Embed Size (px)
Citation preview
MIGUEL ANTONIO MARTIR BRION
DEVELOPMENT OF AN IRON OXIDE NANOPARTICLE-
ACTIVATED CARBON ADSORBENT FOR WATER
TREATMENT OF COMMON HUMAN PHARMACEUTICAL
CHEMICALS
FACULDADE DE CIÊNCIAS E TECNOLOGIA 2016
UNIVERSIDADE DO ALGARVE FACULDADE DE CIÊNCIAS E TECNOLOGIA
DEPARTAMENTO DAS QUÍMICA E FARMÁCIA
DEPARTAMENTO DAS CIÊNCIAS DA TERRA, DO MAR E DO AMBIENTE
DEVELOPMENT OF AN IRON OXIDE NANOPARTICLE-
ACTIVATED CARBON ADSORBENT FOR WATER
TREATMENT OF COMMON HUMAN PHARMACEUTICAL
CHEMICALS
Miguel Antonio M. Brion
Dissertaçao / Dissertation
Mestrado Erasmus Mundus Em Inovação Quimica e Regulamentação
(Erasmus Mundus Masters in Chemical Innovation and Regulation)
Trabalho efetuado sob a orientação de:
Work supervised by
Margarida Ribau Teixeira
José António Moreira
2016

I
DECLARATION OF AUTHORSHIP AND COPYRIGHT
I declare that I am the author of this work which is original. The work cites other authors and
works, which are adequately referred to in the text and are listed in the references section.
____________________________
Miguel Antonio M. Brion
Copyright: Miguel Antonio M. Brion. The Universidade Do Algarve (University of Algarve)
has the right to keep and publicize this work through printed copies in paper of digital form, or
any other means of reproduction, to disseminate it in scientific repositories, and to allow its
copy and distribution with educational and/or research objectives, as long as they are non-
commercial and give credit to the author and editor.

II
III
ACKNOWLEDGEMENTS
First of all, this work will not be possible without the unwavering guidance and love of The Lord. I would like to send my most heartfelt gratitude to all the people who have been part of my Erasmus Mundus journey, in both highs and lows, who continuously try to understand all my weirdness and uniqueness all rolled up into one person. So here it goes….
To the European Commission and the EMMC-ChIR management team for giving me this once in a life time opportunity of being part of an international program. To professors Ana Costa, Margarida Teixeira, and José Moreira for supporting me in this research, giving me the best advices inside and outside of the laboratory, and making me feel at home in Faro.
To Dad, Mom, Ate Van-c, Vince, Nanay, Mommy Inday, and Auntie Dots for keeping me sane whenever I miss home that I just want to hop onto the next flight back to the Philippines or to San Francisco, for accepting me for who I am, and making me believe in myself that I can do great things in life. You are the reason why I entered in this program.
To Gelo Romasanta and Tugce Eran for being my best friends in this program. We may have our
differences but these differences made our bond stronger. I will always be your “older brother” and you will always be my younger siblings that I will forever cherish and love for the rest of my life. To Drew Elepano and P.A. Roxas for making me feel at home, and safe amidst the changing environment and accepting my crazy cleanliness standards. To Leonardo Vale, Raquel Sequiera,
Thomas Ishi, and Gabriel Bentes for being my “Filipino” family in Portugal, for translating most things,
and not making me feel different even though I do not speak the language. To my ChIR professors who did not only teach me lessons in the classroom, but also lessons in life especially to Professors Daniel Sainz, and Isabel Cavaco who are always there.
To Sam Dulay, and Miguel De Jesus for being my pillars of suport and who I know I can trust my life with no matter what. I never thought I will meet such great people in Europe and I love you both. To my ChIR classmates (Peter, Wei, Mireia, Paola, Bethel, Donald, Asnake, Hagos, Bas, Jamil, and Isa) for being such great companions in this journey. I will never forget each one of you and how you made a huge impact my life in the best way you can. You are all welcome in the Philippines!
To the people who helped me in the lab namely Fran Camacho, Filipa Vargues, Vânia Sousa, Filomena, and Miguel for the patience in teaching me how to operate the machines and other things in the lab. To the International Mobility office (Celia Oliveira, Nataliya Butenko and Mercês Covas), and Mar Santacana for making sure that everything is alright and for answering all my questions and requests.
To my globally scattered ADMU Chemistry’09 GuyzNGalz for keeping the friendship alive, and making me laugh and smile first thing in the morning just because the Philippines is 8 hours ahead. To all the friends I gained all over the world from Spain, Portugal, Brazil, USA, etc. for exposing me to new cultures and views in life, as well as to new cuisines that I have never tasted before. I could not
thank you enough.
Thank you and see you soon someday!
Miguel/Macky

IV
V
INDEX
DECLARATION OF AUTHORSHIP AND COPYRIGHT………………………….……… I
ACKNOWLEDGEMENTS………………………………………………………………… III
INDEX……………………………………………………………………………………….. V
ABSTRACT………………………………………………………………………...……… VII
RESUMO ……….………………………………………………………………………….. IX
List of Figures………………………………………………………………………………..XI
List of Tables ……………………………………………………………………………... XIV
List of Acronyms .…………………………………………………………………............. XV
OBJECTIVES OF THE STUDY ……………………………………………………………. 1
1. INTRODUCTION …………………………………………………………………… 3
1.1 Pharmaceutical Contaminants in Water …………………………………………. 3
1.2 Common Human Pharmaceutical Compounds ………………………………… 11
1.2.1 Ibuprofen …………………………………………………………… 11
1.2.2 Acetylsalicylic Acid …………………………………………………12
1.2.3 Paracetamol ………………………………………………………… 13
1.2.4 Amoxicillin …………………………………………………………. 15
1.3 Wastewater Treatment Plants …………………………………………………... 16
1.3.1 Common Decontaminating Techniques …………………………..... 16
1.3.2 Activated Carbon ………………………………………………….... 17
1.4 Iron Nanoparticles ………………………………………………….................... 19
1.5 Magnetic Activated Carbon ………………………………………………….…. 23
1.6
2. EXPERIMENTAL PART ………………………………………………………….. 26
2.1 Materials and Methods ……………………………………………………...….. 26
2.1.1 Chemicals …………………………………………………………... 26
2.2 Instrumentation ……………………………………………………………….... 26
2.2.1 Zetasizer …………………………………………………………..... 26
2.2.2 Ultraviolet-Visible Spectroscopy …………………………............... 27
VI
2.2.2 Other Equipment and Materials ..…………………………............... 27
2.3 General Experimental Flow …………………………………………………….. 28
2.4 Synthesis of Adsorbent Particles …………………………………………..….... 28
2.4.1 Synthesis and Characterization of FeNPs ………………………….. 28
2.4.2 Synthesis and Characterization of PACMAG .……………………... 28
2.5 Characterization of Wastewater …………………………………………….….. 29
2.6 Calibration Curve …………………………………………………………...….. 29
2.7 Adsorption Tests ……………...………………………………………………... 30
2.7.1 Kinetics Measurements …………….………..……………………... 30
2.7.2 Isotherms of PACMAG …………….………..………………….….. 31
2.7.1 Adsorption of PACMAG in WW Spiked with Drug ……………..... 32
2.8 Regeneration of PACMAG (Preliminary Test) …………………………….…... 32
2.9 Sedimentation Test of PACMAG ………………………………….……….…... 32
3. RESULTS AND DISCUSSION …………………………………………………… 33
3.1 Synthesis of Adsorbent Particles …………………………………………..….... 33
3.1.1 Synthesis and Characterization of FeNPs ………………………….. 33
3.1.2 Synthesis and Characterization of PACMAG .……………………... 39
3.2 Characterization of Wastewater …………………………………………….….. 40
3.3 Calibration Curve …………………………………………………………...….. 43
3.4 Adsorption Tests ………..…...………………………………………………...... 43
3.4.1 Kinetics Measurements of IBU, PAR, ASA in FeNPs ……………... 44
3.4.2 Kinetics Measurements of IBU, PAR, ASA in PACMAG .………... 47
3.5 Isotherms of PACMAG …………….………..………………….……………… 52
3.5.1 Varying Amounts of PACMAG …………………………………….... 52
3.5.2 Varying Concentration of Drug ………………………………………. 54
3.6 Adsorption of PACMAG in WW Spiked with Drug ……………....................... 57
3.7 Regeneration of PACMAG (Preliminary Test) …………………………….…... 58
3.8 Sedimentation Test of PACMAG ………………………………….……….…... 61
4. CONCLUSION AND RECOMMENDATION ……………………………………. 64
5.
6. BIBILIOGRAPHY………………………………………………………………….. 66
VII
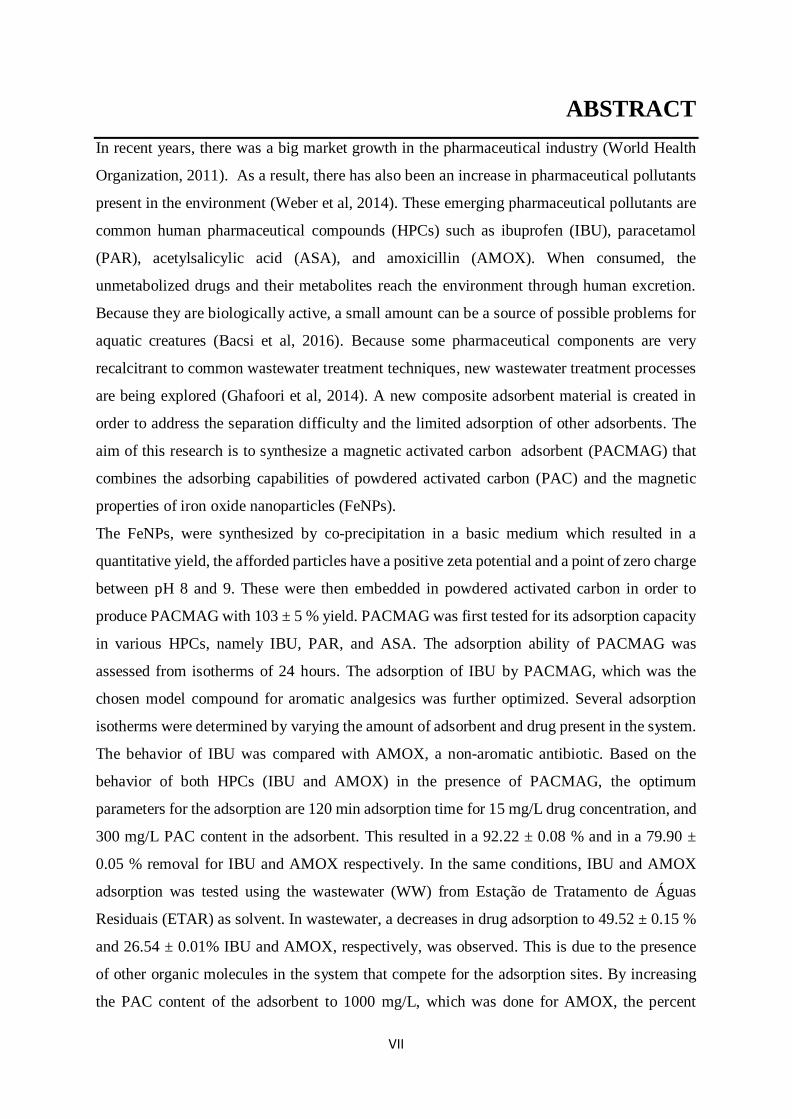
ABSTRACT
In recent years, there was a big market growth in the pharmaceutical industry (World Health
Organization, 2011). As a result, there has also been an increase in pharmaceutical pollutants
present in the environment (Weber et al, 2014). These emerging pharmaceutical pollutants are
common human pharmaceutical compounds (HPCs) such as ibuprofen (IBU), paracetamol
(PAR), acetylsalicylic acid (ASA), and amoxicillin (AMOX). When consumed, the
unmetabolized drugs and their metabolites reach the environment through human excretion.
Because they are biologically active, a small amount can be a source of possible problems for
aquatic creatures (Bacsi et al, 2016). Because some pharmaceutical components are very
recalcitrant to common wastewater treatment techniques, new wastewater treatment processes
are being explored (Ghafoori et al, 2014). A new composite adsorbent material is created in
order to address the separation difficulty and the limited adsorption of other adsorbents. The
aim of this research is to synthesize a magnetic activated carbon adsorbent (PACMAG) that
combines the adsorbing capabilities of powdered activated carbon (PAC) and the magnetic
properties of iron oxide nanoparticles (FeNPs).
The FeNPs, were synthesized by co-precipitation in a basic medium which resulted in a
quantitative yield, the afforded particles have a positive zeta potential and a point of zero charge
between pH 8 and 9. These were then embedded in powdered activated carbon in order to
produce PACMAG with 103 ± 5 % yield. PACMAG was first tested for its adsorption capacity
in various HPCs, namely IBU, PAR, and ASA. The adsorption ability of PACMAG was
assessed from isotherms of 24 hours. The adsorption of IBU by PACMAG, which was the
chosen model compound for aromatic analgesics was further optimized. Several adsorption
isotherms were determined by varying the amount of adsorbent and drug present in the system.
The behavior of IBU was compared with AMOX, a non-aromatic antibiotic. Based on the
behavior of both HPCs (IBU and AMOX) in the presence of PACMAG, the optimum
parameters for the adsorption are 120 min adsorption time for 15 mg/L drug concentration, and
300 mg/L PAC content in the adsorbent. This resulted in a 92.22 ± 0.08 % and in a 79.90 ±
0.05 % removal for IBU and AMOX respectively. In the same conditions, IBU and AMOX
adsorption was tested using the wastewater (WW) from Estação de Tratamento de Águas
Residuais (ETAR) as solvent. In wastewater, a decreases in drug adsorption to 49.52 ± 0.15 %
and 26.54 ± 0.01% IBU and AMOX, respectively, was observed. This is due to the presence
of other organic molecules in the system that compete for the adsorption sites. By increasing
the PAC content of the adsorbent to 1000 mg/L, which was done for AMOX, the percent
VIII
removal can be increased up to 76.720 ± 0.001 %. Finally, PACMAG can be regenerated using
the Fenton reaction. The regenerated PACMAG removed 53.840 ± 0.004% of AMOX in an
AMOX-WW mixture. Based on the sedimentation test, PAGMAG is more time efficient
because it requires 5 minutes at the presence of a magnet to settle, and separate the particles
from the water supply.
The results of this work can contribute for the improvement of water treatment processes
particularly in the removing of HPCs. Being nowadays, this kind of compounds is a growing
problem in water treatment.
Keywords: Magnetic Activated Carbon, Magnetite Nanoparticle, Activated Carbon, Water
Treatment Analysis, Human Pharmaceutical Compounds, Adsorption
IX
RESUMO
Nas últimas décadas assistiu-se a um enorme crescimento da Industria Farmacêutica (World
Health Organization, 2011), o que levou a um aumento exponencial da quantidade e do número
de compostos de origem farmacêutica que se podem encontrar no ambiente (Weber et al, 2014).
Este novo tipo de poluentes designados por “human pharmaceutical compounds” (HPCs),
como o ibuprofen (IBU), o paracetamol (PAR), o ácido acetilsalicílico (ASA), ou a amoxicilina
(AMOX).
Quando consumidos, tanto as drogas não metabolizadas como os seus metabolitos são
libertados no ambiente por via das excreções. Sendo as drogas, e, ou os seus metabolitos
biologicamente ativos, mesmo uma pequena quantidade dos mesmos pode ter impacto sobre
os seres presentes nos meios aquáticos (Bacsi et al, 2016). Sendo alguns destes compostos
particularmente resistentes aos tratamentos comummente usados no processamento das águas
residuais, tal tem levado à procura de novos processos de tratamento de águas residuais
(Ghafoori et al, 2014).
Neste trabalho mostramos os resultados obtidos com um novo material compósito criado de
modo a maximizar a adsorção e a facilitar o processo de separação e regeneração do adsorvente.
Assim damos conta da síntese do um adsorvente de carvão ativado com propriedades
magnéticas (PACMAG), este material combina a capacidade de adsorção do carvão ativado
pulverizado (PAC) e as propriedades magnéticas de nanopartículas de óxido de ferro (FeNPs).
As nanopartículas de óxido de ferro (FeNPs) foram sintetizadas por coprecipitação em meio
básico, por este método foi possível obter nanopartículas com um rendimento quantitativo,
mostrando estas um potencial zeta positivo, e uma ponto de carga zero a pH entre 8 e 9. Estas
partículas forma posteriormente embutidas em carvão ativado pulverizado, resultando o novo
material PACMAG.
Foi testada a capacidade de adsorção de diversos HPC, nomeadamente o IBU, o PAR e o ASA,
pelo PACMAG. Foram realizadas isotérmicas ao longo de 24 horas. O IBU foi escolhido como
composto modelo para os analgésicos aromáticos, tendo sido as condições otimizadas para este
composto. O comportamento do IBU foi comparado com o da AMOX, um antibiótico não
aromático. De acordo com os resultados obtidos para estes dois fármacos foi determinado que,
para concentrações de 15 mg/L de droga, o tempo de contacto necessário é de 120 minutos, e
que o conteúdo em PAC ótimo, do adsorvente, é de 300 mg/L. Nestas condições observou-se
uma remoção de 92,22 ± 0,08 % e de 79,90 ± 0,05 % para o IBU e a AMOX respetivamente.
X
Em condições idênticas, foram repetidos, os testes de adsorção do IBU e da AMOX, usando
água residual (WW) de uma Estação de Tratamento de Águas Residuais (ETAR) como
solvente. Nestas condições observou-se uma diminuição da quantidade de droga adsorvida para
49,52 ± 0,15 % e 26,54 ± 0,01% para o IBU e para a AMOX, respetivamente. Tal deve-se à
presença de outras moléculas orgânicas que competem com os fármacos em estudo pelos sítios
de adsorção. Aumentando a quantidade de PAC no adsorvente para 1000 mg/L, o que foi feito
para o caso da AMOX, a remoção aumenta para 76,720 ± 0,001%.
Finalmente mostra-se que o PACMAG pode ser regenerado usando a reação de Fenton. O
PACMAG regenerado removeu 53,840 ± 0,004% de AMOX de uma solução AMOX-WW. De
acordo com os testes de sedimentação o PACMAG necessita de apenas 5 minutos para na
presença de um campo magnético sedimentar, de modo a permitir a sua separação da água
tratada.
Os resultados deste trabalho são uma contribuição para a melhoria dos processos de tratamento
de águas residuais, em particular na remoção de HPC compostos cada vez mais prevalentes nas
águas a tratar.
Palavras Chave: Carvão Ativado com Propriedade Magnéticas, Nanopartículas de Magnetite,
Carvão Ativado, Tratamento de Águas, Human Pharmaceutical Compounds, Adsorção
XI
LIST OF FIGURES
Figure 1.1: Global occurrence of pharmaceuticals that have been found in the
environment in all UN regional groups………………………………...
4
Figure 1.2: Most selling environmentally relevant HPCs in Germany in 2012 and
HPCs with an annual consumption of more than 80 tons ……………..
11
Figure 1.3: Chemical structure of Ibuprofen ………….…………………………. 11
Figure 1.4: Chemical structure of Acetylsalicylic Acid……………..…………… 13
Figure 1.5: Chemical structure of Paracetamol …………….……………………. 14
Figure 1.6: Chemical structure of Amoxicillin …………………………………… 15
Figure 1.7: Pore structure and type of pores present in activated carbon ………… 18
Figure 1.8: Synthesis of FeNPs coated with amidoxime …………….……….…. 22
Figure 1.9: Schematic diagram of magnetic separation in wastewater …………… 23
Figure 3.1: Diagram of the 2 layers surrounding the particle ………….………… 35
Figure 3.2: Zeta potential of FeNPs before and after sonication ………………… 35
Figure 3.3: Zeta potential of FeNPs in varying ion concentration and pH .……… 37
Figure 3.4: Flocculation scheme in solvent systems with and without salts …….. 38
Figure 3.5: Particle size of FeNPs in varying solvent systems and pH ………….. 39
Figure 3.6: Absorbance of wastewater in the presence of PACMAG at 221 nm for
IBU and at 228 nm for AMOX in a 24 hour adsorption period ………
41
Figure 3.7: Isotherm of the absorbance of wastewater water in the presence of
varying amounts of PAC content in PACMAG at 221 nm for IBU and
at 228 nm for AMOX …………………………………………………
42
Figure 3.8: Absorbance of wastewater water in the presence of varying amounts
of PAC content ……………………………………………………….
42
Figure 3.9: Calibration curves of (A) IBU, (B) PAR, (C) ASA, and (D) AMOX … 43
Figure 3.10: Absorbance measurements of IBU samples in the kinetic experiment
of unsonicated FeNPs …………………………………………………
45
Figure 3.11: Concentration of IBU samples in the kinetic experiment of unsonicated
FeNPs …………………………………………………………………
45
Figure 3.12: Concentration of IBU samples in the kinetic experiment of sonicated
FeNPs …………………………………………………………………
46
XII
Figure 3.13: Absorbance measurements of the drug samples in the kinetic
experiment of sonicated FeNPs using magnetic separation and
centrifuge ……………………………………………………………..
47
Figure 3.14: Percent removal of the drug samples in the kinetic experiment of
sonicated FeNPs using magnetic separation and centrifuge …………...
47
Figure 3.15: Absorbance (A) and concentration (B) of the samples at varying times
of adsorption using PACMAG as adsorbent and its corresponding
percent removal (C) …………………………………………………...
48
Figure 3.16: Absorbance of IBU at varying times of PACMAG exposure …………. 49
Figure 3.17: Concentration (A) of IBU at varying times of PACMAG exposure,
Percent removal (B) of IBU at varying times of PACMAG exposure ...
50
Figure 3.18: Absorbance of AMOX at varying times of PACMAG exposure …….. 51
Figure 3.19: Concentration (A) of AMOX at varying times of PACMAG exposure,
Percent removal (B) of AMOX at varying times of PACMAG
exposure ………………………………………………………………
52
Figure 3.20: Isotherm of the absorbance of (A) IBU and (B) AMOX at varying
amounts of PAC content in PACMAG ………………………………
53
Figure 3.21: Percent removal of (A) IBU and (B) AMOX at varying amounts of
PAC content in PACMAG ……………………………………………
54
Figure 3.22: Isotherm of the absorbance of (A) IBU and (B) AMOX at varying
initial IBU concentration ……………………………………………..
55
Figure 3.23: Percent removal of (A) IBU and (B) AMOX at varying initial IBU
concentration ………………………………………………………….
56
Figure 3.24: Amount of (A) IBU and (B) AMOX in the drug- WW mixture before
and after adsorption …………………………………………………..
58
Figure 3.25: Comparison of absorbance of new PACMAG and regenerated
PACMAG in the adsorption of AMOX in AMOX- wastewater ………
59
Figure 3.26: Comparison of the percent removal of PACMAG and regenerated
PACMAG in the adsorption of AMOX in wastewater –AMOX ………
60
Figure 3.27: Comparison of the total organic carbon (TOC) concentration (ppm) of
samples that were exposed to new PACMAG and regenerated
PACMAG …………………………………………………………….
60
Figure 3.28: Absorbance of IBU in varying sedimentation set-ups ………………… 61
XIII
Figure 3.29: Concentration (A) of IBU in varying sedimentation set-ups, Percent
removal (B) of IBU in varying sedimentation set-ups ……………......
62
Figure 3.30: Trial 1-3 of the sedimentation of PACMAG with the presence of a
magnet after 5 min ……………………………………………………
63
Figure 3.31: Turbidity of the different sedimentation set-ups as time passes ………. 63
XIV
LIST OF TABLES
Table 1.1: Emerging contaminants detected in European ground waters and
surface waters water treatment or other pint sources…………………
4
Table 1.2: Studies on the industrial effluents (IE), river sediments (RS), soil,
ground water (GW) and surface water (SW) where presence of HPCs
are detected……………………………………….…………………...
6
Table 1.3: Top 20 used EPPPs which appear in influents and effluents of typical
New Zealand wastewater of urban origin ………….…………………
10
Table 1.4: Conventional and advanced wastewater treatment processes and their
expected range of removal efficiency for pharmaceuticals……………
17
Table 1.5: Techniques used to synthesize FeNPs ………….……………………. 20
Table 1.6: Application of MAC for the separation of organic and inorganic
compounds ………….…………………………….…………………..
24
Table 2.1: Pharmaceutical Drugs and its corresponding λmax……………………. 27
Table 2.2: Parameters for each case (Adsorbent type, Amount of adsorbent, Type
of contaminated sample, separation technique performed) ……….….
30
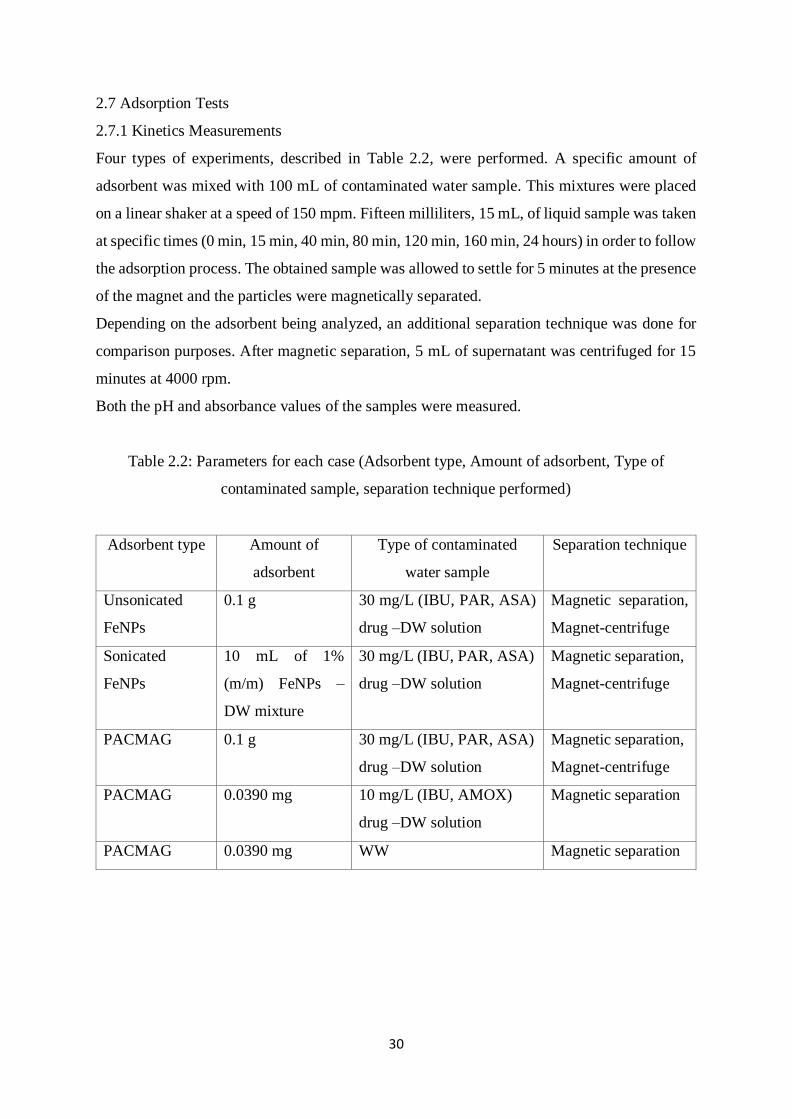
Table 2.3: Amount of PACMAG used in accordance to the expected PAC content
present in the particle ………………………………………………….
31
Table 3.1: The stability of particles based on their zeta potential values ………… 36
Table 3.2: Direct influence of particle size on the property of the material……… 36
Table 3.3: Properties of WW …….…………………………….………………… 40
Table 3.4: Experimental set-ups for drug adsorption of either FeNPs or
PACMAG .……..…….…………………………….…………………
44
Table 3.5: Four kinds of reactions by hydroxyl radical (.OH) with pollutants ….. 59
XV
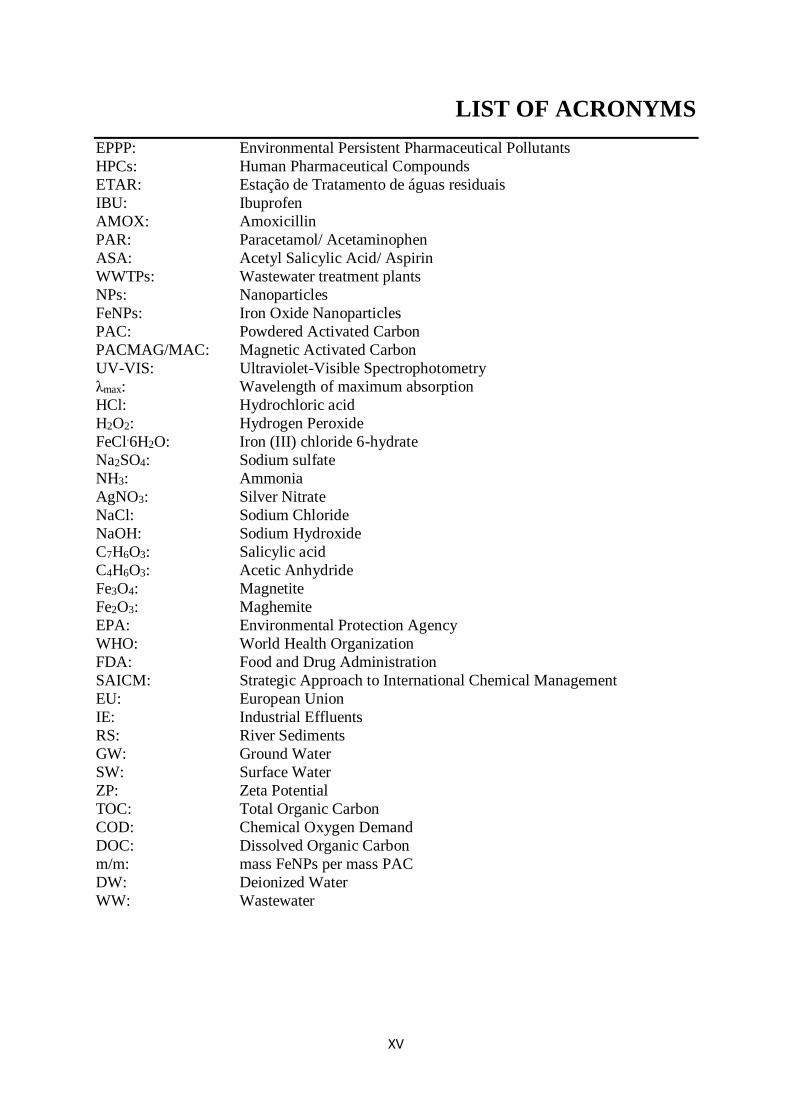
LIST OF ACRONYMS
EPPP: Environmental Persistent Pharmaceutical Pollutants
HPCs: Human Pharmaceutical Compounds
ETAR: Estação de Tratamento de águas residuais
IBU: Ibuprofen
AMOX: Amoxicillin
PAR: Paracetamol/ Acetaminophen
ASA: Acetyl Salicylic Acid/ Aspirin
WWTPs: Wastewater treatment plants
NPs: Nanoparticles
FeNPs: Iron Oxide Nanoparticles
PAC: Powdered Activated Carbon
PACMAG/MAC: Magnetic Activated Carbon
UV-VIS: Ultraviolet-Visible Spectrophotometry
λmax: Wavelength of maximum absorption
HCl: Hydrochloric acid
H2O2: Hydrogen Peroxide
FeCl.6H2O: Iron (III) chloride 6-hydrate
Na2SO4: Sodium sulfate
NH3: Ammonia
AgNO3: Silver Nitrate
NaCl: Sodium Chloride
NaOH: Sodium Hydroxide
C7H6O3: Salicylic acid
C4H6O3: Acetic Anhydride
Fe3O4: Magnetite
Fe2O3: Maghemite
EPA: Environmental Protection Agency
WHO: World Health Organization
FDA: Food and Drug Administration
SAICM: Strategic Approach to International Chemical Management
EU: European Union
IE: Industrial Effluents
RS: River Sediments
GW: Ground Water
SW: Surface Water
ZP: Zeta Potential
TOC: Total Organic Carbon
COD: Chemical Oxygen Demand
DOC: Dissolved Organic Carbon
m/m: mass FeNPs per mass PAC
DW: Deionized Water
WW: Wastewater

XVI
1
OBJECTIVES OF THE RESEARCH
For the past 2 years, there was a US$150 billion increase in global pharmaceutical demand due
to increasing global public consumption (World Health Organization, 2011). Once consumed
these unmetabolized drugs and their metabolites are normally excreted in urine and feces which
end up in wastewater treatment plants (WWTPs). Wastewater treatment plants can remove
some of these pharmaceutical contaminants, but not all are removed. Some pharmaceutical
components are very recalcitrant or persistent and the usual wastewater treatment processes are
inefficient in their removal (Ghafoori et al, 2014). As a result, these contaminants are
discharged in water bodies and present in sludges, contaminating the environment. Even
though their concentration is low, these drugs and their metabolites are bioactive which can
affect aquatic species.
In order to address this problem, a new wastewater treatment process must be optimized or
developed. Adsorption through activated carbon is promising in the removal of these
contaminants from wastewater (WW). Powdered activated carbon (PAC) is an excellent
adsorbent, but it requires an additional filtration step in order to separate it from the effluent
(Borghi and Fabbri, 2013). On the other hand, studies had shown that iron oxide nanoparticles
(FeNPs) have big surface area, due to its small size, and can be magnetically separated
(Stefusova et al, 2012). However, these nanoparticles have a natural tendency to aggregate in
aqueous solutions, decreasing their adsorption capacity (Atta et al, 2015). Thus, work must be
done in trying to maximize the adsorption capacity of the PAC, and the magnetic property of
FeNPs to increase PAC and pharmaceutical removal.
The aim of this research is to develop a composite magnetic activated carbon adsorbent
(PACMAG) which can remove pharmaceuticals (like e.g. IBU, PAR, ASA, and AMOX) from
wastewater (WW).
The main objective of this study was obtained by achieving the following steps:
Synthesis and characterization of the FeNPs based on particle size and zeta potential in
varying pH and ion concentrations
Synthesis of PACMAG using the FeNPs and PAC
2
Analyze FeNPs and PACMAG kinetics in various aqueous drug solutions (IBU, PAR,
ASA, and AMOX)
Determine PACMAG isotherms in various aqueous drug solutions (IBU and AMOX),
Compare the sedimentation of PACMAG using various sedimentation set-ups (with and
without a magnetic force for 5 minutes, without a magnetic force for 30 min),
Determine the adsorption capacity of PACMAG to remove IBU or AMOX in WW,
Perform preliminary tests on the regeneration of PACMAG.
3
1 INTRODUCTION
1.1 Pharmaceutical Contaminants in Water
Currently the pharmaceutical industry is gaining advancement in the global market. Since
2014, 90 new human pharmaceutical compounds (HPCs) have been approved by the Food and
Drug Administration (FDA) (CEN RSS, 2016). According to the World Health Organization
(WHO), in just 2 years (2013-2015) the global pharmaceutical sales would increase by US$
150 billion, amounting to a total of US$ 900 billion (World Health Organization, 2011). There
is a big demand for pharmaceuticals annually which is based on the global public consumption
of medicines. Contrary to the increase in innovation, the pharmaceutical companies currently
spend one-third of all sales revenue on marketing strategies and not on research and
development. As a result, many of these new drugs move in the global market not due to their
ability to transform lives, rather, to gain profit according to the Chemical Engineering News
(C&EN) (CEN RSS, 2016)
As an indirect effect of the high consumption of these HPCs, studies showed that they would
eventually reach different environmental sinks (Shalini et al, 2010). According to the Strategic
Approach to International Chemical Management (SAICM), there had been an emerging issue
of pharmaceuticals in the environment resulting to the term environmental persistent
pharmaceutical pollutants (EPPP) (SAICM, 2016). EPPP are defined as compounds that have
not been studied before and are not currently covered by existing water-quality regulations.
This includes the pharmaceutical residues and metabolites with potential of contaminating the
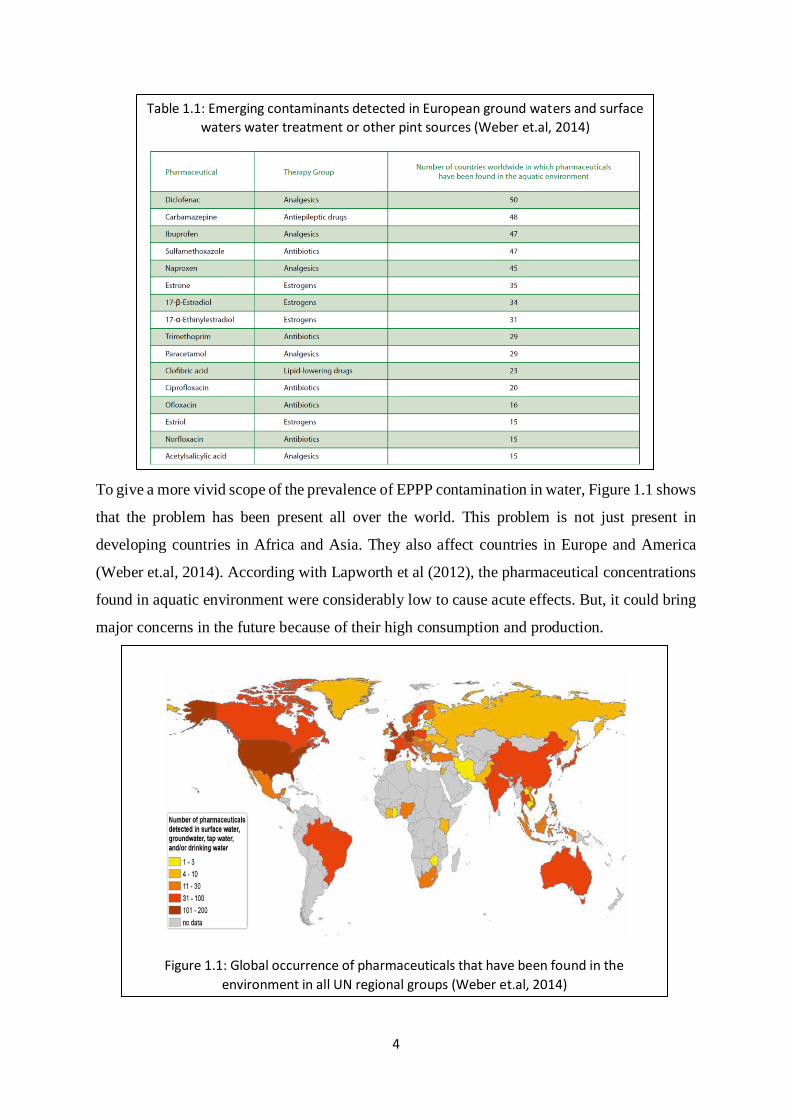
environment (water, soil, organisms) (EUR-Lex, 2016). Table 1.1 depicts the number of EPPP
found in aquatic environment in numerous countries. It also shows the variety of drugs that can
be an EPPP namely analgesics, estrogens and antibiotics. Most of the EPPP are common drugs
such as IBU, ASA, and PAR (Weber et al, 2014). Because of the amount of these HPCs that
are being used by the public, they can eventually be problematic (Geissen et.al, 2015).
4
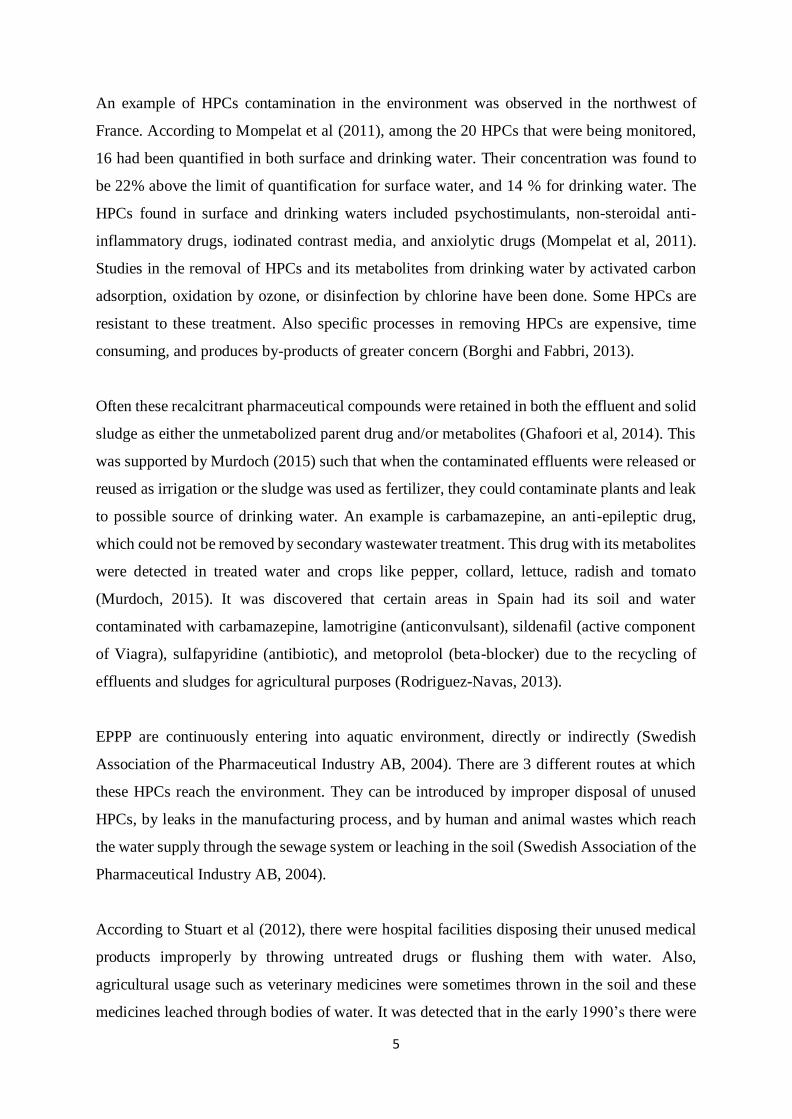
To give a more vivid scope of the prevalence of EPPP contamination in water, Figure 1.1 shows
that the problem has been present all over the world. This problem is not just present in
developing countries in Africa and Asia. They also affect countries in Europe and America
(Weber et.al, 2014). According with Lapworth et al (2012), the pharmaceutical concentrations
found in aquatic environment were considerably low to cause acute effects. But, it could bring
major concerns in the future because of their high consumption and production.
Table 1.1: Emerging contaminants detected in European ground waters and surface
waters water treatment or other pint sources (Weber et.al, 2014)
Figure 1.1: Global occurrence of pharmaceuticals that have been found in the
environment in all UN regional groups (Weber et.al, 2014)
5
An example of HPCs contamination in the environment was observed in the northwest of
France. According to Mompelat et al (2011), among the 20 HPCs that were being monitored,
16 had been quantified in both surface and drinking water. Their concentration was found to
be 22% above the limit of quantification for surface water, and 14 % for drinking water. The
HPCs found in surface and drinking waters included psychostimulants, non-steroidal anti-
inflammatory drugs, iodinated contrast media, and anxiolytic drugs (Mompelat et al, 2011).
Studies in the removal of HPCs and its metabolites from drinking water by activated carbon
adsorption, oxidation by ozone, or disinfection by chlorine have been done. Some HPCs are
resistant to these treatment. Also specific processes in removing HPCs are expensive, time
consuming, and produces by-products of greater concern (Borghi and Fabbri, 2013).
Often these recalcitrant pharmaceutical compounds were retained in both the effluent and solid
sludge as either the unmetabolized parent drug and/or metabolites (Ghafoori et al, 2014). This
was supported by Murdoch (2015) such that when the contaminated effluents were released or
reused as irrigation or the sludge was used as fertilizer, they could contaminate plants and leak
to possible source of drinking water. An example is carbamazepine, an anti-epileptic drug,
which could not be removed by secondary wastewater treatment. This drug with its metabolites
were detected in treated water and crops like pepper, collard, lettuce, radish and tomato
(Murdoch, 2015). It was discovered that certain areas in Spain had its soil and water
contaminated with carbamazepine, lamotrigine (anticonvulsant), sildenafil (active component
of Viagra), sulfapyridine (antibiotic), and metoprolol (beta-blocker) due to the recycling of
effluents and sludges for agricultural purposes (Rodriguez-Navas, 2013).
EPPP are continuously entering into aquatic environment, directly or indirectly (Swedish
Association of the Pharmaceutical Industry AB, 2004). There are 3 different routes at which
these HPCs reach the environment. They can be introduced by improper disposal of unused
HPCs, by leaks in the manufacturing process, and by human and animal wastes which reach
the water supply through the sewage system or leaching in the soil (Swedish Association of the
Pharmaceutical Industry AB, 2004).
According to Stuart et al (2012), there were hospital facilities disposing their unused medical
products improperly by throwing untreated drugs or flushing them with water. Also,
agricultural usage such as veterinary medicines were sometimes thrown in the soil and these
medicines leached through bodies of water. It was detected that in the early 1990’s there were
6
HPCs discharges in the environment by manufacturing plants (Larsson, 2014). But, little
attention was given to it because of the limited analytical devices that could measure such
reduce concentrations (Larsson, 2014). The problem was ignored only until evidences of the
feminization of fish due to the presence of oestrogens from manufacturing plants were found
(Larsson, 2014). Larsson et al (2007) recorded a high emission of HPCs from drug
manufacturers in Patancheru, India. It was noted that the concentration of ciprofloxacin, a
broad spectrum antibiotic, reached 31 mg/L, which was 1 million times more that the regular
level found in other areas and was very toxic for organisms. At this concentration, the total
release of these drug was 44 kg per day, which was sufficient to treat 44,000 inhabitants
(Larsson, 2014). Aside from India, other Asian countries like Korea, Taiwan and China
exhibited high concentrations of HPCs leakage from manufacturing companies (Cui et al,
2006). In China, 51 ng/L of ethinyloestradiol was detected in a river, which affected the
reproduction of aquatic vertebrates (Cui et al, 2006). There were reports in the USA and Europe
of manufacturing companies releasing high concentrations (mg/L) of HPCs in the environment
as well (Larsson, 2014).
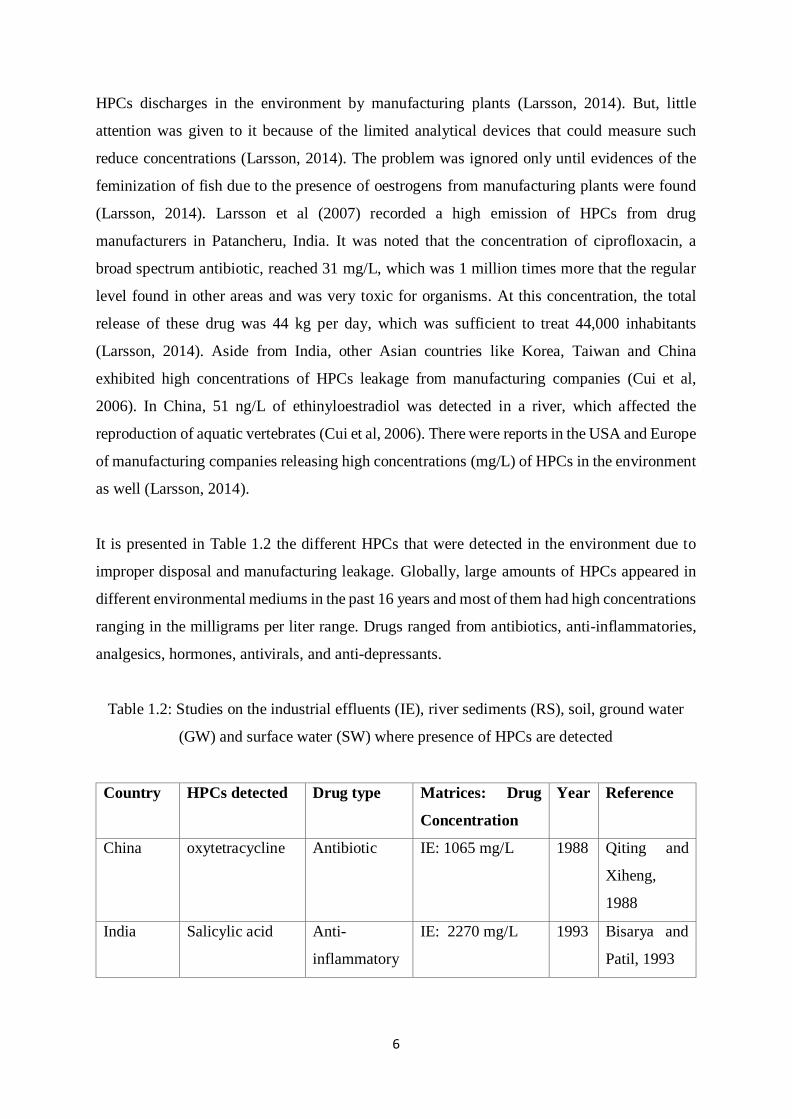
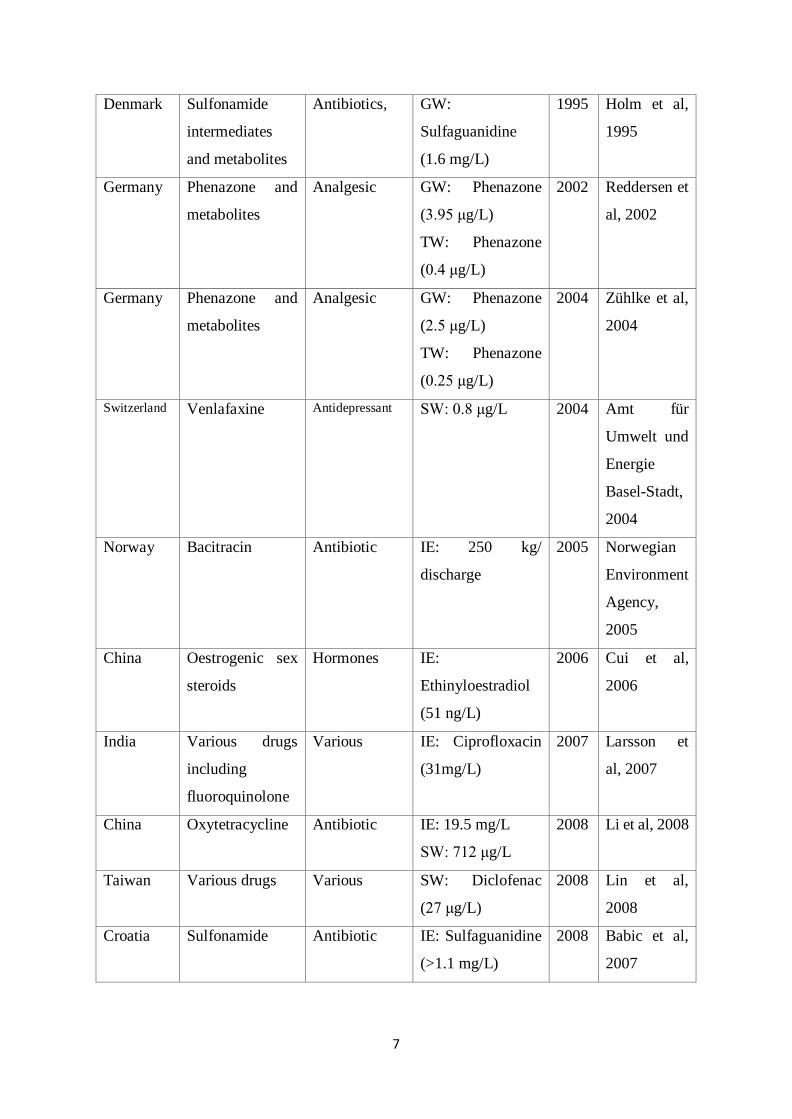
It is presented in Table 1.2 the different HPCs that were detected in the environment due to
improper disposal and manufacturing leakage. Globally, large amounts of HPCs appeared in
different environmental mediums in the past 16 years and most of them had high concentrations
ranging in the milligrams per liter range. Drugs ranged from antibiotics, anti-inflammatories,
analgesics, hormones, antivirals, and anti-depressants.
Table 1.2: Studies on the industrial effluents (IE), river sediments (RS), soil, ground water
(GW) and surface water (SW) where presence of HPCs are detected
Country HPCs detected Drug type Matrices: Drug
Concentration
Year Reference
China oxytetracycline Antibiotic IE: 1065 mg/L 1988 Qiting and
Xiheng,
1988
India Salicylic acid Anti-
inflammatory
IE: 2270 mg/L 1993 Bisarya and
Patil, 1993
7
Denmark Sulfonamide
intermediates
and metabolites
Antibiotics, GW:
Sulfaguanidine
(1.6 mg/L)
1995 Holm et al,
1995
Germany Phenazone and
metabolites
Analgesic GW: Phenazone
(3.95 μg/L)
TW: Phenazone
(0.4 μg/L)
2002 Reddersen et
al, 2002
Germany Phenazone and
metabolites
Analgesic GW: Phenazone
(2.5 μg/L)
TW: Phenazone
(0.25 μg/L)
2004 Zühlke et al,
2004
Switzerland Venlafaxine Antidepressant SW: 0.8 μg/L 2004 Amt für
Umwelt und
Energie
Basel-Stadt,
2004
Norway Bacitracin Antibiotic IE: 250 kg/
discharge
2005 Norwegian
Environment
Agency,
2005
China Oestrogenic sex
steroids
Hormones IE:
Ethinyloestradiol
(51 ng/L)
2006 Cui et al,
2006
India Various drugs
including
fluoroquinolone
Various IE: Ciprofloxacin
(31mg/L)
2007 Larsson et
al, 2007
China Oxytetracycline Antibiotic IE: 19.5 mg/L
SW: 712 μg/L
2008 Li et al, 2008
Taiwan Various drugs Various SW: Diclofenac
(27 μg/L)
2008 Lin et al,
2008
Croatia Sulfonamide Antibiotic IE: Sulfaguanidine
(>1.1 mg/L)
2008 Babic et al,
2007
8
China Penicillin and
metabolites
Antibiotic IE: Penilloic acid
(44 mg/L)
SW: Penilloic acid
(11.6 mg/L)
2008 Li et al, 2008
Taiwan Various drugs Various IE:
Sulfametoxazle
(1.34 mg/L)
Ibuprofen (1.5
mg/L)
2009 Lin and Tsai,
2009
India Various drugs
including
fluoroquinolone
Various IE: Ciprofloxacin
(14mg/L)
GW: Cetirizine (28
μg/L)
SW: Ciprofloxacin
(6.5 mg/L)
2009 Fick et al,
2009
Switzerland Oseltamivir Antiviral SW: 160 ng/L 2010 Prasse et al,
2010
USA Metaxalone Relaxant IE: 3.8 mg/L 2010 Phillips et al,
2010
India Fluoroquinolone Antibiotic RS: Ciprofloxacin
(914 mg/kg of
organic material)
2011 Kristiansson
et al, 2011
Korea Lincomycin Antibiotic IE: 43.9 mg/L 2011 Sim et al,
2011
Israel Venlafaxine and
metabolites
Antidepressant IE: Venlafaxine
(11.2 μg/L)
2012 Gasser et al,
2012
Israel Carbamazepine
and venlafaxine
Various IE: Venlafaxine
(11.7 μ/L)
2013 Lester et al,
2013
Pakistan Various
antibiotics
Antibiotic SW:
Sulfamethoxazole
(49 μg/L)
2013 Khan et al,
2013
9
India Fluoroquinolone Antibiotic GW:
Ciprofloxacin (770
ng/L)
Soil:
Ciprofloxacin (7.2
μg/g of organic
matter)
2014 Rutgersson
et al, 2014
Spain Venlafaxine Antidepressant IE: 2.6 μg/L 2014 Collado et
al, 2014
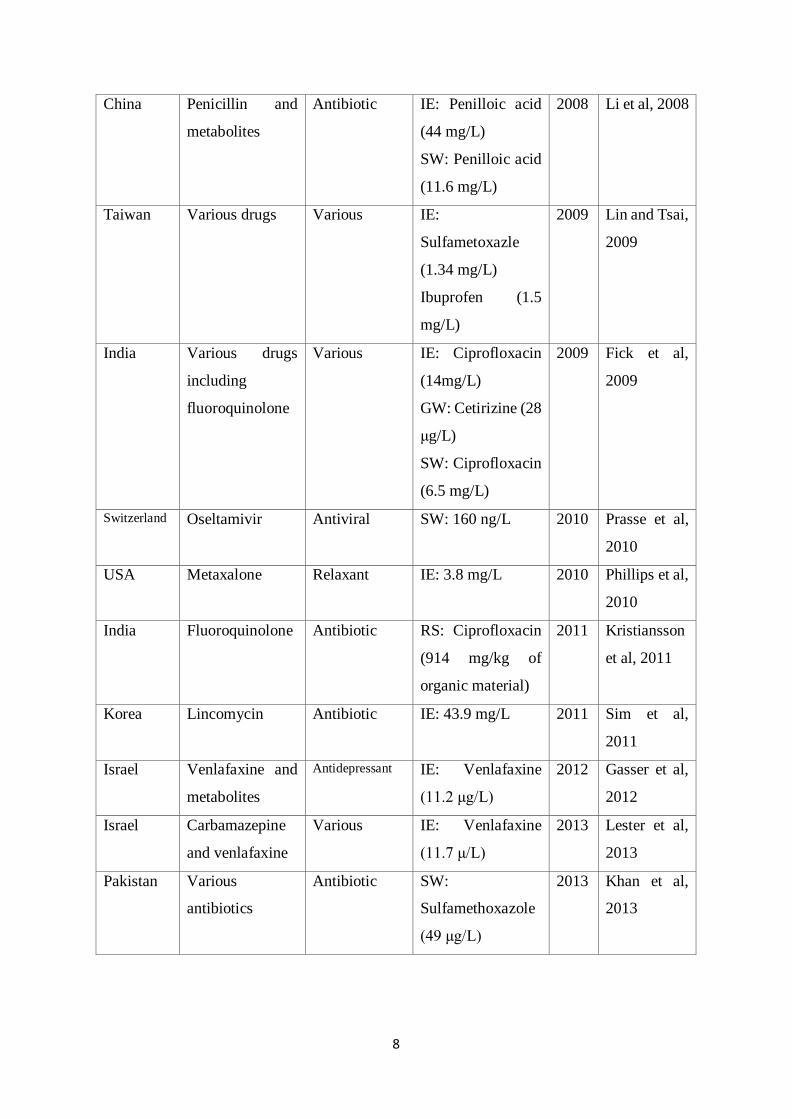
Aside from the improper disposal and manufacturing leakage, a more common source of
contamination is through human and animal excreted products. HPCs are bioactive compounds
primarily designed and prescribed to have specific biological effects on the human body.
Depending on their metabolization, HPCs can be excreted from the human body as
unmetabolized parent compounds and/or metabolites in urine and/or feces (Mompelat et al,
2011). These body wastes containing the unmetabolized drug and its metabolites are discharged
in houses and enter in WWTP. Some examples of the HPCs found are ibuprofen, gemfibrozil,
paracetamol, triclosan, aspirin, naproxen, ampicillin, amoxicillin, nicotine, oesterone bisphenol
A (Stuart et al, 2012). These HPCs usually range from a concentration of 10 to 1000 ng/L
(Lapworth et al, 2012).
Gavrilescu et al (2015) observed that the occurrence and concentrations of HPCs in water
varied with the local of sampling, the time at which they were obtained, and the efficiency of
the treatment plant in removing these contaminants. In general, the concentration of HPCs in
water during summer was higher compared to its concentration during winter because
precipitation was more frequent in winter causing a natural dilution (Nam et al, 2014). While
in terms of location, the frequency and probability at which HPCs could be detected was higher
at sources near urban areas than in agricultural or undeveloped areas. But, this did not mean
that the HPCs concentration was greater because other factors such as natural attenuation,
chemical and physical property of the HPCs could also affect it (Fram and Belitz, 2011).
Trembley et al (2011) referred that there were 156 new EPPPs that could cause environmental
concerns. These new EPPPS included analgesics, antibiotics (AMOX) and antibacterial drugs
10
(ciprofloxacin, erythromycin, tetracycline, sulfamethoxazole), contrast media (lopromide,
iopamidol), prescription drugs (benzodiazepines, salbutamol, carbamazepine), and generic
medicines (IBU, PAR, ASA). Aside from this, steroids and hormones namely androgens
(testosterone, androstenedione), estrogens (estrone, estriol, estradiol), xenoestrogens
(ethynilestradiol, diethylstilbestrol), and anti-inflammatory drugs could cause great concern as
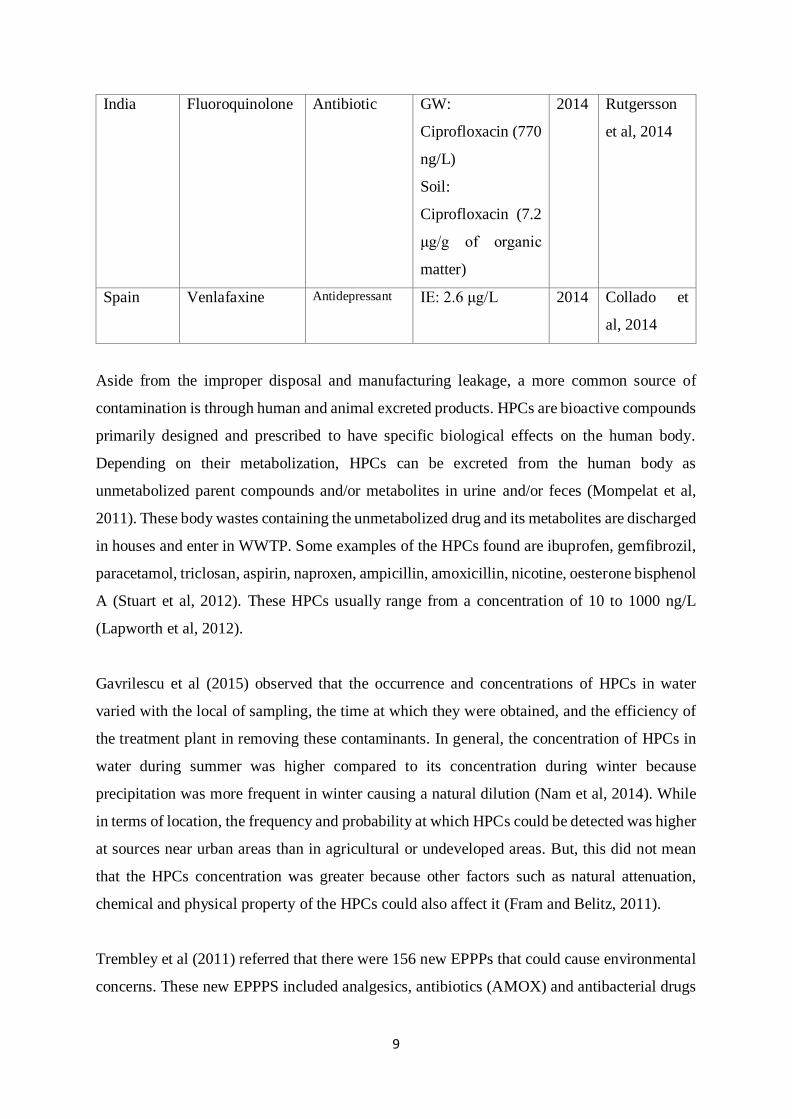
well (Tremblay et al, 2011). Table 1.3 shows the 4 HPCs studied in this research are among
the top 20 most commonly used. As a result, they have a high probability to be present in most
water systems
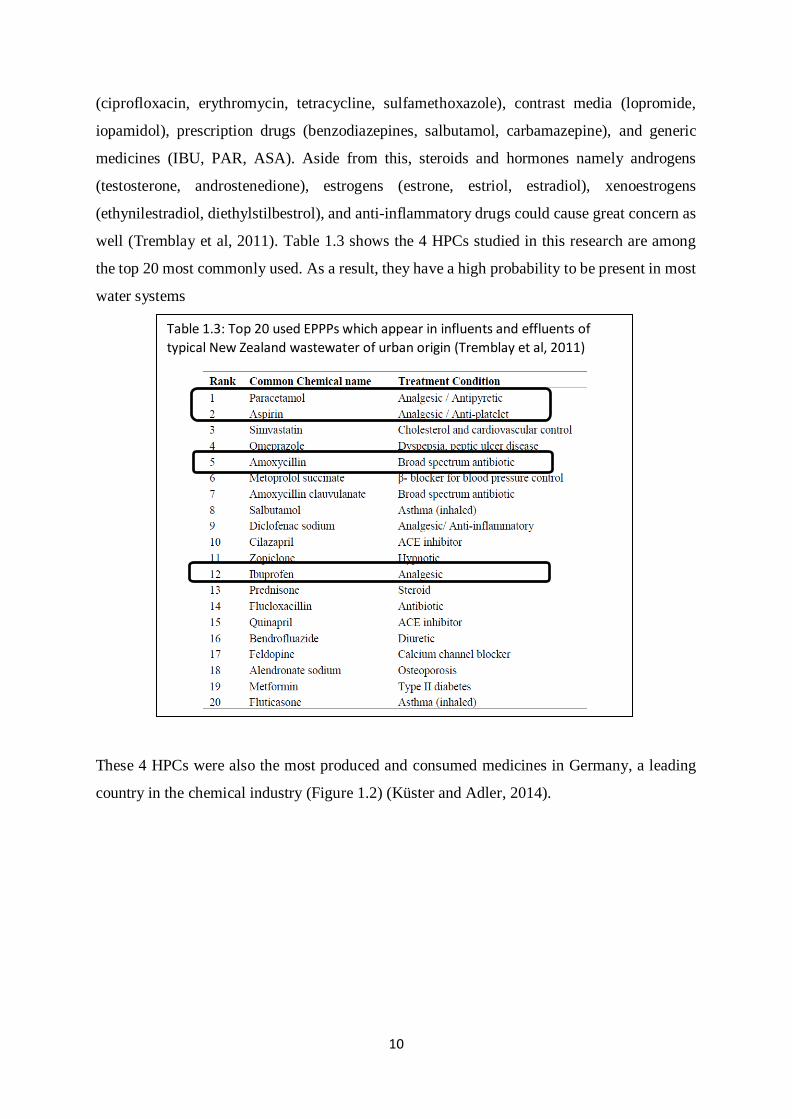
These 4 HPCs were also the most produced and consumed medicines in Germany, a leading
country in the chemical industry (Figure 1.2) (Küster and Adler, 2014).
Table 1.3: Top 20 used EPPPs which appear in influents and effluents of
typical New Zealand wastewater of urban origin (Tremblay et al, 2011)
11
1.2 Common Human Pharmaceutical Compounds
According to the WHO model list of essential medicines (World Health Organization, 2013),
these drugs are considered the most important medications needed in a basic health system,
which makes them very available. In addition, IBU, PAR and ASA can be purchased as a
generic medicine without the need of a prescription (World Health Organization, 2013)
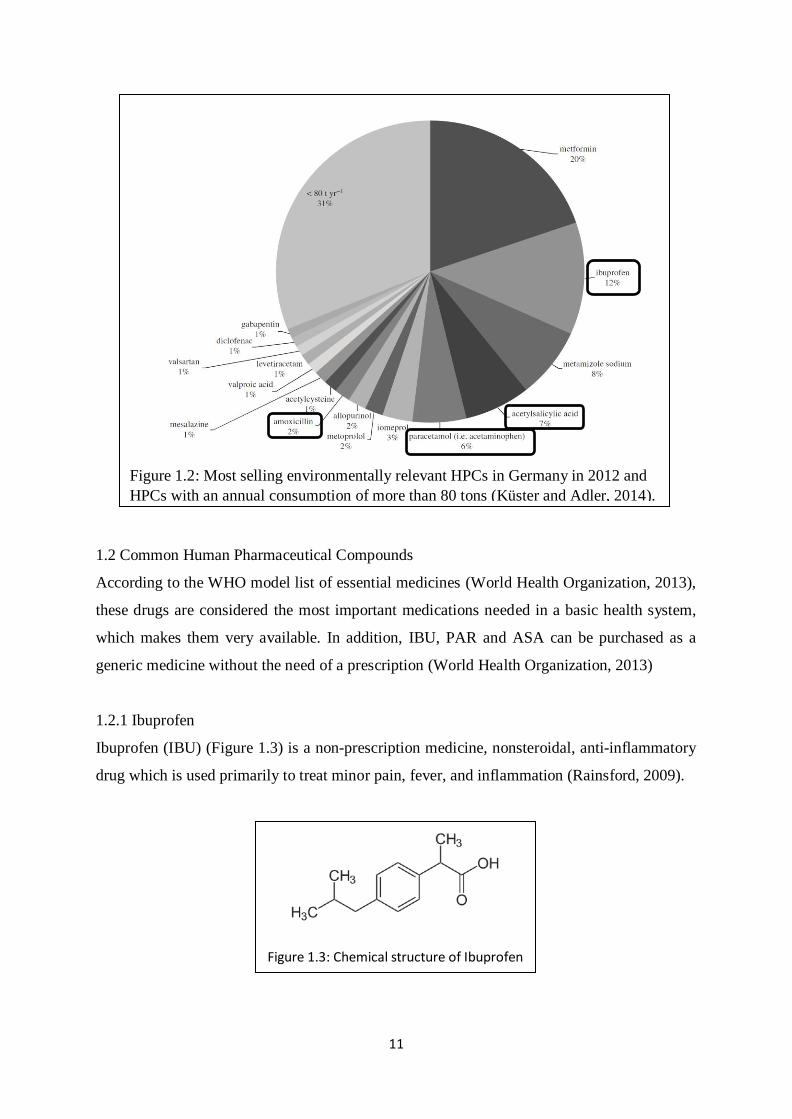
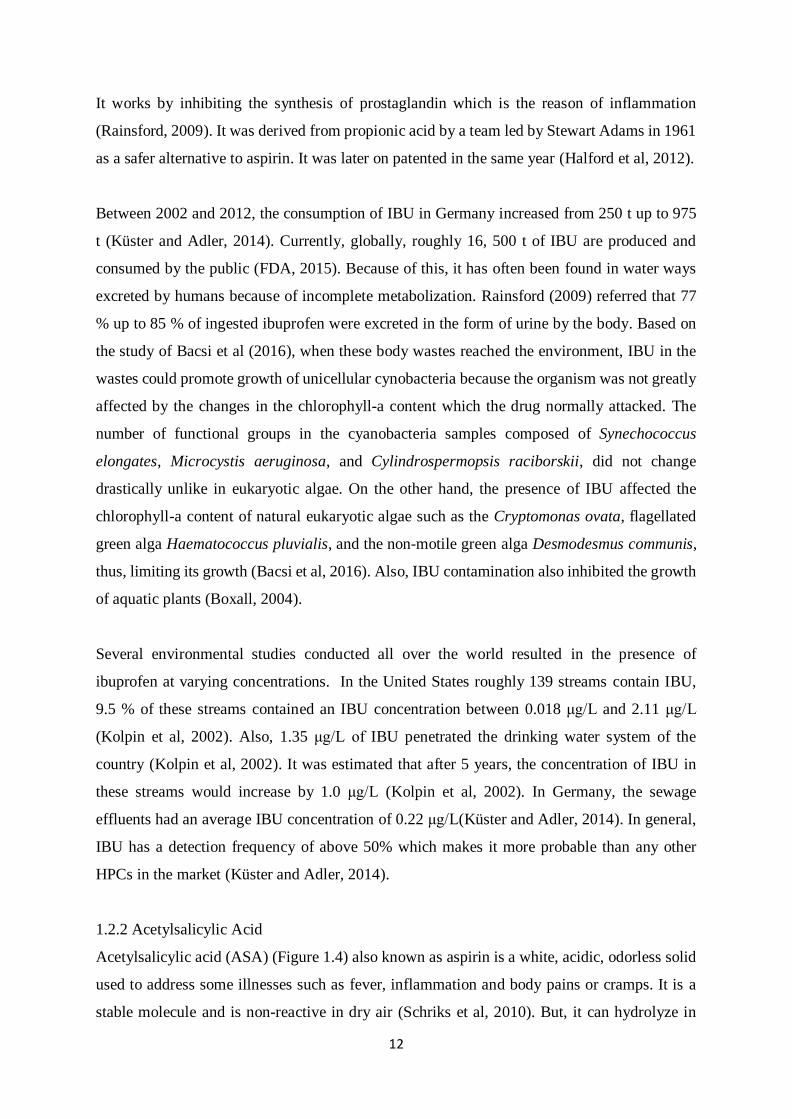
1.2.1 Ibuprofen
Ibuprofen (IBU) (Figure 1.3) is a non-prescription medicine, nonsteroidal, anti-inflammatory
drug which is used primarily to treat minor pain, fever, and inflammation (Rainsford, 2009).
Figure 1.2: Most selling environmentally relevant HPCs in Germany in 2012 and
HPCs with an annual consumption of more than 80 tons (Küster and Adler, 2014).
Figure 1.3: Chemical structure of Ibuprofen
12
It works by inhibiting the synthesis of prostaglandin which is the reason of inflammation
(Rainsford, 2009). It was derived from propionic acid by a team led by Stewart Adams in 1961
as a safer alternative to aspirin. It was later on patented in the same year (Halford et al, 2012).
Between 2002 and 2012, the consumption of IBU in Germany increased from 250 t up to 975
t (Küster and Adler, 2014). Currently, globally, roughly 16, 500 t of IBU are produced and
consumed by the public (FDA, 2015). Because of this, it has often been found in water ways
excreted by humans because of incomplete metabolization. Rainsford (2009) referred that 77
% up to 85 % of ingested ibuprofen were excreted in the form of urine by the body. Based on
the study of Bacsi et al (2016), when these body wastes reached the environment, IBU in the
wastes could promote growth of unicellular cynobacteria because the organism was not greatly
affected by the changes in the chlorophyll-a content which the drug normally attacked. The
number of functional groups in the cyanobacteria samples composed of Synechococcus
elongates, Microcystis aeruginosa, and Cylindrospermopsis raciborskii, did not change
drastically unlike in eukaryotic algae. On the other hand, the presence of IBU affected the
chlorophyll-a content of natural eukaryotic algae such as the Cryptomonas ovata, flagellated
green alga Haematococcus pluvialis, and the non-motile green alga Desmodesmus communis,
thus, limiting its growth (Bacsi et al, 2016). Also, IBU contamination also inhibited the growth
of aquatic plants (Boxall, 2004).
Several environmental studies conducted all over the world resulted in the presence of
ibuprofen at varying concentrations. In the United States roughly 139 streams contain IBU,
9.5 % of these streams contained an IBU concentration between 0.018 μg/L and 2.11 μg/L
(Kolpin et al, 2002). Also, 1.35 μg/L of IBU penetrated the drinking water system of the
country (Kolpin et al, 2002). It was estimated that after 5 years, the concentration of IBU in
these streams would increase by 1.0 μg/L (Kolpin et al, 2002). In Germany, the sewage
effluents had an average IBU concentration of 0.22 μg/L(Küster and Adler, 2014). In general,
IBU has a detection frequency of above 50% which makes it more probable than any other
HPCs in the market (Küster and Adler, 2014).
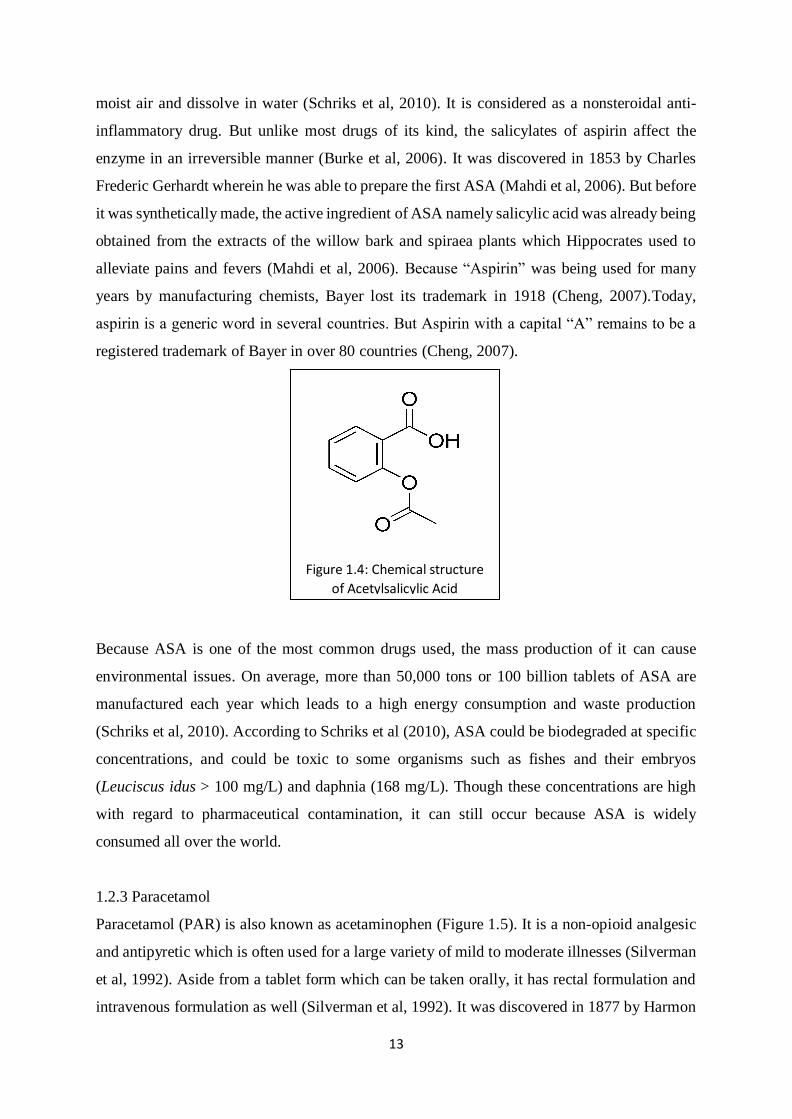
1.2.2 Acetylsalicylic Acid
Acetylsalicylic acid (ASA) (Figure 1.4) also known as aspirin is a white, acidic, odorless solid
used to address some illnesses such as fever, inflammation and body pains or cramps. It is a
stable molecule and is non-reactive in dry air (Schriks et al, 2010). But, it can hydrolyze in
13
moist air and dissolve in water (Schriks et al, 2010). It is considered as a nonsteroidal anti-
inflammatory drug. But unlike most drugs of its kind, the salicylates of aspirin affect the
enzyme in an irreversible manner (Burke et al, 2006). It was discovered in 1853 by Charles
Frederic Gerhardt wherein he was able to prepare the first ASA (Mahdi et al, 2006). But before
it was synthetically made, the active ingredient of ASA namely salicylic acid was already being
obtained from the extracts of the willow bark and spiraea plants which Hippocrates used to
alleviate pains and fevers (Mahdi et al, 2006). Because “Aspirin” was being used for many
years by manufacturing chemists, Bayer lost its trademark in 1918 (Cheng, 2007).Today,
aspirin is a generic word in several countries. But Aspirin with a capital “A” remains to be a
registered trademark of Bayer in over 80 countries (Cheng, 2007).
Because ASA is one of the most common drugs used, the mass production of it can cause
environmental issues. On average, more than 50,000 tons or 100 billion tablets of ASA are
manufactured each year which leads to a high energy consumption and waste production
(Schriks et al, 2010). According to Schriks et al (2010), ASA could be biodegraded at specific
concentrations, and could be toxic to some organisms such as fishes and their embryos
(Leuciscus idus > 100 mg/L) and daphnia (168 mg/L). Though these concentrations are high
with regard to pharmaceutical contamination, it can still occur because ASA is widely
consumed all over the world.
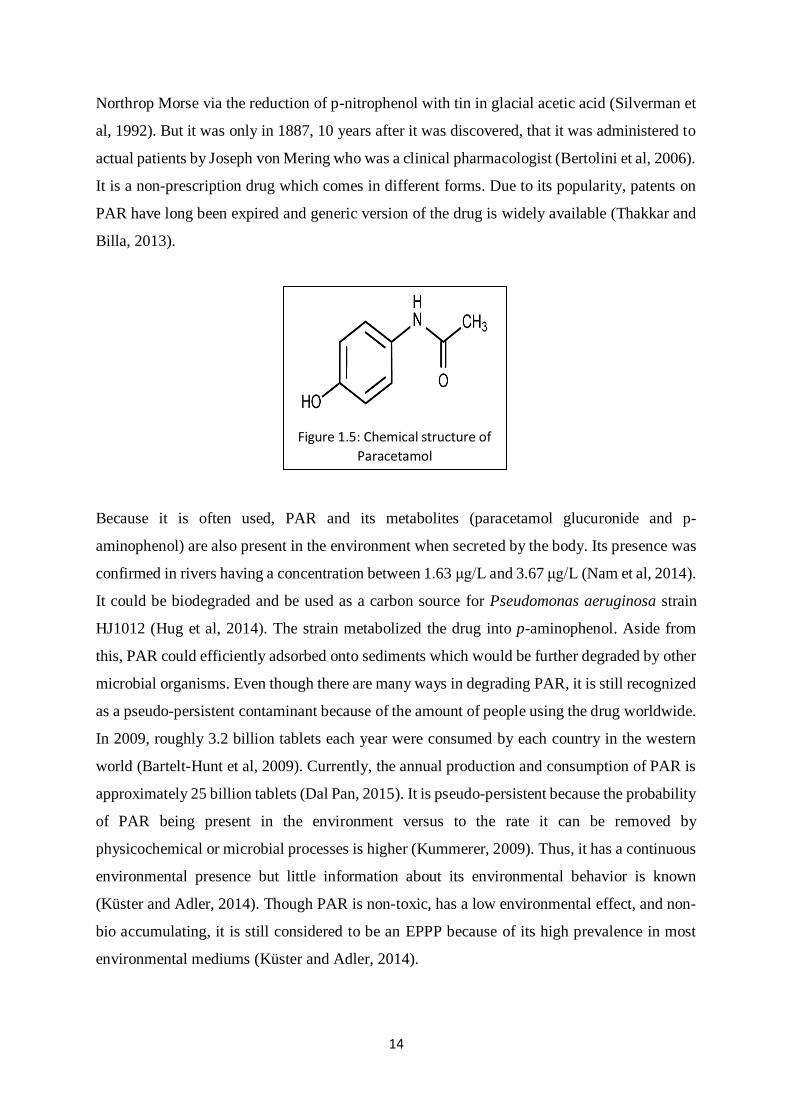
1.2.3 Paracetamol
Paracetamol (PAR) is also known as acetaminophen (Figure 1.5). It is a non-opioid analgesic
and antipyretic which is often used for a large variety of mild to moderate illnesses (Silverman
et al, 1992). Aside from a tablet form which can be taken orally, it has rectal formulation and
intravenous formulation as well (Silverman et al, 1992). It was discovered in 1877 by Harmon
Figure 1.4: Chemical structure
of Acetylsalicylic Acid
14
Northrop Morse via the reduction of p-nitrophenol with tin in glacial acetic acid (Silverman et
al, 1992). But it was only in 1887, 10 years after it was discovered, that it was administered to
actual patients by Joseph von Mering who was a clinical pharmacologist (Bertolini et al, 2006).
It is a non-prescription drug which comes in different forms. Due to its popularity, patents on
PAR have long been expired and generic version of the drug is widely available (Thakkar and
Billa, 2013).
Because it is often used, PAR and its metabolites (paracetamol glucuronide and p-
aminophenol) are also present in the environment when secreted by the body. Its presence was
confirmed in rivers having a concentration between 1.63 μg/L and 3.67 μg/L (Nam et al, 2014).
It could be biodegraded and be used as a carbon source for Pseudomonas aeruginosa strain
HJ1012 (Hug et al, 2014). The strain metabolized the drug into p-aminophenol. Aside from
this, PAR could efficiently adsorbed onto sediments which would be further degraded by other
microbial organisms. Even though there are many ways in degrading PAR, it is still recognized
as a pseudo-persistent contaminant because of the amount of people using the drug worldwide.
In 2009, roughly 3.2 billion tablets each year were consumed by each country in the western
world (Bartelt-Hunt et al, 2009). Currently, the annual production and consumption of PAR is
approximately 25 billion tablets (Dal Pan, 2015). It is pseudo-persistent because the probability
of PAR being present in the environment versus to the rate it can be removed by
physicochemical or microbial processes is higher (Kummerer, 2009). Thus, it has a continuous
environmental presence but little information about its environmental behavior is known
(Küster and Adler, 2014). Though PAR is non-toxic, has a low environmental effect, and non-
bio accumulating, it is still considered to be an EPPP because of its high prevalence in most
environmental mediums (Küster and Adler, 2014).
Figure 1.5: Chemical structure of
Paracetamol
15
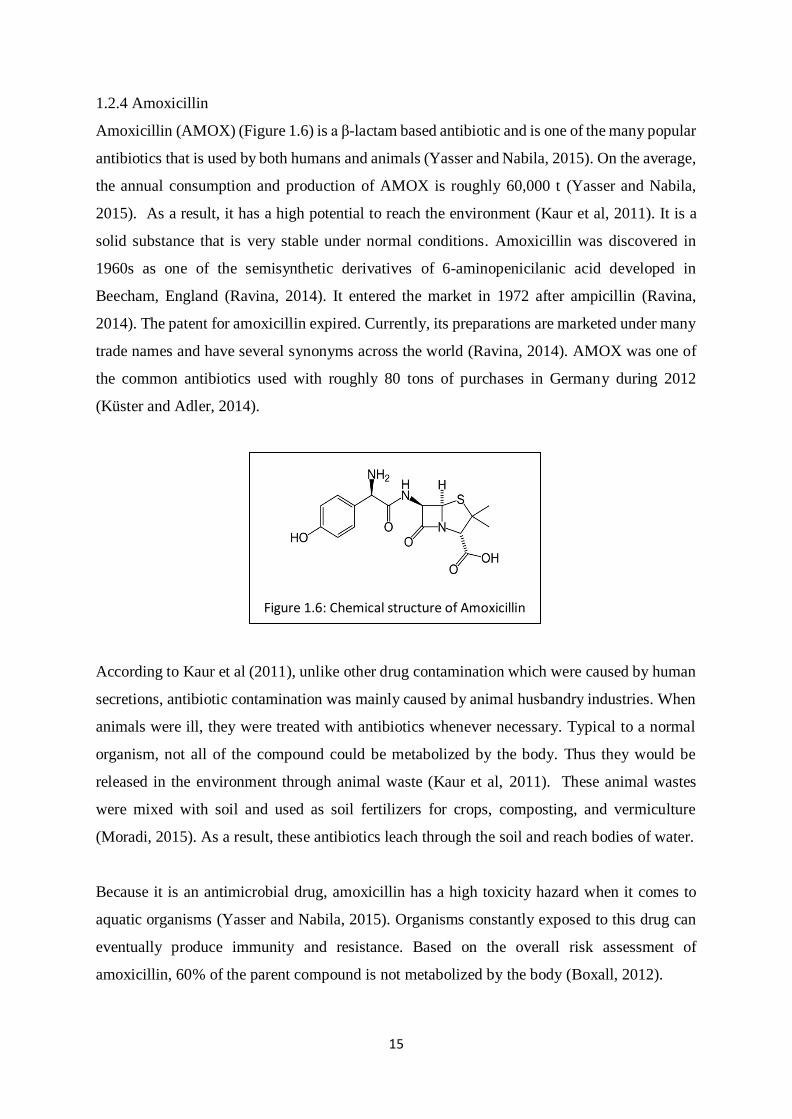
1.2.4 Amoxicillin
Amoxicillin (AMOX) (Figure 1.6) is a β-lactam based antibiotic and is one of the many popular
antibiotics that is used by both humans and animals (Yasser and Nabila, 2015). On the average,
the annual consumption and production of AMOX is roughly 60,000 t (Yasser and Nabila,
2015). As a result, it has a high potential to reach the environment (Kaur et al, 2011). It is a
solid substance that is very stable under normal conditions. Amoxicillin was discovered in
1960s as one of the semisynthetic derivatives of 6-aminopenicilanic acid developed in
Beecham, England (Ravina, 2014). It entered the market in 1972 after ampicillin (Ravina,
2014). The patent for amoxicillin expired. Currently, its preparations are marketed under many
trade names and have several synonyms across the world (Ravina, 2014). AMOX was one of
the common antibiotics used with roughly 80 tons of purchases in Germany during 2012
(Küster and Adler, 2014).
According to Kaur et al (2011), unlike other drug contamination which were caused by human
secretions, antibiotic contamination was mainly caused by animal husbandry industries. When
animals were ill, they were treated with antibiotics whenever necessary. Typical to a normal
organism, not all of the compound could be metabolized by the body. Thus they would be
released in the environment through animal waste (Kaur et al, 2011). These animal wastes
were mixed with soil and used as soil fertilizers for crops, composting, and vermiculture
(Moradi, 2015). As a result, these antibiotics leach through the soil and reach bodies of water.
Because it is an antimicrobial drug, amoxicillin has a high toxicity hazard when it comes to
aquatic organisms (Yasser and Nabila, 2015). Organisms constantly exposed to this drug can
eventually produce immunity and resistance. Based on the overall risk assessment of
amoxicillin, 60% of the parent compound is not metabolized by the body (Boxall, 2012).
Figure 1.6: Chemical structure of Amoxicillin
16
1.3 Wastewater Treatment Plants
In order to address the increasing concern on pharmaceutical contamination particularly the
common HPCs such as IBU, PAR, ASA and AMOX, several wastewater treatment processes
can be used before WW is released into the environment. Wastewater treatment plants
(WWTPs) uses techniques to eliminate potential pathogens and solid impurities (undissolved
substances, easily degradable organic substances, persistent organic substances, plant nutrients,
heavy metals, and salts), and restore as much as possible the natural quality of water before it
is released in the environment (Murdoch, 2015) (Donau Carbon GmbH, 2014).
1.3.1 Common Decontaminating Techniques
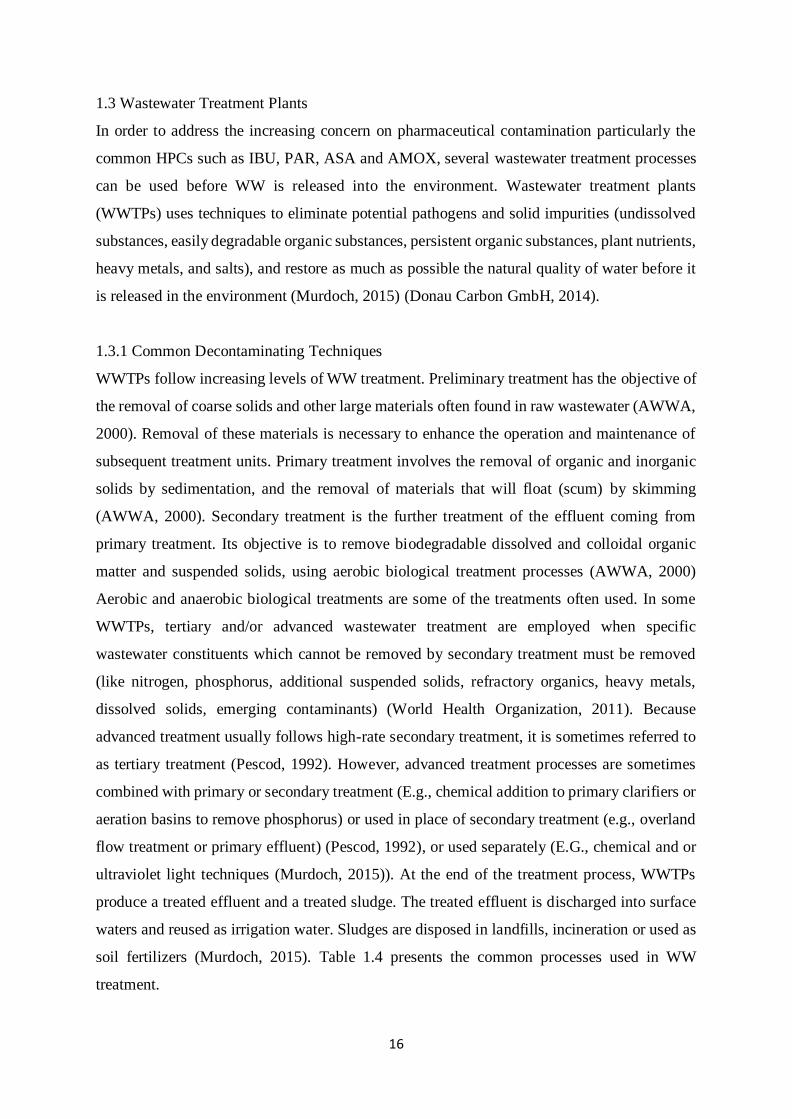
WWTPs follow increasing levels of WW treatment. Preliminary treatment has the objective of
the removal of coarse solids and other large materials often found in raw wastewater (AWWA,
2000). Removal of these materials is necessary to enhance the operation and maintenance of
subsequent treatment units. Primary treatment involves the removal of organic and inorganic
solids by sedimentation, and the removal of materials that will float (scum) by skimming
(AWWA, 2000). Secondary treatment is the further treatment of the effluent coming from
primary treatment. Its objective is to remove biodegradable dissolved and colloidal organic
matter and suspended solids, using aerobic biological treatment processes (AWWA, 2000)
Aerobic and anaerobic biological treatments are some of the treatments often used. In some
WWTPs, tertiary and/or advanced wastewater treatment are employed when specific
wastewater constituents which cannot be removed by secondary treatment must be removed
(like nitrogen, phosphorus, additional suspended solids, refractory organics, heavy metals,
dissolved solids, emerging contaminants) (World Health Organization, 2011). Because
advanced treatment usually follows high-rate secondary treatment, it is sometimes referred to
as tertiary treatment (Pescod, 1992). However, advanced treatment processes are sometimes
combined with primary or secondary treatment (E.g., chemical addition to primary clarifiers or
aeration basins to remove phosphorus) or used in place of secondary treatment (e.g., overland
flow treatment or primary effluent) (Pescod, 1992), or used separately (E.G., chemical and or
ultraviolet light techniques (Murdoch, 2015)). At the end of the treatment process, WWTPs
produce a treated effluent and a treated sludge. The treated effluent is discharged into surface
waters and reused as irrigation water. Sludges are disposed in landfills, incineration or used as
soil fertilizers (Murdoch, 2015). Table 1.4 presents the common processes used in WW
treatment.
17
1.3.2 Activated Carbon
PAC is a non-graphite form of carbon, which is widely used in water/wastewater treatment
(Tolga et al, 2014). PAC can be manufactured by carbonizing and activating various raw
materials such as pine wood, coconut shell, coal, eucalyptus, peat, saw dust, rice husk and
lignite (Rashed, 2013). In the carbonization process, most of the non-carbon elements like
hydrogen and oxygen are first removed in the form of gas by heating the raw material at high
temperatures (Tan and Hameed, 2010). The release of these elements is responsible in
developing the internal pores of the PAC (Tan and Hameed, 2010). After which, the PAC is
activated through chemical activation. In this process, it increases the number and dimension
of the pores which increases the internal surface area (Enz et al, 2006). There are different types
Table 1.4: Conventional and advanced wastewater treatment processes and their
expected range of removal efficiency for pharmaceuticals
(World Health Organization, 2011)
18
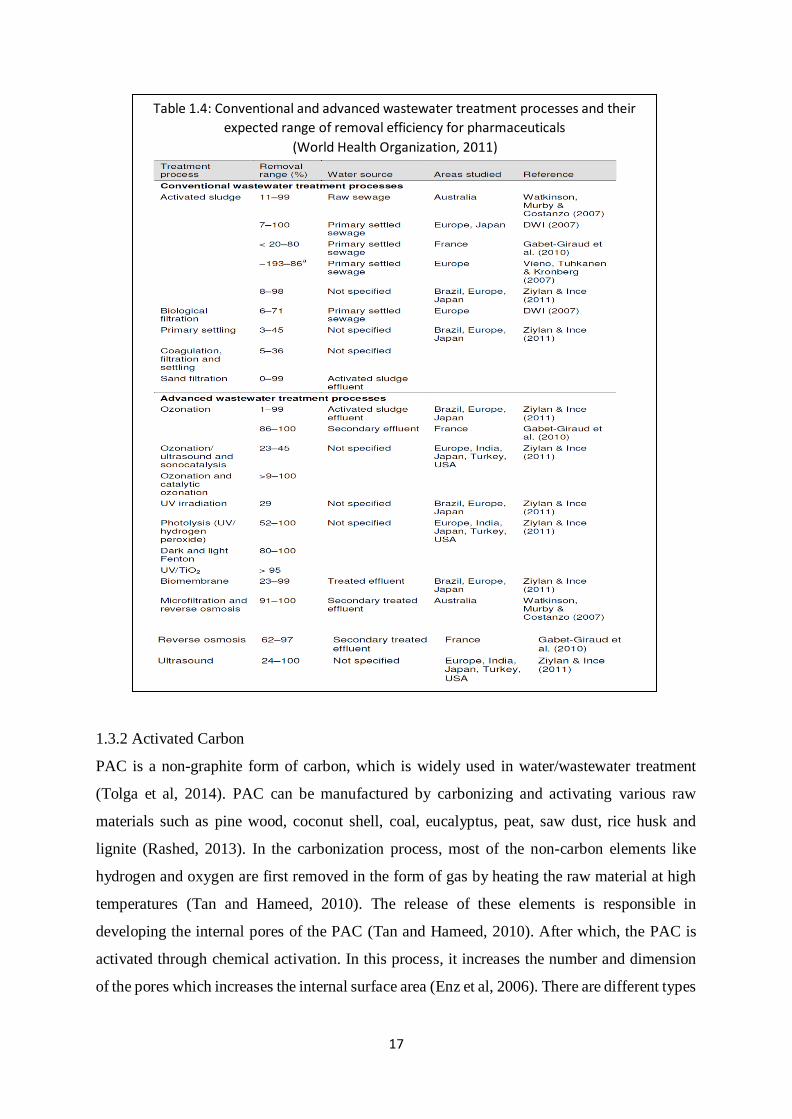
of pores present in PAC namely micro pore, meso pore and macro pore (Figure 1.7) (Enz et al,
2006). The macro pores (25 nm < pore radius) are where the contaminants can enter (Enz et
al, 2006). The meso pores (1 nm < pore radius < 25 nm) act as the hallways or the corridors
where the contaminants are transported (Enz et al, 2006). When the contaminants reach the
micro pores (pore radius < 1nm), they start to adhere to the internal surfaces and adsorb within
the PAC through intermolecular forces (Enz et al, 2006). The strength of the intermolecular
forces in PAC are either weak or strong interactions (Sivasankar, 2008). A weak interaction
(<40 kJ/mol) is the same as the interactions between molecules in liquids and allow for what
is known as physical adsorption or physisorption (Sivasankar, 2008). Strong interactions (>40
kJ/mol) are similar to the interaction between atoms within a molecule like covalent bonds and
allow for chemical adsorption or chemisorption (Sivasankar, 2008). In chemisorption the
molecule may be broken down and the fragmented molecule attaches on the surface of the
adsorbent, this process is known as dissociative chemisorption (Sivasankar, 2008). Unlike in
physisorption where the adsorbed molecule remains intact (Sivasankar, 2008). Because of the
varying molecular size and interaction forces, adsorption is not constant. The smaller the
molecular size of the contaminant, the deeper it can diffuse into the pores of PAC (Enz et al,
2006). Thus, PAC can adsorb more contaminants with a smaller molecular size. At the same
time, the finer the PAC, the more accessible are its surface to contaminants leading to a faster
the rate of adsorption (Sivasankar, 2008). The carbon adsorption process is controlled by the
diameter of the pores in PAC and by the diffusion rate of organic molecules through the pores.
The rate of adsorption is a function of the molecular weight and the molecular size of the
organics (Upadhyayula et al, 2009).
Figure 1.7: Pore structure and type of pores present in activated carbon
(Begg Cousland, 2016)
19
Activated carbon can be used either in powdered (PAC) or granular (GAC) forms and is widely
used to remove bio-resistant organic materials due to its simplicity in design, operation,
regeneration, and cost (Ghafoori et al, 2014). PAC is used in combination with other treatment
processes. Due to its high efficiency, the activated carbon is usually used in the last treatment
step to remove the most difficult impurities like pharmaceutical micropollutants (Donau
Carbon GmbH, 2014). PAC adsorption in WWTPs is done by adding activated carbon, letting
it mix with WW and allowing it to settle for a specific amount of time. In GAC adsorption WW
passes through carbon packed columns or carbon filter bed. (Donau Carbon GmbH, 2014).
Studies showed that activated carbon could remove organic substances and colorants, reduce
the amount of trace substances like chemicals and pharmaceutical, and decrease the residual
chemical oxygen demand in a WWTP (Donau Carbon GmbH, 2014). Based on the study of
Ghafoori et al (2014), approximately 1.07 kg of carbon/L of pharmaceutical WW were required
to remove 320 mg of carbon/L of effluent TOC, since the activated carbon followed the
Langmuir isotherm which meant that only a monolayer, homogeneous adsorption could occur.
1.4 Iron Nanoparticles
Nanoparticles (NPs) can help in water treatment (Carlos et al, 2013). A common type of NP
being used in different applications like water treatment and biological applications is nano-
iron oxide due to its size, abundancy, and magnetic property (Ambashta et al, 2010).
Iron is a common transition metal because of its many applications (Huber, 2005). It is used as
structural backbone of infrastructure as well as other construction applications (Huber, 2005).
However, iron is not as common in the nanoscale unlike its oxide (Huber, 2005). Iron oxide
nanoparticles (FeNPs) are stable unlike plain nano-iron, which is pyrophoric making it difficult
to study (Huber, 2005). But, both are very magnetic and have catalytic properties, which can
be applied in removing contaminants from bodies of water such as inorganic metals (Huber,
2005).
FeNPs have a diameter between 1 to 100 nm and can be observed in two forms namely
magnetite (Fe3O4) and its oxidized form maghemite (Fe2O3), which are stable (Tang and Lo,
2013). FeNPs are used for magnetic data storage, biosensing, and drug-delivery because of
their stability and significantly high surface area to volume ratio (Blaney, 2007). FeNPs exhibit
high magnetic property even at sizes between 2 to 20 nm (Scott et al, 2011). They display super
20
paramagnetism which provides an additional stability (Scott et al, 2011). It is also
biocompatible and non-toxic (Scott et al, 2011). In Table 1.5, the different synthesis techniques
that can be applied to produce FeNPs are shown.
Table 1.5: Techniques used to synthesize FeNPs
Technique Particle Characteristic References
High-temperature decomposition
of organic precursors
Monodisperse, crystalline
structure, uniform size
Scott et al, 2011
Microemulsion or Reverse
Micelle
Monodisperse, well-ordered,
uniform size,
Blaney, 2007
Co-precipitation: Ferrous
hydroxide suspension
Uniform size Blaney, 2007 ;
Mascolo et al, 2013
Co-precipitation: Ageing
stoichiometric mixtures
Uniform size Blaney, 2007 ;
Mascolo et al, 2013
Copolymer Templates Structurally stable, uniform size Blaney, 2007
Based on Scott et al (2014), FeNPs could be made by high-temperature decomposition of
organic precursors (iron carboxylate salts) in the presence of hot organic surfactants (xylenes
and sodium dodecylbenezensulfonate). This technique could be used in creating FeNPs for
biomedical application like magnetic resonance imaging, and magnetorelaxometry (Scott et al
2014).
According to Blaney (2007), showed microemulsion or the reverse micelle technique which
was a stable isotropic dispersion of 2 immiscible liquids with nanosized domains of one or both
liquids. This could be done in a water-in-oil system at the presence of an amphiphilic surfactant.
The presence of the surfactant lowered the surface tension between the 2 immiscible liquids
(Blaney, 2007). As a result, the water nanodroplets acted as nanoreactors where the
nanoparticles could be synthesized. Because these nanodroplets acted as carriers of the FeNPs,
the size of the FeNPs depended on the size of the nanodroplets. As such, if one desired to
change the size of the FeNPs, one should change the size of the nanodroplets (Blaney, 2007).
FeNPs could also be made by co-precipitation using a ferrous hydroxide suspension which was
partially oxidized by an oxidizing agent. This was done by reacting iron (III) salt with a base
21
and a mild oxidant such as nitrate ions. Another process was by co-precipitation which
consisted of ageing stoichiometric mixtures of iron (II) and iron (III) hydroxides in aqueous
media at a basic pH between 8 to14. The ratio of iron (III) to iron (II) was 2:1 and the
environment should be non-oxidizing. The problem with this technique was the susceptibility
of the particles to oxidation. As a result, it could easily transform the magnetite into maghemite
(Mascolo et al, 2013). In both co-precipitation techniques, the size of the FeNPs could be
controlled by adjusting the pH, ionic strength, temperature, nature of the salts used, and the
concentration ratio of iron (II) to iron (III) (Mascolo et al, 2013).
The last technique is by co-polymer templates. According to the study of Blaney (2007), co-
polymer uses ion exchange resins such as micro-scale styrene beads with divinylbenzene
crosslinking. These resins were mesoporous (2-50 nm in diameter) containing negatively
charged sulfonic groups which could exhibit cation exchange. When these templates were
immersed into the solution of strong positive electrolytes like ferrous iron, the metal loads
attached to the sulfonic groups on the mesopores. These mesopores then acted as nanoreactors
(Blaney, 2007).
Once synthesized several modifications can be done to FeNPs depending on the desired
application. According to Blaney (2007), FeNPs could be coated with a monolayer coat of
polymer. By doing so, hydrophobic, organic ligand-coated FeNPs were converted into water-
soluble, bio-accessible FeNPs. Because of this coating, the FeNPs were stable at high pH
values, and temperatures making them untampered when attaching to other molecules. Aside
from coating it with a polymer, biocompatible coatings could also be used such as
polysaccharides like dextran and lipid molecules (Blaney, 2007). Innovation in using FeNPs as
oil spill collectors are also being done. Atta et al (2015), showed that FeNPs could be oxidized
by air and could aggregate in aqueous solutions because of anisotropic dipolar attraction. To
prevent aggregation without affecting the magnetic capabilities of the particle, the surface of
FeNPs were modified by functionalizing the particles with amidoxime (Atta et al, 2015).
Amidoxime is an amphoteric naturally produced molecule found in rosin gum. The acidic and
basic sites on amidoxime could prevent aggregation of FeNP particles with each other and
could attach to hydrophobic molecules (Atta et al, 2015). The coating process is presented on
Figure 1.8. Because the particles were in a basic medium, the hydroxyl (-OH) groups
surrounded the FeNPs and bonds to the carboxylic group of amidoxime. Creating a
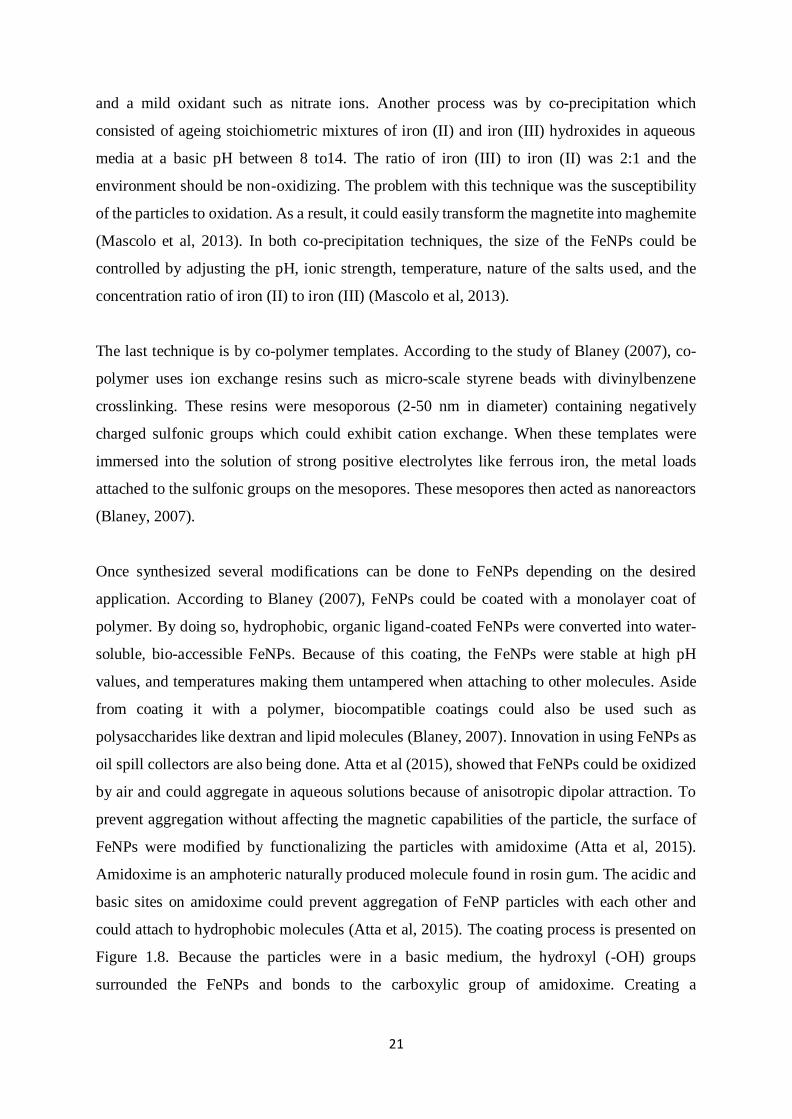
22
functionalized particle which contained nitrogen (basic sites), carboxylic groups (acidic sites)
and carbon-hydrogen groups (hydrophobic sites) (Atta et al, 2015).
In the study of Atta et al (2015), uncoated FeNPs had a removal efficiency that ranged from 10
% to 45 %. This was far from the removal efficiency of amidoxime coated FeNPs which ranged
from 70 % to 95 % because the particles were less aggregated with each other exposing more
binding sites for the hydrophobic oil particles (Atta et al, 2015).
Aside from being an oil spill collector, FeNPs are predominantly used in decontaminating WW
with heavy metal contamination by applying a magnetic force (Carlos et al, 2013). In the study
of Carlos et al (2013), the heavy metals adsorbed by FeNPs are Arsenic (V), Lead (II), Mercury
(II), Copper (II), Cadmium (II) and Chromium (II). All of which have a removal of above 95%.
This is supported by the study of D’Couto (2008), which analyzed the removal of heavy metals
like arsenic and lead in wastewater.
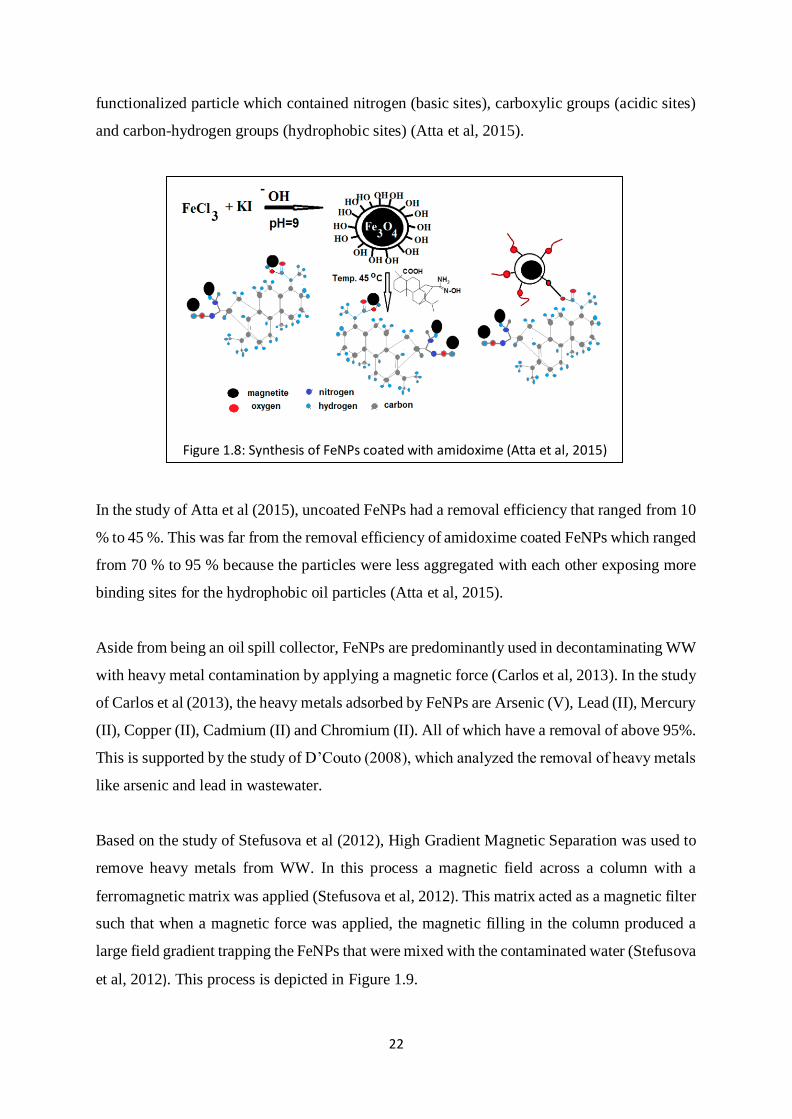
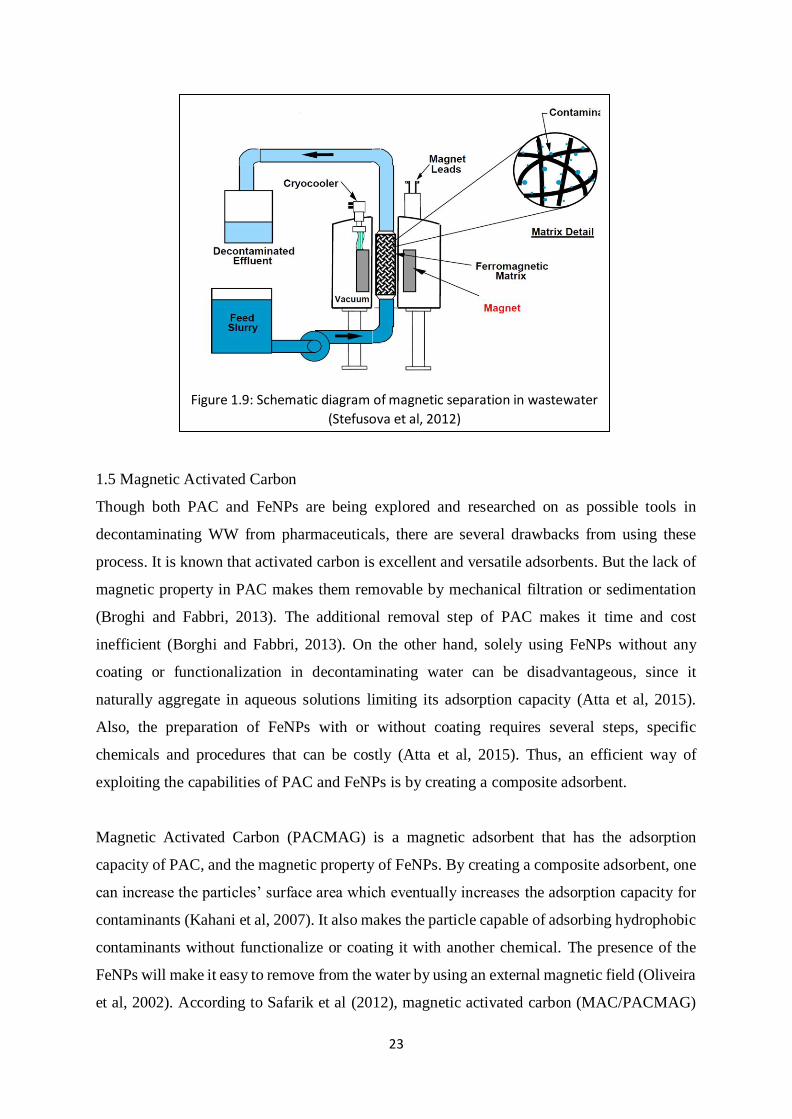
Based on the study of Stefusova et al (2012), High Gradient Magnetic Separation was used to
remove heavy metals from WW. In this process a magnetic field across a column with a
ferromagnetic matrix was applied (Stefusova et al, 2012). This matrix acted as a magnetic filter
such that when a magnetic force was applied, the magnetic filling in the column produced a
large field gradient trapping the FeNPs that were mixed with the contaminated water (Stefusova
et al, 2012). This process is depicted in Figure 1.9.
Figure 1.8: Synthesis of FeNPs coated with amidoxime (Atta et al, 2015)
23
1.5 Magnetic Activated Carbon
Though both PAC and FeNPs are being explored and researched on as possible tools in
decontaminating WW from pharmaceuticals, there are several drawbacks from using these
process. It is known that activated carbon is excellent and versatile adsorbents. But the lack of
magnetic property in PAC makes them removable by mechanical filtration or sedimentation
(Broghi and Fabbri, 2013). The additional removal step of PAC makes it time and cost
inefficient (Borghi and Fabbri, 2013). On the other hand, solely using FeNPs without any
coating or functionalization in decontaminating water can be disadvantageous, since it
naturally aggregate in aqueous solutions limiting its adsorption capacity (Atta et al, 2015).
Also, the preparation of FeNPs with or without coating requires several steps, specific
chemicals and procedures that can be costly (Atta et al, 2015). Thus, an efficient way of
exploiting the capabilities of PAC and FeNPs is by creating a composite adsorbent.
Magnetic Activated Carbon (PACMAG) is a magnetic adsorbent that has the adsorption
capacity of PAC, and the magnetic property of FeNPs. By creating a composite adsorbent, one
can increase the particles’ surface area which eventually increases the adsorption capacity for
contaminants (Kahani et al, 2007). It also makes the particle capable of adsorbing hydrophobic
contaminants without functionalize or coating it with another chemical. The presence of the
FeNPs will make it easy to remove from the water by using an external magnetic field (Oliveira
et al, 2002). According to Safarik et al (2012), magnetic activated carbon (MAC/PACMAG)
Figure 1.9: Schematic diagram of magnetic separation in wastewater
(Stefusova et al, 2012)
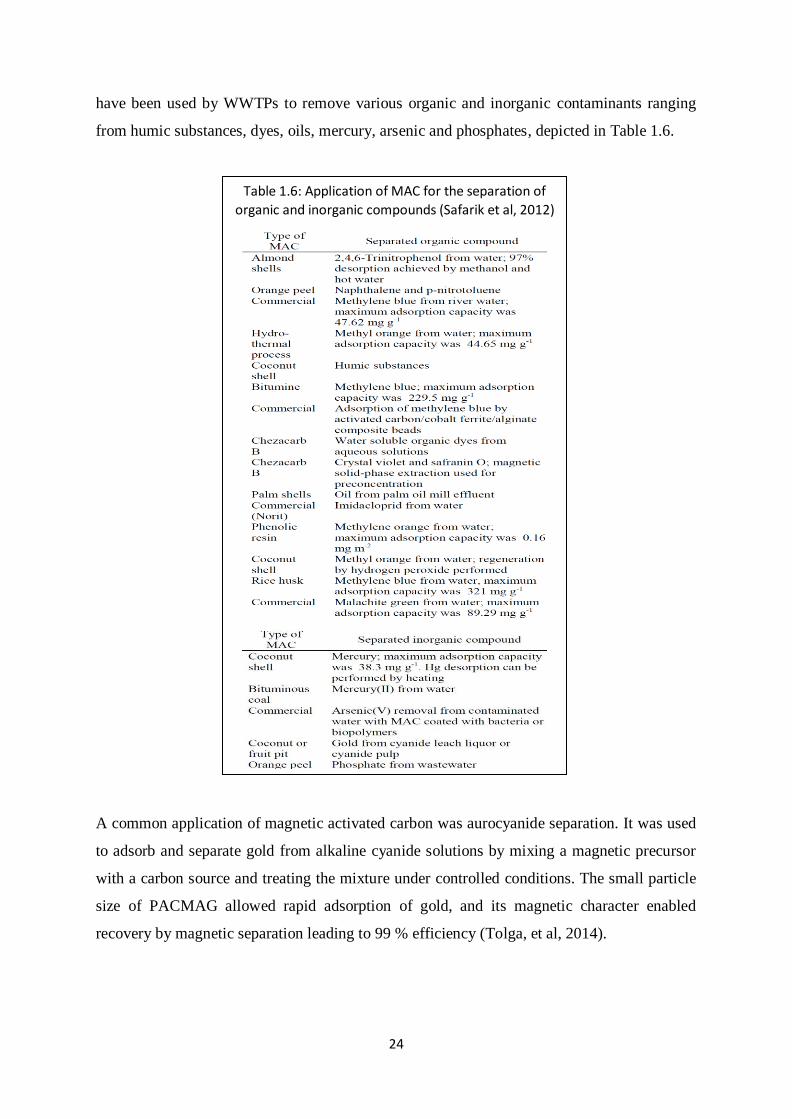
24
have been used by WWTPs to remove various organic and inorganic contaminants ranging
from humic substances, dyes, oils, mercury, arsenic and phosphates, depicted in Table 1.6.
A common application of magnetic activated carbon was aurocyanide separation. It was used
to adsorb and separate gold from alkaline cyanide solutions by mixing a magnetic precursor
with a carbon source and treating the mixture under controlled conditions. The small particle
size of PACMAG allowed rapid adsorption of gold, and its magnetic character enabled
recovery by magnetic separation leading to 99 % efficiency (Tolga, et al, 2014).
Table 1.6: Application of MAC for the separation of
organic and inorganic compounds (Safarik et al, 2012)
25
Aside from aurocyanide separation, PACMAG are used in WWTP to remove endocrine
disruptors in the environment. Based on the study of Borghi and Fabbri (2013), the two
endocrine disruptors, 4-octylphenol and 4-n-nonylphenol, were 95 + 5% until 97 + 1% removed
from WW using 0.1 - 0.5 g/L of PACMAG. This was done by allowing the contaminated water
to pass through a magnetic filtration tube filled with stainless steel spheres at the presence of
an external magnetic field. By doing so, the generated magnetic force was able to capture and
withhold the adsorbent against the drag force of the surrounding fluid.
26
2 EXPERIMENTAL PART
2.1 Materials and Methods
2.1.1 Chemicals
The chemicals used in the synthesis of FeNPs were: iron (III) chloride 6-hydrate (FeCl3.6H2O)
(Panreac Applichem, Barcelona, Spain), hydrochloric acid (HCl) (VWR International,
Pennsylvania, USA), sodium sulfate (Na2SO4) (Fisher Scientific International, Inc., Pittsburgh,
USA), ammonia (NH3) (Panreac Applichem, Bareclona, Spain) and deionized water (ELIX
Millipore Iberico, S.A.U., Madrid, Spain). Silver nitrate (AgNO3) (Aldrich Chemistry,
Steinheim, Germany) was used to assess the presence and absence of chloride anion in the
system after particle washing.
Solutions of sodium chloride (NaCl) (Merck, Darmstadt, Germany) were used to adjust the
ionic strength when measuring the zeta potential of the particles. Hydrochloric acid (HCl) and
sodium hydroxide solutions (NaOH) (Merck, Darmstadt, Germany) solutions were used to
adjust the pH of the solutions.
Powdered activated carbon (PAC) was obtained from Águas do Algarve, S.A. which was used
in the synthesis of the PACMAG. For the adsorption experiments, DW, and WW (Águas do
Algarve, S.A.) were mixed with Ibuprofen (IBU) (Jose M. Vaz Pereira, S.A., Lisboa, Portugal),
Paracetamol (PAR) (Jose M. Vaz Pereira, S.A., Lisboa, Portugal), Amoxicillin (AMOX) (Atral
Cipan, Castanheira do Ribatejo, Portugal) and Acetylsalicylic Acid (ASA). The ASA was
synthesized in the laboratory using salicylic acid (C7H6O3) (Marques & Barroso Lda., Braga,
Portugal) and acetic anhydride (C4H6O3) (Merck, Darmstadt, Germany) based on the standard
procedure obtained from literature (Royal Society of Chemistry, 2003).
For the regeneration of magnetic activated carbon (PACMAG), hydrogen peroxide (H2O2)
(Fisher Scientific International, Inc., Pittsburgh, USA) and hydrochloric acid (HCl) were used.
2.2 Instrumentation
2.2.1 Zetasizer
The size and zeta potential (ZP) of the synthesized FeNP were measured using a Zetasizer
Nano Series Nano-Z590 (Malvern Instruments, Malvern, United Kingdom).
27
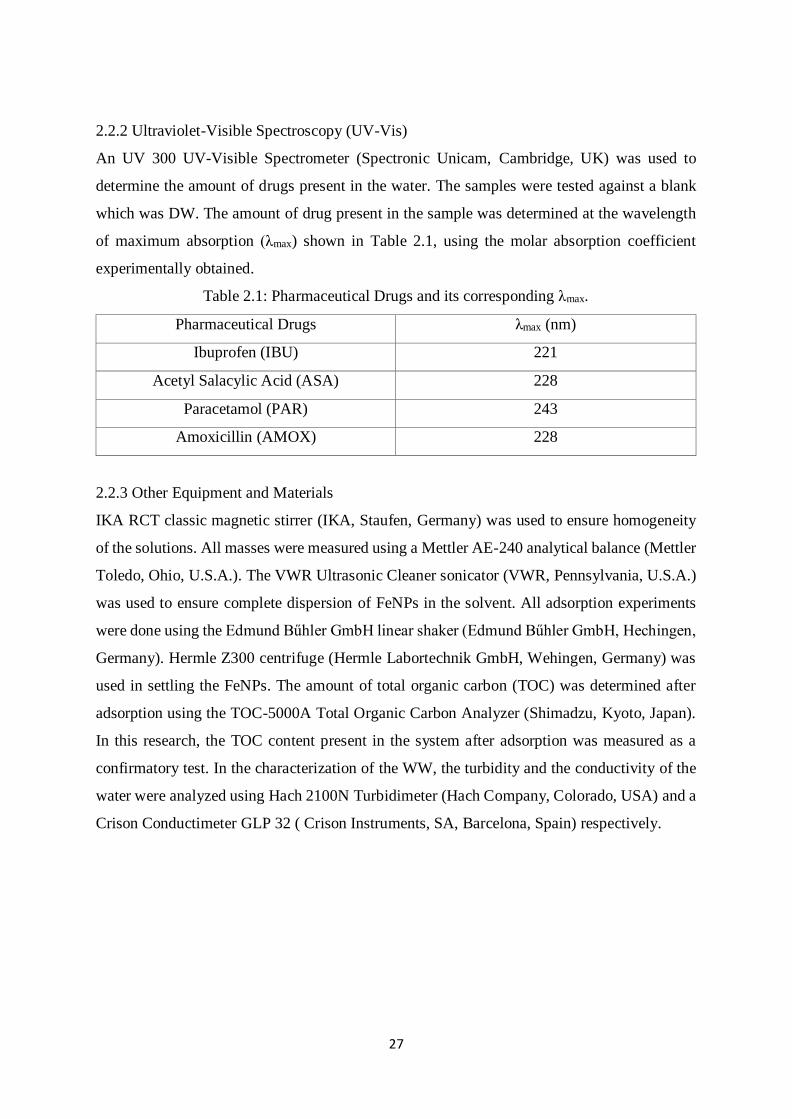
2.2.2 Ultraviolet-Visible Spectroscopy (UV-Vis)
An UV 300 UV-Visible Spectrometer (Spectronic Unicam, Cambridge, UK) was used to
determine the amount of drugs present in the water. The samples were tested against a blank
which was DW. The amount of drug present in the sample was determined at the wavelength
of maximum absorption (λmax) shown in Table 2.1, using the molar absorption coefficient
experimentally obtained.
Table 2.1: Pharmaceutical Drugs and its corresponding λmax.
Pharmaceutical Drugs λmax (nm)
Ibuprofen (IBU) 221
Acetyl Salacylic Acid (ASA) 228
Paracetamol (PAR) 243
Amoxicillin (AMOX) 228
2.2.3 Other Equipment and Materials
IKA RCT classic magnetic stirrer (IKA, Staufen, Germany) was used to ensure homogeneity
of the solutions. All masses were measured using a Mettler AE-240 analytical balance (Mettler
Toledo, Ohio, U.S.A.). The VWR Ultrasonic Cleaner sonicator (VWR, Pennsylvania, U.S.A.)
was used to ensure complete dispersion of FeNPs in the solvent. All adsorption experiments
were done using the Edmund Bűhler GmbH linear shaker (Edmund Bűhler GmbH, Hechingen,
Germany). Hermle Z300 centrifuge (Hermle Labortechnik GmbH, Wehingen, Germany) was
used in settling the FeNPs. The amount of total organic carbon (TOC) was determined after
adsorption using the TOC-5000A Total Organic Carbon Analyzer (Shimadzu, Kyoto, Japan).
In this research, the TOC content present in the system after adsorption was measured as a
confirmatory test. In the characterization of the WW, the turbidity and the conductivity of the
water were analyzed using Hach 2100N Turbidimeter (Hach Company, Colorado, USA) and a
Crison Conductimeter GLP 32 ( Crison Instruments, SA, Barcelona, Spain) respectively.
28
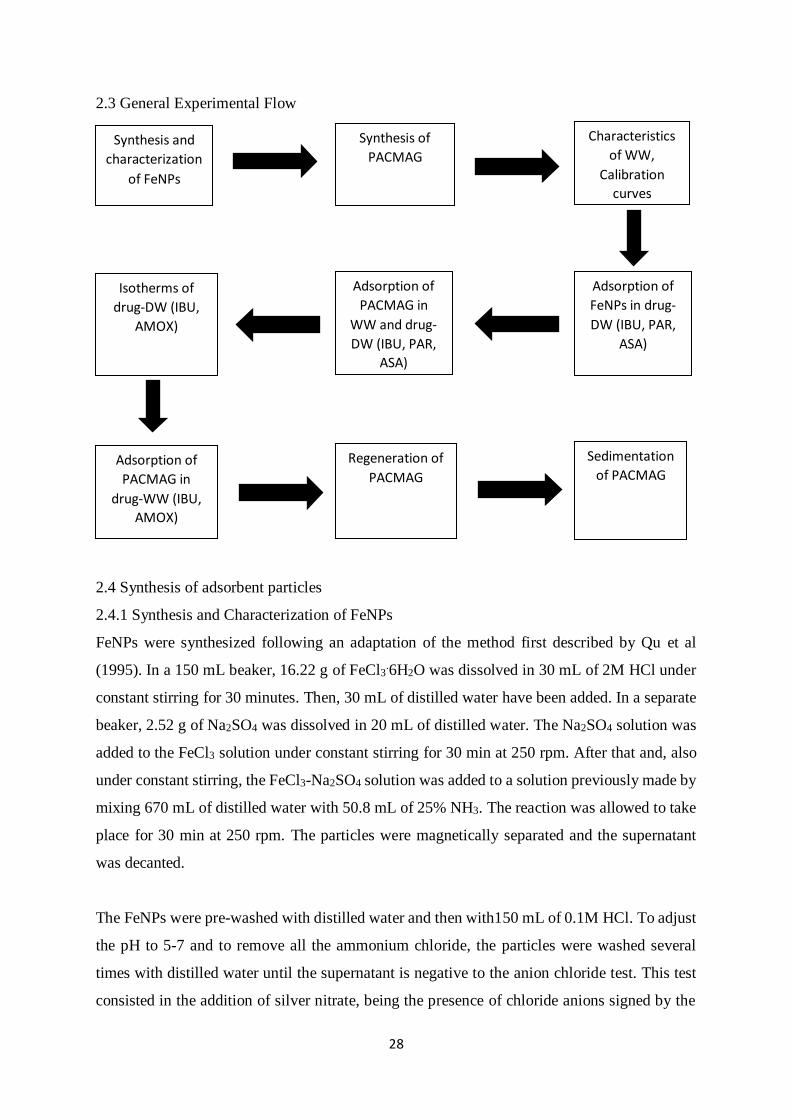
2.3 General Experimental Flow
2.4 Synthesis of adsorbent particles
2.4.1 Synthesis and Characterization of FeNPs
FeNPs were synthesized following an adaptation of the method first described by Qu et al
(1995). In a 150 mL beaker, 16.22 g of FeCl3.6H2O was dissolved in 30 mL of 2M HCl under
constant stirring for 30 minutes. Then, 30 mL of distilled water have been added. In a separate
beaker, 2.52 g of Na2SO4 was dissolved in 20 mL of distilled water. The Na2SO4 solution was
added to the FeCl3 solution under constant stirring for 30 min at 250 rpm. After that and, also
under constant stirring, the FeCl3-Na2SO4 solution was added to a solution previously made by
mixing 670 mL of distilled water with 50.8 mL of 25% NH3. The reaction was allowed to take
place for 30 min at 250 rpm. The particles were magnetically separated and the supernatant
was decanted.
The FeNPs were pre-washed with distilled water and then with150 mL of 0.1M HCl. To adjust
the pH to 5-7 and to remove all the ammonium chloride, the particles were washed several
times with distilled water until the supernatant is negative to the anion chloride test. This test
consisted in the addition of silver nitrate, being the presence of chloride anions signed by the
Synthesis and
characterization
of FeNPs
Synthesis of
PACMAG
Characteristics
of WW,
Calibration
curves
Isotherms of
drug-DW (IBU,
AMOX)
Adsorption of
PACMAG in
WW and drug-
DW (IBU, PAR,
ASA)
Adsorption of
FeNPs in drug-
DW (IBU, PAR,
ASA)
Adsorption of
PACMAG in
drug-WW (IBU,
AMOX)
Regeneration of
PACMAG
Sedimentation
of PACMAG
29
formation of AgCl2 precipitate. Finally, the particles were washed with ethanol. In each wash,
the particles were allowed to settle and magnetically separated. The pH of the supernatant was
measured and then decanted. After the ethanol washing, the particles were air dried for several
days. The mass of the product was obtained and the percent yield was computed.
A solution of 0.0100g of FeNP in 100 mL of a 0.1M NaCl solution and another with the same
amount of FeNP in 100mL of a 0.01M NaCl solution were made, the homogeneity of the
solutions were achieved by sonication for at least 15 minutes. The pH and zeta potential of the
unsonicated and sonicated FeNPs mixtures have been measured. The pH of the mixtures were
adjusted using 3.5 M HCl and 1 M NaOH based on the desired pH. Once the pH was adjusted,
the pH, ZP, and size of the particles have been measured.
2.4.2 Synthesis and Characterization of PACMAG
PACMAG were synthesized following an adaptation of the method first described by Kahani
et al (2007). In a 50 mL beaker, 0.1500 g of FeNPs were added to 15 mL of deionized water
(DW) and sonicated for 15 minutes, 0.5000 g of PAC was added to the sonicated FeNPs, and
the mixture was stirred for 15 minutes. The particles of PACMAG were allowed to settle in the
presence of a magnet for 10 minutes and then decanted. The PACMAG was washed 4 times
with 10mL of DW, decanting the liquid in the presence of a magnet after each wash. The
particles were allowed to air dry for 2 days.
2.5 Characterization of Wastewater (WW)
The pH, conductivity, turbidity, DOC and TOC of the WW were measured using a pH meter,
conductimeter, turbidimeter, Total Organic Carbon Analyzer respectively. This was done for
each batch of the WW to ensure similarity between batches.
2.6 Calibration Curves
In order to determine the unknown concentration of the treated samples, calibration curves for
each drug (IBU, PAR, ASA, and AMOX) were created at known concentrations (5 mg/L, 10
mg/L, 20 mg/L, and 30 mg/L). The absorbance of the solutions was measured at the λmax (Table
2.1) of the corresponding drug. The correlation between the known concentration of the sample
and the measured absorbance was used to develop the calibration curve for each drug.
30
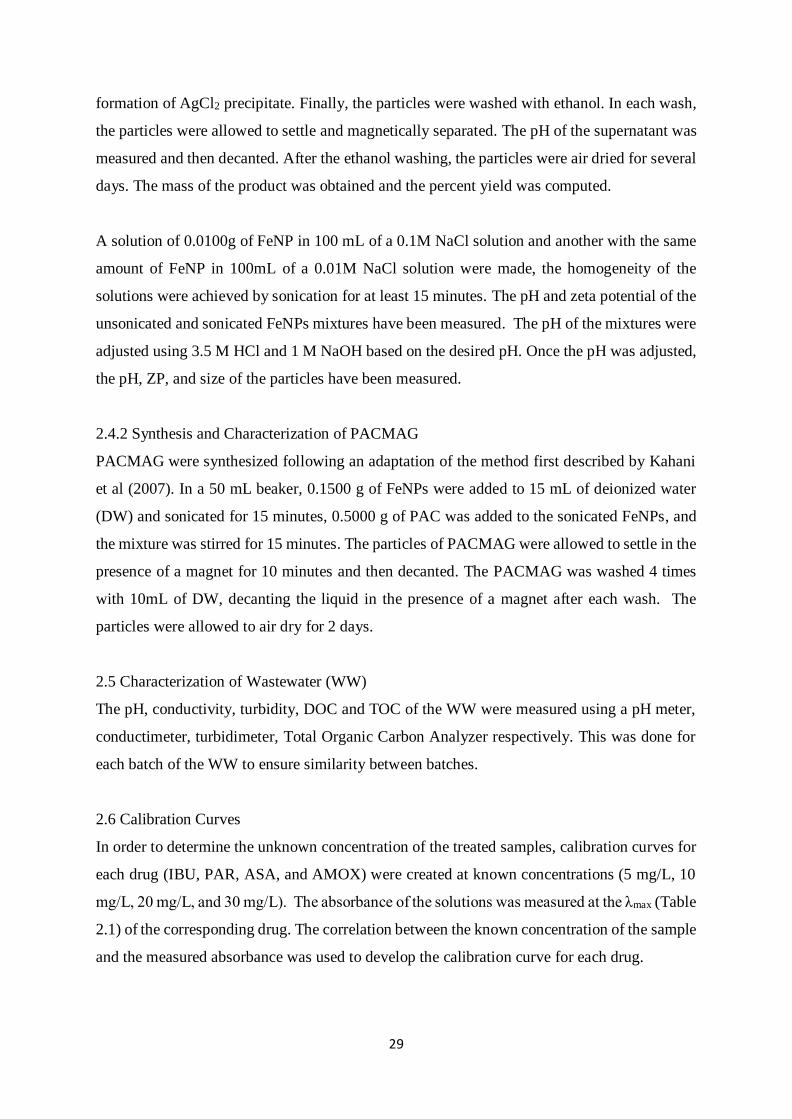
2.7 Adsorption Tests
2.7.1 Kinetics Measurements
Four types of experiments, described in Table 2.2, were performed. A specific amount of
adsorbent was mixed with 100 mL of contaminated water sample. This mixtures were placed
on a linear shaker at a speed of 150 mpm. Fifteen milliliters, 15 mL, of liquid sample was taken
at specific times (0 min, 15 min, 40 min, 80 min, 120 min, 160 min, 24 hours) in order to follow
the adsorption process. The obtained sample was allowed to settle for 5 minutes at the presence
of the magnet and the particles were magnetically separated.
Depending on the adsorbent being analyzed, an additional separation technique was done for
comparison purposes. After magnetic separation, 5 mL of supernatant was centrifuged for 15
minutes at 4000 rpm.
Both the pH and absorbance values of the samples were measured.
Table 2.2: Parameters for each case (Adsorbent type, Amount of adsorbent, Type of
contaminated sample, separation technique performed)
Adsorbent type Amount of
adsorbent
Type of contaminated
water sample
Separation technique
Unsonicated
FeNPs
0.1 g 30 mg/L (IBU, PAR, ASA)
drug –DW solution
Magnetic separation,
Magnet-centrifuge
Sonicated
FeNPs
10 mL of 1%
(m/m) FeNPs –
DW mixture
30 mg/L (IBU, PAR, ASA)
drug –DW solution
Magnetic separation,
Magnet-centrifuge
PACMAG 0.1 g 30 mg/L (IBU, PAR, ASA)
drug –DW solution
Magnetic separation,
Magnet-centrifuge
PACMAG 0.0390 mg 10 mg/L (IBU, AMOX)
drug –DW solution
Magnetic separation
PACMAG 0.0390 mg WW Magnetic separation
31
2.7.2 Isotherms of PACMAG
Table 2.3: Amount of PACMAG used in accordance to the expected PAC content present in
the particle
Amount of PACMAG
(mg PACMAG/30mL solution)
Corresponding PAC content
(mg PAC/L solution)
3.9 100
7.8 200
11.7 300
15.6 400
19.5 500
23.4 600
27.3 700
31.2 800
35.1 900
39.0 1000
In the isotherm for varying amounts of PACMAG, 30 mL of contaminated water samples
composed of either a 10 mg/L IBU solution, 10 mg/L AMOX solution, or WW, was mixed
with varying amounts of PACMAG (100 mg - 800 mg PAC content) (Table 2.3).
While for the second isotherm in which the drug concentration was varied, the optimum amount
of PACMAG (11.7 mg), that has been obtained from the first isotherm, was dissolved in 30
mL of the studied drugs, being at five different concentrations (5 mg/L, 15 mg/L, 20 mg/L, 25
mg/L and 30 mg/L).
In both experiments, samples were taken after 2 hours of adsorption, under constant shaking
(the linear shaker set to 150 mpm). The obtained sample was allowed to settle for 5 minutes at
the presence of the magnet and the particles were magnetically separated. The absorbance of
the liquid sample was measured at the λmax (Table 2.1) of the corresponding drug in order to
obtain their concentration.
32
2.7.3 Adsorption of PACMAG in WW Spiked with Drug
Based on the optimum amounts of PACMAG (11.7 mg) and drug concentration (15 mg/L) of
IBU or AMOX determined in 2.7.2, the adsorbent was mixed with 30 mL of WW spiked drug
(IBU or AMOX). Adsorption took place for 2 hours under constant shaking (the linear shaker
set to 150 mpm). The particles were settled for 5 minutes with the presence of a magnet and
separated. The absorbance of the liquid sample was measured at the λmax (Table 2.1) of the
corresponding drug in order to obtain their concentration.
2.8 Regeneration of PACMAG (Preliminary Test)
PACMAG were regenerated following an adaptation of the method first described by Do et al
(2011). Thirty milliliters, 30 mL, of 15 mg/L of a solution of AMOX in wastewater (WW) was
mixed with different amounts of PACMAG (300 mg- 1000 mg PAC content) (Table 2.3 in
2.7.2). Adsorption took place for 2 hours under constant shaking (the linear shaker set to 150
mpm). The particles were settled for 5 minutes with the presence of a magnet and separated.
The TOC and the absorbance of the liquid sample at 228 nm (Table 2.1) were measured.
The used PACMAG was air dried for 2 days and at 50 oC for 4 hours. Under the hood, the used
PACMAG was mixed with 100 mL of 0.083 M of H2O2. This mixture was shaken for 8 hours
on a linear shaker set to 250-275 mpm. The pH was maintained at 2.90-3.10 using a 6 M HCl
solution during the reaction. After the reaction, the particles were settled for 5 minutes in the
presence of a magnet and separated. In the presence of a magnet, the regenerated PACMAG
were washed with 20 ml of DW until pH of the supernatant was neutral. The regenerated
PACMAG was dried in the oven for 2 days at 50 oC. The dried regenerated PACMAG was
tested again for adsorption in the AMOX-WW mixture.
2.9 Sedimentation Test of PACMAG
Three, 3, samples containing 20 mL of a 10 mg/L IBU solution mixed with 7.8 mg of
PACMAG have been allowed to interact for 2 hours under uniform shaking (the linear shaker
set to 150 mpm). The first sample was allowed to settle with a magnet for 5 minutes. The
second sample was allowed to settle for 5 minutes without a magnet, the third sample was
allowed to settle for 30 minutes without a magnet. The amount of IBU was determined from
the absorbance at its λma.
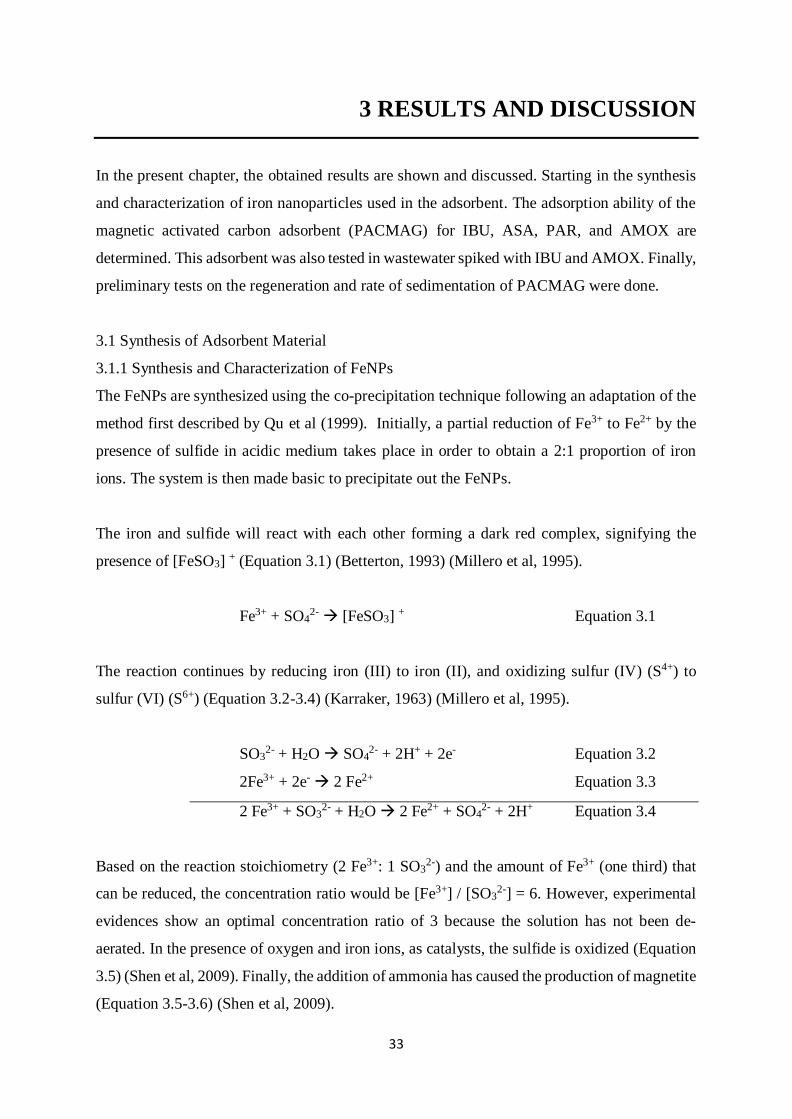
33
3 RESULTS AND DISCUSSION
In the present chapter, the obtained results are shown and discussed. Starting in the synthesis
and characterization of iron nanoparticles used in the adsorbent. The adsorption ability of the
magnetic activated carbon adsorbent (PACMAG) for IBU, ASA, PAR, and AMOX are
determined. This adsorbent was also tested in wastewater spiked with IBU and AMOX. Finally,
preliminary tests on the regeneration and rate of sedimentation of PACMAG were done.
3.1 Synthesis of Adsorbent Material
3.1.1 Synthesis and Characterization of FeNPs
The FeNPs are synthesized using the co-precipitation technique following an adaptation of the
method first described by Qu et al (1999). Initially, a partial reduction of Fe3+ to Fe2+ by the
presence of sulfide in acidic medium takes place in order to obtain a 2:1 proportion of iron
ions. The system is then made basic to precipitate out the FeNPs.
The iron and sulfide will react with each other forming a dark red complex, signifying the
presence of [FeSO3] + (Equation 3.1) (Betterton, 1993) (Millero et al, 1995).
Fe3+ + SO42- [FeSO3] + Equation 3.1
The reaction continues by reducing iron (III) to iron (II), and oxidizing sulfur (IV) (S4+) to
sulfur (VI) (S6+) (Equation 3.2-3.4) (Karraker, 1963) (Millero et al, 1995).
SO32- + H2O SO4
2- + 2H+ + 2e- Equation 3.2
2Fe3+ + 2e- 2 Fe2+ Equation 3.3
2 Fe3+ + SO32- + H2O 2 Fe2+ + SO4
2- + 2H+ Equation 3.4
Based on the reaction stoichiometry (2 Fe3+: 1 SO32-) and the amount of Fe3+ (one third) that
can be reduced, the concentration ratio would be [Fe3+] / [SO32-] = 6. However, experimental
evidences show an optimal concentration ratio of 3 because the solution has not been de-
aerated. In the presence of oxygen and iron ions, as catalysts, the sulfide is oxidized (Equation
3.5) (Shen et al, 2009). Finally, the addition of ammonia has caused the production of magnetite
(Equation 3.5-3.6) (Shen et al, 2009).
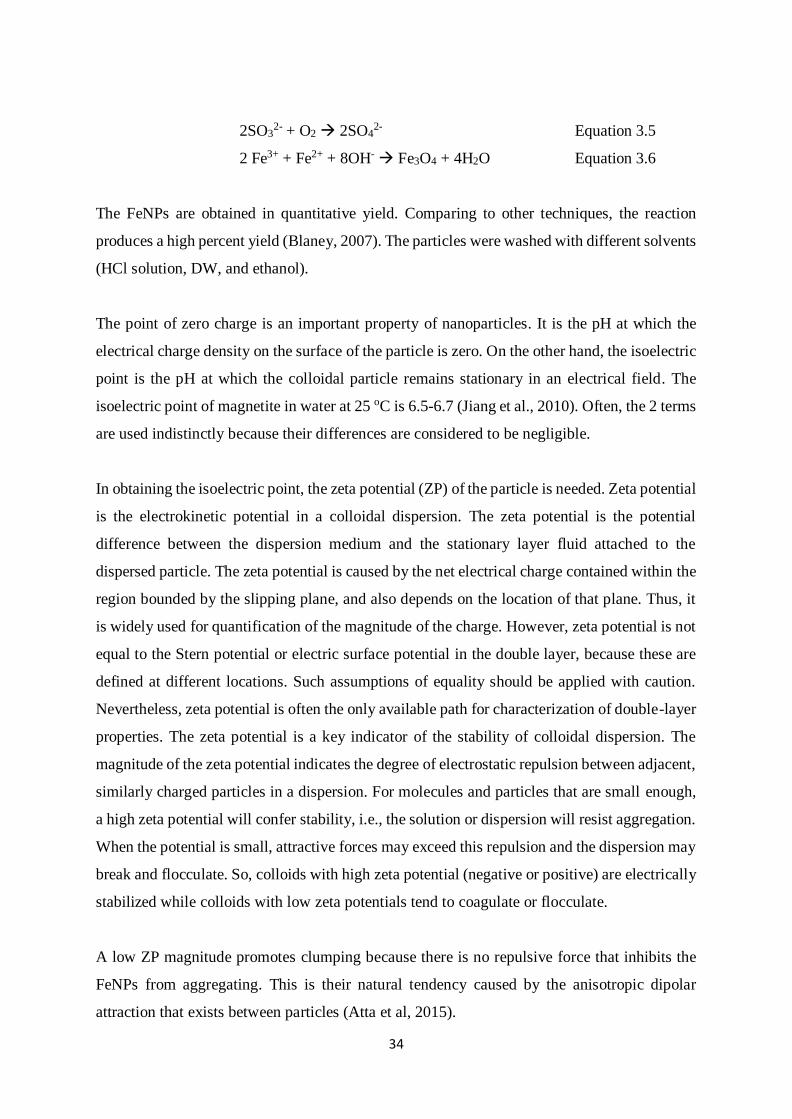
34
2SO32- + O2 2SO4
2- Equation 3.5
2 Fe3+ + Fe2+ + 8OH- Fe3O4 + 4H2O Equation 3.6
The FeNPs are obtained in quantitative yield. Comparing to other techniques, the reaction
produces a high percent yield (Blaney, 2007). The particles were washed with different solvents
(HCl solution, DW, and ethanol).
The point of zero charge is an important property of nanoparticles. It is the pH at which the
electrical charge density on the surface of the particle is zero. On the other hand, the isoelectric
point is the pH at which the colloidal particle remains stationary in an electrical field. The
isoelectric point of magnetite in water at 25 oC is 6.5-6.7 (Jiang et al., 2010). Often, the 2 terms
are used indistinctly because their differences are considered to be negligible.
In obtaining the isoelectric point, the zeta potential (ZP) of the particle is needed. Zeta potential
is the electrokinetic potential in a colloidal dispersion. The zeta potential is the potential
difference between the dispersion medium and the stationary layer fluid attached to the
dispersed particle. The zeta potential is caused by the net electrical charge contained within the
region bounded by the slipping plane, and also depends on the location of that plane. Thus, it
is widely used for quantification of the magnitude of the charge. However, zeta potential is not
equal to the Stern potential or electric surface potential in the double layer, because these are
defined at different locations. Such assumptions of equality should be applied with caution.
Nevertheless, zeta potential is often the only available path for characterization of double-layer
properties. The zeta potential is a key indicator of the stability of colloidal dispersion. The
magnitude of the zeta potential indicates the degree of electrostatic repulsion between adjacent,
similarly charged particles in a dispersion. For molecules and particles that are small enough,
a high zeta potential will confer stability, i.e., the solution or dispersion will resist aggregation.
When the potential is small, attractive forces may exceed this repulsion and the dispersion may
break and flocculate. So, colloids with high zeta potential (negative or positive) are electrically
stabilized while colloids with low zeta potentials tend to coagulate or flocculate.
A low ZP magnitude promotes clumping because there is no repulsive force that inhibits the
FeNPs from aggregating. This is their natural tendency caused by the anisotropic dipolar
attraction that exists between particles (Atta et al, 2015).
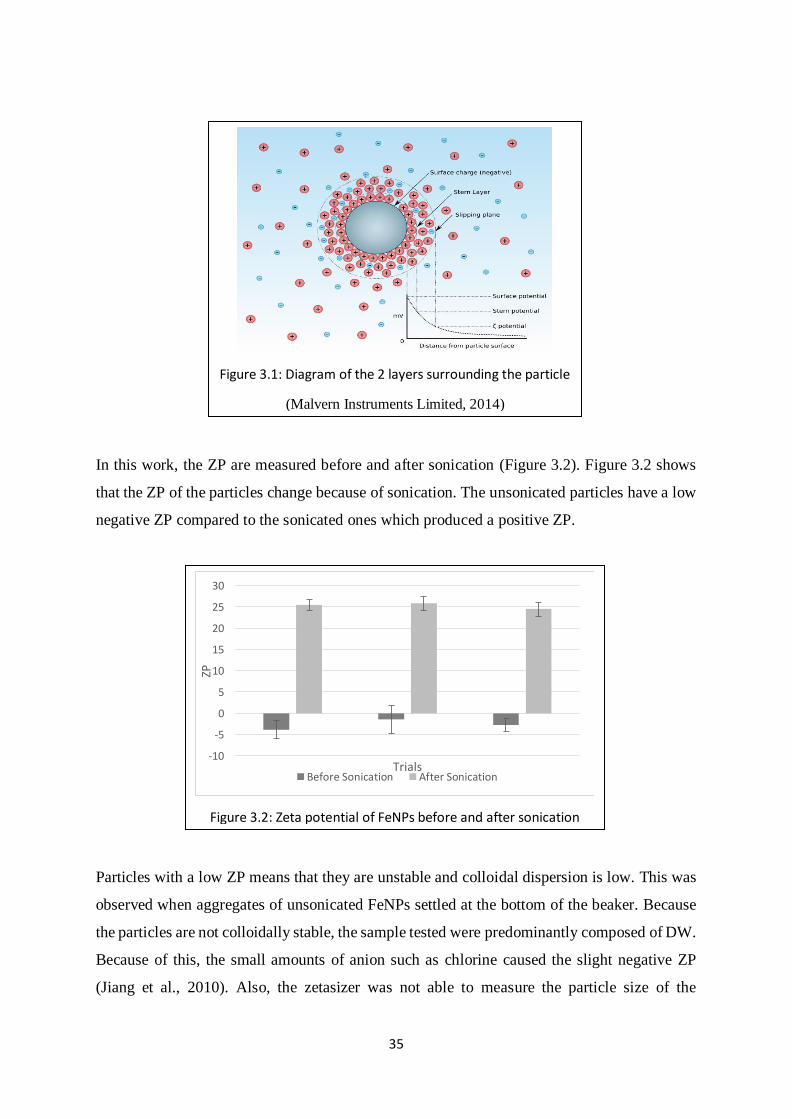
35
In this work, the ZP are measured before and after sonication (Figure 3.2). Figure 3.2 shows
that the ZP of the particles change because of sonication. The unsonicated particles have a low
negative ZP compared to the sonicated ones which produced a positive ZP.
Particles with a low ZP means that they are unstable and colloidal dispersion is low. This was
observed when aggregates of unsonicated FeNPs settled at the bottom of the beaker. Because
the particles are not colloidally stable, the sample tested were predominantly composed of DW.
Because of this, the small amounts of anion such as chlorine caused the slight negative ZP
(Jiang et al., 2010). Also, the zetasizer was not able to measure the particle size of the
Figure 3.1: Diagram of the 2 layers surrounding the particle
(Malvern Instruments Limited, 2014)
Figure 3.2: Zeta potential of FeNPs before and after sonication
-10
-5
0
5
10
15
20
25
30
ZP
TrialsBefore Sonication After Sonication
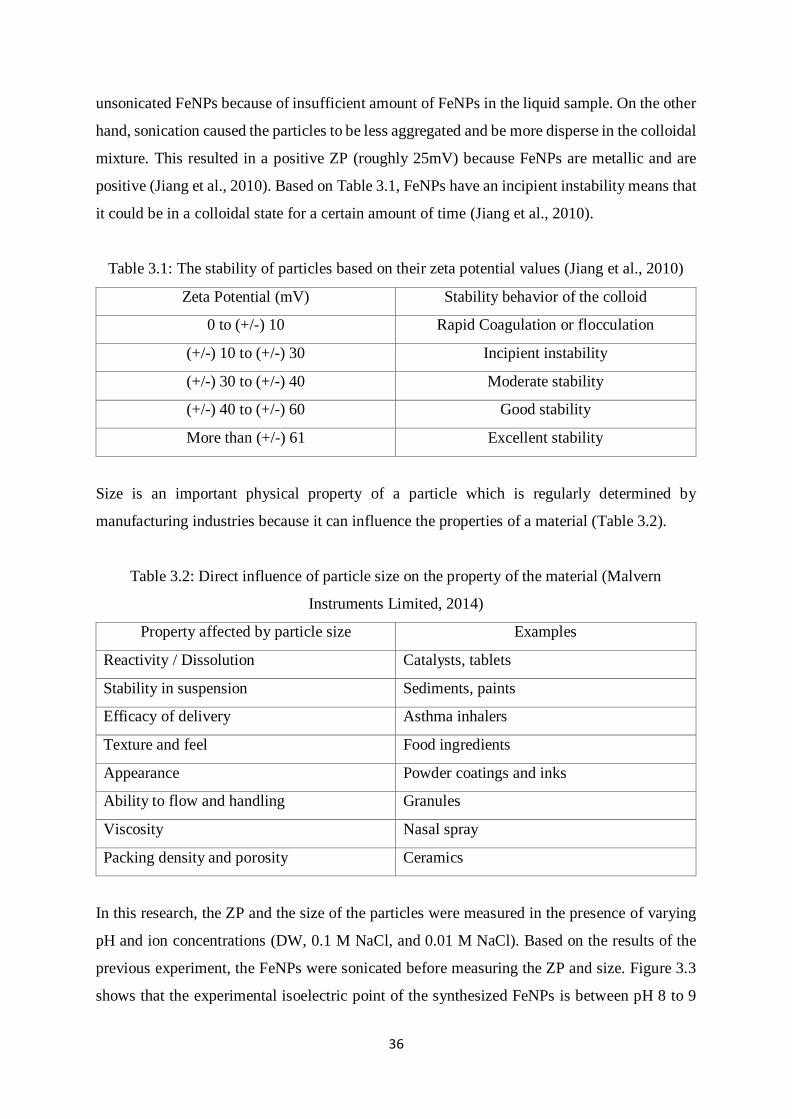
36
unsonicated FeNPs because of insufficient amount of FeNPs in the liquid sample. On the other
hand, sonication caused the particles to be less aggregated and be more disperse in the colloidal
mixture. This resulted in a positive ZP (roughly 25mV) because FeNPs are metallic and are
positive (Jiang et al., 2010). Based on Table 3.1, FeNPs have an incipient instability means that
it could be in a colloidal state for a certain amount of time (Jiang et al., 2010).
Table 3.1: The stability of particles based on their zeta potential values (Jiang et al., 2010)
Zeta Potential (mV) Stability behavior of the colloid
0 to (+/-) 10 Rapid Coagulation or flocculation
(+/-) 10 to (+/-) 30 Incipient instability
(+/-) 30 to (+/-) 40 Moderate stability
(+/-) 40 to (+/-) 60 Good stability
More than (+/-) 61 Excellent stability
Size is an important physical property of a particle which is regularly determined by
manufacturing industries because it can influence the properties of a material (Table 3.2).
Table 3.2: Direct influence of particle size on the property of the material (Malvern
Instruments Limited, 2014)
Property affected by particle size Examples
Reactivity / Dissolution Catalysts, tablets
Stability in suspension Sediments, paints
Efficacy of delivery Asthma inhalers
Texture and feel Food ingredients
Appearance Powder coatings and inks
Ability to flow and handling Granules
Viscosity Nasal spray
Packing density and porosity Ceramics
In this research, the ZP and the size of the particles were measured in the presence of varying
pH and ion concentrations (DW, 0.1 M NaCl, and 0.01 M NaCl). Based on the results of the
previous experiment, the FeNPs were sonicated before measuring the ZP and size. Figure 3.3
shows that the experimental isoelectric point of the synthesized FeNPs is between pH 8 to 9
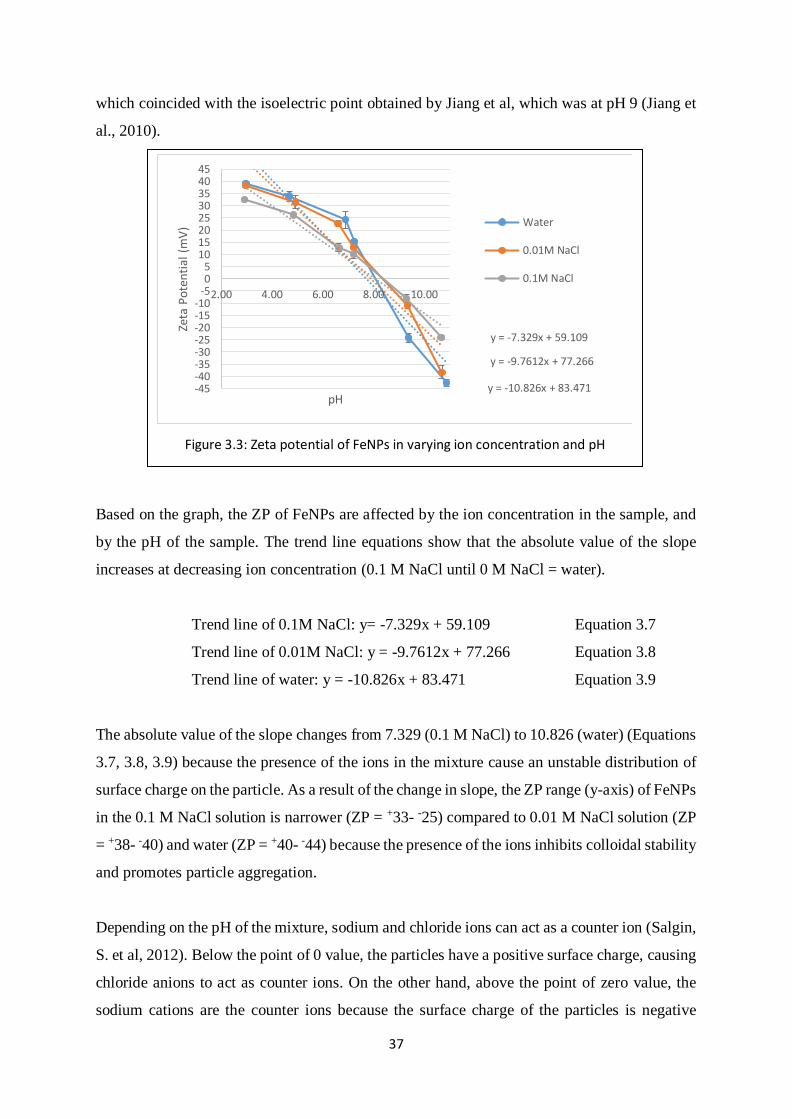
37
which coincided with the isoelectric point obtained by Jiang et al, which was at pH 9 (Jiang et
al., 2010).
Based on the graph, the ZP of FeNPs are affected by the ion concentration in the sample, and
by the pH of the sample. The trend line equations show that the absolute value of the slope
increases at decreasing ion concentration (0.1 M NaCl until 0 M NaCl = water).
Trend line of 0.1M NaCl: y= -7.329x + 59.109 Equation 3.7
Trend line of 0.01M NaCl: y = -9.7612x + 77.266 Equation 3.8
Trend line of water: y = -10.826x + 83.471 Equation 3.9
The absolute value of the slope changes from 7.329 (0.1 M NaCl) to 10.826 (water) (Equations
3.7, 3.8, 3.9) because the presence of the ions in the mixture cause an unstable distribution of
surface charge on the particle. As a result of the change in slope, the ZP range (y-axis) of FeNPs
in the 0.1 M NaCl solution is narrower (ZP = +33- -25) compared to 0.01 M NaCl solution (ZP
= +38- -40) and water (ZP = +40- -44) because the presence of the ions inhibits colloidal stability
and promotes particle aggregation.
Depending on the pH of the mixture, sodium and chloride ions can act as a counter ion (Salgin,
S. et al, 2012). Below the point of 0 value, the particles have a positive surface charge, causing
chloride anions to act as counter ions. On the other hand, above the point of zero value, the
sodium cations are the counter ions because the surface charge of the particles is negative
Figure 3.3: Zeta potential of FeNPs in varying ion concentration and pH
y = -10.826x + 83.471
y = -9.7612x + 77.266
y = -7.329x + 59.109
-45-40-35-30-25-20-15-10
-505
1015202530354045
2.00 4.00 6.00 8.00 10.00
Zeta
Po
ten
tial
(m
V)
pH
Water
0.01M NaCl
0.1M NaCl
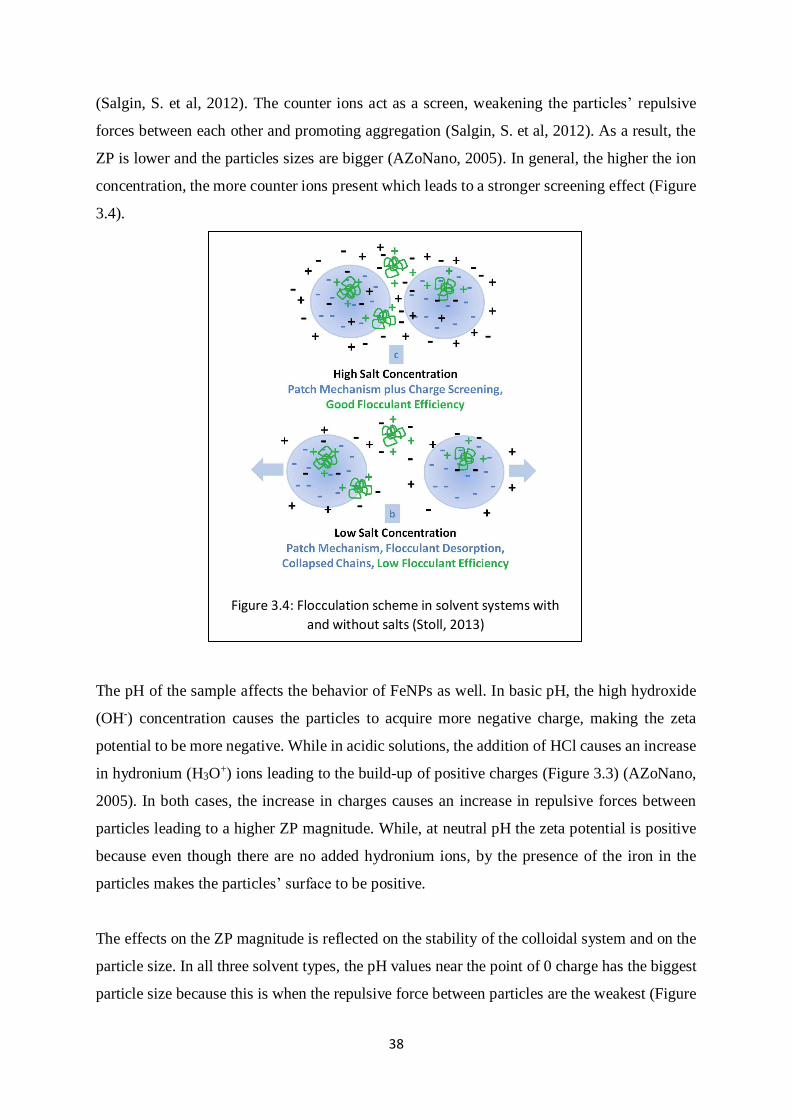
38
(Salgin, S. et al, 2012). The counter ions act as a screen, weakening the particles’ repulsive
forces between each other and promoting aggregation (Salgin, S. et al, 2012). As a result, the
ZP is lower and the particles sizes are bigger (AZoNano, 2005). In general, the higher the ion
concentration, the more counter ions present which leads to a stronger screening effect (Figure
3.4).
The pH of the sample affects the behavior of FeNPs as well. In basic pH, the high hydroxide
(OH-) concentration causes the particles to acquire more negative charge, making the zeta
potential to be more negative. While in acidic solutions, the addition of HCl causes an increase
in hydronium (H3O+) ions leading to the build-up of positive charges (Figure 3.3) (AZoNano,
2005). In both cases, the increase in charges causes an increase in repulsive forces between
particles leading to a higher ZP magnitude. While, at neutral pH the zeta potential is positive
because even though there are no added hydronium ions, by the presence of the iron in the
particles makes the particles’ surface to be positive.
The effects on the ZP magnitude is reflected on the stability of the colloidal system and on the
particle size. In all three solvent types, the pH values near the point of 0 charge has the biggest
particle size because this is when the repulsive force between particles are the weakest (Figure
Figure 3.4: Flocculation scheme in solvent systems with
and without salts (Stoll, 2013)
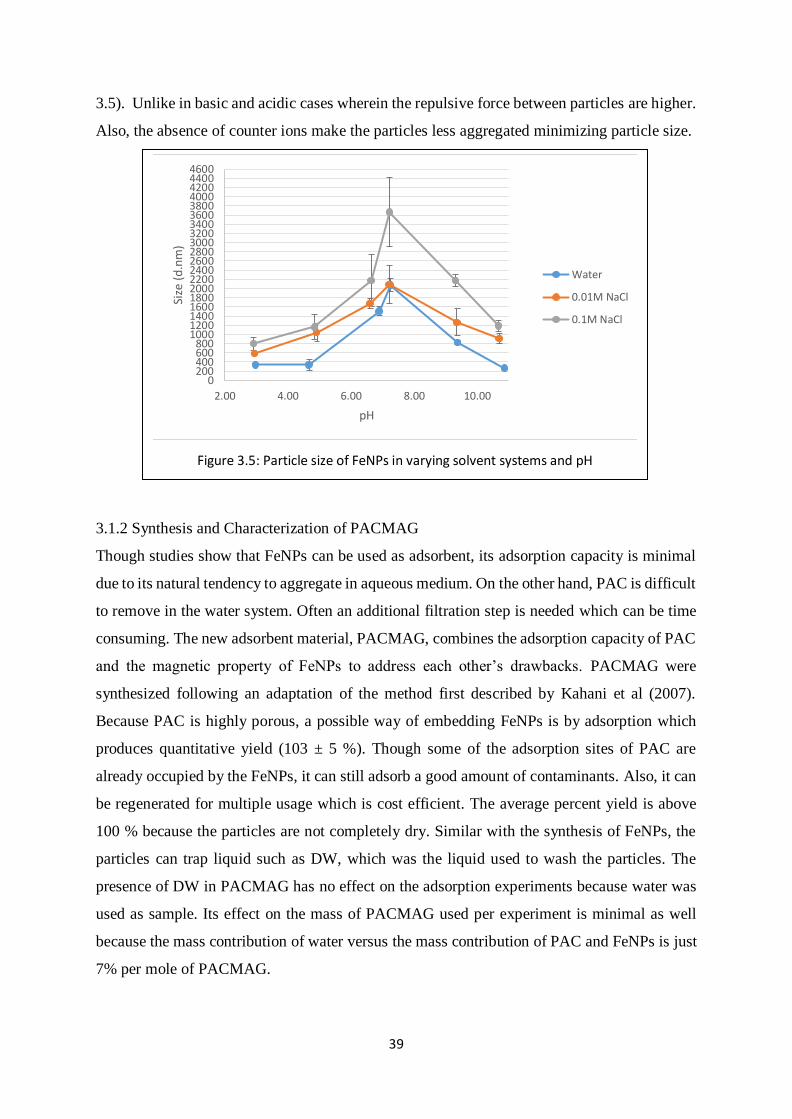
39
3.5). Unlike in basic and acidic cases wherein the repulsive force between particles are higher.
Also, the absence of counter ions make the particles less aggregated minimizing particle size.
3.1.2 Synthesis and Characterization of PACMAG
Though studies show that FeNPs can be used as adsorbent, its adsorption capacity is minimal
due to its natural tendency to aggregate in aqueous medium. On the other hand, PAC is difficult
to remove in the water system. Often an additional filtration step is needed which can be time
consuming. The new adsorbent material, PACMAG, combines the adsorption capacity of PAC
and the magnetic property of FeNPs to address each other’s drawbacks. PACMAG were
synthesized following an adaptation of the method first described by Kahani et al (2007).
Because PAC is highly porous, a possible way of embedding FeNPs is by adsorption which
produces quantitative yield (103 ± 5 %). Though some of the adsorption sites of PAC are
already occupied by the FeNPs, it can still adsorb a good amount of contaminants. Also, it can
be regenerated for multiple usage which is cost efficient. The average percent yield is above
100 % because the particles are not completely dry. Similar with the synthesis of FeNPs, the
particles can trap liquid such as DW, which was the liquid used to wash the particles. The
presence of DW in PACMAG has no effect on the adsorption experiments because water was
used as sample. Its effect on the mass of PACMAG used per experiment is minimal as well
because the mass contribution of water versus the mass contribution of PAC and FeNPs is just
7% per mole of PACMAG.
Figure 3.5: Particle size of FeNPs in varying solvent systems and pH
0200400600800
1000120014001600180020002200240026002800300032003400360038004000420044004600
2.00 4.00 6.00 8.00 10.00
Size
(d
.nm
)
pH
Water
0.01M NaCl
0.1M NaCl
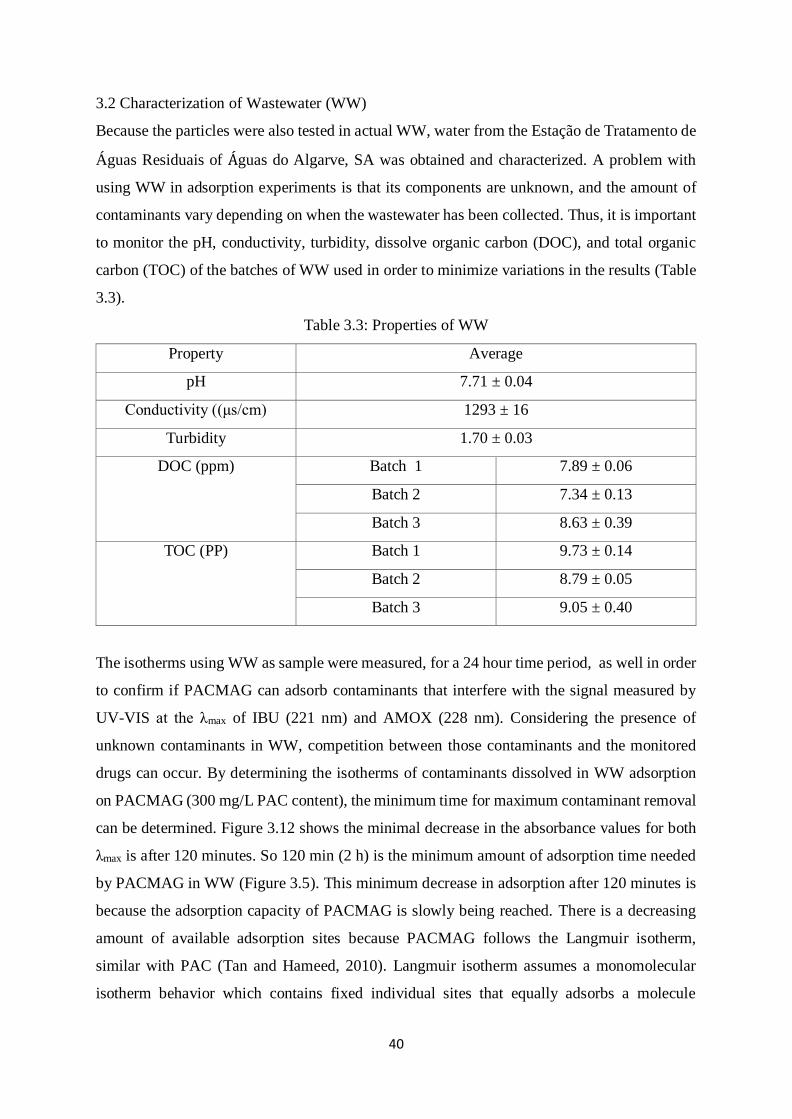
40
3.2 Characterization of Wastewater (WW)
Because the particles were also tested in actual WW, water from the Estação de Tratamento de
Águas Residuais of Águas do Algarve, SA was obtained and characterized. A problem with
using WW in adsorption experiments is that its components are unknown, and the amount of
contaminants vary depending on when the wastewater has been collected. Thus, it is important
to monitor the pH, conductivity, turbidity, dissolve organic carbon (DOC), and total organic
carbon (TOC) of the batches of WW used in order to minimize variations in the results (Table
3.3).
Table 3.3: Properties of WW
Property Average
pH 7.71 ± 0.04
Conductivity ((μs/cm) 1293 ± 16
Turbidity 1.70 ± 0.03
DOC (ppm) Batch 1 7.89 ± 0.06
Batch 2 7.34 ± 0.13
Batch 3 8.63 ± 0.39
TOC (PP) Batch 1 9.73 ± 0.14
Batch 2 8.79 ± 0.05
Batch 3 9.05 ± 0.40
The isotherms using WW as sample were measured, for a 24 hour time period, as well in order
to confirm if PACMAG can adsorb contaminants that interfere with the signal measured by
UV-VIS at the λmax of IBU (221 nm) and AMOX (228 nm). Considering the presence of
unknown contaminants in WW, competition between those contaminants and the monitored
drugs can occur. By determining the isotherms of contaminants dissolved in WW adsorption
on PACMAG (300 mg/L PAC content), the minimum time for maximum contaminant removal
can be determined. Figure 3.12 shows the minimal decrease in the absorbance values for both
λmax is after 120 minutes. So 120 min (2 h) is the minimum amount of adsorption time needed
by PACMAG in WW (Figure 3.5). This minimum decrease in adsorption after 120 minutes is
because the adsorption capacity of PACMAG is slowly being reached. There is a decreasing
amount of available adsorption sites because PACMAG follows the Langmuir isotherm,
similar with PAC (Tan and Hameed, 2010). Langmuir isotherm assumes a monomolecular
isotherm behavior which contains fixed individual sites that equally adsorbs a molecule
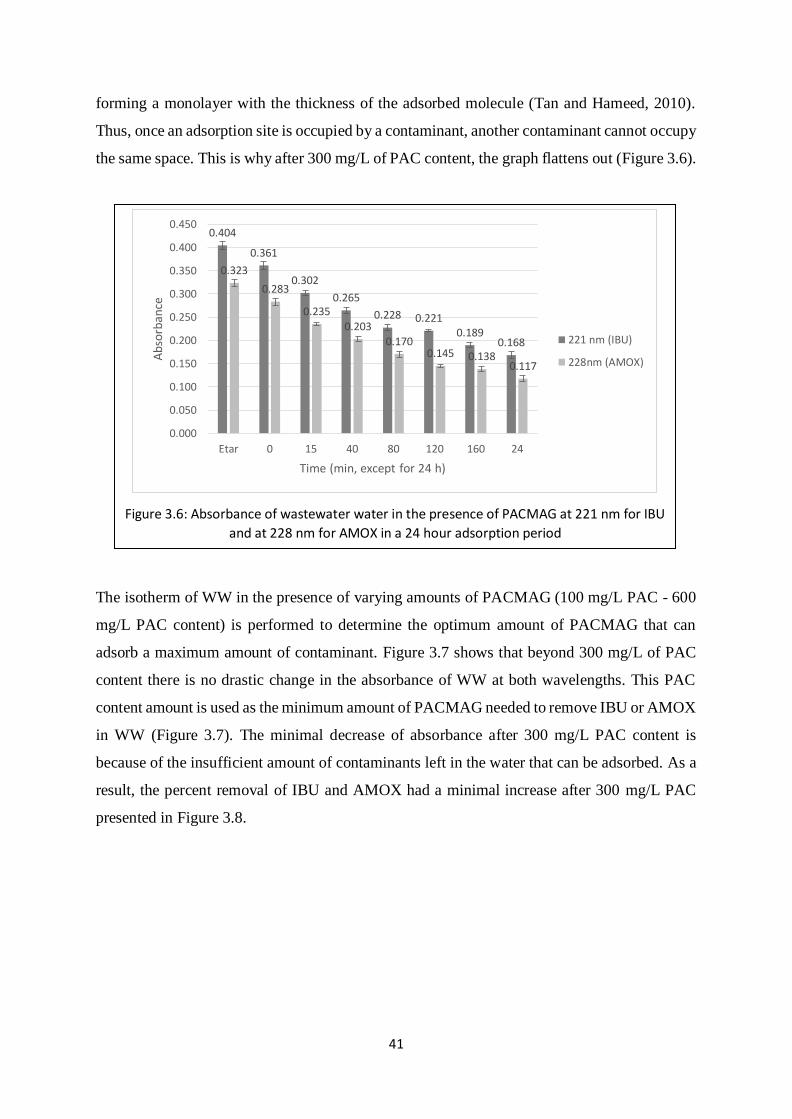
41
forming a monolayer with the thickness of the adsorbed molecule (Tan and Hameed, 2010).
Thus, once an adsorption site is occupied by a contaminant, another contaminant cannot occupy
the same space. This is why after 300 mg/L of PAC content, the graph flattens out (Figure 3.6).
The isotherm of WW in the presence of varying amounts of PACMAG (100 mg/L PAC - 600
mg/L PAC content) is performed to determine the optimum amount of PACMAG that can
adsorb a maximum amount of contaminant. Figure 3.7 shows that beyond 300 mg/L of PAC
content there is no drastic change in the absorbance of WW at both wavelengths. This PAC
content amount is used as the minimum amount of PACMAG needed to remove IBU or AMOX
in WW (Figure 3.7). The minimal decrease of absorbance after 300 mg/L PAC content is
because of the insufficient amount of contaminants left in the water that can be adsorbed. As a
result, the percent removal of IBU and AMOX had a minimal increase after 300 mg/L PAC
presented in Figure 3.8.
Figure 3.6: Absorbance of wastewater water in the presence of PACMAG at 221 nm for IBU
and at 228 nm for AMOX in a 24 hour adsorption period
0.404
0.361
0.302
0.265
0.228 0.2210.189
0.168
0.323
0.283
0.235
0.203
0.1700.145 0.138
0.117
0.000
0.050
0.100
0.150
0.200
0.250
0.300
0.350
0.400
0.450
Etar 0 15 40 80 120 160 24
Ab
sorb
ance
Time (min, except for 24 h)
221 nm (IBU)
228nm (AMOX)
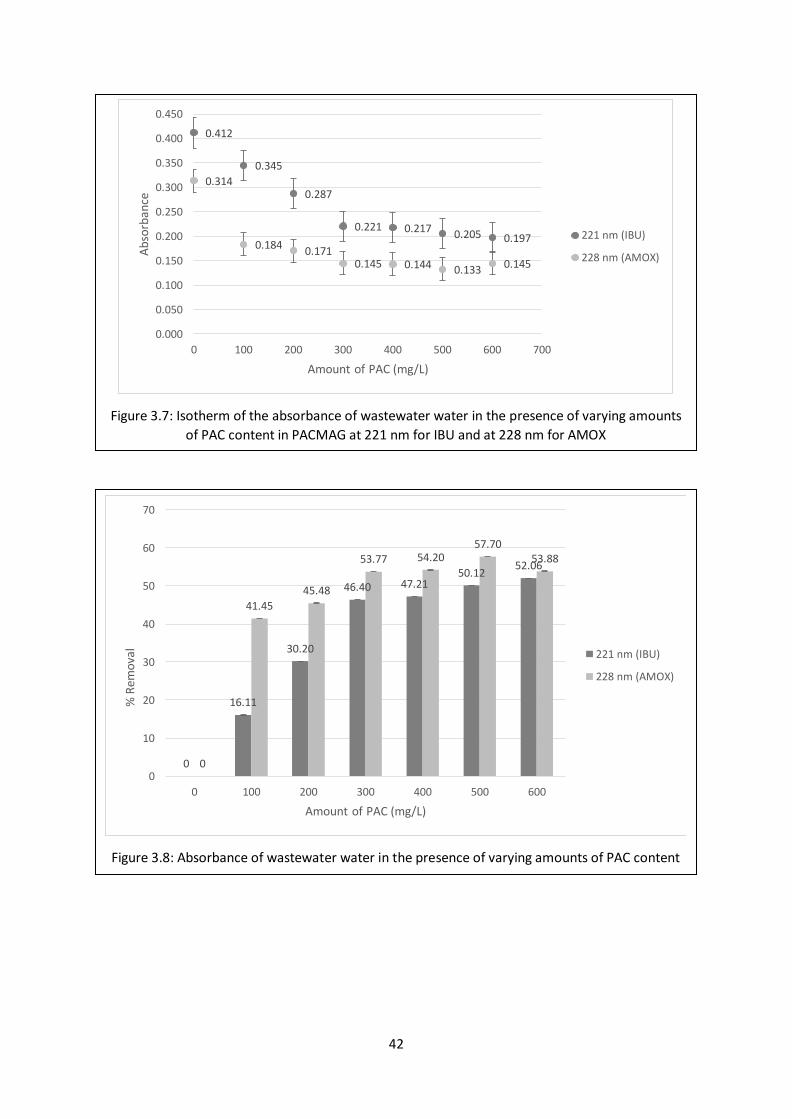
42
Figure 3.7: Isotherm of the absorbance of wastewater water in the presence of varying amounts
of PAC content in PACMAG at 221 nm for IBU and at 228 nm for AMOX
0.412
0.345
0.287
0.221 0.217 0.205 0.197
0.314
0.1840.171
0.145 0.144 0.133 0.145
0.000
0.050
0.100
0.150
0.200
0.250
0.300
0.350
0.400
0.450
0 100 200 300 400 500 600 700
Ab
sorb
ance
Amount of PAC (mg/L)
221 nm (IBU)
228 nm (AMOX)
Figure 3.8: Absorbance of wastewater water in the presence of varying amounts of PAC content
in PACMAG at 221 nm for IBU and at 228 nm for AMOX (ERROR)
0
16.11
30.20
46.40 47.2150.12
52.06
0
41.45
45.48
53.77 54.2057.70
53.88
0
10
20
30
40
50
60
70
0 100 200 300 400 500 600
% R
emo
val
Amount of PAC (mg/L)
221 nm (IBU)
228 nm (AMOX)
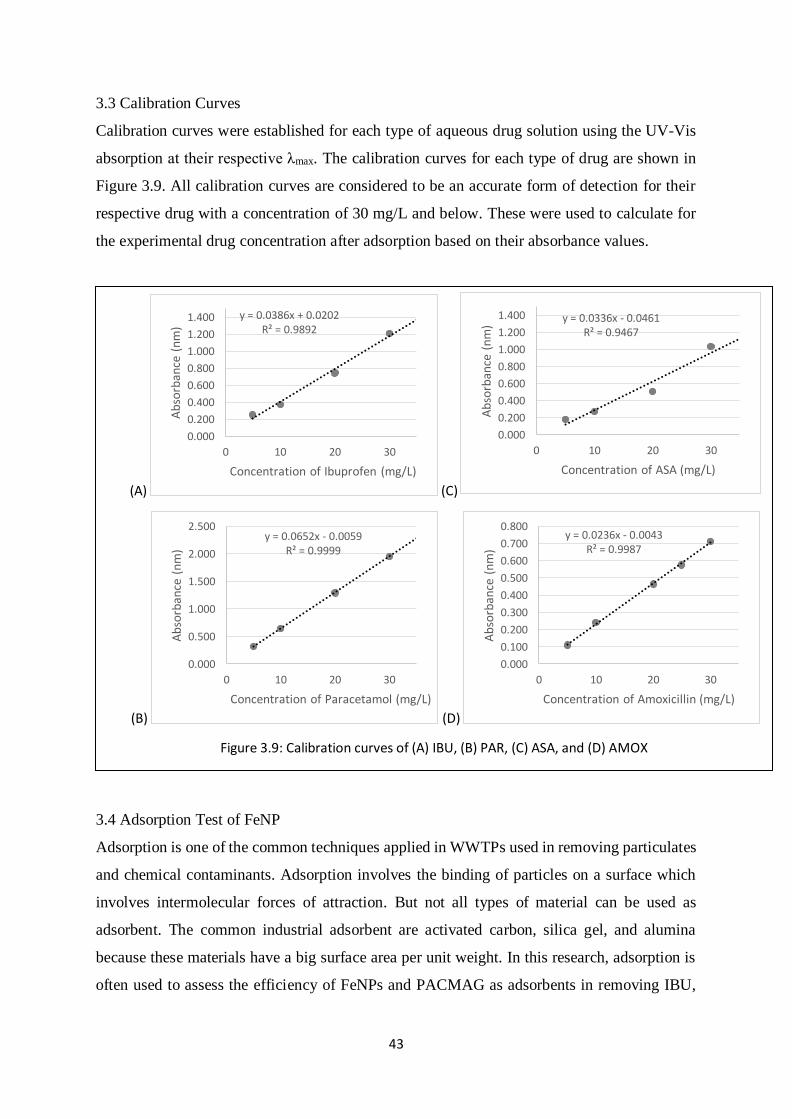
43
3.3 Calibration Curves
Calibration curves were established for each type of aqueous drug solution using the UV-Vis
absorption at their respective λmax. The calibration curves for each type of drug are shown in
Figure 3.9. All calibration curves are considered to be an accurate form of detection for their
respective drug with a concentration of 30 mg/L and below. These were used to calculate for
the experimental drug concentration after adsorption based on their absorbance values.
3.4 Adsorption Test of FeNP
Adsorption is one of the common techniques applied in WWTPs used in removing particulates
and chemical contaminants. Adsorption involves the binding of particles on a surface which
involves intermolecular forces of attraction. But not all types of material can be used as
adsorbent. The common industrial adsorbent are activated carbon, silica gel, and alumina
because these materials have a big surface area per unit weight. In this research, adsorption is
often used to assess the efficiency of FeNPs and PACMAG as adsorbents in removing IBU,
(A) (C)
(B) (D)
Figure 3.9: Calibration curves of (A) IBU, (B) PAR, (C) ASA, and (D) AMOX
y = 0.0386x + 0.0202R² = 0.9892
0.000
0.200
0.400
0.600
0.800
1.000
1.200
1.400
0 10 20 30
Ab
sorb
ance
(n
m)
Concentration of Ibuprofen (mg/L)
y = 0.0336x - 0.0461R² = 0.9467
0.000
0.200
0.400
0.600
0.800
1.000
1.200
1.400
0 10 20 30
Ab
sorb
ance
(n
m)
Concentration of ASA (mg/L)
y = 0.0652x - 0.0059R² = 0.9999
0.000
0.500
1.000
1.500
2.000
2.500
0 10 20 30
Ab
sorb
ance
(n
m)
Concentration of Paracetamol (mg/L)
y = 0.0236x - 0.0043R² = 0.9987
0.000
0.100
0.200
0.300
0.400
0.500
0.600
0.700
0.800
0 10 20 30
Ab
sorb
ance
(n
m)
Concentration of Amoxicillin (mg/L)
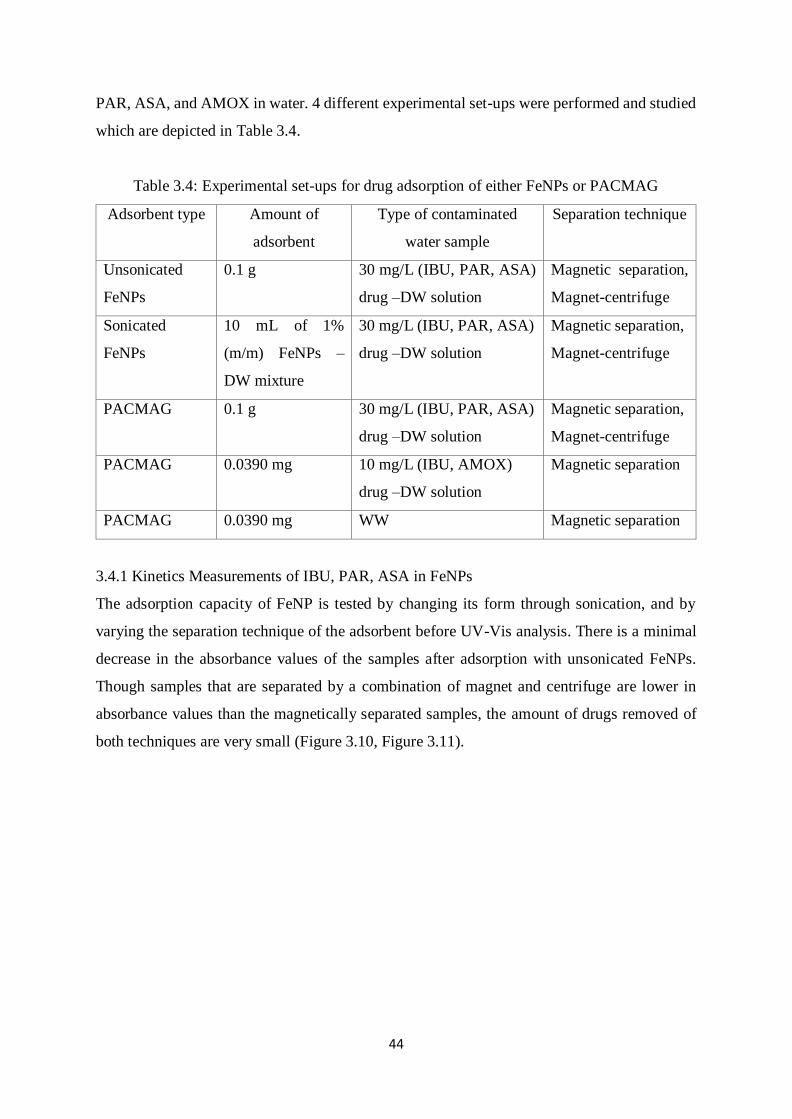
44
PAR, ASA, and AMOX in water. 4 different experimental set-ups were performed and studied
which are depicted in Table 3.4.
Table 3.4: Experimental set-ups for drug adsorption of either FeNPs or PACMAG
Adsorbent type Amount of
adsorbent
Type of contaminated
water sample
Separation technique
Unsonicated
FeNPs
0.1 g 30 mg/L (IBU, PAR, ASA)
drug –DW solution
Magnetic separation,
Magnet-centrifuge
Sonicated
FeNPs
10 mL of 1%
(m/m) FeNPs –
DW mixture
30 mg/L (IBU, PAR, ASA)
drug –DW solution
Magnetic separation,
Magnet-centrifuge
PACMAG 0.1 g 30 mg/L (IBU, PAR, ASA)
drug –DW solution
Magnetic separation,
Magnet-centrifuge
PACMAG 0.0390 mg 10 mg/L (IBU, AMOX)
drug –DW solution
Magnetic separation
PACMAG 0.0390 mg WW Magnetic separation
3.4.1 Kinetics Measurements of IBU, PAR, ASA in FeNPs
The adsorption capacity of FeNP is tested by changing its form through sonication, and by
varying the separation technique of the adsorbent before UV-Vis analysis. There is a minimal
decrease in the absorbance values of the samples after adsorption with unsonicated FeNPs.
Though samples that are separated by a combination of magnet and centrifuge are lower in
absorbance values than the magnetically separated samples, the amount of drugs removed of
both techniques are very small (Figure 3.10, Figure 3.11).
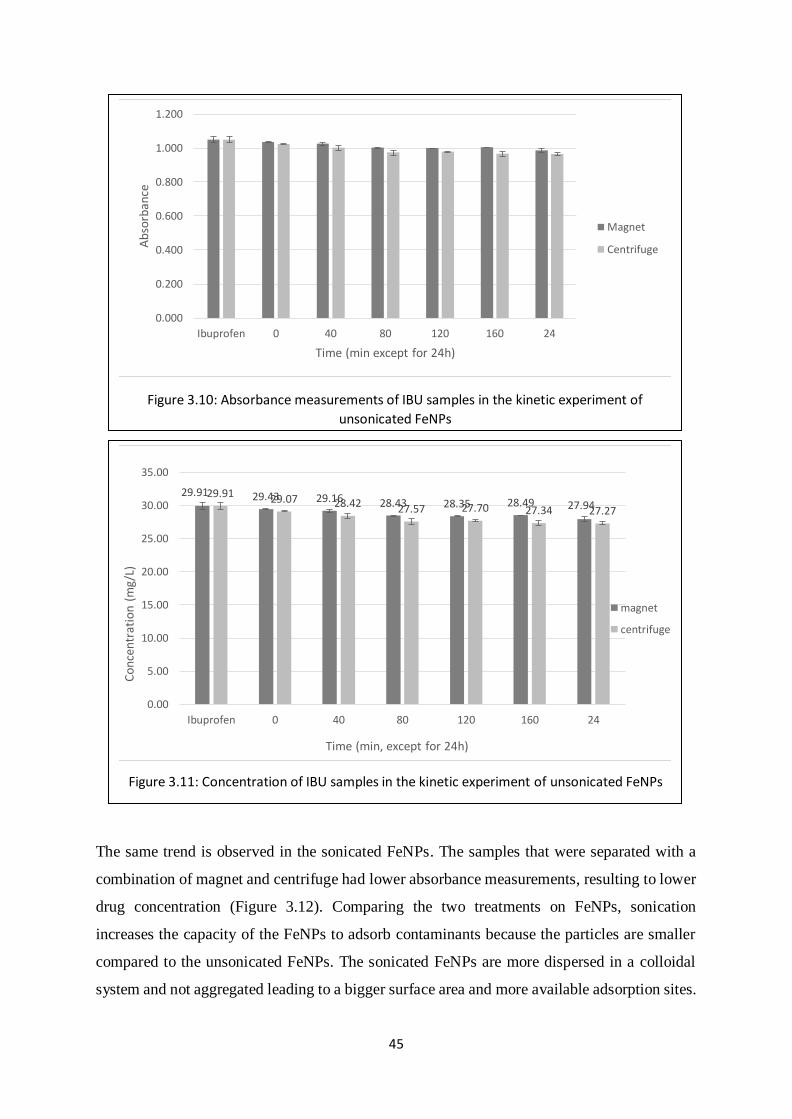
45
The same trend is observed in the sonicated FeNPs. The samples that were separated with a
combination of magnet and centrifuge had lower absorbance measurements, resulting to lower
drug concentration (Figure 3.12). Comparing the two treatments on FeNPs, sonication
increases the capacity of the FeNPs to adsorb contaminants because the particles are smaller
compared to the unsonicated FeNPs. The sonicated FeNPs are more dispersed in a colloidal
system and not aggregated leading to a bigger surface area and more available adsorption sites.
Figure 3.10: Absorbance measurements of IBU samples in the kinetic experiment of
unsonicated FeNPs
0.000
0.200
0.400
0.600
0.800
1.000
1.200
Ibuprofen 0 40 80 120 160 24
Ab
sorb
ance
Time (min except for 24h)
Magnet
Centrifuge
Figure 3.11: Concentration of IBU samples in the kinetic experiment of unsonicated FeNPs
29.91 29.43 29.16 28.43 28.35 28.49 27.9429.91 29.07 28.42 27.57 27.70 27.34 27.27
0.00
5.00
10.00
15.00
20.00
25.00
30.00
35.00
Ibuprofen 0 40 80 120 160 24
Co
nce
ntr
atio
n (
mg/
L)
Time (min, except for 24h)
magnet
centrifuge
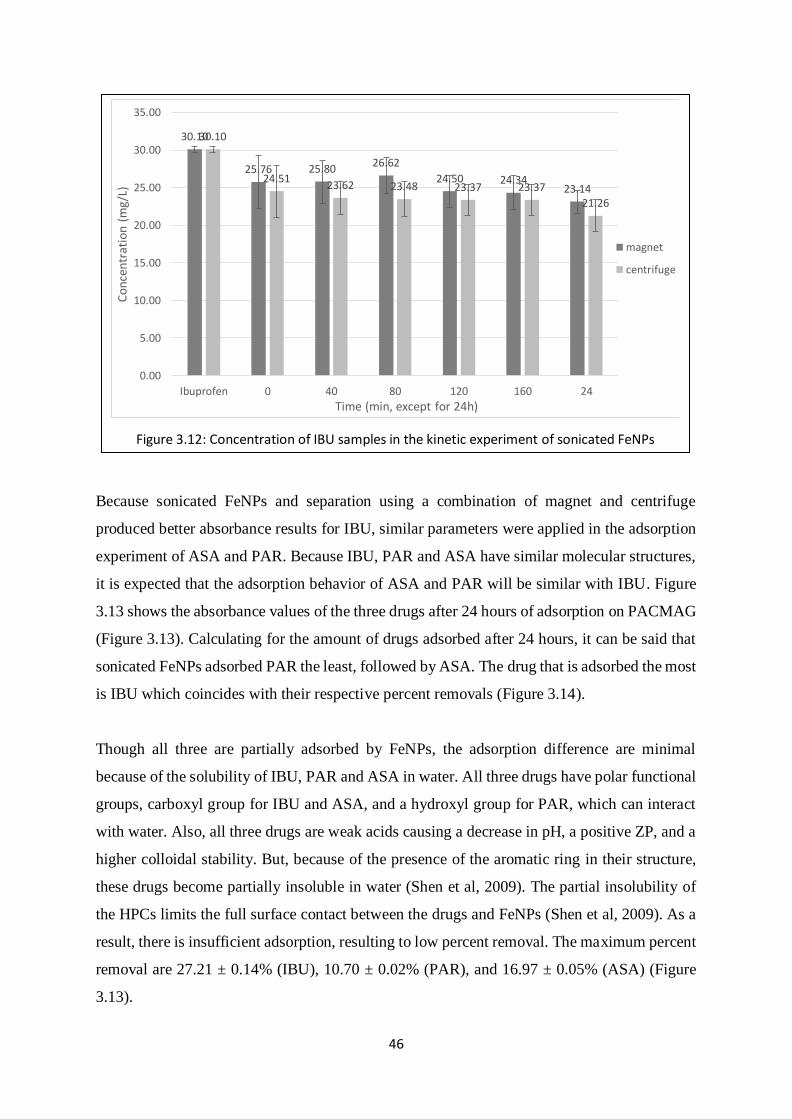
46
Because sonicated FeNPs and separation using a combination of magnet and centrifuge
produced better absorbance results for IBU, similar parameters were applied in the adsorption
experiment of ASA and PAR. Because IBU, PAR and ASA have similar molecular structures,
it is expected that the adsorption behavior of ASA and PAR will be similar with IBU. Figure
3.13 shows the absorbance values of the three drugs after 24 hours of adsorption on PACMAG
(Figure 3.13). Calculating for the amount of drugs adsorbed after 24 hours, it can be said that
sonicated FeNPs adsorbed PAR the least, followed by ASA. The drug that is adsorbed the most
is IBU which coincides with their respective percent removals (Figure 3.14).
Though all three are partially adsorbed by FeNPs, the adsorption difference are minimal
because of the solubility of IBU, PAR and ASA in water. All three drugs have polar functional
groups, carboxyl group for IBU and ASA, and a hydroxyl group for PAR, which can interact
with water. Also, all three drugs are weak acids causing a decrease in pH, a positive ZP, and a
higher colloidal stability. But, because of the presence of the aromatic ring in their structure,
these drugs become partially insoluble in water (Shen et al, 2009). The partial insolubility of
the HPCs limits the full surface contact between the drugs and FeNPs (Shen et al, 2009). As a
result, there is insufficient adsorption, resulting to low percent removal. The maximum percent
removal are 27.21 ± 0.14% (IBU), 10.70 ± 0.02% (PAR), and 16.97 ± 0.05% (ASA) (Figure
3.13).
Figure 3.12: Concentration of IBU samples in the kinetic experiment of sonicated FeNPs
30.10
25.76 25.8026.62
24.50 24.3423.14
30.10
24.5123.62 23.48 23.37 23.37
21.26
0.00
5.00
10.00
15.00
20.00
25.00
30.00
35.00
Ibuprofen 0 40 80 120 160 24
Co
nce
ntr
atio
n (
mg/
L)
Time (min, except for 24h)
magnet
centrifuge
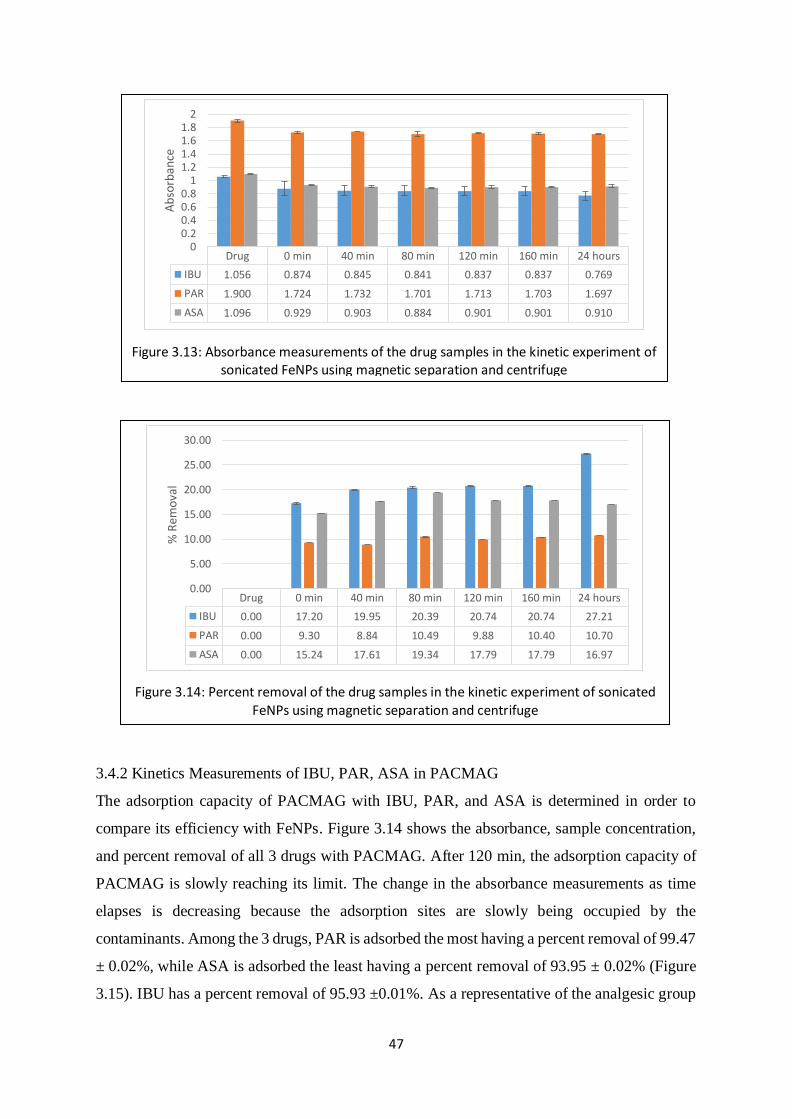
47
3.4.2 Kinetics Measurements of IBU, PAR, ASA in PACMAG
The adsorption capacity of PACMAG with IBU, PAR, and ASA is determined in order to
compare its efficiency with FeNPs. Figure 3.14 shows the absorbance, sample concentration,
and percent removal of all 3 drugs with PACMAG. After 120 min, the adsorption capacity of
PACMAG is slowly reaching its limit. The change in the absorbance measurements as time
elapses is decreasing because the adsorption sites are slowly being occupied by the
contaminants. Among the 3 drugs, PAR is adsorbed the most having a percent removal of 99.47
± 0.02%, while ASA is adsorbed the least having a percent removal of 93.95 ± 0.02% (Figure
3.15). IBU has a percent removal of 95.93 ±0.01%. As a representative of the analgesic group
Figure 3.13: Absorbance measurements of the drug samples in the kinetic experiment of sonicated FeNPs using magnetic separation and centrifuge
Drug 0 min 40 min 80 min 120 min 160 min 24 hours
IBU 1.056 0.874 0.845 0.841 0.837 0.837 0.769
PAR 1.900 1.724 1.732 1.701 1.713 1.703 1.697
ASA 1.096 0.929 0.903 0.884 0.901 0.901 0.910
00.20.40.60.8
11.21.41.61.8
2
Ab
sorb
ance
Figure 3.14: Percent removal of the drug samples in the kinetic experiment of sonicated FeNPs using magnetic separation and centrifuge
Drug 0 min 40 min 80 min 120 min 160 min 24 hours
IBU 0.00 17.20 19.95 20.39 20.74 20.74 27.21
PAR 0.00 9.30 8.84 10.49 9.88 10.40 10.70
ASA 0.00 15.24 17.61 19.34 17.79 17.79 16.97
0.00
5.00
10.00
15.00
20.00
25.00
30.00
% R
emo
val
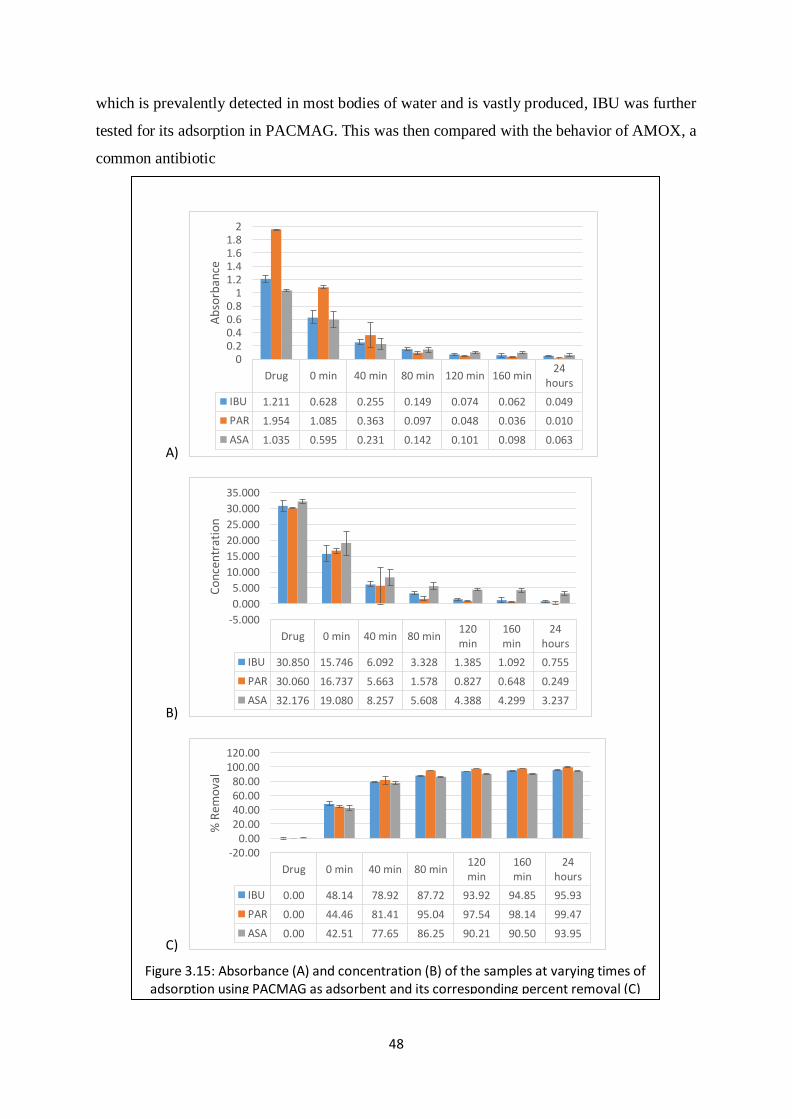
48
which is prevalently detected in most bodies of water and is vastly produced, IBU was further
tested for its adsorption in PACMAG. This was then compared with the behavior of AMOX, a
common antibiotic
A)
B)
C)
Figure 3.15: Absorbance (A) and concentration (B) of the samples at varying times of adsorption using PACMAG as adsorbent and its corresponding percent removal (C)
Drug 0 min 40 min 80 min 120 min 160 min24
hours
IBU 1.211 0.628 0.255 0.149 0.074 0.062 0.049
PAR 1.954 1.085 0.363 0.097 0.048 0.036 0.010
ASA 1.035 0.595 0.231 0.142 0.101 0.098 0.063
00.20.40.60.8
11.21.41.61.8
2A
bso
rban
ce
Drug 0 min 40 min 80 min120min
160min
24hours
IBU 30.850 15.746 6.092 3.328 1.385 1.092 0.755
PAR 30.060 16.737 5.663 1.578 0.827 0.648 0.249
ASA 32.176 19.080 8.257 5.608 4.388 4.299 3.237
-5.000
0.000
5.000
10.000
15.000
20.000
25.000
30.000
35.000
Co
nce
ntr
atio
n
Drug 0 min 40 min 80 min120min
160min
24hours
IBU 0.00 48.14 78.92 87.72 93.92 94.85 95.93
PAR 0.00 44.46 81.41 95.04 97.54 98.14 99.47
ASA 0.00 42.51 77.65 86.25 90.21 90.50 93.95
-20.000.00
20.0040.0060.0080.00
100.00120.00
% R
emo
val
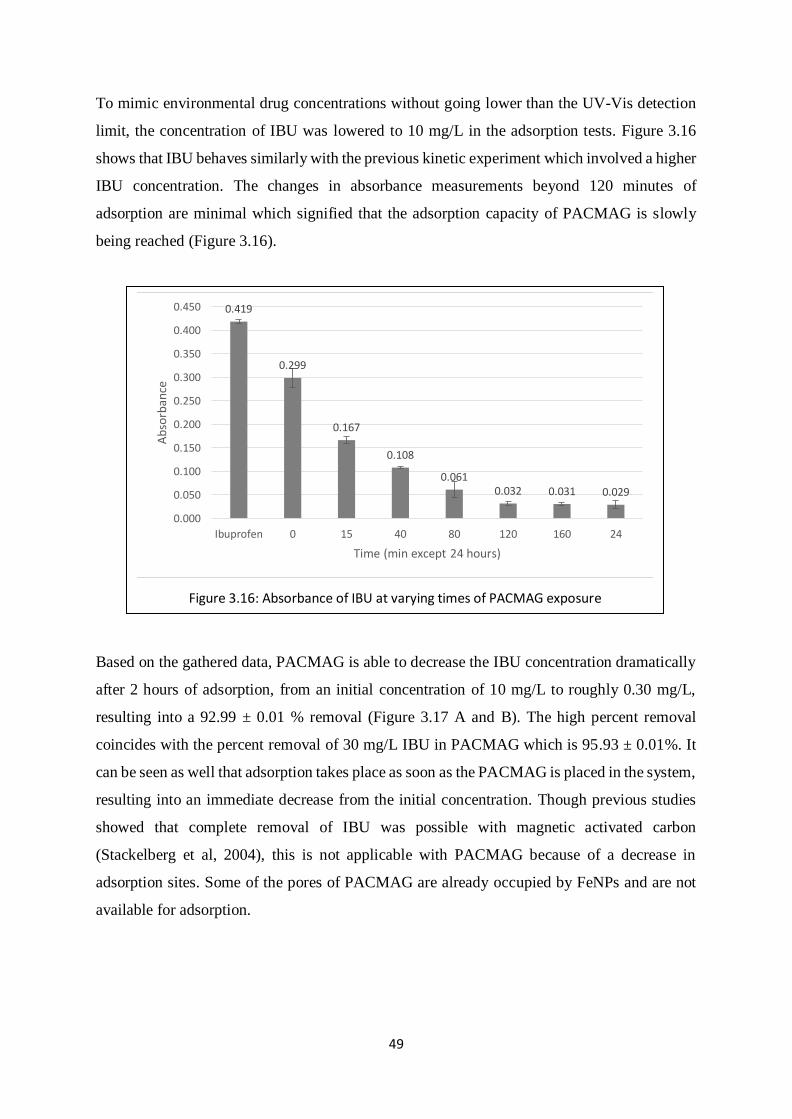
49
To mimic environmental drug concentrations without going lower than the UV-Vis detection
limit, the concentration of IBU was lowered to 10 mg/L in the adsorption tests. Figure 3.16
shows that IBU behaves similarly with the previous kinetic experiment which involved a higher
IBU concentration. The changes in absorbance measurements beyond 120 minutes of
adsorption are minimal which signified that the adsorption capacity of PACMAG is slowly
being reached (Figure 3.16).
Based on the gathered data, PACMAG is able to decrease the IBU concentration dramatically
after 2 hours of adsorption, from an initial concentration of 10 mg/L to roughly 0.30 mg/L,
resulting into a 92.99 ± 0.01 % removal (Figure 3.17 A and B). The high percent removal
coincides with the percent removal of 30 mg/L IBU in PACMAG which is 95.93 ± 0.01%. It
can be seen as well that adsorption takes place as soon as the PACMAG is placed in the system,
resulting into an immediate decrease from the initial concentration. Though previous studies
showed that complete removal of IBU was possible with magnetic activated carbon
(Stackelberg et al, 2004), this is not applicable with PACMAG because of a decrease in
adsorption sites. Some of the pores of PACMAG are already occupied by FeNPs and are not
available for adsorption.
Figure 3.16: Absorbance of IBU at varying times of PACMAG exposure
0.419
0.299
0.167
0.108
0.0610.032 0.031 0.029
0.000
0.050
0.100
0.150
0.200
0.250
0.300
0.350
0.400
0.450
Ibuprofen 0 15 40 80 120 160 24
Ab
sorb
ance
Time (min except 24 hours)
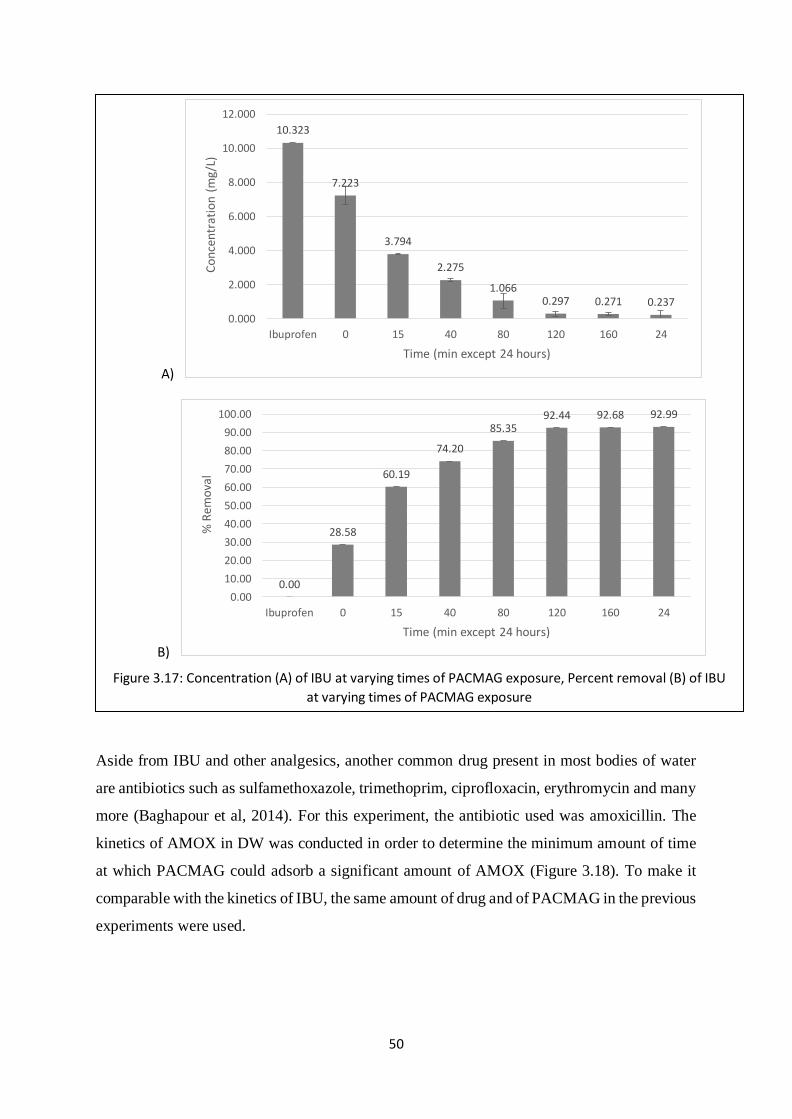
50
Aside from IBU and other analgesics, another common drug present in most bodies of water
are antibiotics such as sulfamethoxazole, trimethoprim, ciprofloxacin, erythromycin and many
more (Baghapour et al, 2014). For this experiment, the antibiotic used was amoxicillin. The
kinetics of AMOX in DW was conducted in order to determine the minimum amount of time
at which PACMAG could adsorb a significant amount of AMOX (Figure 3.18). To make it
comparable with the kinetics of IBU, the same amount of drug and of PACMAG in the previous
experiments were used.
A)
B)
Figure 3.17: Concentration (A) of IBU at varying times of PACMAG exposure, Percent removal (B) of IBU
at varying times of PACMAG exposure
10.323
7.223
3.794
2.275
1.0660.297 0.271 0.237
0.000
2.000
4.000
6.000
8.000
10.000
12.000
Ibuprofen 0 15 40 80 120 160 24
Co
nce
ntr
atio
n (
mg/
L)
Time (min except 24 hours)
0.00
28.58
60.19
74.20
85.3592.44 92.68 92.99
0.00
10.00
20.00
30.00
40.00
50.00
60.00
70.00
80.00
90.00
100.00
Ibuprofen 0 15 40 80 120 160 24
% R
emo
val
Time (min except 24 hours)
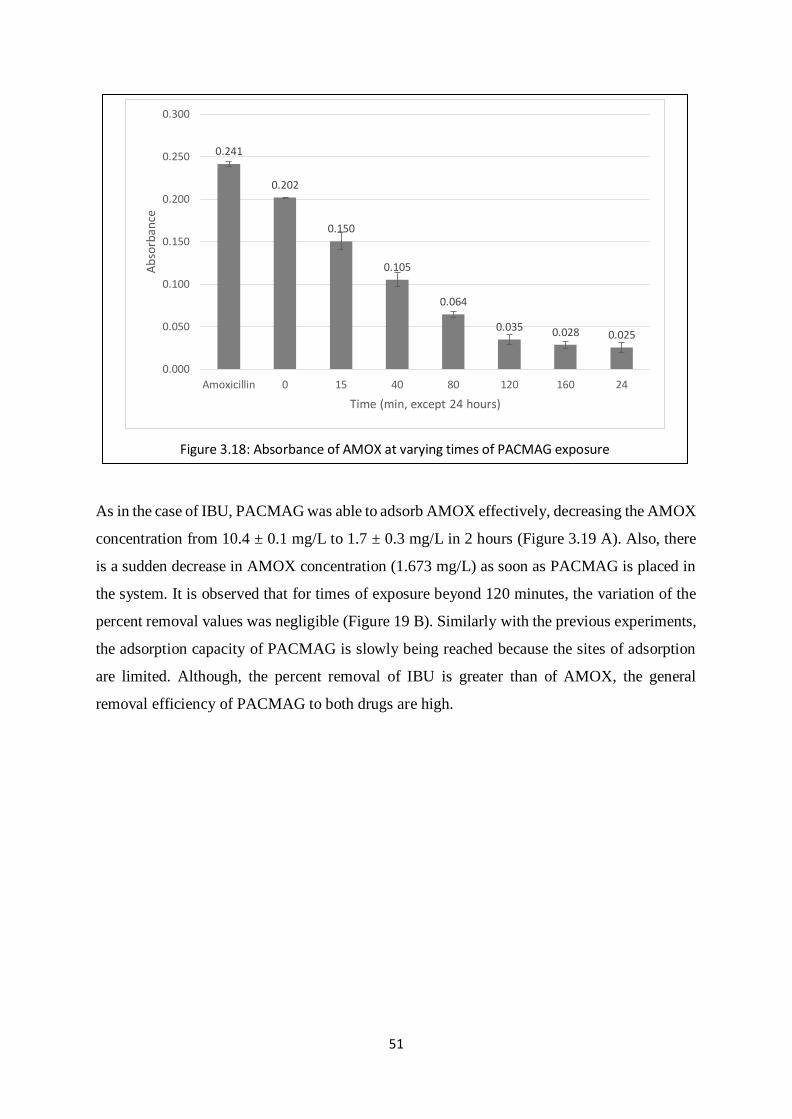
51
As in the case of IBU, PACMAG was able to adsorb AMOX effectively, decreasing the AMOX
concentration from 10.4 ± 0.1 mg/L to 1.7 ± 0.3 mg/L in 2 hours (Figure 3.19 A). Also, there
is a sudden decrease in AMOX concentration (1.673 mg/L) as soon as PACMAG is placed in
the system. It is observed that for times of exposure beyond 120 minutes, the variation of the
percent removal values was negligible (Figure 19 B). Similarly with the previous experiments,
the adsorption capacity of PACMAG is slowly being reached because the sites of adsorption
are limited. Although, the percent removal of IBU is greater than of AMOX, the general
removal efficiency of PACMAG to both drugs are high.
Figure 3.18: Absorbance of AMOX at varying times of PACMAG exposure
0.241
0.202
0.150
0.105
0.064
0.035 0.028 0.025
0.000
0.050
0.100
0.150
0.200
0.250
0.300
Amoxicillin 0 15 40 80 120 160 24
Ab
sorb
ance
Time (min, except 24 hours)
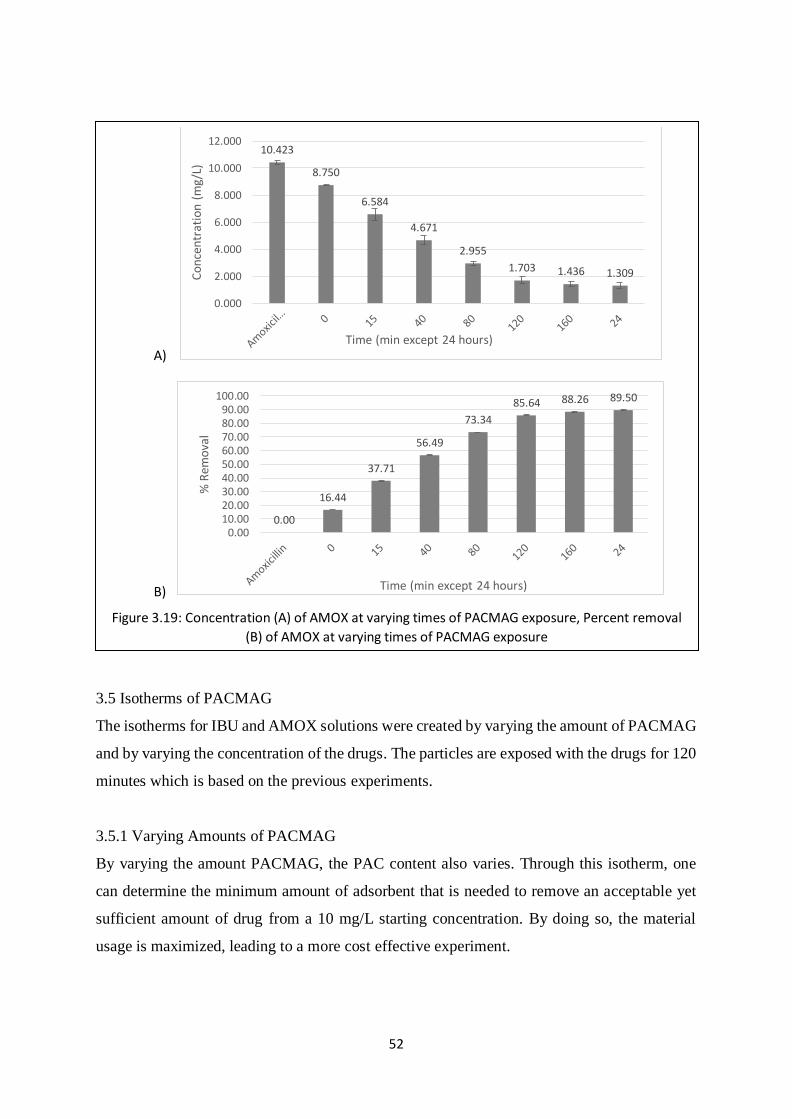
52
3.5 Isotherms of PACMAG
The isotherms for IBU and AMOX solutions were created by varying the amount of PACMAG
and by varying the concentration of the drugs. The particles are exposed with the drugs for 120
minutes which is based on the previous experiments.
3.5.1 Varying Amounts of PACMAG
By varying the amount PACMAG, the PAC content also varies. Through this isotherm, one
can determine the minimum amount of adsorbent that is needed to remove an acceptable yet
sufficient amount of drug from a 10 mg/L starting concentration. By doing so, the material
usage is maximized, leading to a more cost effective experiment.
A)
B)
Figure 3.19: Concentration (A) of AMOX at varying times of PACMAG exposure, Percent removal
(B) of AMOX at varying times of PACMAG exposure
10.423
8.750
6.584
4.671
2.955
1.703 1.436 1.309
0.000
2.000
4.000
6.000
8.000
10.000
12.000
Co
nce
ntr
atio
n (
mg/
L)
Time (min except 24 hours)
0.00
16.44
37.71
56.49
73.34
85.64 88.26 89.50
0.0010.0020.0030.0040.0050.0060.0070.0080.0090.00
100.00
% R
emo
val
Time (min except 24 hours)
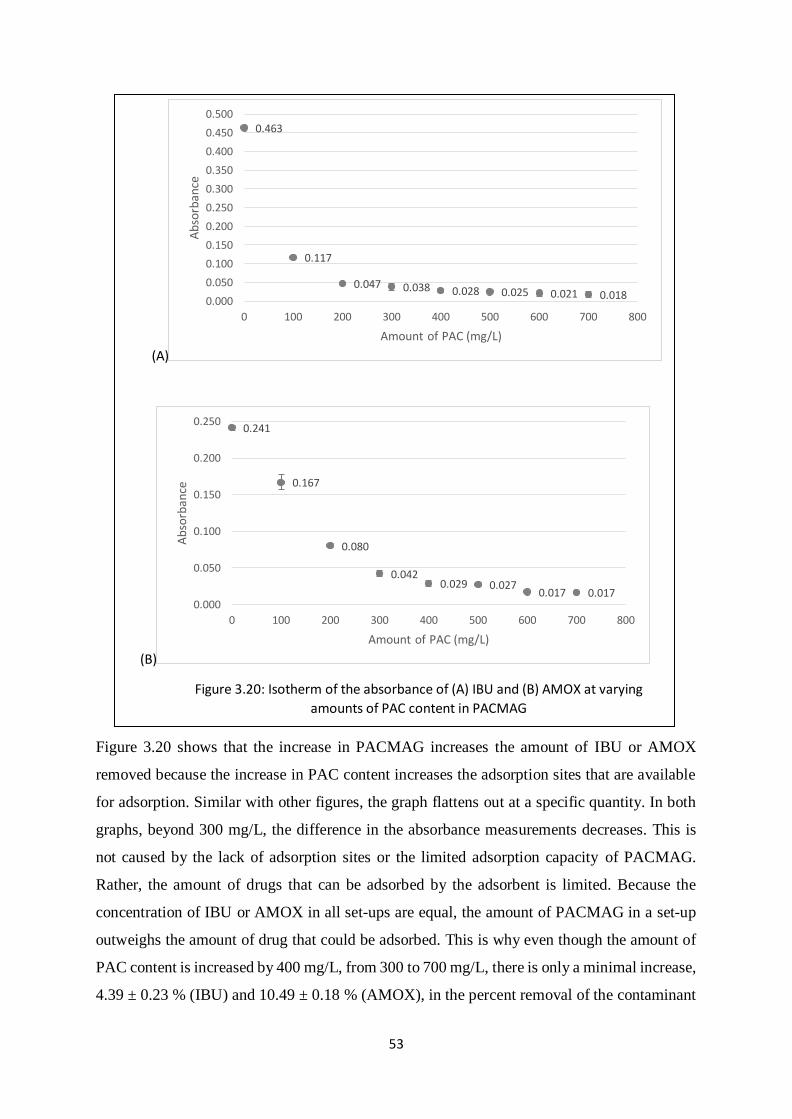
53
Figure 3.20 shows that the increase in PACMAG increases the amount of IBU or AMOX
removed because the increase in PAC content increases the adsorption sites that are available
for adsorption. Similar with other figures, the graph flattens out at a specific quantity. In both
graphs, beyond 300 mg/L, the difference in the absorbance measurements decreases. This is
not caused by the lack of adsorption sites or the limited adsorption capacity of PACMAG.
Rather, the amount of drugs that can be adsorbed by the adsorbent is limited. Because the
concentration of IBU or AMOX in all set-ups are equal, the amount of PACMAG in a set-up
outweighs the amount of drug that could be adsorbed. This is why even though the amount of
PAC content is increased by 400 mg/L, from 300 to 700 mg/L, there is only a minimal increase,
4.39 ± 0.23 % (IBU) and 10.49 ± 0.18 % (AMOX), in the percent removal of the contaminant
(A)
(B)
Figure 3.20: Isotherm of the absorbance of (A) IBU and (B) AMOX at varying
amounts of PAC content in PACMAG
0.463
0.117
0.047 0.038 0.028 0.025 0.021 0.0180.000
0.050
0.100
0.150
0.200
0.250
0.300
0.350
0.400
0.450
0.500
0 100 200 300 400 500 600 700 800
Ab
sorb
ance
Amount of PAC (mg/L)
0.241
0.167
0.080
0.0420.029 0.027
0.017 0.0170.000
0.050
0.100
0.150
0.200
0.250
0 100 200 300 400 500 600 700 800
Ab
sorb
ance
Amount of PAC (mg/L)
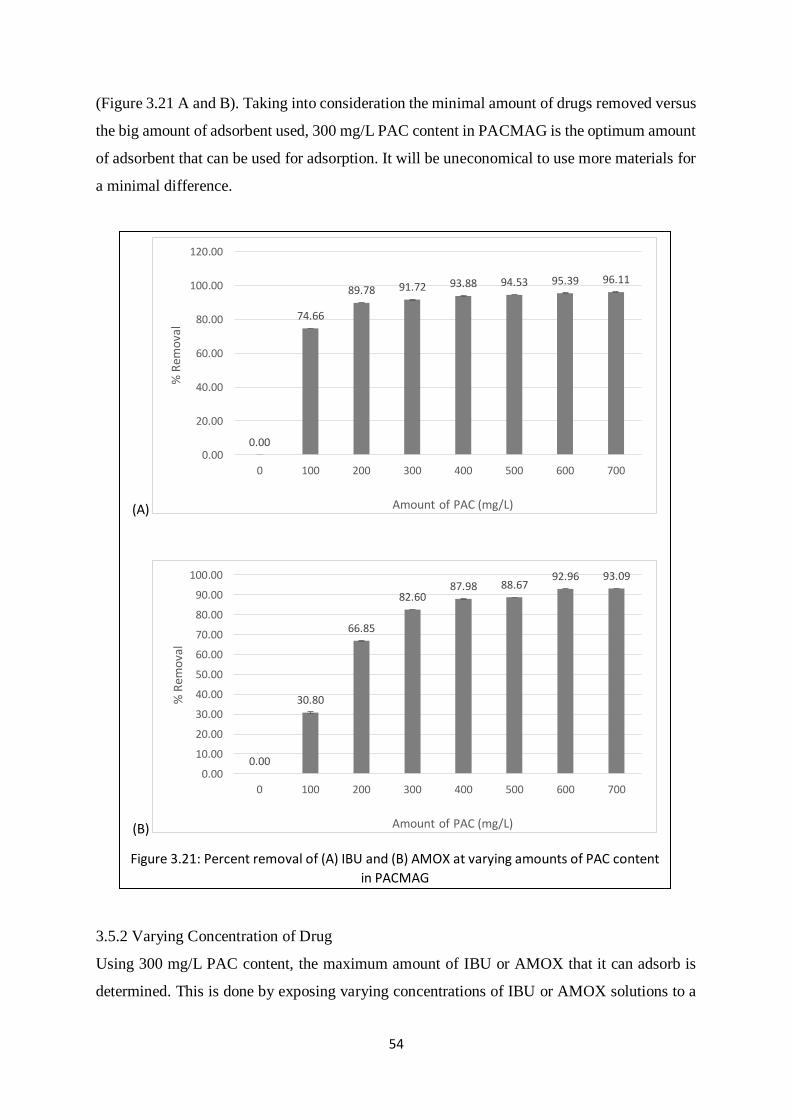
54
(Figure 3.21 A and B). Taking into consideration the minimal amount of drugs removed versus
the big amount of adsorbent used, 300 mg/L PAC content in PACMAG is the optimum amount
of adsorbent that can be used for adsorption. It will be uneconomical to use more materials for
a minimal difference.
3.5.2 Varying Concentration of Drug
Using 300 mg/L PAC content, the maximum amount of IBU or AMOX that it can adsorb is
determined. This is done by exposing varying concentrations of IBU or AMOX solutions to a
(A)
(B)
Figure 3.21: Percent removal of (A) IBU and (B) AMOX at varying amounts of PAC content
in PACMAG
0.00
74.66
89.78 91.72 93.88 94.53 95.39 96.11
0.00
20.00
40.00
60.00
80.00
100.00
120.00
0 100 200 300 400 500 600 700
% R
emo
val
Amount of PAC (mg/L)
0.00
30.80
66.85
82.6087.98 88.67
92.96 93.09
0.00
10.00
20.00
30.00
40.00
50.00
60.00
70.00
80.00
90.00
100.00
0 100 200 300 400 500 600 700
% R
emo
val
Amount of PAC (mg/L)
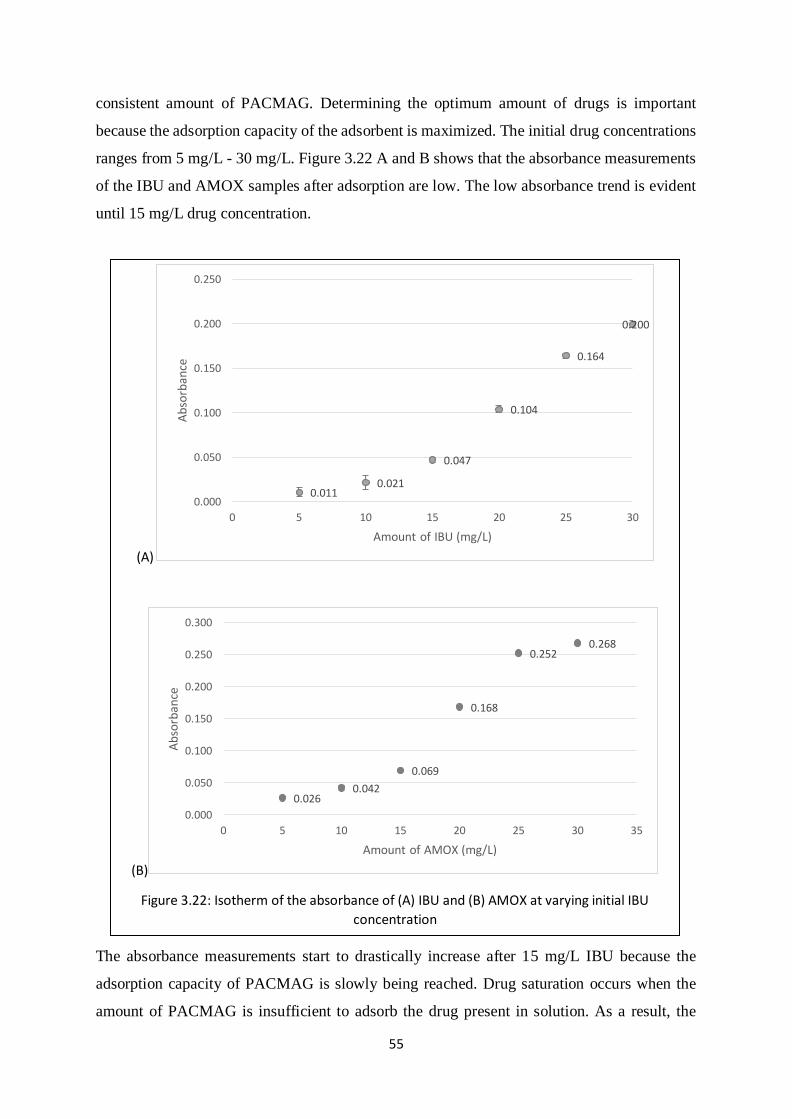
55
consistent amount of PACMAG. Determining the optimum amount of drugs is important
because the adsorption capacity of the adsorbent is maximized. The initial drug concentrations
ranges from 5 mg/L - 30 mg/L. Figure 3.22 A and B shows that the absorbance measurements
of the IBU and AMOX samples after adsorption are low. The low absorbance trend is evident
until 15 mg/L drug concentration.
The absorbance measurements start to drastically increase after 15 mg/L IBU because the
adsorption capacity of PACMAG is slowly being reached. Drug saturation occurs when the
amount of PACMAG is insufficient to adsorb the drug present in solution. As a result, the
(A)
(B)
Figure 3.22: Isotherm of the absorbance of (A) IBU and (B) AMOX at varying initial IBU
concentration
0.0110.021
0.047
0.104
0.164
0.200
0.000
0.050
0.100
0.150
0.200
0.250
0 5 10 15 20 25 30
Ab
sorb
ance
Amount of IBU (mg/L)
0.0260.042
0.069
0.168
0.2520.268
0.000
0.050
0.100
0.150
0.200
0.250
0.300
0 5 10 15 20 25 30 35
Ab
sorb
ance
Amount of AMOX (mg/L)
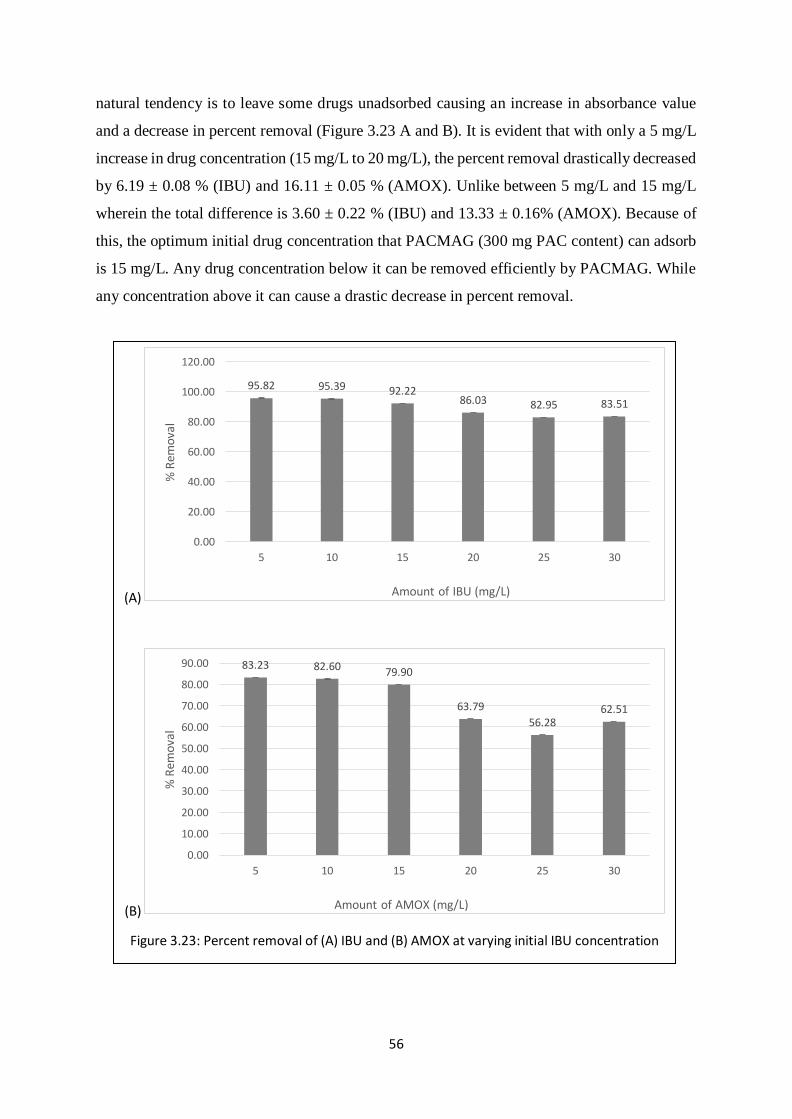
56
natural tendency is to leave some drugs unadsorbed causing an increase in absorbance value
and a decrease in percent removal (Figure 3.23 A and B). It is evident that with only a 5 mg/L
increase in drug concentration (15 mg/L to 20 mg/L), the percent removal drastically decreased
by 6.19 ± 0.08 % (IBU) and 16.11 ± 0.05 % (AMOX). Unlike between 5 mg/L and 15 mg/L
wherein the total difference is 3.60 ± 0.22 % (IBU) and 13.33 ± 0.16% (AMOX). Because of
this, the optimum initial drug concentration that PACMAG (300 mg PAC content) can adsorb
is 15 mg/L. Any drug concentration below it can be removed efficiently by PACMAG. While
any concentration above it can cause a drastic decrease in percent removal.
(A)
(B)
Figure 3.23: Percent removal of (A) IBU and (B) AMOX at varying initial IBU concentration
95.82 95.39 92.2286.03 82.95 83.51
0.00
20.00
40.00
60.00
80.00
100.00
120.00
5 10 15 20 25 30
% R
emo
val
Amount of IBU (mg/L)
83.23 82.60 79.90
63.79
56.2862.51
0.00
10.00
20.00
30.00
40.00
50.00
60.00
70.00
80.00
90.00
5 10 15 20 25 30
% R
emo
val
Amount of AMOX (mg/L)
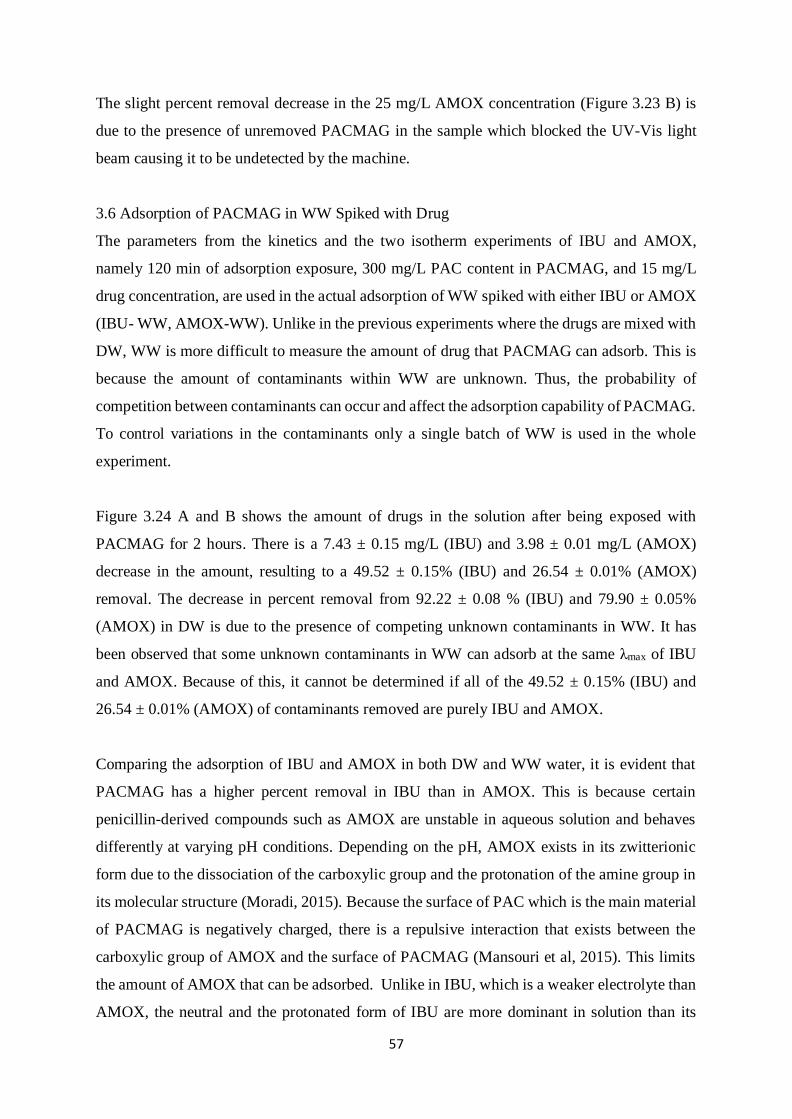
57
The slight percent removal decrease in the 25 mg/L AMOX concentration (Figure 3.23 B) is
due to the presence of unremoved PACMAG in the sample which blocked the UV-Vis light
beam causing it to be undetected by the machine.
3.6 Adsorption of PACMAG in WW Spiked with Drug
The parameters from the kinetics and the two isotherm experiments of IBU and AMOX,
namely 120 min of adsorption exposure, 300 mg/L PAC content in PACMAG, and 15 mg/L
drug concentration, are used in the actual adsorption of WW spiked with either IBU or AMOX
(IBU- WW, AMOX-WW). Unlike in the previous experiments where the drugs are mixed with
DW, WW is more difficult to measure the amount of drug that PACMAG can adsorb. This is
because the amount of contaminants within WW are unknown. Thus, the probability of
competition between contaminants can occur and affect the adsorption capability of PACMAG.
To control variations in the contaminants only a single batch of WW is used in the whole
experiment.
Figure 3.24 A and B shows the amount of drugs in the solution after being exposed with
PACMAG for 2 hours. There is a 7.43 ± 0.15 mg/L (IBU) and 3.98 ± 0.01 mg/L (AMOX)
decrease in the amount, resulting to a 49.52 ± 0.15% (IBU) and 26.54 ± 0.01% (AMOX)
removal. The decrease in percent removal from 92.22 ± 0.08 % (IBU) and 79.90 ± 0.05%
(AMOX) in DW is due to the presence of competing unknown contaminants in WW. It has
been observed that some unknown contaminants in WW can adsorb at the same λmax of IBU
and AMOX. Because of this, it cannot be determined if all of the 49.52 ± 0.15% (IBU) and
26.54 ± 0.01% (AMOX) of contaminants removed are purely IBU and AMOX.
Comparing the adsorption of IBU and AMOX in both DW and WW water, it is evident that
PACMAG has a higher percent removal in IBU than in AMOX. This is because certain
penicillin-derived compounds such as AMOX are unstable in aqueous solution and behaves
differently at varying pH conditions. Depending on the pH, AMOX exists in its zwitterionic
form due to the dissociation of the carboxylic group and the protonation of the amine group in
its molecular structure (Moradi, 2015). Because the surface of PAC which is the main material
of PACMAG is negatively charged, there is a repulsive interaction that exists between the
carboxylic group of AMOX and the surface of PACMAG (Mansouri et al, 2015). This limits
the amount of AMOX that can be adsorbed. Unlike in IBU, which is a weaker electrolyte than
AMOX, the neutral and the protonated form of IBU are more dominant in solution than its
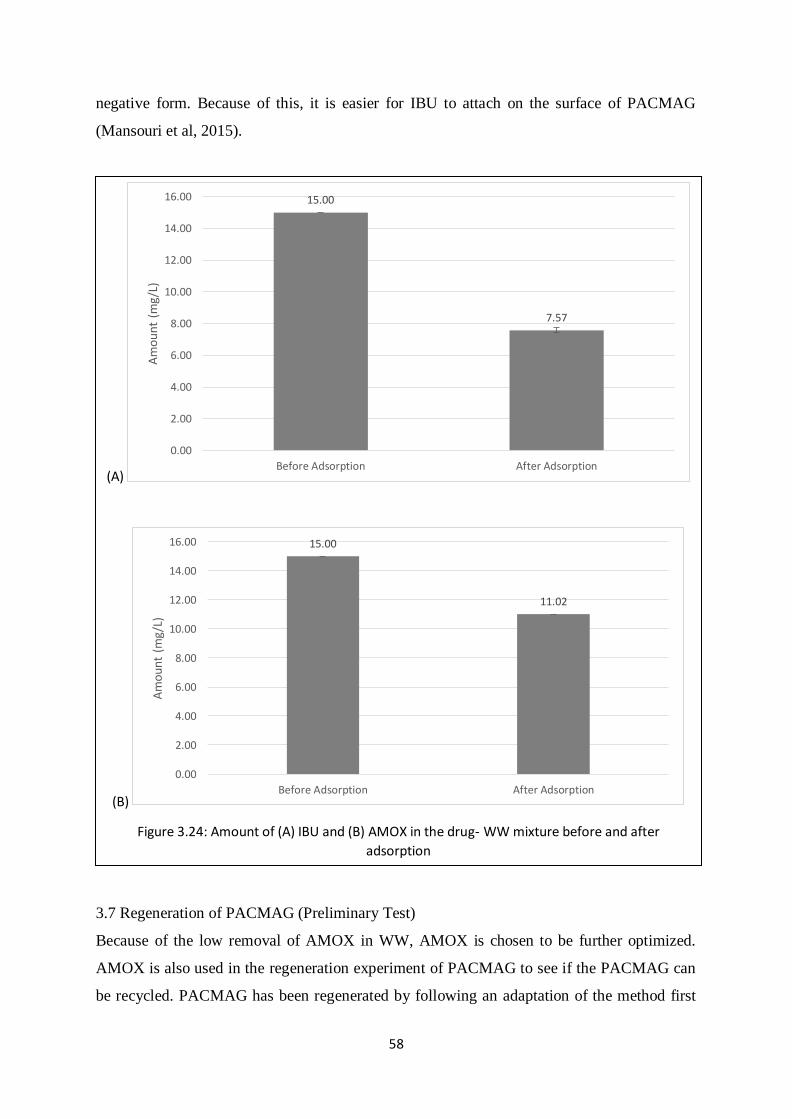
58
negative form. Because of this, it is easier for IBU to attach on the surface of PACMAG
(Mansouri et al, 2015).
3.7 Regeneration of PACMAG (Preliminary Test)
Because of the low removal of AMOX in WW, AMOX is chosen to be further optimized.
AMOX is also used in the regeneration experiment of PACMAG to see if the PACMAG can
be recycled. PACMAG has been regenerated by following an adaptation of the method first
(A)
(B)
Figure 3.24: Amount of (A) IBU and (B) AMOX in the drug- WW mixture before and after
adsorption
15.00
7.57
0.00
2.00
4.00
6.00
8.00
10.00
12.00
14.00
16.00
Before Adsorption After Adsorption
Am
ou
nt
(mg/
L)
15.00
11.02
0.00
2.00
4.00
6.00
8.00
10.00
12.00
14.00
16.00
Before Adsorption After Adsorption
Am
ou
nt
(mg/
L)
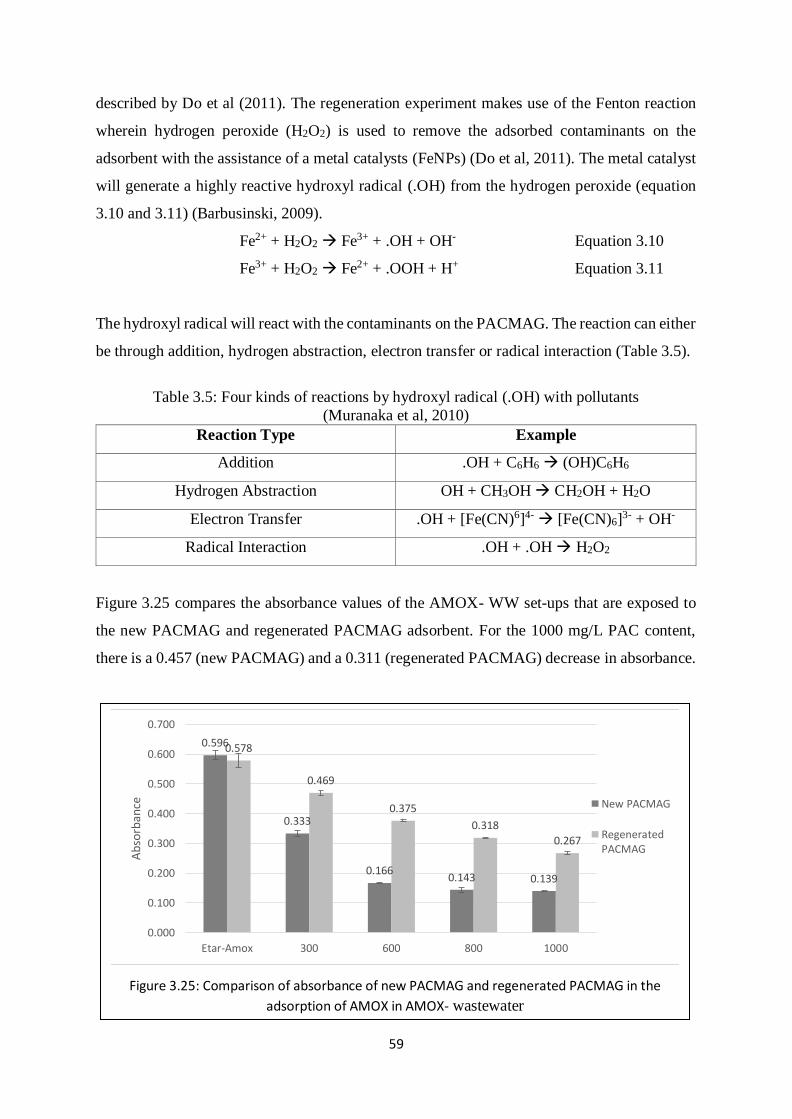
59
described by Do et al (2011). The regeneration experiment makes use of the Fenton reaction
wherein hydrogen peroxide (H2O2) is used to remove the adsorbed contaminants on the
adsorbent with the assistance of a metal catalysts (FeNPs) (Do et al, 2011). The metal catalyst
will generate a highly reactive hydroxyl radical (.OH) from the hydrogen peroxide (equation
3.10 and 3.11) (Barbusinski, 2009).
Fe2+ + H2O2 Fe3+ + .OH + OH- Equation 3.10
Fe3+ + H2O2 Fe2+ + .OOH + H+ Equation 3.11
The hydroxyl radical will react with the contaminants on the PACMAG. The reaction can either
be through addition, hydrogen abstraction, electron transfer or radical interaction (Table 3.5).
Table 3.5: Four kinds of reactions by hydroxyl radical (.OH) with pollutants
(Muranaka et al, 2010)
Reaction Type Example
Addition .OH + C6H6 (OH)C6H6
Hydrogen Abstraction OH + CH3OH CH2OH + H2O
Electron Transfer .OH + [Fe(CN)6]4- [Fe(CN)6]3- + OH-
Radical Interaction .OH + .OH H2O2
Figure 3.25 compares the absorbance values of the AMOX- WW set-ups that are exposed to
the new PACMAG and regenerated PACMAG adsorbent. For the 1000 mg/L PAC content,
there is a 0.457 (new PACMAG) and a 0.311 (regenerated PACMAG) decrease in absorbance.
Figure 3.25: Comparison of absorbance of new PACMAG and regenerated PACMAG in the
adsorption of AMOX in AMOX- wastewater
0.596
0.333
0.1660.143 0.139
0.578
0.469
0.375
0.318
0.267
0.000
0.100
0.200
0.300
0.400
0.500
0.600
0.700
Etar-Amox 300 600 800 1000
Ab
sorb
ance New PACMAG
RegeneratedPACMAG
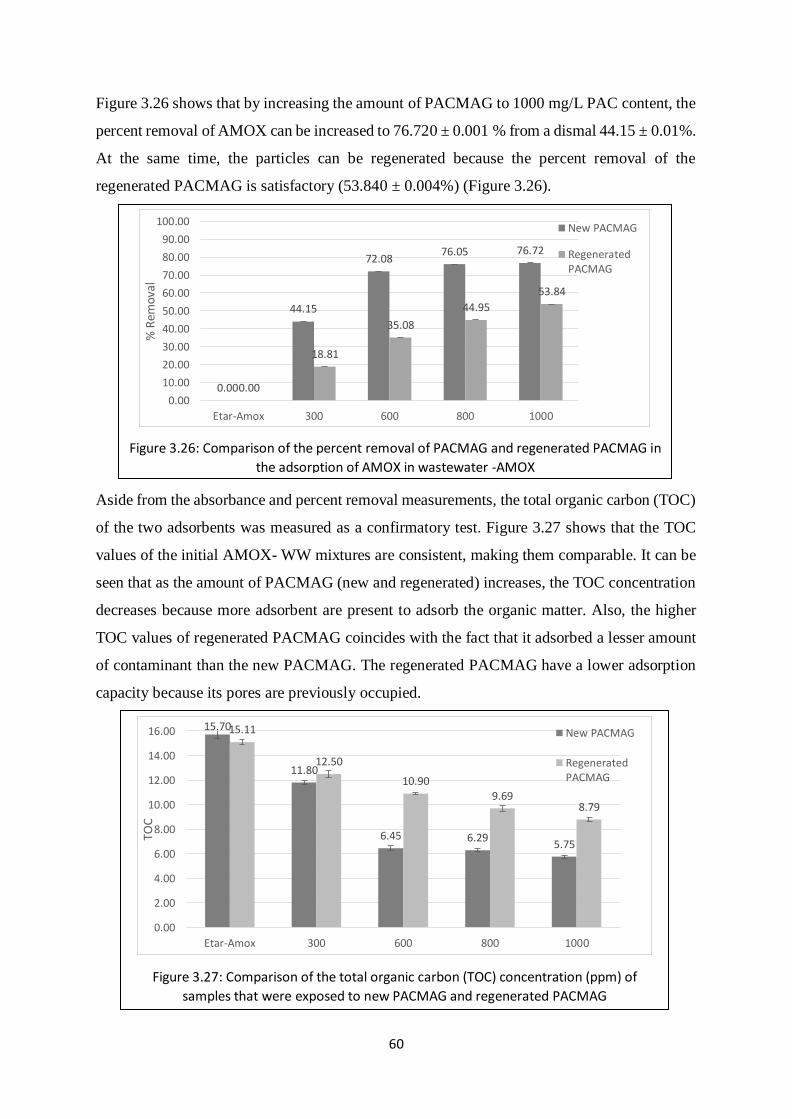
60
Figure 3.26 shows that by increasing the amount of PACMAG to 1000 mg/L PAC content, the
percent removal of AMOX can be increased to 76.720 ± 0.001 % from a dismal 44.15 ± 0.01%.
At the same time, the particles can be regenerated because the percent removal of the
regenerated PACMAG is satisfactory (53.840 ± 0.004%) (Figure 3.26).
Aside from the absorbance and percent removal measurements, the total organic carbon (TOC)
of the two adsorbents was measured as a confirmatory test. Figure 3.27 shows that the TOC
values of the initial AMOX- WW mixtures are consistent, making them comparable. It can be
seen that as the amount of PACMAG (new and regenerated) increases, the TOC concentration
decreases because more adsorbent are present to adsorb the organic matter. Also, the higher
TOC values of regenerated PACMAG coincides with the fact that it adsorbed a lesser amount
of contaminant than the new PACMAG. The regenerated PACMAG have a lower adsorption
capacity because its pores are previously occupied.
Figure 3.26: Comparison of the percent removal of PACMAG and regenerated PACMAG in
the adsorption of AMOX in wastewater -AMOX
0.00
44.15
72.0876.05 76.72
0.00
18.81
35.08
44.95
53.84
0.00
10.00
20.00
30.00
40.00
50.00
60.00
70.00
80.00
90.00
100.00
Etar-Amox 300 600 800 1000
% R
emo
val
New PACMAG
RegeneratedPACMAG
Figure 3.27: Comparison of the total organic carbon (TOC) concentration (ppm) of
samples that were exposed to new PACMAG and regenerated PACMAG
15.70
11.80
6.45 6.295.75
15.11
12.50
10.909.69
8.79
0.00
2.00
4.00
6.00
8.00
10.00
12.00
14.00
16.00
Etar-Amox 300 600 800 1000
TOC
New PACMAG
RegeneratedPACMAG
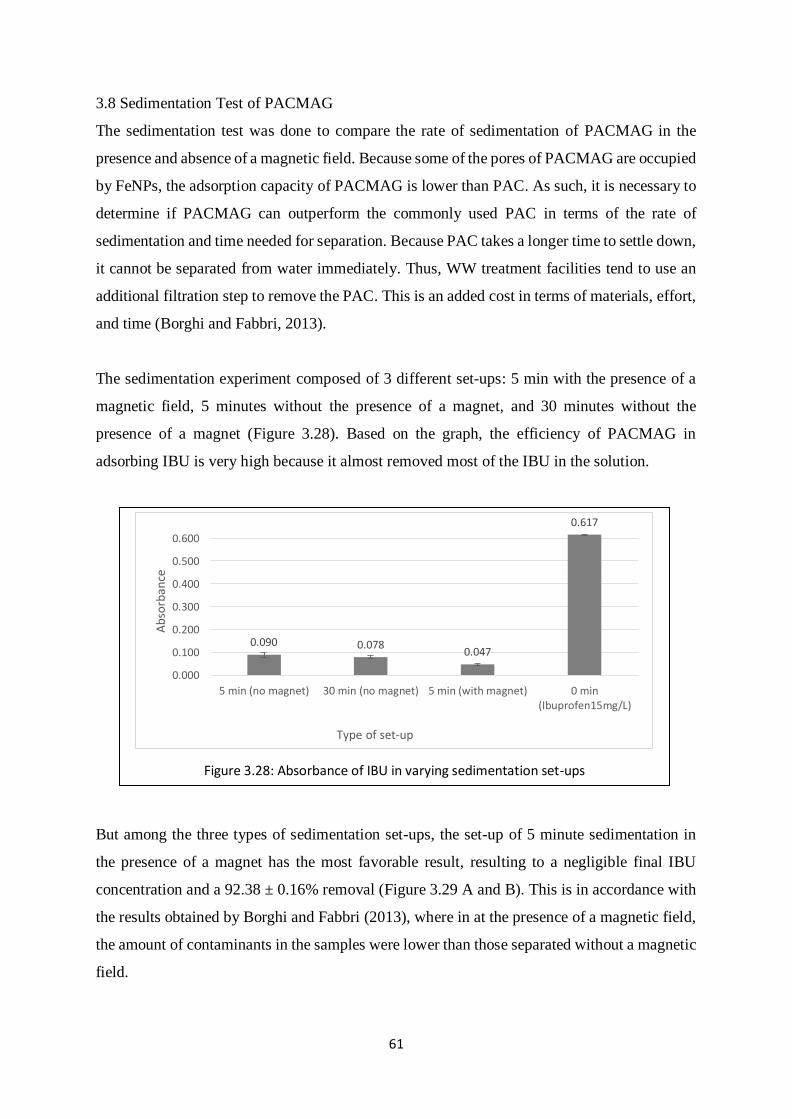
61
3.8 Sedimentation Test of PACMAG
The sedimentation test was done to compare the rate of sedimentation of PACMAG in the
presence and absence of a magnetic field. Because some of the pores of PACMAG are occupied
by FeNPs, the adsorption capacity of PACMAG is lower than PAC. As such, it is necessary to
determine if PACMAG can outperform the commonly used PAC in terms of the rate of
sedimentation and time needed for separation. Because PAC takes a longer time to settle down,
it cannot be separated from water immediately. Thus, WW treatment facilities tend to use an
additional filtration step to remove the PAC. This is an added cost in terms of materials, effort,
and time (Borghi and Fabbri, 2013).
The sedimentation experiment composed of 3 different set-ups: 5 min with the presence of a
magnetic field, 5 minutes without the presence of a magnet, and 30 minutes without the
presence of a magnet (Figure 3.28). Based on the graph, the efficiency of PACMAG in
adsorbing IBU is very high because it almost removed most of the IBU in the solution.
But among the three types of sedimentation set-ups, the set-up of 5 minute sedimentation in
the presence of a magnet has the most favorable result, resulting to a negligible final IBU
concentration and a 92.38 ± 0.16% removal (Figure 3.29 A and B). This is in accordance with
the results obtained by Borghi and Fabbri (2013), where in at the presence of a magnetic field,
the amount of contaminants in the samples were lower than those separated without a magnetic
field.
Figure 3.28: Absorbance of IBU in varying sedimentation set-ups
0.090 0.0780.047
0.617
0.000
0.100
0.200
0.300
0.400
0.500
0.600
5 min (no magnet) 30 min (no magnet) 5 min (with magnet) 0 min(Ibuprofen15mg/L)
Ab
sorb
ance
Type of set-up
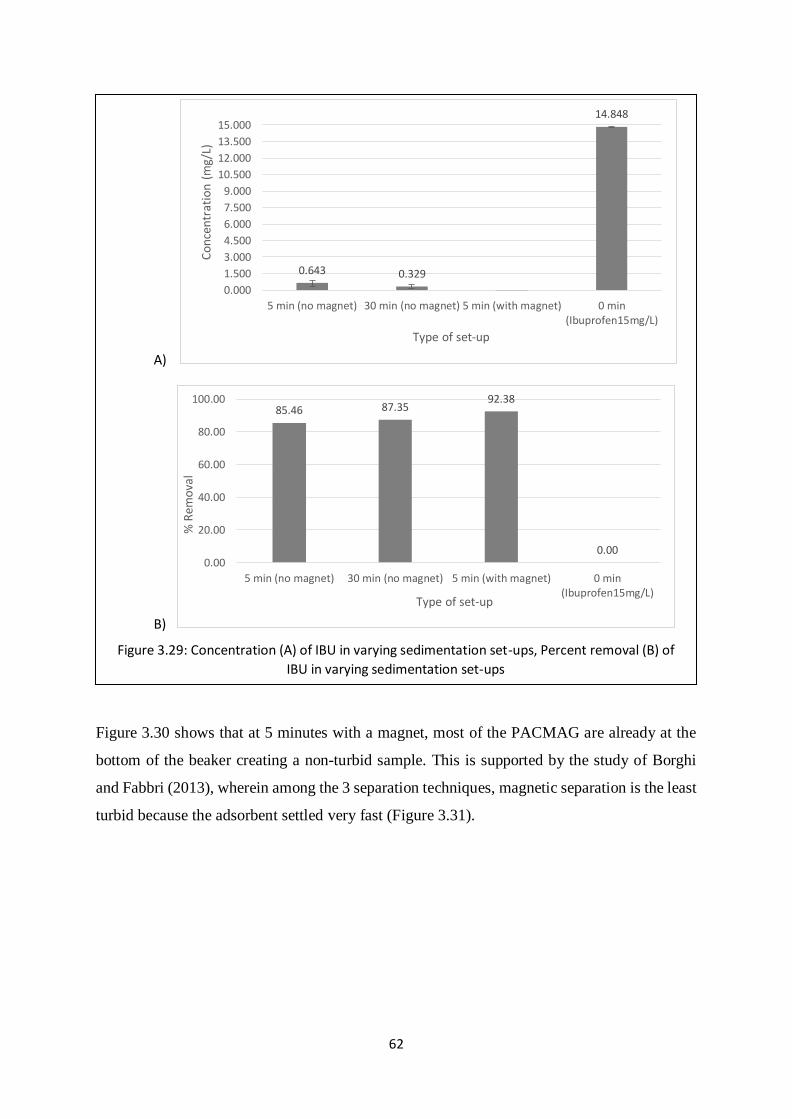
62
Figure 3.30 shows that at 5 minutes with a magnet, most of the PACMAG are already at the
bottom of the beaker creating a non-turbid sample. This is supported by the study of Borghi
and Fabbri (2013), wherein among the 3 separation techniques, magnetic separation is the least
turbid because the adsorbent settled very fast (Figure 3.31).
A)
B)
Figure 3.29: Concentration (A) of IBU in varying sedimentation set-ups, Percent removal (B) of
IBU in varying sedimentation set-ups
0.643 0.329
14.848
0.000
1.500
3.000
4.500
6.000
7.500
9.000
10.500
12.000
13.500
15.000
5 min (no magnet) 30 min (no magnet) 5 min (with magnet) 0 min(Ibuprofen15mg/L)
Co
nce
ntr
atio
n (
mg/
L)
Type of set-up
85.46 87.3592.38
0.000.00
20.00
40.00
60.00
80.00
100.00
5 min (no magnet) 30 min (no magnet) 5 min (with magnet) 0 min(Ibuprofen15mg/L)
% R
emo
val
Type of set-up
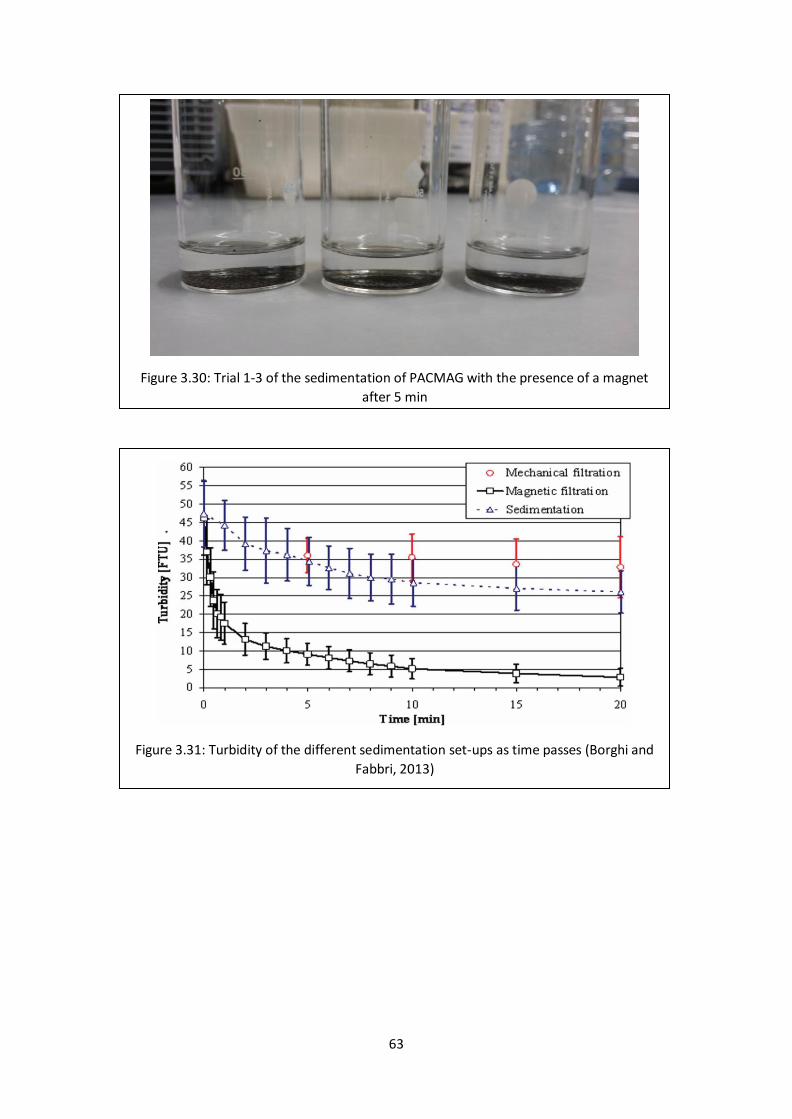
63
Figure 3.30: Trial 1-3 of the sedimentation of PACMAG with the presence of a magnet
after 5 min
Figure 3.31: Turbidity of the different sedimentation set-ups as time passes (Borghi and
Fabbri, 2013)
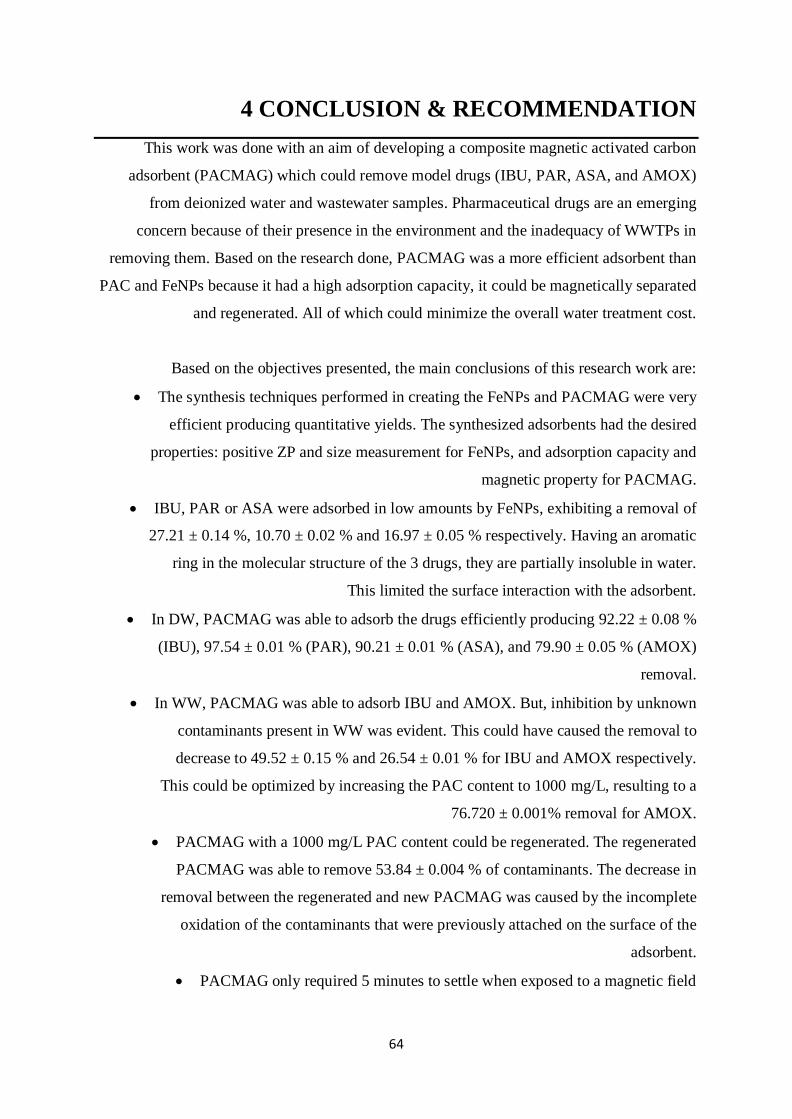
64
4 CONCLUSION & RECOMMENDATION
This work was done with an aim of developing a composite magnetic activated carbon
adsorbent (PACMAG) which could remove model drugs (IBU, PAR, ASA, and AMOX)
from deionized water and wastewater samples. Pharmaceutical drugs are an emerging
concern because of their presence in the environment and the inadequacy of WWTPs in
removing them. Based on the research done, PACMAG was a more efficient adsorbent than
PAC and FeNPs because it had a high adsorption capacity, it could be magnetically separated
and regenerated. All of which could minimize the overall water treatment cost.
Based on the objectives presented, the main conclusions of this research work are:
The synthesis techniques performed in creating the FeNPs and PACMAG were very
efficient producing quantitative yields. The synthesized adsorbents had the desired
properties: positive ZP and size measurement for FeNPs, and adsorption capacity and
magnetic property for PACMAG.
IBU, PAR or ASA were adsorbed in low amounts by FeNPs, exhibiting a removal of
27.21 ± 0.14 %, 10.70 ± 0.02 % and 16.97 ± 0.05 % respectively. Having an aromatic
ring in the molecular structure of the 3 drugs, they are partially insoluble in water.
This limited the surface interaction with the adsorbent.
In DW, PACMAG was able to adsorb the drugs efficiently producing 92.22 ± 0.08 %
(IBU), 97.54 ± 0.01 % (PAR), 90.21 ± 0.01 % (ASA), and 79.90 ± 0.05 % (AMOX)
removal.
In WW, PACMAG was able to adsorb IBU and AMOX. But, inhibition by unknown
contaminants present in WW was evident. This could have caused the removal to
decrease to 49.52 ± 0.15 % and 26.54 ± 0.01 % for IBU and AMOX respectively.
This could be optimized by increasing the PAC content to 1000 mg/L, resulting to a
76.720 ± 0.001% removal for AMOX.
PACMAG with a 1000 mg/L PAC content could be regenerated. The regenerated
PACMAG was able to remove 53.84 ± 0.004 % of contaminants. The decrease in
removal between the regenerated and new PACMAG was caused by the incomplete
oxidation of the contaminants that were previously attached on the surface of the
adsorbent.
PACMAG only required 5 minutes to settle when exposed to a magnetic field
65
Knowing the potential of PACMAG as an efficient adsorbent for common drugs like IBU,
AMOX, PAR and ASA, this experiment can be further improved on by doing the following,
Optimizing the regeneration experiments,
Exploring the adsorption of other HPCs like drug metabolites, hormones and
endocrine disruptors
Using other metallic nanoparticles as composite material
Using other forms of carbon like graphene
66
5 BIBLIOGRAPHY
Ambashta, R.D., Sillanpaa, M., 2010. Water purification using magnetic assistance: A review.
Journal of hazardous materials. 180, 38-49.
Amt fur Umwelt and Energie Basel-Stadt, 2004. Rhein-uberwachtungs-Station Weil am Rhein.
Jahresbericht 2003.
Atta, A.M., Al-lohedan, H.A., Al-Hussain, S.A., 2015. Functionalization of magnetite
nanoparticles as oil spill collector. Int. J. Mol. Sci. 16, 6911-6931
AWWA, 2000. Water quality and treatment: A handbook of community water supplies. 5th
edition. Mc-Graw-Hill, USA.
AZoNano, 2005. Pharmaceutical formulations and the importance of zeta potential to
pharmaceutical formulations with supplier data by Malvern.
Babic, S., Mutavdzic, D., Asperger, D., Horvat, A.J.M., Kastelan-Macan, M., 2007.
Determination of veterinary pharmaceuticals in production wastewater by HPTLC-
videodensitometry. Chromatographia.65, 105-110.
Bacsi, I., Beres, V., Kokai, Z., Gonda, S., Novak, Z., Nagy, S.A., Vasa, G., 2016. Effects of
non-steroidal anti-inflammatory drugs on cyanobacteria and algae in laboratory strains and in
natural algal assemblages. Environ. Pollut. 212, 508-518.
Baghapour, M.A., Shirdarreh, M.R., Derakhshan, Z., Faramarzian, M., 2014. Modeling
amoxicillin removal from aquatic environemtns in biofilters. Health scope. 3(1)
Barbusinski, K., 2009. Fenton reaction- Controversy concerning the chemistry. Ecological
Chemistry and Engineering S. 16 (3), 347-358
Begg Cousland. Active Carbon Systems. Retrieved: June 28, 2016, from
http://beggcousland.co.uk/products/gas-cleaning/active-carbon-systems/
67
Bartelt-Hunt, S., Snow, D., Damon, T., Shockley, J., Hoagland, K., 2009. The occurrence of
illicit and therapeutic pharmaceuticals in wastewater effluent and surface waters in Nebraska.
Environmental Pollution. 157, 786-791.
Bertolini, A., Ferrari, A., Ottani, A., Guerzoni, S., Tacchi, R., Leone, S., 2006. Paracetamol:
new vistas of an old drug". CNS Drug Reviews. 12 (3–4), 250–75.
Betterton, E.A., 1993. On the pH-dependent formation constants of iron (III) - sulfur (IV)
transient complexes. Journal of Atmospheric Chemistry.17, 307-324.
Bisarya, S., Patil, D., 1993. Determination of salicylic-acid and phenol (ppm level) in effluent
from aspirin plant. Res. Ind. 38, 170-172.
Blaney, L., 2007. Magnetite (Fe3O4): Properties, synthesis, and applications. Lehigh Preserve.
15 (5).
Boxall, A.B.A., 2012. New and emerging water pollutants arising from agriculture.
Organization for Economic Co-operation and Development (OECD), 1-49.
Boxall, A.B.A., 2004. The environmental side effects of medication. European Molecular
Biology Organization. 5(12), 1110-1116.
Borghi, C.C., Fabbri, M., 2014. Magnetic recovery of modified activated carbon powder used
for removal of endocrine disruptors present in water. Environmental Technology. 35 (8), 1018-
1026.
Carlos, L., Garcia Einschlag, F.S., Gonzalez, M.C., Martire, D.O., 2013. Applications of
magnetite nanoparticles for heavy metal removal from wastewater. Waste water-Treatment
Technologies and Recent Analytical Developments. 63-77
CEN RSS. The Year In New Drugs. (n.d.). Retrieved: June 9, 2016, from
http://cen.acs.org/articles/94/i5/Year-New-Drugs.html
68
Collado, N., Rodriguez-Mozaz, S., Gros, M., Rubirola, A., Barcelo, D., Comas, J., Rodriguez-
Roda, I., Buttiglieri, G., 2014. Pharmaceuticals occurrence in a WWTP with significant
industrial contribution and its input into the river system. Environ. Pollut. 185, 202-212.
Cheng, Tsung O.,2007. The History of Aspirin. Texas Heart Institute Journal. 34 (3), 392–393.
Cui, C.W., Ji, S.L., Ren, H.Y., 2006. Determination of steroid estrogens in wastewater
treatment plant of a contraceptives producing factory. Environ.Monit.Assess.121, 409-419.
Dal Pan, G.J., 2015. Acetaminophen: Background and Overview. U.S. Food and Drug
Administratio.
D’Couto, H., 2008. Development of a low-cost sustainable water filter: A study of the removal
of water pollutants As (V) and Pb (II) using magnetite nanoparticles. Journal of the US SJWP.
1, 32-45.
Do, M.H., Phan, N.H., Nguyen, T.D., Pham, T.T.S., Nguyen, V.K., Vu, T.T.T., Nguyen,
T.K.P., 2011. Activated carbon/Fe3O4 nanoparticle composite: Fabrication, methyl orange,
removal and regeneration by hydrogen peroxide. Chemosphere. 85, 1269-1276.
Donau Carbon GmbH, 2014. Activated carbon for waste water treatment.
Dong, C., Chen, W., Liu, C., Liu, Y., Liu, H., 2014. Synthesis of magnetic chitosan
nanoparticle and its adsorption property for humic acid from aqueous solution. Colloids and
surfaces A: Physicochem. Eng. Aspects. 446, 179-189.
Enz, T., Winterer, M., Stahl, B., Bhattacharya, S., Miehe, G., Foster, K., Fasel, C., Hahn, H.,
2006. Structure and magnetic properties of iron nanoparticles stabilized in carbon. Journal of
applied physics. 99, 1-9.
European Environment Agency, 2010. Pharmaceuticals in the environment: EEA technical
report. 1, 1-33.
European Union, 2014. Drinking water regulations. Statutory Instruments. S.I. no. 122 of 2014.
69
EUR-Lex.europa.eu. (n.d.). Retrieved: June 9, 2016, from http://eur-lex.europa.eu/
Fick, J., Soderstorm, H., Lindberg, R.H., Phan, C., Tysklind, M., Larsson, D.G.L., 2009.
Contamination of surface, ground, and drinking water from pharmaceutical production.
Environ. Toxicol. Chem. 28. 2522-2527.
Fram, M.S., Belitz, K., 2011. Occurrence and concentrations of pharmaceutical compounds in
groundwater used for public drinking-water supply in California. Science of the Total
Environment. 409, 3409-3417.
Ford, C.M., 2001. Acetaminophen, aspirin, and chronic renal failure. New England Journal of
Medicine. 345, 1801-1808.
Gasser, G., Pankratov, I., Elhanany, S., Werner, P., Gun, J., Gelman, F., Lev, O., 2012. Field
and laboratory studies of the fate and enantiomeric enrichment of venlafaxine and O-
desmethylvenlafaxine under aerobic and anaerobic conditions. Chemosphere.88, 98-105.
Gavrilescu, M., Demnerova, K., Aamand, J., Agathos, S., Fava, F., 2015. Emerging pollutants
in the environment: present, and future challenges in biomonitoring, ecological risks and
bioremediation. New Biotechnology. 32 (1), 146-156.
Geissen, V., Mol, H., Klumpp, E., Umlauf, G., Nadal, M., Van der Ploeg, M., Van de Zee,
S.E.A.T.M., Ritsema, C.J., 2015. Emerging pollutants in the environment: A Challenge for
water resource management. International Soil and Water Conservation Research. 3, 57-65.
Ghaffoori, S., Shah, K.K., Mehrvar, M., Chan, P.K., 2014. Pharmaceutical wastewater
treatment using granular activated carbon and UV/H2O2 processes: Experimental analysis and
modelling. Canadian Society for Chemical Engineering. 92, 1163- 1173.
Halford, G.M., Lordkipanidzé, M., Watson, S.P., 2012. 50th anniversary of the discovery of
ibuprofen: an interview with Dr Stewart Adams. Platelets. 23 (6): 415–22
70
Holm, J.V., Ruegge, K., Bjerg, P.L., Christensen, T.H., 1995. Occurrence and distribution of
pharmaceutical organic compounds in the groundwater downgradient of a landfill (Grindsted,
Denmark). Environ. Sci. Technol. 29, 1415-1420.
Huber, D.L., 2005. Synthesis, properties, and applications of iron nanoparticles. Nano micro
small. 1(5), 482-501.
Hug, C., Ulrich, N., Schulze, T. Brack, W., Krauss,M., 2014. Identification of Novel micro-
pollutants in wastewater by a combination of suspect and non-target screening. Environmental
Pollution. 184, 25-32
Jiang, C., Wang, R., Ma, W., 2010. The effect of magnetic nanoparticles on Microcystis
aeruginosa removal by a composite coagulant. Colloids and Surfaces A: Physicochem.Eng.
Aspects. 369, 260-267.
Kahani, S.A., Hamadanian, M., Vandadi, O., 2007. Deposition of magnetic nanoparticles in
activated carbons and preparation of magnetic activated carbon. Nanotechnology and its
applications. 183-188.
Karraker, D.G., 1963. The kinetics of the reaction between sulfurous acid and ferric ion. Journal
of Physical Chemistry. 67, 871-874.
Kaur, S.P., Rao, R., Nanda, S., 2011. Amoxicillin: A broad spectrum antibiotic. International
Journal of Pharmacy and Pharmaceutical Sciences. 3 (3), 1-8.
Khan, G.A., Berglund, B., Khan, K.M., Lindergren, P.E., Fick, J., 2013. Occurrence and
abundance of antibiotics and resistance genes in rivers, canal, and near drug formulation
facilities: a study in Pakistan. PLoS ONE. 8.
Kolpin, D.W., Furlong, E.T., Meyer, M.T., Thurman, E.M., Zaugg, S.D., Barber, L.B., Buxton,
H.T., 2002. Pharmaceuticals, hormones, and other organic wastewater contaminants in US
streams. Environ. Sci. Technol. 36 (6), 1202.
71
Kristiansson, E., Fick, J., Janzon, A., Grabic, R., Rutgersson, C., Weijdegard, B., Soderstrom,
H., Larsson, D.G.J., 2011. Pyrosequencing and antibiotic-contaminated river sediments reveals
high levels of resistance and gene transfer elements. PLoS ONE. 6.
Küster, A., Adler, N., 2014. Pharmaceuticals in the environment: scientific evidence of risks
and its regulation. Philosophical Transactions of the Royal Society B.369, 20130587.
Kummerer, K., 2009. The presence of pharmaceuticals in the environment due to human use,
present knowledge and future challenges. J. Environmental Management. 90(8), 2354-2366.
Lapworth, D.J., Baran, N., Stuart, M.E., Ward, R.S., 2012. Emerging organic contaminants in
groundwater: A review of sources, fate and occurrence. Environmental Pollution. 162, 287-
303.
Larsson, D.G.J., 2014. Pollution of drug manufacturing: review and perspectives. Phil. Trans.
R. Soc. B. 369, 1-7.
Larsson, D.G.J., De Pedro, C., Paxeus, N., 2007. Effluent from drug manufactures contain
extremely high levels of pharmaceuticals. J. Hazard. Mater. 148, 751-755.
Lenntech Water Treatment. Water Treatment Solutions. (n.d.). Retrieved: May 8, 2016, from
http://www.lenntech.com/water-purification-steps-faq.htm
Lester, Y., Mamane, H., Zucker, I., Avisar, D., 2013. Treating wastewater from pharmaceutical
formulation facility by biological process and ozone. Water Res. 47, 4349-4356.
Li, D., Tang, M., Hu, J., Ren, L., Zhang, Y., Li, K., 2008. Determination and fate of
oxytetracycline and related compounds in oxytetracycline production wastewater and the
receiving river. Environ. Toxicol. Chem. 27, 80-86.
Li, D., Tang, M., Hu, J., Zhang, Y., Chang, H., Jin, F., 2008. Determination of penicillin G and
its degradation products in a penicillin production wastewater treatment plant and the receiving
river. Water Res. 42, 307-317.
72
Lin, A.Y., Tsai, Y.T., 2009. Occurrence of pharmaceuticals in Taiwan’s surface waters: impact
of waste streams from hospitals and pharmaceutical production facilities. Sci. Total Environ.
407, 3793-3802.
Lin, A.Y., Yu, T.H., Lin, C.F., 2008. Pharmaceutical contamination in residential, industrial
and agricultural waste streams: risk to aqueous environments in Taiwan. Chemosphere. 74,
131-141.
Mahdi, J.G., Mahdi, A.J., Mahdi, A.J., Bowen, I.D., 2006. The historical analysis of aspirin
discovery, its relation to the willow tree and antiproliferative and anticancer potential. Cell
proliferation. 39 (2), 147–55.
Malvern Instruments Limited. A basic guide to particle characterization. 2014.
Mansouri, H., Carmona, R.J., Gomis-Berenguer, A., Souissi-Najar, S., Ouederni, A., Ania, C.,
2015. Competitive adsorption of ibuprofen and amoxicillin mixtures from aqueous solution on
activated carbons. Journal of Colloid and interface Science. 449, 252-260.
Mascolo, M.S., Pei, Y., Ring, T.A., 2013. Room temperature co-precipitation synthesis of
magnetite nanoparticles in a large pH window with different bases. Materials. 6, 5549-5567.
Millero, F.J., Gonzalez-Davila, M., Santana-Casiano, J.M., 1995. Reduction of Fe (III) with
sulfite in natural water. Journal of Geophysical Research. 100(D4), 7235-7244.
Mompelat, S., Thomas, O., Le Bot, B., 2011. Contamination levels of human pharmaceutical
compounds in French surface and drinking water. J. Environ. Monit. 2011, 13, 2929.
Moradi, S.E., 2015. Highly efficient removal of amoxicillin from water by magnetic graphene
oxide adsorbent. Series of chemistry and environmental engineering. 60(74), 2.
Muranaka, C.T., Julcour, C., Wilhelm, A.M., Delmas, H., Nascimento, C., 2010. Regeneration
of activated carbon by (photo)-Fenton oxidation. Ind.Eng.Chem. Res. 49, 989-995.
73
Murdoch, K., 2015. Pharmaceutical pollution in the environment: Issues for Australia, New
Zealand and Pacific island countries. National Toxic Network. 1-36.
Nam, S.W., Jo, B.I., Yoon, Y., Zoh, K.D., 2014. Occurrence and removal of selected micro-
pollutants in a water treatment plant. Chemosphere. 95, 156-165.
Norwegian Environment Agency, 2005. Retrieved: June 7, 2016.www.
miljodirektoratet.no/no/Nyheter/Nyheter/Old-klif/2005/September/Nye_antibiotikautslipp_
fra _Alpharma_i_Oslo/.
Oliveira, L.C.A., Rios, R.V.R.A., Fabris, J.D., Garg, V., Sapag, K., Lago, R.M., 2002.
Activated carbon/iron oxide magnetic composited for the adsorption of contaminants in water.
Carbon. 40, 2177-2183.
Pescod, M.B., 1992. Wastewater treatment and use in agriculture-FAO irrigation and drainage
paper. Food and Agriculture Organization of the United Nations. 1-169.
Phillips, P.J., Smith, S.G., Kolpin, D.W., Zaugg, S.D., Buxton, H.T., Furlong, E.T., Esposito,
K., Stinson, B., 2010. Pharmaceutical formulation facilities as sources of opioids and other
pharmaceuticals to wastewater treatment plant effluents. Environ. Sci. Technol. 44, 4910-4916.
Prasse, C., Schlusener, M.P., Schulz, R., Ternes, T.A., 2010. Antiviral drugs in wastewater and
surface waters: a new pharmaceutical class of environmental relevance. Environ.Sci. Technol.
44, 1728-1735.
Qiting, J., Xiheng, Z., 1988. Combination process of anaerobic digestion and ozonation
technology for treating wastewater from antibiotics production. Water Treat. 3, 285-291.
Qu, S., Yang, H., Ren, D., Kan, S., Zou, G., Li, D., Li, M., 1995. Magnetite nanoparticles
prepared by precipitation from partially reduced ferric chloride aqueous solutions. J. Colloid
Interface Sci. 215(1), 190-192.
Rainsford, K., 2009. Ibuprofen: Pharmacology, efficacy and safety. Inflammopharmacology,
17(6), 275.
74
Rashed, M.N., 2013. Adsorption technique for the removal of organic pollutants from water
and wastewater. Intech.
Ravina, E., 2014. The evolution of drug discovery. Weinheim: Wiley-VCH. 262.
Reddersen, K., Heberer, T., Dunnbier, U., 2002. Identification and significance of phenazone
drugs and their metabolites in ground- and drinking water. Chemosphere. 49, 539-544.
Rodriguez-Navas, C., 2013. Pollution pathways of pharmaceutical residues in the aquatic
environment on the island of Mallorca, Spain. Arch. Environ.Contam.Toxicol. 65, 56-66.
Rutgersson, C. et al, 2014. Fluoroquinolones and qnr genes in sediment, water, soil, and human
fecal flora in an environment polluted by manufacturing discharges. Environ. Sci. Technol. 48,
7825-7832.
Safarik, I., Horska, K., Pospiskova, K., Safarikova, M., 2012. Magnetically responsive
activated carbons for bio- and environmental applications. International Review of Chemical
Engineering. 4 (3), 346-352.
SAICM. (n.d.). Retrieved: June 9, 2016, from http://www.saicm.org/
Salgin, S., Salgin, U., Bahadir, S., 2012. Zeta Potentials and Isoelectric Points of Biomolecules:
The effects of ion types and ionic strengths. Int. J. Electrochem. Sci. 7, 12404-12414.
Schriks, M., Heringa, M.B., Van der Kooi, M.M.E., De Voogt, P., Van Wezel, A.P., 2010.
Toxicological relevance of emerging contaminants for drinking water quality. Water research.
44, 461-476.
Scott, T.B., Popescu, I.C., Crane, R.A., Noubactep, C., 2011. Nano-scale metallic iron for the
treatment of solutions containing multiple inorganic contaminants. Journal of hazardous
materials. 186, 280-287.
75
Shalini, K., Anwer, Z., Sharma, P.K., Garg, V.K., Numar, N., 2010. A review on pharma
pollution. International Journal of PharmTech Research. 2 (4), 2265-2270.
Shen, Y.F., Tang, J., Nie, Z.H., Wang, Y.D., Ren, Y., Zuo, L., 2009. Preparation and
application of magnetic Fe3O4 nanoparticles for wastewater purification. Separation and
Purification Technology. 68, 312-319.
Silverman, M., Lydecker, M., Lee, P.R., 1992. Bad Medicine: The Prescription Drug Industry
in the Third World. Stanford University Press. pp. 88–90.
Sim, W.J., Lee, J.W., Lee, E.S., Shin, S.K., Hwang, S.R., Oh, J.E., 2011. Occurrence and
distribution of pharmaceuticals in wastewater from households, livestock farms, hospitals and
pharmaceutical manufactures. Chemosphere. 82, 179-186.
Sivasankar, B., 2008. Engineering Chemistry. Tata McGraw Hill Publishing.
Stackelberg, P.E., Furlong, E.T., Meyer, M.T., Zaugg, S.D., Henderson, A.K., 2004.
Persistence of pharmaceutical compounds and other organic wastewater contaminations in a
conventional drinking water treatment plant. USGS Staff-Published Research Paper.443.
Stefusova, K., Vaclavikova, M., Lovas, M., Hredzak, S., 2012. Use of magnetic filtration in
waste water treatment. Acta Montanistica Slovaca. 17 (1), 81-84.
Stoll, S., 2013. The importance of zeta potential measurements and role of ionic strentght in
flocculation processes. Water and Technology, 4 (1), 1-5.
Stuart, M., Lapworth, D, Crane, E., Hart, A., 2012. Review of risk from potential emerging
contaminants in UK groundwater. Science of the Total Environment. 416, 1-21.
Swedish Association of the Pharmaceutical Industry AB, 2004. Swedish environmental
classification of pharmaceuticals. The research-based pharmaceutical industry.
76
Tan, I.A.W., Hameed, B.H., 2010. Adsorption isotherms, kinetics, thermodynamics, and
desorption studies of basic dye on activated carbon derived from oil palm empty fruit bunch.
Journal of Applied Sciences. 10 (21), 2565-2571.
Tang, S.C.N., Lo, I.M.C., 2013. Magnetic nanoparticles: Essential factors for sustainable
environmental applications. Water research. 47, 2613-2632.
Thakkar, K.B., Billa, G., 2013. The concept of: Generic drugs and patented drugs vs. brand
name drugs and non-proprietary (generic) name drugs. Front Pharmacol. 4, 113.
Tremblay, L.A., Stewart, M., Peake, B.M., Gadd, J., Northcott, G., 2011. Review of risks of
emerging organic contaminants and potential impacts to Hawke’s Bay. Prepared for Hawke’s
Bay Regional Council. Cawthron Report No. 1973, 39.
Tolga, Depci, Busetty, S., Yunun, O., 2014. Investigation of the potential of activated and
magnetic activated carbon produced from Turkish lignite as gold adsorbents. Asian journal of
applied sciences. 7(6), 486-498.
United States Environmental Protection Agency, 2008. FACTOIDS: Drinking water and
ground water statistics for 2007. Safe Drinking Water Information System.
United States Environmental Protection Agency, 2015. Ibuprofen- Info for Consumers.
Upadhyayula, V.K.K., Deng, S., Mitchell, M.C., Smith, G.B., 2009. Application of carbon
nanotube technology for removal of contaminants in drinking water: A review. Science of total
environment. 408, 1-13.
Weber, F.A., Aus Der Beek, T., Bergmann, A., Carius, A., Grüttner, G., 2014. Pharmaceuticals
in the environment- the global perspective: Occurrence, effects, and potential cooperative
action under Strategic Approach to International Chemicals Management (SAICM). German
Environment Agency.1-12.
World Health Organization, 2011. Pharmaceuticals in drinking-water. World Health
Organization. 1-49.
77
World Health Organization, 2013. WHO Model List of Essential Medicines. World Health
Organization. 1-47.
Yasser, E.N., Nabila, E.D., 2015. Toxicity of amoxicillin and erythromycin to fish and
mosquitoes. Ecotoxicol.Environ.Contam. 10 (1), 13-21.
Zazouli, M.A., Ulbricht, M., Nasseri, S., Susanto, H., 2010. Effect of hydrophilic and
hydrophobic organic matter on amoxicillin and cephalexin residuals rejection from water by
nano-filtration. Iran J. Environmental Health. Sci. Eng. 7 (1), 15-24.
Zuhlke, S., Dunnbier, U., Heberer, T., 2004. Detection and identification of phenazone-type
drugs and their microbial metabolites in ground water and drinking water applying solid-phase
extraction and gas chromatography with mass spectrometric detection. J. Chromatogr. A. 1050,
201-209.