Embed Size (px)
Citation preview
53
CHAPTER-4
Migration trends in uttar pradesh
Migration from one region to another in search of better employment
opportunities is a general phenomenon. People migrate from the backward
regions to the developed regions as they get more income earning opportunities
there. The slow growth in agriculture and fast growth of industry and services
widen the gap between rural and urban areas and push the rural workforce
towards the urban centres of industrialized regions. Expansion of transport and
communication facilities coupled with industrialization and economic
development have made possible the exodus of large number of people from
villages to towns, from towns to other towns and from one rural area to
another. In addition to fertility and mortality rates, migration is another
component of population growth of any area and it influences size, composition
and distribution of population. Migration is classified into two categories:
migration by birth and migration by place of last residence. In this study,
migration by place of last residence is considered as it provided valuable
information about the internal migration. As discussed elsewhere, there are four
streams of migration: rural to rural, rural to urban, urban to rural and urban to
urban. As the study focuses on rural to urban migration, this chapter gives more
emphasis on rural-urban migration, although other types of migration streams
54
are also discussed in brief. The trends in migration are based on the last two
population censuses.
4.1 TRENDS IN RURAL TO URBAN MIGRATION
Opportunities in urban areas for employment, education, amenities, etc., cause
the rural people to move to the urban areas. In this section, we examine the
trends in rural to urban total migrants and total worker migrants on the basis of
various characteristics of migrants.
4.1.1 Rural to Urban Migration by Place of Last Residence
On the basis of place of last residence, internal migration is classified
into several categories. Table 4.1 shows the trends in the rural to urban
migration in Uttar Pradesh. Total internal migrants, as indicated by last
residence elsewhere in India, increased from 33.91 lakhs in 1991 to
40.15 lakhs in 2001, thus, registering a growth rate of 18.40 percent. It is
also found that the number of female migrants was much higher than
their male counterparts. In case of males, the number increased from
12.07 laks in 1991 to 14.25 lakhs in 2001 while for female, it increased
from 21.83 lakhs to 25.90 lakhs. Since, total migrants comprise both
workers and non-workers, the relatively higher number of female
migrants may be due to marriages. It is significant to note that a very
high proportion of total migrants were having their last residence within
55
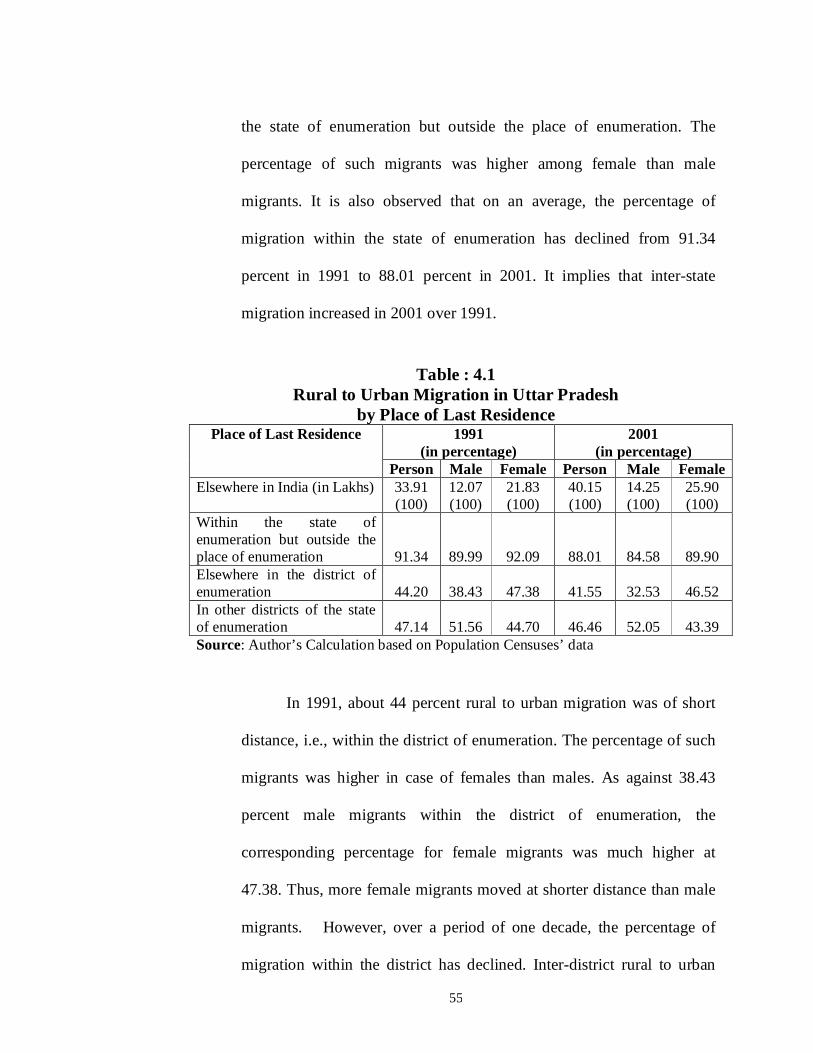
the state of enumeration but outside the place of enumeration. The
percentage of such migrants was higher among female than male
migrants. It is also observed that on an average, the percentage of
migration within the state of enumeration has declined from 91.34
percent in 1991 to 88.01 percent in 2001. It implies that inter-state
migration increased in 2001 over 1991.
Table : 4.1 Rural to Urban Migration in Uttar Pradesh
by Place of Last Residence Place of Last Residence 1991
(in percentage) 2001
(in percentage) Person Male Female Person Male Female
Elsewhere in India (in Lakhs) 33.91 (100)
12.07 (100)
21.83 (100)
40.15 (100)
14.25 (100)
25.90 (100)
Within the state of enumeration but outside the place of enumeration 91.34 89.99 92.09 88.01 84.58 89.90 Elsewhere in the district of enumeration 44.20 38.43 47.38 41.55 32.53 46.52 In other districts of the state of enumeration 47.14 51.56 44.70 46.46 52.05 43.39 Source: Author’s Calculation based on Population Censuses’ data
In 1991, about 44 percent rural to urban migration was of short
distance, i.e., within the district of enumeration. The percentage of such
migrants was higher in case of females than males. As against 38.43
percent male migrants within the district of enumeration, the
corresponding percentage for female migrants was much higher at
47.38. Thus, more female migrants moved at shorter distance than male
migrants. However, over a period of one decade, the percentage of
migration within the district has declined. Inter-district rural to urban
56
migration, as indicated by last residence in other districts of the state of
enumeration, has slightly declined in 2001 over 1991. The percentage of
migrants (person) decreased from 47.14 in 1991 to 46.46. The decline
was only due to deceleration in the percentage of female migrants, as
percentage of male migrants has increased moderately from 51.56 in
1991 to 52.05 in 2001.
4.1.2 Rural to Urban Migration by Duration of Stay
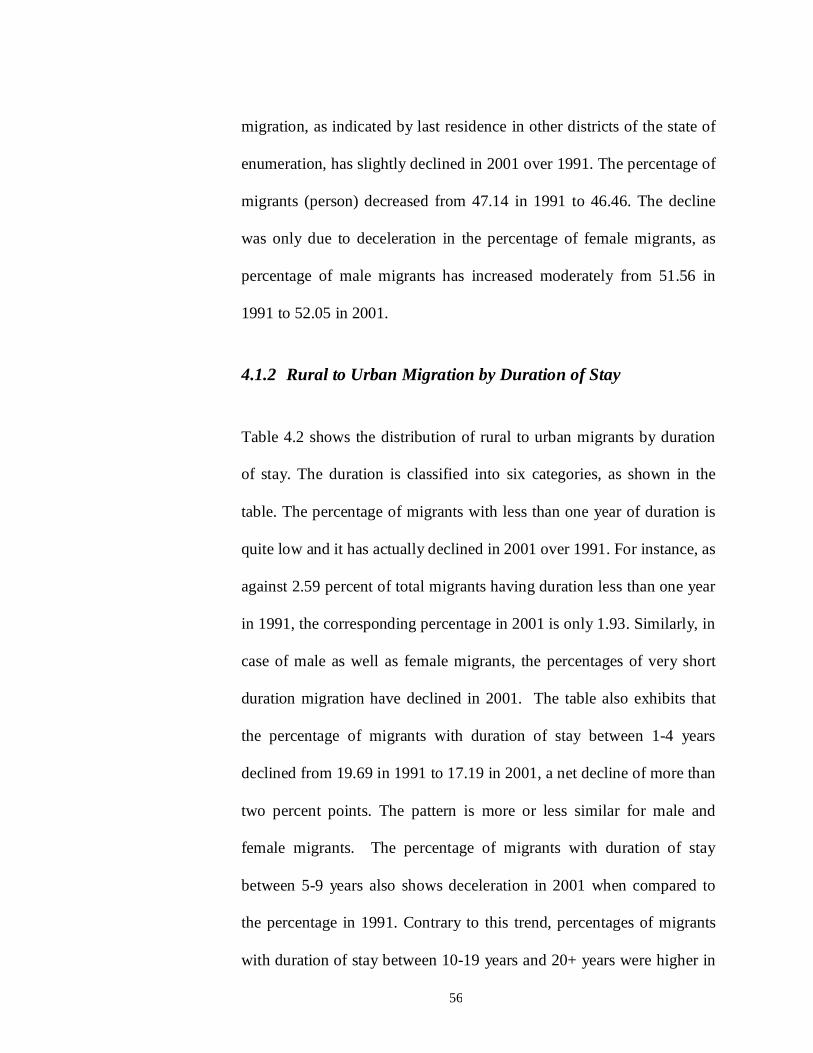
Table 4.2 shows the distribution of rural to urban migrants by duration
of stay. The duration is classified into six categories, as shown in the
table. The percentage of migrants with less than one year of duration is
quite low and it has actually declined in 2001 over 1991. For instance, as
against 2.59 percent of total migrants having duration less than one year
in 1991, the corresponding percentage in 2001 is only 1.93. Similarly, in
case of male as well as female migrants, the percentages of very short
duration migration have declined in 2001. The table also exhibits that
the percentage of migrants with duration of stay between 1-4 years
declined from 19.69 in 1991 to 17.19 in 2001, a net decline of more than
two percent points. The pattern is more or less similar for male and
female migrants. The percentage of migrants with duration of stay
between 5-9 years also shows deceleration in 2001 when compared to
the percentage in 1991. Contrary to this trend, percentages of migrants
with duration of stay between 10-19 years and 20+ years were higher in
57
2001 than in 1991. For instance, the percentage of migrants with 10-19
years duration increased from 24.17 in 1991 to 26.42 in 2001 for person;
from 21.60 in 1991 to 25.76 2001 for male migrants; and from 25.60 in
1991 to 26.78 in 2001 for female migrants. A perusal of the table
reveals that about 50 percent of total migrants have long duration stay
(more than 10 years). The percentage of such migrants is higher for
female than male migrants. On an average, about 8 to 10 percent
migrants could not specify their duration of stay.
Table : 4.2 Trends in Rural to Urban Migrants by Duration of Stay
In Uttar Pradesh Duration of Stay
(in Years) 1991
(in percentage) 2001
(in percentage) Person Male Female Person Male Female
All duration n 33.91 (100)
12.07 (100)
21.83 (100)
40.15 (100)
14.25 (100)
25.90 (100)
< 1 2.59 3.86 1.89 1.93 2.75 1.47 1-4 19.69 24.23 17.18 17.19 21.71 14.71 5-9 16.34 17.09 15.92 15.78 17.56 14.79 10-19 24.17 21.60 25.60 26.42 25.76 26.78 20 + 27.03 18.74 31.61 30.70 22.07 35.44 Duration not stated 10.18 14.48 7.80 7.99 10.14 6.80
4.1.3 Region-wise Trends in Rural to Urban Migration Rates of Total Migrants (RUMT)
As discussed earlier, the State of Uttar Pradesh is divided into four
regions, namely, Western Region (WR), Central Region (CR),
Bundelkhand Region (BK) and Eastern Region (ER). In order to
understand regional pattern of trends in rural to urban migration, we
collected the district-wise data and then estimated the region-wise

58
migration rates. Since sizes of regions in terms of area and population
are different, the estimation of migration rates would neutralize the size
effect and make possible comparison of the results. Rural-urban
migration rate is a ratio of number of rural to urban migrants in a region
to the total urban population of that region, measured in percentage. On
the basis of place of last residence, we can make as many migration
rates as are the categories of place of last residence. In this section, we
consider only two categories, name, place of last residence elsewhere in
India and place of last residence elsewhere within the district of
enumeration. The first rate is based on total internal rural to urban
migration in the state, while the latter refers to the rural to urban
migration within the district of enumeration. It also indicates to the short
distance migration of people from rural to urban areas.
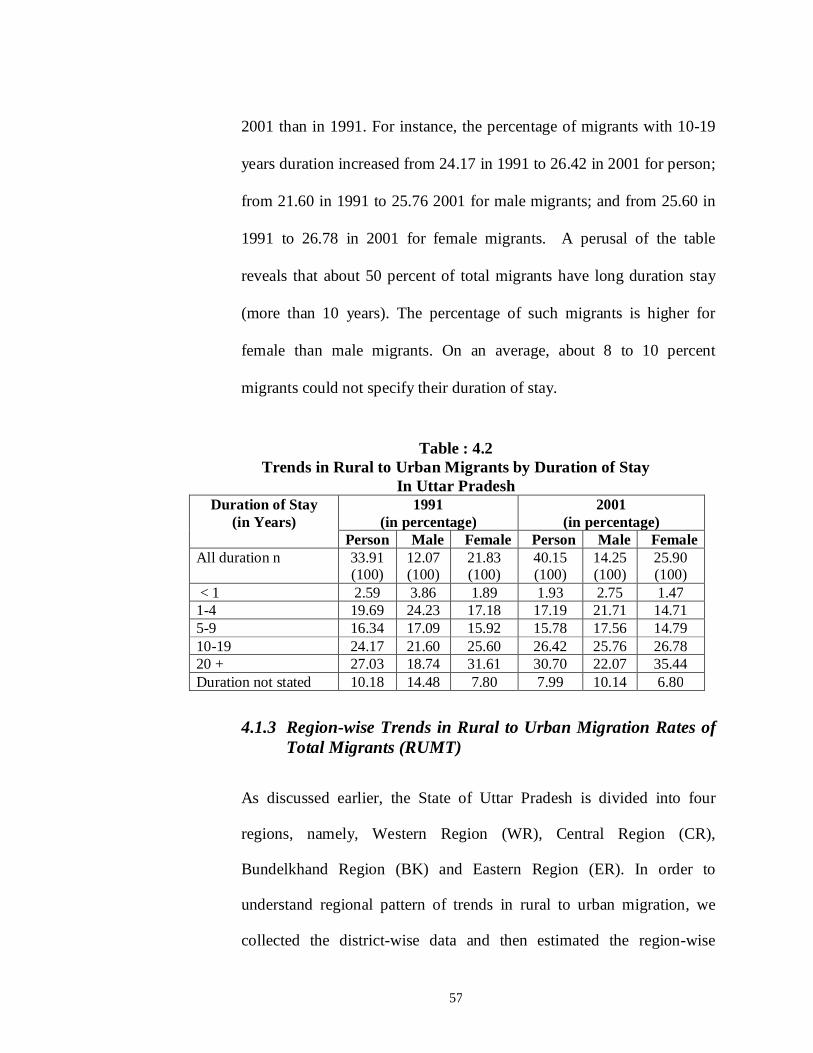
Table 4.3 shows the trends in migration rates based on the last
residence elsewhere in India. At the state level, we do not observe any
perceptible change in the migration rates (person) between two
censuses. However, some variations are observed in case of male and
female migration rates. For instance, the migration rate for male
declined from 8.09 percent in 1991 to 7.40 percent in 2001, whereas the
corresponding rate for female increased slightly from 20.0 percent in
1991 to 20.26 percent in 2001. If we look at region-wise rural-urban
migration rates in 1991, we find that BK has the highest rate (17.63%),
followed by CR (15.40%) and ER (13.64). The most developed WR has
the lowest rate (11.63%). We also notice the gender differences in the
59
migration rates. The female migration rates are found much higher than
the male migration rates. The findings are quite obvious as the female
also migrate due to marriages.
It is significant to note that on an average, the migration rates for person
have declined in CR, BK and ER in 2001 over 1991; while it shows an
increase in the WR. This indicates that during the last one decade,
relatively more people from the rural areas of the country, including the
State, migrated to the urban areas of WR. This is quite understandable as
cities, like, Meerut, Ghaziabad, Noida and Greater Noida have expanded
rapidly during this period and have attracted large number of people
from rural areas. In brief, it may be concluded from Table 4.3 that there
is significant variation in the migration rates across regions; BK and CR
have relatively higher migration rates than the other two regions; and
migration rate slightly declined in 2001 over 1991 at aggregate level.
Further, it is also observed that migration rates for female are higher in
2001 in case of all the regions, except for CR.
Table : 4.3 Region-wise Rural to Urban Migration Rate in Uttar Pradesh
(Based on last Residence Elsewhere In India) Region Census 1991
(in percentage) Census 2001
(in percentage) Person Male Female Person Male Female
WR 11.63 6.65 17.34 12.20 7.00 18.10 CR 15.40 9.77 21.86 14.35 9.28 20.05 BK 17.63 10.79 25.61 17.41 9.53 26.47 ER 13.79 8.02 20.35 13.31 6.54 20.81 Whole UP 13.64 8.09 20.00 13.46 7.40 20.26 Source: Author’s Calculation based on Censuses Data
60
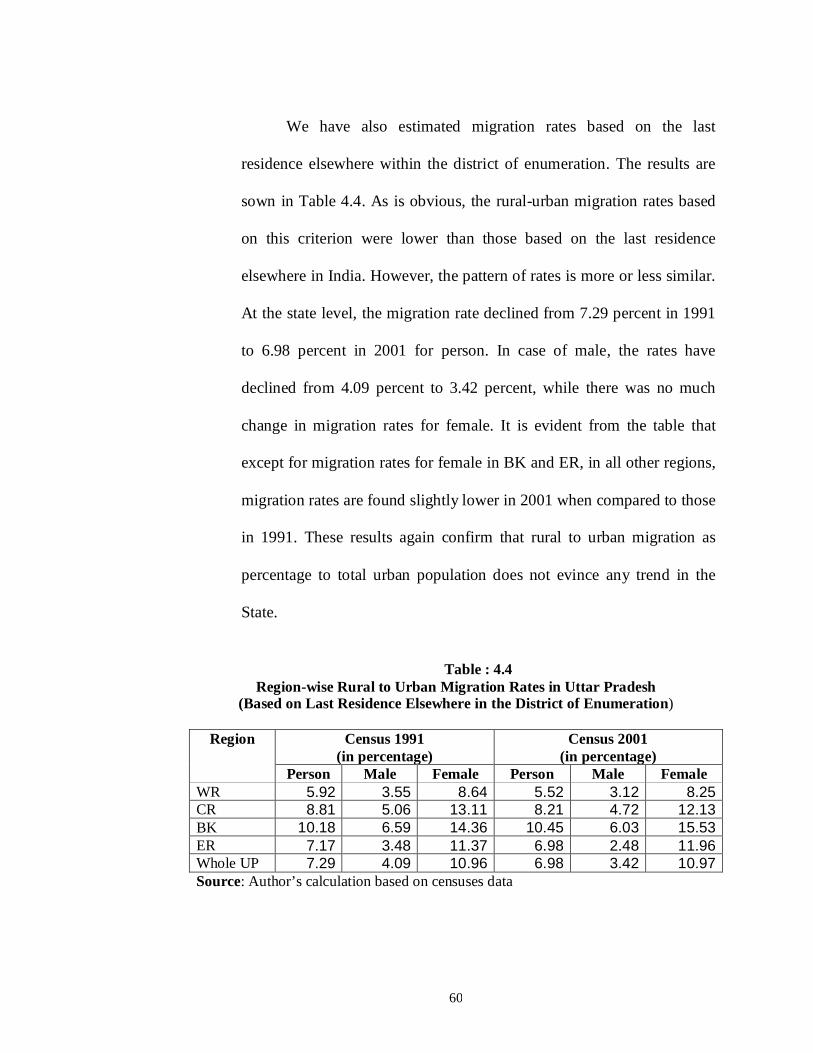
We have also estimated migration rates based on the last
residence elsewhere within the district of enumeration. The results are
sown in Table 4.4. As is obvious, the rural-urban migration rates based
on this criterion were lower than those based on the last residence
elsewhere in India. However, the pattern of rates is more or less similar.
At the state level, the migration rate declined from 7.29 percent in 1991
to 6.98 percent in 2001 for person. In case of male, the rates have
declined from 4.09 percent to 3.42 percent, while there was no much
change in migration rates for female. It is evident from the table that
except for migration rates for female in BK and ER, in all other regions,
migration rates are found slightly lower in 2001 when compared to those
in 1991. These results again confirm that rural to urban migration as
percentage to total urban population does not evince any trend in the
State.
Table : 4.4 Region-wise Rural to Urban Migration Rates in Uttar Pradesh
(Based on Last Residence Elsewhere in the District of Enumeration)
Region Census 1991 (in percentage)
Census 2001 (in percentage)
Person Male Female Person Male Female WR 5.92 3.55 8.64 5.52 3.12 8.25 CR 8.81 5.06 13.11 8.21 4.72 12.13 BK 10.18 6.59 14.36 10.45 6.03 15.53 ER 7.17 3.48 11.37 6.98 2.48 11.96 Whole UP 7.29 4.09 10.96 6.98 3.42 10.97 Source: Author’s calculation based on censuses data
61
4.1.4 Region-wise Trends in Rural to Urban Migration Rates of Workers (RUMW)
In the preceding section, migration rates based on total rural to urban
migrants are discussed. In this section, we examine rural to urban
migration rates of workers only. The migration rate of workers
(RUMW) is estimated rural to urban migrant workers as percentage of
total urban workers. Table 4.5 shows the RUMW rates based on last
residence elsewhere in India. It is significant to note that rural to urban
migration rates of workers have significantly increased in 2001 over
1991 in all the regions of the State. Since, there has not been any
perceptible increase in the rural-urban migration rates of total migrants
in 2001 census over the preceding census, the results shown in Table 4.5
indicate that migration rates of non-workers have declined in 2001 when
compared to 1991. Thus, during the last one decade, more workers
moved from rural to urban area than non-workers.
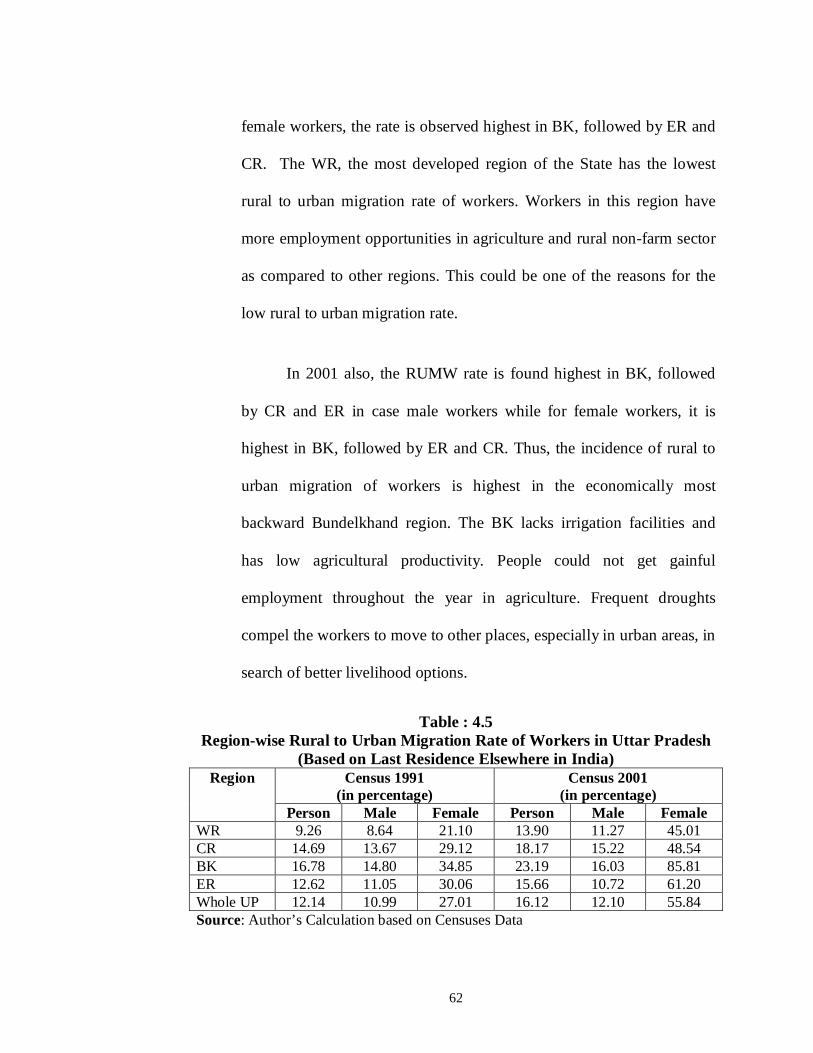
At the state level, RUMW rate for person increased from 12.14
percent in 1991 to 16.12 percent in 2001. The migration rates for male
and female workers increased, respectively, from 10.99 percent and
27.01 percent in 1991 to 12.10 percent and 55.84 percent in 2001. A
region-wise comparison shows that in 1991, BK has the highest
migration rate of workers, followed by CR and ER in case person, while
in case of male workers also, the same pattern is observed. However, for
62
female workers, the rate is observed highest in BK, followed by ER and
CR. The WR, the most developed region of the State has the lowest
rural to urban migration rate of workers. Workers in this region have
more employment opportunities in agriculture and rural non-farm sector
as compared to other regions. This could be one of the reasons for the
low rural to urban migration rate.
In 2001 also, the RUMW rate is found highest in BK, followed
by CR and ER in case male workers while for female workers, it is
highest in BK, followed by ER and CR. Thus, the incidence of rural to
urban migration of workers is highest in the economically most
backward Bundelkhand region. The BK lacks irrigation facilities and
has low agricultural productivity. People could not get gainful
employment throughout the year in agriculture. Frequent droughts
compel the workers to move to other places, especially in urban areas, in
search of better livelihood options.
Table : 4.5 Region-wise Rural to Urban Migration Rate of Workers in Uttar Pradesh
(Based on Last Residence Elsewhere in India) Region Census 1991
(in percentage) Census 2001
(in percentage) Person Male Female Person Male Female
WR 9.26 8.64 21.10 13.90 11.27 45.01 CR 14.69 13.67 29.12 18.17 15.22 48.54 BK 16.78 14.80 34.85 23.19 16.03 85.81 ER 12.62 11.05 30.06 15.66 10.72 61.20 Whole UP 12.14 10.99 27.01 16.12 12.10 55.84 Source: Author’s Calculation based on Censuses Data
63
Table 4.5 also reveals that the migration rates of female workers
are much higher than male workers. What could be the reason for the
high migration rate for female workers? In case of migration rates
estimated on the basis of total migrants, the difference between male and
female migration rate could be attributed due to marriages, but in case of
workers, marriages may partly explain the difference, as some female
who move due to marriages, may enter in the urban job market and push
up the migration rate.
However, the most important reason for the high migration for
female workers seems to be the lower work participation rate of female
than male. Since, rural to urban migration rate is the ratio of rural to
urban migrant workers to the total urban workers, low denominator
(number of urban female workers) increases the rural-urban migration
rate for female, whereas, in case of male workers, the number of rural to
urban migrant workers in relation to total urban male workers is
relatively lower and therefore, the migration rate is also lower.
Table 4.6 shows the short distance migration rates of workers that
are the migration rates based on last residence elsewhere in the district
of enumeration. The table shows that the migration rates of workers vary
across regions. The migration rate for person is found highest in BK,
followed by CR and ER and lowest in WR in both the census. However,
the rates are higher in 2001 than in 1991, indicating that the migration of
workers in the State has increased in 2001 over 1991. The rate increased
64
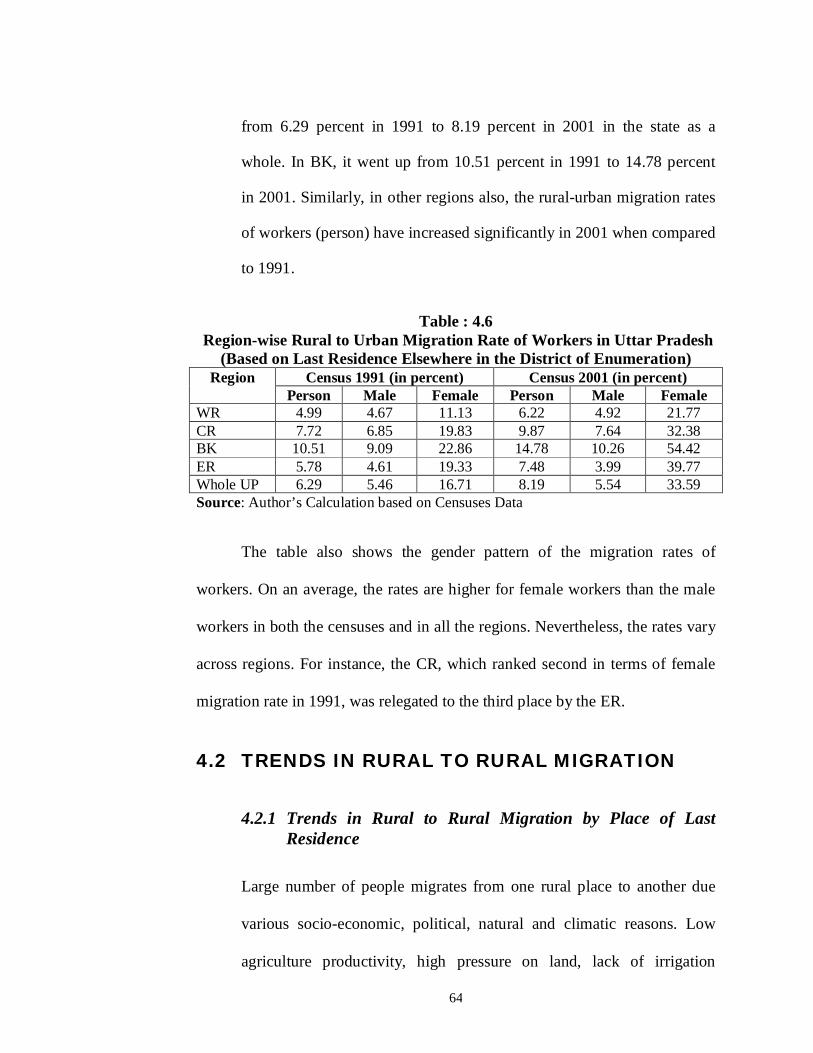
from 6.29 percent in 1991 to 8.19 percent in 2001 in the state as a
whole. In BK, it went up from 10.51 percent in 1991 to 14.78 percent
in 2001. Similarly, in other regions also, the rural-urban migration rates
of workers (person) have increased significantly in 2001 when compared
to 1991.
Table : 4.6 Region-wise Rural to Urban Migration Rate of Workers in Uttar Pradesh
(Based on Last Residence Elsewhere in the District of Enumeration) Region Census 1991 (in percent) Census 2001 (in percent)
Person Male Female Person Male Female WR 4.99 4.67 11.13 6.22 4.92 21.77 CR 7.72 6.85 19.83 9.87 7.64 32.38 BK 10.51 9.09 22.86 14.78 10.26 54.42 ER 5.78 4.61 19.33 7.48 3.99 39.77 Whole UP 6.29 5.46 16.71 8.19 5.54 33.59 Source: Author’s Calculation based on Censuses Data
The table also shows the gender pattern of the migration rates of
workers. On an average, the rates are higher for female workers than the male
workers in both the censuses and in all the regions. Nevertheless, the rates vary
across regions. For instance, the CR, which ranked second in terms of female
migration rate in 1991, was relegated to the third place by the ER.
4.2 TRENDS IN RURAL TO RURAL MIGRATION
4.2.1 Trends in Rural to Rural Migration by Place of Last Residence
Large number of people migrates from one rural place to another due
various socio-economic, political, natural and climatic reasons. Low
agriculture productivity, high pressure on land, lack of irrigation
65
facilities, frequent floods and droughts, etc push the workers to other
rural areas in search of better livelihood. A large number of workers
from rural areas of backward regions, such as, Bihar, Eastern Uttar
Pradesh migrate to the rural areas of Punjab, Western Uttar Pradesh,
Haryana. For non-worker female migrants, marriage is one of the main
reasons for rural to rural migration. Table 4.7 shows the trends in the
rural to rural migration by place of last residence (rural). As is evident
from the table, total internal rural to rural migrants, as indicated by last
residence elsewhere in India, increased from 220.39 lakhs in 1991 to
273.78 lakhs in 2001, thus, registering a growth rate of 16.43 percent. It
is also found that the number of female migrants was much higher than
their male counterparts. In case of male migrants, the number declined
from 19.52 lakhs in 1991 to 17.17 lakhs in 2001 while for female
migrants, it significantly increased from 200.88 lakhs in 1991 to 256.61
lakhs in 2001, a net increase of 27.74 percent. It is significant to note
that male migrants constituted 6.27 percent of total rural to rural
migration in the State in 2001, while their share was 8.86 in the total
rural to rural migration in 1991. Thus, over a period of one decade, rural
to rural migration of males has declined while for females, it has
increased. In 2001, female migrants constituted about 94 percent of total
rural to rural migration in the State.
It is also evident from the table that inter-state rural to rural
migration of people was about 9 percent in 1991 which increased to

66
about 12 percent in 2001. It is also found that inter-state rural to rural
migration is higher for males than females in both the censuses. Thus, a
very high percentage of rural to rural migrants were having their last
residence within the state of enumeration but outside the place of
enumeration. The percentage was higher among female migrants than
male migrants. It is also observed that on an average, the percentage of
migration within the state of enumeration has slightly declined from
95.86 percent in 1991 to 95.24 percent in 2001. If we look at the gender
pattern of rural to rural migration, we find that inter-state migration of
male workers has increased in 2001 over 1991, whereas it has declined
for female migrants. Contrary to this, intra-state rural to rural migration
females has increased in 2001 when compared to that of 1991.
Table : 4.7 Rural to Rural Migration in Uttar Pradesh by Place of Last Residence
Place of Last Residence
1991 (in percentage)
2001 (in percentage)
Person Male Female Person Male Female Elsewhere in India (in Lakhs)
220.39 (100)
19.52 (100)
200.88 (100)
273.78 (100)
17.17 (100)
256.61 (100)
Within the state of enumeration but outside the place of enumeration 95.86 91.47 96.29 95.24 87.13 95.78 Elsewhere in the district of enumeration 69.31 65.90 69.64 70.57 63.02 71.07 In other districts of the state of enumeration 26.55 25.57 26.64 24.67 24.11 24.71 Source: Author’s Calculation based on Censuses Data
Table 4.7 shows that in 1991, 69.31 percent rural to rural
migration was of short distance, i.e., within the district of enumeration.
67
The percentage of such migrants was higher in case of females than
males. As against 65.90 percent male migrants within the district of
enumeration, the corresponding percentage for female migrants was
higher at 69.64. In 2001, the percentage increased to 71.07 for female
migrants and went down to 63.02 for male migrants. Thus, over a period
of one decade, the percentage of migration within the district has
increased mainly due to increase in percentage of female migrants as
percentage of male migrants declined in 2001. Inter-district rural to rural
migration, as indicated by last residence in other districts of the state of
enumeration, has slightly declined in 2001 over 1991. The percentage of
migrants (person) decreased from 26.55 in 1991 to 24.67 in 2001. It is
concluded from the above analysis that rural to rural migration is
basically intra-district and inter-district; and 92 to 94 percent of total
rural to rural migrants in the state were women.
4.2.2 Trends in Rural to Rural Migration by Duration of Stay
Table 4.8 shows the distribution of rural to rural migrants by duration of
stay. The duration is classified into six categories, as shown in the table.
The percentage of migrants with less than one year of duration is quite
low and it has slightly declined for female and increased for male in
2001 over 1991. The similar trend is also observed for the percentage of
migrants with duration of stay between 1-4 years. For example, the
percentage of male migrants with duration of stay between 1-4 years has
68
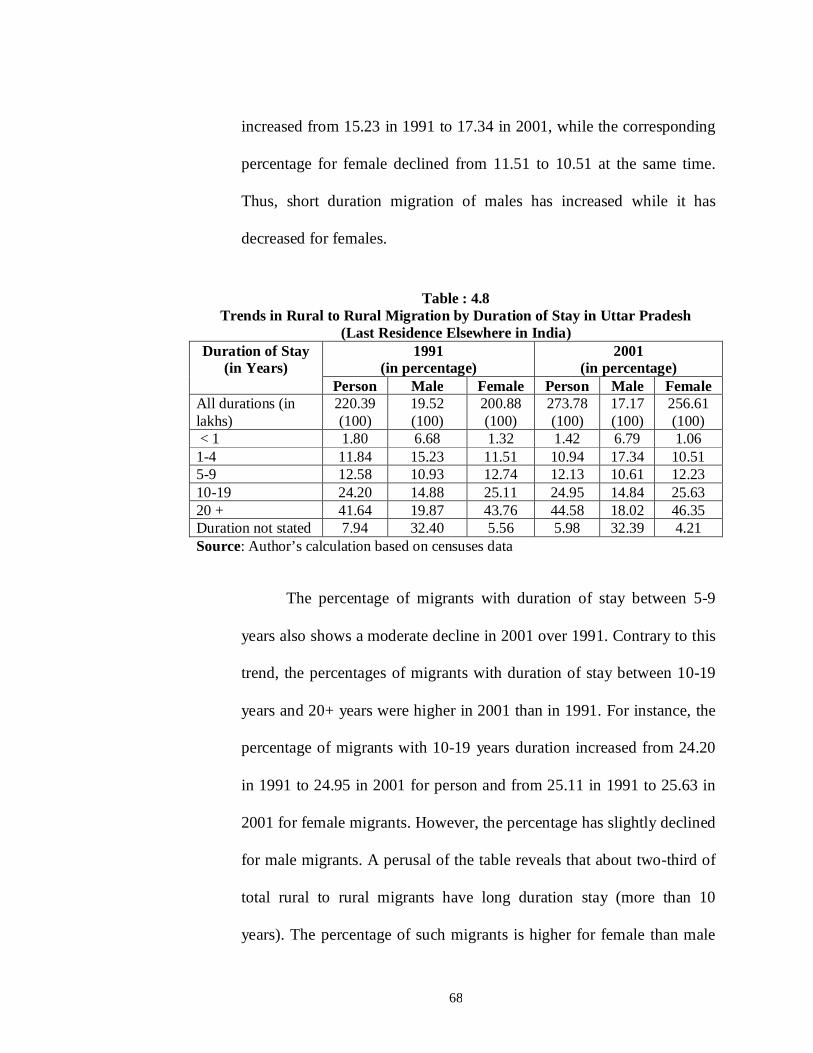
increased from 15.23 in 1991 to 17.34 in 2001, while the corresponding
percentage for female declined from 11.51 to 10.51 at the same time.
Thus, short duration migration of males has increased while it has
decreased for females.
Table : 4.8 Trends in Rural to Rural Migration by Duration of Stay in Uttar Pradesh
(Last Residence Elsewhere in India) Duration of Stay
(in Years) 1991
(in percentage) 2001
(in percentage) Person Male Female Person Male Female
All durations (in lakhs)
220.39 (100)
19.52 (100)
200.88 (100)
273.78 (100)
17.17 (100)
256.61 (100)
< 1 1.80 6.68 1.32 1.42 6.79 1.06 1-4 11.84 15.23 11.51 10.94 17.34 10.51 5-9 12.58 10.93 12.74 12.13 10.61 12.23 10-19 24.20 14.88 25.11 24.95 14.84 25.63 20 + 41.64 19.87 43.76 44.58 18.02 46.35 Duration not stated 7.94 32.40 5.56 5.98 32.39 4.21 Source: Author’s calculation based on censuses data
The percentage of migrants with duration of stay between 5-9
years also shows a moderate decline in 2001 over 1991. Contrary to this
trend, the percentages of migrants with duration of stay between 10-19
years and 20+ years were higher in 2001 than in 1991. For instance, the
percentage of migrants with 10-19 years duration increased from 24.20
in 1991 to 24.95 in 2001 for person and from 25.11 in 1991 to 25.63 in
2001 for female migrants. However, the percentage has slightly declined
for male migrants. A perusal of the table reveals that about two-third of
total rural to rural migrants have long duration stay (more than 10
years). The percentage of such migrants is higher for female than male
69
migrants. On an average, about 8 migrants in 1991 and 6 percent in 2001
could not specify their duration of stay. The percentage of such migrants
is quite high for males.
4.3 TRENDS IN URBAN TO RURAL MIGRATION
4.3.1 Trends in Urban to Rural Migration by Place of Last Residence
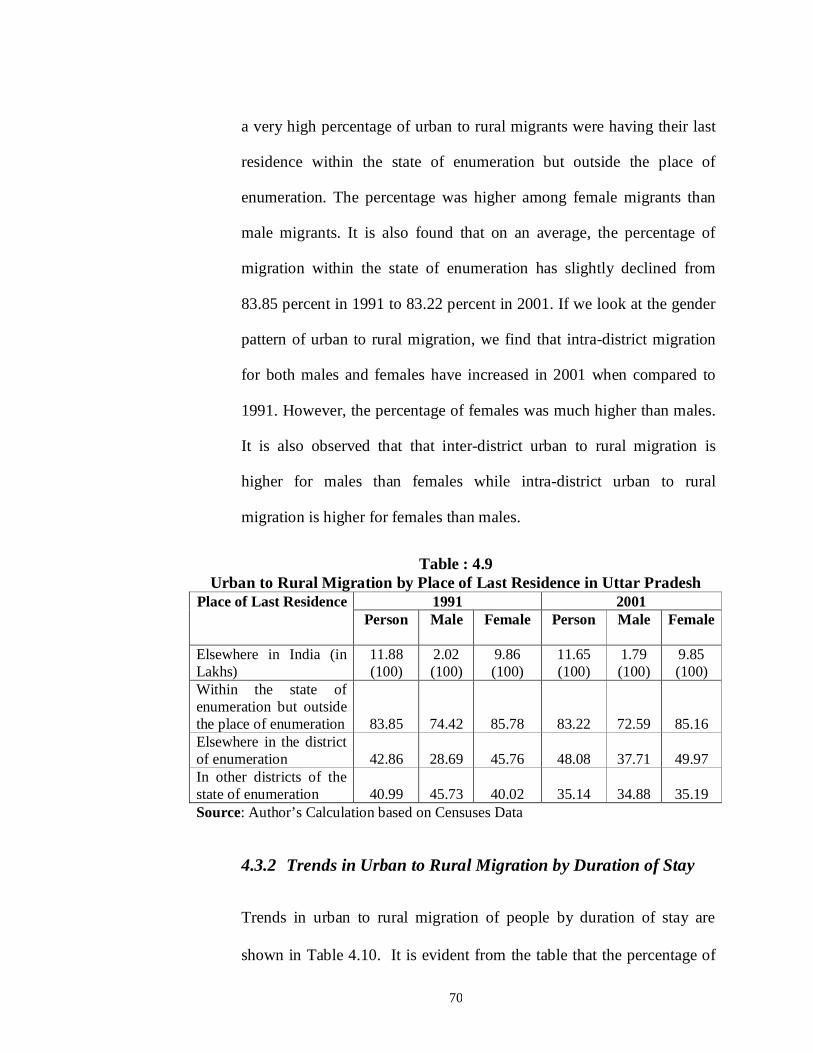
Migration of urban people to rural areas is relatively low. Table 4.9
shows the trends in the urban to rural migration by place of last
residence (urban). As is evident from the table, total internal urban to
rural migrants, as indicated by last residence elsewhere in India,
declined from 11.88 lakhs in 1991 to 11.65 lakhs in 2001. It is also
found that the number of female migrants was much higher than their
male counterparts. In case of male migrants, the number declined from
2.02 lakhs in 1991 to 1.79 lakhs in 2001 while for female migrants, it
remained more or less same. The share of male migrants in total urban
to rural migration declined from 17 percent in 1991 to 15.36 percent in
2001. Thus, over a period of one decade, urban to rural migration of
males has declined while for females, it has increased. In 2001, female
migrants constituted about 85 percent of total urban to rural migration in
the State. It is also evident from the table that inter-state urban to rural
migration of people was 16.15 percent in 1991 which slightly increased
to 16.78 percent in 2001. It is also observed that inter-state urban to rural
migration was higher for males than females in both the censuses. Thus,
70
a very high percentage of urban to rural migrants were having their last
residence within the state of enumeration but outside the place of
enumeration. The percentage was higher among female migrants than
male migrants. It is also found that on an average, the percentage of
migration within the state of enumeration has slightly declined from
83.85 percent in 1991 to 83.22 percent in 2001. If we look at the gender
pattern of urban to rural migration, we find that intra-district migration
for both males and females have increased in 2001 when compared to
1991. However, the percentage of females was much higher than males.
It is also observed that that inter-district urban to rural migration is
higher for males than females while intra-district urban to rural
migration is higher for females than males.
Table : 4.9 Urban to Rural Migration by Place of Last Residence in Uttar Pradesh
Place of Last Residence 1991 2001 Person Male Female Person Male Female
Elsewhere in India (in Lakhs)
11.88 (100)
2.02 (100)
9.86 (100)
11.65 (100)
1.79 (100)
9.85 (100)
Within the state of enumeration but outside the place of enumeration 83.85 74.42 85.78 83.22 72.59 85.16 Elsewhere in the district of enumeration 42.86 28.69 45.76 48.08 37.71 49.97 In other districts of the state of enumeration 40.99 45.73 40.02 35.14 34.88 35.19 Source: Author’s Calculation based on Censuses Data
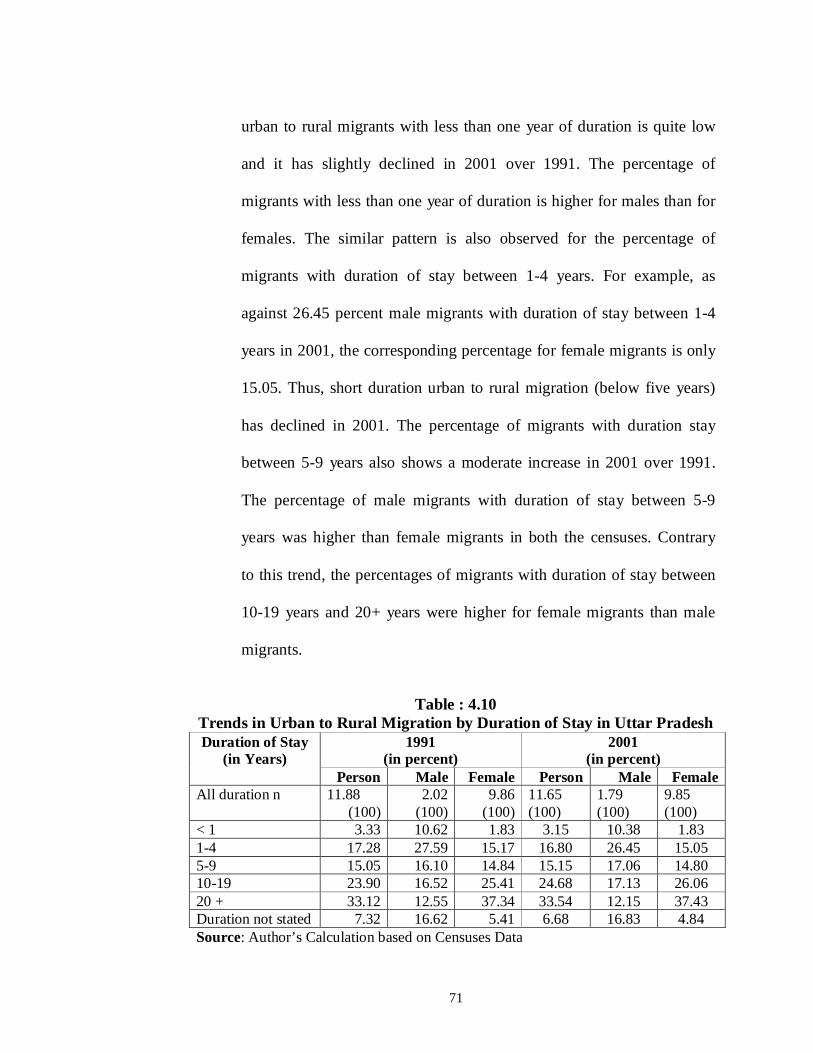
4.3.2 Trends in Urban to Rural Migration by Duration of Stay
Trends in urban to rural migration of people by duration of stay are
shown in Table 4.10. It is evident from the table that the percentage of
71
urban to rural migrants with less than one year of duration is quite low
and it has slightly declined in 2001 over 1991. The percentage of
migrants with less than one year of duration is higher for males than for
females. The similar pattern is also observed for the percentage of
migrants with duration of stay between 1-4 years. For example, as
against 26.45 percent male migrants with duration of stay between 1-4
years in 2001, the corresponding percentage for female migrants is only
15.05. Thus, short duration urban to rural migration (below five years)
has declined in 2001. The percentage of migrants with duration stay
between 5-9 years also shows a moderate increase in 2001 over 1991.
The percentage of male migrants with duration of stay between 5-9
years was higher than female migrants in both the censuses. Contrary
to this trend, the percentages of migrants with duration of stay between
10-19 years and 20+ years were higher for female migrants than male
migrants.
Table : 4.10
Trends in Urban to Rural Migration by Duration of Stay in Uttar Pradesh Duration of Stay
(in Years) 1991
(in percent) 2001
(in percent) Person Male Female Person Male Female
All duration n 11.88 (100)
2.02 (100)
9.86 (100)
11.65 (100)
1.79 (100)
9.85 (100)
< 1 3.33 10.62 1.83 3.15 10.38 1.83 1-4 17.28 27.59 15.17 16.80 26.45 15.05 5-9 15.05 16.10 14.84 15.15 17.06 14.80 10-19 23.90 16.52 25.41 24.68 17.13 26.06 20 + 33.12 12.55 37.34 33.54 12.15 37.43 Duration not stated 7.32 16.62 5.41 6.68 16.83 4.84 Source: Author’s Calculation based on Censuses Data
72
It is also apparent from the data given in Table 4.10 that the percentages
of migrants with long duration of stay were higher in 2001 than in 1991. For
instance, the percentage of migrants with 10-19 years duration increased from
23.90 in 1991 to 24.68 in 2001 for person; from 16.52 in 1991 to 17.13 in 2001
for male migrants; and from 25.41 in 1991 to 26.06 in 2001 for female
migrants. A perusal of the table reveals that about 57 to 58 percent of total
urban to rural migrants have long duration stay (more than 10 years). The
percentage of such migrants is much higher for female than male migrants. On
an average, about 7 percent urban to rural migrants could not specify their
duration of stay. The percentage of such migrants is higher for males than
females.
4.4 TRENDS IN URBAN TO URBAN MIGRATION
4.4.1 Trends in Urban to Urban Migration by Place of Last Residence
Urban to Urban migration is general phenomenon in an emerging
economy. People migrate from one urban area to another in search of
better employment opportunities. Localization and concentration of
industries in some regions attract the workers of required skills from
other regions to these regions. For example, Banglore, Hyderabad,
Chennai, Noida, Gurgoan, Mumbai, Poona, Chandigarh, etc., have
become the major urban centres for information technology related
services which create lots of employment opportunities in software and
hardware services to engineers and technocrats. Table 4.11 shows the
73
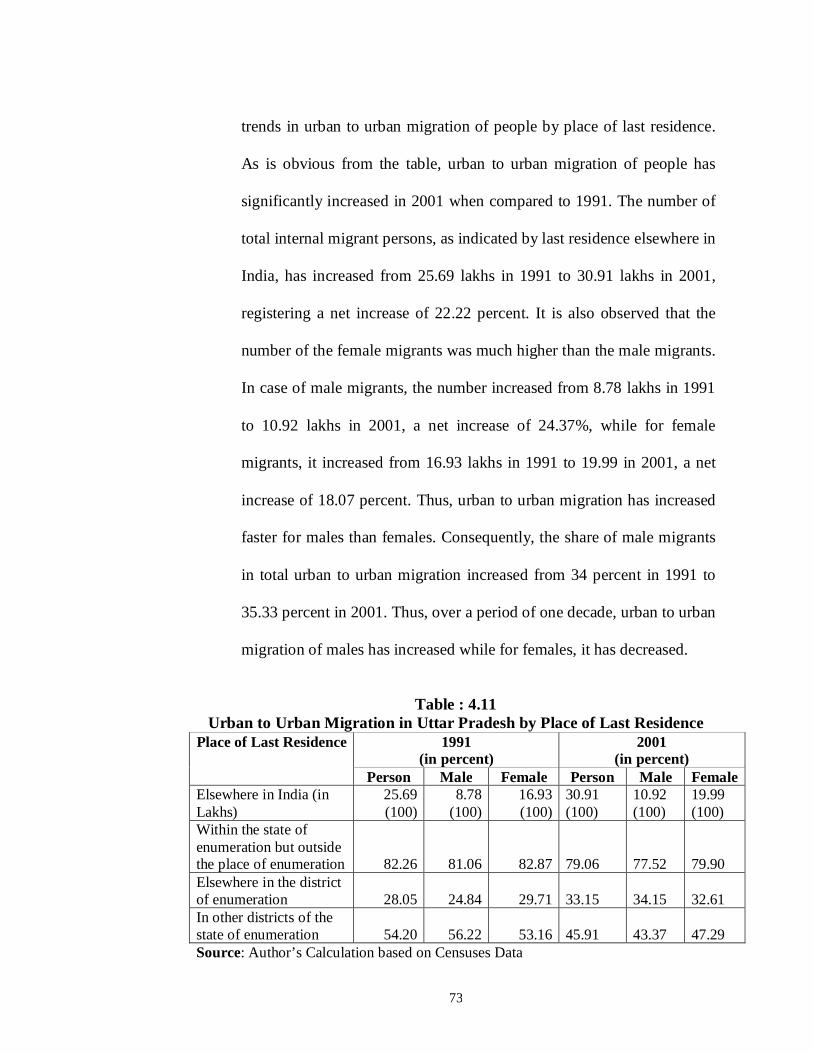
trends in urban to urban migration of people by place of last residence.
As is obvious from the table, urban to urban migration of people has
significantly increased in 2001 when compared to 1991. The number of
total internal migrant persons, as indicated by last residence elsewhere in
India, has increased from 25.69 lakhs in 1991 to 30.91 lakhs in 2001,
registering a net increase of 22.22 percent. It is also observed that the
number of the female migrants was much higher than the male migrants.
In case of male migrants, the number increased from 8.78 lakhs in 1991
to 10.92 lakhs in 2001, a net increase of 24.37%, while for female
migrants, it increased from 16.93 lakhs in 1991 to 19.99 in 2001, a net
increase of 18.07 percent. Thus, urban to urban migration has increased
faster for males than females. Consequently, the share of male migrants
in total urban to urban migration increased from 34 percent in 1991 to
35.33 percent in 2001. Thus, over a period of one decade, urban to urban
migration of males has increased while for females, it has decreased.
Table : 4.11
Urban to Urban Migration in Uttar Pradesh by Place of Last Residence Place of Last Residence 1991
(in percent) 2001
(in percent) Person Male Female Person Male Female
Elsewhere in India (in Lakhs)
25.69 (100)
8.78 (100)
16.93 (100)
30.91 (100)
10.92 (100)
19.99 (100)
Within the state of enumeration but outside the place of enumeration 82.26 81.06 82.87 79.06 77.52 79.90 Elsewhere in the district of enumeration 28.05 24.84 29.71 33.15 34.15 32.61 In other districts of the state of enumeration 54.20 56.22 53.16 45.91 43.37 47.29 Source: Author’s Calculation based on Censuses Data
74
Inter-state urban to urban migration of people has increased from
17.74 percent in 1991 to 20.94 percent in 2001. It is also observed that
inter-state urban to urban migration was higher for males than females in
both the censuses. The table also indicates that about 82 percent urban to
urban migrants in 1991 and 79 percent in 2001 were having their last
residence within the state of enumeration but outside the place of
enumeration. This implies that urban to urban migration within the State
is quite high. However, the percentage was slightly higher for females
than males. It is also found that on an average, the percentage of
migration within the state of enumeration has declined in 2001 over
1991. If we look at the gender pattern of urban to urban migration, we
find that intra-district migration for both males and females have
increased in 2001. However, the percentage of females was higher than
males. It is significant to note that about 54 percent of total urban to
urban migration of persons in 1991 was in other districts of the state.
The percentage of such migrants was higher for males than females.
Further, the table shows that the percentage of urban to urban migration
in other district of the state has declined in 2001. The decline was higher
for males than females.
4.4.2 Trends in Urban to Urban Migration by Duration of Stay
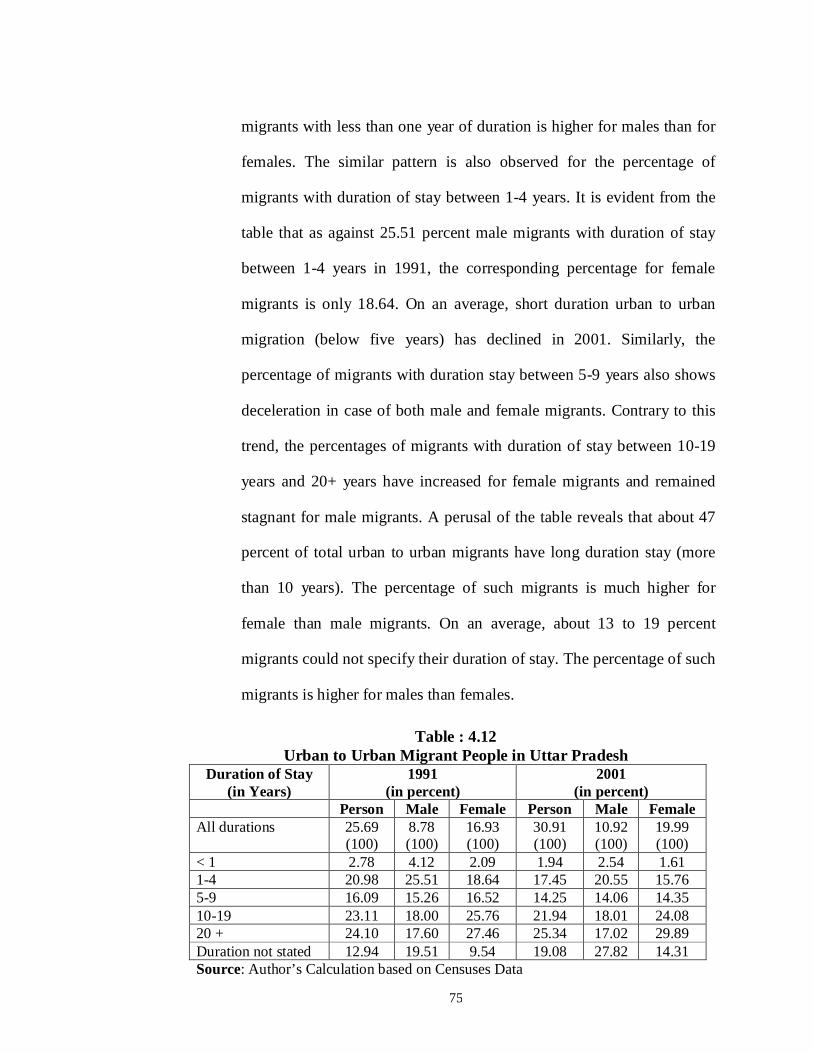
Trends in urban to rural migration of people by duration of stay are
shown in Table 4.12. It is evident from the table that the percentage of
urban to urban migrants with less than one year of duration is quite low
and it has significantly declined in 2001. Further, the percentage of
75
migrants with less than one year of duration is higher for males than for
females. The similar pattern is also observed for the percentage of
migrants with duration of stay between 1-4 years. It is evident from the
table that as against 25.51 percent male migrants with duration of stay
between 1-4 years in 1991, the corresponding percentage for female
migrants is only 18.64. On an average, short duration urban to urban
migration (below five years) has declined in 2001. Similarly, the
percentage of migrants with duration stay between 5-9 years also shows
deceleration in case of both male and female migrants. Contrary to this
trend, the percentages of migrants with duration of stay between 10-19
years and 20+ years have increased for female migrants and remained
stagnant for male migrants. A perusal of the table reveals that about 47
percent of total urban to urban migrants have long duration stay (more
than 10 years). The percentage of such migrants is much higher for
female than male migrants. On an average, about 13 to 19 percent
migrants could not specify their duration of stay. The percentage of such
migrants is higher for males than females.
Table : 4.12 Urban to Urban Migrant People in Uttar Pradesh
Duration of Stay (in Years)
1991 (in percent)
2001 (in percent)
Person Male Female Person Male Female All durations 25.69
(100) 8.78 (100)
16.93 (100)
30.91 (100)
10.92 (100)
19.99 (100)
< 1 2.78 4.12 2.09 1.94 2.54 1.61 1-4 20.98 25.51 18.64 17.45 20.55 15.76 5-9 16.09 15.26 16.52 14.25 14.06 14.35 10-19 23.11 18.00 25.76 21.94 18.01 24.08 20 + 24.10 17.60 27.46 25.34 17.02 29.89 Duration not stated 12.94 19.51 9.54 19.08 27.82 14.31 Source: Author’s Calculation based on Censuses Data
76
4.5 TRENDS IN TOTAL MIGRATION BY PLACE OF LAST RESIDENCE
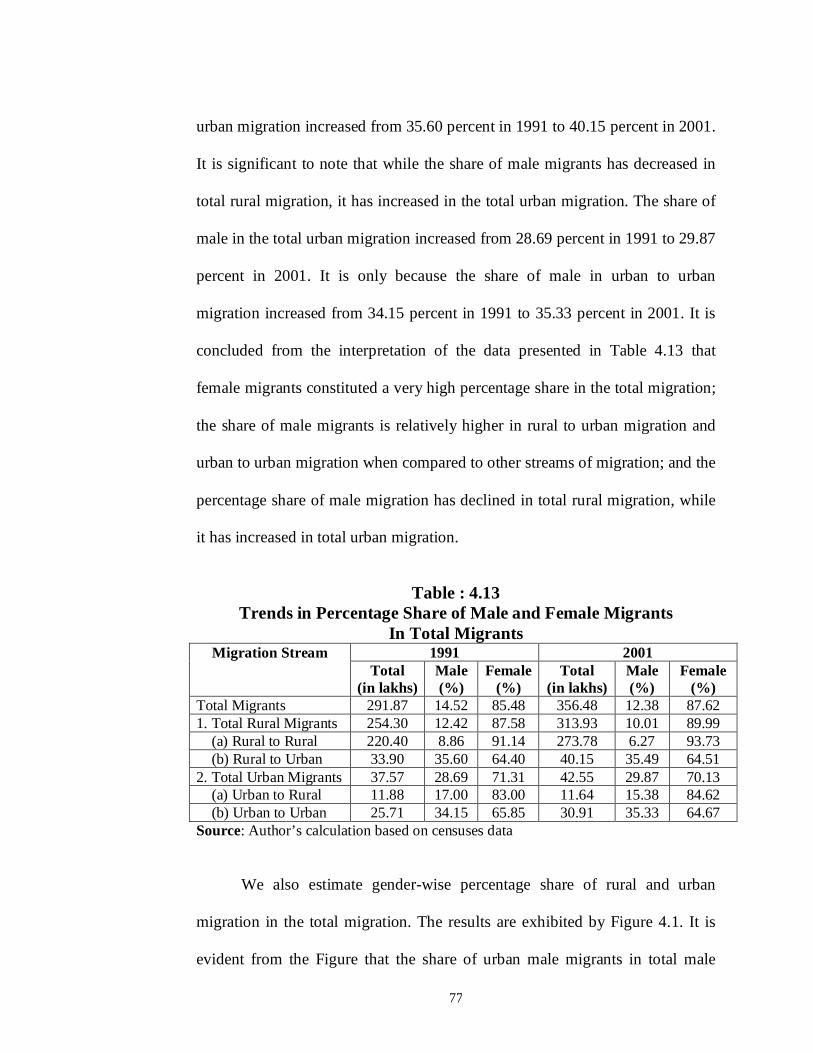
Table 4.13 shows the trends in total migration and gender pattern of migration
of different streams. Total migration in the State has increased from 291.87
lakhs in 1991 to 356.48 lakhs in 2001, thus registering a net increase of 22.14
percent. Total rural migration increased from 254.30 lakhs in 1991 to 313.93
lakhs in 2001, a net increase of 23.45%, while total urban migration went up
from 37.57 lakhs in 1991 to 42.55 lakhs in 2001 (13.26%). Thus, urban
migration grew at a slower rate than the rural migration. Out of total rural
migration, rural to urban migration constituted 13.33 percent in 1991. Its share
declined marginally to 12.79 percent in 2001. Thus, basically rural migration
in the State is rural to rural. The percentage share of urban to rural migration
decelerated from 31.62 in 1991 to 27.36 in 2001. Thus, the percentage shares
of both rural to urban and urban to rural migrants have declined in the State of
Uttar Pradesh, while the corresponding shares of rural to rural and urban to
urban have increased.
Table 4.13 also presents the gender pattern of migration in the state. It is
evident from the table that the share of male migrants in total migration has
declined from 14.52 percent in 1991 to 12.38 percent in 2001. Their share in
total rural migration also decelerated, as is evident from the table. The
percentage share of male migrants in total rural to rural migration also declined
from 8.86 in 1991 to 6.27 in 2001. Contrary to this, the share of male in rural to
77
urban migration increased from 35.60 percent in 1991 to 40.15 percent in 2001.
It is significant to note that while the share of male migrants has decreased in
total rural migration, it has increased in the total urban migration. The share of
male in the total urban migration increased from 28.69 percent in 1991 to 29.87
percent in 2001. It is only because the share of male in urban to urban
migration increased from 34.15 percent in 1991 to 35.33 percent in 2001. It is
concluded from the interpretation of the data presented in Table 4.13 that
female migrants constituted a very high percentage share in the total migration;
the share of male migrants is relatively higher in rural to urban migration and
urban to urban migration when compared to other streams of migration; and the
percentage share of male migration has declined in total rural migration, while
it has increased in total urban migration.
Table : 4.13 Trends in Percentage Share of Male and Female Migrants
In Total Migrants Migration Stream 1991 2001
Total (in lakhs)
Male (%)
Female (%)
Total (in lakhs)
Male (%)
Female (%)
Total Migrants 291.87 14.52 85.48 356.48 12.38 87.62 1. Total Rural Migrants 254.30 12.42 87.58 313.93 10.01 89.99 (a) Rural to Rural 220.40 8.86 91.14 273.78 6.27 93.73 (b) Rural to Urban 33.90 35.60 64.40 40.15 35.49 64.51 2. Total Urban Migrants 37.57 28.69 71.31 42.55 29.87 70.13 (a) Urban to Rural 11.88 17.00 83.00 11.64 15.38 84.62 (b) Urban to Urban 25.71 34.15 65.85 30.91 35.33 64.67 Source: Author’s calculation based on censuses data
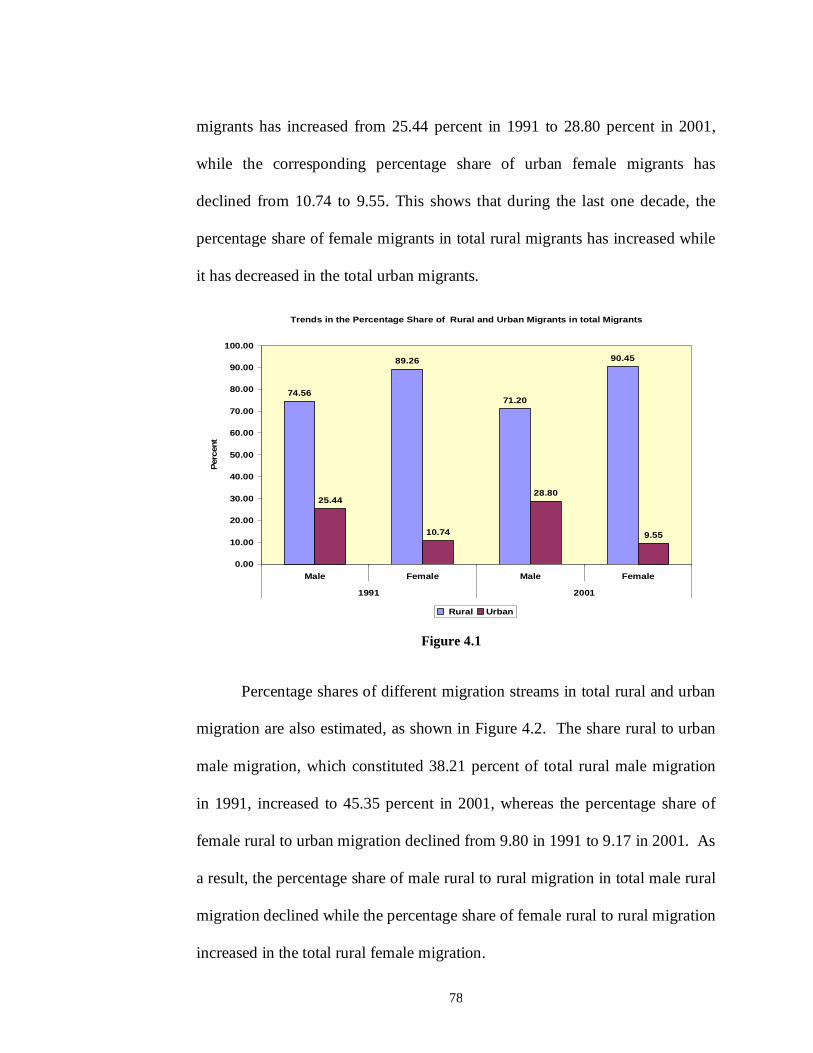
We also estimate gender-wise percentage share of rural and urban
migration in the total migration. The results are exhibited by Figure 4.1. It is
evident from the Figure that the share of urban male migrants in total male
78
migrants has increased from 25.44 percent in 1991 to 28.80 percent in 2001,
while the corresponding percentage share of urban female migrants has
declined from 10.74 to 9.55. This shows that during the last one decade, the
percentage share of female migrants in total rural migrants has increased while
it has decreased in the total urban migrants.
Trends in the Percentage Share of Rural and Urban Migrants in total Migrants
74.56
89.26
71.20
90.45
25.44
10.74
28.80
9.55
0.00
10.00
20.00
30.00
40.00
50.00
60.00
70.00
80.00
90.00
100.00
Male Female Male Female
1991 2001
Perc
ent
Rural Urban Figure 4.1
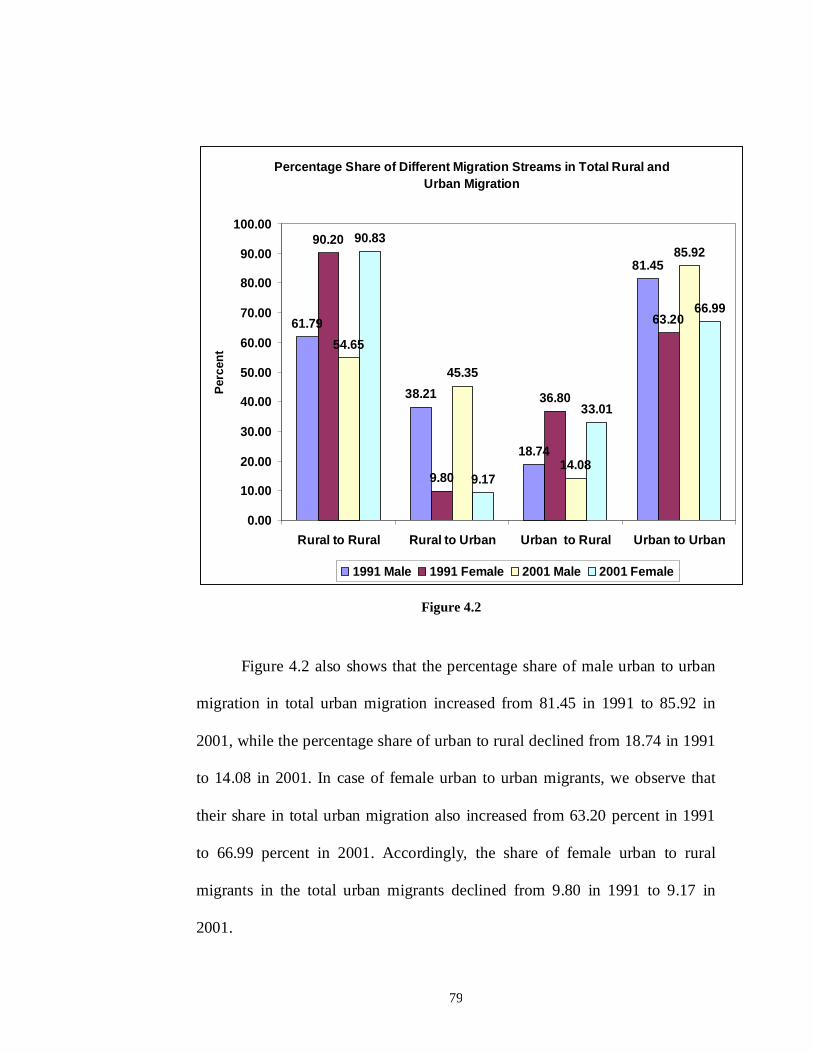
Percentage shares of different migration streams in total rural and urban
migration are also estimated, as shown in Figure 4.2. The share rural to urban
male migration, which constituted 38.21 percent of total rural male migration
in 1991, increased to 45.35 percent in 2001, whereas the percentage share of
female rural to urban migration declined from 9.80 in 1991 to 9.17 in 2001. As
a result, the percentage share of male rural to rural migration in total male rural
migration declined while the percentage share of female rural to rural migration
increased in the total rural female migration.
79
Percentage Share of Different Migration Streams in Total Rural and Urban Migration
61.79
38.21
18.74
81.45
90.20
9.80
36.80
63.20
54.65
45.35
14.08
85.9290.83
9.17
33.01
66.99
0.00
10.00
20.00
30.00
40.00
50.00
60.00
70.00
80.00
90.00
100.00
Rural to Rural Rural to Urban Urban to Rural Urban to Urban
Perc
ent
1991 Male 1991 Female 2001 Male 2001 Female
Figure 4.2
Figure 4.2 also shows that the percentage share of male urban to urban
migration in total urban migration increased from 81.45 in 1991 to 85.92 in
2001, while the percentage share of urban to rural declined from 18.74 in 1991
to 14.08 in 2001. In case of female urban to urban migrants, we observe that
their share in total urban migration also increased from 63.20 percent in 1991
to 66.99 percent in 2001. Accordingly, the share of female urban to rural
migrants in the total urban migrants declined from 9.80 in 1991 to 9.17 in
2001.
80
4.6 SUMMING UP
This chapter examines the trends in rural to urban, rural to rural, urban to rural
and urban to urban migration in the State. The trends are based on two
population censuses, namely, 1991 and 2001. The analysis of migration data is
based on place of last residence criterion. Since, the main focus of the study is
on rural to urban migration, the detailed discussion have been made on this
stream of migration. Region-wise and gender-wise trends in the rural to urban
migration have been estimated. The results show that percentage of rural to
urban migration rates vary across regions. Bundelkhand, the economically most
backward region of the state has the highest rural to urban migration rate,
followed by Central Region and Eastern Region. The most developed Western
Region has the lowest rural to urban migration rate. The study also finds that
the migration rate for females is much higher than the males in all the regions.
The study further shows that about 50 percent of total rural to urban migrants
have long duration stay (more than 10 years). The percentage of such migrants
is higher for female than male migrants. The results confirm that rural to urban
total migration (RUMT) rate does not evince any trend, whereas, rural-urban
migration rate of workers (RUMW) has increased significantly in all the
regions of the State in 2001 over 1991.
The study also finds that rural to rural migration of males has declined
while for females, it has increased. Further, inter-state rural to rural migration
is found higher for males than females in both the censuses. The gender pattern
81
of rural to rural migration indicates that the inter-state migration of males has
increased in 2001 over 1991, whereas it has declined for females. Contrary to
this, intra-state rural to rural migration of females has increased. It is also
observed that the short duration rural to rural migration of males has increased
while it has declined for females. About two-third of total rural to rural
migrants have long duration stay (more than 10 years). The percentage of such
migrants is found higher for female than male migrants. In case of urban to
rural migration, we observe that it has declined for males and increased for
females. Inter-district urban to rural migration is found higher for males, while
intra-district urban to rural migration is observed higher for females. Further,
the percentage of urban to rural migrants with long duration of stay has
increased in 2001 over 1991.
Urban to urban migration of males has increased while for females, it
has decreased. If we look at the gender pattern of urban to urban migration, we
find that intra-district urban to urban migration for both males and females
have increased in 2001. However, the percentage of females was higher than
males. On an average, percentages of short term (below five years) and
medium-term (5-9 years) urban to urban migration have declined both for
males and females, while the percentage of long term migration (10 years and
above) has increased for females, but remained stagnant for males.
The percentage shares of both rural to urban and urban to rural
migration have declined, while the corresponding shares of rural to rural and

82
urban to urban have increased. The share of male migrants has decreased in
total rural migration and increased in the total urban migration. Female
migrants constituted a very high percentage share in the total migration. The
share of males is found relatively higher in rural to urban and urban to urban
migration. Further, the percentage share of female migrants in total rural
migration has increased while it has decreased in the total urban migrants.
****