Embed Size (px)
Citation preview

NationalLevel 13, 440 Collins Street Melbourne VIC 3000 GPO Box 2117 Melbourne VIC 3001 Telephone 03 9662 3544 Email [email protected]
New South Wales and the ACTLevel 14 The John Hunter Building 9 Hunter Street Sydney NSW 2000 GPO Box 2100 Sydney NSW 2001 Telephone 02 9299 7022 Email [email protected]
QueenslandLevel 17, 300 Adelaide Street Brisbane QLD 4000 GPO Box 2900 Brisbane QLD 4001 Telephone 07 3229 9955 Email [email protected]
South Australia and the Northern TerritoryLevel 5 2 Ebenezer Place Adelaide SA 5000 Telephone 08 8211 7222 Email [email protected]
Victoria and TasmaniaLevel 13 440 Collins Street Melbourne VIC 3000 GPO Box 2117 Melbourne VIC 3001 Telephone 03 9662 3544 Email [email protected]
Western AustraliaLevel 5 105 St Georges Terrace Perth WA 6000 PO Box 5631 St Georges Tce Perth WA 6831 Telephone 08 9226 4799 Email [email protected]
Migration: the economic debate
November 2016M
IGR
AT
ION
: TH
E E
CO
NO
MIC
DE
BA
TE
NO
VE
MB
ER
20
16
WITH SUPPORT FROM

Migration: the economic debate
November 2016

M i g r a t i o n : t h e e c o n o M i c d e b a t e
2
About this publicationMigration: the economic debate © CEDA 2016 ISBN: 0 85801 309 6
The views expressed in this document are those of the authors, and should not be attributed to CEDA. CEDA’s objective in publishing this collection is to encourage constructive debate and discussion on matters of national economic importance. Persons who rely upon the material published do so at their own risk.
Design: Robyn Zwar Graphic Design
Photography:Page 31: NAA: A12111, 1/1954/4/53, Migrant arrivals in Australia – the 50,000th Dutch migrant arrives in Australia aboard the SIBAJAK, 1954.
43: Lukas Coch, AAP Image. Seasonal workers pick grapes outside Canberra, 2015.
81: Richard Milnes, AAP Image. Protest against the High Court’s decision regarding the 267 refugees facing deportation, Sydney, February 2016.
All other images: iStock Photo Library and CEDA library.
About CEDACEDA – the Committee for Economic Development of Australia – is a national, independent, member-based organisation providing thought leadership and policy perspectives on the economic and social issues affecting Australia.
We achieve this through a rigorous and evidence-based research agenda, and forums and events that deliver lively debate and critical perspectives.
CEDA’s membership includes 750 of Australia’s leading businesses and organisations, and leaders from a wide cross-section of industries and academia. It allows us to reach major decision makers across the private and public sectors.
CEDA is an independent not-for-profit organisation, founded in 1960 by leading Australian economist Sir Douglas Copland. Our funding comes from membership fees, events and sponsorship.
CEDA – the Committee for Economic Development of AustraliaLevel 13, 440 Collins Street Melbourne 3000 Australia Telephone: +61 3 9662 3544 Email: [email protected] Web: ceda.com.au

M i g r a t i o n : t h e e c o n o M i c d e b a t e
3
Forewords 4
Executive summary 6
Recommendations 8
Contributions 12
CEDA overview 14
Chapter 1 31attitudes to australia’s immigration policy Professor Andrew Markus, Monash University
Chapter 2 43australia’s de facto low skilled migration programsDr Anna Boucher, Senior Lecturer, University of Sydney
Chapter 3 55redesigning australia’s labour migration programDr Joanna Howe, Associate Professor, University of Adelaide
Chapter 4 67Skilled migration and australia’s productivitySue Regan, Analyst, Crawford School of Public Policy, Australian National University Dean Parham, non-resident Research Fellow, University of Adelaide
Chapter 5 81ensuring immigration benefits allProfessor Glenn Withers AO, Professor of Economics, Research School of Economics and Crawford School of Public Policy, Australian National University and Visiting Professor, Tongji University, Shanghai
Acknowledgements 100
Contents

M i g r a t i o n : t h e e c o n o M i c d e b a t e
4
Concern over migration both domestically and internationally
has been increasing, driven by fear-mongering coupled with
genuine community (albeit misplaced) concern about secu-
rity. However, despite this, Australia’s migration program is
considered world leading, and its contribution to Australia’s
economic sustainability genuine.
That does not mean it is problem free.
CEDA has undertaken this report because public policy improvements are
needed to ensure previous strong community support for migration is re-estab-
lished; fair treatment for both temporary and permanent migrants; and that the
country continues to reap the economic benefits from the skills that a balanced
migration program brings.
The report in fact shows how with the right policies, annual permanent migration
intakes could be doubled over the next 40 years and deliver significant per capita
economic activity. Seventeen recommendations are presented. These range
from:
• Influencing Australia’s settlement pattern, with particular beneficial impacts of
migration in regions and Northern Australia;
• Consideration of the impact of the current migration program on Melbourne and
Sydney and subsequent future infrastructure and services requirements;
• Providing a more robust model for determining occupation shortages with
respect of 457 visas;
• Shifting to a universal points test for permanent skilled migrants and tightening
entry requirements relating to age, skills and English-language proficiency;
• Reviewing and capping the working holiday visa program and possibly intro-
ducing a purpose built guest worker program for specific industries struggling
to attract adequate low-skilled workers;
• Increasing penalties for exploiting migrant workers; and
• Improving settlement services and support, access to English language pro-
grams and recognition of foreign qualifications.
Migration has been a significant driver for our economy. Fine tuning what is con-
sidered a world-leading immigration system will continue to deliver economic
improvements for all Australians.
As always I hope you find this a valuable resource and it can contribute to a rea-
soned, fact-based and constructive debate on this important topic.
Foreword: Professor the Hon. Stephen Martin Chief Executive, CEDA

M i g r a t i o n : t h e e c o n o M i c d e b a t e
5
Migration has played a central role in Australia’s economic
development and is pivotal to our celebrated cultural diversity.
Australia’s sustained prosperity over the last 25 years has
been supported by migration – and particularly the movement
of temporary labour. It is therefore no surprise that migration
is generally well supported by the Australian community; but
what of its role in Australia’s future?
Across the 160 jurisdictions in which Fragomen provides immigration services,
we have directly seen how the opening and levelling of international trade has
necessitated a rethink of the design of migration programs, with ramifications also
for a range of domestic policy areas.
As a medium-sized economic power, Australia’s migration program must perform
better than simply screening migrants for their prospects of immediate employ-
ment. It must compete effectively against other countries and be part of a holistic
approach to create an environment that attracts and supports talented people
from around the world, with the ideas and entrepreneurism to develop the emerg-
ing industries of Australia’s future.
For the migration program to remain effective and maintain community support,
it must be agile enough to adapt to technological change and a burgeoning “gig”
economy. As technology disrupts the way in which we all engage in work, new job
categories are appearing and evolving as quickly as old ones disappear. Current
visa programs do not accommodate the fast changing work arrangements that
drive productivity and innovation.
While trade in services constitutes 70 per cent of our domestic economy, it
accounts for only 30 per cent of our exports. Services are often pointed to as an
area of significant potential growth for Australia – and this necessarily involves the
international movement of people both in and out of Australia.
This report contains insightful commentary on the impacts of migration to-date. It
does not shy away from challenges we face in designing a migration program for
the future while re-examining the role of temporary migrants in filling shortages in
lower skilled work. Critical areas for consideration include:
• The type of economy and society Australia might want;
• The workforce we need to get there; and
• How migration can contribute to that vision, for the benefit of all.
I would like to thank the authors of this report and the CEDA advisory group for
this significant contribution.
Foreword: Alex Paterson, Co-Managing Partner of Australia and New Zealand, Fragomen

M i g r a t i o n : t h e e c o n o M i c d e b a t e
6
Executive summary
Australia has absorbed an estimated 10 million settlers since the First Fleet
arrived in 1788. The majority of these settlers, some seven million, have come
to Australia since 1945.
Post-World War II, the immigration program was focused on nation building. Over
time, the “populate or perish” approach was replaced with a focus on Australia
developing a predominantly skill-based formal selection system for permanent
migration.
Australia now takes a disproportionately large component of the world’s migra-
tion flows, with significant economic and social consequences for the country.
Despite Australia comprising only 0.3 per cent of the world’s population, 2.8 per
cent of the world’s immigrants live in Australia. There are now more people living
in Australia who were born overseas, as a portion of the population, than at any
other time in the last 130 years. This is the highest portion in the world, after
Israel.
The migration program has favoured skilled migrants over family reunion since
1997–98. Over this century there have been 1,464,622 skilled migrant visas
issued with 753,691 family stream visas. Over the same period, 205,987 humani-
tarian visas were issued, slightly more than nine per cent of the total visas issued
this century.
In line with global trends in people movement, temporary migration has become
the dominate element of Australia’s immigration program. Strong demand growth
M i g r a t i o n : t h e e c o n o M i c d e b a t e
7
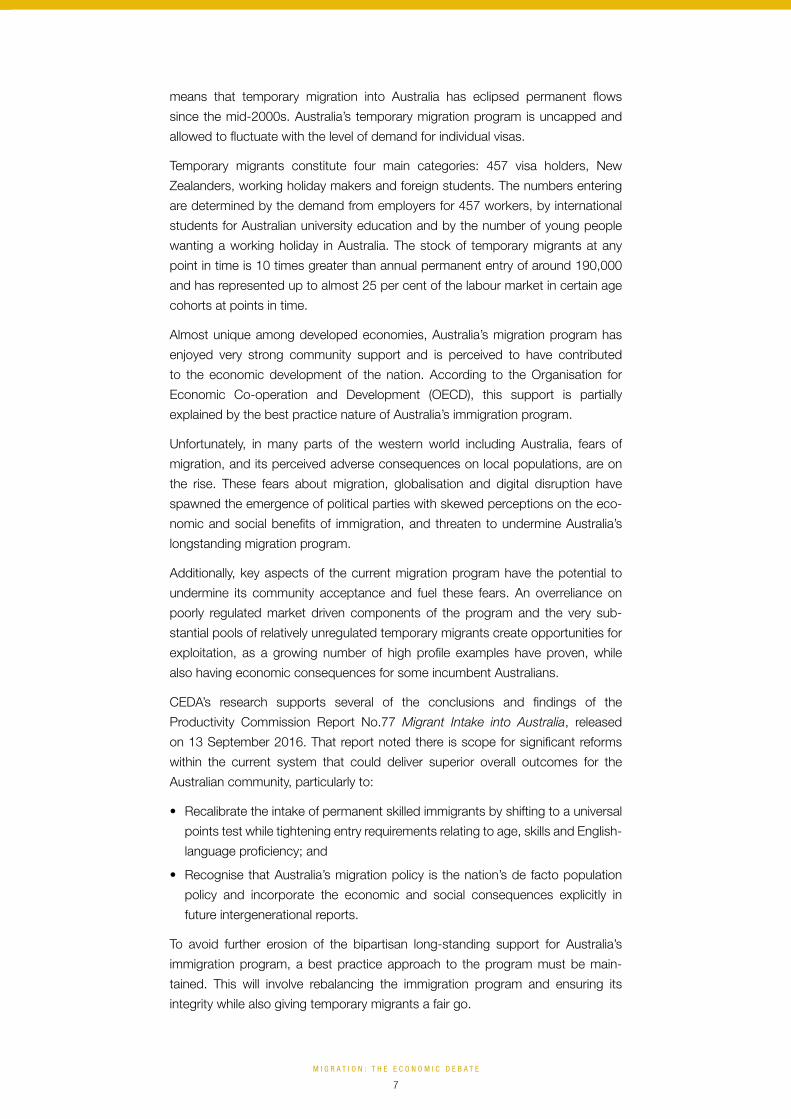
means that temporary migration into Australia has eclipsed permanent flows
since the mid-2000s. Australia’s temporary migration program is uncapped and
allowed to fluctuate with the level of demand for individual visas.
Temporary migrants constitute four main categories: 457 visa holders, New
Zealanders, working holiday makers and foreign students. The numbers entering
are determined by the demand from employers for 457 workers, by international
students for Australian university education and by the number of young people
wanting a working holiday in Australia. The stock of temporary migrants at any
point in time is 10 times greater than annual permanent entry of around 190,000
and has represented up to almost 25 per cent of the labour market in certain age
cohorts at points in time.
Almost unique among developed economies, Australia’s migration program has
enjoyed very strong community support and is perceived to have contributed
to the economic development of the nation. According to the Organisation for
Economic Co-operation and Development (OECD), this support is partially
explained by the best practice nature of Australia’s immigration program.
Unfortunately, in many parts of the western world including Australia, fears of
migration, and its perceived adverse consequences on local populations, are on
the rise. These fears about migration, globalisation and digital disruption have
spawned the emergence of political parties with skewed perceptions on the eco-
nomic and social benefits of immigration, and threaten to undermine Australia’s
longstanding migration program.
Additionally, key aspects of the current migration program have the potential to
undermine its community acceptance and fuel these fears. An overreliance on
poorly regulated market driven components of the program and the very sub-
stantial pools of relatively unregulated temporary migrants create opportunities for
exploitation, as a growing number of high profile examples have proven, while
also having economic consequences for some incumbent Australians.
CEDA’s research supports several of the conclusions and findings of the
Productivity Commission Report No.77 Migrant Intake into Australia, released
on 13 September 2016. That report noted there is scope for significant reforms
within the current system that could deliver superior overall outcomes for the
Australian community, particularly to:
• Recalibrate the intake of permanent skilled immigrants by shifting to a universal
points test while tightening entry requirements relating to age, skills and English-
language proficiency; and
• Recognise that Australia’s migration policy is the nation’s de facto population
policy and incorporate the economic and social consequences explicitly in
future intergenerational reports.
To avoid further erosion of the bipartisan long-standing support for Australia’s
immigration program, a best practice approach to the program must be main-
tained. This will involve rebalancing the immigration program and ensuring its
integrity while also giving temporary migrants a fair go.

M i g r a t i o n : t h e e c o n o M i c d e b a t e
8
Recommendations
Rebalancing immigration
Australia’s temporary migration program is uncapped and allowed to fluctuate
with the level of demand for individual visas. Several significant issues arise from
the current system.
With respect to the management of 457 visas, allowing employer attestation to
determine which occupations are in shortage is inappropriate. Provided an occu-
pation is listed on the Consolidated Sponsored Occupation List (CSOL) and a
457 visa holder is paid a higher annual wage than the Temporary Income Skilled
Migration Threshold (currently set at $53,900 per annum), an employer is able to
hire a 457 visa holder. Existing labour market testing that is as weak as an adver-
tisement, of indeterminate length, on a social media platform is deemed to be
sufficient. In contrast the OECD suggests that independent labour market testing
is preferable for identifying labour shortages.
Ensuring workers are treated fairly and in accordance with legislative requirements
has become a significant issue. More than one tenth of all complaints received by
the Fair Work Ombudsman (FWO) were from temporary visa holders, with many
high-profile cases that have exposed how temporary workers are being exploited.
It is important to end the exploitation of temporary workers. The community
requires confidence that the migration program is operating with integrity.

M i g r a t i o n : t h e e c o n o M i c d e b a t e
9
Drawing on the proposals put forward in Chapter Three, Redesigning Australia’s labour migration program in national interest by Associate Professor Joanna Howe, CEDA recommends that to ensure the demand driven component of the migration program is robust, the government should:
• Reconstitute the membership and accountability of the existing Ministerial
Advisory Council on Skilled Migration so that it provides objective and evi-
dence based independent advice on which occupations are experiencing
shortages. This would involve:
1. Having equal membership from both industry and unions, as well as inde-
pendent experts in labour migration from relevant fields, demography,
economics and law;
2. Having an evidence-based approach to gathering information on which
occupations should form part of the occupational shortage list, relying on
subjective input from stakeholders through a formal and transparent sub-
missions process and on economic data; and
3. Ensuring that the processes, deliberations, findings and recommendations
of the Council are accessible to the public.
Drawing on Boucher and Howe’s recommendations in Chapter Two and Chapter Three, to ensure the integrity of the temporary migration program, the government should:
4. Cap the working holiday visa program; and
5. Have the Ministerial Advisory Council on Skilled Migration be responsible
for examining the labour market impact of visas with a non-work purpose
but which allow the performance of work in the Australian economy (such
as visas for backpackers and international students).
If these approaches do not restore the integrity of the migration program then CEDA recommends, as suggested by Boucher in Chapter Two:
6. A purpose-built guest worker program should be considered to meet the
needs of specific industries struggling to attract adequate low-skilled
workers.
To improve the capacity of the FWO to deal with exploitation, as suggested by Howe in Chapter Three, the relevant legislation should be amended to:
7. Increase penalties for exploiting migrant workers; and
8. Protect the privacy of migrant workers so that their complaints are treated
confidentially through a one-way flow of information from the Department of
Immigration and Border Protection (DIBP) to FWO.
Temporary migrants should enjoy the same standard of workplace regulations
as the rest of the country. The concept of fairness has been a touchstone for
Australian labour law but temporary migrants do not fully benefit from it.

M i g r a t i o n : t h e e c o n o M i c d e b a t e
10
To improve the fairness of employment outcomes for temporary workers:
9. The notion of according fairness to the parties involved in migration should
inform the interpretation of the stated purposes in the Migration Act in
regulating labour migration and should be used to influence the making of
migration laws and policies; and
10. A new purpose should be added to the legislation giving effect to the
principle that Australia’s labour migration program should seek to ensure a
fairer distribution of the prosperity that the migration process creates and
to make clear that migrant workers are entitled to a fair go just like their
Australian counterparts.
A greater Australia
At different junctures of recent history, an inevitable debate has emerged con-
cerning what might constitute an appropriate population level for Australia. A
significant component of this debate has centred on the contribution migration
has and can make.
Economic modelling generally shows that the benefits of migration are relatively
small and any net benefits are captured by the immigrants themselves. However,
recent modelling conducted for the Immigration Council incorporating agglomera-
tion benefits associated with migration finds a more significant net contribution to
the Australian economy.
As explored in Chapter Five, Ensuring immigration benefits all by Professor Glenn
Wither, and Chapter Four, Skilled migration and Australia’s productivity by Dean
Parham and Sue Regan, Australia’s existing population benefits from the eco-
nomic activity generated from migrants and the influx of skills and abilities they
bring. The focus on skilled immigration has skewed the economic outcomes in
the nation’s favour. On average migrants have been more productive than non-
migrants, as measured by earnings, and have increased their productivity more
rapidly than non-migrants.
Echoing Professor Wither’s recommendations, to enhance the capacity of migrants to make a productive contribution to Australia the government should:
11. Shift immigration administration to a more welcoming and supportive
orientation and ensure enhanced integration with improved settlement
services and support.
In addition, it is recommended that the government should:
12. Improve the access to English-language programs, such as the Adult
Migrant English Program, as suggested by Regan and Parham in Chapter
Four; and
13. Facilitate the recognition of foreign qualifications to enable migrants to
make the most of their skills and education.
M i g r a t i o n : t h e e c o n o M i c d e b a t e
11
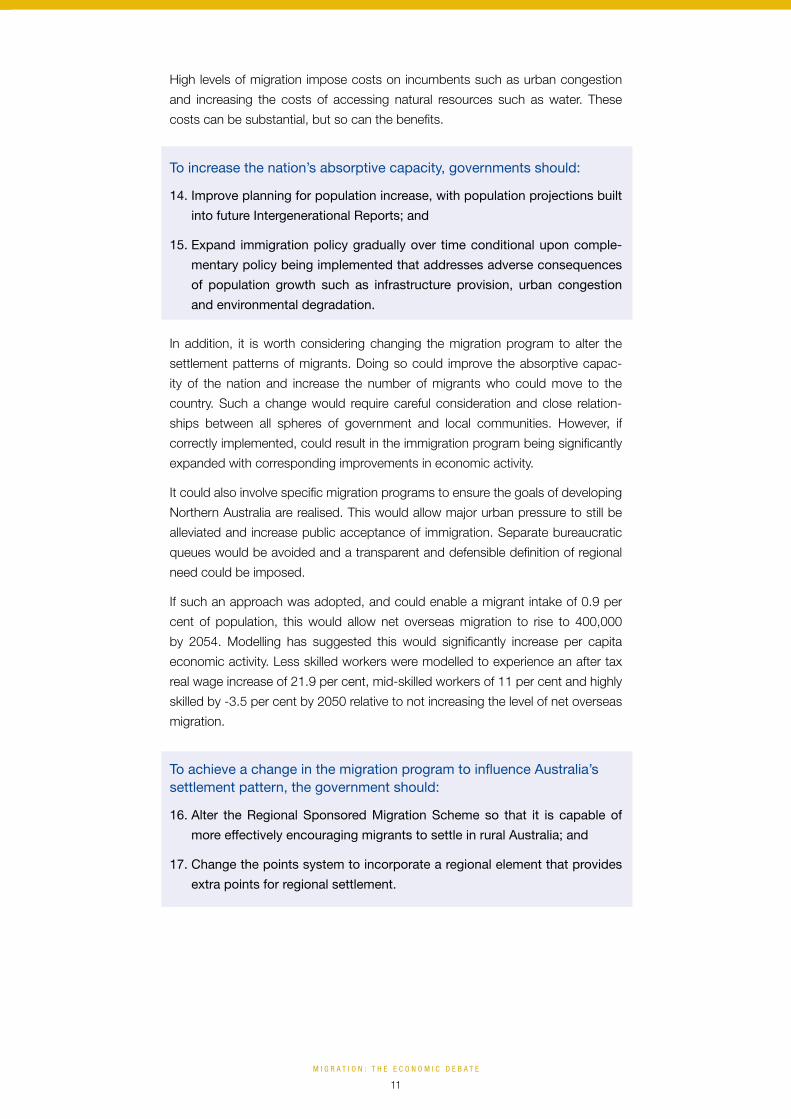
High levels of migration impose costs on incumbents such as urban congestion
and increasing the costs of accessing natural resources such as water. These
costs can be substantial, but so can the benefits.
To increase the nation’s absorptive capacity, governments should:
14. Improve planning for population increase, with population projections built
into future Intergenerational Reports; and
15. Expand immigration policy gradually over time conditional upon comple-
mentary policy being implemented that addresses adverse consequences
of population growth such as infrastructure provision, urban congestion
and environmental degradation.
In addition, it is worth considering changing the migration program to alter the
settlement patterns of migrants. Doing so could improve the absorptive capac-
ity of the nation and increase the number of migrants who could move to the
country. Such a change would require careful consideration and close relation-
ships between all spheres of government and local communities. However, if
correctly implemented, could result in the immigration program being significantly
expanded with corresponding improvements in economic activity.
It could also involve specific migration programs to ensure the goals of developing
Northern Australia are realised. This would allow major urban pressure to still be
alleviated and increase public acceptance of immigration. Separate bureaucratic
queues would be avoided and a transparent and defensible definition of regional
need could be imposed.
If such an approach was adopted, and could enable a migrant intake of 0.9 per
cent of population, this would allow net overseas migration to rise to 400,000
by 2054. Modelling has suggested this would significantly increase per capita
economic activity. Less skilled workers were modelled to experience an after tax
real wage increase of 21.9 per cent, mid-skilled workers of 11 per cent and highly
skilled by -3.5 per cent by 2050 relative to not increasing the level of net overseas
migration.
To achieve a change in the migration program to influence Australia’s settlement pattern, the government should:
16. Alter the Regional Sponsored Migration Scheme so that it is capable of
more effectively encouraging migrants to settle in rural Australia; and
17. Change the points system to incorporate a regional element that provides
extra points for regional settlement.

M i g r a t i o n : t h e e c o n o M i c d e b a t e
12
Contributions
Attitudes to Australia’s immigration policy
Australia’s migration program has successfully increased the size of the country
by a third, with some local government areas having migrants from 109 different
countries of birth. Professor Andrew Markus examines how, overall the migra-
tion program has maintained high levels of community acceptance and support,
equivalent to universally accepted programs such as Medicare. However, this
support is precarious, subject to economic conditions and perceptions of the
economic benefits associated with the migration program. It can also be influ-
enced by political leadership. This contribution discusses the nature of community
acceptance for the migration program and how it contrasts with other developed
countries.
Australia’s de facto low skilled migration programs
A key source of community support for the migration program has been its focus
on relatively productive individuals who are perceived as making a significant
economic contribution to the country. However, as Dr Anna Boucher describes,
recent changes in the immigration program have resulted in significant growth
in relatively low skilled migrants entering Australia. These migrants have signifi-
cant consequences for existing workers that are likely to grow as the anticipated
numbers of low skilled workers increase. This contribution discusses what could
be done to maintain the community’s support for the migration program.

M i g r a t i o n : t h e e c o n o M i c d e b a t e
13
Redesigning Australia’s labour migration program
In order to maintain community confidence in the migration program it is neces-
sary that it builds Australia rather than being captured by narrow vested interests.
The contribution by Associate Professor Joanna Howe discusses three proposals
designed to embed a “fair go” into the migration program. These reforms include
adding accountability and objectivity to the demand driven temporary migration;
making migration fairer for the migrants themselves; and improving the role and
responsibilities of the regulators. These reforms are put forward with the aim of
improving the outcomes of all Australians from the immigration program.
Skilled migration and Australia’s productivity
The economic consequences of migration in the incumbent population are highly
influenced by the nature of the migration. The contribution by Sue Regan and
Dean Parham from the Australian National University examines the links between
migration and productivity and finds that the emphasis given to skills in the migra-
tion program has had a positive effect on Australia’s productivity. It describes the
labour market outcomes of migrants from different streams of the immigration
program and finds a significant positive contribution to the overall productivity of
the Australian migration, particularly from skilled migrants. The contribution also
describes the framework in which migrants contribute to the nation’s productivity
and the policy levers available to influence it.
Ensuring immigration benefits all
Australia, along with Canada, has created one of the world’s best practice migra-
tion programs. The key has been a utilitarian focus in the migration program and
the stated ambition of building a larger nation. Professor Glenn Withers discusses
the economic benefits of migration and how the migration program has evolved
over time. This contribution puts forward recommendations as to how Australia
could increase its level of immigration while reducing the social costs that are
currently associated with it. The potential economic benefits of increasing the
migration intake are also outlined.

M i g r a t i o n : t h e e c o n o M i c d e b a t e
14
Australia is a nation of immigrants. These migrants have come
in successive waves, encouraged by developments such as
the 1850s gold rush, to escaping the ravages of World War II in
Europe, through to the focus on skilled migration of late, which
has resulted in the largest portion of the population having been
born overseas in over 130 years.
CEDA overview
Nathan Taylor CHIEF ECONOMIST

M i g r a t i o n : t h e e c o n o M i c d e b a t e
15
However, specific policies in the migration program, when added to the rise of
extremist politicians in Australia and globally, have the potential to undermine the
community’s acceptance of the migration program. In particular, an overreliance
on poorly regulated market driven components of the program and the very sub-
stantial pools of relatively unskilled temporary migrants create opportunities for
exploitation and have significant consequences for incumbent workers.
These fears are not new. Immigration was a major issue during the first elec-
tion campaign of the newly federated colonies of Australia. The political debate
resulted in the racist Immigration Restriction Act to be passed in 1901. This act
placed restrictions on immigration and aimed to restrict the capacity of people of
non-European ethnicity to move to Australia by imposing a dictation test to gain
residency. The dictation test could be in any European language. In 1905, the Act
was changed so it could be given in any language at all. These laws, known as
the White Australia policy, informed Australian attitudes to immigration for almost
50 years.
While the White Australia policy was in force, the portion of the population born
overseas steadily declined, reaching as low as only 10 per cent of the popula-
tion in the 1940s. Following World War II, Australia established the world’s first
Department of Immigration and set a target of increasing the population by two
per cent each year, with a contribution from migration of one per cent. This was
the popular “populate or perish” period when Australia accepted more than two
million migrants and displaced people from Europe, offering assisted £10 pas-
sages to one million British migrants, nicknamed £10 Poms.
In 1958, under the Migration Act 1958, the dictation test was removed and a
new universal visa scheme introduced. This allowed non-Europeans to immi-
grate. Their entry was now based on what they could contribute to Australia
and if it could be shown that they could integrate into Australian society. Many
of these immigrants were assisted by the Australian government to find work in
nation building projects, the Snowy Mountains Scheme being the most famous.
Australia’s population increased from about 7.4 million in 1945 to over 13 million
in 1970. Over three million of this increase in population was due to immigration.
Finally, in the 1970s, the last vestiges of the White Australia policy were removed
and Australia adopted a strictly applied non-discriminatory immigration program
but with more stringent entry criteria. The evolution of the migration program was
motivated by what Professor Glenn Withers, in Ensuring immigration benefits
all, describes as a utilitarian approach – one that seeks to ensure the greatest
happiness of the greatest number, where happiness is defined as economic
improvement for incumbent Australians.

M i g r a t i o n : t h e e c o n o M i c d e b a t e
16
The focus on economic improvement of Australia is a key aspect of commu-
nity support for the migration program. When asked if immigrants are generally
good for the Australian economy, 83 per cent of respondents to the Scanlon
Foundation national surveys agreed that it was. Furthermore, there is consider-
able evidence that suggests Australia, along with Canada, is the western nation
most receptive to immigration. This community support stands in stark contrast
to many countries in Europe, where anti-immigration sentiment is strongest.
While Australia’s migration program has transformed significantly, a major
achievement has been its capacity to maintain community support. As detailed
by Professor Andrew Markus in Current opinion on Australia’s immigration
policy, community surveys consistently find that the vast majority (83 per cent of
respondents) agreed that immigration has generally been good for the Australian
economy. In addition, these surveys find between 84 to 86 per cent of respon-
dents have agreed to the proposition that “multiculturalism has been good for
Australia”. More than half respondents also agree that the immigration intake is
about right or too low. Given Australia’s immigration program has been higher
than its long run average for a decade, these responses are in stark contrast to
the attitudes in the US or Europe.
Over the last 70 years immigration has added seven million people to Australia’s
population and will, if current policy settings continue, add a further 13 million by
2060.
Just as the number of migrants living in Australia have increased, so to have the
source countries diversified. Australia’s major capital cities now exhibit what is
known as super diversity, with people from almost all nations of the world found in
its capital cities. Take Melbourne, for instance. There were immigrants from over
190 nations living in Melbourne in 2011, with up to 109 countries represented in
some local government areas.1
Figure 1 PErCEntAgE of thE PoPulAtion born ovErsEAs, CEnsus yEAr
Source: ABS, Cat No. 3105.0.65.001
0
5
10
15
20
25
30
%
1901
1911
1921
1933
1947
1954
1961
1966
1971
1976
1981
1986
1991
1996
2001
2006
2011
2015

M i g r a t i o n : t h e e c o n o M i c d e b a t e
17
Figure 2 Contribution to AustrAliA’s EstimAtED rEsiDEntiAl PoPulAtion by Country of birth, At 30 JunE 2015
Other* 44.38%
*See table for complete break-down of countries.
Malaysia 2.33%
South Africa 2.33%
Italy 2.95%Vietnam
3.43%Philippines 3.52%
India 6.45%
People's Republic of China 7.18%
New Zealand9.11%
United Kingdom17.99%
Germany 1.88%
Greece 1.77%
Sri Lanka 1.70%
United States of America 1.53%
Republic of Korea 1.53%
Hong Kong (SAR of China) 1.41%
Lebanon 1.38%
Ireland 1.32%
Netherlands 1.25%
Indonesia 1.21%
Fiji 1.06%
Singapore 1.03%
Iraq 1.02%
Thailand 1.00%
Croatia 0.96%
Pakistan 0.86%
Poland 0.83%
Japan 0.83%
Taiwan 0.82%
Iran 0.80%
Canada 0.75%
Former Yugoslav Republic of Macedonia
0.75%
Malta 0.67%
Egypt 0.66%
Nepal 0.65%
Afghanistan 0.64%
Bangladesh 0.61%
Turkey 0.60%
France 0.58%
Bosnia and Herzegovina 0.57%
Zimbabwe 0.57%
Cambodia 0.54%
Serbia 0.51%
Papua New Guinea 0.49%
Myanmar 0.46%
Chile 0.45%
Samoa 0.43%
Mauritius 0.41%
Brazil 0.37%
Russian Federation 0.36%
Sudan 0.35%
Hungary 0.32%
Cyprus 0.31%
Portugal 0.29%
Austria 0.28%
Kenya 0.28%
Spain 0.27%
Colombia 0.26%
Romania 0.26%
Ukraine 0.24%
Argentina 0.23%
Switzerland 0.23%
Czech Republic 0.20%
Syria 0.20%
Saudi Arabia 0.19%
Ethiopia 0.19%
Sweden 0.18%
Tonga 0.18%
Israel 0.18%
Laos 0.17%
El Salvador 0.16%
Denmark 0.16%
Timor-Leste 0.16%
Peru 0.16%
Uruguay 0.15%
Source: ABS Migration, Australia 3412.0

M i g r a t i o n : t h e e c o n o M i c d e b a t e
18
For the most part these immigrants have integrated smoothly. Migrants exhibit
economic outcomes similar to incumbent Australians and their children have at
least equivalent economic outcomes if not better than the broader community.
This report examines the suitability of Australia’s migration program and makes
recommendations to improve it. It also includes a thought piece on how we can
have our cake and eat it, that is to say how the rate of immigration can be signifi-
cantly increased without corresponding congestion costs. Compared with other
countries, the Australian regime for assessing and recognising overseas skills is
generally regarded as well-developed and successful in achieving its objectives.
However, a number of potential issues have been identified by interested parties
which might provide a basis for fine tuning of the current arrangements. This
report’s scope does not address sustainability or social cohesiveness nor does it
address issues with the humanitarian stream of migration in detail.
Australia’s migration program
Australia’s migration program constitutes two parts. The first is the capped per-
manent immigration program which constitutes the migration and humanitarian
program. The level and composition of permanent immigration is determined
using qualitative criteria and quotas. Qualitative criteria can include attributes
such as character, health, finances, age, education and skills. The second impor-
tant aspect is temporary migration, which is uncapped and influenced by migrant
demand. New Zealand citizens, who are classed as temporary immigrants,
have almost unrestricted access to Australia under the Trans-Tasman Travel
Arrangement and can reside in Australia for an indefinite period of time.
Figure 3 thE vArious strEAms of thE immigrAtion ProgrAm
international students other
return overseas
Working holiday
return overseas
temporary immigration
humanitarian program
new Zealand citizens
Further temporary
immigration
Permanent immigration
Skilled temporary
Migration program
remain permanent
resident
australian citizenship

M i g r a t i o n : t h e e c o n o M i c d e b a t e
19
The permanent migration program is capped and split into a family stream, a skill
stream and a special eligibility stream, with the level and composition determined
using qualitative criteria and quotas. Qualitative criteria can include attributes
such as character, health, finances, age, education and skills. It also includes a
humanitarian program constituting refugees, the special humanitarian program,
special assistance category, and onshore. In 2014–15, the total permanent visas
issued was 202,853 and breakdown of these visas was:
Both permanent and temporary immigration have increased in recent years,
with temporary immigration increasing at a much faster rate. It is now the larger
contributor to net overseas migration. While the Australian Government sets
the broad parameters for the permanent and temporary immigration programs,
employers have a pivotal role in selecting immigrants under a range of skilled
visa categories. Most of the recent growth in permanent immigration has been in
employer sponsored skilled immigration, which increased from 17 per cent of the
skill stream in 2007 to 38 per cent in 2015. However, these figures include sec-
ondary applicants (family members of primary applicants) who are not necessarily
skilled themselves.
The contribution of net overseas migration
(NOM) to Australia’s population growth has
increased over the last two decades. While
natural increase has been relatively stable,
fluctuating between 120,000 and 160,000 from
1996 to 2014, NOM has increased significantly
over the same period. Since the mid-2000s
NOM has made a larger contribution to popula-
tion growth than natural increase.
Temporary immigration has also fluctuated significantly over the past decade,
while permanent immigration has remained relatively stable. The fluctuations are
due to temporary immigration being mostly uncapped and relatively more respon-
sive to economic conditions than permanent immigration.
Issues with the temporary migration program are raised below, the issues associ-
ated with maximising the economic benefit of permanent migration are discussed
subsequently.
Migration program visa grants, 2014–15 humanitarian visa grants, 2014–15
Family stream
Skill stream
Special eligibility
Refugee Special humanitarian
Special assistance
Onshore
61,085 127,774 238 6002 5007 0 2747
Source: Department of Immigration and Border Protection, historic migration statistics.
“ Both permanent and temporary immigration
have increased in recent years, with
temporary immigration increasing at a much
faster rate. It is the larger contributor to net
overseas migration.”

M i g r a t i o n : t h e e c o n o M i c d e b a t e
20
Temporary migration program
There has been a global trend towards temporary rather than permanent migra-
tion, and Australia’s immigration program is no exception. Globalisation and
technological developments have reduced transportation, information and com-
munication costs. These developments made it easier for people to migrate and
remain connected with their families and
friends. Improvements in access to informa-
tion have increased people’s awareness of
migration and work opportunities, and their
desire to migrate. Globally, the number of
people living outside their home country has
not changed since 1980 as a percentage
of world population and remains at around 2.7 per cent.2 While the absolute
numbers have changed, the percentage of the overall global population has been
static for over 35 years. What has changed is that people now travel more fre-
quently as tourists, to study, or to work temporarily. For instance, China had 56
million tourists visit in 2014 while 109 million Chinese travelled abroad, a tenfold
increase from 2000.3
The global growth in temporary people movements has been reflected in the
number of temporary visas in Australia rising rapidly. Temporary migration into
Australia has eclipsed permanent flows since the mid-2000s, and more than
doubled between 2003 and 2014. Depending on whether Working Holiday
Makers and International Student visas are included in the calculation of tempo-
rary flows, the stock of temporary migrants at any point in time is 10 times greater
than annual permanent entry of around 190,000. Key categories were:
• Visitor visa holders with 26 per cent of the total;
• Student visa and temporary graduate visa holders representing 17 per cent of
total temporary migrant visa holders;
• Temporary Skilled (subclass 457) visa holders with eight per cent of the tempo-
rary intake;
• Working Holiday Maker visa holders representing almost eight per cent of the
temporary intake; and
• New Zealand (subclass 444) visa holders who represented almost 32 per cent
of temporary migrants, even though they have rights to live and work indefinitely.
Of course, not all temporary migrants seek permanent residence. However, in
2013–14, approximately half of all recipients of permanent visas were already
living in Australia on temporary visas.4 Gaining permanent residency in Australia
has increasingly become a two-step process.
Currently permanent immigration is capped and temporary immigration is
uncapped, so there is no direct regulation of the balance between the two
streams. A well targeted temporary immigration program can be an effective
response to labour market shortages. However, the labour market implications
“ The global growth in temporary people
movements has been reflected in the number
of temporary visas in Australia rising rapidly.”

M i g r a t i o n : t h e e c o n o M i c d e b a t e
21
of the work rights of the substantial and uncapped pool of international students,
graduates, and working holiday makers are poorly understood and warrant
further investigation. Of particular concern, given their existing size and current
rate of growth, are the 457 visa program, the foreign student program, and the
working holiday maker program.
In December 2015, there were around 328,000 students and almost 24,000
temporary graduate visa holders in Australia. Student visa holders have a right
to work, generally, up to 40 hours per fortnight while those on a Temporary
Graduate visa, depending on their qualifications, have a right to work for between
18 months and four years after graduation. Student and Temporary Graduate visa
holders play a critical role in underpinning the international education sector. It has
been estimated that they contributed some $17 billion to the Australian economy,
while it also represents around 27 per cent of services exports.5
International students with work rights are supplemented by around 155,000
additional working holiday makers, as at the end of December 2015. The stated
objective of the working holiday visa program is to encourage cultural exchange
and closer ties between Australia and eligible countries (with reciprocal rights for
Australian citizens). It started as a small form of inflow for young people from the
UK and Canada for work and travel purposes
in 1975.
While the program benefits Australia’s tourism
industry it has increasingly been shaped to
benefit other industries that have a need for
short term casual workers, particularly those
based in regional Australia. The introduction
of the Second Working Holiday visa initiative
in November 2005 allowed first time Working
Holiday visa holders who undertake 88 days specified work in regional Australia
during their stay to apply for a second such visa. For the purpose of the Second
Working Holiday visa initiative, regional Australia includes large parts of rural and
regional Australia. Second Working Holiday visa grants grew from about 2700 in
2005–06 to 46,000 in 2013–14.6 In 2013–14, over one in four first time Working
Holiday visa holders went on to acquire a Second Working Holiday visa.7
In the six months to 31 December 2015, approximately 92 per cent of the
Second Working Holiday visa applicants undertook agricultural work to acquire
eligibility, six per cent undertook construction work and approximately one per
cent worked in the mining sector. According to the National Farmers’ Federation,
temporary visa holders represented almost one third of the total (non managerial)
workforce in the agricultural sector.8
Given the age requirements, working holiday makers are young and of working
age. They are also excluded from free or subsidised access to most government
support services (such as health and welfare). The National Farmers’ Federation
also estimated that they spend approximately $15,000 per person each year
while in Australia for an annual cumulative contribution of more than $3.5 billion.
“ Student and Temporary Graduate visa
holders play a critical role in underpinning
the international education sector. It has been
estimated that they contributed some
$17 billion to the Australian economy.”

M i g r a t i o n : t h e e c o n o M i c d e b a t e
22
Temporary immigrants, particularly international students and working holiday
makers, face a higher risk of being exploited by their employers than the general
workforce for a number of reasons. They are more likely to be young, have limited
English language proficiency and be unaware of their work rights compared to
the broader Australian community. Arguably, these risks are highest for temporary
workers engaged in unskilled and semiskilled jobs, for which labour is generally
not in short supply.
In the past three years, the Fair Work Ombudsman (FWO) dealt with over 6000
requests for assistance from immigrant workers, and has recovered more than
$4 million in outstanding wages and entitlements. Requests for assistance from
immigrant workers have steadily increased over this time, with those received and
finalised in 2014–15 accounting for just under 11 per cent of all requests.9
There is also research that suggests that the willingness of working holiday
makers to work for lower wages, or in jobs that local workers do not like, has
depressed the working conditions and reduced the job openings for relatively
unskilled local Australians.10
The 457 visa
The key objective for the Temporary Work (Skilled) (subclass 457) visa program
is to enable businesses to sponsor a skilled overseas worker if they cannot find
an appropriately skilled Australian citizen or permanent resident to fill a skilled
position, while ensuring that working conditions of sponsored visa holders are no
less favourable than those provided to Australians. The program is intended to
only provide a visa if there is a job offer in Australia from an approved sponsoring
employer.
Subject to a minimum annual salary threshold, all 457 visa holders must receive
the same terms and conditions of employment as an equivalent Australian worker.
In addition, they are excluded from free or subsidised access to most government
support services. Immigrants under the program are, thus, likely to contribute to
economic activity and taxation revenue, and are likely to deliver a fiscal benefit to
the Government.
The annual intake of workers on 457 visas has almost doubled over the past
decade, and as at December 2015 there were around 160,000 such visa holders
in Australia. The 457 program has also provided a significant pool of appli-
cants for permanent immigration.11 In 2013–14, for example, 457 visa holders
accounted for around 50 per cent of the approximately 79,000 onshore grants of
skilled permanent visas.
There are legitimate concerns that the growth in 457 visas is not linked with labour
shortages. Currently a social media advertisement, of indeterminate length of
time, is sufficient evidence to justify a labour shortage, suggesting the pendulum
has swung too far towards a market driven migration program. There are a range
of reforms put forward in this report that could ensure community confidence that
the 457 visa program is not undercutting the wages of incumbent Australian.

M i g r a t i o n : t h e e c o n o M i c d e b a t e
23
The economics of permanent migration
The economic consequences of migration occur at the margins rather than
having one definitive answer. The majority of the research says that it is difficult
to quantify if immigration has a net positive or net negative impact. The most
common point of agreement among economic analyses of migration is that the
net economic effects are not large. Furthermore, the classic approach to model-
ling the economic impact of migrants finds that the immigrants themselves are
able to capture most of the benefits that are generated.12
In considering the economic consequences of migration, the focus is on how
migration impacts Australian citizens. This approach tries to ask what would
happen to future generations of Australians including the children of migrants after
they settle in Australia. However, it does not explicitly account for the economic
benefit to prospective immigrants. This is because migrants voluntarily chose to
immigrate to Australia, and the policy options for the Government involve con-
trolling these migrant flows. Furthermore, given the relatively low travel costs,
immigrants to Australia have the option of returning to their country of origin. This
of course excludes humanitarian refuges.
The main ways migrants impact the economy are through:
• Their addition to the labour market;
• Changes in capital and investment levels in sectors; and
• Government expenditure on services, transfer payments and taxation.
There are also a range of very significant externalities associated with migration.
These include improved international trade links, technology transfers, improving
economies of scale in Australia as well as congestion consequences for natural
resources and physical infrastructure.
Labour and capital
The addition of migrants expands the labour market. This potentially creates
competition for jobs, but it also expands economic activity creating more employ-
ment. The actual economic consequences depend on the size and characteristics
of the immigrants themselves. In Skilled migration and Australia’s productivity,
Sue Regan and Dean Parham examine the way in which Australia’s migration
program has influenced the nation’s productivity. Given the importance of pro-
ductivity to improving living standards, it is critical to understand the relationship
between migration and the productivity of labour to understand its economic
consequences.
The major contributor to labour productivity involves the amount of capital allo-
cated to their tasks. Consider the difference between an agricultural labourer
equipped with a shovel versus the productivity of one using a tractor. Capital
deepening, the process of replacing shovels with tractors, has accounted for
two-thirds of the improvements in Australia’s labour productivity over the past four

M i g r a t i o n : t h e e c o n o M i c d e b a t e
24
decades. Economic assessments of migration consider its effect on the capital-
labour ratio as crucial. If migration is not accompanied by an equivalent growth in
capital, the labour-boosting effect of migration result in a lower capital-labour ratio
and, all other things being equal, lower per capita incomes. The relative decline
in per capita income would occur because wages tend to be closely linked with
labour productivity growth. So an increase in migration, resulting in a decline
in labour productivity, would make existing workers worse off than without the
migration but the owners of capital better off.
The argument is complicated by the second round consequences. It is argued
that the increase in returns to capital would induce further investment and restore
the ratio of capital to workers. Labour productivity would return to where it would
have been without any migration, and wages and average incomes would be
restored but at a higher level of aggregate economic activity. There is consider-
able academic uncertainty as to whether this equilibrating path actually occurs
in practice. The numbers of migrants, their
individual skills and capabilities, and the
ability of labour markets to absorb them
and the extent and pace with which capital
responds become key issues. While it is
generally thought the net effects are positive,
the conclusion can vary across countries with
different labour markets, economic structures
and migration programs.
Migration can also influence the level of labour
utilisation in Australia. As a higher proportion of the population reaches retire-
ment, the number of hours worked will fall in proportion to population numbers.
Immigration can increase the proportions of the population of working and child-
bearing age, bringing an immediate, as well as a longer-term, effect on labour
utilisation. However, the Productivity Commission noted that for Australia to main-
tain the 2005 dependency ratio (of people of working age compared to those not
of working age) until 2045 would require an annual immigration intake of 3.1 per
cent of the population.13 Under this scenario Australia’s population would be 85
million and the annual net migration intake would be 2.5 million in 2045.
Australia’s migration program has favoured skilled migrants. The focus on skills
within the migration program means that the average migrant is better educated
and more skilled than the average incumbent Australian. As a consequence,
the evidence finds that, on average, migrants have been more productive than
non-migrants, as measured by earnings. Furthermore, they have been motivated
to increase their productivity more rapidly than non-migrants. For example, a
migrant earned a wage premium of about $3 an hour in 2011, about $3.60 in
2012 and about $5 in 2013.
The influence of migration on labour productivity depends on more than just the
productiveness of individual migrants. It depends very importantly on the produc-
tion conditions in which the labour of migrants is used. Migrant productivity may
be affected by a range of government policies post-arrival in the country. Access
to education and labour market programs can be important for migrants as they
“ The majority of the research says that it
is difficult to quantify if immigration has
a net positive or net negative impact. The
most common point of agreement among
economic analyses of migration is that the
net economic effects are not large.”

M i g r a t i o n : t h e e c o n o M i c d e b a t e
25
both seek work and progress in work. Settlement services can be particularly
important for family and humanitarian migrants.
According to census data migrants have raised the level of Australia’s labour pro-
ductivity by six per cent. Between 2006 and 2011 migrant’s contributed at least
10 per cent to growth in the nation’s skilled capacity. This accounted for 0.17 of
a percentage point of annual labour productivity growth. These estimates only
cover the direct effects migration can have on productivity and do not include
other mechanisms that may influence the productivity of labour, such as entrepre-
neurial effects and trade and finance links to home country.
In the contribution, Ensuring immigration benefits all, Professor Glenn Withers
suggests that the modelling that finds migration adds only a small net benefit
may fail to account for economies of scale. Given Australia’s vast size and small
population, the increases in efficiency associated with a larger population could
be substantial. The potential sources of this impact are many and varied, such as
the exploitation of economies of scale and agglomeration or thick market effects
in some cities or regions. A larger population (and domestic market) could also
improve productivity by enhancing competition in domestic markets, by support-
ing a larger number of firms competing against each other in particular industries.
The increase in population size per se could contribute to a general increase
Figure 4 migrAtion ProgrAm, Contribution of fAmily AnD skillED strEAms, 1983–84 to 2014–15
Source: Various population flows publications and annual reports – Migration Reporting, DIBP
0
20
40
60
80
100
%
Family Skill
1983
–84
1984
–85
1985
–86
1986
–87
1987
–88
1988
–89
1989
–90
1990
–91
1991
–92
1992
–93
1993
–94
1994
–95
1995
–96
1996
–97
1997
–98
1998
–99
1999
–00
2000
–01
2001
–02
2002
–03
2003
–04
2004
–05
2005
–06
2006
–07
2007
–08
2008
–09
2009
–10
2010
–11
2011
–12
2012
–13
2013
–14
2014
–15

M i g r a t i o n : t h e e c o n o M i c d e b a t e
26
in productivity and income per capita, regardless of the skills of the migrants
themselves.
The benefits associated with a larger population could be substantial. Adjusting
for the potential effect of agglomeration benefits associated with a larger popula-
tion finds that the current migration program will result in Australia’s per capita
income being 5.9 per cent higher than if there was zero net migration. These
results are closer to direct estimates using time series regression models which
track actual effects in real time with real data.
The Productivity Commission found that the estimated median income tax paid
in 2009–10 by all recent permanent immigrants was about the same as the rest
of the Australian community, at $4500.14 However, there were significant differ-
ences based on the migration program stream of the permanent immigrants. Skill
stream immigrants paid more income tax relative, around $8100, compared to
the general population, whereas family stream and humanitarian immigrants paid
less. The key determinant of the life time fiscal impact of migration was the age of
the immigrant. The younger the immigrant, the more of a fiscal contribution they
are likely to make, other things being equal.
Congestion of the commons
Increasing the size of the population increases the number of people putting
demands on fixed and renewable natural resources. As the supply of these
resources is limited, a larger population can contribute to lower productivity and
income per capita. Road congestion is a major concern to many Australians, par-
ticularly in the nation’s most congested cities of Sydney, Melbourne and Brisbane.
Population growth in urban areas adds to congestion and can reduce the amenity
of these cities. The costs of congestion, such as additional time spent travelling,
uncertainty about travel times,
accidents, and frustrations are
real even if they are not mea-
sured in economic statistics of
the nation’s overall wellbeing.
Likewise, urban utilities, such as
water supplies, utilise the envi-
ronment as a source of water
(rain fed dams and groundwa-
ter), and waste disposal (ocean
outfalls and landfills). As the population grows, the pressure on the environment
means that more infrastructure is required to deliver the same level of services.
This is particularly the case with reliable urban water supplies where Australia
already has some of the largest reservoirs to population in the world. As annual
demand approaches mean annual inflows, a much larger proportion of water
requires engineering solutions. The costs of additional water are shared between
incumbents and immigrants.
“ Increasing the size of the population increases the number
of people putting demands on fixed and renewable
natural resources. In that case, when the supply of these
resources is limited, a larger population can contribute to
lower productivity and income per capita.”

M i g r a t i o n : t h e e c o n o M i c d e b a t e
27
In every year since 2006, migration has contributed more to population growth
than occurred through natural increases. The environmental and congestion
pressures created by migration are a consequence of where migrants settle in
Australia. The 2014–15 Migration Programme Report found that immigrants
overwhelmingly tend to settle in Australia’s major cities, with 30 per cent moving
to Sydney, 24 per cent to Melbourne and approximately 14 per cent to Perth,
which has been deemed a regional city since 2012–13. Census data confirms
this trend and finds that half of all migrants in Australia are living in either Sydney
or Melbourne. This places significant strains on the transport networks and physi-
cal amenity of these two cities.
The Bureau of Infrastructure, Transport and Regional Economics estimated the
avoidable cost of road congestion in the Australian capital cities was $16.5 billion
in 2015, more than doubled since 2005. These costs have been estimated to
increase significantly from 2015 to 2030, with avoidable costs of road congestion
rising from $6.1 to $12.6 billion in Sydney, from $4.6 to $10.2 billion in Melbourne,
from $2.3 to $5.9 billion in Brisbane, and from $2 to $5.7 billion in Perth. These
are the cities most likely to be affected by immigration.15
It has been estimated that the contribution of individual migrants to the social
costs of congestion will rise significantly. For instance, the social cost of conges-
tion caused by migrants in Sydney by 2026 has been estimated at being almost
60 per cent higher, while it has been estimated to be 124 per cent higher in
Perth.16
While congestion of common infrastructure or natural resources can be mitigated
through more effective government policies, such as congestion pricing, these
costs cannot be eliminated.
Figure 5 soCiAl Costs of CongEstion PEr migrAnt, ConstAnt 2000 DollArs
Source: DIAC, 2010.
0
500
1000
1500
2000
2500
3000
2026
2006
PerthBrisbaneMelbourneSydney

M i g r a t i o n : t h e e c o n o M i c d e b a t e
28
A greater Australia
Decisions about the size and composition of Australia’s migration program are
taken by the Commonwealth Government, which also benefits most from the
expanded economic activity, but it is the various state governments who deal
with the costs of migration. In particular, the state governments are required to
provide government services, such as health and education and ensure adequate
infrastructure is delivered. As Australia’s population ages the natural rate of popu-
lation growth will slow and approach zero. CEDA has estimated that by 2050,
births will no longer exceed deaths and immigration will be the only source of
population growth.17
There has been a pronounced failure to fund and deliver appropriate levels of
infrastructure in Australia. CEDA’s report Australia adjusting: optimising national
prosperity cited a range of policy recommendations to improve the efficiency with
which infrastructure is used and significant changes to the governance arrange-
ments that oversee the way in which it is planned and delivered. In Australia’s
economic future: an agenda for growth, CEDA pointed out that while there have
been significant reforms in many areas of the Australian economy, infrastructure
has largely been unchanged for decades. Improved efficiency, such as through
appropriate congestion prices, is critical to meet Australia’s current requirements
and will only become more so as the population grows.
Given the contribution the migration cap makes to population increase in
Australia, Australia’s immigration program is its de facto population policy. This
was a key point made in CEDA’s 2012 report, A Greater Australia: population,
policies and governance, and reinforced by a recent Productivity Commission
report. As the Australian population ages, the rate of natural growth in population
is set to decline until it reaches zero in 2050.18 At that stage immigration will be
Figure 6 Contribution to PoPulAtion growth, 2000 to 2015
Source: Australian Demographic Statistics (3101.0), June 2015, ABS
Net overseas migration Natural increase

M i g r a t i o n : t h e e c o n o M i c d e b a t e
29
the only source of population growth. While temporary migration is uncapped, it
varies in response to the economic conditions in Australia. In contrast, the per-
manent migration program is capped and set by the Australian Government.
Forecasts of Australia’s future population suggest that at the long run average
NOM, of 0.6 per cent, the country’s population will grow to 43 million by 2060, an
increase of 74 per cent over the 2014 population. If NOM remains at the elevated
level it has been over the decade to 2014, of one per cent, then the population
will reach 50 million by 2060, an increase of 117 per cent over the 2014 popula-
tion. It is questionable as to whether the current
settlement patterns of migrants, predominately
into Sydney and Melbourne, can continue
indefinitely with these figures. It is not pos-
sible under current planning and governance
arrangements.
A positive rate of immigration that is within
Australia’s absorptive capacity and oriented
towards young and skilled immigrants will
improve the nation’s economy. It is likely to deliver substantial economic benefits
to incumbent Australians and the immigrants themselves. As Professor Withers
points out, a major benefit of migration is that Australia is a sparsely populated
continent, and that there are potentially significant economies of scale with
a larger population. This is likely to be more true if the settlement patterns of
migrants were more dispersed. There are significant opportunities to increase
the population in rural and regional Australia through migration. For instance, the
Developing Northern Australia White Paper noted:
While the growth of Asian’s economic prosperity has the potential to transform Northern
Australia, to realise this potential will require many more people living in the region. …
Transformation won’t happen if its population inches up by a few hundred thousand over the
next 20 years. It would remain a high cost, small scale economy; more of a pilot project than a
powerhouse. We need to lay the foundations for rapid population growth and put the north on
a trajectory to reach a population of four to five million by 2060.19
Current projections suggest that the population growth in Northern Australia will
be higher than the rest of the country, but not substantially, and it will remain
relatively sparsely populated region. A more activist migration program could
ensure the economic and social development of Northern Australia and maintain
the vitality of regional Australia.
The immigration program has gone through significant changes in the past,
and it is not implausible to suggest that it could be altered again to influence
the settlement patterns of immigrants. Doing so could improve the absorptive
capacity of the nation and increase the number of immigrants who could move
to the country. Such a change would require careful consideration and close
relationships between all spheres of government and local communities. This
would represent a more significant change than the current Regional Sponsored
Migration Scheme, where capital cities such as Perth and Adelaide can be con-
sidered regional.
“ Current projections suggest that the
population growth in Northern Australia will
be higher than the rest of the country, but
not substantially, and it will remain relatively
sparsely population.”

M i g r a t i o n : t h e e c o n o M i c d e b a t e
30
endnotes
1 Davern, M., Warr, D., Higgs, C., Dickinson, H., Phillimore, J., September 2015, Superdiversity in Melbourne, McCaughey VicHealth Community Wellbeing unit.
2 Manyika, J et al 2014, Global Flows in a Digital Age: How Trade, Finance, People and Data Connect the World Economy, McKinsey Global Institute,London , p. 5.
3 United Nations World Tourism Organization statistics.
4 Productivity Commission, 2016, Migrant Intake into Australia, page 4.
5 Productivity Commission, 2015, International Education Services, Commission Research Paper, Canberra.
6 Department of Immigration and Border Protection, 2015, Working Holiday Maker Visa Programme Report: 31 December 2014, Canberra.
7 Department of Immigration and Border Protection, 2015, Working Holiday Maker Visa Programme Report: 31 December 2014, Canberra.
8 National Farmers’ Federation, Submission 31, Productivity Commission Migration Inquiry.
9 Fair Work Ombudsman, 2015, Submission to Productivity Commission inquiry into Workplace Relations Framework
10 Tan, Y. and Lester, L. 2012, ‘Labour Market and Economic Impacts of International Working Holiday Temporary Migrants to Australia’, Population, Space and Place, vol. 18, no. 3, pp. 359–383.
11 Department of Immigration and Border Protection, 2015, Temporary Entrants and New Zealand Citizens in Australia: As at 31 December 2014, Canberra.
12 Reference the PC report, page X.
13 Productivity Commission, 2006, Economic Impacts of Migration and Population Growth.
14 Productivity Commission, 2016, Migrant Intake into Australia, page 308.
15 Bureau of Infrastructure, Transport and Regional Economics, Traffic congestion cost trends for Australian capital cities, Information sheet, accessible here: https://bitre.gov.au/publications/2015/files/is_074.pdf
16 Department of Immigration and Citizenship, Long-term physical implications of net overseas migration: Australia in 2050, December 2010.
17 CEDA, 2012, A Greater Australia,
18 Pincus, J. and Hugo, G. 2012, ‘Introduction: The Issues in Brief’, A Greater Australia: Population, Policies and Governance, CEDA, Melbourne, pp. 6–16.
19 Australian Government, 2015, Our North, Our Future White Paper.

M i g r a t i o n : t h e e c o n o M i c d e b a t e
31
This chapter explores current Australian opinion on
immigration alongside the attitudes of immigrants,
based on surveying that has been conducted by the
Scanlon Foundation and rounded-out with the findings
of other publicly available surveys.
1. Attitudes to Australia’s immigration policy
Professor Andrew Markus

M i g r a t i o n : t h e e c o n o M i c d e b a t e
32
Professor Andrew markus is the Pratt Foundation Research
Professor of Jewish Civilisation at Monash University and is a Fellow
of the Academy of the Social Sciences in Australia. He has published
extensively in the field of Australian race relations and immigration
history. Since 2007, Professor Markus has been Senior Researcher
for the Scanlon Foundation Social Cohesion Research Program, which in 2016 conducted
its ninth national survey.
Introduction
For the first time in Australian social research, systematic surveying of attitudes
to immigration, cultural diversity and social cohesion has been conducted. This
research has been undertaken by the Scanlon Foundation, with additional funding
for three surveys provided by the Federal Government.
Since 2007, the Scanlon Foundation has conducted eight national surveys
and four local area surveys. These surveys have employed telephone admin-
istered probability samples and a survey instrument of some 65 questions,
with a minimum of 1200 respondents. In addition to this, experimental online
surveys have been conducted together with a focus-group project in 2015 in
four Australian capital cities. An online survey, Au@2015, conducted between
September 2015 and February 2016, which was available in 20 languages, was
completed by some 10,500 respondents. In total, more than 35,000 respondents
have completed the Scanlon Foundation surveys, providing the basis for reliable
analysis of trends in opinions and attitudes within sub-groups.1

M i g r a t i o n : t h e e c o n o M i c d e b a t e
33
Australian attitudes: immigration and cultural diversity
There is substantial evidence to indicate that among western nations, Australia
and Canada rank as the most receptive to immigration.2
A major survey conducted between 2012 and 2014 in 142 countries by Gallup
World Poll provides scope for comparison across regions. The aggregated results
indicate that support for immigration at current or higher levels is at 69 per cent in
the Oceania region (Australia and New Zealand), 57 per cent in Northern America
(Canada and the United States of America [US]), and at 38 per cent in Europe.3
Recent European surveys have found support for immigration at similar or lower
levels to the Gallup World Poll. The 2014 Eurobarometer survey, conducted in
November 2014, found that 35 per cent of the European population was positive
towards immigration from outside the European Union (EU), while 57 per cent
was negative. The highest levels of negative response were in Italy and Greece at
75 per cent.4
region immigration should be increased (per cent)
immigration should remain at the present level
(per cent)
immigration should be decreased (per cent)
don’t know/ refused
(per cent)
Oceania 28 41 26 5
Northern America 23 34 39 4
Europe 8 30 52 10
Source: International Organization for Migration, How the World Views Migration, 2015 (Results of the Gallup World Poll, 2012–2014).
Table 1 “ in your viEw, shoulD immigrAtion in this Country bE kEPt At its PrEsEnt lEvEl, inCrEAsED or DECrEAsED?” AggrEgAtED rEsults by rEgion:
Table 2 “ PlEAsE tEll mE whEthEr EACh of thE following stAtEmEnts EvokEs A PositivE or nEgAtivE fEEling for you… immigrAtion of PEoPlE from outsiDE thE Eu.” sElECtED CountriEs:
Positive (per cent) negative (per cent)
Italy 18 75
Greece 23 75
Germany 29 61
France 35 58
UK 38 57
Spain 48 42
EU28 35 57
Source: Eurobarometer 2014, T61.

M i g r a t i o n : t h e e c o n o M i c d e b a t e
34
The Pew Research Centre found in May 2014 that of seven European countries
surveyed there was majority support for a cut in immigration in Greece (86 per
cent), Italy (80 per cent), France (57 per cent ) and the UK (55 per cent).5
Survey findings in the US, Canada and Australia are in marked contrast to results
obtained in Europe.
For more than 20 years Pew Research surveys in the US have sought response
to the juxtaposed statements that immigrants “strengthen our country because
of their hard work and talents” and immigrants “are a burden on our country
because they take our jobs, housing and health care”. The March 2016 survey
found 59 per cent in agreement with the positive view of immigration, 33 per cent
with the negative. The proportion favourable towards immigration has increased
since 1994, when 63 per cent saw immigrations as a burden and 31 per cent
as a strength. However, the proportion favourable to immigrants still remains low
among Republican voters in 2016, with only 35 per cent in agreement with the
positive view.6
The Focus Canada survey conducted annually by the Environics Institute has
found that a majority of Canadians reject the proposition that the country is
taking too many immigrants. The 2015 survey, which was conducted in June
by telephone and achieved a sample size of 2000, found that 57 per cent of
respondents disagreed with the proposition
that “overall, there is too much immigration in
Canada”; a statement that only 38 per cent
agreed with. These proportions have changed
little over the last four years. In 2016, 82 per
cent of respondents agreed that “overall,
immigration has a positive impact on the
economy”, only 14 per cent disagreed. While
a minority of 30 per cent agreed that “immi-
grants take away jobs from other Canadians”,
67 per cent of the respondents disagreed with the statement. Sub-group analysis
indicated that the highest proportion of negative sentiment towards immigration
was among: older Canadians, those of lower socio-economic status, those who
live outside major urban areas, and those who support the Conservative Party or
the Québécois.7
A staple of Australian surveying since 1951 has been to ask respondents if they
consider the immigration intake to be too high, about right, or too low.8 The
record of polling indicates that the question has found considerable volatility of
response. In a period of increasing or relatively high unemployment there has
been majority support for the view that the intake is too high, whereas in times
of economic growth and low unemployment there is majority support for the level
of current immigration or its increase. Seven of the eight Scanlon Foundation
national surveys conducted between 2007 and 2015 found agreement that the
intake was about right or too low in the range 53–61 per cent, and opinion that
it was too high was in the range 35–42 per cent.9 These findings are close to the
Canadian level indicated by the Environics survey.
“ The 2016 Lowy Institute Poll, administered
in February–March, tested responses to the
proposition that ‘overall, there is too much
immigration to Australia’. Disagreement was
at 57 per cent, agreement at 40 per cent.”

M i g r a t i o n : t h e e c o n o M i c d e b a t e
35
Two additional surveys administered by telephone and employing random
samples also found majority support for immigration. The April 2015 Australian
National University (ANU) Poll asked, “Do you think the number of immigrants to
Australia nowadays should be increased, remain the same as it is, or reduced?’”
A relatively low 28 per cent favoured reduction, while 67 per cent favoured an
increase on the current level. Questions similar to those asked in the Environics
survey obtained almost identical results: 83 per cent of respondents agreed that
“immigrants are generally good for the Australian economy”, while only a minority
of 29 per cent agreed that “immigrants take jobs away from people who were
born in Australia”.10
The 2016 Lowy Institute Poll, administered in February–March, tested responses
to the proposition that “overall, there is too much immigration to Australia”.
Disagreement was at 57 per cent, agreement at 40 per cent. This finding was
similar to that obtained by the 2014 Lowy Institute Poll, when 37 per cent agreed
that the “total number of migrants coming to Australia each year is too high”. Just
24 per cent of Lowy respondents in 2016 disagreed that “overall, immigration
has a positive impact on the economy of Australia”, and 25 per cent disagreed
that “immigrants strengthen our country because of their hard work and talents”.
A larger proportion, but still a minority at 35 per cent, were in agreement that
“immigrants take away jobs from other Australians”.11
Table 3 “ whAt Do you think of thE numbEr of immigrAnts ACCEPtED into AustrAliA?” 2012–2015
too high (per cent)
about right (per cent)
too low (per cent)
refused/don’t know (per cent )
2012 38 42 14 7
2013 42 38 13 7
2014 35 42 17 8
2015 35 41 19 5
Source: Scanlon Foundation (Markus 2012–2015).
Table 4 survEys ComPArED, sElECtED quEstions:
Pew research US, 2016 (per cent)
environics canada, 2016
(per cent)
anU Poll, 2015
(per cent)
Lowy institute, 2016
(per cent)
“ Immigrants are good for the economy”, “have a positive impact on the economy” – agree
82 83 73
“ Immigrants take jobs away” – agree
30 29 35
“ Immigrants strengthen the country” – agree
59 72

M i g r a t i o n : t h e e c o n o M i c d e b a t e
36
In national surveys conducted in 2013, 2014 and 2015, the Scanlon Foundation
asked for response to the proposition that “multiculturalism has been good for
Australia”. A high level of agreement has been constant, in the range 84–86
per cent.12 The 2013 survey tested association of the term multiculturalism with
five possible results: the strongest association was with the proposition that
multiculturalism “benefits the economic development of Australia” (75 per cent
agreement) and its “encouragement of immigrants to become part of Australian
society” (71 per cent).13
Acceptance pending integration
While there is strong support in Australia for immigration and for the policy of
multiculturalism, close to 35 per cent consider that the immigration intake is too
high and 11 per cent disagree that multiculturalism has been good for Australia.
Of those who are favourable towards multiculturalism, the support of a substan-
tial proportion is conditional on commitment to integrate; to accept what are
seen as normative Australian values. In the words of one focus group participant,
immigrants are “more than welcome to resettle elsewhere if they don’t like our
values”.14
Stance of Australian-born respondents
The Scanlon Foundation national surveys have asked for response to the propo-
sition that “accepting immigrants from many different countries makes Australia
stronger”. Between 2012 and 2015, an average of 10 per cent of Australia-born
respondents strongly disagreed, a further 17 per cent disagreed – a combined
27 per cent.15
The 2014 Scanlon Foundation online
survey of third generation Australians
asked if it is “best if people forget their
different ethnic and cultural backgrounds
as soon as possible”; 23 per cent indi-
cated strong agreement or agreement,
and a further 15 per cent somewhat
agreed, a combined 38 per cent.16
An Ethnic and Cultural Tolerance Scale was used to analyse the Au@2015 survey,
the results of which were based on nine survey questions. Low scores (in the
range 0–9 on a scale with a maximum score of 45) were obtained by 29 per cent
of third generation Australians. This was more than three times the proportion
(8 per cent) obtained by Australia-born citizens with one or both parents born
in a non-English speaking country. Of all Australia-born, 26 per cent obtained
low-scores.
“ While there is strong support in Australia for
immigration and for the policy of multiculturalism,
close to 35 per cent consider that the immigration
intake is too high and 11 per cent disagree that
multiculturalism has been good for Australia.”

M i g r a t i o n : t h e e c o n o M i c d e b a t e
37
The most significant variance for Australia-born respondents was based on five
key attributes. These were:
• Political alignment – a relatively high proportion of negative scores were obtained
by those intending to vote Independent (44 per cent) or National (41 per cent).
This was compared to Liberal (17 per cent), Labor (12 per cent) and Greens
(one per cent).
• Level of education – a small proportion of those with Bachelor (12 per cent)
or higher degree (eight per cent) obtained a low score. Those whose highest
qualification is at the trade or apprentice level were more likely to receive a low
score (61 per cent).
• Gender – 35 per cent of men obtained low scores, whereas a much lower
17 per cent of women obtained low scores.
• Financial situation – respondents who described their financial situation as “just
getting along”, or “struggling to pay bills” were more likely to obtain a low score
(both responses scoring 32 per cent), as were those who described their finan-
cial situation as “poor” (37 per cent).
• Regional analysis found 22 per cent of low scores came from major cities,
26 per cent from inner regional areas, and 42 per cent came from outer regional
areas.17
Immigrant experiences
The Au@2015 survey and focus groups provide insight into attitudes within the
immigrant population. The broad findings support international comparisons that
rank Australia as a good country for native
born citizens and for immigrants.
When Au@2015 asked immigrants who
arrived over the last 15 years to indicate their
level of happiness in Australia, only 13 per
cent indicated that they were very unhappy
or unhappy, and just six per cent indicated
that they are strongly dissatisfied or dissatis-
fied with their life in Australia. Recent arrivals
are optimistic for their future; when presented with the proposition that “Australia
is a land of economic opportunity where in the long run, hard work brings a better
life”, only six per cent disagreed.
However, a closer analysis indicates that findings are not at the same positive
level for all. There is indication of difficulties and heightened dissatisfaction among
those who entered Australia under Skill Independent visas, New Zealand Special
Category visas (SCV) and Student visas. Additionally, members of a number of
Asian and African national groups experienced high levels of discrimination.
A number of studies of labour force outcomes have been undertaken using
census data.18 Key predictors of economic success include field of qualification,
“ Recent arrivals are optimistic for their future;
when pre sented with the proposition that
‘Australia is a land of economic opportunity
where in the long run, hard work brings a better
life’, only six per cent disagreed.”
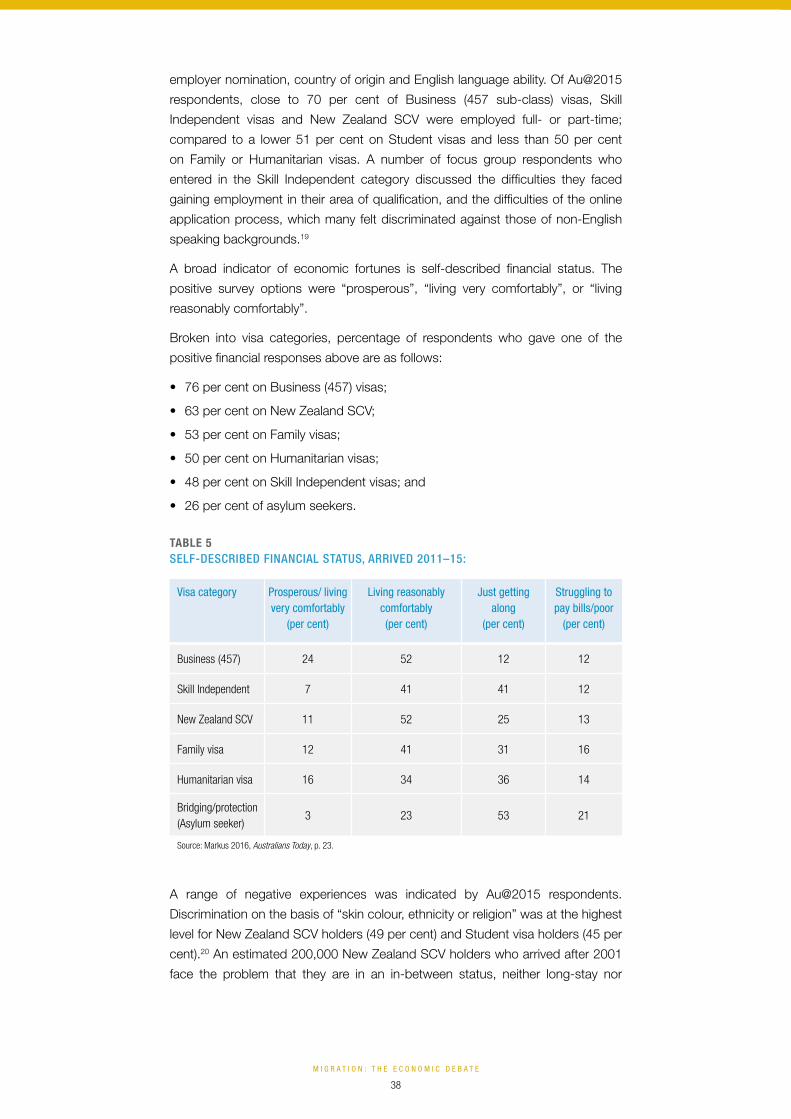
M i g r a t i o n : t h e e c o n o M i c d e b a t e
38
employer nomination, country of origin and English language ability. Of Au@2015
respondents, close to 70 per cent of Business (457 sub-class) visas, Skill
Independent visas and New Zealand SCV were employed full- or part-time;
compared to a lower 51 per cent on Student visas and less than 50 per cent
on Family or Humanitarian visas. A number of focus group respondents who
entered in the Skill Independent category discussed the difficulties they faced
gaining employment in their area of qualification, and the difficulties of the online
application process, which many felt discriminated against those of non-English
speaking backgrounds.19
A broad indicator of economic fortunes is self-described financial status. The
positive survey options were “prosperous”, “living very comfortably”, or “living
reasonably comfortably”.
Broken into visa categories, percentage of respondents who gave one of the
positive financial responses above are as follows:
• 76 per cent on Business (457) visas;
• 63 per cent on New Zealand SCV;
• 53 per cent on Family visas;
• 50 per cent on Humanitarian visas;
• 48 per cent on Skill Independent visas; and
• 26 per cent of asylum seekers.
A range of negative experiences was indicated by Au@2015 respondents.
Discrimination on the basis of “skin colour, ethnicity or religion” was at the highest
level for New Zealand SCV holders (49 per cent) and Student visa holders (45 per
cent).20 An estimated 200,000 New Zealand SCV holders who arrived after 2001
face the problem that they are in an in-between status, neither long-stay nor
Table 5 sElf-DEsCribED finAnCiAl stAtus, ArrivED 2011–15:
Visa category Prosperous/ living very comfortably
(per cent)
Living reasonably comfortably (per cent)
Just getting along
(per cent)
Struggling to pay bills/poor
(per cent)
Business (457) 24 52 12 12
Skill Independent 7 41 41 12
New Zealand SCV 11 52 25 13
Family visa 12 41 31 16
Humanitarian visa 16 34 36 14
Bridging/protection (Asylum seeker)
3 23 53 21
Source: Markus 2016, Australians Today, p. 23.

M i g r a t i o n : t h e e c o n o M i c d e b a t e
39
permanent. This leaves them free to work and pay taxes in Australia, but ineligible
for a range of benefits, including unemployment and sickness benefits and HECS
assistance for students until they have been resident for 10 years.21
The lowest level of personal trust, indicated by those of the view that in personal
interactions “you can’t be too careful”, was among New Zealand SCV holders (63
per cent) and Humanitarian visa holders (52 per cent). In response to the ques-
tion “has your experience of Australia has been more positive than you expected
before your arrival, or has it been more negative?” more than a quarter (28 per
cent) of New Zealand SCV holders who arrived in Australia between 2001 and
2015 answered “much more negative” or “more negative”, followed by 21 per
cent of Student visa holders, and 19 per cent Skill Independent visa holders.22
Integration in the computer age
Earlier generations of immigrants, such as those who arrived in the boom post-
war decades, were in large measure isolated from families and friends who stayed
behind. They kept in touch primarily by mail as telephone calls were very expen-
sive and used only on special occasions, usually for just a few minutes. A return
visit might occur once in a lifetime, and then only after decades in Australia. For
most there was little access to newspapers and movies from their homelands.
The experience of immigrants today has been vastly changed by a new freedom:
the communications revolution that’s transforming the lives of both the Australia-
born and of immigrants, and in the process portending significant social change
for Australia.
Almost seven out of 10 respondents to the 2013 Scanlon Foundation Recent
Arrivals survey and close to 80 per cent of Au@2015 respondents who arrived
since 2001 indicated that they are in contact with their overseas relatives or
friends every day or several times a week. The most popular form of contact
is through social media, such as Facebook, although Skype and other internet
based video communication, mobile phones, and email are also much used.
Table 6 “ how oftEn Do you kEEP in ContACt with friEnDs AnD rElAtivEs from your formEr homE Country?” by sms AnD soCiAl mEDiA, by yEAr of ArrivAl:
2011–15 (per cent)
2006–10 (per cent)
2001–05 (per cent)
1991–2000 (per cent)
1981–90 (per cent)
Every day 43 44 36 32 25
Several times a week
28 31 29 27 28
Total 71 75 65 59 53
Source: Markus 2016, Australians Today, p. 107.

M i g r a t i o n : t h e e c o n o M i c d e b a t e
40
A high proportion of the 2013 Recent Arrivals survey respondents indicated
regular visits to friends or relatives in former home countries. Close to 45 per cent
of recent arrivals (2000–10) from a number of Asian countries visited their former
homeland at least once a year, while 15–30 per cent of immigrants from Europe
and the US and Canada visited home at least once a year.23 The pattern of such
visits is a consequence not only of cheaper air fares, but also of the new context
for immigration, where more than half of immigrants originate from Australia’s
geographical region, where visits home don’t involve travelling long distances
compared to Europe.
Low cost media access also facilitates active contact with former home countries.
Of those who arrived between 2006–15, over 65 per cent access news reports
on the internet and close to a one-third watch television from their former home
countries on cable or satellite every day or several times a week.24
The impact of the communication revolution on adoption of Australian identity by
immigrants – and on the identity of the Australia-born – is yet to be determined.
Au@2015 provides some evidence of what may be a delayed identification
among arrivals during their first 15 years in Australia. Survey results show over
this initial 15-year period there is little increase in a sense of belonging in Australia.
However, there is inadequate evidence to determine if this is a new development
or if it has always been a feature of the immigrant experience.
Reflections
Immigration is a difficult process for the host society and immigrant – and
Australia does as well as any country in its selection and settlement policies. A
range of positive indicators have been noted, including the positive outlook of
recent arrivals.
In Australia there is a range of views on immigration and cultural diversity, as on all
issues within the political realm. While there has been majority support for immi-
gration and multicultural policy over the last decade, in contrast with much of
Europe, minority viewpoints continue to be strongly held, evident in public cam-
paigns and elections. A key issue in determining levels of acceptance is perceived
willingness of immigrants to integrate.
Table 7 “ to whAt ExtEnt Do you hAvE A sEnsE of bElonging in AustrAliA?” ovErsEAs born by yEAr of ArrivAl:
2011–15 (per cent)
2006–10 (per cent)
2001–05 (per cent)
1991–2000 (per cent)
1981–90 (per cent)
Great extent 29 25 26 38 49
Moderate extent
34 40 39 45 39
Sub-total 63 66 65 82 88
Source: Markus 2016, Australians Today, p. 100.

M i g r a t i o n : t h e e c o n o M i c d e b a t e
41
Analysis by visa categories finds heightened dissatisfaction among those who
gain residence under Skill Independent visas, New Zealand SCV and Student
visas. Responses to a range of questions contrast the positive experiences of
those in employer sponsored visa categories and independent arrivals. Skill
Independent entrants meet requirements to gain a visa, but many encoun-
ter difficulties in obtaining employment in their area of qualification. Obstacles
include difficulties of navigating unfamiliar institutional requirements and lack of
local experience. Many form the view that the job selection process, whose first
requirement is an online application, discriminates on the basis of ethnicity, creat-
ing barriers that had not been expected in a first world country such as Australia.
endnotes
1 Reports on Scanlon Foundation surveys are available at the Mapping Australia’s Population website, http://monash.edu/mapping-population/
2 Reitz, J 2011, Pro-immigration Canada. Social and economic roots of popular views, IRPP Study, No. 20, October; Markus, A 2012, ‘Immigration and public opinion’, in Pincus, J and Hugo, G (Eds), A Greater Australia: Population, Policies and Governance, CEDA, Melbourne, pp. 114-132
3 International Organization for Migration 2015, How the World Views Migration, accessed at http://publications.iom.int/books/how-world-views-migration, 29 August 2016
4 Eurobarometer 82, 2014, Public Opinion in the European Union, accessed at http://ec.europa.eu/public_opinion/archives/eb/eb82/eb82_en.htm, 29 August 2016
5 Pew Research Centre, 2014, ‘Most support limiting immigration’, accessed at http://www.pewglobal.org/2014/05/12/chapter-3-most-support-limiting-immigration/, 29 August 2016
6 Pew Research Centre, 2016, ‘Americans’ views of immigrants …’, accessed at http://www.pewresearch.org/fact-tank/2016/04/15/, 29 August 2016
7 The Environics Institute 2015, Focus Canada, ‘Canadian public opinion about immigration and multiculturalism’, accessed at http://www.environicsinstitute.org/, 29 August 2016
8 Goot, Murray 1999, ‘Migrant numbers, Asian immigration and multiculturalism: trends in the polls, 1943–1998’, National Multicultural Advisory Council, Australian Multiculturalism for a New Century, Statistical Appendix part 2.
9 Markus, Andrew 2015, Mapping Social Cohesion, The Scanlon Foundation Surveys: National Report 2015, p. 36
10 ANU Poll 2015, Australian Attitudes Towards National Identity: Citizenship, Immigration and Tradition, pp. 17–18, accessed at http://politicsir.cass.anu.edu.au/research/projects/electoral-surveys/anupoll , 29 August 2016
11 Oliver, Alex 2016, The Lowy Institute Poll 2016, Understanding Australian Attitudes to the World, accessed at http://www.lowyinstitute.org/programs-and-projects/programs/polling, 29 August 2016, pp. 15, 27
12 Markus 2015, op cit, p. 41
13 Markus, Andrew 2013, Mapping Social Cohesion, The Scanlon Foundation Surveys: National Report 2013, p. 34
14 Markus, Andrew 2016, Australians Today: The Australia@2015 Scanlon Foundation Survey, p. 79
15 Ibid, p. 19
16 Markus 2015, op cit, p. 51
17 Au@2015 survey, analysis of Australia born respondents; see also Markus, Australians Today, part 5, Attitudes to Cultural Diversity
18 See, for example, Hawthorne, Lesleyanne 2015, ‘The Impact of Skilled Migration on Foreign Qualification Recognition Reform in Australia’, Canadian Public Policy, August, p. s184; Hawthorne, Lesleyanne and To, Anna 2014, ‘Australian Employer Response to the Study-Migration Pathway’, International Migration, pp. 104-5
19 Markus, Australians Today, pp. 19, 26-27
20 Ibid, p. 64
21 Hamer, Paul 2016, ‘200,000 New Zealanders live in Australia without a helping hand’, Right Now: Human Rights in Australia, accessed at http://rightnow.org.au/opinion, 14 April
22 Markus, Australians Today, pp. 43, 35
23 Markus, Andrew 2014, Mapping Social Cohesion, The Scanlon Foundation Surveys: Recent Arrivals Report 2013, pp. 31-32
24 Markus, Australians Today, p. 107

M i g r a t i o n : t h e e c o n o M i c d e b a t e
42
references
ANU Poll 2015, Australian Attitudes Towards National Identity: Citizenship, Immigration and Tradition, pp. 17–18, accessed at http://politicsir.cass.anu.edu.au/research/projects/electoral-surveys/anupoll , 29 August 2016
Environics Institute 2015, Focus Canada, ‘Canadian public opinion about immigration and multiculturalism’, accessed at http://www.environicsinstitute.org/, 29 August 2016
Eurobarometer 82, 2014, Public Opinion in the European Union, accessed at http://ec.europa.eu/public_opinion/archives/eb/eb82/eb82_en.htm, 29 August 2016
Goot, Murray 1999, ‘Migrant numbers, Asian immigration and multiculturalism: trends in the polls, 1943–1998’, National Multicultural Advisory Council, Australian Multiculturalism for a New Century, Statistical Appendix part 2.
International Organization for Migration 2015, How the World Views Migration, accessed at http://publications.iom.int/books/how-world-views-migration, 29 August 2016
Hamer, Paul 2016, ‘200,000 New Zealanders live in Australia without a helping hand’, Right Now: Human Rights in Australia, accessed at http://rightnow.org.au/opinion, 14 April
Hawthorne, Lesleyanne and To, Anna 2014, ‘Australian Employer Response to the Study-Migration Pathway’, International Migration, vol. 53 (3), pp. 99–115
Hawthorne, Lesleyanne 2015, ‘The Impact of Skilled Migration on Foreign Qualification Recognition Reform in Australia’, Canadian Public Policy, supplement 1, vol. 41, pp. s173–s187
Markus, A 2012, ‘Immigration and public opinion’, in Pincus, J and Hugo, G (Eds), A Greater Australia: Population, Policies and Governance, CEDA, Melbourne, pp. 114–132
Markus, Andrew 2013, Mapping Social Cohesion, The Scanlon Foundation Surveys: National Report 2013
Markus, Andrew 2014, Mapping Social Cohesion, The Scanlon Foundation Surveys: Recent Arrivals Report 2013
Markus, Andrew 2015, Mapping Social Cohesion, The Scanlon Foundation Surveys: National Report 2015
Markus, Andrew 2016, Australians Today: The Australia@2015 Scanlon Foundation Survey
Oliver, Alex 2016, The Lowy Institute Poll 2016, Understanding Australian Attitudes to the World, accessed at http://www.lowyinstitute.org/programs-and-projects/programs/polling, 29 August 2016, pp. 15, 27
Pew Research Centre, 2014, ‘Most support limiting immigration’, accessed at http://www.pewglobal.org/2014/05/12/chapter-3-most-support-limiting-immigration/, 12 May
Pew Research Centre, 2016, ‘Americans’ views of immigrants …’, accessed at http://www.pewresearch.org/fact-tank/2016/04/15/, 15 April
Reitz, J 2011, Pro-immigration Canada. Social and economic roots of popular views, IRPP Study, No. 20, October

M i g r a t i o n : t h e e c o n o M i c d e b a t e
43
This chapter looks at how the growth of working
holiday visas and student visas has created a
continuous, temporary, low-skilled migration stream,
which is potentially competing with naturalised
citizens for job opportunities.
2. Australia’s de facto low skilled migration program
Dr Anna Boucher

M i g r a t i o n : t h e e c o n o M i c d e b a t e
44
Dr Anna boucher is a senior lecturer in public policy and political
science at the University of Sydney and her research focuses on
immigration. Her book Gender Migration and the Global Race for
Talent (Manchester University Press 2016) analyses skilled
immigration policies globally. Her second book, Crossroads of
Migration: A Global Approach to Policy Differences (under contract with Cambridge
University Press, New York) compares immigration outcomes across 51 countries. Prior to
coming to the University of Sydney, she was an Australian Commonwealth Scholar at the
London School of Economics.
Executive summary
There has been a pronounced and significant shift to temporary migration in
Australia over the last decade. A growing portion of this temporary migration is
relatively low skilled. To maintain the community’s confidence and support for the
immigration program it is important to ensure that:
• Exploitation of workers on temporary visas does not take place;
• Ethnicisation of segments of the labour market is not being encouraged; and
• The labour market effects of temporary immigration are not overtly affecting key
disadvantaged groups, in particular, young people.
To assess this final point, more research on the Australian case is needed both
nationally and within key regions of high youth unemployment.

M i g r a t i o n : t h e e c o n o M i c d e b a t e
45
Introduction
It is timely to consider the effects of immigration upon domestic unemploy-
ment in Australia. As the recent British referendum demonstrates, a failure by
policy-makers to adequately manage fears (manufactured or real) of the labour
market impact of immigration can contribute to political and social disunity. While
Australia does not face the same pressures of a federal collapse as Europe, the
fact that Australia has one of the highest rates of immigration per capita of any
democratic country,1 in addition to a growing trend to accept low-skilled migrants,
makes it a timely moment to consider Australia’s temporary immigration channels
and their contribution to the labour market outcomes of Australian-born workers
and naturalised citizens.
This chapter takes the somewhat unorthodox perspective that key aspects of
Australia’s current temporary migration program, in particular Working Holiday
visas and International Student visas, constitute a de facto low-skilled labour
program in Australia. This creates potential for labour market effects that must
be more seriously assessed than previously by researchers and policy-makers.
This chapter demonstrates the need for a clear research agenda on this topic,
targeted to the Australian case.
This chapter contains three main sections. First, it provides an account of these
temporary visas and their growth within the broader Australian immigration
program. Second, it outlines some of the potential implications of these forms
of migration for the Australian labour market, identifying unanswered questions
around the effects for the unemployment of young Australians in particular. This
includes some consideration of the new Temporary Graduate visa (485 visa).
Finally, the policy brief outlines policy prescriptions and future avenues for
research on this topic.
Australia’s temporary migration program
Temporary migration into Australia has eclipsed permanent flows since at least
the early 2000s.2 Temporary immigration comprised approximately 67 per cent
of net overseas migration into Australia in 2013–2014.3 Despite the prevalence of
temporary immigration, as recently as 2011, immigration ministers have avoided
discussion of a “guest worker society” in Australia and have focused conversa-
tions on the virtues of the permanent settlement of immigrants.4 In contrast,
the current Secretary of the Australian Department of Immigration and Border
Protection, Mike Pezzullo, has recently argued that Australian policy-makers
should be wary of the “trap of sentimentality” that preferences traditional forms
of permanent settlement, despite the fact they are dwarfed in any case by large-
scale temporary migration.5

M i g r a t i o n : t h e e c o n o M i c d e b a t e
46
At the same time, the message from the current Federal Government is more
confused; the Minister of Immigration and Border Protection, Peter Dutton, has
not embraced the shift towards temporary immigration as openly as his Secretary
has, and the Minister for Employment, Senator Michaelia Cash announced a
parliamentary inquiry into key forms of temporary immigration in 2015. The
crossbench report that emerged contains fairly self-critical reflections regarding
the protections offered to temporary migrant workers in Australia through current
legal arrangements.6 Yet, over this period, the Federal Government also expanded
the Working Holiday visa program by allowing visa holders working in a number
of industries to work with their employer for 12 months, rather than six. This move
will likely continue to support the “working” rather than “holidaying” dimensions
of the visa remit, especially as the chosen industries include care work, where
Australia faces a chronic domestic undersupply of workers.7
Despite these mixed policy moves from different sections of Federal Government,
a shift towards low skilled temporary immigration within Australia’s overall immi-
gration program is both discernible and accelerating. Three key categories of the
temporary program are considered in this chapter:
1. Temporary Work (Skilled) 457 visas: This is the category that has received the
most media and policy attention. Entry into this visa class remains strong at
85,611 visas issued in the financial year 2015–2016, although this is down
from 96,084 in the previous year.8 Importantly, given the focus in this chapter
upon low skilled immigration, a wage threshold test known as the Temporary
Skilled Migration Income Threshold (TSMIT) controls entry of semi- and low-
skilled workers through 457s, with the exception of some negotiated entry in
regional areas through arrangements known as the Designated Area Migration
Agreement (DAMA). These agreements allow a 10 per cent concession on
the current TSMIT setting of $53,900 per annum.9 Although entry through the
DAMA stream is currently small, there are no clear caps and there is strong
expansionary potential in the future. In Canada, where regional concessions in
salary thresholds were permitted for its Temporary Foreign Worker Program,
this policy contributed to considerable expansion in those provinces that
granted such concessions.10
2. International Student visas (500); and Post-Study visas (485): In the financial
year 2014–2015, Australia granted 299,540 student visas,11 which represents
an 80 per cent increase over the preceding decade.12 Furthermore, in the
calendar year 2014–2015, 22,895 Post-Study 485 visas were issued.13 As
the name suggests, this latter visa allows previous international students
to remain in Australia for up to four years after they finish their studies, with
limited labour market restrictions. While the number of 485 visa grants is small
at present, government predicts significant growth of up to 200,000 entrants
in 2017–2018 as more international students complete their current degrees
but are ineligible for alternate visas to remain.14 As such, the 485 visa category
represents a future growth area within the temporary economic immigration
program that warrants more attention than it has received to date from a labour
market perspective.

M i g r a t i o n : t h e e c o n o M i c d e b a t e
47
3. Working Holiday-Makers (417 and 462 visas): This visa category started as a
small form of inflow for young people from the UK and Canada for work and
travel purposes in 1975.15 In the decade leading to 2014, it has increased
by 170 per cent, amounting to 239,592 entrants in the financial year 2013–
2014.16 Furthermore, the source countries represented in bilateral Working
Holiday-Maker (WHM) agreements has diversified dramatically to include a
larger number of countries, some of which have significant wage differentials
with Australia.17 As noted, throughout 2015, following on from recommenda-
tions in the White Paper on Developing Northern Australia, rules attached to
the visa were reformed, liberalising restrictions on working periods for WHMs
across a number of sectors.18
Consequences of a de facto low skilled program
The potential labour market consequences of these three channels of temporary
immigration relate in part to the influx into the labour market of these workers.
At the same time, the working rights and restrictions of these visa holders also
shape the potential labour consequences for Australian-born workers and natu-
ralised citizens.
It is important to note that although the focus here is upon the legal provisions
for each class of temporary migrant workers, as the recent Senate Inquiry
documented, real life practices can deviate significantly from employment law
conditions.19 While the focus of these breaches
has primarily been on the implications of these
breaches for migrant workers, there can also be
consequences for the Australian-born workers
and naturalised citizens in the sense that mis-
treatment of temporary migrant workers may
undermine general adherence to Australian
working standards. In another scenario,
exploiting one group of workers may create an
ethnicised and contingent workplace in certain
occupational areas, which incumbent workers
in turn avoid.20
While acknowledging these complicating factors, this chapter focuses upon the
legal framework of working rights, and the academic literature from economics
on the potential consequences of temporary immigration for the labour market
opportunities of incumbents.
Working rights differ for temporary visa holders in Australia. Temporary Worker
(Skilled) visa holders are bound to their sponsoring employer. In contrast,
International Student visa holders are not subject to conditions other than a
restriction to 40 hours of paid work per fortnight during the semester and enjoy
unlimited work during holiday periods.
“ Despite these considerable mixed policy
moves from different sections of Federal
Government, a shift towards low skilled
temporary immigration within Australia’s
overall immigration program is both
discernible and accelerating.”
M i g r a t i o n : t h e e c o n o M i c d e b a t e
48
WHMs may work for up to six months with an employer on a year-long visa;
however, they can extend this to an additional year if they are prepared to work in
regional Australia for at least three months. Furthermore, as noted above, since
2015, WHMs can apply to extend a six-month placement with one employer for
a further six months in a large number of occupations, including au pair work,
aged and disability care, primary agriculture, some areas of construction, areas of
mining and certain parts of the tourism industry.21
Post-Study visa holders can work between 18 months to four years after gradua-
tion and are not restricted by employer or working hours. In short, factoring in the
working rights attached to these visas and the scope of employment opportuni-
ties across a wide range of industries and
occupations, there is a strong argument to
be made that Australia already has, or is
close to developing, a de facto low skilled
migration program, that in its size and
scope significantly eclipses the skilled per-
manent program.
Putting aside the legal rules that structure
the work opportunities of individuals on
these visas, we should also consider the associated employment outcomes.
Here, evidence is more mixed as the last major survey on the working patterns
of WHM visa holders was conducted in 2009.22 The data that do exist make
clear that while International Student visas and WHM visas are formally viewed as
study and tourism visas respectively, individuals on these visas are also engaging
in high levels of employment.
For instance, WHMs have an employment rate of at least 69 per cent,23 while
international students have rates of between 59 to 70 per cent.24 Furthermore,
WHMs have disproportionately engaged in the horticulture and hospitability
sectors, and on average earned around $16 per hour in 2008, which was margin-
ally above the minimum award wage for that year.25
Labour market effects of temporary immigration in Australia
Evidence on the domestic labour market imapact of temporary immigration is
mixed. A study by the National Institute of Labour Studies on the effects of WHM
visas upon domestic youth unemployment in Australia did not give a categori-
cal answer to the question of domestic labour market impact, commenting that:
“It is still possible that on balance (WHM visas) reduce the job opportunities for
Australians in local labour markets. We do not have direct evidence on this point.
We do know that WHMs overwhelmingly worked in relatively unskilled jobs that
most Australians could do.”26
Research by Cully from 2009 demonstrates that while temporary migrants
comprised only 4.2 per cent of the workforce for the general civilian population,
they comprised 17.9 per cent of the workforce for the 20–24 age bracket.27 The
Productivity Commission also estimates that in the year 2014–2015, temporary
migrants represented 50 per cent of the growth in the youth labour market.28 As
“ The data that do exist make clear that while
International Student visas and WHM visas are
formally viewed as study and tourism visas
respectively, individuals on these visas are also
engaging in high levels of employment.”

M i g r a t i o n : t h e e c o n o M i c d e b a t e
49
the numbers of young temporary migrants increases as a result of the Post-Study
visa expansion discussed above, these age distributions are likely to become
more skewed towards the younger age bracket.
We also know at the same time that the unemployment figures of Australian youth
remain stubbornly high. This is true of school leavers aged 15–19. Unemployment
levels in this age bracket for those who are neither in employment nor full-time
study, sits at 17.7 per cent.29 Graduate outcomes for Australian students aged
20–24 are also poor. The percentage of graduates in full-time employment within
four months after completion of their degree currently stands at around 69 per
cent, which is down significantly from 85 per cent prior to the onset of the Global
Financial Crisis.30 The question that emerges from these data is whether such
changes are simply a product of broader shifts in the labour market, or whether
temporary migration, at least in part, is displacing low-skilled workers in the first
category and competing for graduate positions in the second.
Recent research commissioned by the Australian Productivity Commission in
2015 demonstrates a correlation between increased stock of migrants and
increased youth unemployment among Australian-born workers and naturalised
citizens.31 This research is contrary to the orthodox position taken by Australian
economists that immigration has had largely neutral or even positive effects upon
Australian workers.
Yet, historically, this research has focused on the macro-level with limited
work upon particular segments of the Australian population, such as youth.
Furthermore, some of this research is now dated and therefore does not capture
the policy trends outlined above. For instance, Addison and Worswick’s recent
foundational study that finds no negative effect of immigration across 48 regions,
relies upon data from 2001.32 Other studies conducted more recently either do
not take particular sub-groups such as young people as an affected category,33
or fail to differentiate between visa categories.34 Alternately, these studies were
undertaken during a period when the inflow of WHMs was much lower.35
A recent article by Breunig and collaborators finds that once experience and edu-
cation are controlled for, there is no evidence that immigration has had harmful
labour market effects in Australia.
Adopting a national labour market
approach, these authors argue that
immigration has been largely benign.
However, they do identify some negative
effects from recent arrivals (over the last
five years) upon the employment and
wages of Australian-born.36
Several critiques can be levelled at
this study. First, given that the paper operates from a national labour market
approach, it may fail to capture regional effects that have been found to be impor-
tant in labour market studies in Australia. This critique is particularly important
with regards to youth unemployment, where there is strong regional variation in
unemployment rates across Australia.37
“ Recent research commissioned by the Australian
Productivity Commission in 2015 demonstrates a
correlation between increased stock of migrants and
increased Australian-born workers and naturalised
citizen youth unemployment.”

M i g r a t i o n : t h e e c o n o M i c d e b a t e
50
Second, it does not control for the visa status of migrant groups. Yet, as outlined
above, given differences in the working rights and permission to remain of dif-
ferent visa holders, it is plausible that visa status could inform the preference by
employers for certain visa holders over others, or for Australian-born workers and
naturalised workers. Temporary visa holders for instance, might be viewed as a
more flexible labour market than those on permanent visas and therefore lead to
greater displacement effects for incumbents.
Third, the article conducts a number of dissimilarity tests to counter a possible
occupational downscaling of recently arrived migrants into lower paid jobs. The
authors find that while there is some evidence of downscaling for highly skilled
migrants, migrants and native-born are undertaking similar jobs for their experi-
ence level.38 However, there are several concerns with the way this dissimilarity
test is undertaken that may affect the conclusions reached. First it only considers
downgrading of those in employment, but not other labour market outcomes,
such as participation and unemployment rates addressed elsewhere in the
study. Second, it only considers the top three occupations for each education
and experience paring, leaving approximately 40–50 per cent of possible parings
unchecked for such downscaling. Third, while migrants generally do not appear
to have a negative effect upon domestic wages, there is some evidence of this
effect for those with one to 10 years of experience.39
The authors do not further investigate this relationship between experience and
age in this regard, although it is precisely this range where there will be the large
temporary migrant inflows into the labour market through former international stu-
dents, once the Post-Study visa intake expands from 2017 and where, as noted,
there is high unemployment among recent Australian-born graduates. These
critiques of the occupational dissimilarity method may appear unduly technical;
however, a recent study by Harvard University economist Borjas emphasises
the importance of accurate skills matching in order to accurately assess labour
market effects and to generate meaningful policy recommendations.40 It is worth
noting that the Productivity Commission’s final report on Migrant Intake, takes a
regional labour market approach and does not find a negative effect upon youth
unemployment.41
International research on the relationship between temporary immigration and youth unemployment
International research presents an empirical and theoretical basis for further
investigation in Australia of the relationship between unemployment and rising
rates of temporary immigration. Research undertaken by the American Federal
Reserve since the global financial crisis demonstrates some displacement of
young Americans through low-skilled immigrant labour.42 Ruhs and Vargas-Silvia’s

M i g r a t i o n : t h e e c o n o M i c d e b a t e
51
(2015) overview of the British scholarship notes that the Migration Advisory
Committee in the UK found non-EU immigration (but not EU immigration) was
associated with a reduction in employment of British workers from 1995–2010
and this research has been corroborated elsewhere.43
While some British researchers find no effect either way upon welfare beneficia ries
– another vulnerable group44 – other studies identify increased migrant represen-
tation in the labour market as having a negative effect on the probability of work
for incumbents with O-Level education (equivalent to Year 10 in the Australian
system) when compared with natives with higher educational levels.45
Application of international research to Australia
As a result of EU membership, the UK has historically provided a different policy
context for immigrant labour market effects than what is observed in Australia.
Free movement, particularly from the new accession states, has contributed to
large-scale inflow of immigrants into the British labour market with broadly similar
occupational levels to native born.46 In contrast, Australia has in recent years been
identified as a country where the skill and education levels of immigrants exceed
those of Australian-born workers and naturalised
citizens.47 Nonetheless, there are reasons to be
attentive to the shifting policy context in Australia
and the implications that this might hold for
changes to the composition of immigration flows,
and in turn, subsequent labour market effects.
First, as noted above, the largest increases within
the migration program have been in the low- and
semi-skilled space through the dramatic expan-
sion of International Student and WHM visa intake.
In this sense, this form of immigration is not dissimilar from the supply-driven
immigration into the UK from the new accession states; there is no upper cap
on allocations into these visa categories and push factors from sending countries
largely inform flows. Second, as noted earlier, grants into the 485 Post-Study
visa category are anticipated to increase sharply from 2017, which will result in
a strong influx of international graduates with limited work restrictions who are
seeking graduate positions in direct competition with Australian-born graduates.
Finally, high rates of youth unemployment in Australia and real concerns over
the future viability of key sectors such as manufacturing, present questions over
the implications of growing rates of low skilled immigration into Australia. As
the Productivity Commission argued in its Draft Report on Migrant Intake, more
research is needed on the possible distributional effects of these forms of low
skilled immigration upon particular groups within the Australian labour market.48
“ High rates of youth unemployment in
Australia and real concerns over the
future viability of key sectors such as
manufac turing, present questions over the
implications of growing rates of low skilled
immigration into Australia.”

M i g r a t i o n : t h e e c o n o M i c d e b a t e
52
Recommendation and policy prescriptions
The Senate Education and Employment References Committee released its
report on Australia’s temporary immigration programs in March 2016. Among
its long list of recommendations was investigation into the possible capping of
the WHM program. The report also recommended further regulatory changes
to increase the integrity of this program and to minimise the exploitation experi-
enced by some WHMs and international students working on associated visas.49
Another possible policy solution that has been raised is the creation of a formal
fit-for-purpose guest worker program to replace existing channels of entry for
low- and semi-skilled migrants with the view that this would offer better labour
protections.50 Yet, the thrust of these policy recommendations in both cases
remains upon improving the protections of temporary migrant workers – a legiti-
mate and important endeavour – but less so upon measuring and minimising the
impact upon Australian-born workers and naturalised citizens, both Australian
and overseas-born.
Research and data collection on this topic is vitally needed, particularly in light of
high and intransigent youth unemployment, and the likely future expansions in the
temporary migrant worker area in coming years both as a result of the recom-
mendations of the white paper on Developing Northern Australia and international
student migration. It seems inappropriate to continue expansion of the WHM visa
program in particular until the distributional effects upon existing Australian-born
and naturalised workers have been established.
Key recommendations are as follows. The Federal Government should:
• Collect and publish better data on the employment outcomes of those migrants
on WHM and international student visas; and
• Commission further research on the relationship between youth unemployment
and temporary immigration, through detailed case studies, as recommended in
the Productivity Commission Report on Migrant Intake.51
The author thanks Mark Cully, Nathan Taylor, Lesleyanne Hawthorne, Stephen Clibborn, Chris Wright, Josh Healy, Joanne Howe and David Smith for comments on this article and assistance with data.

M i g r a t i o n : t h e e c o n o M i c d e b a t e
53
endnotes
1 Anna Boucher and Justin Gest (2016, forthcoming) Crossroads of Migration: A Global Approach to National Differences, Cambridge University Press, New York, Chapter 3, drawing upon United Nations Department of Economic and Social Affairs, New York, 2015 Migrant Stock reprint. From 2010–2015 these data indicate that the annual increase in migrant stock in Australia was 2.92 %. The average for the developed world in contrast was 1.87%.
2 Peter Mares (2016) Not Quite Australian: How Temporary Migration is Changing the Nation, Text Publishing, Melbourne University, p.55, compared with permanent flow data collected and published in Boucher, Anna (2016) Gender, Migration and the Global Race for Talent, Manchester University Press: Manchester, p.89.
3 Stephen Easton (2015) “Mike Pezzullo inspired by powerful post-war mandarins for immigration’s new way,” The Mandarin, 22 April 2015, available at http://www.themandarin.com.au/31018-days-old-mandarins-bold-immigration-and-border-protection-boss-weaves-narrative/. See also “3412.0 - Migration, Australia, 2014-5, Net Overseas Migration Table, 2.2;, Selected characteristics, State and Territory, 2014-5, NOM” available at http://www.abs.gov.au/ausstats/[email protected]/mf/3412.0/. Note that this percentage is likely to be an underestimate of the relative proportion of temporary stock as those temporary migrants resident in Australia for less than twelve months (such as short-term WHMs and international students) are not included in the NOM calculation, even though they may enjoy working rights.
4 Chris Bowen, Minister for Immigration and Citizenship, ‘The genius of Australian multiculturalism’, address to the Sydney Institute, 17 February 2011, cited at Peter Mares ‘Temporary Migration and its Implications for Australia’, Papers on Parliament No. 57, February 2012
5 Mike Pezzullo (2016) “Immigration Department won’t be trapped by history,” The Mandarin, 2 June 2016, available at http://www.themandarin.com.au/65969-michael-pezzullo-immigration-department-wont-be-trapped-by-history/?pgnc=1, see also note 3.
6 The Australian Senate, Education and Employment References Committee, A National Disgrace: The Exploitation of Temporary Worker Visa Holders, Parliament of Australia, Canberra, March 2016. Although it should be noted that Coalition Senators produced an additional comment to the final report which clarifies that they do not agree with all of the Report’s recommendations.
7 Department of Immigration and Border Protection (2015), “Working in Australia, six months with one employer,” available at https://www.border.gov.au/Trav/Work/Empl/WHM-six-months-one-employer. Australian Government (2015) Our North, Our Future: White Paper on Developing Northern Australia, June 2015, available at http://industry.gov.au/ONA/WhitePaper/index.html, see in particular pages 10 and 112. Australian Workforce and Productivity Agency (2012) “Future focus: Australia’s skills and development needs”, AWPA, Canberra, July 2012, page41.
8 Department of Immigration and Border Protection (2015). Subclass 457 Visas, Granted Pivot table, 2015–16 to 30 June 2016 with previous years, available at www.datagov.au. These figures incorporate both primary and secondary applicants.
9 At present, only one DAMAs has been negotiated between the Australian Department of Border Protection and the Northern Territory government: Senate References Committee, op.cit, 2.78. There are discussions around agreements with the governments of Western Australia, Tasmania and Queensland however, to date, nothing has been implemented.
10 Gross, D.M (2014). “Temporary Foreign Workers in Canada: Are They Really filling Labour Shortages”, C.D. Howe Institute. Ultimately, the “15 per cent rule” as it was known in Canada was removed: Gross, D.M. (2015) “How Can Access to Temporary Foreign Workers Ensure Priority to Domestic Workers? A Canadian policy experiment,” Simon Fraser University School of Public Policy, Research Paper 2015.4, page 4.
11 Department of Immigration and Border Protection (2015). Student visa and temporary graduate visa report, Canberra, p.78.
12 Productivity Commission of Australia (2015). Draft Report on Australia’s Migrant Intake, Canberra, page 66.
13 Ibid, page 69
14 Australian Department of Immigration and Border Protection (2015) Proposal Paper: Simplification of the skilled migration and temporary activity visa programmes – December 2014, Canberra, page 26, cited in Henry Sherrell (2015) “The coming increase of Temporary Graduate Visas,” on valueformoney blog, April 5, 2015.
15 Bai, T., Lester, L, Richardson, S., Sun, L. and Tan, Y. (2008) Evaluation of Australia’s working holiday maker program, Project funded by the Department of Immigration and Citizenship, 2008, project description at www.flinders.edu.au
16 Productivity Commission, op.cit, note 12, pages 51; 66.
17 These include Bangladesh, Turkey, Taiwan and Thailand.
18 See note 7 above.
19 The Australian Senate, Education and Employment Reference Committee, note 6, see in particular Part IV.
20 The argument that reliance on these temporary visas might be contributing to a form of segmented labour market with concentration of migrant workers in key sectors and an ensuing downgrading of working conditions in those sectors, is explored in the Reference Committee report with regard to the meatpacking industry in Queensland: Reference Committee (2015, 116), note 6 above. However, evidence at present is sparse, anecdotal and needs a stronger research base.
21 Department of Immigration and Border Protection (2016) Working in Australia – six months with one employer, applying for permission to work beyond six months with one employer, available at https://www.border.gov.au/Trav/Work/Empl/WHM-six-months-one-employer
22 Tan, Y., Richardson, S., Lester, L., Bai, T., & Sun, L. (2009). Evaluation of Australia’s Working Holiday Maker (WHM) Program. Retrieved from National Institute of Labour Studies, Flinders University.
23 Note that this figure is based on a survey of Working-Holiday Makers in 2007 and 2008 before new agreements were signed with Bangladesh, Turkey, Taiwan and Thailand. As such, it likely underrepresents the scope of labour force engagement as the incentive for individuals with countries with a greater wage differential to Australia to work, is higher: Tan, Y and Lester, L. (2012) “Labour Market and Economic Impacts of International Working Holiday Temporary Migrants to Australia,” Population, Space and Place, 18, 359–383, page 363.
24 Marginson, S, Nyland, C, Sawer, E and Forbes-Mewett, H. (2010) International Student Security, Cambridge, Cambridge University Press, 124. In contrast, Cully, M. (2010) reported that only 28.3 per cent of overseas students in 2006 were employed, however, noted that this low figure could represent deliberate underreporting for fear of visa breaches: Cully, M. (2010) “Migrant Labour Supply: Its Dimensions and Character,” paper presented to the Australian Labour Market Research Workshop, University of Sydney, 15–16 February 2010.
25 Tan, Y., & Lester, L. (2012). Labour Market and Economic Impacts of International Working Holiday Temporary Migrants to Australia. Population, Place and Space, 18, 359–383, 367. Tan et al, 2009, note 23, pages 6–7.

M i g r a t i o n : t h e e c o n o M i c d e b a t e
54
26 Tan et al, 2009, op.cit, note 23, page 57.
27 Cully 2010, op.cit, note 24, page 2. Note, the Productivity Commission (2016) Inquiry Report: Migrant Intake into Australia, Productivity Commission, Canberra, estimates the figure at 13.7 per cent: page 201.
28 Productivity Commission (2016), op.cit, above note 27, page 203.
29 Australian Bureau of Statistics (2016). “6202.0 Labour Force Australia, Table 17, Labour force status for 15-19 year olds by Sex, Trend, Seasonally adjusted and original; unemployed and looking for full-time work,” available at http://www.abs.gov.au/AUSSTATS/[email protected]/DetailsPage/6202.0Jul%202016?OpenDocument.
30 Graduate Careers Australia (2015) ‘Grad Stats: Employment and Salary Outcomes of Recent Higher Education Graduates,” available at http://www.graduatecareers.com.au/wp-content/uploads/2015/12/GCA_GradStats_2015_FINAL.pdfand Graduates Careers Australia (2008),‘GradStats: Number 13, December 2008,” available at http://www.graduatecareers.com.au/wp-content/uploads/2012/01/gca001224.pdf
31 Productivity Commission, 2015, op.cit, note 12, Figure 15.5d-f
32 Addison, T. and C. Worswick. 2002. ‘The impact of immigration on the earnings of natives: Evidence from Australian micro data.’ Economic Record 78:68–78.
33 Kifle, T. 2009. ‘The effect of immigration on the earnings of native-born workers: Evidence from Australia.’ The Journal of Socio-Economics 38:350–356.
34 Bond, M. and N. Gaston. The Impact of Immigration on Australian-born Workers: An Assessment Using the National Labour Market Approach. ‘2011.’ Economic Record 30:400–413. This study also relies upon HILDA data before the inclusion of the 2011 supplement for temporary migrants, which could raise some validity issues. Further, the use of HILDA data to measure migrant stock has been critiqued by Breunig et al (2015, 6-7) as raising endogeneity issues in the sense that HILDA data were used for both outcome data and immigrant share data: Breunig, R., Deutscher, N and To, H.T. (2015) “The relationship between immigration to Australia and the labour market outcomes of Australian-born workers,” Australian National University, 11 December 2015, available at https://crawford.anu.edu.au/people/academic/robert-breunig?tb=researc. See also Sinning, M. and M. Vorell. 2011. There Goes the Neighborhood? People’s Attitudes and the Effects of Immigration to Australia. Bonn: IZA which has also been critiqued by Breunig et al 2015, page 7 for its operationalisation of a regional labour market approach.
35 Tan, Y. et al. 2009. Evaluation of Australia’s Working Holiday Maker (WHM) Program. National Institute of Labour Studies, Flinders University: Adelaide.
36 Breunig et al, op.cit, note 34, page 22
37 Brotherhood of St Laurence (2016) Australia’s Youth Unemployment Hotspots Snapshot, March 2016, page 3., drawing upon ABS 2016, Labour force status by region (ASGS SA4), sex and age, datacube RM1. Debates over whether a national or regional labour market approaches are preferable from both an empirical and methodological perspective dominate this area of research. Dustman et al (2005) defend a regional labour market approach in their study on the basis of low levels of labour mobility across Great Britain: Dustmann, C., F. Fabri and P. Preston. 2005. ‘The Impact of Immigration on the British Labour Market.’ Economic Journal 115:F324-341, F329.
38 Breunig et al, op.cit, note 34, page 19. The authors argue that the magnitude of difference between migrants and incumbents is not big and therefore occupational downgrading for migrants is not great. However, without comparative data, it is difficult to assess whether the differences that are identified are significant or not.
39 Breunig et al, op.cit, note 34, page 21.
40 Borjas, G. (2016) The Wage Impact of the Marielitos: A Reappraisal, NBER Working paper, 21588, available at http://www.nber.org/papers/w21588. See also: Frum, David (2016), “The Great Immigration Data Debate,” The Atlantic, available at http://www.theatlantic.com/politics/archive/2016/01/the-great-immigration-data-debate/424230/. This debate focuses upon the effects of a large inflow of unskilled Cuban refugees into the Miami labour market in 1990 but has methodological implications for Australian studies.
41 Productivity Commission, 2016, above, note 28, page 649. Using regression modelling under several scenarios, the Commission in fact finds a positive effect of immigration upon youth unemployment, although it does argue that further research is needed on this topic, especially given its assumptions about labour substitution. Further, it does not control for visa class in its analysis.
42 Smith, C.L. 2012. ‘The impact of low-skilled immigration on the youth labor market.’ Journal of Labor Economics 30:55–89.
43 Migration Advisory Committee. 2012. Analysis of the Impacts of Migration London: Home Office; Devlin, C., Bolt, O., Patel, D., Harding, D. and Hussain. 2014. Impacts of Migration on UK Native Employment: An Analytical Review of the Evidence. London: Home Office and Department for Business Innovation and Skills.
44 Lucchino, P.C., C. Rosazza-Bondibene and J. Portes. 2012. Examining the Relationship between Immigration and Unemployment using National Insurance Number Registration Data. London: National Institute of Economic and Social Research.
45 Dustmann et al, op.cit, note 37, F336. That said, the authors note that the effects are weakly determined and that this outcome is offset by the elevated earnings for highly educated domestics as a result of immigration.
46 Dustmann et al, op.cit, note 37, F.330.
47 Productivity Commission, op.cit, note 12 at page 137, citing OECD and EU 2015, Indicators of Immigrant Integration, 2015, Settling In, Paris.
48 Productivity Commission, 2015, op.cit, note 12, pages 8–9; 20–21.
49 The Australian Senate, Education and Employment References Committee, note vix, Recommendation 10, page x.
50 Howe, J. and Reilly, A. (2015) “Meeting Australia’s labour needs: the case for a new low-skilled work visa,” Federal Law Review, 42: 259–287.
51 Productivity Commission (2016), op.cit, note 28, page 652.
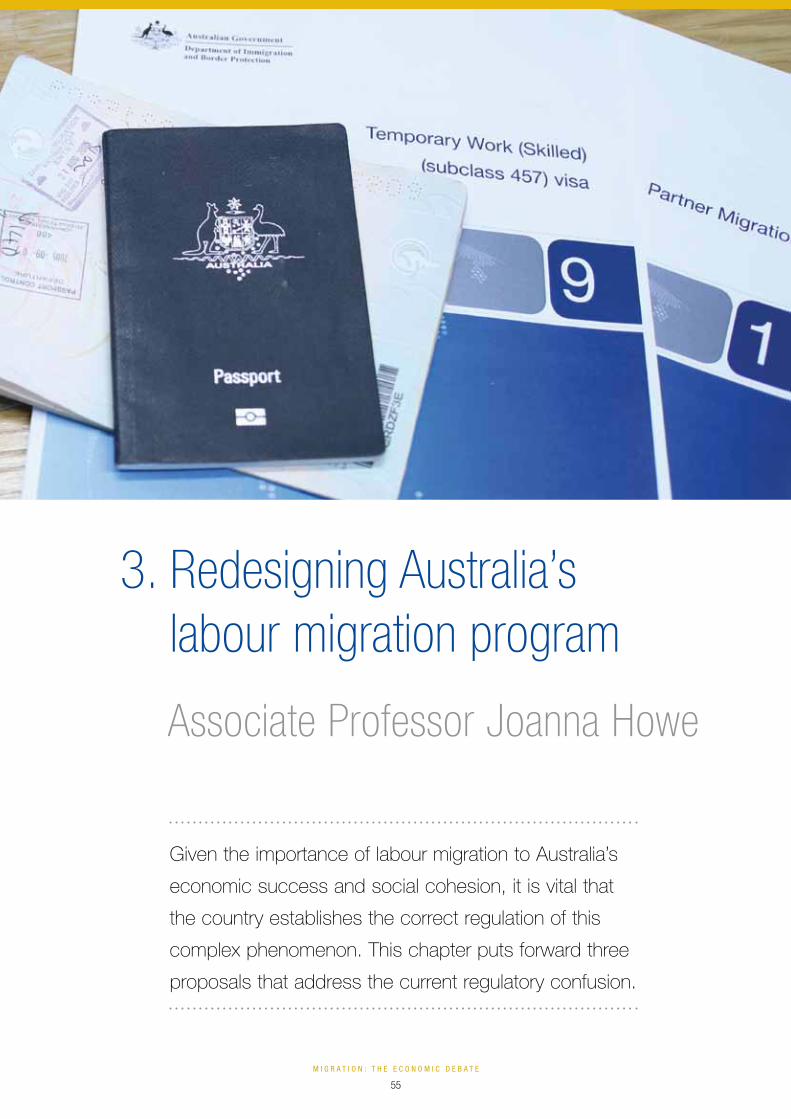
M i g r a t i o n : t h e e c o n o M i c d e b a t e
55
Given the importance of labour migration to Australia’s
economic success and social cohesion, it is vital that
the country establishes the correct regulation of this
complex phenomenon. This chapter puts forward three
proposals that address the current regulatory confusion.
3. Redesigning Australia’s labour migration program
Associate Professor Joanna Howe

M i g r a t i o n : t h e e c o n o M i c d e b a t e
56
Associate Professor Joanna howe is an Associate Professor of
Law at the University of Adelaide and the leading Australian expert in
temporary labour migration. She is the author of three books,
including Temporary Labour Migration in the Global Era – The
Regulatory Challenges (2016, Hart, with Rosemary Owens) and
Rethinking Job Security (2016 – forthcoming, Routledge).
Associate Professor Howe is currently leading a project (with Alex Reilly) commissioned by
the Fair Work Ombudsman into the experience of international students in the Australian
labour market and is the project leader on a category one grant from Horticulture Innovation
Australia (HIA, VG15025, $231,207, 2016) examining labour supply options in the
Australian vegetable industry.
In 2015 she received a grant from the Oñati International Institute for the Sociology of Law
in Spain to convene a workshop on temporary labour migration, bringing together
international experts. Associate Professor Howe is also a chief-investigator on an Australian
Research Council Discovery Grant, Work Experience: Labour Law at the Boundary of Work
and Education (DP150104516, $207,200, 2015–2018). She is regularly invited to present
evidence to the Senate Legal and Constitutional Affairs Committee and to advise
government departments and reviews on Australia’s temporary migration program. She is
the recipient of the University of Adelaide’s Women’s Research Excellence Award 2015.
Associate Professor Howe holds a Doctorate of Philosophy in Law from the University of
Oxford, where she studied as a Rhodes Scholar.

M i g r a t i o n : t h e e c o n o M i c d e b a t e
57
Introduction
In many parts of the western world, fear of migration and its perceived adverse
consequences on local populations is on the rise. Brexit, Trump, Hanson – all
represent, in part, a concern by citizens that their economic prosperity and way
of life is under threat by immigration. In the Brexit debate, the European Union’s
common economic zone allowing the free movement of people to Britain was a
key reason for the success of the leave vote. In the US, presidential candidate
Donald Trump’s anti-free trade agenda and plans to build a wall between Mexico
and the US tap into a concern that Americans’ job security and access to jobs
is under threat by both illegal immigrants and labour mobility provisions in trade
deals.
In Australia, Hanson’s rise can largely be attributed to anti-Muslim sentiment,
but is intertwined with the unease of some Australians with the notion of their
country as a multicultural nation built upon the contribution of migrants.1 In all
three cases, we can discern a suspicion of globalisation and its promise of a
more economically prosperous and socially cohesive world. These broader fears
around migration and globalisation threaten to undermine Australia’s longstanding
commitment to labour migration, that is, the movement of people into Australia
for a work purpose. These fears are not being helped by the regular media stories
exposing Australia’s labour migration system as poorly managed, incapable of
withstanding rorts or of protecting the jobs of local workers and migrant workers
from gross exploitation.
This chapter argues the need to completely rethink the way Australia regulates
and approaches labour migration. It advances three proposals that would improve
both the regulatory design and enforcement capacity of Australia’s labour migra-
tion program.
Proposal 1: a tripartite, objective and evidence-based independent commission
Public confidence in the way labour migration is managed is essential for main-
taining support for permissive visa regulations.2 Yet, it is difficult for the public to
maintain confidence in a labour migration system that is cloaked in secrecy, com-
plexity and a lack of transparency and accountability. The 457 visa is the mainstay
of Australia’s labour migration program scheme. Introduced in 1996 with biparti-
san political support, the 457 visa permits high-skilled temporary labour migration
to Australia in occupations that are deemed to be in shortage in the Australian
labour market.

M i g r a t i o n : t h e e c o n o M i c d e b a t e
58
The primary defect in the management of the 457 visa lies in the delegation to
employers of the decision as to which occupations are in shortage. Australia
has a demand-driven program – employer attestation determines which occu-
pations are in shortage. So long as an occupation is listed on the Consolidated
Sponsored Occupation List (CSOL) and a 457 visa holder is paid a higher annual
wage than the minimum amount for temporary skilled migrants,3 an employer is
able to access a 457 visa holder. The CSOL is not an occupational shortage list; it
includes over 600 occupations, many of which are not in shortage.
Diehard defenders of the status quo will point to the introduction of employer-
conducted labour market testing in 2013 as evidence of a requirement that
employers need to first advertise jobs locally before hiring a 457 visa holder.
However, when one realises that a simple Facebook advertisement suffices to
meet the Department of Immigration and Border Protection’s (DIBP) very low evi-
dentiary requirement,4 it becomes clear that employer-conducted labour market
testing is both weakly enforced and easily evaded.
The effectiveness of using an employer-attestation approach to determine the
existence of which occupations are in shortage has been repeatedly debunked.5
A number of significant reviews of the 457 visa program have called for greater
limits on employer demand.6 Even the Organisation for Economic Co-operation
and Development (OECD) concurs, advising that independent labour market
testing is preferable for mapping domes-
tic labour shortages because “historically,
requests by employers have not been con-
sidered a fully reliable guide in this regard, at
least not without some verification by public
authorities to ensure that the requests repre-
sent actual labour needs that cannot be filled
from domestic sources”.7
The simplistic notion that employers will only go to the trouble and expense of
employing a migrant worker when they want to meet a skill shortage skims over
a range of motives an employer may have for employing a migrant worker. These
could be a reluctance to invest in training for existing or prospective staff, a desire
to move towards a de-unionised workforce or, for a (perhaps small) minority of
employers, a belief that it is easier to avoid paying minimum wage rates and con-
ditions for temporary migrant workers.8 For other employers, there is a perception
that they gain a cost advantage, either directly or indirectly, because temporary
migrant workers will be willing to work for less, or be more productive by working
harder for the same pay.9
To remedy the problematic use of employer attestation to determine the compo-
sition of Australia’s 457 visa holders, the Australian Government should consider
establishing a tripartite, independent commission charged with the compilation of
the occupational shortage list for the 457 visa program. This commission would
use an evidence-based approach to identify Australia’s labour market needs in a
timely, efficient and transparent manner.10
“ The primary defect in the management
of the 457 visa lies in the delegation to
employers of the decision as to which
occupations are in shortage.”

M i g r a t i o n : t h e e c o n o M i c d e b a t e
59
Instead of an independent expert commission, what Australia currently has
is a body very few have heard of – the Ministerial Advisory Council on Skilled
Migration (MACSM). MACSM is comprised of eight members appointed by gov-
ernment. Its current make-up is far from tripartite, with one independent member
(John Azarias), one representative from the unions (Australian Council of Trade
Unions President, Ged Kearney) and the other six members all from a business
background with a vested interest in increasing the level of labour migration to
Australia. MACSM’s deliberative processes and recommendations occur behind
closed doors and with very limited
public engagement or accountability.
Despite being charged with the impor-
tant responsibility of reviewing the
CSOL, since its establishment in 2015,
there have been no public statements
from MACSM as to its work to-date.
What would a genuinely independent
and tripartite commission look like?
First, it would have equal membership from both industry and unions, as well
as independent experts in labour migration from relevant fields, demography,
economics and law. Second, it would have an evidence-based approach to
gathering information on which occupations should form part of the occupational
shortage list, relying on subjective input from stakeholders through a formal and
transparent submissions process and on economic data. For example, a similar
body in the UK, the Migration Advisory Committee, uses 12 economic indicators
to make recommendations for its occupational shortage list. Third, its processes,
deliberations, findings and recommendations would be placed on its website
and be accessible to the public. Fourth, it would have responsibility for both
the permanent and temporary labour migration programs and for assessing the
labour market impact of visas with a non-work purpose but which allow the per-
formance of work in the Australian economy (such as visas for backpackers and
international students).
This commission would undermine the possibility for fear mongering by populist
politicians. Experience from other jurisdictions attests to the ability of an inde-
pendent migration commission to lift the quality of public debate and promote
informed government decision-making. This is because a more transparent and
rigorous process for selecting occupations to be on a shortage list has the benefit
of increasing public confidence that only occupations which are in shortage are
eligible for labour migration. This alleviates the fear of local workers that migrants
are stealing their jobs. An expert commission can also assist in communicating
to the public the shared prosperity and economic gains that ensue from labour
migration, leading to greater public acceptance of the use of labour migration
to address domestic shortfalls. An independent commission also reduces the
opportunity for regulatory capture by special interests.
“ The simplistic notion that employers will only go to
the trouble and expense of employing a migrant
worker when they want to meet a skill shortage skims
over a range of motives an employer may have for
employing a migrant worker.”

M i g r a t i o n : t h e e c o n o M i c d e b a t e
60
The work of the commission would not be without challenge. Independent labour
market testing is not easy to get right. It is tricky for government agencies to
identify and quantify skill shortages as “occupation is not an innate characteris-
tic”,11 particularly in a geographically dispersed country like Australia,12 and past
experience shows there can be a time lag between identification and when an
occupation is made eligible for temporary labour migration.13 Nonetheless, a well-
resourced, genuinely tripartite and independent commission would go a long way
to developing and maintaining the integrity of an Australian occupational shortage
list for labour migration purposes.
Proposal 2: a fair go for migrant workers
The second recommendation draws upon the notion of fairness as a normative
framework and ordering principle in regulating labour migration.14
Fairness for workers has long been a touchstone for Australian labour law.
McCallum, for one, suggests that the success of compulsory arbitration for nearly
a century was due to the “egalitarianism and fairness” that was emblematic of
the Australian character, with its pursuit of fair and reasonable outcomes.15 Not
dissimilarly, Macintyre observes that the emphasis of the Australian Constitution’s
framers and the Conciliation and Arbitration Court’s early members was on egali-
tarianism and “shaping the political economy according to the national ethos of
the fair go”.16 While seemingly a colloquialism, the fair go became deeply embed-
ded in Australia’s labour laws and jurisprudence. According to Riley:
The fair go is an idiomatic expression of the Australian commitment to an egalitarian democ-
racy which respects the autonomy and dignity of its citizenry. Those who engage workers and
those who work are all working citizens, and as such they are entitled to equal respect and
consideration in the determination of matters affecting their working lives.17
Despite the substantial changes that have occurred in Australia’s labour laws in
the last two decades,18 the uniquely Australian concept of the fair go still endures
and has even made it into federal legislation governing unfair dismissal,19 and into
the name of the federal labour law statute,20 and into the institution charged with
resolving disputes between employers and employees.21
Notwithstanding scholarly criticism of its use,22 the stem word fair is identified
seven times within the stated objects of the Fair Work Act 2009 (Cth) and is the
most common substantive descriptive word used in this section.23 More recently,
the Productivity Commission has acknowledged the importance of fairness to
Australia’s workplace relations framework, recognising that “labour differs from
other inputs, and that a sound workplace relations system must give primacy to
the wellbeing of employees (and would be employees), and take account of com-
munity norms about the fair treatment of people”.24
Under the Fair Work Act 2009 (Cth) we expect that temporary migrant workers
would have the same access to a fair go as their Australian counterparts – after
all, the law applies equally to both. However, in practice we find a different story

M i g r a t i o n : t h e e c o n o M i c d e b a t e
61
emerging. Although many temporary migrant workers are treated well by their
employers, there seems to be many who are not. How else to describe a job
to dive through murky ponds and lakes for golf balls and receiving less than $5
per hour,25 or the kinds of exploitative treatment of workers at Baida Poultry pro-
cessing plants,26 or the international student
dismissed for making himself a cup of
coffee?27 Or the systematic underpayments,
threats and exploitation of international
students employed in 7-Eleven franchises,
and the 457 visa holders forced to endure
all manner of unreasonable requests and
appalling treatment in order to maintain their
employer’s sponsorship.28
Clearly, migrant workers are struggling to access a fair go in the Australian labour
market. This is despite the much-lauded triple win promised by migration in the
literature29 and by international institutions keen to promote temporary labour
migration as a talisman for success in the new economy and deploying migrant
labour around the globe.30
The International Labour Organisation’s 2014 Report Fair Migration advances this
notion that labour migration should ensure the realisation of the dignity of migrant
workers. The report argues that this means:
…constructing an agenda for fair migration which not only respects the fundamental rights
of migrant workers but also offers them real opportunities for decent work. Recognition of the
contribution that they make to the societies from which they come and where they work has
to be translated into instruments of governance which guarantee a fair share of the prosperity
which migration helps to create.31
This approach is one that advocates the development of migration laws and poli-
cies that distribute the economic gains of labour migration so that workers receive
a fair share. The normative implications of this approach in the Australian context
means that migrant workers should receive equivalent wages and conditions to
local workers as their work is of no less value purely because of their migrant
status. This also means migrant workers should have the same workplace rights
as local workers and be able to enforce these rights. Migrants should also be
treated with dignity and respect at work and migration laws and policies should
take into account the interests of migrants as workers and human beings.
To see this enforced, the notion of according fairness to the parties involved in
migration should inform the interpretation of the stated purposes in the Migration
Act 1958 (Cth) in regulating labour migration and should be used to influence the
making of migration laws and policies. A new purpose should be added to the
legislation giving effect to the principle that Australia’s labour migration program
should seek to ensure a fairer distribution of the prosperity that the migration
process creates, and to make clear that migrant workers are entitled to a fair go,
just like their Australian counterparts.
“ Although many temporary migrant workers are
treated well by their employers, there seems to
be many who are not. How else to describe a job
to dive through murky ponds and lakes for golf
balls and receiving less than $5 per hour.”

M i g r a t i o n : t h e e c o n o M i c d e b a t e
62
Although this proposal may seem tokenistic and incapable of effecting real
change, legislative purpose is important for the formation and interpretation of
laws and policies. Explicitly acknowledging the entitlement of temporary migrant
workers to fair treatment in the workplace provides an essential pushback to the
notion that temporary migrants are merely cogs in the wheels of global capitalism.
It challenges the conception that the role and purpose of temporary labour migra-
tion has become one of unlocking and maximising the entrepreneurial potential
and profit-maximising capabilities of capital.32
This proposal seeks to decommodify temporary migrant labour in the same way
that the aphorism “labour is not a commodity” recognises that the relationship of
the human person to their labour cannon be separated, it also seeks to explain
the conundrum that work cannot be separated from the human person and yet is
traded in the marketplace.33
Proposal 3: a strong, well-resourced inspectorate
Although the first two proposals focus on improving the regulatory design of
Australia’s labour migration program, this final proposal seeks to guarantee that
Australia has an adequately resourced labour inspectorate when things go wrong.
Australia is fortunate to have an established labour inspectorate in the Fair Work
Ombudsman (FWO), which is an independent statutory authority created under
the Fair Work Act 2009 (Cth). The
FWO has identified migrant workers as
particularly vulnerable to exploitation
and recently has established an Office
for Migrant Worker Engagement and
Strategy. This reflects the disappointing
reality that more and more of the FWO’s
time and resources are being devoted to
preventing the exploitation of temporary migrant workers in the Australian labour
market. More than one tenth of all complaints received by the FWO were from
visa holders and the FWO has recovered more than $1.1 million on behalf of tem-
porary migrant workers in 2013–2014.34
While these and other enforcement initiatives of the FWO are important, the
regulatory capacity of the FWO is necessarily bound by the huge challenge pre-
sented by Australia’s geography and the significant number of temporary migrant
workers. It seems unlikely that the FWO’s resourcing and powers are sufficient.
FWO has 300 inspectors divided into teams: compliance, early intervention, alter-
native dispute resolution and campaigns.35 Its inspectorate is required to serve
up to 11.6 million workers,36 a significant portion of which are temporary migrants
with work rights in the domestic economy.37
“ The Fair Work Ombudsman has identified migrant
workers as particularly vulnerable to exploitation
and recently has established an Office for Migrant
Worker Engagement and Strategy.”

M i g r a t i o n : t h e e c o n o M i c d e b a t e
63
Although it is unlikely that the FWO will be able to significantly increase its
resources as the federal budgetary climate is so tight, its suite of legislative
powers need to be strengthened. A promising sign that legislators are begin-
ning to understand the importance of the FWO’s role in effecting change in the
experience of temporary migrant workers in the Australian labour market was the
Coalition Government’s policy, Protecting Vulnerable
Workers, released during the 2016 federal election
campaign.38 This policy plans to increase tenfold
the penalties for employers who deliberately and
systematically underpay workers and fail to keep
proper records.
This policy also creates a new offence for employ-
ers engaged in cashback scams like in the 7-Eleven
scenario, where an employer pays the correct
wages to employees but then forces them to repay
a proportion of their wages in cash.39 The policy also
proposes to tighten the obligations on franchisors and parent companies and
substantially increases the compulsory evidence gathering powers of the FWO
(similar to those currently held by other watchdogs such as ASIC, the ACCC,
the ATO). This will enhance the FWO’s powers to gather evidence where proper
records do not exist and assist in gathering evidence in situations where tem-
porary migrant workers are reluctant to publicly complain to the FWO about an
exploitative situation at work for fear of repercussion. The policy also introduces
new penalty provisions for employers who obstruct the FWO’s inspectorate or
provide false or misleading information.
This policy, if enacted, is a substantial step in the right direction in the area of
regulatory enforcement and monitoring of the workplace rights of temporary
migrant workers. It goes a long way in increasing the power and role of the FWO,
and provides disincentives for non-compliant employers to engage in exploitation
of temporary migrant workers.
Proposal 3 recommends that the Coalition’s policy Protecting Vulnerable Workers
be implemented so as to strengthen the FWO’s role and powers. This policy
makes an important contribution to increasing the financial risks for employers
seeking to exploit temporary migrant workers to maximise profits and provides
greater powers to the FWO to detect and expose employers acting in this way.
An important omission in the Coalition’s policy, which needs to be addressed,
is to ensure that there is provision in the legislation to protect the identities of
temporary migrant workers who engage the FWO for assistance and to ensure
this information cannot be passed on by the FWO to the DIBP. Even though the
only information that the FWO shares with DIBP relates to breaches of 457 visas,
an impression may be created among visa holders that the FWO passes informa-
tion onto the DIBP concerning all breaches of visa work conditions. This naturally
affects other visa holders with work rights such as international students and
working holiday makers, who will be less likely to complain because of the per-
ception that the FWO’s role is compromised. To remedy this, Clibborn proposes
“ A promising sign that legislators are
begin ning to understand the importance
of the FWO’s role in effecting change
in the experience of temporary migrant
workers in the Australian labour market
was the Coalition Government’s policy,
Protecting Vulnerable Workers.”

M i g r a t i o n : t h e e c o n o M i c d e b a t e
64
that FWO and the department should “formally and publicly establish indepen-
dence from each other” and “cease information sharing”.40 The Productivity
Commission recommended a one-way sharing of information between DIBP and
FWO so that the labour inspectorate is prevented from passing onto immigration
officials any identifying information about a visa holder. This approach is consis-
tent with international principles on labour inspection,41 and should be adopted.
Conclusion
Simply closing Australia’s doors to labour migration is not an option. Australia
needs migration to prosper. Although permanent labour migration is preferable
in terms of recognising migrants’ contribution and protecting their workplace
rights,42 increasingly we rely on the contribution of temporary migrants as suc-
cessive governments prefer to use temporariness as a means to ensure migrant
workers are deployed into particular occupations and geographical places. Given
the importance of labour migration to Australia’s economic success and social
cohesion, it is vital that we get right the regulation of this complex phenomenon.
Although there is far more that needs to be done, the three proposals advanced
here go some way to addressing the current regulatory confusion that exists.
M i g r a t i o n : t h e e c o n o M i c d e b a t e
65
endnotes
1 Lewis, P 2016, ‘Pauline Hanson can’t be dismissed this time. One Nation is bigger than it looks’, Guardian, accessed at https://www.theguardian.com/commentisfree/2016/aug/18/pauline-hanson-cant-be-dismissed-this-time-one-nation-is-bigger-than-it-looks, 18 August.
2 See, for example: Wright, CF 2014, ‘How Do States Implement Liberal Immigration Policies? Control Signals and Skilled Immigration Reform in Australia’, Governance: An International Journal of Policy, Administration and Institutions, vol. 27, no. 3, p. 397.
3 This is called the Temporary Income Skilled Migration Threshold. The TSMIT is currently set at $53,900 per annum.
4 Department of Immigration and Border Protection 2013, Labour Market Testing in the Subclass 457 Visa Programme: Frequently Asked Questions, Department of Immigration and Border Protection, Canberra.
5 Azarias, J et al 2014, Robust New Foundations – A Streamlined, Transparent and Responsive System for the 457 Programme: An Independent Review into Integrity in the Subclass 457 Programme, Report; Wright, CF & Constantin, A 2015, ‘Inquiry into the Impact of Australia’s Temporary Work Visa Programs on the Australian Labour Market and on the Temporary Work Visa Holders’, Submission No. 23 to Senate Education and Employment References Committee, Parliament of Australia, 1 May.
6 Azarias, J et al 2013, Robust New Foundations, Majority Report to the Constitutional and Legal Affairs Committee Inquiry into the Subclass 457 Visa, Australian Senate.
7 Organization for Economic Co-operation and Development 2009, ‘International Migration Outlook: SOPEMI 2009’, OECD Publishing, p. 134.
8 See, eg, Howe, J 2013, ‘Is the Net Cast Too Wide? An Assessment of Whether the Regulatory Design of the 457 Visa Meets Australia’s Skills Needs’, Federal Law Review, vol. 41, no. 3, p. 443.
9 MacKenzie, R & Forde, C 2009, ‘The Rhetoric of the “Good Worker” Versus the Realities of Employers’ Use and the Experiences of Migrant Workers’, Work, Employment and Society vol. 23, no. 1, p.142; Moriarty, E et al 2012, ‘“Taking on Almost Everyone?” Migrant and Employer Recruitment Strategies in a Booming Labour Market’, International Journal of Human Resource Management vol. 23, no. 9, p. 1871; Waldinger, R & Lichter, MI 2003, How the Other Half Works: Immigration and the Social Organization of Labor, University of California Press, California.
10 For a more detailed, scholarly development of this proposal, see my article, Howe, J 2013, op cit.
11 Platonova, A & Urso, G (eds) 2012, Labour Shortages and Migration Policy, International Organization for Migration, Geneva, p. 15.
12 Visa Subclass 457 Integrity Review 2008, Final Report, Commonwealth of Australia, Canberra, p. 39, accessed at https://www.border.gov.au/WorkinginAustralia/Documents/457-integrity-review.pdf.
13 See, eg, Howe, J 2013, op cit.
14 For a more detailed, scholarly development of this proposal, see my article, Howe, J 2016, ‘Regulation of Australia’s Labour Migration Program: Is There a Case for Including Fairness’, Australian Journal of Labour Law, vol. 29, pp. 58-77.
15 McCallum, R 2006, ‘The New Work Choices Laws: Once Again Australia Borrows Foreign Labour Law Concepts’, Australian Journal of Labour Law, vol. 19, p.101. See also, Rickard, J 1984, HB Higgins – The Rebel as Judge, Allen & Unwin, Sydney, p. 261.
16 Macintyre, S, ‘Arbitration’ in Davison G, Hirst J & Macintyre S (Eds) 2001, The Oxford Companion to Australian History, Oxford University Press, p. 31.
17 Riley, J, ‘Good Faith Performance’ in Bromberg M & Irving M (Eds) 2007, The Australian Charter of Employment Rights, Hardie Grant Books, p. 13. Similarly, the President of the NSW Industrial Relations Commission observed that the ‘notion of a fair go is a profound one, firmly rooted in the Australian psyche’: Boland J 2010, In Defence of Industrial Tribunals, Paper presented to the National Conference of the Industrial Relations Society of Australia.
18 For an overview, see Owens, R, Riley, J & Murray, J 2011, The Law of Work, Oxford University Press, Melbourne, p. 18; Creighton, B & Stewart, A 2012, Labour Law, 5th edn, Federation Press, Sydney.
19 Workplace Relations Act 1996 (Cth) s 170CA(2); Fair Work Act 2009 (Cth) s 381.
20 The Fair Work Act 2009 (Cth).
21 The Fair Work Commission.
22 For example, Greame Orr argues that the use of the term ‘fair work’ in the context of the Fair Work Act 2009 (Cth) tends to be on a sloganistic rather than meaningful: Orr, G 2009, ‘The Fair Work Act and Other Names of Shame’, Australian Journal of Labour Law, vol. 16, p. 75.
23 Fair Work Act 2009 (Cth) s 3.
24 Productivity Commission 2015, Inquiry into the Workplace Relations Framework, Draft Report, p. 5.
25 Worthington, E 2015, ‘Dutch golf-ball diving backpacker sues Queensland company for unpaid wages’, ABC Radio, accessed at http://www.abc.net.au/pm/content/2015/s4277407.htm, 20 July; Calligeros, M 2015, ‘Dutch backpacker paid $5 an hour to retrieve golf balls from lakes’, The Sydney Morning Herald, 22 July.
26 James, N 2015, ‘The Fair Work Ombudsman’s Inquiry into the labour procurement arrangements of Baida Group in New South Wales’, accessed at http://www.fairwork.gov.au/about-us/news-and-media-releases/2015-media-releases/june-2015/20150618-baiada-group-statement-of-findings, 18 June.
27 Raj Bista v Glad Group Pty Ltd t/a Glad Commercial Cleaning [2016] FWC 3009.
28 For examples involving 457 visa holders, see: Farzday v Monochromatic Engineering Pty Ltd T/A MCE Lasers [2015] FWC 7216; Ms Maricar Virata v NSW Motel Management Services Pty Ltd T/A Comfort Inn Country Plaza Halls Gap [2015] FWC 7932; RAM v D&D Indian Fine Food Pty Ltd & Trivedi [2015] FCCA 389.
29 See, eg, Castles, S & Ozkul, D 2014, ‘Circular Migration: Triple Win, or a New Label for Temporary Migration?’ in Battistella, G (ed) 2014, Global and Asian Perspectives on International Migration, Springer Publishing, New York.
30 World Bank 2005, Global Economic Prospects 2006: Economic Implications of Remittances and Migration, World Bank, Washington, DC; Global Commission on International Migration 2005, Migration in an Interconnected World: New Directions for Action, Global Commission on International Migration, Geneva.
31 International Labour Organization 2014, Fair Migration: Setting an ILO Agenda, Report of the Director-General, Report I(B)) to the International Labour Conference, 103rd session, Geneva, p. 4.

M i g r a t i o n : t h e e c o n o M i c d e b a t e
66
32 For example, see the argument of Mark Freedland and Cathryn Costello that the deference to the needs of capital which is inherent in the design of most contemporary temporary labour migration programmes in receiving states is derivative of a seemingly unquestioned economic philosophy that temporary labour migration programmes need to be less regulated by government and driven instead by the needs of business, with market responsiveness, timeliness and flexibility as the key indicators of success: Costello, C & Freedland, M, ‘Seasonal Workers and Intra-corporate Transferees in EU Law: Capital’s Handmaidens?’ in Howe, J & Owens, R 2016, Temporary Labour Migration in the Global Era: The Regulatory Challenges, 1st edn, Hart Publishing, chapter 2.
33 See philosophers as diverse as John Locke, Adam Smith, Karl Marx, Karl Polyani and Hannah Arendt (to name but a few) for discussions of this idea.
34 James, N 2014, Fair Work Ombudsman Annual Report 2013–2014, Fair Work Ombudsman, Melbourne.
35 Department of Immigration and Border Protection 2014, Annual Report 2013–2014, Department of Immigration and Border Protection, pp. 71–72.
36 Australian Bureau of Statistics 2014, Australian Labour Market Statistics, Cat. No. 6105, Australian Bureau of Statistics, Canberra.
37 For example, in 2013–2014 visas were issued for 260,303 international students, 258,248 working holiday makers and 126,350 subclass 457 visa holders: Department of Immigration and Citizenship 2013, Annual Report 2012–2013, Department of Immigration and Citizenship, Canberra, p. 2.
38 Liberal Party of Australia 2016, ‘The Coalition’s policy to Protect Vulnerable Workers’, accessed at https://www.liberal.org.au/coalitions-policy-protect-vulnerable-workers.
39 It seems this practice was not just limited to 7-Eleven. For another example involving a 457 visa holder, see Farzday v Monochromatic Engineering Pty Ltd T/A MCE Lasers [2015] FWC 7216.
40 Clibborn, S 2015, ‘Why Undocumented Immigrant Workers Should Have Workplace Rights’, Economic and Labour Relations Review, vol. 26, p. 465.
41 See further, International Labour Organisation 2006, Labour Inspection, Report of the Committee of Experts on the Application of Conventions and Recommendations, General Survey of the Reports Concerning the Labour Inspection Convention 1947 (No 81) (etc), International Labour Conference, 95th session.
42 Reilly, A, ‘The Membership of Migrant Workers and the Ethical Limits of Exclusion’ in Howe J & Owens R (eds) 2016, Temporary Labour Migration in the Global Era: The Regulatory Challenges, 1st edn, Hart Publishing, chapter 13.

M i g r a t i o n : t h e e c o n o M i c d e b a t e
67
4. Skilled migration and Australia’s productivity
Dean Parham, Sue Regan
This chapter considers whether Australia’s migration
program, with its emphasis on skills, is having a positive
impact on Australia’s productivity performance.

M i g r a t i o n : t h e e c o n o M i c d e b a t e
68
Introduction
The benefits and costs of migration have long been debated along both eco-
nomic and social lines. The effect on living standards is an overarching rubric for
economic considerations. Debate on social dimensions has largely hinged on
cultural enrichment and social cohesion.
Migration operates on margins rather than in absolutes; a single answer on
whether migration has a positive or negative net effect cannot be given. Rather,
the size and direction of net effects depends on the size and structure of migra-
tion flows. For example, the issue of infrastructure congestion only arises when
the rate of immigration is large relative to the existing population and is concen-
trated in a particular region.
Dean Parham is a long-time productivity analyst; he led the
Productivity Commission’s flagship program of productivity research
for over a decade, and since 2008 has investigated productivity
trends and public policy issues for government, academic and
private-sector agencies. He is currently a non-resident Research
Fellow with the University of Adelaide and operates his own consultancy business.
sue regan is an analyst at the Crawford School of Public Policy at
the Australian National University (ANU), where she was previously
head of the Social Policy Program of the HC Coombs Policy Forum.
Before joining the ANU, Ms Regan was Chief Executive of the
Resolution Foundation, a UK-based research and policy institute.
Prior to that, she worked for the Institute for Public Policy Research and the Department of
Work and Pensions.

M i g r a t i o n : t h e e c o n o M i c d e b a t e
69
The most common point of agreement among economic analyses of migration is
that the net economic effects are not large. While it is generally thought the net
effects are positive, the conclusion can vary across countries with different labour
markets, economic structures and migration programs.
There have been policy-driven changes in the size and structure of Australia’s
migration program over the past few decades:
• The number of migrants coming to Australia has increased and their countries
of origin have diversified. In every year since 2006, migrants have contributed
more to population growth than is occurring through natural increases. In the
1960s, the vast majority of migrants came from the UK and the rest of Europe.
Today, migrants come from a much broader range of countries, particularly from
across Asia.
• The proportion of skilled migrants has increased compared to migrants coming
for family reunification, or on humanitarian grounds. In 2013–14, just over
200,000 permanent migration visas were approved – 128,550 (67.7 per cent)
through the Skill Stream and 61,112 (32.2 per cent) through the Family Stream.
In the same year, 13,768 Humanitarian visas were granted.
• Temporary migration (as students and workers) has increased substantially and,
along with it, the number of migrants who progress from a temporary visa to
permanent migration has grown. This is probably the big story of migration over
the past decade. Some of the temporary migration has been to meet short-
term skill shortages, most notably associated with the construction phase of the
mining boom. Temporary entry for students, on the other hand, has become an
avenue for transition to permanent stays.2
This chapter examines the links between migration and productivity and finds that
the emphasis given to skills in the migration program in recent times has had a
noticeable and positive effect on Australia’s productivity performance. The mate-
rial is based on an extensive study undertaken at the Crawford School of Public
Policy at the Australian National University for the Department of Immigration and
Border Protection.3
The context: living standards and the productivity imperative
Putting the discussion in the broader context of growth in living standards high-
lights, in particular, the need for strong productivity growth as a foundation for
improvements in Australian living standards. It can be shown that growth in living
standards is the combination of growth in labour productivity (gross domestic
product [GDP] per hour worked) and growth in labour utilisation (hours worked
per capita).

M i g r a t i o n : t h e e c o n o M i c d e b a t e
70
Living standards
Average income or GDP per capita is the usual (albeit imperfect) way to capture
living standards.4 GDP per capita can be divided into two components:
From this simple relationship, growth in living standards can be decomposed into
the sum of growth in labour productivity plus growth in labour utilisation.
That decomposition, presented in Table 1, shows productivity has been the domi-
nant source of growth in living standards over the past four decades. Productivity
accounted for most if not all of the growth in GDP per person over each of the
periods. The growth in GDP per person was especially strong in the 1990s and
early 2000s (2.6 per cent a year) on the back of very strong productivity growth
(2.1 per cent a year). Averaged over the four decades, productivity accounts for
very nearly all the growth in average income.
Table 1 growth rAtEs in rEAl AvErAgE inComE, ProDuCtivity AnD lAbour utilisAtion (PEr CEnt PEr yEAr)
Table 1 also shows labour utilisation has had important effects on living standards
in some decades, but in both positive and negative ways. Labour utilisation has
had little effect over the entire period.
The period from 2003–04 warrants some further discussion. The slowdown in
growth in GDP per person from 2003–04 to 2011–12 overstates the slowdown in
growth in living standards. There was an additional source of real income growth
gdP per person gdP per hour Labour utilisation gdi per person
1974–75 to 1983–84 1.3 2.5 –1.2 1.1
1983–84 to 1993–94 1.9 1.3 0.6 1.8
1993–94 to 2003–04 2.6 2.1 0.5 3.0
2003–04 to 2011–12 1.3 1.0 0.3 2.6
2011–12 to 2014–15 0.8 1.9 –1.1 –0.9
Source: Author estimates based on data from ABS Cat. No. 5204.0.
GDP = GDP · H
P H P
GDP = GDP per person
P
GDP =
HGDP per hour worked, which is a broad measure of labour productivity and
where
H =
Phours worked per capita of population, often referred to as labour utilisation.

M i g r a t i o n : t h e e c o n o M i c d e b a t e
71
over the period in the form of a largely unprecedented rise in Australia’s terms
of trade.5 This lifted real incomes through a shift in the relative prices of traded
goods and services. A gross domestic income (GDI) measure adjusts GDP for
terms of trade effects. As the GDI per person column in Table 1 shows, the lift
in the terms of trade meant strong growth in living standards continued, despite
weaker growth in productivity after 2003–04. However, on this same measure,
living standards have fallen since 2011–12 because of falls in the terms of trade.
The current position is that much stronger productivity growth is needed if
Australians are to recover lost ground and return to the rate of improvements in
living standards they enjoyed over the two decades prior to 2011–12.
Before moving on to look at how migration affects productivity, some potential
influences of migration on labour utilisation are worth noting. The ageing of the
population affects the long-term outlook on labour utilisation in Australia. As a
higher proportion of the population reaches retirement, the number of hours
worked will fall in proportion to population numbers. Immigration can increase
the proportions of the population of working and child-bearing age, bringing
an immediate, as well as a longer-term, effect on labour utilisation. Immigrants
may also have higher participation rates, employment rates and hours worked
depending on, for example, motivation (migrants are sometimes characterised as
keen to work and as working longer hours) and culture (for, example, the partici-
pation rate of married women).
How migration can affect national productivity
Productivity is about efficient production of goods and services. It is the rate at
which production inputs are transformed into outputs of goods and services.
Labour and capital (assets such as buildings, machinery, equipment and infra-
structure) are the inputs most commonly included in productivity measures.
It makes sense for the current purpose to focus on labour productivity (output per
hour worked) given the above living standards perspective. The task then is to
determine how migration affects Australia’s labour productivity.
The influence of migration on labour productivity depends on more than just the
productiveness of individual migrants. It depends on the production conditions in
which the labour of migrants is used.
Labour productivity in general is influenced by anything (other than the amount of
labour used) that leads to more output being produced. This could include new
technologies or improved management practices.
Capital deepening – higher capital per worker – is actually the most important
contributor to labour productivity growth. Capital deepening occurs, for example,
when production processes are automated, leading to more output generated
per employee.6 Over the past four decades, capital deepening has accounted for
two-thirds of growth in Australia’s labour productivity.7

M i g r a t i o n : t h e e c o n o M i c d e b a t e
72
Consequently, the contribution of migrants to productivity will depend not only on
their innate characteristics, but also on where and how they are employed.
Many assessments of migration and productivity have seen the effect on the
capital-labour ratio as crucial. If there is not commensurate growth in capital, the
labour-boosting effect of migration leads to a lower capital-labour ratio, all other
things being equal.
The argument then runs that wages growth would be less because wage rises
tend to align with productivity growth. This would make existing workers worse
off than they would be without the migration. (This has been a major focus of
analysis in the US, for example.) The owners
of capital, who pay for the labour, on the
other hand would be better off.
A further argument is that this effect would be
temporary. The increase in returns to capital
would induce further investment and restore
the rate of capital deepening. Labour productivity would return to where it would
have been and wages and average incomes would be restored. The economy
would just be bigger.
A lot of debate centres on the extent that this equilibrating path would be fol-
lowed in practice. Key issues become: the numbers of migrants, the ability of
labour markets to absorb them and the extent and pace that capital responds.
A productivity determinants framework
The analysis presented in this chapter envisages a broader set of factors to
explain labour productivity. Labour productivity is considered to depend on two
principal sources: capital deepening and multifactor productivity (MFP) growth.
MFP is the amount of output produced per unit of labour and capital combined.
MFP growth stems from factors that enable given inputs of labour and capital
to generate more output (such as advances in technology and management
practices).
A practical starting point is to group productivity determinants under three
headings:
1. Immediate determinants – factors that are within the control of producers of
goods and services when they make their production decisions (for example,
the technology they use);
2. Underlying determinants – factors outside of businesses’ immediate control
that affect their operating environment and abilities to lift productivity growth
(for example, the innovation system and development of required skills); and
“ Many assessments of migration and
productivity have seen the effect on the
capital-labour ratio as crucial.”

M i g r a t i o n : t h e e c o n o M i c d e b a t e
73
3. Fundamental determinants – factors that are difficult or slow to change, but
nevertheless affect national productivity, perhaps more in the level of productiv-
ity than in the growth of productivity (for example, climate and the availability of
natural resource affect the relative importance of agriculture and mining in an
economy).
A framework of major immediate and underlying determinants is set out in
Figure 1. The complex set of interrelationships and feedbacks between determi-
nants is omitted in the interests of simplicity. The schema also depicts the policy
and institutional environment, which has many and complex influences through
the underlying determinants. It gives some hint as to the multidimensional and
indirect ways in which governments have to operate if they are to influence pro-
ductivity in a positive way.
Knowledge
intangibles
Physical capital
human capital
Savings
Finance for investment
FinanceDirect ownershipKnowledge transfer
CohesionInclusionWork values
ScaleKnowledge transfer
TechnologyManagement systems
FlexibilityOrganisational capital
Buildings, machinery, etc.
SkillsExperienceTacit knowledgeEntrepreneurship
CompetitionRegulationGovernanceTaxationIR systemProperty rights Growth of demand
Stability of demandPatterns of demandOpportunities for scale
Foreign capital
Social capital
PoLicY and inStitUtionaL
SettingS
demand
trade
business environment
health and education systems
Figure 1 frAmEwork of sElECtED ProDuCtivity DEtErminAnts
LaboUr ProdUctiVitY
TransportCommunicationsEnergy and waterInnovation system
infrastructure

M i g r a t i o n : t h e e c o n o M i c d e b a t e
74
Immediate determinants
In brief, the immediate determinants have the following effects on productivity:
• Increases in physical capital are part of capital deepening;
• Human capital comprises the innate capabilities and the skills, knowledge and
experience people have accumulated and that are useful to production activi-
ties. Growth in human capital means the workforce is able to foster and use
more-sophisticated production processes that generate more and higher-value
output;
• Intangible investments, such as in training and systems to help firms be more
responsive to opportunities in a rapidly-changing global economy, promote pro-
ductivity growth in modern times; and
• Production knowledge covers the kinds of technologies and management
techniques used in production, such as robotics and lean production. New
knowledge enhances innovation and productivity growth.
determinant Sub-category Potential migrant effect
human capital
Skills Add skills.Alter skill mix.Fill skill shortages.Ease of transition depends on:• Transferability of qualifications; and• English and foreign language fluency.
Experience Add relevant work experience.Specialist knowledge for production.Management capability.
Tacit knowledge Specialist knowledge for development and application of technologies.
Entrepreneurship Flair, ideas, contacts and business acumen.
Physical capitalTemporary stays can supplement domestic labour and speed completion of large-scale capital-formation projects.
intangible capital
Flexibility Prepared to undertake a range of tasks.Geographic flexibility and mobility.
Organisational capital
Experience in organisational change.Knowledge of useful systems and structures.
Knowledge
Technology Tacit and complementary knowledge and ideas.Experience in Research and Development (R&D) and commercialisation of ideas.Spillovers to migrant and non-migrant populations.
Management Business and management expertise.
Table 2 PotEntiAl EffECts of migrAtion on immEDiAtE DEtErminAnts

M i g r a t i o n : t h e e c o n o M i c d e b a t e
75
The ways that migrants can affect the immediate determinants are summarised in
Table 2. The most significant direct and collective effect is via their skills: adding
to skills, altering the mix of skills, and helping meet skill shortages. Indirect effects,
more often associated with particular migrants, can come through research and
commercialisation experience, entrepreneurial flair, management experience and
so on.
Underlying determinants
Very briefly, underlying determinants can affect productivity indirectly in the follow-
ing ways:
• Sources of funds for investment, which brings about capital deepening, are
crucial. Domestic savings and foreign capital (foreign direct investment and
loans) are the two sources.
• Infrastructure, which also requires substantial funding, provides a platform for
businesses to operate more efficiently by facilitating transactions, communica-
tions, energy use transport, R&D and so on.
• The education system is central in fostering many skills and acquired attributes
that people bring to work. The health system, among other things, helps ensure
that people are able to engage productively in work.
• International trade can help improve productivity. Some imported goods, such
as computers, may provide “spillovers” to the domestic economy through the
technologies that are embedded within them. Developing export markets can
provide local producers with opportunities for economies of scale or even to
learn from production practices in other markets.
• While productivity is a supply-side concept, the strength and pattern of demand
has an influence on productivity outcomes. Strong demand provides growth in
output, which can assist productivity growth, be it through scale or entrants
into the market with better business models. The structure of demand can also
influence the allocation of resources and the industry mix of production.8
• Social capital (social networks and connectedness) has many dimensions
including in relation to social cohesion and inclusion, cultural attitudes and
practices. These can affect the extent to which people are engaged in work and
seek to be more productive.
• The business environment refers to the set of rules and conditions firms operate
under. In general, a relatively stable business environment helps to provide con-
ditions that businesses are prepared to make large long-term investments in.9
The potential effects of migration on underlying determinants are summarised in
Table 3. These indirect effects include the savings and capital that migrants might
bring to Australia, the ability to facilitate linkages with foreign capital and the wider
trade opportunities (import and export) that migrants might open up in particular
with their home countries.

M i g r a t i o n : t h e e c o n o M i c d e b a t e
76
Table 3 PotEntiAl EffECts of migrAtion on unDErlying DEtErminAnts
Estimated contributions of past migration to Australia’s productivity
The Crawford study10 undertook several component analyses. Two result areas
are reported here: productivity differences between migrants and the Australian-
born; and an analysis of the migrant contributions to productivity through skills.
The study proceeded on the assumption that relative wages of workers were a
reasonable reflection of their relative productivities. A literature review provided
support for the assumption in general and even stronger support for the case of
Australia.
Differences between migrants and Australian-born
While a gap between wages of migrants and non-migrants is often found, it can
reflect wage disadvantage (productivity-related differences) as well as discrimina-
tion (lower wages for the same productivity). Australia appears to have low wage
discrimination against migrants.
determinant Potential migrant effect
SavingsBring accumulated savings (if permanent).Remittances to home country (if temporary).
Foreign capital Facilitate linkages to sources of funds in home country.
infrastructureAdd demand and opportunities for scale.Strengthen the national innovation system.Add to congestion.
health &and education systems No effect (aside from adding to labour supply and filling skill gaps).
trade Facilitate export and import linkages with home country.
demandAdd thickness to domestic markets.Changes in demand patterns.Assist in scale and agglomeration effects.
Social capitalCohesion and inclusion (isolation and prejudice) effects.Migrants often have strong work attitudes and motivation (for themselves and their children).
business environment Add to labour market and product market competition.

M i g r a t i o n : t h e e c o n o M i c d e b a t e
77
The Crawford study sought to explain wage differences and employment differ-
ences between migrants and non-migrants in terms of characteristics such as
demography, education, and English fluency. The two main data sources were
the Household, Income and Labour Dynamics in Australia (HILDA) survey and the
Continuous Survey of Australia’s Migrants (CSAM).
It was found that on average migrants have been
more productive than non-migrants, as measured by
earnings, and have increased their productivity more
rapidly than non-migrants. For example, a migrant
earned a wage premium of about $3 an hour in 2011,
about $3.60 in 2012 and about $5 in 2013.
On the other hand, the probability of migrants being
employed is not significantly different from that of
non-migrants.
Census data also confirmed that migrants earned a wage premium, putting the
premium at six per cent. This suggests work performed by migrants is more
skilled on average than work performed by the Australian-born. Overall wage
rates do not differ substantially between migrants and non-migrants in the same
skill categories.
Characteristics of migrants that make a difference
Migrants born in English speaking countries and migrants born in Organisation for
Economic Co-operation and Development (OECD) countries are more produc-
tive, as measured by the hourly wage rate, than non-migrants, migrants born in
non-English speaking countries, and migrants born in non-OECD countries.
English-language proficiency and level and type of education are important
explanatory factors in the labour market performance of migrants.
• English proficiency increases productivity, as measured by earnings, as well as
probability of getting paid employment.
• Having a university education increases productivity and probability of paid
employment.
• Highest qualification being an Australian qualification does not affect productiv-
ity, but does increase probability of being employed.
• Having an overseas post-school qualification does not increase the probability
of getting a job, but does increase migrants’ productivity.
• Migrants whose fields of study had been health and education are more likely to
be employed than migrants in other fields of study or migrants without tertiary
education.
“ On average migrants have been
more productive than non-migrants,
as measured by earnings, and have
increased their productivity more
rapidly than non-migrants.”

M i g r a t i o n : t h e e c o n o M i c d e b a t e
78
Contributions of migrants’ skills to productivity growth
The Crawford study also used the Australian Bureau of Statistics (ABS) productiv-
ity datacube11 and supplementary data provided directly by the ABS to estimate
the contribution of migrants to productivity. The only mechanism analysed was
the contribution through higher skills.
The ABS has a quality-adjusted labour input (QALI)
measure that it uses to estimate the contribution of
shifts in the distribution of skills to productivity growth.
The skill categories identified were four categories of
educational attainment and five categories of age,
used as a proxy for workforce experience.12
The ABS was able to provide migrant and non-
migrant distributions of skills in 2006 and 2011. This
data enabled an assessment of migrants’ contribu-
tions to changes in skill composition, which was a
general shift toward higher skills.
The contribution of skills to productivity in the QALI methodology is estimated
through statistical growth accounting. The change in skill distribution is com-
puted as the weighted growth in hours worked in each of the skill categories.
The weights are the relative wages of each skill category, on the assumption that
relative wages reflect relative productivities. The contribution to labour productivity
is the growth in output less the growth in average skill.
The key findings were:
• Migrant labour grew more rapidly than Australian-born labour, in terms of both
hours worked and skill;
• Migrants’ increase in skill has come about solely from growth in qualifications,
whereas upskilling of work for the Australian-born has come from a combination
of increased qualifications and more workforce experience;
• Migrant workers have become younger on average, to some extent offsetting
the ageing of the Australian workforce;
• Migrants have met a third of the increase in skill requirements of work; and
• Migrants account for about 0.17 of a percentage point of annual labour produc-
tivity growth between 2006 and 2011. To put this figure in perspective, this is
equivalent to over 10 per cent of the average rate of labour productivity growth
between 2005–06 and 2010–11.
The ABS data provided further insights. Migrants are more highly represented
than their Australian-born counterparts in manufacturing, in health and social
assistance services and in professional, scientific and technical services. Migrants
contributed to increased skills in all broad industry groups, but especially in
“ The ABS data provided further
insights. Migrants are more highly
represented than their Australian-born
counterparts in manufacturing, in
health and social assistance services
and in professional, scientific and
technical services.”

M i g r a t i o n : t h e e c o n o M i c d e b a t e
79
financial and insurance services, wholesale trade, and the information, media and
telecommunications industries. These industries are where migrants made the
largest contributions to industry productivity growth.
Most of the migrant upskilling occurred in metropolitan areas, whereas the shift
to employing migrants with less experience (younger age) in Australia mostly
occurred in regional areas. By contrast, the more-rapid upskilling of migrants, in
comparison to the Australian-born, occurred in metropolitan areas, as the skill
contributions of migrants and non-migrants were identical in regional areas.
Concluding remarks
The Crawford study showed that the migration program, with its emphasis on
skills, is having a positive impact on Australia’s productivity performance. Migrants
have raised the level of labour productivity by six per cent according to census
data. Between 2006 and 2011 their contribution to growth in skills accounted for
at least 10 per cent or 0.17 of a percentage point of annual labour productivity
growth.
These estimates only cover the direct effects migration can have on productivity.
They omit other mechanisms included in the migration-productivity framework set
out in the chapter, such as entrepreneurial effects and trade and finance links to
home country.
In addition to the role of the Migration Program in shaping the type of migrants
who gain entry to Australia, migrant productivity may be affected by a range of
government policies post-arrival in the country. Access to education and labour
market programs can be important for migrants as they both seek work and
progress in work. Settlement services can be particularly important for family and
humanitarian migrants. Given the importance of English-language proficiency for
good labour market and productivity outcomes,
access to English-language programs, such
as the Adult Migrant English Program, can be
valuable for some migrants. Policies that facili-
tate recognition of foreign qualifications enable
migrants to make the most of their skills and
education and, thus, be more productive.
We noted in our introduction that the big migration story of recent time is the
increase in temporary migration – both international students and short-term
workers. Further policy and empirical focus is needed on the transition from tem-
porary to permanent residency, given this is the route so many migrants now take.
Partly owing to data limitations, this evolution of Australia’s permanent migration
process into a two-step policy framework13 is yet to receive much scrutiny and
may reveal more about the links between productivity and contemporary migra-
tion patterns.
“ Migrants have raised the level of labour
productivity by six per cent according to
census data.”

M i g r a t i o n : t h e e c o n o M i c d e b a t e
80
endnotes
1 Australian Bureau of Statistics 2014, Australian Social Trends-Where do migrants live? Accessed 28 May 2015 www.abs.gov.au/ausstats/[email protected]/Lookup/4102.0main+features102014
2 See Department of Immigration and Border Protection 2015, Australia’s Migration Trends 2013–14, Canberra, for trends in migration growth and composition.
3 Parham, D, Thi To, H, Nazmun, R, Regan, S and Grafton, Q 2015, Migration and Productivity in Australia, Crawford School of Public Policy, Australian National University, Canberra
4 This measure overlooks the effects of the terms of trade, which have had major effects on real income per capita over the past decade or so. The terms of trade are the ratio of export prices to import prices. The terms of trade rose markedly from 2002–03 to 2011–12 with the mineral commodity price boom, but have since fallen. Terms of trade effects show up in gross domestic income, rather than gross domestic product.
5 The terms of trade are the ratio of export prices to import prices.
6 As a concrete example, a construction worker can generate a lot more output in a work day, using a nail gun instead of a hammer.
7 Calculated from data referring to the 12 ‘selected industries’ in the ABS productivity datacube.
8 To the extent that industries have different productivity levels, changes in industry proportions will affect average productivity.
9 The formal ‘rules of the game’ for business are, to a large extent, established by policy and institutional settings. Taxes, regulation, governance arrangements and the strength of competition can influence the motivation that businesses have to improve their productivity performance and the ways in which they are able to go about it. They can also influence the allocation of resources. The industrial relations framework can affect the degree of flexibility firms have to adjust their business models. An effective system for defining and enforcing property rights (for example, over land use, intellectual property or market exclusions) will affect investment risks, but will also help to settle what can and cannot be done (including, for example, in regard to environmentally-sensitive proposals).
10 Parham et al 2015, op cit
11 ABS Cat No 5260.0.55.002
12 The education attainment categories were: unqualified, skilled, bachelor degree and higher degree. Age categories were 15–24, 25–34, 35 to 44, 45–54, 55–64.
13 Gregory, R 2014,The Two-Step Australian Immigration Policy and its Impact on Immigrant Employment Outcomes, IZA Discussion Paper No. 8061.

M i g r a t i o n : t h e e c o n o M i c d e b a t e
81
This chapter considers how immigration policy can be
enhanced to: avoid population congestion, encourage
greater regional immigration, deliver better outcomes
for those in long waiting queues and keep Australia’s
economy strong.
5. Ensuring immigration benefits all
Professor Glenn Withers

M i g r a t i o n : t h e e c o n o M i c d e b a t e
82
Professor glenn withers Ao is a distinguished professor within the
Australian National University’s (ANU) Research School of Economics
and the Crawford School of Public Policy, the latter of which he
co-founded. He is also President of the Academy of the Social
Sciences in Australia and a Visiting Professor at Tongji University,
Shanghai. He was previously Universities Australia Foundation Chief Executive Officer and
has held earlier academic and government appointments, including as Professor of Public
Policy at the Australia and New Zealand School of Government (ANZSOG), Head of the
Economic Planning Advisory Commission under Prime Minister Paul Keating and Co-Chair of
the National Population Council under Prime Minister Bob Hawke.
He has chaired a number of government inquiries including reviews of population,
immigration, and infrastructure. He was Co-Chair for the Howard Government’s Stocktake of
Micro-Economic Reform and helped that Government establish the Productivity Commission.
He has also been a business adviser ranging from the Business Council of Australia (BCA)
and North West Shelf Consortium to Kerry Stokes. He was awarded an AO for contributions
to applied economics, including for development of the Australian immigration points
system. Professor Withers obtained his PhD from Harvard, and was a longstanding CEDA
Board member. His most recent publication is the Cambridge Economic History of Australia,
which he co-edited.
Introduction
The Brexit referendum in Britain on July 2016 had the Australian immigration
points system as a central focus, symbolically at least. The “leave” forces saw
it as the way Britain could properly manage its borders, compared to open
European immigration.
Tory Brexit campaigners vowed to introduce this type of points system, which
allows a country to control how many migrants enter based on an assessment of
the skills and related characteristics that the country needs.
Naturally, Brexit is more complicated than that – as is the Australian immigra-
tion system. But it is worth examining the Australian immigration story more
M i g r a t i o n : t h e e c o n o M i c d e b a t e
83
closely and assessing its strengths and weaknesses. This chapter argues that
the system has served Australia well overall and, along with the Canadian system,
has been a world-leading immigration arrangement, for all its flaws.1 It also argues
that these arrangements have broadly delivered wide benefits to Australia, sub-
stantially ahead of costs incurred in the process. Of course the issue of indefinite
detention for asylum-seekers is an elephant in the room. However, the focus here
is on regular migration movements.
Nevertheless, this chapter proposes that the strongly positive elements in the
regular migration area can be further enhanced by policy advance. The recent
Productivity Commission report on the Migrant Intake into Australia2 will be key to
assisting such advance. Possible improved practice directions are also specified
in this chapter.
Australian policy evolution
One fundamental explanation for Australia’s successful immigration arrangements
is the country’s occupation of a large land mass by a relatively modest popula-
tion. Additionally, possession of a whole continent, as with Australia, gives better
border control than countries with common land borders or close sea proximity to
others. Australia can, more than most, choose its numbers.
Australia has chosen a route of substantial immigration. For many decades in the
19th century and well into the 20th century, border controls were relatively light to
non-existent. The tyranny of distance limited flows of migrants to those that could
afford to come. Additionally, the local populace saw immigration as beneficial,
with occasional opposition to those who were seen as less desirable immigrants,
such as those who were deemed culturally incompatible. But as travel costs fell
and the early development phase of Australian settlement passed, more stringent
entry criteria increasingly emerged. From the 1980s this led to Australia distinc-
tively developing a predominantly skill-based formal selection system.
All of this evolved relatively pragmatically, according to the views of successive
governments as to Australian settlement and the country’s economic need.
Indeed, Australia is one of the more utilitarian of nations. It is no accident that
Jeremy Bentham developed his characterisation of this philosophy after his time
in Australia (as a temporary entrant, as we would say today).
Utilitarianism seeks “the greatest happiness of the greatest number”. The con-
tention here is that Australian immigration has been a driving force in Australia
delivering on that proposition more than most countries of the world.
Indigenous Australians might well validly disagree. The European occupation
devastated the Aboriginal population, especially in south eastern Australia, where
diseases such as smallpox spread rapidly. But for some Indigenous Australians
and for most subsequent immigrants and their descendants, the outcomes have
been impressive.

M i g r a t i o n : t h e e c o n o M i c d e b a t e
84
Australia does well by most global indicators, ranging from the Human
Development Index through per capita income, to liveable cities, and
Transparency International’s non-corruption index. Despite this, it is undeniable
that issues of disadvantage, equity, sustainability and more have been painfully
present and persist. A compendium of such benchmarks is in Kumar.3
The point that can be emphasised here is Australia’s leading global achievement
in the presence of high rates of immigration, which are still among the world’s
highest. At the least, immigration has not stopped achievement and, as posited
here, it has actually been a force underpinning that achievement. Some 25 per
cent of the Australian population still today is overseas born, a statistic that is one
of the world’s highest for an overseas born population.
Modelling the benefit
Interestingly, when global modelling of the kind that has long supported liber-
alisation in trade and investment is applied to people movements, we find that
removal of border restrictions on people could double world gross domestic
product (GDP).4 This is a much, much greater gain than what is now available
from trade and investment, since the latter restrictions have long been eased
more than for people. This is called a “trillion dollar bills on the sidewalk” proposi-
tion. Economically, great gains are there for the taking
if people movements are made more free.
For Australia, the most recent modelling of the eco-
nomic benefit from immigration has been compiled by
the Migration Council of Australia.5 Comparing a sce-
nario of zero net migration with continuation of current
trends, the modelling finds that by 2050 the higher
immigration scenario delivers a 5.9 per cent increase in
GDP per capita.
To put this in perspective, this is driven by a GDP per capita premium per migrant
of 10 per cent ($6151 at 2012–13 prices) or consumption per capita of 21 per
cent ($6977 at 2012–13 prices). These are the economic bonuses delivered to all
Australians by a sustained migration program relative to zero net migration for the
year 2050.
This outcome derives from increased labour force participation and increased
productivity. The labour force effect is especially due to the age structure of
migrants (younger), and the productivity effect especially from their human capital
(more skilled). Matters such as benefit from economies of scale and cultural diver-
sity also enter the equation.
Recent work by Parham et al estimates direct effects of migration on productivity
for Australia as being 10 per cent of annual labour productivity growth between
2006 and 2011, according to census data.6
“ Some 25 per cent of the Australian
population still today is overseas
born, a statistic that is one of the
world’s highest for an overseas born
population.”

M i g r a t i o n : t h e e c o n o M i c d e b a t e
85
The Migration Council’s work with an Independent Economics model is especially
pertinent, since it overcomes many of the severe limitations of earlier modelling,
such as that of the Productivity Commission7 and Econtech,8 in estimating the
magnitude of immigration economic effects.
Earlier modelling found it technically difficult to allow for scale economies, even
when these may be essential for the peopling of a lightly populated continent.
That earlier modelling also found it technically difficult
to look beyond market effects to allow for economic
endogeneity, such as through the agglomeration
benefits associated with skills concentration and the
interactions of such people. Following recent European
work, this Independent Economics model is semi-
endogenous as its closure requirements for projections
still ultimately reduce such endogenous effects over
time to facilitate convergence, and hence computa-
tional convenience. For this reason, the results are still
conservative.
Figure 1 EffECts of migrAtion on PEr CAPitA gDP by ExPEnDiturE
Note: This is per capita expenditure growth of GDP in percentage terms for 2050 for a 0.9 per cent net migration growth scenario relative to a zero net migration growth scenario.
Source: Migration Council of Australia (2015) p.18.
–0.3
–0.2
–0.1
–0.0
0.1
0.2
0.3
0.4
0.5
0.6
0.7
GDPImportsExportsPublicenterpriseinvestment
Businessinvestment
Residentialinvestment
Governmentfinal
demand
Householdconsumption
-0.3
-0.2
-0.1
-0.0
0.1
0.2
0.3
0.4
0.5
0.6
0.7
GDPImportsExportsPublic enterprise investmentBusiness investmentResidential investmentGovernment final demandHousehold consumption
“ Interestingly, when global modelling
of the kind that has long supported
liber alisation in trade and investment
is applied to people movements, we
find that removal of border restrictions
on people could double world gross
domestic product.”

M i g r a t i o n : t h e e c o n o M i c d e b a t e
86
The chart above summarises the key differences in modelling for the recent
Independent Economics work for the Migration Council compared to the earlier
Productivity Commission and KPMG modelling.
This modelling is also an improvement over standard demographic projection
modelling, which compares alternative migration levels over time. Of course,
a constant level on a growing base shows diminishing influence and benefit,
including in reducing the impacts of population ageing. After all, migrants age
like everybody else. But at entry migrants are younger under Australian selec-
tion, and a gradually increasing migration intake (or a constant rate) has a greatly
enhanced economic benefit in dealing with ageing population concerns. This too
is reflected in the Independent Economics modelling, but largely neglected in
earlier modelling.9
Table 1 moDEl AttributE DiffErEnCEs in mAJor AustrAliAn migrAtion AnAlysEs
Model attribute2006
commission2006
econtech
2014 independent economics
Labour skills and migration 3 3 3
Labour force participation and migration 3 3 3
Link from higher exports to lower terms-of-trade 3 3 3
Link from population growth to investment ? 3 3
Link from financial wealth of migrants to living standards 5 3 3
Natural resources diseconomies of scale 5 5 3
Infrastructure economies of scale 5 5 3
Semi-endogenous growth a) Link from education spending to
productivity5 5 3
Semi-enndrogenous growth b) Link from R&D to productivity 5 5 3
Population and government spending (social security, health, education) 5 5 3
Source: Migration Council of Australia (2015), p.7.

M i g r a t i o n : t h e e c o n o M i c d e b a t e
87
The Independent Economics simulations are larger for per capita income effects
than the previous neo-classical simulations, and they are closer to direct esti-
mates using time series regression models that track actual effects in real time
with real data, beginning with Pope and Withers10,11 through to Docquier, Ozden
and Peri.12 These also find pay-off for previous residents – not only migrants
– especially for less well-off native workers, indicating a significant equity improve-
ment too.13
Yet, we are aware of some possible major re-evaluation of the benefits of glo-
balisation by a substantial number of voters in various countries. If Australia is
leading world-practice, in immigration especially, this phenomenon is therefore
worth closer review.
The source of negative evaluations by voters and/or by
various groups clearly needs to be examined, if claims
of overall benefit are to be taken seriously. Cultural and
social challenges have been mentioned. Additionally,
environmental impacts, including on city living as well as
the wider environment and ecology, are pertinent.14
One way of accounting for these negatives formally is
to move from GDP to National Well-Being measures.15
The most developed of these measures that provides a single aggregate indi-
cator in Australia has been the Genuine Progress Indicator (GPI), produced by
the Australia Institute.16 Inclusion of negatives such as congestion and pollution
naturally do reduce the production based measures but, once the adjustment is
made, the GPI per capita then tracks the GDP per capita measure fairly closely
upwards over time allowing for the population effect, which is roughly half due to
net migration.
This said, such negative effects do operate and net benefit would be enhanced
if better management were in place for environmental externalities, congestion
effects and other negatives. The Australian Infrastructure Audit found that if we
don’t increase capacity on our roads and/or better manage demand and traffic
flows, the total cost of urban congestion could increase from $13.7 billion in 2011
to $53.3 billion in 2031.17
Further guidance on which sustainability effects require focus is given in environ-
mental work commissioned for a recent Australian Council of Learned Academies
report. The study found that while in some areas there is significant environmental
improvement relative to GDP and/or population growth, in other areas problems
have grown.18 The table that follows outlines these areas and whether they are
linked to economic growth and in what way.
The pace of immigration must also be mindful of the effects on social and cultural
cohesion. Even more than the global opening of trade and investment, people
movements involve substantial people-to-people effects that can be disturbing
for some. Thus a public opinion survey commissioned for the Australian Council
of Learned Academies studying Australia’s Comparative Advantage19 did have a
majority support for enhanced migration, but less fulsomely than for a number of
other policy options government might pursue, see Figure 2 overleaf.
“ Even more than the global opening
of trade and investment, people
movements involve substantial
people-to-people effects that can be
disturbing for some.”

M i g r a t i o n : t h e e c o n o M i c d e b a t e
88
A notion of conditionality can be imposed. Migration movements should not be so
high as to out-run the absorption capacity of the nation – but this capacity should
be enhanced and managed well. Quite often policy improvement is needed
anyway, even if population were not growing faster with immigration. This means
that issues such as infrastructure and settlement support need best-practice and
not neglect, and they need leadership, partnership and communication if the
greatest happiness of the greatest number is indeed to result.
Figure 2
PubliC AttituDEs to sElECtED mAJor PoliCy ChAngEs: AustrAliA 2015
Source: Social Research Centre (2015).
environmental improvement
• Carbon monoxide (CO);
• Volatile organic compounds (VOC); and
• Applied nutrients (water pollution).
Mixed outcomes
• Carbon Dioxide (CO2);
• Particulate matter 2.5 (PM2.5); and
• Water used in agriculture.
environmental deterioration
• Particulate matter 10 (PM100);
• Waste;
• Nitrogen oxides (NOx); and
• Sulphur oxides (SOx).
inconclusive impact
• Protected areas/biodiversity.
Source: Bond, Burger and Nguyen (2015).
Table 2 EnvironmEntAl inDiCAtors’ rElAtionshiP with EConomiC growth in AustrAliA, 2003–2011
0 20 40 60 80 100
Total supportNeutralTotal opposeDoes not comprehend
Lift net overseas migration with a greater focus on skilled migration
Pursue better childcare support to boost female labour force participation
Undertake labour force reforms to boost labour force participation in mature ages
Lift government funding of vocational education and training
Lift government funding in higher education
Lift public infrastructure spending such as road, rail, electricity, etc.
Adopt policies to encourage greater innovation in research and development
2 4 1 93
1 7 4 88
2 8 6 84
3 11 5 81
2 36 10 52
14 5 81
10 5 85

M i g r a t i o n : t h e e c o n o M i c d e b a t e
89
Modern immigration policy in Australia
If there is net benefit from Australia’s experience of immigration, the question
therefore arises as to how that benefit can be maintained and enhanced. And
the fact is, the extent and nature of the benefits are in part a function of policy
choices. Included here is recognition that we can shape the outcomes of the
migration program itself and therefore its impacts.
Here, we focus on the mechanisms available through the migration program itself.
A key to Australia’s outcomes has been the decision in the late 1980s to adopt
a points system. The mass migration of earlier intakes post-war had especially
been oriented at family settlers who could help with the basic workforce required
to contribute to the construction and development of Australia.
But as the economy became more sophisticated, urban, skilled, educated and
service oriented, a need to better link immigration to future workforce needs such
as these became evident. The result was a report commissioned from the then-
National Population Council by Immigration Minister Chris Hurford and received
by subsequent Immigration Minister Robert Ray20 and adopted in short order and
in full by the Hawke Labor Government.
The consequent policy that emerged in this process was to make immigra-
tion much more oriented to emerging workforce requirements through a points
entry selection. With independent migrants as the largest component pathway
to entry, the component points emphasised youth, education and training, work
experience, English language and other economic and community language
capability. The points level was adjusted to meet
the total program numbers desired. Extended
family were brought into the points system through
bonus points for family linkage reflecting easier
settlement.
Direct family entry likewise became more skilled
over time through assortative mating, and even
refugee and humanitarian entry became dominated more by skill as the special
humanitarian component selection process (more than the mostly smaller
UNHCR refugee component) allowed skill characteristics and family links to
Australia to facilitate selection from long queues.
A wider reform still of immigration was foreshadowed in a further National
Population Council Report on Population Issues and Australia’s Future,21 com-
missioned by the Hon. Prime Minister Bob Hawke.
This report sought to integrate immigration into wider population policy and to
allow for triple bottom line objectives and outcomes through enhanced coordina-
tion. The report landed on Prime Minister Hawke’s desk just as he was challenged
for the leadership by Paul Keating. It was never seen again as a lead policy
document. This was because it was strongly opposed by bureaucratic interests
who would have lost power, and because Paul Keating was less committed to
“ A key to Australia’s outcomes has been
the decision in the late 1980s to adopt a
points system.”

M i g r a t i o n : t h e e c o n o M i c d e b a t e
90
vigorous support of immigration policy and changes therein than was Prime
Minister Hawke. Melbourne Immigration Ministers and Premiers have shown a
tendency to be more immigration policy expansionary and focused in general
than those from Sydney.
The points system itself though was sustained under the Hawke and Keating
Labor governments and also under the Howard Coalition Government. Prime
Minister John Howard initially raised the points and slashed entry numbers for
permanent migration, to reflect his earlier opposition to a growth in numbers that
had worried him because of its ethnic composition and which, indeed, cost him
the Leadership of the Opposition at that time.
However, two developments followed. The Coalition’s business constituency
was concerned over the reduced immigration levels because they saw that this
reduced workforce growth and product demand. The government accordingly
expanded temporary entry for workforce reasons and without clear caps and built
pathways from temporary to permanent over time. This was the beginnings of the
457 and similar visa growth.
Secondly, the Government after its first period in office and following some
electoral backlash in key electorates from ethnic constituencies, including in
the Prime Minister’s own electorate, relaxed
total program number constraints on perma-
nent migration. By the time of the Howard
Government’s defeat, immigration was at
record levels.
One key to this expansion was not the reduc-
tion of required points entry levels. Prime
Minister Howard saw any such reduction
as signaling reduced quality of migrants.
Something he did not wish to countenance
intrinsically and politically. Rather the sugges-
tion was put by key advisers (especially Glenn
Withers and Chris Conybeare) to business and government that expansion could
take place appropriately by awarding bonus points to current and former interna-
tional students. The rationale was easier settlement through language capabilities,
Australian qualifications and Australian community knowledge and links. This was
adopted. Over 60 per cent of the skilled permanent migration expansion came
from this source for the first five years after adoption.
A second source of such expansion also came from increases in employer and
state nominations under separate schemes for permanent entry, including by
conversion from temporary entry through employers. These entrants passed
basic tests to avoid eroding local working conditions, and had the evident virtue
of easy transition to employment. Indeed, over time, the implied points cut-off
for permanent entry through nomination began to be considerably lower than for
independent entry, as successive governments made independent numbers a
residual within the total program quota.
“ Increasingly therefore the immigration
program veered away from the post-
war focus on broad-based workforce
enhancement and commitment to Australian
settlement, to meeting narrower and more
immediate employer and state politi cal
requirements.

M i g r a t i o n : t h e e c o n o M i c d e b a t e
91
Increasingly therefore the immigration program veered away from the post-war
focus on broad-based workforce enhancement and commitment to Australian
settlement, to meeting narrower and more immediate employer and state politi-
cal requirements. Such settings continued under the Gillard and Rudd Labor
governments.
Adjustment of selection settings could have enhanced immigration benefits
further, and could still today. But they were either avoided or indeed loosened
further such as with business investor settings.
For improvement, the simplest path would be to retain and enhance benefits
from employer sponsorship or state nomination. This could be done through a
straightforward incorporation of these criteria into points representation. Then
those benefits can be calibrated in the same metric as other factors. Instead,
they have been given priority pathways that crowd out independent entry without
measuring trade-offs. This segmented bureaucratic pathway approach also
undermines some public support for immigration, as it becomes seen as more an
employer prerogative than a personal commitment by individuals to this country.
Likewise, the conversion of the once Department of Immigration and Citizenship
to the Department of Immigration and Border Protection, with a new militaristic
command and control ethos, has further undermined the older Australian Way.
The nature of the offshore detention regime and the “pushing back of boats”, and
associated rhetoric has reinforced such perceptions.
Former Immigration Deputy Secretary, Peter Hughes has documented the shift to
a hardline “threat” approach in immigration and has argued that, unless a more
“coherent, positive, government-led narrative” is offered, public support will be
dangerously eroded.22 Security agencies have
also reportedly warned against such rhetoric
as a source of radicalisation. The preferred
approach is to “talk softly and carry a big
stick”.
Good administration and a welcoming
approach is crucial. The introduction by the
immigration department of new entry criteria
thresholds, even for those long standing
in queues, was one of the major contributory reasons for the sudden drop of
student migrant applications in the later 2000s, alongside some student safety
concerns at the time.
One benefit of the otherwise mostly limited change in settings under Prime
Ministers Kevin Rudd and Julia Gillard is worth listing: the continuation of
high levels of immigration was restored and enhanced after the first Howard
Government cuts to permanent entry numbers (despite the subtle expansion of
temporary entry).
“ For improvement, the simplest path would be
to retain and enhance benefits from employer
sponsorship or state nomination. This could be
done through a straightforward incorporation of
these criteria into points representation.”

M i g r a t i o n : t h e e c o n o M i c d e b a t e
92
When the incoming Rudd Government confronted the Global Financial Crisis and
managed Australia’s path through it very well, compared to most other indus-
trial countries, it sustained high immigration. It is not widely understood that this
played as big a role in sustaining the Australian economy as the local monetary
and fiscal measures that were introduced, and the Chinese export demand
during this period. In this respect the then-Department of Immigration deserves
commendation as great as that claimed by Treasury and the Reserve Bank.
Finally, one further commendation is due. It should be mentioned that Howard
Government Immigration Minister, Amanda Vanstone, almost alone among many
such Ministers, increased refugee numbers significantly. Previous and subse-
quent governments (until the present decade) kept numbers steady, especially
refugee numbers as opposed to special humanitarian entry, because of concern
at the high budget cost of services and slow adjustment to employment. Minister
Vanstone also moved well on the regional location of migrants, a matter dis-
cussed further below.
Case studies: regions and employment
Regions
Two areas illustrate how the immigration process can be enhanced in different
ways. The first is the regional immigration process. If there is concern over urban
congestion in cities such as Sydney, and migrants are seen as contributing to
that, there are policies that can assist. One is to redirect migrants to regions with
smaller populations and reasonable carrying capacity. If potential migrants indi-
cate a willingness to settle in such regions they
can be accepted ahead of others, all else equal.
The points system can accommodate this by
bonus points for the regions.
However, the issue then arises as to free move-
ment. Once admitted, why will such migrants
not move to perceived preferred locations such
as the large cities? This was the issue with some
such early programs. In response to objection to large city-directed migration by
then-NSW premier Bob Carr, an alternative was advanced in a study commis-
sioned by then-shadow Immigration Minister Julia Gillard and funded through the
Evatt Foundation.23
The alternative idea was to provide a temporary-to-permanent visa, which would
be validated as permanent when residence in the region for a specified period
could be demonstrated. When such residence, employment, housing, education
and social networks are established, the migrant is therefore more likely to stay
longer in their more remote region.
“ If there is concern over urban congestion
in cities such as Sydney, and migrants
are seen as contributing to that, there are
policies that can assist.”

M i g r a t i o n : t h e e c o n o M i c d e b a t e
93
Interestingly, Liberal Party Immigration Minister Vanstone adopted the report’s
approach in 2004 following its publication, even though the report was for the
Labor shadow minister. The result of this change was a major increase in the
share of the immigration program devoted to regional schemes and a substantial
increase in regional retention as well. The expansion of this designated regional
migrations after 2004 is illustrated in the above chart, as is some fall-back after
2014.
One trouble with the scheme has arisen from delegating to states/territories
the power to specify the regional areas. This delegation was abused substan-
tially in some jurisdictions such as Victoria, which chose to include Melbourne
as a region. Victoria sought to increase its population growth rate, after losing
many residents to Queensland. It was nevertheless successful in this ambition
and Sydney, which was excluded from such schemes by Premier Bob Carr,
languished for many years. Such implementation issues can be improved upon
as, unlike Canada, the constitutional power over immigration rests solely with the
Commonwealth Government.
Subject to such improvement, a target of 40 per cent of skill program immigration
to operate through regional mechanisms would be reasonable under condition-
ality principles. The improving infrastructure management under such bodies
as Infrastructure NSW may then render such constraints increasingly unneces-
sary. This would be long overdue implementation of the views of the Private
Infrastructure Taskforce.24
Figure 3 stAtE-sPECifiC AnD rEgionAl migrAtion outComEs: AustrAliA, fy 2005–2015
Source: Department of Immigration and Border Protection (2015), p. 15.
0
20,000
40,000
60,000
80,000
100,000
120,000
140,000
Number Percentage
Skill – non-SSRM (LHS)Skill – SSRM (LHS) SSRM percentage of Skill stream (RHS)
2015
–16
2014
–15
2013
–14
2012
–13
2011
–12
2010
–11
2009
–10
2008
–09
2007
–08
2006
–07
2005
–06
2004
–05
0
5
10
15
20
25
30
35
40
45
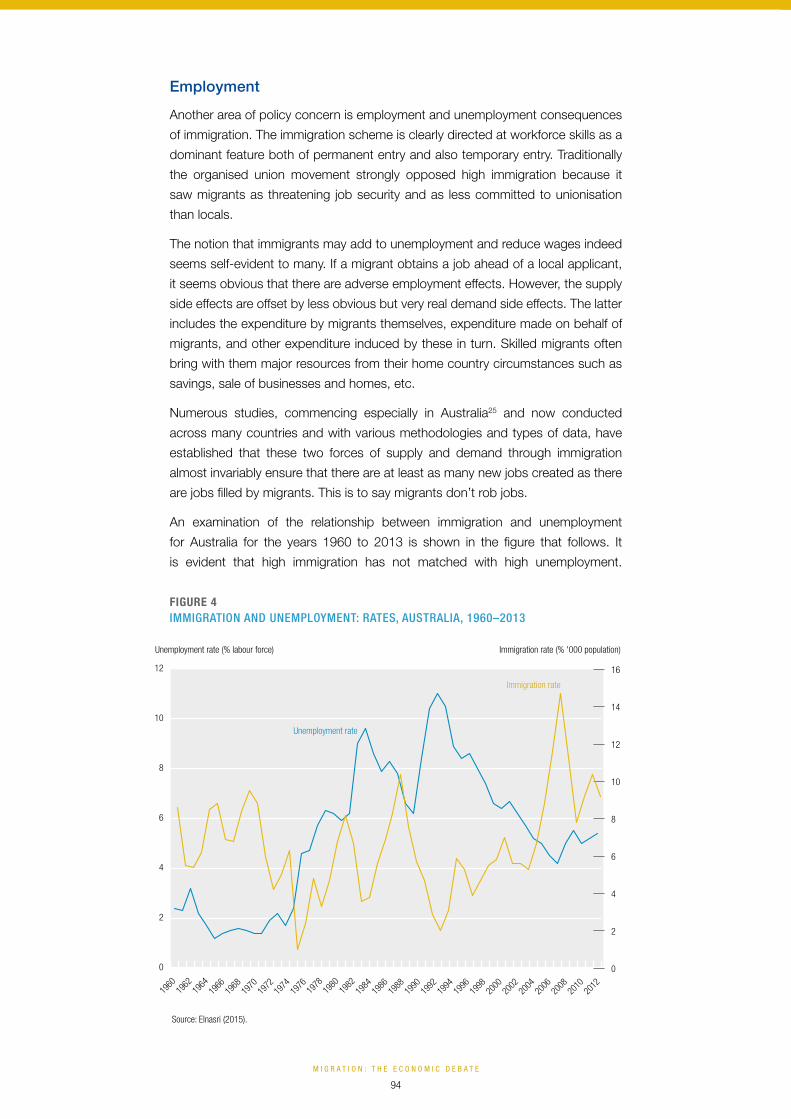
M i g r a t i o n : t h e e c o n o M i c d e b a t e
94
Employment
Another area of policy concern is employment and unemployment consequences
of immigration. The immigration scheme is clearly directed at workforce skills as a
dominant feature both of permanent entry and also temporary entry. Traditionally
the organised union movement strongly opposed high immigration because it
saw migrants as threatening job security and as less committed to unionisation
than locals.
The notion that immigrants may add to unemployment and reduce wages indeed
seems self-evident to many. If a migrant obtains a job ahead of a local applicant,
it seems obvious that there are adverse employment effects. However, the supply
side effects are offset by less obvious but very real demand side effects. The latter
includes the expenditure by migrants themselves, expenditure made on behalf of
migrants, and other expenditure induced by these in turn. Skilled migrants often
bring with them major resources from their home country circumstances such as
savings, sale of businesses and homes, etc.
Numerous studies, commencing especially in Australia25 and now conducted
across many countries and with various methodologies and types of data, have
established that these two forces of supply and demand through immigration
almost invariably ensure that there are at least as many new jobs created as there
are jobs filled by migrants. This is to say migrants don’t rob jobs.
An examination of the relationship between immigration and unemployment
for Australia for the years 1960 to 2013 is shown in the figure that follows. It
is evident that high immigration has not matched with high unemployment.
Figure 4 immigrAtion AnD unEmPloymEnt: rAtEs, AustrAliA, 1960–2013
Source: Elnasri (2015).
1976
1974
1972
1970
1968
1966
1964
1962
1960
1994
1996
1998
2000
2002
2004
2006
2008
2010
2012
1992
1990
1988
1986
1984
1982
1980
1978
0
2
4
6
8
10
12
Unemployment rate (% labour force)
Unemployment rate
Immigration rate (% '000 population)
Immigration rate
0
2
4
6
8
10
12
14
16

M i g r a t i o n : t h e e c o n o M i c d e b a t e
95
The technical studies control for the causation forces behind this and confirm the
conclusion in a more sophisticated way.
Immigration Minister Chris Hurford was the first Labor Minister to successfully
convince his Government to maintain and indeed raise immigration at a time of
rising unemployment. He has said that this was because he was convinced by
the logic and economic evidence in the early Australian studies, and sold this to
his colleagues.
Such evidence-based policy is less common than analysts would like to see.
Fortunately, the practical tests since have been limited, since Australia will have
experienced by 2017 the longest period without recession of any industrial
country in the post-war period: 26 years. As stated, huge increases in immigra-
tion levels have certainly occurred without unemployment rate increases.
With immigration, both “jobs and growth” are eminently feasible. The lesson
should not be lost on politicians if and when populist issues arise on immigration.
If the politicians and other community leaders lead quickly and explain and com-
municate the truth, then Australia’s better angels have more chance. If they delay,
we can pay a high price as a community.
Furthermore, if we undermine the gathering and analysis of evidence we can lose
the foundations of good policy. The decision to axe the Bureau of Immigration,
Population and Multicultural Research in 1996 – just as an earlier round of
Hansonism was surfacing – shows the costs of leaving government without
the analytic foundations to manage well. It may be time to restore strength and
balance to our knowledge base. The contemporary retreat from expertise and
facts does need redress.
The way forward
Immigration is a major component of the way Australia moves forward. It always
has been, since European settlement – and even in earlier times for indigenous
Australia. Getting it right is essential. But so are the accompanying policies that
must complement the peopling of Australia.
A vision of what the wider policy menu must look like has been given in the
report from the Australian Council of Learned Academies (ALCOLA) on Australia’s
Comparative Advantage.26 The report suggests that Australia can indeed sustain
its past achievement. What is required to secure that future is a comprehensive
set of ongoing structural and competition reforms, combined with a complemen-
tary set of investments in the national capability to compete.
The structural and competition reforms should encompass tax, labour market
and product market competition, genuine free trade enhancement and federal-
ism reform. The investment in capability should embrace infrastructure, innovation
and education plus labour force participation and migration.

M i g r a t i o n : t h e e c o n o M i c d e b a t e
96
If such a set of policies are treated as a package, indeed, as a new narrative for
Australia, they will operate together to enhance benefit while allowing costs to
be evened out. Thus a return to serious and well-directed infrastructure provision
would work seamlessly with the migration process to avoid congestion. Local
education initiatives would stand all locals in good stead and not lead to concerns
of educated migrants displacing local education attainment. Policy becomes a
“virtuous circle”, including in funding fiscal consolidation for governments
With reasonable specification of these policies from major respected public
reviews, the ACOLA report used Independent Economics modelling to conclude
that such a package could deliver an increase in consumption per capita of 17.2
per cent by 2030 and 24.5 per cent by 2050. This was the pay-off over and
above a “no-policy-change” base line. Immigration, federalism reform, tertiary
education policy, plus enhanced labour participation are the four leading compo-
nents of pay-off.
For the migration component of this modelling to play its part, a constant rate of
migration at 0.9 per cent of population annually was assumed. This would allow
net migration to rise to 400,000 by 2054. This compares with an earlier peak of
300,000 in 2008–09.
The analysis in this chapter indicates that such growth can take place without
adverse unemployment outcomes. Further, as indicated, if there is leadership
in place that explains this outcome, we can help avoid populism that can arise
without objective foundation. In such leadership, it may help citizens to be aware
these outcomes provide more benefit to the least skilled. The less skilled after tax
Figure 5 living stAnDArD PAy-off from struCturAl AnD invEstmEnt rEform: AustrAliA 2030
Note: The pay-off here is the percentage deviation for the reform scenario over a no-policy-change baseline in relation to per capita consumption. The contributing elements to this pay-off are presented here as well as their total compound effect.
Source: Withers et al (2015).
0
5
10
15
20
25
%
Living standardsConsumption shareLabour productivityEmployment rate
8.4
4.0
22.0
8.2

M i g r a t i o n : t h e e c o n o M i c d e b a t e
97
real wage, is projected to rise by 21.9 per cent, mid-level skilled by 11 per cent
and highly skilled by –3.5 per cent by 2050, around an average of 9.7 per cent.27
This is a conservative estimate of gains. It assumes the existing migration
composition, and simply expands the numbers under the existing system. If
the migration selection system were to be enhanced by reducing the separate
pathways for entry and merging employer and independent skilled permanent
migration, outcomes could rise further.
Under such revised arrangements, as flagged, the up-front immediate employ-
ment benefits of employer selection migration could easily be maintained by
simply incorporating points for the employer nomination. Further, quick entry for
all could now be facilitated, whereas at present independent migrant queues are
manipulated to accommodate employer priority over entry, within the total skilled
quota. Such processing priority is strange when employer short-term needs are
provided for by the separate uncapped temporary entry program, such as the
457 visa.
Floating points entry cut-off would transparently and fairly allow total program
size control. However, this should be done with a managed float and with no
retrospectivity – so that those currently waiting upon final decisions are not
disadvantaged. Retrospectivity has been particularly damaging in the past for
Australia’s international student exports. This should be avoided.
In adjusting the points cut-off to determine the skilled entry totals, allowance could
also be made for the level of immediate family reunion, at present managed as a
separate queue with processing time used as the regulator. The consequence of
this latter clumsy bureaucratic process has been that Australians with overseas
spouses and children can often wait for unpredictable and unconscionable times
for the exercise of their rights as Australian citizens.
Finally, the points system could also incorporate a regional element to provide
extra points for regional settlement (while retaining the transition to permanent
provision to validate the locational choice). This will allow major urban pressure
to still be alleviated and increase public acceptance of immigration. Separate
bureaucratic queues would be avoided and a transparent and defensible defini-
tion of regional need could be imposed. This is an example of how conditionality
in immigration policy can operate. We can reduce negatives while better address-
ing them directly. This is an unusual policy avenue of “having the best of both
worlds”.
Various other anomalies could be mentioned, ranging from the contradictions
involved in New Zealand visa free entry with restrictive residence cancellation pro-
visions, through to the bizarre bridging visa system for onshore refugee claimants
that denies work-rights and training opportunities. But the argument is now clear.
Australian immigration selection could be returned to being a much more rational
and efficient system. It has grown in ways, since establishment, that are like an
adolescent’s growth: it is in need of a good wash and tidy.
The ACOLA report indicated that the public was supportive of improving settings
for enhancing our future. It wanted leadership in this.

M i g r a t i o n : t h e e c o n o M i c d e b a t e
98
Conclusion
Good policies explained well are the way forward. The UK Brexit debate showed
how Australia’s selection system for immigration is widely regarded elsewhere as
the jewel in our population policy crown. It should be refreshed and enhanced,
and our migration selection could then deliver even more than at present and with
greater public support, whatever various special interest groups think.
Recent political trends here and overseas show that undue privilege and lack of
transparency is eroding public trust. It can be restored by good, well-explained
and transparent policy.
The policy approach here would:
1. Expand immigration gradually over time in-line with population, but conditional
upon complementary policy advance that addresses adverse consequences
of population growth such as infrastructure provision, urban congestion and
environmental degradation.
2. Improve immigration program management by reducing separate pathways
and administered queues, and integrating these through a refreshed Australian
points system.
3. Ensure that an enhanced points system is grounded on suitable specification
of work skills, language skills, partner skills, extended family Australian linkages
and age, alongside necessary hurdles for health and security.
4. Supplement the basic points common across all skill categories with additional
points for employer nomination to enhance direct employment outcomes.
5. Shift weighting within the points system toward greater points priority for
regional location, using the temporary to permanent visa provisions to
enhance regional integration and directly reduce larger city pressures.
6. Reform the processing speed of immediate family entry, refugee and special
humanitarian entry decision-making to eliminate demoralising waiting times.
7. Reform the processing speed too for temporary entry, so that the benefits
from areas such as international students and tourism are not diverted to com-
petitor countries.
8. Shift immigration administration to a more welcoming, positive and sup-
portive orientation and ensure enhanced integration with improved settlement
services and support.
9. Improve administrative and external data to allow better examination of
immigration processes and outcomes, and support further internal and inde-
pendent external research into the immigration experience.
Comments from Nathan Taylor are appreciated. Responsibility for the views expressed are those of the author.

M i g r a t i o n : t h e e c o n o M i c d e b a t e
99
endnotes
1 OECD (2014), ‘Managing labour migration: Smart policies to support economic growth’ in International Migration Outlook 2014, Paris: OECD.
2 Productivity Commission (2016), Migrant Intake into Australia: Final report, Canberra, April 2016, publicly released September 2016.
3 Kumar, S. (2013), A Compendium of Global Ranking Reports, Melbourne (Report for ACOLA, as updated)
4 Clemens, M (2011), ‘Economics and Immigration: Trillion-Dollar Bills on the Sidewalk”, Journal of Economic Perspectives, 25 (3), Summer: 83–106
5 Migration Council of Australia (2015), The Economic Impact of Immigration, Canberra.
6 Parham, D. et al. (2015), Migration and Productivity in Australia, Crawford School of Public Policy, ANU.
7 Productivity Commission (2006), Economic Impacts of Migration and Population Growth, Canberra.
8 Econtech (2006) The economic impacts of migration: a comparison of two approaches. Department of Immigration and Multicultural and Indigenous Affairs: Canberra.
9 Withers, G. (2002), “Demographic Ageing and Immigration”, Australian Economic Review, 35(1) March 2002: 104–112.
10 Pope, D., and G. Withers (1985), “Immigration and Unemployment”, Economic Record, 61(2), June: 554–564.
11 Pope, D. and G. Withers (1993), “Do Migrants Rob Jobs? Lessons of Australian History, 1861-1991,” Journal of Economic History, 53(4), December: 719–742
12 Docquier,F., Ozden,C., and G. Peri (2010), The Labor Market Effects of Immigration, IZA Discussion Paper No. 6258, December 2011, IZA
13 Bond, M., & Gaston, N. (2011). “The impact of immigration on Australian-born workers: An assessment using the national labour market approach”. Economic Papers, 30(3): 400–413.
14 Castles, S., Foster, W., Iredale, R., and G.Withers (1998), Immigration and Australia: Myths and Realities, Sydney: Allen and Unwin
15 Salvaris, M. (2013), Australia’s Progress in the Twenty-First Century - measuring the future we want. Australian Council of Learned Academies, Melbourne.
16 Hamilton, C. and R. Denniss (2000), Tracking Well-being in Australia: The Genuine Progress Indicator 2000, Discussion Paper Number 35, December, The Australian Institute
17 Davies, P. (2016), “Time to reform century old road taxes so we can fund new infrastructure”, Australian Financial Review, 9 September http://www.afr.com/business/infrastructure/roads/time-to-reform-century-old-road-taxes-so-we-can-fund-new-infrastructure-20160908-grbkq5#ixzz4Jj8IrLSF
18 Bond, C., Burger, N., and P. Nguyen (2015) Implications of Australian Economic Growth for Environmental Sustainability: RAND Justice, Infrastructure, and Environment WR-1081 March, (Report for ACOLA).
19 Withers, G., Gupta, N., Curtis, L., and N. Larkins, (2015), Australia’s Comparative Advantage, report for the Australian Council of Learned Academies, http://www.acola.org.au/PDF/SAF01/SAF01%20full%20lo%20res.pdf
20 Expert Working Party on the Immigration Selection System, National Population Council, (1988), Report, Canberra: National Population Council, (G. Withers, Chair).
21 Population Issues Committee, National Population Council (1992), Population Issues and Australia’s Future: environment, economy and society, Final Report, Canberra AGPS, (G. Withers, Chair of Committee) (2 volumes).
22 Hughes, P. (2016), A New Narrative, Policy Forum Net, Crawford School: http://www.policyforum.net/a-new-narrative
23 Powall, M. and G. Withers (2003), Immigration and the Regions, Report for the Chifley Foundation, September.
24 Private Infrastructure Taskforce (1995), Private Financing of Public Infrastructure: Final Report, Canberra: AGPS (G. Withers, Chair).
25 Pope, D., and G. Withers (1985), “Immigration and Unemployment”, Economic Record, 61(2), June: 554–564.
26 Withers, G., Gupta, N., Curtis, L., and N. Larkins, (2015), Australia’s Comparative Advantage, report for the Australian Council of Learned Academies, http://www.acola.org.au/PDF/SAF01/SAF01%20full%20lo%20res.pdf
27 Migration Council of Australia (2015), The Economic Impact of Immigration, Canberra.
M i g r a t i o n : t h e e c o n o M i c d e b a t e
100
Acknowledgements
national
ABB Australia
ACIL Allen Consulting
Advisian
AEMO
AGL
Allens
ANZ Banking Group
APA Group
Arup
Ashurst
Austrade
Australia Post
Australian Catholic University
Australian Rail Track Corporation
AustralianSuper
Bankwest
Broadspectrum
Bupa
Cardno
Chartered Accountants Australia and New Zealand
CEDA would like to acknowledge the following members and individuals
who contributed to CEDA’s general research fund between 1 September 2015
and 1 September 2016.
CEDA undertakes research with the objective of delivering independent,
evidence-based policy to address critical economic issues, and to drive public
debate and discussion. CEDA could not complete its research without the
support of these contributors.

M i g r a t i o n : t h e e c o n o M i c d e b a t e
101
Clayton Utz
Commonwealth Bank of Australia
CPB Contractors
CSC
CSIRO
Deloitte
Empired
EY
Fragomen
G4S Australia and New Zealand
GHD
HASSELL
Herbert Smith Freehills
HESTA
IBM
Jacobs
Keolis Downer
KinCare
KPMG
Lendlease
McKinsey & Company
Minerals Council of Australia
Mitsubishi Australia
National Australia Bank
Navitas
Nous Group
Philips Electronics
PPB Advisory
PwC Australia
Reserve Bank of Australia
Rio Tinto
RSM
Santos
SEEK
Siemens
South32
Stellar Asia Pacific
Stockland
Telstra
The University of Queensland
Transurban
TRILITY
Uber
UniSuper
Westpac
Woods Bagot
WSP | Parsons Brinckerhoff
ACt
Aged and Community Services Australia
Australian Bureau of Statistics
Australian National University
Federal Department of Industry, Innovation and Science
University of Canberra
nsw
amaysim
ARITA - Australian Restructuring Insolvency & Turnaround Association
Arts NSW
Australian Computer Society
Australian Energy Market Commission
Australian Institute of Company Directors
Australian Nuclear Science and Technology Organisation

M i g r a t i o n : t h e e c o n o M i c d e b a t e
102
Australian Payments Clearing Association
Barangaroo Delivery Authority
BOC
BRI Ferrier
Business Events Sydney
Caltex Australia
CBRE
City of Parramatta
Clean Energy Finance Corporation
Coal Services
Consult Australia
Data61
Edelman
EIG
Essential Energy
Export Finance and Insurance Corporation
Four Seasons Hotel Sydney
Gadens
Gilbert + Tobin
Healthdirect Australia
Holcim (Australia)
Hunter Water Corporation
IAG
Infrastructure Australia
Insurance & Care NSW (icare)
JBA
Johnson & Johnson
L.E.K. Consulting
Macquarie Group
Macquarie University
Maddocks
Mainsheet Capital
National Insurance Brokers Association of Australia
New Zealand Trade and Enterprise
Newgate Communications
NSW Department of Family and Community Services
NSW Department of Finance, Services and Innovation
NSW Treasury Corporation
Plenary Group
Port Authority of New South Wales
Port of Newcastle
Powershop
Regional Development Australia Orana
Royal Bank of Canada
Standards Australia
Swiss Re
Sydney Airport
Sydney Business School, University of Wollongong
Sydney City Council
TAFE NSW Western Sydney Institute
TBH
The Benevolent Society
The BPAY Group
The Future Fund
The GPT Group
The University of Sydney
Thorn Group
Transport for NSW
UGL
United Overseas Bank
University of Newcastle
University of Technology Sydney
University of Wollongong
UrbanGrowth NSW
Visa
M i g r a t i o n : t h e e c o n o M i c d e b a t e
103
Water NSW
Western Sydney University
Wollongong City Council
nt
Darwin Convention Centre
qlD
Accenture Australia
AE Projects
Arcadis Australia Pacific
Arrow Energy
Aurizon
Australian Sugar Milling Council
Baker & McKenzie
Bank of Queensland
Bond University
Brisbane Airport Corporation
Brisbane Convention and Exhibition Centre
Brisbane Marketing
Burrell Stockbroking and Superannuation
Churches of Christ in Queensland
Colin Biggers & Paisley
Community Services Industry Alliance
ConocoPhillips
Construction Skills Queensland
CPL
Energex
Ergon Energy
Ferrier Hodgson
Gadens
Griffith University
Hastings Deering
Honeycombes Property Group
Initiative Capital
Ipswich City Council
James Cook University
Law In Order
Local Government Association of Queensland
Logan City Council
Lutheran Community Care
McCullough Robertson Lawyers
Morgans
New Hope Group
NOJA Power
North Queensland Bulk Ports Corporation
Port of Brisbane
QGC
QIC
QSuper
Queensland Competition Authority
Queensland Department of Agriculture and Fisheries
Queensland Department of Energy and Water Supply
Queensland Department of Environment and Heritage Protection
Queensland Department of Infrastructure, Local Government and Planning
Queensland Department of State Development
Queensland Department of the Premier and Cabinet
Queensland Law Society
Queensland Resources Council
Queensland Treasury
Queensland Treasury Corporation
Queensland Urban Utilities

M i g r a t i o n : t h e e c o n o M i c d e b a t e
104
QUT
Robert Walters
Sarina Russo Group
Seqwater
South Burnett Regional Council
St Vincent de Paul Society
Stanwell Corporation
Suncorp Group
SunWater
Super Retail Group
TechnologyOne
The Star Entertainment Group
Toowoomba and Surat Basin Enterprise
Toowoomba Regional Council
Trade and Investment Queensland
Tri-Star Petroleum Company
UniQuest
Unitywater
University of Southern Queensland
University of the Sunshine Coast
Wiggins Island Coal Export Terminal
sA
Adelaide Airport
Adelaide Casino
Adelaide Convention Centre
AISSA
BankSA
Coopers Brewery
Executive Leadership Connection
Flinders University
Funds SA
Health Partners
InterContinental Adelaide
Investment Attraction South Australia
Life Without Barriers
NCVER
OZ Minerals
Philmac
RAA of SA
RiAus
SA Department of the Premier and Cabinet
SACE Board of SA
Shoal Engineering
South Australian Water Corporation
Statewide Superannuation Trust
TAFE SA
tAs
Aurora Energy
MyState
University of Tasmania
viC
AusNet Services
Australian Energy Council
Australian Health Policy Collaboration
Australian Red Cross
Australian Unity
Barwon Water
Benetas
Bombardier Transportation Australia
Box Hill Institute
City of Ballarat
City of Greater Geelong

M i g r a t i o n : t h e e c o n o M i c d e b a t e
105
City of Melbourne
Colin Biggers & Paisley
CSL
Data #3
Data61
Deakin University
Epworth HealthCare
ExxonMobil
Fair Work Ombudsman
Fed Square
GlaxoSmithKline
Housing Choices Australia
IAG
IFM Investors
Independent Schools Victoria
Industry Super Australia
JANA Investment Advisers
Jo Fisher Executive
La Trobe University
Life Without Barriers
Master Builders Association of Victoria
Medibank
Melbourne Water Corporation
Mercy Health and Aged Care Group
Metro Trains Melbourne
Mitchell Institute
Monash University
Newgate Communications
Parks Victoria
PGA Group
Phillip Island Nature Park
Pinnacle Group
Pitcher Partners
Plenary Group
Powershop
Programmed Group
RMIT University
Royal Automobile Club of Victoria
RPS
SED Advisory
Smarketer
Spotless
Swinburne University of Technology
The Future Fund
Toyota
Treasury Corporation of Victoria
United Energy and Multinet Gas
Victoria University
Victorian Department of Education and Training
Victorian Department of Environment, Land, Water and Planning
VicTrack
Visa
Western Water
WorkSafe Victoria
wA
ATCO
Bendigo Bank
BP Australia
Brookfield Rail
City of Joondalup
City of Perth
Clifford Chance
CommunityWest
Curtin University
Edith Cowan University

M i g r a t i o n : t h e e c o n o M i c d e b a t e
106
ExxonMobil
Georgiou Group
HopgoodGanim Lawyers
INPEX
Jackson McDonald
Main Roads, Western Australia
Murdoch University
National Energy Resources Australia
Perpetual Limited
Programmed Group
RAC of WA
Road Safety Commission
Silver Chain
South Regional TAFE
Syrinx Environmental
The Bethanie Group
The Chamber of Minerals and Energy of Western Australia
The University of Western Australia
Toro Energy
WA Department of Finance
WA Department of Mines and Petroleum
WA Department of Planning
WA Department of State Development
Wesfarmers
Western Australian Treasury Corporation
Western Power
Woodside Energy

M i g r a t i o n : t h e e c o n o M i c d e b a t e
107
Elizabeth Bryan AM
Laureate Professor Adrienne Clarke AC
Ivan Deveson AO
Professor Julian Disney AO
Laureate Professor Peter Doherty AC
Peter Duncan AO
The Hon. Martin Ferguson AM
Professor Margaret Gardner AO
The Hon. Julia Gillard
The Hon. Nick Greiner AC
Professor Sandra Harding
Dr Allan Hawke AC
The Hon. Robert Hawke AC
Dr Ken Henry AC
The Hon. John Howard AC
Graham Kraehe AO
John Langoulant AO
Catherine Livingstone AO
Professor the Hon. Stephen Martin
John Massey
Paul McClintock AO
Dr Stuart McGill
Andrew Mohl
Terry Moran AC
David Mortimer AO
Warren Mundine AO
Dr Kerry Schott AO
Dr John Schubert AO
Dr Ziggy Switkowski AO
Richard Warburton AO LVO
Peter Wills AC
CEDA board of governors

M i g r a t i o n : t h e e c o n o M i c d e b a t e
108
CEDA board of Directors
Paul Mcclintock ao National Chairman, CEDA; Chairman of NSW Ports
angus armour Principal Advisor, Business Council of Australia
dr John edwards Visiting Fellow, Lowy Institute
Patricia Faulkner ao Deputy Chair, St Vincent’s Health Australia
John Langoulant ao WA Chairman, Westpac
dr rodney Maddock Professor, Monash Business School, Monash University; Vice Chancellor’s Fellow, Victoria University; and President, Economic Society of Australia (Victorian Branch)
Professor the hon. Stephen Martin Chief Executive, CEDA
Miriam Silva Director, TAFE South Australia
dr catherine Sinclair Director, The Consultancy Bureau
diane Smith-gander Director, AGL
Stephen Spargo aM Director, Stanbury Consultants
andrew Stevens Chair, Advanced Manufacturing Growth Centre and Independent Non-Executive Director, MYOB Group
dr ian J Watt ac Chairman, BAE Systems Australia

NationalLevel 13, 440 Collins Street Melbourne VIC 3000 GPO Box 2117 Melbourne VIC 3001 Telephone 03 9662 3544 Email [email protected]
New South Wales and the ACTLevel 14 The John Hunter Building 9 Hunter Street Sydney NSW 2000 GPO Box 2100 Sydney NSW 2001 Telephone 02 9299 7022 Email [email protected]
QueenslandLevel 17, 300 Adelaide Street Brisbane QLD 4000 GPO Box 2900 Brisbane QLD 4001 Telephone 07 3229 9955 Email [email protected]
South Australia and the Northern TerritoryLevel 5 2 Ebenezer Place Adelaide SA 5000 Telephone 08 8211 7222 Email [email protected]
Victoria and TasmaniaLevel 13 440 Collins Street Melbourne VIC 3000 GPO Box 2117 Melbourne VIC 3001 Telephone 03 9662 3544 Email [email protected]
Western AustraliaLevel 5 105 St Georges Terrace Perth WA 6000 PO Box 5631 St Georges Tce Perth WA 6831 Telephone 08 9226 4799 Email [email protected]
Migration: the economic debate
November 2016
MIG
RA
TIO
N: T
HE
EC
ON
OM
IC D
EB
AT
E N
OV
EM
BE
R 2
01
6
WITH SUPPORT FROM