Embed Size (px)
Citation preview
Athens Journal of Mass Media and Communications- Volume 1, Issue 4 – Pages 275-288
https://doi.org/10.30958/ajmmc.1-4-3 doi=10.30958/ajmmc.1-4-3
Migration of Television Audience to Digital
Media: Impacts on TV Schedule and Journalism
By Valdecir Becker
Daniel Gambaro†
Aline Crisnir‡
Samara Coutinho
This article discusses the audience migration between Brazilian television and digital
media. Since 2000, Brazilian free-to-air TV audience dropped by 28%. In the same
period, Internet access increased 400%, and digital paid TV, more than 500%. The
phenomenon accentuated after 2006, when pay TV had begun to grow on average
30% per year, and the Internet, 26%. A statistical comparison between this fall of
audience with the increase of pay TV subscribers and growth of broadband Internet
access shows that there is a migration of free-to-air TV audience towards these two
media. Nowadays, one third of Brazilian population has access to pay TV and more
than half use the Internet. Through empirical investigation and statistical analysis,
this paper investigates the implications for such decrease and the motivation of
audience migration. The most important consequences are: a partial reformulation of
television schedule, programme focus and targets; transmedia productions, including
new web narratives; focus on mobile applications, with interactivity and public
participation; and new approaches on newscasts, which are becoming more informal,
focused on opinion and local news.
Keywords: audience migration, audience research, new media, television
Introduction
Brazil represents, today, a sizable part of total advertisement expenditures
worldwide, being the 6th
market according to the recent data released by Zenith
Optmedia1. Television is the major communication medium in Brazil in terms
of revenue, with 2/3 of total advertisement investment directed to TV. The
same occurs in the reach of television: Researches show that 65% of Brazilian
population watch free-to-air TV on a daily basis, spending around 3.5 hours
every day in front of the TV set (Brasil, 2014, p. 19). Free-to-air TV is also the
biggest medium in terms of penetration, present in 97% of Brazilian homes
(IBGE, 2012). There is a predominance of aired TV. Pay TV reaches a little
more than 1/3 of Brazil’s population, in spite of its more than 200% growth in
the last five years (Brasil, 2014; ANATEL, 2014). Television also performs an
Professor, Federal University of Paraiba, Brazil.
†Professor, Anhembi Morumbi University, Brazil.
‡Researcher, Federal University of Paraiba, Brazil.
Researcher, Federal University of Paraiba, Brazil.
1See: http://www.zenithoptimedia.com/.
Vol. 1, No. 4 Becker et al.: Migration of Television Audience to Digital Media...
276
even more important role in comparison to internet, since 53% of the
population does not access the web (Brasil, 2014, p. 48).
The difficulty in accessing other media has been keeping television as the
largest and the main source of information and cultural production.
Traditionally, the Brazilian population gets informed through television
(Hoineff, 2001).
As regards the total advertisement investment in Brazilian market, 66.5%
were invested in free-to-air TV in 2013, according to data released by Mídia
Dados Brasil (Grupo de Mídia São Paulo, 2014). In comparison, radio obtained
4.1%, pay TV 4.9%, and Internet 4.5%.
Nonetheless, even with such prevalence, the aired TV has been facing
constant fall in audience ratings. The number of turned-on TV sets decreases
year after year and the TV networks have lost 28% audience from year 2000 to
2013. This represents at least minus two points per year in the total audience of
the five major commercial TV networks. The principal and most traditional
shows, such as telenovelas, newscasts, and reality shows have suffered decline
in their audience. In absolute numbers, the aired TV lost the audience of 1.15
million people in the last 14 years only in the Sao Paulo Metropolitan Region.
It is important to report the most important Brazilian television market is
the city of Sao Paulo, which, by the time of the gathering of information for
this present study, had a 760-household sample sending information minute to
minute, which is considered real time audience measurement (Jauset, 2000).
TV broadcasters use this database as a guidance to construct the immediate
programming plan. Actually, due to the great economical weight and the
concentration of broadcasters and advertising agencies in the city1, all
information regarding the Brazilian TV audience is based on the measurements
held in Sao Paulo Metropolitan Region. For the same reason, this study focuses
on the analysis of data of this same region.
This paper investigates and quantifies this fall in audience ratings, showing
that there is a migration of the public to digital media, such as Internet and pay
TV. By analysing the impact of this migration, this work shows that television
begins to react to the fall in audience, with changes in the programming profile,
especially in journalism.
Methodology
Audience is defined as "the collective term for the 'receivers' in the simple
sequential model of the mass communication process" (McQuail, 1997, p. 1).
In other words, the audience comprises the readers of printed press, radio
listeners, television viewers, and users of digital communication technologies,
such as the Internet (Bermejo, 2007).
1The largest TV networks are headquartered in the city of São Paulo, where their national
network central stations are also located. The only exception is Rede Globo, whose national
network central station is located in Rio de Janeiro, but also has a station and studios in São
Paulo. Furthermore, the eight biggest advertisement agencies have head-offices in São Paulo,
thus concentrating almost the entire publicity and television markets in this town.
Athens Journal of Mass Media and Communications October 2015
277
The audience measurement results in a projection of the total number of
viewers exposed to a TV programming from a statistically defined sample. The
measurement of audience ratings reflects the total number of people or
households in the sample that actually tuned in a determined channel. The
quantity of people predominates in Brazil. According to the Ibope website,
each percentage point corresponded to 62 thousand households and 185
thousand people in Sao Paulo Metropolitan Region in 2013. The audience
rating is expressed in points. Each audience point represents one percentage
point of the sample, consequently, one percent of population.
For this study, the Brazilian TV audience ratings between years 2000 to
2013 have been analysed to obtain the above-mentioned characteristics of TV
viewership. The average monthly ratings have been calculated on the basis of
the average daily rating of each broadcaster (from 7:00 am to 12:00 pm) and
then the average annual rating. Only the viewership of TV channels with more
than one point in audience has been considered statistically relevant
(Magalhães & Lima, 2011), namely Globo, TV Record, SBT, Band e Rede TV.
In this presentation, any mention of Brazilian TV audience refers to these five
networks.
Since the 1970s decade, the leader in audience has been Rede Globo,
receiving more than 50% of the total advertising investment in television in the
country (Grupo de Mídia Sao Paulo, 2014). Globo profited 6.3 billion dollars
in 2013 and is today the largest media company in Latin America (Globo
Domination, 2014). These numbers also make Globo one of the largest TV
networks in the world, figuring amongst the Top Thirty Global Media Owners,
released by Zenith Optimedia. Rede Globo reaches 13.6% of average daily
audience.
TV Record, associated to The Universal Church (IURD) and Sistema
Brasileiro de TeleviSao (SBT), of entrepreneur and TV Host Silvio Santos,
fight for the second place in audience. TV Bandeirantes (Band) appears in 4th
place, with an average daily audience of 2.36% in 2013, followed by RedeTV,
with 1%.
As a side note, we should consider that Public and State TV networks have
statistically insignificant audiences, which generates the total predominance of
commercial TV. Considering the audience ratings, the sum of all public and
State TV networks does not reach 1%. Consequently, these channels have
minor impact on the dynamics of audience and on the programming strategies
of commercial broadcasters.
The proposed analysis neglects all other channels as their audience
together amounted to less than 1% in the ratings during the analysed period
(from 2000 to 2013). To avoid any distortion in data, those channels have been
grouped together with pay TV ratings and identified under the terminology
OCN. In a similar way, the term OPA represents other devices connected to
TV set, such as external media players, video game consoles, personal
computers, etc. Finally, the last analysed item is the total number of turned-on
television sets (TTL). This number allows generating analyses on the evolution
of television as a medium and its importance on people’s daily life. This
Vol. 1, No. 4 Becker et al.: Migration of Television Audience to Digital Media...
278
proposed methodology follows that of Ibope, a company that measures the
audience in Brazil and publishes its ratings.
Data Analysis
From the analysis of the audience data published by Ibope from 2000 to
2013, some noticeable patterns point to loss of viewership in front of the TV
set, both in percentage and in absolute values.
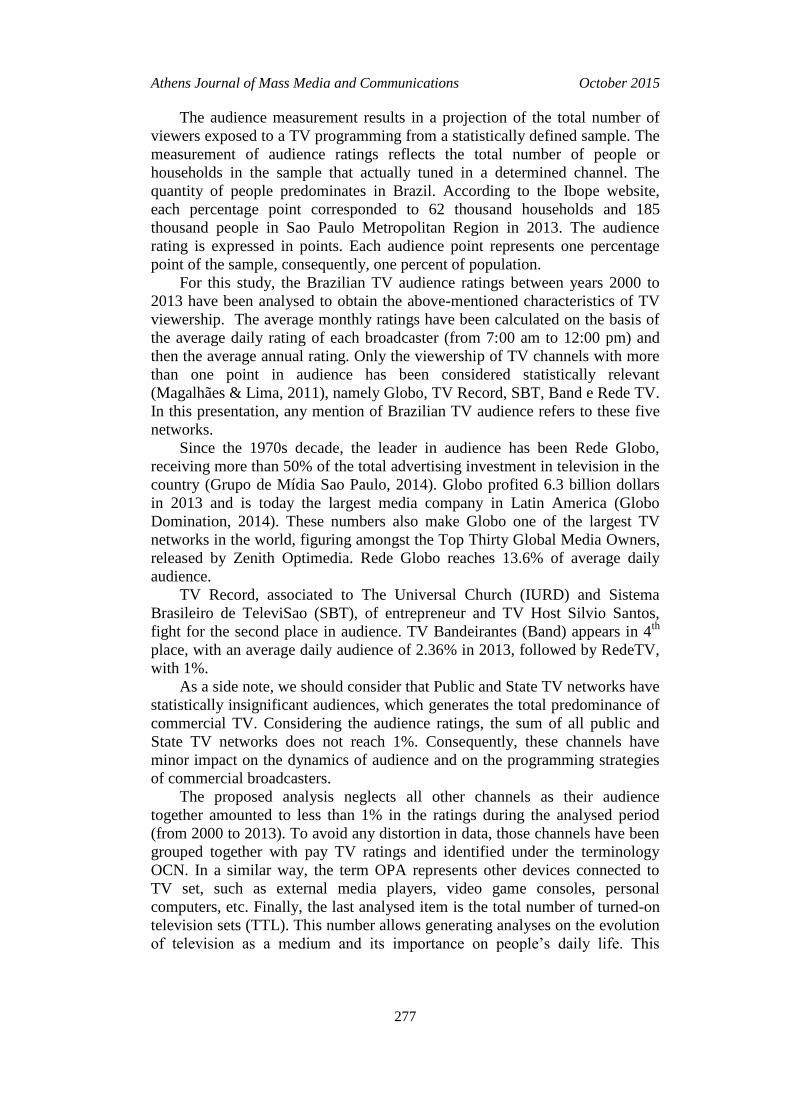
Figure 1 shows the variation in the sum of the main broadcasters’
audience. While in 2006 the five main commercial broadcasters had together
38.75% of the audience, in 2013 they had only 28.26%, representing 10.49%
loss in audience. In relative terms, 27% of the audience (more than one quarter)
stopped watching one of the five main aired channels. Considering the entire
period of analysis, from 2000 to 2013, the fall has been greater than 28%.
Figure 1. The Variation in the Sum of the Main Brazilian Broadcasters’
Audience
Source: Compilation of data acquired from Ibope.
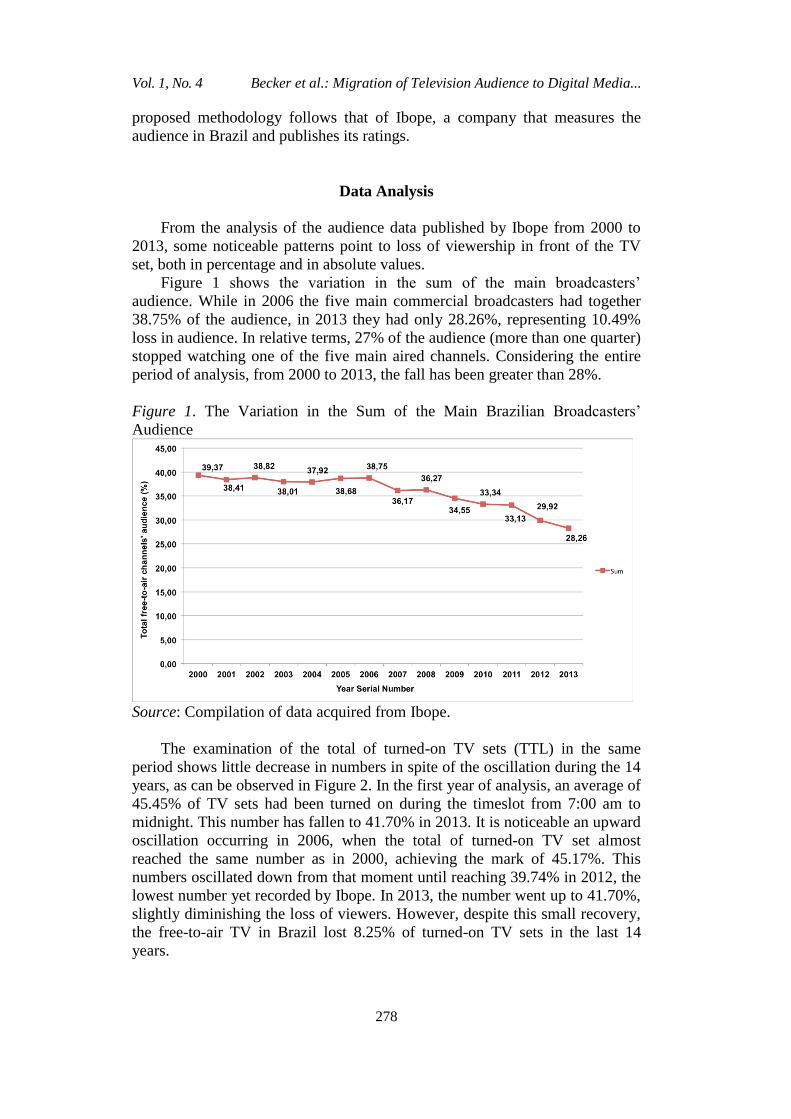
The examination of the total of turned-on TV sets (TTL) in the same
period shows little decrease in numbers in spite of the oscillation during the 14
years, as can be observed in Figure 2. In the first year of analysis, an average of
45.45% of TV sets had been turned on during the timeslot from 7:00 am to
midnight. This number has fallen to 41.70% in 2013. It is noticeable an upward
oscillation occurring in 2006, when the total of turned-on TV set almost
reached the same number as in 2000, achieving the mark of 45.17%. This
numbers oscillated down from that moment until reaching 39.74% in 2012, the
lowest number yet recorded by Ibope. In 2013, the number went up to 41.70%,
slightly diminishing the loss of viewers. However, despite this small recovery,
the free-to-air TV in Brazil lost 8.25% of turned-on TV sets in the last 14
years.
Athens Journal of Mass Media and Communications October 2015
279
Rede Globo, had obtained a growth in its audience between years 2000
and 2006, when an accentuated decay started. In the first year of the analysed
period, this broadcaster had 19.95% of the audience, number that rose to
21.41% in 2006. Still, from that year on, Rede Globo has lost on average 0.8%
each year, constantly diminishing its viewership. In 2013, the network reached
its lowest historical rating, reaching 13.60%. In other words, in seven years
Rede Globo has lost 7.81 percentage points, which corresponds to more than
1/3 of the audience (36.5%).
The audience ratings of the other broadcasters had distinct behaviours.
Band and RedeTV oscillated little, while SBT had a considerable loss in
viewership, thus losing to TV Record the second place on the TV audience
ranking that it had consolidated through the 1990’s decade. In 2000, SBT had
10.41 points, a value that declined to five points in 2013. In other words, SBT
lost half of its audience in 14 years.
Figure 2. Audience Oscillation During the 14 Years
Source: Compilation of data acquired from Ibope.
Meanwhile, Record was the only TV network that registered a rise in
audience during this period, surpassing SBT as a second place in 2006 – the
same year this the other broadcasters’ fall of the audience strengthened. From
5.48 audience points in 2000, TV Record underwent some decrease until 2004,
when the curve inverted. In the same year, The Universal Church (IURD)
increased the investments on the television channel (Castro, 2005; Mattos,
2007) aiming at making TV Record the leader in audience in Brazil in 10
Vol. 1, No. 4 Becker et al.: Migration of Television Audience to Digital Media...
280
years. The results were positive up to 2008 and the audience ratings rose, with
an average-annual rating of 8.34 points. That is, in four years the broadcaster
doubled its viewership, the fruits of an ostensive commercial campaign aligned
to the launch of new programming. Nonetheless, this growth did not sustain
itself and Record closed 2013 with 6.3% of audience; higher than the 4.2 points
in 2004, but still far from the leadership. The positive oscillation on the
analysed period, especially until 2008, shows that Record partially absorbed
the loss of audience of Globo and SBT. In the same period, SBT faced some
difficulties derived from administrative crisis of companies from entrepreneur
Silvio Santos, including the TV channel; and from constant changes in the TV
programming, which directly reflected on the audience ratings.
Figure 2 also shows the behaviour of growth of other channels (OCN). In
2000, 2.6% of turned-on TV Sets tuned in to other channels. This number
diminished to 1.78% the following year, which can be attributed to
technological changes in the measurement of OCN and pay TV. From 2002
and on, the rating for OCN has increased year after year by an average greater
than one percent since 2008. The greatest rise was verified in the last year of
the analysed period, when the number of TV sets tuned in to pay TV increased
from 5.33% to 8.5%, a growth of almost 60%.
Where Did the Audience Go?
As shown in the previous sections, the Brazilian TV audience has been
falling year after year. Nonetheless, it is necessary to investigate also the
absolute numbers on viewership that the Ibope’s measurement projects. In
absolute numbers, in 2000 every audience point corresponded to 162,465
people. In 2013, this number rose to 185,814 viewers. Thus, in 2000 the
summed audience of the five main channels corresponded to 39.37% of the
population, or 6.4 million people in Sao Paulo Metropolitan Region. In 2013,
this number fell to 28.26% of the population, representing 5.25 million people.
In other words, the audience of aired television also decreased in absolute
numbers.
What would explain this fall in the free-to-air TV audience? The present
study points out that there is no single cause to this occurrence. It is a
conjunction of factors that produces this trend. The expansion of pay TV and of
Internet access may explain this phenomenon.
The Development of Pay TV
A central element when analysing the audience of the aired television is
the pay TV, since the latter has had a nation-wide growth of more than 500%
between 2000 and 2013, the analysed period. In 2000, Brazil had 3.5 million
pay TV subscribers. After a relative stagnation during the beginning of last
decade, this number increased year after year, in a slow pace until 2007, when
it surpassed the mark of 4 million subscribers. From that point on, the growth
Athens Journal of Mass Media and Communications October 2015
281
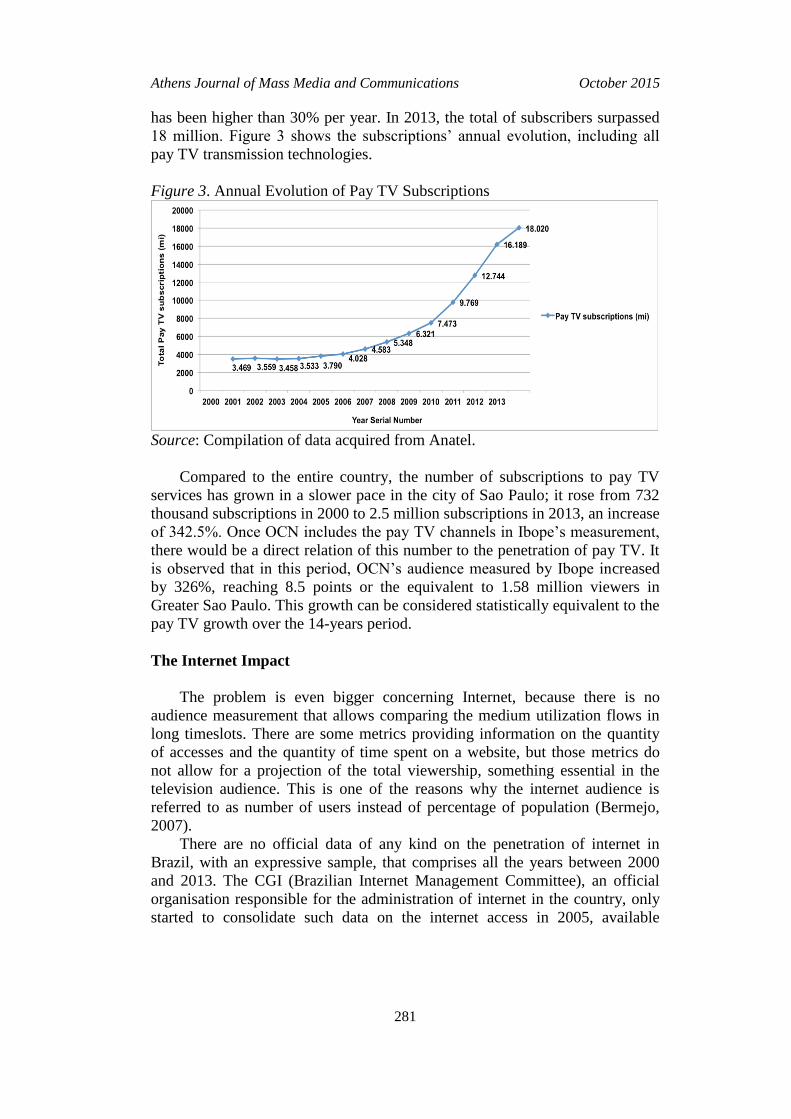
has been higher than 30% per year. In 2013, the total of subscribers surpassed
18 million. Figure 3 shows the subscriptions’ annual evolution, including all
pay TV transmission technologies.
Figure 3. Annual Evolution of Pay TV Subscriptions
Source: Compilation of data acquired from Anatel.
Compared to the entire country, the number of subscriptions to pay TV
services has grown in a slower pace in the city of Sao Paulo; it rose from 732
thousand subscriptions in 2000 to 2.5 million subscriptions in 2013, an increase
of 342.5%. Once OCN includes the pay TV channels in Ibope’s measurement,
there would be a direct relation of this number to the penetration of pay TV. It
is observed that in this period, OCN’s audience measured by Ibope increased
by 326%, reaching 8.5 points or the equivalent to 1.58 million viewers in
Greater Sao Paulo. This growth can be considered statistically equivalent to the
pay TV growth over the 14-years period.
The Internet Impact
The problem is even bigger concerning Internet, because there is no
audience measurement that allows comparing the medium utilization flows in
long timeslots. There are some metrics providing information on the quantity
of accesses and the quantity of time spent on a website, but those metrics do
not allow for a projection of the total viewership, something essential in the
television audience. This is one of the reasons why the internet audience is
referred to as number of users instead of percentage of population (Bermejo,
2007).
There are no official data of any kind on the penetration of internet in
Brazil, with an expressive sample, that comprises all the years between 2000
and 2013. The CGI (Brazilian Internet Management Committee), an official
organisation responsible for the administration of internet in the country, only
started to consolidate such data on the internet access in 2005, available
Vol. 1, No. 4 Becker et al.: Migration of Television Audience to Digital Media...
282
through its website1. In spite of this limitation, it is possible to analyse the
changes in Internet penetration during the mentioned period to verify if there is
any correlation with the television audience. The official survey is just
adequate to show the fast growth of internet in Brazil from the middle of the
past decade, both in number of accesses and in connection speed.
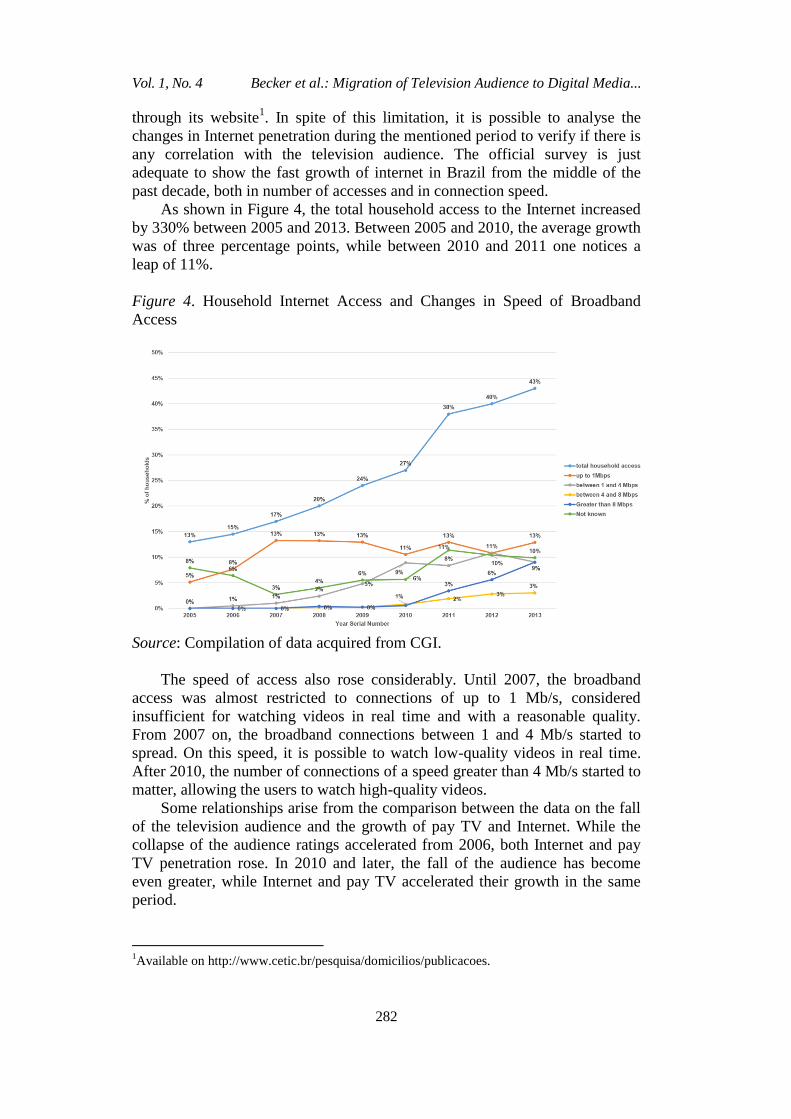
As shown in Figure 4, the total household access to the Internet increased
by 330% between 2005 and 2013. Between 2005 and 2010, the average growth
was of three percentage points, while between 2010 and 2011 one notices a
leap of 11%.
Figure 4. Household Internet Access and Changes in Speed of Broadband
Access
Source: Compilation of data acquired from CGI.
The speed of access also rose considerably. Until 2007, the broadband
access was almost restricted to connections of up to 1 Mb/s, considered
insufficient for watching videos in real time and with a reasonable quality.
From 2007 on, the broadband connections between 1 and 4 Mb/s started to
spread. On this speed, it is possible to watch low-quality videos in real time.
After 2010, the number of connections of a speed greater than 4 Mb/s started to
matter, allowing the users to watch high-quality videos.
Some relationships arise from the comparison between the data on the fall
of the television audience and the growth of pay TV and Internet. While the
collapse of the audience ratings accelerated from 2006, both Internet and pay
TV penetration rose. In 2010 and later, the fall of the audience has become
even greater, while Internet and pay TV accelerated their growth in the same
period.
1Available on http://www.cetic.br/pesquisa/domicilios/publicacoes.
Athens Journal of Mass Media and Communications October 2015
283
Studies have demonstrated that there is quantitative and qualitative
audience migration from television to Internet (Jaffer, 2008; Liebowitz &
Zentner, 2012; Becker, 2011). Shall this hypothesis be confirmed, the loss of
audience may increase over time, with continuous audience migration due to
the growth of web users and the increase in data transfer speed – still a critical
factor in Brazil. In other words, it is possible to affirm that the increase in pay
TV and Internet penetration directly affects the audience of television.
Changes in the TV Programming
One effect of audience loss on aired television is the reconfiguration of the
programming schedule. In the Brazilian case, it is noticeable the emphasis in
some genres already historically present on TV, such as hosted live shows and
factual journalism. Since 1970 decade, when the main network (TV Globo)
constructed a blocked vertical and horizontal scheduling, only few adjustments
have been made – most of that to incorporate more time on air and an audience
that sleeps later.
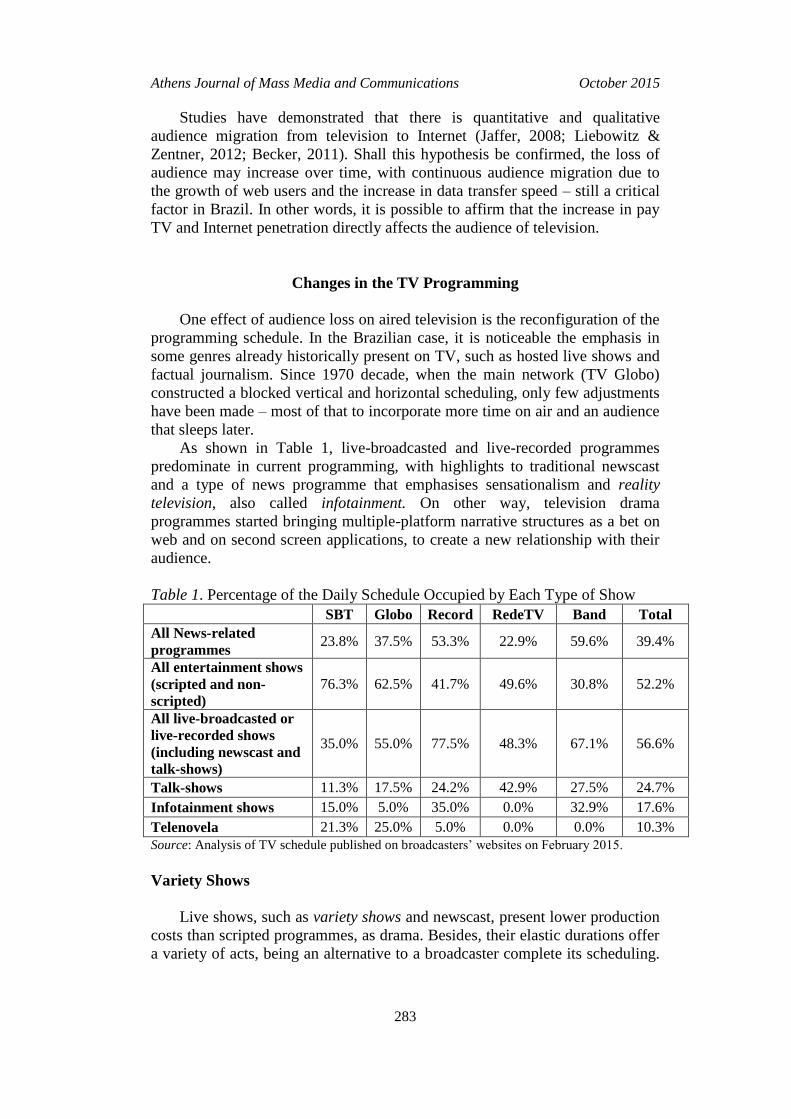
As shown in Table 1, live-broadcasted and live-recorded programmes
predominate in current programming, with highlights to traditional newscast
and a type of news programme that emphasises sensationalism and reality
television, also called infotainment. On other way, television drama
programmes started bringing multiple-platform narrative structures as a bet on
web and on second screen applications, to create a new relationship with their
audience.
Table 1. Percentage of the Daily Schedule Occupied by Each Type of Show
SBT Globo Record RedeTV Band Total
All News-related
programmes 23.8% 37.5% 53.3% 22.9% 59.6% 39.4%
All entertainment shows
(scripted and non-
scripted)
76.3% 62.5% 41.7% 49.6% 30.8% 52.2%
All live-broadcasted or
live-recorded shows
(including newscast and
talk-shows)
35.0% 55.0% 77.5% 48.3% 67.1% 56.6%
Talk-shows 11.3% 17.5% 24.2% 42.9% 27.5% 24.7%
Infotainment shows 15.0% 5.0% 35.0% 0.0% 32.9% 17.6%
Telenovela 21.3% 25.0% 5.0% 0.0% 0.0% 10.3%
Source: Analysis of TV schedule published on broadcasters’ websites on February 2015.
Variety Shows
Live shows, such as variety shows and newscast, present lower production
costs than scripted programmes, as drama. Besides, their elastic durations offer
a variety of acts, being an alternative to a broadcaster complete its scheduling.
Vol. 1, No. 4 Becker et al.: Migration of Television Audience to Digital Media...
284
Thus, along with the fact that journalism has increased its space on TV
programming, talk shows and variety entertainment shows have become a
morning phenomenon in different broadcasters (recovering a trend that was
natural in 1970 and 1980 decades). These shows can be themed (health,
culinary, etc.) or not, and its main characteristic is to be an extension of the
viewer’s living room, receiving guests to relaxed interviews.
Newscast
The newscast language, especially the one held on live, in site coverage,
feeds the viewer with a "belonging to" feeling that projects him from his actual
position – as a passive spectator – to the local of action, to become part of the
event, or to identify himself with the characters presented by television
(Fechine, 2006). The dramatization of the news creates a contact effect in
which the representation of the world becomes the own world for the viewer, a
ubiquity effect that authenticates the event through a sentiment similar to
voyeurism (Chareaudeau, 2010). The information credibility is one important
value attributed to the newscast to attract and maintain the audience fidelity.
Philo (1990) states that belief in a dominant media frame is highest among
those who are most dependent on the communication media.
It is worth to point out even a change in the reference for information
quality, since with the dissemination of internet and the easy access to other
sources, newscast are becoming in one more medium, risking losing the leading
position. To summarize, three are the characteristics of current journalism on
TV.
More sensationalism. During the last few years, conservative newscasts
opened more space to local news coverage, filled with everyday life events of
little journalistic relevance, but of great image impact. Morning and lunchtime
newscasts present longer reportages with complex narrative structure, similar
to fiction. Moreover, teletabloid proliferates throughout the entire schedule,
emphasising crime and violence, the curious news and celebrities’ life,
generally in a polemic-style coverage. Such approach to news coverage is only
lesser in prime time, when the need for a more broad coverage of subjects,
from quotidian facts to economics and worldwide news, makes the dramatic
narrative less evident, but still present.
More intimacy. Information credibility grows with the notoriety of the
agent of information, which Chareaudeau (2010) calls "right to speak". Thus,
free-to-air TV creates idols through the status the journalist obtain as a
legitimate fact mediator, turning him into the connexion between everyday life
and spectator. Today’s news programming has more discourse, manifestation
and voice of the anchors. In evening newscasts, the presenters bring opinions
and editorials (sometimes so polemic that they become "viral" on the internet),
and the news annunciation receives loads of colloquialism. In morning and
daytime newscasts, the presenters literally invite the viewer to "fell at home to
an intimate chat with them".
Athens Journal of Mass Media and Communications October 2015
285
Increasing time of journalism during daily programming. Recently a
research showed that the informative radio programming during the morning
has twice the audience of television (Castro, 2014). The importance given to
television outside the prime time is almost irrelevant, while the public
considers Internet a more important way to media consumption during the
morning and the afternoon (Grupo de Mídia Sao Paulo, 2014). TV is then
forced to seek a differentiated programming. During the last decade, stations
with an average audience (Record and Band) have been investing in a type of
newsmagazine that mixes factual news, tabloid format and variety
entertainment. The style, adapted from the American morning shows, values
the image and sensationalism – examples to the infotainment shows depicted
on Table 1.
Other Screens
Only recently Brazilian broadcasters have shown consistent initiatives to
occupy the digital world in complement to their TV scheduling. Nonetheless,
there were restrained actions until 2010, consisting mainly of webpages to
some shows, blogs to special fictional series, and the distribution of excerpts of
programmes online. For example, only in 2012 TV Globo reinforced
investments in internet-based platforms (Cimino, 2012). In other words, for a
long time digital media were treated as a menu to the broadcasted
programming.
There is not an accurate measurement of the video audience on the web,
but according to CGI (Brazilian Internet Committee), 56% of Internet users
usually watched video online in 2013. Besides the loss of audience, this can be
a reason to broadcasters to invest in Internet content. Narrative complements
and transmedia extensions is becoming part of the productions quotidian.
At the same time, the channels’ webpages were transformed into assorted
portals. Again, TV Globo shows the initiative of having a website do the TV
broadcaster, with the programmes schedule, some news, etc.
(http://redeglobo.globo.com); a video portal (http://globotv.globo.com),
presenting excerpts of and full-length aired programmes, closed to subscribers;
and an entertainment portal with special content, focused on web audience with
web series and exclusive written news (http://gshow.globo.com).
Second screen applications have become more common and diverse: the
broadcasters have a generic one, that allows to synchronically comment and
share virtually any show on air; and there is the development of those
dedicated to one programme, such as reality shows, aiming at a more
instantaneous interaction. However, the content available to drama shows are
still rare, different from what we may observe in other countries.
One main reason supporting these new interactive interfaces may be the
maintenance of the younger viewership. Television has less penetration in this
parcel of the population, in opposition to Internet (Brasil, 2014). Thus, TV
channels continue to operate their strategy of connection and credibility toward
the youngsters, but acting in a different approach from that of sensationalism in
Vol. 1, No. 4 Becker et al.: Migration of Television Audience to Digital Media...
286
journalism. In this case, the notion of identification with the audience is
established through web interaction and participation.
Conclusions
Studies worldwide investigate the relation between the value a person
gives to information and the credibility arisen from the news. Bird (1992),
Liebes (1997) and Kitzinger (1993), among others, have pointed that the news
perception and given importance varies according to beliefs and personal likes.
Morley (1980) concluded that social class and locality affect the value of
perception of the news. Moreover, Philo (1990) and Madianou (2007) point
that the existence of alternative information sources, and the grade of exposure
to and dependence of a determined medium also affects the fruition of the
news.
Although conducted in different countries and periods, all those studies
indicate that the more options to access the news, the lesser is the possibility of
one single medium to dominate attention and credibility. Digital technologies
and the audience’s connection through internet accentuates the changes in
perceiving the information value. If some time ago television had the
monopoly of information and news production and transmission, with
quantitative impacts on audience ratings, today it competes with online media,
of instant access, although such services still limited to one part of the
population.
The loss of value as an audio-visual product reflects another important
debate to journalism: the loss of credibility. Madianou (2007) shows that when
people know something on the subject of the News, the perception and
interpretation changes. That is, the personal experience again interferes in
reception.
There is an intensifying change on what audience considers a "qualified
information". Despite the increase in resolution and quality of the image
brought by technological evolution, newscasts face growing difficulties in
"showing the reality" and need to seek alternative forms to create and maintain
proximity and familiarity bonds to the audience, thus supporting the viewership
loyalty.
We showed in this study that the journalism on TV is getting closer to the
infotainment genre, in different degrees according to the programme format
and to the time of exhibition, but always supported by the sensationalist news
and the transformation of the news presenter in a kind of entertainment host.
The main objective for such strategy is to speak to an audience composed of
lower-income people, whose gained importance to the publicity market from
1990 decade, along with those that usually access information through other
media. The appeal of image associated to live, real-time coverage is one great
differential to television, feeding the audience with a sentiment of presence and
participation among others (Fechine, 2006).
Athens Journal of Mass Media and Communications October 2015
287
Moreover, news and live variety shows are an economically viable
alternative in the morning. For many years, this period was dedicated almost
exclusively to children’s programming, both education-oriented or not. Since
the beginning of the last decade, however, the time dedicated to this genre is
shrinking when we consider the entire Brazilian TV scheduling. The last great
novelty was the inclusion of one more morning newscast in TV Globo. Now
there are about four consecutive hours of journalism with regional and national
programmes, eliminating the children programmes from Monday-to-Friday
scheduling.
This turn to informative shows appears to be the natural transition to a TV
model that tries to reach an audience that seeks information in the morning,
disputing with other media and, at the same time, aiming for a low-cost
programming (these new programmes include analysis and interviews, which
occupy a great time in the scheduling). If, on one site, the educative function
television should have is lost, on the other the broadcasters develop a kind of
programme that reinforces bonds, identification and credibility to the public.
Nevertheless, one question still stands: will those changes be enough to
reverse the audience falling? A previous study (Becker, Gambaro, Lemos,
2015) revealed that the audience loss verified since year 2000 should
accentuate during the next years, and the reason is the multiplication of means
to access information through different media. Although such fading of free-to-
air TV viewership has not yet resulted in a significant economic impact to the
broadcasters, those companies are losing their reach and influence as the main
information source, to a level that seems more compatible to the present
moment. Nonetheless, this could mean the loss of revenues to broadcasters in a
near future. Thus, the strategies now adopted seem to be too cautious to face
the business model’s reconfiguration that is just happening. Those short-term
strategic solutions still require some development to make possible the
broadcasters do better comprehend and attend a viewership divided in multiple
platforms.
References
ANATEL-Agência Nac. Telecomunicações. (2014). Anatel dados [Anatel Data].
Retrieved from http://bit.ly/1GdqGRw
Becker, V. (2011). Ambiente de medição da audiência para TV digital [Audience
measurement environment for digital TV] (Doctoral dissertation). Escola
Politécnica, Universidade de Sao Paulo, Brazil. Retrieved from
http://bit.ly/1F9N2AL
Becker, V., Gambaro, D., Lemos, G. (2015). O impacto das mídias digitais na
televisão brasileira: queda da audiência e aumento do faturamento [The impact of
digital media on Brazilian TV: Fall audience and revenue growth].
Bermejo, F. (2007). The Internet Audience: Constitution & Measurement. New York,
NY: Peter Lang.
Bird, E. S. (1992). For Inquiring Minds: A Cultural Study of Supermarket Tabloids.
Knoxville: University of Tennessee Press.
Vol. 1, No. 4 Becker et al.: Migration of Television Audience to Digital Media...
288
Brasil-Presid ncia da ep blica. Secretaria de Comunica o Social. 2014 .
brasileira [Brazilian Media research 2014: Media consumption habits by the
Brazilian population]. Brazil, BR: Secom.
Castro, D. (2005, December 6). Record cresce 20%, mas está longe do SBT. [Record
grows 20%, but is far from SBT.]. Retrieved from http://bit.ly/1cYMjMg
Castro, D. (2014). De manhã, rádio tem o dobro da audiência da TV aberta em SP.
[In the morning, radio has twice the audience of free-to-air television in SP].
Retrieved from http://bit.ly/1F9N6AB
Cimino, J. (2012). "Globo não é apenas uma rede de TV", diz diretor-geral; emissora
terá plataforma de celular. ["Globo is not just a TV network", says director-
general; station will have mobile platform]. Retrieved from http://bit.ly/1J4hQZr
Charaudeau, P. (2010). Discurso das Mídias [The media discourse]. Sao Paulo, BR:
Contexto.
Fechine, Y. (2006). Tendências, uso e efeitos da transmissão direta no telejornal
[Trends, use and effects of direct transmission on the news]. In E. B. Duarte & M.
L. D. Castro (Eds.), Televisão, entre o mercado e a academia [Television,
between the market and the academy]. Porto Alegre, BR: Sulina.
Globo Domination. (2014, June 7). The Economist. Retrieved from
http://econ.st/1hsxYZU
Grupo de Mídia São Paulo. (2014). Mídia Dados Brasil 2014 [Media Data Brazil
2014]. São Paulo, BR.: Grupo de Mídia
Hoineff, N. (2001). A nova televisão [The new television]. Rio de Janeiro, BR: Relume
Dumará.
IBGE-Instituto Brasileiro de Geografia e Estatística. (2012). Pesquisa nacional por
amostra de domicílios [National survey by sample households]. 32. Rio de
Janeiro, BR: IBGE. Retrieved from http://bit.ly/1FWQB48
Jaffe, J. (2008). O Declínio da Mídia de Massa: Por que os comerciais de TV de 30
segundos estão com os dias contados? [Life After the 30-Second Spot: Energize
Your Brand With a Bold Mix of Alternatives to Traditional Advertising] Sao
Paulo: Mbooks.
Kitzinger, J. (1993). Understanding AIDS: Researching audience perceptions of the
acquired immune deficiency syndrome. In J. Eldridge (Eds.), Getting the
message: News, truth and power (pp. 271–304). London: Routledge.
Liebes, T. (1997). Reporting the Israeli-Arab conflict: How hegemony works. London:
Routledge.
Liebowitz, S. J., Zentner, A. (2012). Clash of the titans: does internet use reduce
television viewing?. The Review of Economics and Statistics, 94(1): 234–245.
Madianou, M. (2007). Shifting identities: banal nationalism and cultural intimacy in
Greek television news and everyday life. In R. Mole (Eds.), Discursive
constructions of identity in European politics (pp. 95–118). London: Palgrave.
Mattos, L. (2007, March 18). O céu é o limite. Folha de São Paulo [The sky is the
limit]. Retrieved from http://bit.ly/1GCvp1X
agalh es, . N., ima, A. C. P. (2011).
[Probability and statistical notions . S o Paulo, B : dusp.
McQuail, D. (1997). Audience Analysis. London, UK: Sage Publications.
Morley, D. (1980). The Nationwide audience: Structure and decoding. Television
monograph. London: BFI.
Philo, G. (1990). Seeing and believing: The influence of television. London:
Routledge.