Embed Size (px)
Citation preview

Migration in Focus: An Analysis of Recent Permanent Migration Census Data
Occasional Paper 1 (2015)

The Migration Council Australia would like to acknowledge the Australian Bureau of Statistics for their assistance and the provision of "Microdata: The Australian Census and Migrants Integrated Dataset". The analysis in this report was undertaken by Yichao Sun and Henry Sherrell. The Migration Council is an independent, non-profit organisation. This report is covered by Creative Commons licence 3.0 — Attribution-NonCommercial (CC BY-NC). This licence allows users to distribute, remix and build upon a work, and create Derivative Works — but only if it is for non–commercial purposes — provided they credit the Migration Council Australia and where relevant, the Australian Bureau of Statistics.

Migration in Focus: An Analysis of Recent Permanent Migration Census Data
Occasional Paper 1 (2015)
Executive Summary 03
Section 1: Australian Migration Trends 05
Section 2: A Statistical Snapshot of Permanent Migrants in Australia 08English language 08
Employment 08
Education 09
Location of visa grant 10
Age 12
Section 3: Comparing ACMID and the Past 13Migrant earnings 13
Gender 16
A skills mismatch? 19
Employment 20
Conclusion 24
References 25
CONTENTS

Tables and Figures Table 1: Change in permanent residency visas over time 06
Table 2: The percentage of skilled migrant visas granted in or outside of Australia 11
Table 3: Previous research on the earnings gap for migrants not proficient in the dominant language 13
Table 4: Labour market outcomes for various migrants 16
Table 5: Percentage of males for various migration categories 17
Table 6: Participation rate by English language 17
Table 7: Difference in participation rates for males and females 18
Table 8: Occupational representation of new permanent migrants compared to the general population 18
Table 9: Occupational skill level for skilled independent migrants by education level 19
Table 10: The difference in participation and unemployment between various migrant populations 21
Table 11: Change over time in labour market outcomes 23
Figure 1: The percentage of permanent migrants with poor English proficiency 09
Figure 2: Level of education by migration stream 10
Figure 3: Earnings over $1,500 per week by migration stream and education 10
Figure 4: Earnings over $1,500 per week by migration stream, location and English proficiency 11
Figure 5: Age profile of skilled migrants 12
Figure 6: Age profile of family migrants 12
Figure 7: Earnings over $1,500 per week by arrival period and English proficiency 14
Figure 8: Earnings between $1000–$1,499 by arrival period and English proficiency 14
Figure 9: Proportional difference between male and female earnings over $1,500 per week 16


The proportion of Australians born overseas is now at the highest point in 120 years.
Approximately 6.6 million people, or 28 per cent of our population is comprised of migrants. Indeed, since 20052006, migration has been the main driver of Australia’s population growth, contributing approximately 60 per cent to total growth. Migration is a significant player in our future national story and a critical factor underwriting our economic prospects.
This paper analyses the latest statistical information to gain an in-depth picture of how our migration program is performing. It provides an overview of the demographic and socioeconomic characteristics of recent Australian immigrants and asks how our new arrivals are fairing in the labour market.
The analysis in this paper is based on newly released data from the Australia Bureau of Statistics (ABS), namely the Australian Census and Migrants Integrated Dataset (ACMID). This new dataset allows for a detailed examination of recent permanent migrants by visa type and enables a comparison between two distinct periods of migration policy in Australia.
Using this data, we are able to profile changes in migration policy and evaluate their success in terms of key markers in the settlement process, such as employment, language skills and income earned. Further, detailed analyses around gender and skills recognition are also undertaken.
The success of migration rests on two policy levers — visa policy and settlement programs. Visa policy enables government not only to set numbers, but to adjust and regulate the characteristics of migrants coming to Australia. Settlement programs are a post arrival service that aims to assist new migrants to seamlessly integrate into a new job market, a new culture and often a new language environment. The two should work hand in hand to ensure Australia maximises the benefits of our migration programs.
Using the evidence base provided by ACMID data, we evaluate the nexus between visa policy and settlement to determine both the gains and gaps in our migration framework. This paper is presented in three parts. The first section provides a brief contextual overview of changes in the migration program and the connection between economic structural changes and visa policy. The second section provides snapshot analysis of the performance of migration streams (skilled, family and humanitarian) with respect to the key settlement markers. The third section offers a detailed analysis comparing recent permanent migrants with older permanent migrants and the general population. This section outlines some of structural, environmental and policy shifts on migration outcomes as they pertain to gender, earnings, skills recognition and employment.
EXECUTIVE SUMMARY03
Mig
ratio
n in
Foc
us

Over the past two decades the Australian economy has undergone significant structural changes. We have moved to decentralise monetary policy and deregulate key industries, shifted away from manufacturing and towards higher skilled service industries and diversified our trade and investment linkages, opening up to the global economy. For the most part, migration policy has been ahead of our economic trajectory, enabling structural changes to unfold relatively seamlessly and supplying the human capital needed for the expansion of technology driven sectors.
As our economy began to shift away from manufacturing, migration policy swung sharply toward the delivery of high skilled workers needed to build a burgeoning service hub. By the mid-90s skilled migration had reached 47 per cent of our intake and by 2013–14 it was edging toward 70 per cent of total permanent arrivals. Moreover, the creation of temporary migration came as our growth sectors shifted to industries built on defined investment projects and demand responsive global delivery chains.
All the while, migration has been a key player in the race to improve our productivity and to shorten the investment cycle. The move to introduce temporary migration not only decentralised control over the selection of migrants and improved skills matching, it reduced the lag time on skills shifts in the economy and enabled industrial technical change.
Yet temporary migration should not be seen as an isolated stream. It is part of the overall migration framework and has reshaped and driven our permanent skilled programs. As Table 1 outlines, in 1996–1997 only 22.5 per cent of visas were granted onshore. By 2013–14, the share of permanent migrants already living and working in Australia was over half.
Unlike our significant economic reforms — the floating of the dollar, the abolition of tariffs — Australian migration policy has been remade without fanfare. Today, Australian governments can manage migration but they cannot control it like they once did. This has plugged Australia into a global framework.
SECTION 1: Australian Migration Trends
05
Mig
ratio
n in
Foc
us
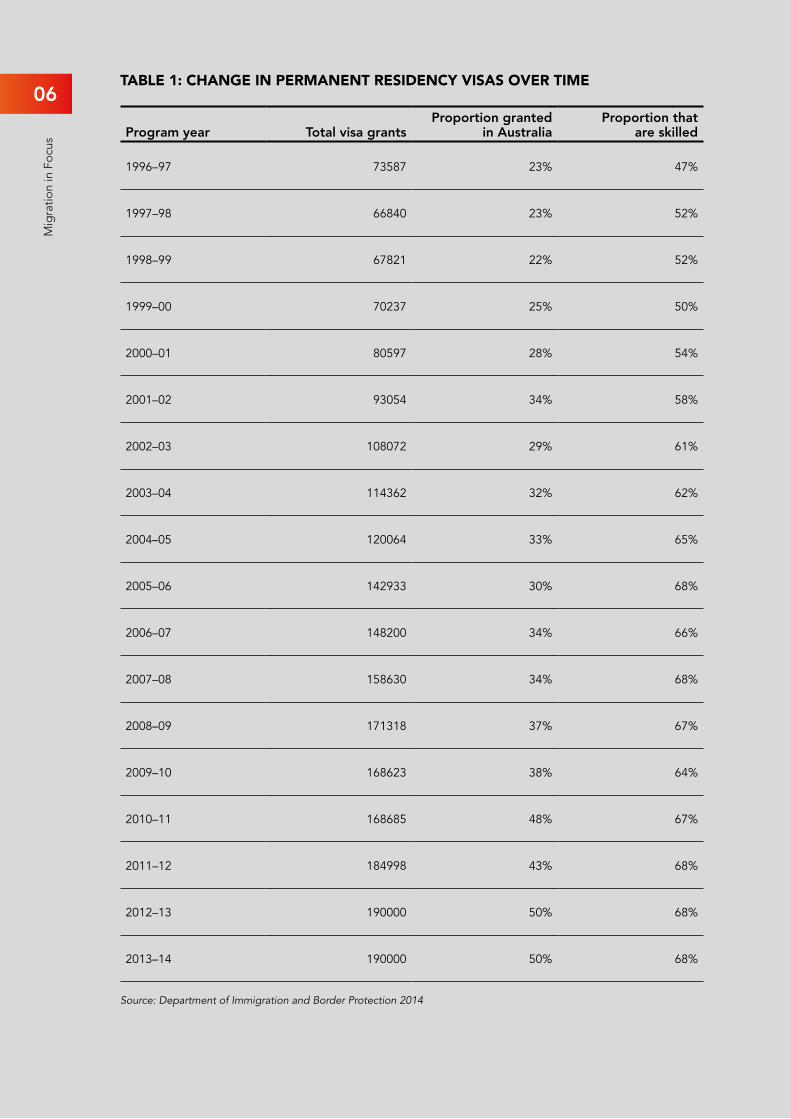
TABLE 1: CHANGE IN PERMANENT RESIDENCY VISAS OVER TIME
Program year Total visa grantsProportion granted
in AustraliaProportion that
are skilled
1996–97 73587 23% 47%
1997–98 66840 23% 52%
1998–99 67821 22% 52%
1999–00 70237 25% 50%
2000–01 80597 28% 54%
2001–02 93054 34% 58%
2002–03 108072 29% 61%
2003–04 114362 32% 62%
2004–05 120064 33% 65%
2005–06 142933 30% 68%
2006–07 148200 34% 66%
2007–08 158630 34% 68%
2008–09 171318 37% 67%
2009–10 168623 38% 64%
2010–11 168685 48% 67%
2011–12 184998 43% 68%
2012–13 190000 50% 68%
2013–14 190000 50% 68%
Source: Department of Immigration and Border Protection 2014
06
Mig
ratio
n in
Foc
us
Before this transition, the government would pick a number and determine the type of migrants allowed to Australia each year. The economic environment, particularly the rate of unemployment, would shape these decisions but they were not fundamental as evidenced by Calwell’s “populate or perish” — driven by a security rationale — or Fraser’s acceptance of refugees, embedded in a humanitarian framework. In essence, the underlying institution of migration to Australia was fully controlled by the government of the day.
This process is now in the past. Australia’s migration framework has transformed. As Table 1 outlines, there have been three major changes between 1996–97 and 2013–14: The size of the permanent migration program has grown strongly; the proportion of migrants already living in Australia when receiving their permanent visa has more than doubled; and, the prioritisation of skilled migrants has continued to grow.
The dominant factors behind all three changes are the confluence of economic growth and temporary migration.
The bipartisan support for various categories of temporary migrants — international students, temporary graduates, 457 visa holders and working holiday makers — has created a migration framework very different to those of Australia’s past. The cumulative effect of these major policy changes is that non-government actors now primarily determine the number of new migrants. Governments remain an important actor by managing a regulatory framework yet, unlike in the past, governments are not the sole actor determining migration.
In addition to temporary migrants, skilled migration was an important government policy shift. Skilled migration increased in total numbers and as a share of the migration program as a whole under the Howard government. These trends were maintained under the Rudd-Gillard governments. Combined, temporary migration and skilled migration generated a policy environment where new permanent migrants are very different in the 21st century to those of the late 20th century.
The ACMID provides a unique opportunity to further analyse this structural shift in Australia’s migration framework. While the dataset only looks at permanent migrants, careful analysis can demonstrate how past regulatory shifts have driven a change in the very essence of Australian migration. Further, while changes in migration have helped facilitate our economic transformation, there have been policy glitches and unintended consequences that have reduced the benefit of migration. A careful look at the outcomes of permanent arrivals can show the flow on effects of regulatory issues in other streams, such as student visas and support for dependent visas.!
1 Dependent migrants are the spouses and children of primary visa holders. This is an important distinction as only primary visa holders are assessed against migration regulations designed to improve economic outcomes.
07
Mig
ratio
n in
Foc
us

SECTION 2: A Statistical Snapshot of Permanent Migrants in Australia
This section will provide a high level summary of the ACMID survey.
Some of the information below is drawn from a previous publication, authored by the Department of Immigration and Border Protection. The Migration Council thanks both the Department and the Australian Bureau of Statistics for creating and distributing the ACMID survey, enabling timely research on Australia’s migration policies.
English language
English language proficiency is the primary determinant for migrants in the labour market, more important than both work experience and formal qualifications. Figure 1 shows a breakdown of language proficiency by visa stream. As would be anticipated, few skilled visa holders have low level or no English proficiency (6 per cent) compared to Family (19 per cent) and Humanitarian migrants (33 per cent)."
Importantly, the percentage of permanent migrants with poor English language proficiency declines over time periods.
Often overlooked, Figure 1 demonstrates that an important part of learning English is simply being increasingly exposed to English. The reiteration of this for new permanent migrants highlights why policy makers must be conscious in expanding the opportunities for non-native English speakers.
2 English proficiency in the Census is ‘self-assessed’ and therefore likely subject to a degree of measurement error given there is no standard definition.
Current opportunities — such as the Adult Migrant English Program — have served Australia well in the past yet policy settings must remain current and suitable to the labour market environment of the time.
Permanent migrants have made the decision to live in Australia for the long term and improving English language proficiency is the single most effective method to increase the economic benefit of migration to Australia.
Employment
Permanent migrants receiving their visa after 2000 show varying levels of employment compared to the labour market average.
The unemployment rate for skilled primary visa holders was 3 per cent, well below 5.6 per cent, the Australian average at the time of the Census. However the dependents of skilled visa holders have a substantially higher rate of unemployment at 12 per cent. Family migrants and humanitarian migrants show higher rates of unemployment, 9 per cent and 16 per cent respectively, than the labour market average (Smith and Smith 2014).
Despite higher unemployment rates, participation rates for both the dependents of skilled visa holders (71 per cent) and family migrants (61 per cent) are equal to or above the labour market. Age is a factor here, as many of these migrants arrive in prime working years.

This shows a desire to work in line with labour market norms and may indicate evidence of structural barriers to employment for dependents and family migrants.
There are also important inter-category differences. Employer sponsored and points-tested skilled migrants have different employment outcomes. Family migrants are partners and parents. Humanitarian migrants are both those resettled through the UNHCR and those seeking asylum direct to Australia.
Many of these findings confirm previous research on labour market outcomes for migrants and also expectations of governments. The shift to skilled migration occurred primarily to boost the economic outcome for Australians. These labour market outcomes are explored more in the following section.
Education
The education of permanent migrants who arrived after 2000 is on average substantially higher than Australia’s general population. This occurs as Australia’s migration framework rewards formal qualifications.
0% 10% 20% 30% 40% 50% 60%
Dependent
Primary
Dependent
Primary
Dependent
Primary
Skill
edFa
mily
Hum
anita
rian
1-5 years since arrival 6-10 years since arrival
Bachelor Degree Advanced Diploma or Diploma CertificatePostgraduate Qualification
0%
20%
40%
60%
80%
100%
Skill (Primary) Skill(Dependent)
Family (Primary) Humanitarian(Primary)
GeneralPopulation
0%
5%
10%
15%
20%
25%
30%
35%
40%
45%
Postgraduate Qualification
Bachelor DegreeAdvanced Diplomaor Diploma
CertificateNo Post SchoolQualification
Humanitarian (Primary)Family (Primary) Skill (Dependent)Skill (Primary) General Population
0%
20%
40%
60%
80%
English (Onshore) English (Offshore) Non-English(Onshore)
Non-English(Offshore)
Skilled - Independent
Skilled - Family or Government Sponsored
Family - Partner
Skilled - Employer Sponsored
0-4 5-9 10-14 15-19 20-24 25-29 30-34 35-39 40-44 45-49 50-54 55-59 60-64 65-69 70+0%
5%
15%
25%
35%
Primary (onshore) Primary (offshore) Dependent (onshore) Dependent (offshore)
Years
0-4 5-9 10-14 15-19 20-24 25-29 30-34 35-39 40-44 45-49 50-54 55-59 60-64 65-69 70+0%
5%
10%
20%
25%
30%
Years
15%
45-49 years
35-39 years
30-34 years
25-29 years
40-44 years
Pre-2000 migrantsEnglish proficieny: Native
Pre-2000 migrantsEnglish proficieny: Very Well
Post-2000 migrants English proficieny: Native
Post-2000 migrants English proficieny: Very Well
15-19 20-24 25-29 30-34 35-39 40-44 45-49 50-54 55-59 60-640%
5%
10%
20%
25%
30%
Pre-2000 permanent migrants Post-2000 permanent migrants Australian born
Years
15%
Primary (onshore) Primary (offshore) Dependent (onshore) Dependent (offshore)
50-54 years
20%10% 30% 40%0%20%30%40% 10%
45-49 years
35-39 years
30-34 years
25-29 years
40-44 years
Pre-2000 migrantsEnglish proficieny: Very Well
Pre-2000 migrantsEnglish proficieny: Well
Post-2000 migrants English proficieny: Very Well
Post-2000 migrants English proficieny: Well
50-54 years
20%10% 30% 40%0%20%30%40% 10%
Source: David Smith and Therese Smith, Department of Immigration and Border Protection, “Using Linking to Sharpen Policy-Thinking: Early Findings from the Australian Census and Migrants Integrated Database”, Australian Economic Review, 47(2), 2014, hereafter ‘Smith and Smith’
FIGURE 1: THE PERCENTAGE OF PERMANENT MIGRANTS WITH POOR ENGLISH PROFICIENCY
For skilled primary permanent migrants, levels of postgraduate and bachelor qualifications are 23 and 17 percentage points higher than for Australia’s general population. Figure 2 highlights the varying levels of education for different visa subclasses.
However unlike qualifications for the general population, education for migrants does not generate similar employment and income gains.
Figure 3 outlines how increased education can produce some earnings benefit yet new permanent migrants are not rewarded to the same extent as the general population. This shows other factors — such as English proficiency and work experience — typically have a stronger effect on earnings than education. This also may indicate a level of discrimination in the labour market and difficulties in relation to skills recognition.
Smith and Smith show that for permanent migrants arriving in Australia between 2000 and 2011, higher levels of education do not result in the same level of income increases compared to the general population. While primary skilled migrants show very positive returns for income, both the dependents of skilled migrants and family migrants earn considerably less than Australian’s with comparable education.
09
Mig
ratio
n in
Foc
us

FIGURE 2: LEVEL OF EDUCATION BY MIGRATION STREAM
Source: Smith and Smith
0% 10% 20% 30% 40% 50% 60%
Dependent
Primary
Dependent
Primary
Dependent
Primary
Skill
edFa
mily
Hum
anita
rian
1-5 years since arrival 6-10 years since arrival
Bachelor Degree Advanced Diploma or Diploma CertificatePostgraduate Qualification
0%
20%
40%
60%
80%
100%
Skill (Primary) Skill(Dependent)
Family (Primary) Humanitarian(Primary)
GeneralPopulation
0%
5%
10%
15%
20%
25%
30%
35%
40%
45%
Postgraduate Qualification
Bachelor DegreeAdvanced Diplomaor Diploma
CertificateNo Post SchoolQualification
Humanitarian (Primary)Family (Primary) Skill (Dependent)Skill (Primary) General Population
0%
20%
40%
60%
80%
English (Onshore) English (Offshore) Non-English(Onshore)
Non-English(Offshore)
Skilled - Independent
Skilled - Family or Government Sponsored
Family - Partner
Skilled - Employer Sponsored
0-4 5-9 10-14 15-19 20-24 25-29 30-34 35-39 40-44 45-49 50-54 55-59 60-64 65-69 70+0%
5%
15%
25%
35%
Primary (onshore) Primary (offshore) Dependent (onshore) Dependent (offshore)
Years
0-4 5-9 10-14 15-19 20-24 25-29 30-34 35-39 40-44 45-49 50-54 55-59 60-64 65-69 70+0%
5%
10%
20%
25%
30%
Years
15%
45-49 years
35-39 years
30-34 years
25-29 years
40-44 years
Pre-2000 migrantsEnglish proficieny: Native
Pre-2000 migrantsEnglish proficieny: Very Well
Post-2000 migrants English proficieny: Native
Post-2000 migrants English proficieny: Very Well
15-19 20-24 25-29 30-34 35-39 40-44 45-49 50-54 55-59 60-640%
5%
10%
20%
25%
30%
Pre-2000 permanent migrants Post-2000 permanent migrants Australian born
Years
15%
Primary (onshore) Primary (offshore) Dependent (onshore) Dependent (offshore)
50-54 years
20%10% 30% 40%0%20%30%40% 10%
45-49 years
35-39 years
30-34 years
25-29 years
40-44 years
Pre-2000 migrantsEnglish proficieny: Very Well
Pre-2000 migrantsEnglish proficieny: Well
Post-2000 migrants English proficieny: Very Well
Post-2000 migrants English proficieny: Well
50-54 years
20%10% 30% 40%0%20%30%40% 10%
FIGURE 3: EARNINGS OVER $1,500 PER WEEK BY MIGRATION STREAM AND EDUCATION
Source: Smith and Smith
Location of visa grant
Whether a visa is granted in or outside of Australia has no effect on the regulations governing the visa — the conditions and eligibility criteria are the same. However this characteristic has become an important part in understanding labour market outcomes of new permanent migrants.
Table 2 shows the percentage of visas granted either in Australia (onshore) or outside of Australia (offshore) and whether those permanent migrants are from an English or non-English speaking background.
98 per cent of primary skilled independent visas granted to migrants already in Australia are from non-English speaking backgrounds. In comparison, 68 per cent of visas granted to migrants who were outside of Australia were non-English speaking.
10
Mig
ratio
n in
Foc
us

TABLE 2: THE PERCENTAGE OF SKILLED MIGRANT VISAS GRANTED IN OR OUTSIDE OF AUSTRALIA
Onshore OffshoreEnglish-
speakingNon-English
speakingEnglish-
speakingNon-English
speaking
Employer SponsoredPrimary 44 56 49 51
Dependent 42 58 55 45
Skilled IndependentPrimary 2 98 32 68
Dependent 6 94 41 59
Family or Government Sponsored
Primary 3 97 25 75
Dependent 11 89 31 69
In the decade from 2000 to 2010, the points-tested visa category was the choice for many international students to transition to permanent residency in Australia. Given the vast majority of international students are from non-English background countries, these results are not a surprise.
This factor — whether a visa was granted in Australia or outside — is important and plays a role in shaping labour market outcomes. For example, Figure 4 highlights whether a visa is granted onshore or offshore and the associated level of income.
The pattern is clear. English or non-English background employer sponsored migrants who received their visa in Australia earn more than those who receive their visa outside of Australia. This is likely as there was an existing employment relationship from a previous visa combined with the asset of Australian work experience.
This pattern is reversed when there is no direct employer relationship. Migrants in the skilled independent and family or government sponsored categories who receive their visa offshore show higher incomes than migrants who receive their visa in Australia. This holds for both English and non-English speakers.
FIGURE 4: EARNINGS OVER $1,500 PER WEEK BY MIGRATION STREAM, LOCATION AND ENGLISH PROFICIENCY
0% 10% 20% 30% 40% 50% 60%
Dependent
Primary
Dependent
Primary
Dependent
Primary
Skill
edFa
mily
Hum
anita
rian
1-5 years since arrival 6-10 years since arrival
Bachelor Degree Advanced Diploma or Diploma CertificatePostgraduate Qualification
0%
20%
40%
60%
80%
100%
Skill (Primary) Skill(Dependent)
Family (Primary) Humanitarian(Primary)
GeneralPopulation
0%
5%
10%
15%
20%
25%
30%
35%
40%
45%
Postgraduate Qualification
Bachelor DegreeAdvanced Diplomaor Diploma
CertificateNo Post SchoolQualification
Humanitarian (Primary)Family (Primary) Skill (Dependent)Skill (Primary) General Population
0%
20%
40%
60%
80%
English (Onshore) English (Offshore) Non-English(Onshore)
Non-English(Offshore)
Skilled - Independent
Skilled - Family or Government Sponsored
Family - Partner
Skilled - Employer Sponsored
0-4 5-9 10-14 15-19 20-24 25-29 30-34 35-39 40-44 45-49 50-54 55-59 60-64 65-69 70+0%
5%
15%
25%
35%
Primary (onshore) Primary (offshore) Dependent (onshore) Dependent (offshore)
Years
0-4 5-9 10-14 15-19 20-24 25-29 30-34 35-39 40-44 45-49 50-54 55-59 60-64 65-69 70+0%
5%
10%
20%
25%
30%
Years
15%
45-49 years
35-39 years
30-34 years
25-29 years
40-44 years
Pre-2000 migrantsEnglish proficieny: Native
Pre-2000 migrantsEnglish proficieny: Very Well
Post-2000 migrants English proficieny: Native
Post-2000 migrants English proficieny: Very Well
15-19 20-24 25-29 30-34 35-39 40-44 45-49 50-54 55-59 60-640%
5%
10%
20%
25%
30%
Pre-2000 permanent migrants Post-2000 permanent migrants Australian born
Years
15%
Primary (onshore) Primary (offshore) Dependent (onshore) Dependent (offshore)
50-54 years
20%10% 30% 40%0%20%30%40% 10%
45-49 years
35-39 years
30-34 years
25-29 years
40-44 years
Pre-2000 migrantsEnglish proficieny: Very Well
Pre-2000 migrantsEnglish proficieny: Well
Post-2000 migrants English proficieny: Very Well
Post-2000 migrants English proficieny: Well
50-54 years
20%10% 30% 40%0%20%30%40% 10%
11
Mig
ratio
n in
Foc
us
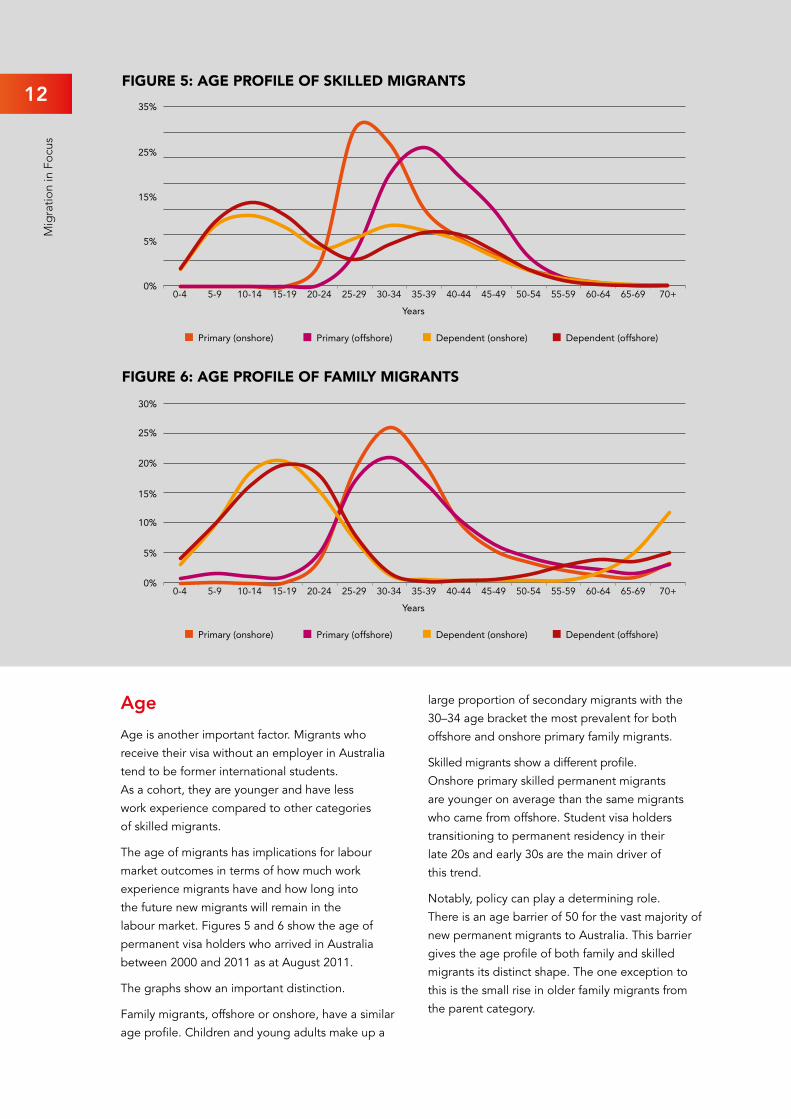
FIGURE 5: AGE PROFILE OF SKILLED MIGRANTS
0% 10% 20% 30% 40% 50% 60%
Dependent
Primary
Dependent
Primary
Dependent
Primary
Skill
edFa
mily
Hum
anita
rian
1-5 years since arrival 6-10 years since arrival
Bachelor Degree Advanced Diploma or Diploma CertificatePostgraduate Qualification
0%
20%
40%
60%
80%
100%
Skill (Primary) Skill(Dependent)
Family (Primary) Humanitarian(Primary)
GeneralPopulation
0%
5%
10%
15%
20%
25%
30%
35%
40%
45%
Postgraduate Qualification
Bachelor DegreeAdvanced Diplomaor Diploma
CertificateNo Post SchoolQualification
Humanitarian (Primary)Family (Primary) Skill (Dependent)Skill (Primary) General Population
0%
20%
40%
60%
80%
English (Onshore) English (Offshore) Non-English(Onshore)
Non-English(Offshore)
Skilled - Independent
Skilled - Family or Government Sponsored
Family - Partner
Skilled - Employer Sponsored
0-4 5-9 10-14 15-19 20-24 25-29 30-34 35-39 40-44 45-49 50-54 55-59 60-64 65-69 70+0%
5%
15%
25%
35%
Primary (onshore) Primary (offshore) Dependent (onshore) Dependent (offshore)
Years
0-4 5-9 10-14 15-19 20-24 25-29 30-34 35-39 40-44 45-49 50-54 55-59 60-64 65-69 70+0%
5%
10%
20%
25%
30%
Years
15%
45-49 years
35-39 years
30-34 years
25-29 years
40-44 years
Pre-2000 migrantsEnglish proficieny: Native
Pre-2000 migrantsEnglish proficieny: Very Well
Post-2000 migrants English proficieny: Native
Post-2000 migrants English proficieny: Very Well
15-19 20-24 25-29 30-34 35-39 40-44 45-49 50-54 55-59 60-640%
5%
10%
20%
25%
30%
Pre-2000 permanent migrants Post-2000 permanent migrants Australian born
Years
15%
Primary (onshore) Primary (offshore) Dependent (onshore) Dependent (offshore)
50-54 years
20%10% 30% 40%0%20%30%40% 10%
45-49 years
35-39 years
30-34 years
25-29 years
40-44 years
Pre-2000 migrantsEnglish proficieny: Very Well
Pre-2000 migrantsEnglish proficieny: Well
Post-2000 migrants English proficieny: Very Well
Post-2000 migrants English proficieny: Well
50-54 years
20%10% 30% 40%0%20%30%40% 10%
FIGURE 6: AGE PROFILE OF FAMILY MIGRANTS
0% 10% 20% 30% 40% 50% 60%
Dependent
Primary
Dependent
Primary
Dependent
Primary
Skill
edFa
mily
Hum
anita
rian
1-5 years since arrival 6-10 years since arrival
Bachelor Degree Advanced Diploma or Diploma CertificatePostgraduate Qualification
0%
20%
40%
60%
80%
100%
Skill (Primary) Skill(Dependent)
Family (Primary) Humanitarian(Primary)
GeneralPopulation
0%
5%
10%
15%
20%
25%
30%
35%
40%
45%
Postgraduate Qualification
Bachelor DegreeAdvanced Diplomaor Diploma
CertificateNo Post SchoolQualification
Humanitarian (Primary)Family (Primary) Skill (Dependent)Skill (Primary) General Population
0%
20%
40%
60%
80%
English (Onshore) English (Offshore) Non-English(Onshore)
Non-English(Offshore)
Skilled - Independent
Skilled - Family or Government Sponsored
Family - Partner
Skilled - Employer Sponsored
0-4 5-9 10-14 15-19 20-24 25-29 30-34 35-39 40-44 45-49 50-54 55-59 60-64 65-69 70+0%
5%
15%
25%
35%
Primary (onshore) Primary (offshore) Dependent (onshore) Dependent (offshore)
Years
0-4 5-9 10-14 15-19 20-24 25-29 30-34 35-39 40-44 45-49 50-54 55-59 60-64 65-69 70+0%
5%
10%
20%
25%
30%
Years
15%
45-49 years
35-39 years
30-34 years
25-29 years
40-44 years
Pre-2000 migrantsEnglish proficieny: Native
Pre-2000 migrantsEnglish proficieny: Very Well
Post-2000 migrants English proficieny: Native
Post-2000 migrants English proficieny: Very Well
15-19 20-24 25-29 30-34 35-39 40-44 45-49 50-54 55-59 60-640%
5%
10%
20%
25%
30%
Pre-2000 permanent migrants Post-2000 permanent migrants Australian born
Years
15%
Primary (onshore) Primary (offshore) Dependent (onshore) Dependent (offshore)
50-54 years
20%10% 30% 40%0%20%30%40% 10%
45-49 years
35-39 years
30-34 years
25-29 years
40-44 years
Pre-2000 migrantsEnglish proficieny: Very Well
Pre-2000 migrantsEnglish proficieny: Well
Post-2000 migrants English proficieny: Very Well
Post-2000 migrants English proficieny: Well
50-54 years
20%10% 30% 40%0%20%30%40% 10%
Age
Age is another important factor. Migrants who receive their visa without an employer in Australia tend to be former international students. As a cohort, they are younger and have less work experience compared to other categories of skilled migrants.
The age of migrants has implications for labour market outcomes in terms of how much work experience migrants have and how long into the future new migrants will remain in the labour market. Figures 5 and 6 show the age of permanent visa holders who arrived in Australia between 2000 and 2011 as at August 2011.
The graphs show an important distinction.
Family migrants, offshore or onshore, have a similar age profile. Children and young adults make up a
large proportion of secondary migrants with the 30–34 age bracket the most prevalent for both offshore and onshore primary family migrants.
Skilled migrants show a different profile. Onshore primary skilled permanent migrants are younger on average than the same migrants who came from offshore. Student visa holders transitioning to permanent residency in their late 20s and early 30s are the main driver of this trend.
Notably, policy can play a determining role. There is an age barrier of 50 for the vast majority of new permanent migrants to Australia. This barrier gives the age profile of both family and skilled migrants its distinct shape. The one exception to this is the small rise in older family migrants from the parent category.
Mig
ratio
n in
Foc
us
12
SECTION 3: Comparing ACMID and the pastSection two provided a brief snapshot of new permanent migrant labour market outcomes as at August 2011. Section three will compare these migrants with migrants who arrived prior to 2000 and, where relevant, to the general population.
In the 1980s and 1990s, the economy was different and in particular, the labour market was different. Links in the Asia-Pacific were shallow and origin countries in Europe drove migration flows. That environment was conducive to a migration policy framework that relied heavily on tradition.
This section will outline how some of the large structural changes have altered the nature of migration to Australia. By looking at the population of new migrants from 2000 to 2011 and comparing this group of new Australians to other groups of migrants and the population at large, we can be better understand themes and outcomes that are now playing out in terms of settlement outcomes.
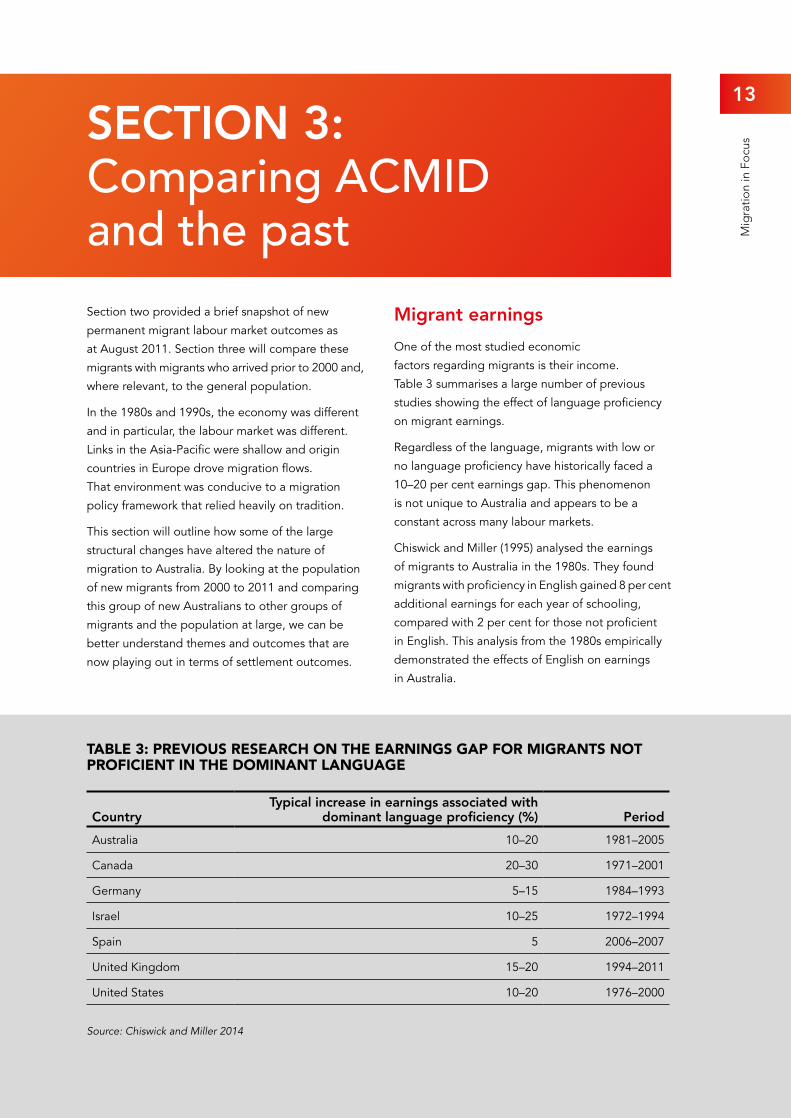
Migrant earnings
One of the most studied economic factors regarding migrants is their income. Table 3 summarises a large number of previous studies showing the effect of language proficiency on migrant earnings.
Regardless of the language, migrants with low or no language proficiency have historically faced a 10–20 per cent earnings gap. This phenomenon is not unique to Australia and appears to be a constant across many labour markets.
Chiswick and Miller (1995) analysed the earnings of migrants to Australia in the 1980s. They found migrants with proficiency in English gained 8 per cent additional earnings for each year of schooling, compared with 2 per cent for those not proficient in English. This analysis from the 1980s empirically demonstrated the effects of English on earnings in Australia.
TABLE 3: PREVIOUS RESEARCH ON THE EARNINGS GAP FOR MIGRANTS NOT PROFICIENT IN THE DOMINANT LANGUAGE
CountryTypical increase in earnings associated with
dominant language proficiency (%) Period
Australia 10–20 1981–2005
Canada 20–30 1971–2001
Germany 5–15 1984–1993
Israel 10–25 1972–1994
Spain 5 2006–2007
United Kingdom 15–20 1994–2011
United States 10–20 1976–2000
Source: Chiswick and Miller 2014
13
Mig
ratio
n in
Foc
us

By the 1990s, the difference in earnings between those who were proficient and those who weren’t proficient in English had increased to approximately 20 per cent (Chiswick, Lee and Miller, 2005).
The increasing earnings gap from the 1980s to the 1990s has accelerated in the 21st century as the structure of the labour market further changed. ACMID can assist in demonstrating exactly how important English language for migrants is in the 21st century.
For all permanent migrants arriving between 2000 and 2011, only 4 per cent of migrants who are not proficient in spoken English earned $52,000 or more per annum compared to 29 per cent who are proficient in spoken English and 46 per cent of native English speakers.
FIGURE 7: EARNINGS OVER $1,500 PER WEEK BY ARRIVAL PERIOD AND ENGLISH PROFICIENCY
0% 10% 20% 30% 40% 50% 60%
Dependent
Primary
Dependent
Primary
Dependent
Primary
Skill
edFa
mily
Hum
anita
rian
1-5 years since arrival 6-10 years since arrival
Bachelor Degree Advanced Diploma or Diploma CertificatePostgraduate Qualification
0%
20%
40%
60%
80%
100%
Skill (Primary) Skill(Dependent)
Family (Primary) Humanitarian(Primary)
GeneralPopulation
0%
5%
10%
15%
20%
25%
30%
35%
40%
45%
Postgraduate Qualification
Bachelor DegreeAdvanced Diplomaor Diploma
CertificateNo Post SchoolQualification
Humanitarian (Primary)Family (Primary) Skill (Dependent)Skill (Primary) General Population
0%
20%
40%
60%
80%
English (Onshore) English (Offshore) Non-English(Onshore)
Non-English(Offshore)
Skilled - Independent
Skilled - Family or Government Sponsored
Family - Partner
Skilled - Employer Sponsored
0-4 5-9 10-14 15-19 20-24 25-29 30-34 35-39 40-44 45-49 50-54 55-59 60-64 65-69 70+0%
5%
15%
25%
35%
Primary (onshore) Primary (offshore) Dependent (onshore) Dependent (offshore)
Years
0-4 5-9 10-14 15-19 20-24 25-29 30-34 35-39 40-44 45-49 50-54 55-59 60-64 65-69 70+0%
5%
10%
20%
25%
30%
Years
15%
45-49 years
35-39 years
30-34 years
25-29 years
40-44 years
Pre-2000 migrantsEnglish proficieny: Native
Pre-2000 migrantsEnglish proficieny: Very Well
Post-2000 migrants English proficieny: Native
Post-2000 migrants English proficieny: Very Well
15-19 20-24 25-29 30-34 35-39 40-44 45-49 50-54 55-59 60-640%
5%
10%
20%
25%
30%
Pre-2000 permanent migrants Post-2000 permanent migrants Australian born
Years
15%
Primary (onshore) Primary (offshore) Dependent (onshore) Dependent (offshore)
50-54 years
20%10% 30% 40%0%20%30%40% 10%
45-49 years
35-39 years
30-34 years
25-29 years
40-44 years
Pre-2000 migrantsEnglish proficieny: Very Well
Pre-2000 migrantsEnglish proficieny: Well
Post-2000 migrants English proficieny: Very Well
Post-2000 migrants English proficieny: Well
50-54 years
20%10% 30% 40%0%20%30%40% 10%FIGURE 8: EARNINGS BETWEEN $1000–$1,499 BY ARRIVAL PERIOD AND ENGLISH PROFICIENCY
0% 10% 20% 30% 40% 50% 60%
Dependent
Primary
Dependent
Primary
Dependent
Primary
Skill
edFa
mily
Hum
anita
rian
1-5 years since arrival 6-10 years since arrival
Bachelor Degree Advanced Diploma or Diploma CertificatePostgraduate Qualification
0%
20%
40%
60%
80%
100%
Skill (Primary) Skill(Dependent)
Family (Primary) Humanitarian(Primary)
GeneralPopulation
0%
5%
10%
15%
20%
25%
30%
35%
40%
45%
Postgraduate Qualification
Bachelor DegreeAdvanced Diplomaor Diploma
CertificateNo Post SchoolQualification
Humanitarian (Primary)Family (Primary) Skill (Dependent)Skill (Primary) General Population
0%
20%
40%
60%
80%
English (Onshore) English (Offshore) Non-English(Onshore)
Non-English(Offshore)
Skilled - Independent
Skilled - Family or Government Sponsored
Family - Partner
Skilled - Employer Sponsored
0-4 5-9 10-14 15-19 20-24 25-29 30-34 35-39 40-44 45-49 50-54 55-59 60-64 65-69 70+0%
5%
15%
25%
35%
Primary (onshore) Primary (offshore) Dependent (onshore) Dependent (offshore)
Years
0-4 5-9 10-14 15-19 20-24 25-29 30-34 35-39 40-44 45-49 50-54 55-59 60-64 65-69 70+0%
5%
10%
20%
25%
30%
Years
15%
45-49 years
35-39 years
30-34 years
25-29 years
40-44 years
Pre-2000 migrantsEnglish proficieny: Native
Pre-2000 migrantsEnglish proficieny: Very Well
Post-2000 migrants English proficieny: Native
Post-2000 migrants English proficieny: Very Well
15-19 20-24 25-29 30-34 35-39 40-44 45-49 50-54 55-59 60-640%
5%
10%
20%
25%
30%
Pre-2000 permanent migrants Post-2000 permanent migrants Australian born
Years
15%
Primary (onshore) Primary (offshore) Dependent (onshore) Dependent (offshore)
50-54 years
20%10% 30% 40%0%20%30%40% 10%
45-49 years
35-39 years
30-34 years
25-29 years
40-44 years
Pre-2000 migrantsEnglish proficieny: Very Well
Pre-2000 migrantsEnglish proficieny: Well
Post-2000 migrants English proficieny: Very Well
Post-2000 migrants English proficieny: Well
50-54 years
20%10% 30% 40%0%20%30%40% 10%
14
Mig
ratio
n in
Foc
us

These results point towards an increasing earning gap for migrants proficient in English and those not proficient, a gap that has been growing each decade since the 1980s. While the entire earnings gap cannot be attributed to English language (other factors include age, work experience and education), the earnings gap is growing as employers continue to prioritise skills and language proficiency. This process should be expected to continue as the skills base in the labour market continues to grow.
To investigate this in more detail, the earnings gap can be explored by comparing migrants who arrived before and after 2000.
Figure 7 shows that permanent migrants who arrived in Australia between 2000 and 2011 and have a high level of English proficiency have significantly better earnings than migrants with the same characteristics who arrived before 2000, despite holding less Australian work experience.
Working age migrants who arrived after 2000 (right hand side) are typically between 5 and 8 percentage points more likely to earn over $1,500 per week than migrants who arrived before 2000 if they are native or speak English ‘very well’.
Importantly, while the gap between native English speakers and those who speak ‘very well’ grows between the two cohorts, it does so in an environment of increasing earnings for all age categories.
These results point towards the success of recent migration policy change. This graph represents the ‘best and the brightest’ that has become a theme of Australia’s migration selection framework. The regulatory framework of migration underwent substantial change in the 2000s with the aim to achieve precisely this type of result.
However there is another side to the same story. Figure 7 showed the proportion of migrants earning over $75,000 per year. Moving down the income scale and comparing migrants who speak English ‘well’ and ‘very well’, different outcomes are apparent.
While Figure 7 highlighted how more recent arrivals had improved their earnings compared to migrants arriving before 2000, Figure 8 shows there is little improvement for migrants further down the income ladder. The share of each age category for post-2000 migrants that speak English ‘well’ has regressed compared to pre-2000 migrants.
Migrants that speak English ‘very well’ have fared better, with small increases in most age categories, however the magnitude is not akin to those earning over $75,000.
As before, the earnings gap between migrants who speak English ‘very well’ and ‘well’ increases from 2000 for migrants earning between $1,000 and $1,499. However as the earnings of some age categories have regressed as a share of total migrants, this points to a more complex understanding of recent policy change.
Lower earnings growth coupled with an increased gap between those who can speak English well and those who cannot is a poor environment for the settlement journey of migrants. This is not a new feature of the labour market but it is an important trend policy makers must be cognescent of.
The picture to emerge when considering the data is complex. On the one hand, newer migrants with very good English proficiency are thriving in the labour market, outperforming even their native English peers who have been in Australia for decades. On the other hand, new migrants whose English is not as good are more static with regard to earnings.
Combining the findings of past research and the results of ACMID, policy-makers should be aware how English language proficiency is becoming more important to the outcomes of migrants in the labour market.
More than any single other factor, the government must consider how to better increase the English proficiency levels for non-English speaking migrants given the long-term benefits this will generate for the Australian economy.
These findings point towards an expanded role for how new permanent migrants learn to continuously improve their English. This is critical particularly in the first few years of living in Australia. These first years shape permanent migrants labour market outcomes for many years to come as they are formative in the settlement process.
15
Mig
ratio
n in
Foc
us

Gender
While much of the migration policy change over the last decade has been successful, there remain policy areas requiring further attention. One of these areas is the relatively poor labour market outcomes for migrant women compared to migrant men. Figure 9 shows the earnings gap for new permanent migrants, pre-2000 permanent migrants and the general population.
Figure 9 shows the percentage difference between males and females who earn over $1,500 per week. The yellow line highlights the gender gap for Australian-born. Newer migrants have a higher earnings gap for prime working age years than both pre-2000 migrants and Australian-born residents.
This highlights how the gender gap is worse for migrants who have arrived in the last decade and appears to be growing compared to migrants who arrived before 2001.
In addition to the earnings gap, there is also a general unemployment and participation rate gap as shown in Table 4.
Even for the same visa subclasses, there are clear differences between males and females in the labour market. This applies even for primary visa applicants who have been selected based on strict rules-based criteria designed to generate positive labour market outcomes.
FIGURE 9: PROPORTIONAL DIFFERENCE BETWEEN MALE AND FEMALE EARNINGS OVER $1,500 PER WEEK
0% 10% 20% 30% 40% 50% 60%
Dependent
Primary
Dependent
Primary
Dependent
Primary
Skill
edFa
mily
Hum
anita
rian
1-5 years since arrival 6-10 years since arrival
Bachelor Degree Advanced Diploma or Diploma CertificatePostgraduate Qualification
0%
20%
40%
60%
80%
100%
Skill (Primary) Skill(Dependent)
Family (Primary) Humanitarian(Primary)
GeneralPopulation
0%
5%
10%
15%
20%
25%
30%
35%
40%
45%
Postgraduate Qualification
Bachelor DegreeAdvanced Diplomaor Diploma
CertificateNo Post SchoolQualification
Humanitarian (Primary)Family (Primary) Skill (Dependent)Skill (Primary) General Population
0%
20%
40%
60%
80%
English (Onshore) English (Offshore) Non-English(Onshore)
Non-English(Offshore)
Skilled - Independent
Skilled - Family or Government Sponsored
Family - Partner
Skilled - Employer Sponsored
0-4 5-9 10-14 15-19 20-24 25-29 30-34 35-39 40-44 45-49 50-54 55-59 60-64 65-69 70+0%
5%
15%
25%
35%
Primary (onshore) Primary (offshore) Dependent (onshore) Dependent (offshore)
Years
0-4 5-9 10-14 15-19 20-24 25-29 30-34 35-39 40-44 45-49 50-54 55-59 60-64 65-69 70+0%
5%
10%
20%
25%
30%
Years
15%
45-49 years
35-39 years
30-34 years
25-29 years
40-44 years
Pre-2000 migrantsEnglish proficieny: Native
Pre-2000 migrantsEnglish proficieny: Very Well
Post-2000 migrants English proficieny: Native
Post-2000 migrants English proficieny: Very Well
15-19 20-24 25-29 30-34 35-39 40-44 45-49 50-54 55-59 60-640%
5%
10%
20%
25%
30%
Pre-2000 permanent migrants Post-2000 permanent migrants Australian born
Years
15%
Primary (onshore) Primary (offshore) Dependent (onshore) Dependent (offshore)
50-54 years
20%10% 30% 40%0%20%30%40% 10%
45-49 years
35-39 years
30-34 years
25-29 years
40-44 years
Pre-2000 migrantsEnglish proficieny: Very Well
Pre-2000 migrantsEnglish proficieny: Well
Post-2000 migrants English proficieny: Very Well
Post-2000 migrants English proficieny: Well
50-54 years
20%10% 30% 40%0%20%30%40% 10%
TABLE 4: LABOUR MARKET OUTCOMES FOR VARIOUS MIGRANTS
Skilled Family Humanitarian
Male Female Male Female Male Female
PrimaryUnemployment Rate 3% 5% 8% 12% 19% 23%
Participation 95% 85% 81% 57% 57% 31%
DependentUnemployment Rate 9% 11% 16% 16% 22% 26%
Participation 74% 64% 53% 38% 46% 28%
16
Mig
ratio
n in
Foc
us
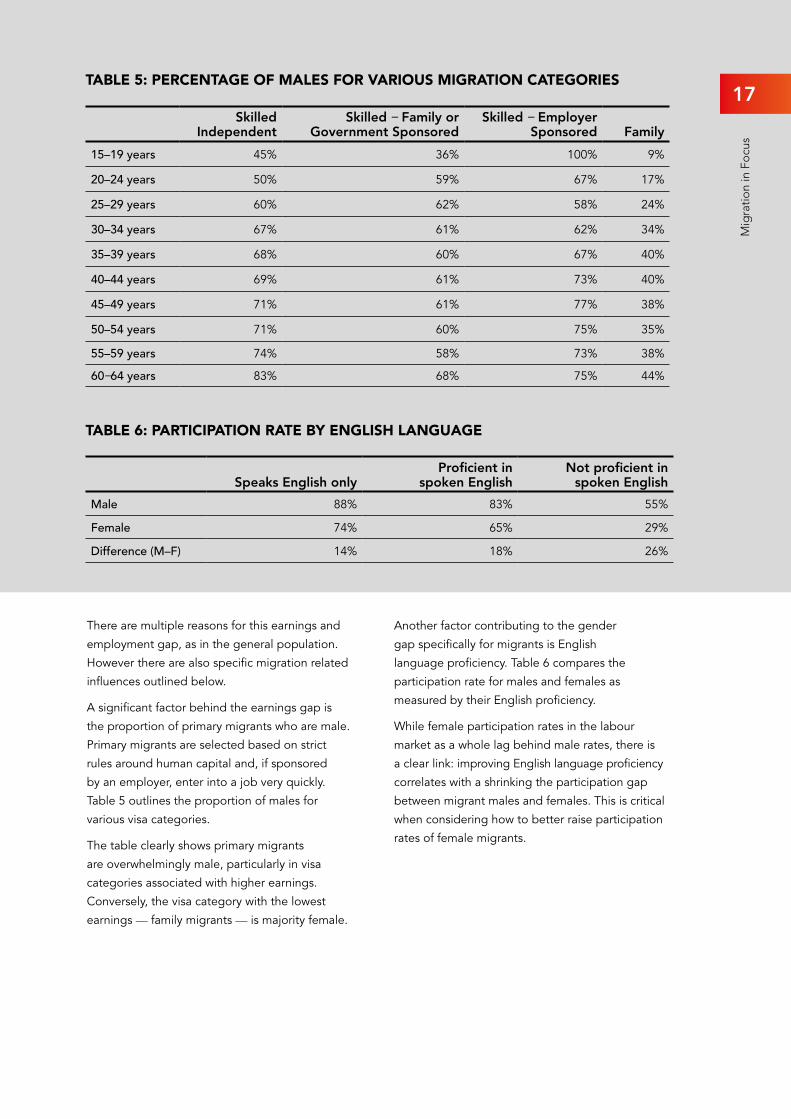
TABLE 5: PERCENTAGE OF MALES FOR VARIOUS MIGRATION CATEGORIES
Skilled Independent
Skilled Family or Government Sponsored
Skilled Employer Sponsored Family
15–19 years 45% 36% 100% 9%
20–24 years 50% 59% 67% 17%
25–29 years 60% 62% 58% 24%
30–34 years 67% 61% 62% 34%
35–39 years 68% 60% 67% 40%
40–44 years 69% 61% 73% 40%
45–49 years 71% 61% 77% 38%
50–54 years 71% 60% 75% 35%
55–59 years 74% 58% 73% 38%
6064 years 83% 68% 75% 44%
TABLE 6: PARTICIPATION RATE BY ENGLISH LANGUAGE
Speaks English onlyProficient in
spoken EnglishNot proficient in
spoken English
Male 88% 83% 55%
Female 74% 65% 29%
Difference (M–F) 14% 18% 26%
There are multiple reasons for this earnings and employment gap, as in the general population. However there are also specific migration related influences outlined below.
A significant factor behind the earnings gap is the proportion of primary migrants who are male. Primary migrants are selected based on strict rules around human capital and, if sponsored by an employer, enter into a job very quickly. Table 5 outlines the proportion of males for various visa categories.
The table clearly shows primary migrants are overwhelmingly male, particularly in visa categories associated with higher earnings. Conversely, the visa category with the lowest earnings — family migrants — is majority female.
Another factor contributing to the gender gap specifically for migrants is English language proficiency. Table 6 compares the participation rate for males and females as measured by their English proficiency.
While female participation rates in the labour market as a whole lag behind male rates, there is a clear link: improving English language proficiency correlates with a shrinking the participation gap between migrant males and females. This is critical when considering how to better raise participation rates of female migrants.
17
Mig
ratio
n in
Foc
us
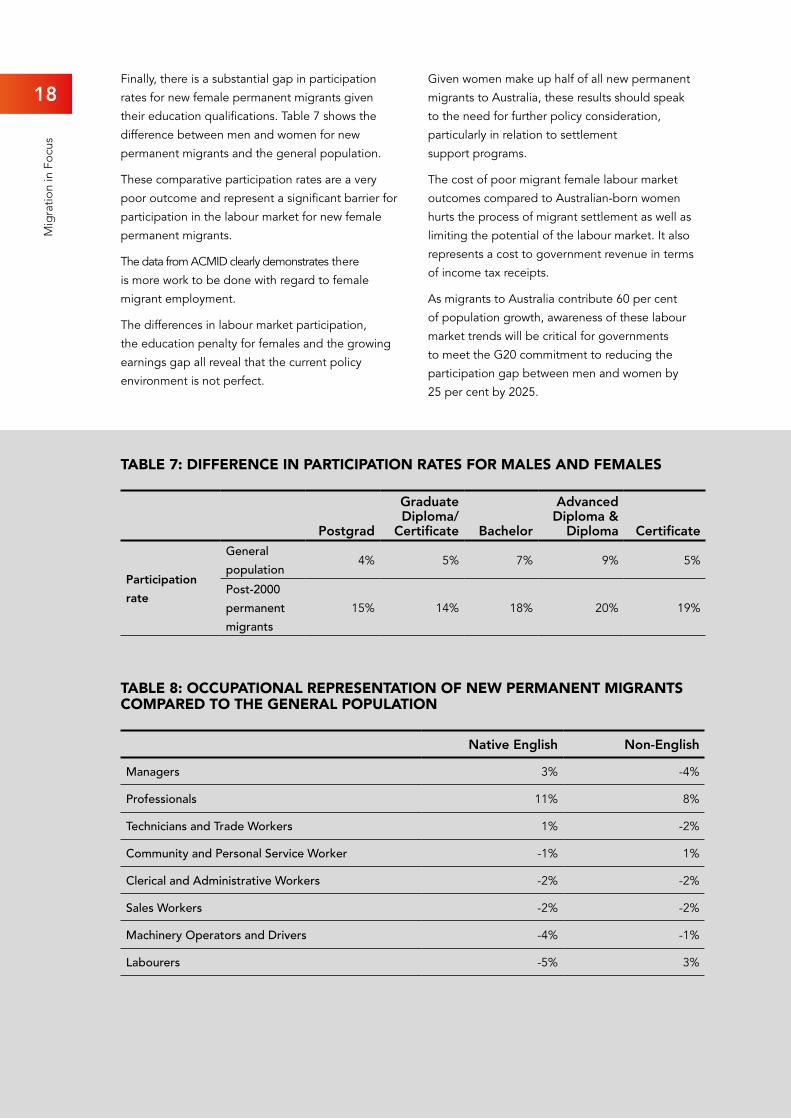
TABLE 7: DIFFERENCE IN PARTICIPATION RATES FOR MALES AND FEMALES
Postgrad
Graduate Diploma/
Certificate Bachelor
Advanced Diploma &
Diploma Certificate
Participation rate
General population
4% 5% 7% 9% 5%
Post-2000 permanent migrants
15% 14% 18% 20% 19%
TABLE 8: OCCUPATIONAL REPRESENTATION OF NEW PERMANENT MIGRANTS COMPARED TO THE GENERAL POPULATION
Native English Non-English
Managers 3% -4%
Professionals 11% 8%
Technicians and Trade Workers 1% -2%
Community and Personal Service Worker -1% 1%
Clerical and Administrative Workers -2% -2%
Sales Workers -2% -2%
Machinery Operators and Drivers -4% -1%
Labourers -5% 3%
Finally, there is a substantial gap in participation rates for new female permanent migrants given their education qualifications. Table 7 shows the difference between men and women for new permanent migrants and the general population.
These comparative participation rates are a very poor outcome and represent a significant barrier for participation in the labour market for new female permanent migrants.
The data from ACMID clearly demonstrates there is more work to be done with regard to female migrant employment.
The differences in labour market participation, the education penalty for females and the growing earnings gap all reveal that the current policy environment is not perfect.
Given women make up half of all new permanent migrants to Australia, these results should speak to the need for further policy consideration, particularly in relation to settlement support programs.
The cost of poor migrant female labour market outcomes compared to Australian-born women hurts the process of migrant settlement as well as limiting the potential of the labour market. It also represents a cost to government revenue in terms of income tax receipts.
As migrants to Australia contribute 60 per cent of population growth, awareness of these labour market trends will be critical for governments to meet the G20 commitment to reducing the participation gap between men and women by 25 per cent by 2025.
18
Mig
ratio
n in
Foc
us
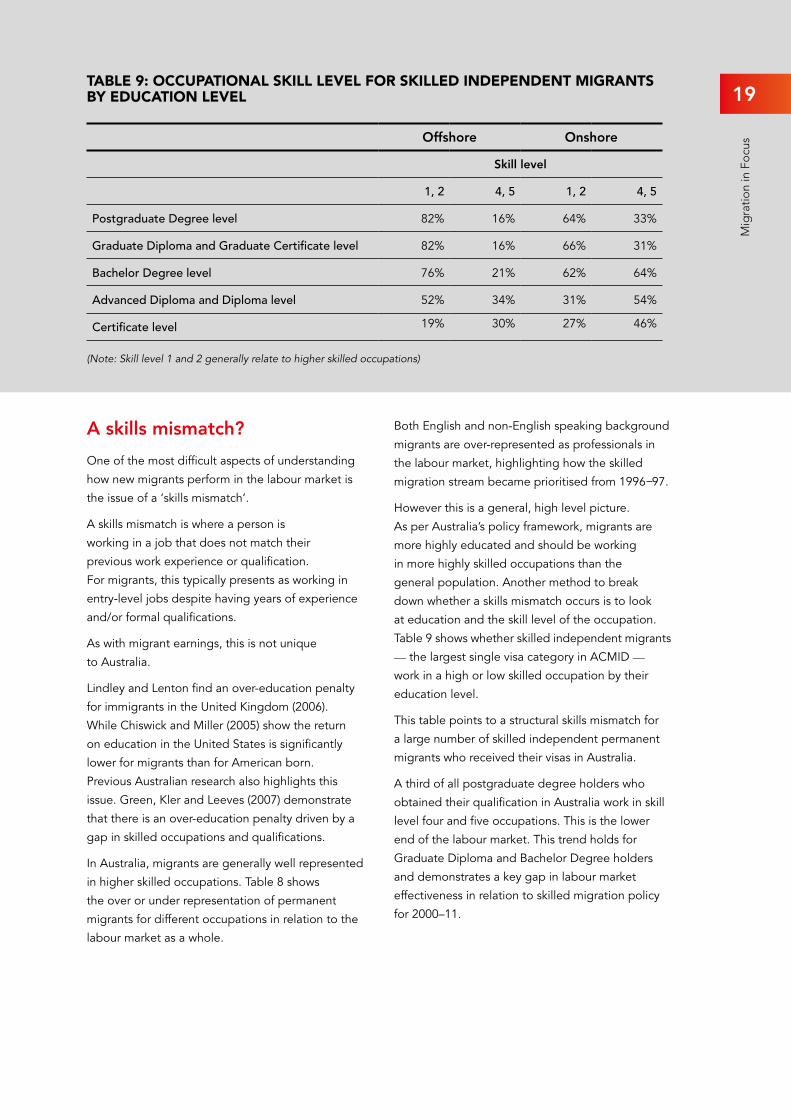
TABLE 9: OCCUPATIONAL SKILL LEVEL FOR SKILLED INDEPENDENT MIGRANTS BY EDUCATION LEVEL
Offshore Onshore
Skill level
1, 2 4, 5 1, 2 4, 5
Postgraduate Degree level 82% 16% 64% 33%
Graduate Diploma and Graduate Certificate level 82% 16% 66% 31%
Bachelor Degree level 76% 21% 62% 64%
Advanced Diploma and Diploma level 52% 34% 31% 54%
Certificate level 19% 30% 27% 46%
(Note: Skill level 1 and 2 generally relate to higher skilled occupations)
A skills mismatch?
One of the most difficult aspects of understanding how new migrants perform in the labour market is the issue of a ‘skills mismatch’.
A skills mismatch is where a person is working in a job that does not match their previous work experience or qualification. For migrants, this typically presents as working in entry-level jobs despite having years of experience and/or formal qualifications.
As with migrant earnings, this is not unique to Australia.
Lindley and Lenton find an over-education penalty for immigrants in the United Kingdom (2006). While Chiswick and Miller (2005) show the return on education in the United States is significantly lower for migrants than for American born. Previous Australian research also highlights this issue. Green, Kler and Leeves (2007) demonstrate that there is an over-education penalty driven by a gap in skilled occupations and qualifications.
In Australia, migrants are generally well represented in higher skilled occupations. Table 8 shows the over or under representation of permanent migrants for different occupations in relation to the labour market as a whole.
Both English and non-English speaking background migrants are over-represented as professionals in the labour market, highlighting how the skilled migration stream became prioritised from 199697.
However this is a general, high level picture. As per Australia’s policy framework, migrants are more highly educated and should be working in more highly skilled occupations than the general population. Another method to break down whether a skills mismatch occurs is to look at education and the skill level of the occupation. Table 9 shows whether skilled independent migrants — the largest single visa category in ACMID — work in a high or low skilled occupation by their education level.
This table points to a structural skills mismatch for a large number of skilled independent permanent migrants who received their visas in Australia.
A third of all postgraduate degree holders who obtained their qualification in Australia work in skill level four and five occupations. This is the lower end of the labour market. This trend holds for Graduate Diploma and Bachelor Degree holders and demonstrates a key gap in labour market effectiveness in relation to skilled migration policy for 2000–11.
19
Mig
ratio
n in
Foc
us
Unfortunately this is likely in part due to past government policy decisions instead of active choices by migrants. In the early 2000s, there was a “near-automatic link between studying in Australia and the right to permanent residency” (Mares 2013).
This created downstream consequences, and one of the most prominent issues was the proliferation of private education institutions. International students would obtain qualifications unvalued by employers yet remain eligible for permanent residency.
While significant reform was undertaken to resolve these policy issues, the data above reflect a large scale skills mismatch for particular cohorts of new migrants arriving since 2000 as employers continue to ignore particular types of qualifications and work experience. While the skill share results for offshore skilled independent migrants are positive, the contrast with onshore skilled independent migrants is striking.
It is inevitable that not every single permanent skilled migrant will work in a highly skilled job. Yet it is important policy makers ensure the numerous regulatory changes since this issue was identified keep working towards maintaining the integrity of skilled visa categories.
A skills mismatch hurts both migrants ability to settle into the community and has significant economic opportunity costs for individual migrants and governments.
Employment
The previous income data from ACMID highlights some of the benefits of the economic shift for migration policy in Australia. The employment data also highlights positive labour market outcomes while raising some questions for the future.
Table 10 shows a comparison of the participation and unemployment rate by age for permanent migrants who arrived before and after 2000.
Migrants who arrived before 2000 outperform all recent migrants across both employment indicators. Even isolating the migrants who arrived between 2000 and 2005, there is a slight edge to migrants who arrived before 2000. Why are the employment outcomes of newer permanent migrants less favourable thank for migrants who arrived before 2000? Is this example of policy failure?
The main explanation is time spent in the labour market. Migrants who arrived before 2000 have a minimum of a decade in Australia already under their belt. Most have much more than that. This means they have significant experience in the Australian labour market, which is a major advantage. For example, over 50 per cent of all 30 to 49 year older permanent migrants who arrived before 2000 have been in Australia for over two decades.
A majority of the newer permanent migrants are in prime working age. For these groups, the difference between new and old migrants is less than the overall difference. For example, from 35 to 44, the difference in participation is 3 per cent and the difference in unemployment is 2 per cent. For migrants arriving from 2000–2005, the difference is 1 per cent in participation and no difference in unemployment.
These results point to a positive labour market future for newer permanent migrants. The longer they remain in Australia, the better their employment outcomes become over time. This shows up in recent arrivals. By splitting new migrant arrivals into those who arrived 2001–06 and 2006–11, large improvements appear immediately across all visa categories.
20
Mig
ratio
n in
Foc
us

TAB
LE 1
0: T
HE
DIF
FER
ENC
E IN
PA
RTIC
IPA
TIO
N A
ND
UN
EMPL
OY
MEN
T B
ETW
EEN
VA
RIO
US
MIG
RA
NT
POPU
LATI
ON
S
Pre-
2000
P
ost-
2000
Pre-
2000
P
ost-
2000
05
Pre-
2000
P
ost-
2006
11
Part
icip
atio
nU
nem
ploy
men
tPa
rtic
ipat
ion
Une
mpl
oym
ent
Part
icip
atio
nU
nem
ploy
men
t
15–1
9 ye
ars
10%
-3%
6%-1
%3%
-1%
20–2
4 ye
ars
15%
-6%
7%-4
%8%
-2%
25–2
9 ye
ars
11%
-3%
5%0%
5%-3
%
30–3
4 ye
ars
5%-2
%3%
0%2%
-2%
35–3
9 ye
ars
3%-2
%1%
0%2%
-1%
40–4
4 ye
ars
3%-2
%1%
0%1%
-1%
45–4
9 ye
ars
3%-2
%2%
-1%
1%-1
%
50–5
4 ye
ars
6%-3
%3%
-2%
3%-2
%
55–5
9 ye
ars
13%
-6%
-6%
-1%
19%
-4%
60–6
4 ye
ars
14%
-6%
7%-2
%7%
-4%
Tota
l3%
-3%
0%-1
%3%
-2% 21
Mig
ratio
n in
Foc
us

This data shows the importance of time. Being a brand new entrant to a labour market with established norms and structures is difficult, even for skilled migrants. Knowledge about the labour market is learnt over time and employment outcomes improve.
To take the example of family migrants, there is a significant increase in the participation rate and a sizable decrease in the rate of unemployment in the second five-year period after bring granted a permanent visa.
Even though these migrants were not selected on the basis of their human capital, they show rapid improvements. As the unemployment rate for the general population was 5.6 per cent at the time of the 2011 Census, an unemployment rate of 6.5 for primary family migrants who have been in Australia for less than a decade is promising. The halving of the unemployment rate over the second five-year period shows good integration into the labour market.
The lesson for migration policy is clear. There are long-term effects to any change in policy and proper evaluation should occur over appropriate time periods. Measuring the labour market outcomes of migrants in short periods such as a number of months will fail to capture the true effect. This is particularly the case with younger migrants who have the added drawback of less work experience, a trait highly prioritised by many employers.
The majority of new permanent migrants who arrived in Australia from 2000–11 have a very positive future in the labour market. The snapshot in the previous section highlighted how the foundations of Australia’s migration framework are strong.
However there are always those on the margins who should remain at the forefront of how we understand migrant integration into the Australian labour market.
The labour market of the future will be more difficult for a small minority of new permanent migrants. The previous section established how English language proficiency was becoming more important in the labour market as a whole. For new permanent migrants who cannot speak English well (a small proportion of new migrants), there are structural labour market trends that will hurt their ability to thrive.
The most obvious example is the manufacturing industry. Australia’s manufacturing industry has historically been one of the major industries for new migrants, providing their first job. This was a critical step on the pathway to successfully settling in Australia. This was especially the case for new permanent migrants without a defined skill or superior English language proficiency.
Yet manufacturing has been declining over time as a share of the overall labour market primarily due to lower skilled occupations being lost. For migrants, this will force a transition to other sectors of the economy that are growing. This transition will not be easy given the factors discussed previously.
For example, for the period 2000–11, 10.6 per cent of new permanent migrants worked in the manufacturing industry, compared to about 9 per cent for the labour market as a whole. For non-English speakers, the share was 11.5 per cent.
Of these manufacturing workers who work as managers and professionals, the share of English speakers is almost double the share of non-English speakers, 39 per cent to 22 per cent respectively.
This pattern is reversed for lower skilled occupations, such as operators, drivers and labourers where 13 per cent of English speakers work compared to 46 per cent of non-English speakers.
Lower skilled occupations in the manufacturing industry are the jobs most at risk in a changing labour market. However new permanent migrants from non-English backgrounds are over-represented in these very occupations. Of these non-English speaking new permanent migrants about 55 per cent are in the skilled stream while the remaining 45 per cent are from the family and humanitarian streams.
While the general employment outcomes for new permanent migrants have a strong foundation moving forward, there will also be difficulties associated with lower skilled migrants from non-English speaking backgrounds. This is an important point that can get lost if only a quick overview of the labour market is taken.
22
Mig
ratio
n in
Foc
us

TAB
LE 1
1: C
HA
NG
E O
VER
TIM
E IN
LA
BO
UR
MA
RK
ET O
UTC
OM
ES
Skill
edFa
mily
Hum
anit
aria
n
Year
s si
nce
arri
val
Prim
ary
Dep
ende
ntPr
imar
yD
epen
dent
Prim
ary
Dep
ende
nt
1–5
year
s
Part
icip
atio
n91
%66
%62
%37
%43
%26
%
Une
mpl
oym
ent
4%12
%13
%20
%26
%31
%
6–10
yea
rs
Part
icip
atio
n92
%70
%69
%51
%55
%45
%
Une
mpl
oym
ent
3%8%
7%13
%14
%20
%
Imp
rove
men
t
Part
icip
atio
n1%
4%7%
14%
13%
20%
Une
mpl
oym
ent
1%4%
7%7%
12%
11% 23
Mig
ratio
n in
Foc
us
Since 2000, the economy has transformed, migration policy has changed and global migration trends have shifted. The picture is complex. The Global Financial Crisis and policy reform make the characteristics and experience of the migrants analysed in this report different to those who will come in the next decade.
Yet the Australian Census Migrant Integrated Dataset provides a timely tool to assess how Australia’s recent permanent migrants have settled into the labour market. There are lessons to improve future outcomes.
On the surface, the positive indicators are many: migrant incomes are high, migrants hold above average education, and English proficiency is improving much faster than for previous cohorts.
There are also labour market outcomes that show some new migrants require more assistance.
Native English speakers and non-English migrants with very good English proficiency are thriving in the labour market. Yet the gap between those who can and those who cannot speak English well is growing as the economy prioritises skilled work and high tech service industries.
New permanent migrants are more highly educated than both their migrant predecessors and the average Australian. But the earnings for new permanent migrants as they become more educated is not in line with labour market norms, an outcome that indicates a structural skills mismatch.
Perhaps of most concern, there is also failure in relation to gender participation. A growing gender disparity across income, employment and education points to an area requiring attention sooner rather than later. At a time when Australia has led the call to increase female participation rates, the structure and nature of our migration program and settlement support services mean migration is reducing not increasing female participation and income levels to Australia.
Keeping these labour market outcomes in mind when looking to the future, policy makers can better inform their actions. As the economy continues to shift, Australia’s migration framework will also need to be recalibrated. Ensuring all permanent migrants are included in this journey is a worthy goal.
CONCLUSION

REFERENCES
Australian Bureau of Statistics 2014, “Microdata: Australian Census and Migrants Integrated Dataset, 2011”, cat. No. 3417.0.55.001, ABS, Canberra, February
Chiswick, Barry R., and Paul W. Miller. “The endogeneity between language and earnings: International analyses.” Journal of labor economics (1995): 246-288.
Chiswick, Barry R., Yew Liang Lee, and Paul W. Miller. “Immigrant earnings: a longitudinal analysis.” Review of Income and Wealth 51.4 (2005): 485-503.
Chiswick, Barry R., and Paul W. Miller. “Why is the payoff to schooling smaller for immigrants?” Labour Economics 15.6 (2008): 1317-1340.
Chiswick, Barry R., and Paul W. Miller. “International migration and the economics of language.” Handbook of the Economics of International Migration, 1A: The Immigrants (2014): 211.
Department of Immigration and Border Protection, “Total permanent visas granted, by location and migration stream”, data request to Department, provided November 2014
Green, Colin, Parvinder Kler, and Gareth Leeves. “Immigrant overeducation: Evidence from recent arrivals to Australia.” Economics of Education Review26.4 (2007): 420-432.
Lindley, J and Lenton P, “The Over-Education of UK Immigrants: Evidence from the Labour Force Survey”, Sheffield Economic Research Paper Series 2006001,
Mares, Peter, “Graduate visas may yet prove controversial”, The Age, April 4 2013, www.theage.com.au/comment/graduate-visas-may-yet-prove-controversial-20130403-2h706.html
Smith, David and Therese Smith, Department of Immigration and Border Protection, “Using Linking to Sharpen Policy-Thinking: Early Findings from the Australian Census and Migrants Integrated Database”, Australian Economic Review, 47(2), 2014
25
Mig
ratio
n in
Foc
us