Embed Size (px)
Citation preview

Migration Behavior of Adult Pacific Lamprey in the Lower Columbia River and
Evaluation of Bonneville Dam Modifications to Improve Passage, 2002.
Mary L. Moser
Fish Ecology Division, Northwest Fisheries Science Center
National Marine Fisheries Service
National Oceanic and Atmospheric Administration
2725 Montlake Boulevard East
Seattle, WA 98112
Darren A. Ogden
Pacific States Marine Fisheries Commission
45 S.E. 82nd Drive, Suite 100
Gladstone, OR 97027-2522
Christopher A. Peery
Idaho Cooperative Fish and Wildlife Research Unit
U.S. Geological Survey, University of Idaho
Moscow, ID 83843
Report of research to
Portland District
North Pacific Division
U.S. Army Corps of Engineers
P.O. Box 2946
Portland OR 9720-2946
Contract E96950021
March 2005

ii

iii
EXECUTIVE SUMMARY
Adult Pacific lamprey (Lampetra tridentata) encounter various obstacles to
upstream migration at lower Columbia River hydropower dams. In particular,
radiotelemetry studies indicate that lamprey have the greatest difficulty negotiating
fishway entrances, collection channels, transition areas, and areas at the top of fishways.
In 2002, we continued a study to evaluate the areas at dams where lamprey passage could
be improved. Specific objectives of our research were to:
1) Evaluate passage efficiency of radio-tagged adult Pacific lamprey at Bonneville, The
Dalles, and John Day Dams on the lower Columbia River.
2) Evaluate effects of structural and operational modifications on passage of adult
lamprey at the lower Columbia River dams.
3) Determine fates of radio-tagged adult lamprey that do not pass Bonneville Dam.
4) Develop and evaluate a structure to pass adult lamprey from makeup water channels
to the forebay at Bonneville Dam.
We radio-tagged 201 adult lamprey (101 with a 4.5-g transmitter and 100 with a
7.7-g transmitter) and released them approximately 3 km downstream from Bonneville
Dam. Ninety-six percent of the radio-tagged lamprey were detected at Bonneville Dam
and the median time from release to first detection at the dam was 4.5 d.
Passage efficiency at Bonneville Dam in 2002 (48%) was slightly higher than in
2001 (46%) and 2000 (47%). As in 2001, more lamprey initially approached fishway
entrances at Powerhouse 2 (PH2) than at the spillway or Powerhouse 1 (PH1). In
addition, median passage time (the time from first detection outside a fishway entrance to
the last detection at the fishway exit) was substantially longer in 2002 (9 d) than in
1997-2001 (4-6 d). We conclude that the delay exhibited in 2002 was probably due in
part to higher lamprey use of PH2 fishways.
While rounding the edges at the spillway entrance bulkheads improved lamprey
entrance efficiency, addition of attachment plates in the PH2 transition area produced
equivocal results. Lamprey passage efficiency through the PH2 transition area decreased
relative to 2001 (the first year that attachment plates were added). Orifice gates at PH1
were open in 2002, and lamprey passage efficiency through this area was lower than in

iv
2000 and 2001 (when orifice gates were periodically closed). This result provides some
indication that closing orifice gates may help to retain lamprey in PH1 collection channels
by reducing the number that exit the PH1 collection channel via the orifice gates.
As in previous years, lamprey were delayed and/or obstructed by the serpentine
weir sections at the tops of both fish ladders at Bonneville Dam. However, tests of two
prototype bypass structures in the adjacent makeup water channel (MWC) at Bradford
Island indicated that it may be possible to provide passage for up to 50 lamprey/night or
18% of those in the MWC. While MWC bypass structures showed promise, further
refinement is needed to improve lamprey collection.

v
CONTENTS
EXECUTIVE SUMMARY . . . . . . . . . . . . . . . . . . . . . . . . . . . . . . . . . . . . . . . . . . . . . . . iii
INTRODUCTION . . . . . . . . . . . . . . . . . . . . . . . . . . . . . . . . . . . . . . . . . . . . . . . . . . . . . . . 1
METHODS . . . . . . . . . . . . . . . . . . . . . . . . . . . . . . . . . . . . . . . . . . . . . . . . . . . . . . . . . . . . 3
Study Area . . . . . . . . . . . . . . . . . . . . . . . . . . . . . . . . . . . . . . . . . . . . . . . . . . . . . . . 3
Tagging and Tracking . . . . . . . . . . . . . . . . . . . . . . . . . . . . . . . . . . . . . . . . . . . . . 11
Bypass Structure Development and Testing . . . . . . . . . . . . . . . . . . . . . . . . . . . . 14
RESULTS . . . . . . . . . . . . . . . . . . . . . . . . . . . . . . . . . . . . . . . . . . . . . . . . . . . . . . . . . . . . 19
Trapping and Tagging . . . . . . . . . . . . . . . . . . . . . . . . . . . . . . . . . . . . . . . . . . . . . 19
Bonneville Dam . . . . . . . . . . . . . . . . . . . . . . . . . . . . . . . . . . . . . . . . . . . . . . . . . . 25
The Dalles Dam . . . . . . . . . . . . . . . . . . . . . . . . . . . . . . . . . . . . . . . . . . . . . . . . . . 39
John Day Dam . . . . . . . . . . . . . . . . . . . . . . . . . . . . . . . . . . . . . . . . . . . . . . . . . . . 42
Overall Passage Patterns . . . . . . . . . . . . . . . . . . . . . . . . . . . . . . . . . . . . . . . . . . . 44
Tributary Use and Seasonal Distribution . . . . . . . . . . . . . . . . . . . . . . . . . . . . . . . 46
Bypass Evaluation . . . . . . . . . . . . . . . . . . . . . . . . . . . . . . . . . . . . . . . . . . . . . . . . 50
DISCUSSION . . . . . . . . . . . . . . . . . . . . . . . . . . . . . . . . . . . . . . . . . . . . . . . . . . . . . . . . . 53
ACKNOWLEDGMENTS . . . . . . . . . . . . . . . . . . . . . . . . . . . . . . . . . . . . . . . . . . . . . . . . 56
REFERENCES . . . . . . . . . . . . . . . . . . . . . . . . . . . . . . . . . . . . . . . . . . . . . . . . . . . . . . . . 57

vi

INTRODUCTION
The Pacific lamprey (Lampetra tridentata) is an anadromous, parasitic fish that
occurs along the west coast of North America from California to Alaska (Scott and
Crossman 1973). Indigenous peoples from the Pacific coast to the interior Columbia
River have harvested adult lamprey for subsistence, religious, and medicinal purposes for
many generations (Close et al. 2002). However, in recent years adult Pacific lamprey
fisheries in the Columbia River drainage have experienced dramatic declines and
unprecedented regulation (Kostow 2002).
In the Columbia River, adult lamprey undertake a free-swimming, spawning
migration into fresh water during late spring and summer. Lamprey abundance has
historically been monitored by visually counting adults as they pass counting stations in
fishways at hydropower dams. While these adult counts are not an accurate means of
estimating absolute abundance, they provide a good measure of relative abundance
patterns (Starke and Dalen 1995; Moser and Close 2003). Comparison of counts made at
dams in the lower and middle Columbia River revealed a fourfold to tenfold decrease in
yearly abundance during the past four decades (Close 2001). In addition, concerns that
lamprey are declining have resulted in a petition to list this species under the U.S.
Endangered Species Act.
Hydropower dams on the Columbia River may have contributed to declines in
lamprey abundance by restricting access to historical spawning locations. While the
distribution of lamprey spawning sites in upriver areas prior to dam construction is not
well documented, there are historical accounts of lamprey in the headwaters of both the
Columbia and Snake Rivers (Kan 1975; Hammond 1979; Simpson and Wallace 1982).
Lamprey must pass four hydropower dams to reach the confluence of the Columbia and
Snake Rivers, and up to five additional dams to attain spawning areas in the upper
reaches of these rivers. Our previous radiotelemetry studies determined that lamprey
passage at lower Columbia River dams is poor relative to that of salmonids. For
example, less than half of the radio-tagged lamprey that approached Bonneville Dam in
1997-2000 were able to successfully pass upstream (Moser et al. 2002b), whereas passage
efficiency for salmonids during this period was typically greater than 90% (Bjornn et al.
2000a,b).
In previous studies, we identified specific obstacles to adult Pacific lamprey
passage within the fishways at Bonneville, The Dalles, and John Day Dams using
radiotelemetry. Over the past decade an extensive array of fixed-site radio receivers and
antennas has been installed on and around these dams to assess adult salmonid passage at
discrete areas in each fishway (Moser et al. 2002a). We used this receiver array to

2
document passage success of radio-tagged lamprey at each area. Lamprey were
obstructed or delayed at fishway entrances, collection/transition areas at the bottom of the
fishways, and count station areas at the top of the fishways (Moser et al. 2002b). In
contrast, lamprey exhibited relatively rapid and successful passage through the pool and
weir sections of the fishways where they were exposed to rapid currents.
The goal of our research in 2002 was to assess lamprey passage and the efficacy
of actions taken to improve passage at Bonneville Dam, the first mainstem dam that adult
lamprey encounter on their spawning migration in the Columbia River. Specific
objectives were:
1) Evaluate passage efficiency of radio-tagged adult Pacific lamprey at Bonneville, The
Dalles, and John Day Dams on the lower Columbia River.
2) Evaluate effects of structural (rounding entrance bulkheads and adding plates over
diffuser grating) and operational (orifice gate closure) modifications on passage of
adult lamprey at lower Columbia River dams.
3) Determine fates of radio-tagged adult lamprey that do not pass Bonneville Dam.
4) Develop and evaluate a structure to enable adult lamprey to pass from makeup water
channels to the forebay at Bonneville Dam.
3
METHODS
Study Area
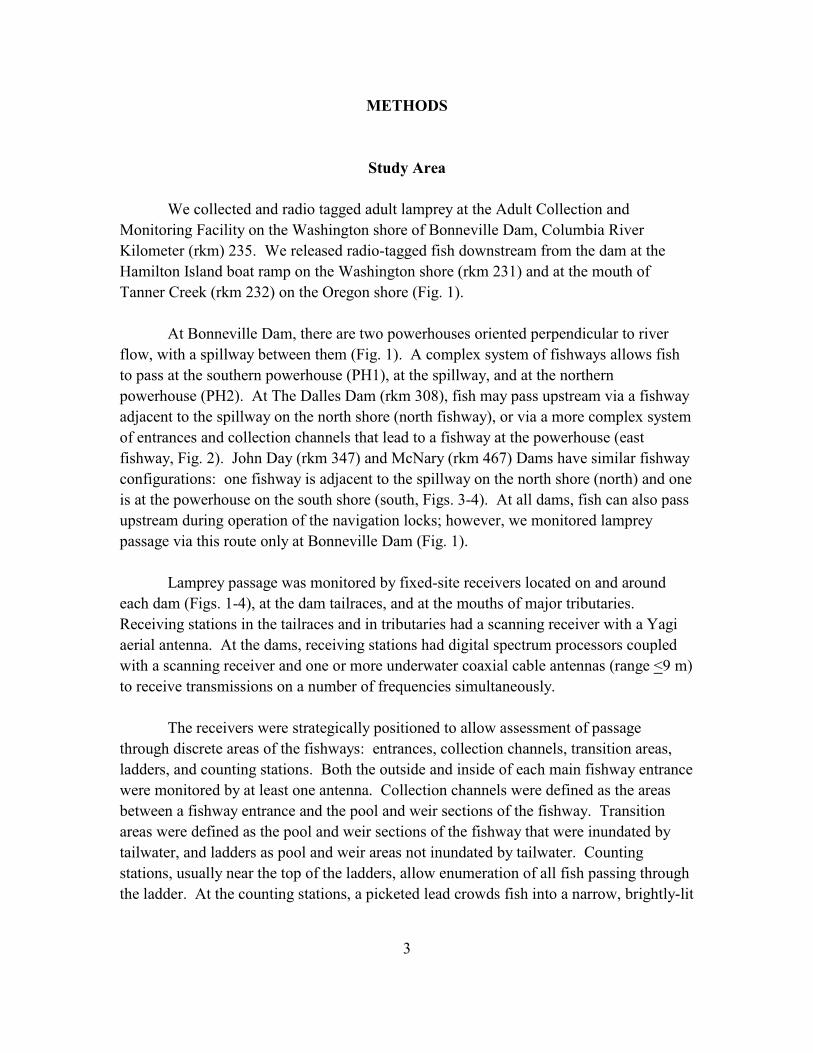
We collected and radio tagged adult lamprey at the Adult Collection and
Monitoring Facility on the Washington shore of Bonneville Dam, Columbia River
Kilometer (rkm) 235. We released radio-tagged fish downstream from the dam at the
Hamilton Island boat ramp on the Washington shore (rkm 231) and at the mouth of
Tanner Creek (rkm 232) on the Oregon shore (Fig. 1).
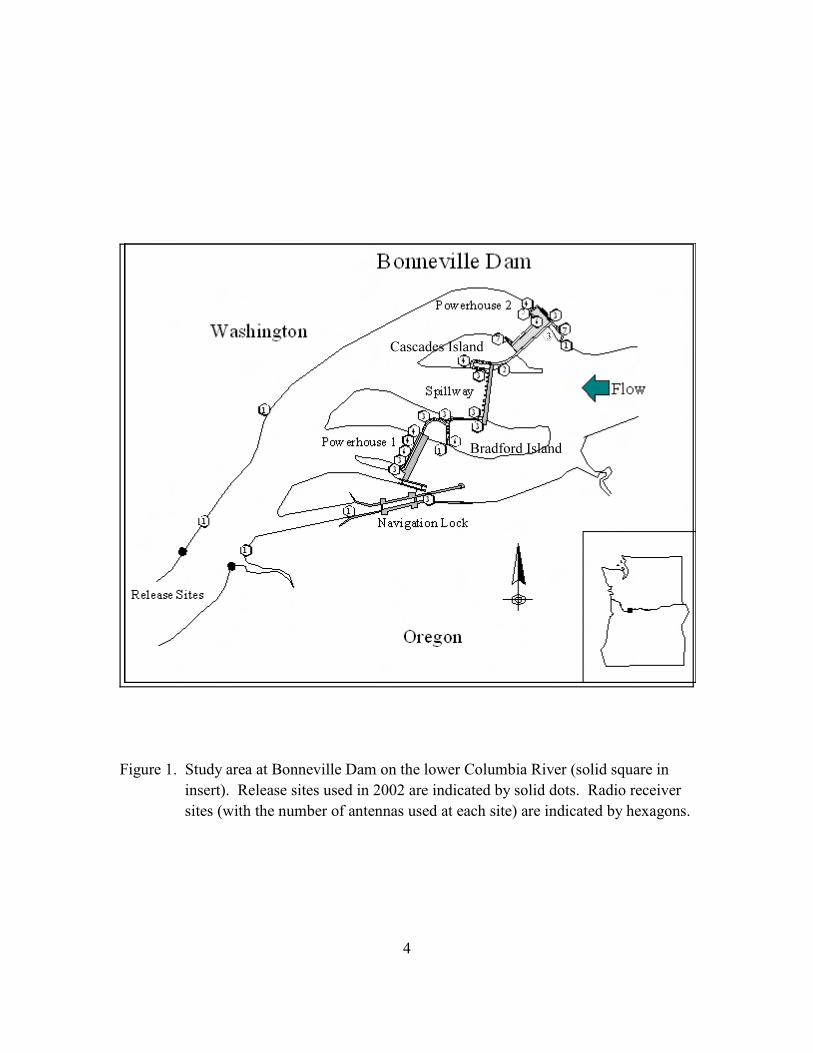
At Bonneville Dam, there are two powerhouses oriented perpendicular to river
flow, with a spillway between them (Fig. 1). A complex system of fishways allows fish
to pass at the southern powerhouse (PH1), at the spillway, and at the northern
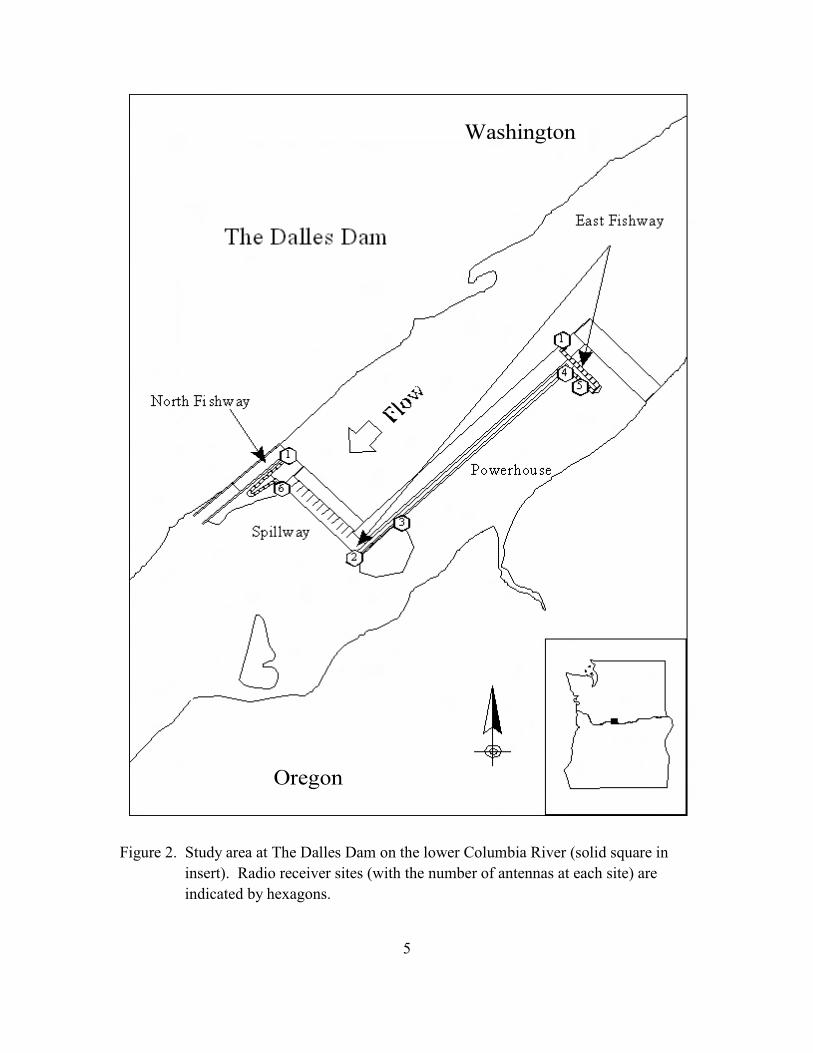
powerhouse (PH2). At The Dalles Dam (rkm 308), fish may pass upstream via a fishway
adjacent to the spillway on the north shore (north fishway), or via a more complex system
of entrances and collection channels that lead to a fishway at the powerhouse (east
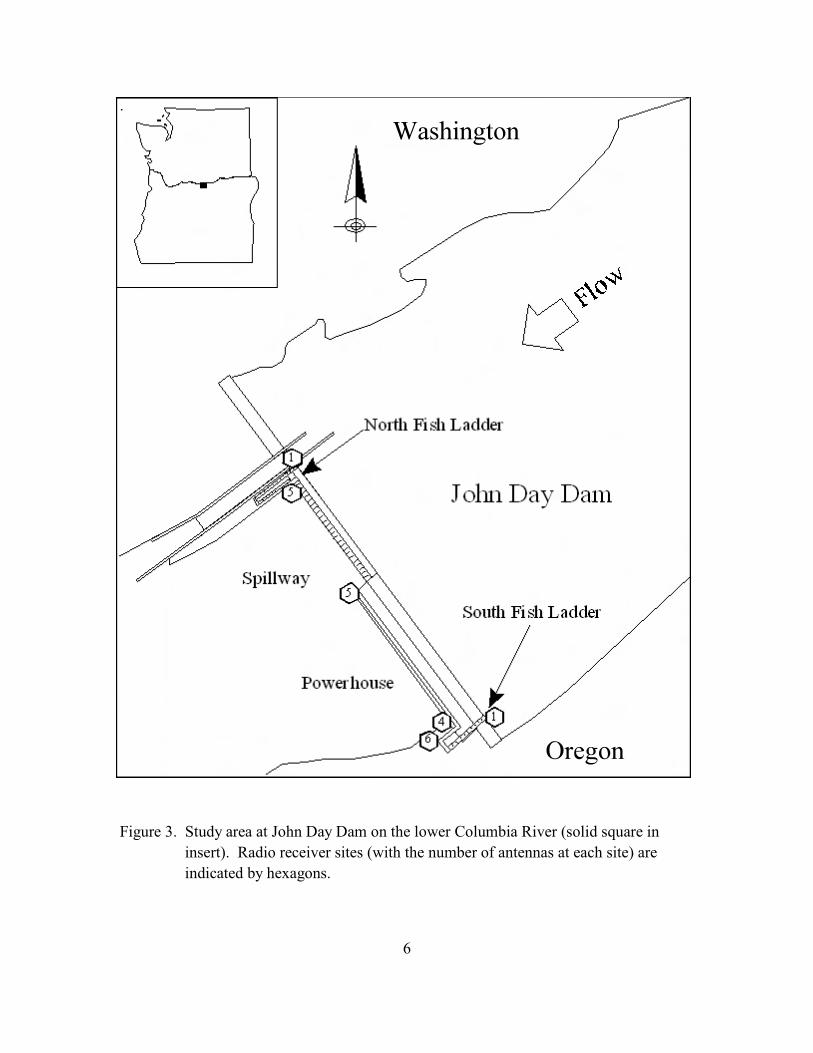
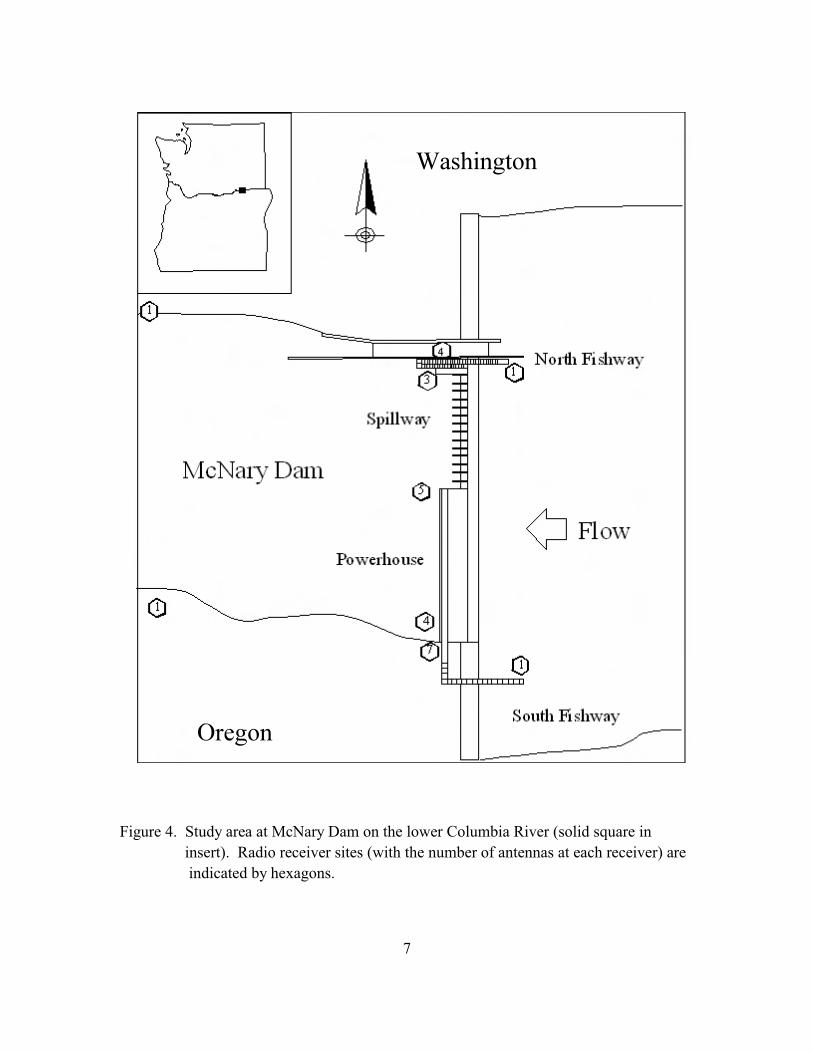
fishway, Fig. 2). John Day (rkm 347) and McNary (rkm 467) Dams have similar fishway
configurations: one fishway is adjacent to the spillway on the north shore (north) and one
is at the powerhouse on the south shore (south, Figs. 3-4). At all dams, fish can also pass
upstream during operation of the navigation locks; however, we monitored lamprey
passage via this route only at Bonneville Dam (Fig. 1).
Lamprey passage was monitored by fixed-site receivers located on and around
each dam (Figs. 1-4), at the dam tailraces, and at the mouths of major tributaries.
Receiving stations in the tailraces and in tributaries had a scanning receiver with a Yagi
aerial antenna. At the dams, receiving stations had digital spectrum processors coupled
with a scanning receiver and one or more underwater coaxial cable antennas (range <9 m)
to receive transmissions on a number of frequencies simultaneously.
The receivers were strategically positioned to allow assessment of passage
through discrete areas of the fishways: entrances, collection channels, transition areas,
ladders, and counting stations. Both the outside and inside of each main fishway entrance
were monitored by at least one antenna. Collection channels were defined as the areas
between a fishway entrance and the pool and weir sections of the fishway. Transition
areas were defined as the pool and weir sections of the fishway that were inundated by
tailwater, and ladders as pool and weir areas not inundated by tailwater. Counting
stations, usually near the top of the ladders, allow enumeration of all fish passing through
the ladder. At the counting stations, a picketed lead crowds fish into a narrow, brightly-lit
4
Figure 1. Study area at Bonneville Dam on the lower Columbia River (solid square in
insert). Release sites used in 2002 are indicated by solid dots. Radio receiver
sites (with the number of antennas used at each site) are indicated by hexagons.
5
Figure 2. Study area at The Dalles Dam on the lower Columbia River (solid square in
insert). Radio receiver sites (with the number of antennas at each site) are
indicated by hexagons.
6
.
Figure 3. Study area at John Day Dam on the lower Columbia River (solid square in
insert). Radio receiver sites (with the number of antennas at each site) are
indicated by hexagons.
7
Figure 4. Study area at McNary Dam on the lower Columbia River (solid square in
insert). Radio receiver sites (with the number of antennas at each receiver) are
indicated by hexagons.
8
channel which is viewed from the side through a window. Slot or overflow weirs
upstream from the window that lead to the fishway exit were also included in the
counting station area.
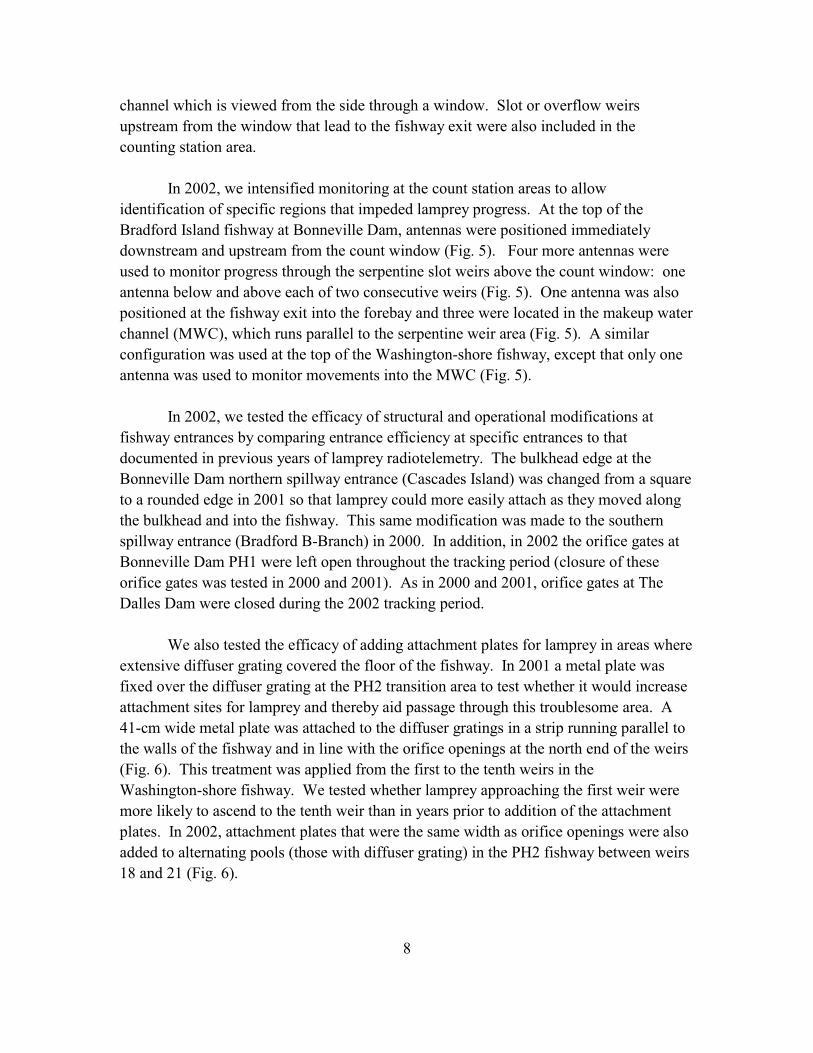
In 2002, we intensified monitoring at the count station areas to allow
identification of specific regions that impeded lamprey progress. At the top of the
Bradford Island fishway at Bonneville Dam, antennas were positioned immediately
downstream and upstream from the count window (Fig. 5). Four more antennas were
used to monitor progress through the serpentine slot weirs above the count window: one
antenna below and above each of two consecutive weirs (Fig. 5). One antenna was also
positioned at the fishway exit into the forebay and three were located in the makeup water
channel (MWC), which runs parallel to the serpentine weir area (Fig. 5). A similar
configuration was used at the top of the Washington-shore fishway, except that only one
antenna was used to monitor movements into the MWC (Fig. 5).
In 2002, we tested the efficacy of structural and operational modifications at
fishway entrances by comparing entrance efficiency at specific entrances to that
documented in previous years of lamprey radiotelemetry. The bulkhead edge at the
Bonneville Dam northern spillway entrance (Cascades Island) was changed from a square
to a rounded edge in 2001 so that lamprey could more easily attach as they moved along
the bulkhead and into the fishway. This same modification was made to the southern
spillway entrance (Bradford B-Branch) in 2000. In addition, in 2002 the orifice gates at
Bonneville Dam PH1 were left open throughout the tracking period (closure of these
orifice gates was tested in 2000 and 2001). As in 2000 and 2001, orifice gates at The
Dalles Dam were closed during the 2002 tracking period.
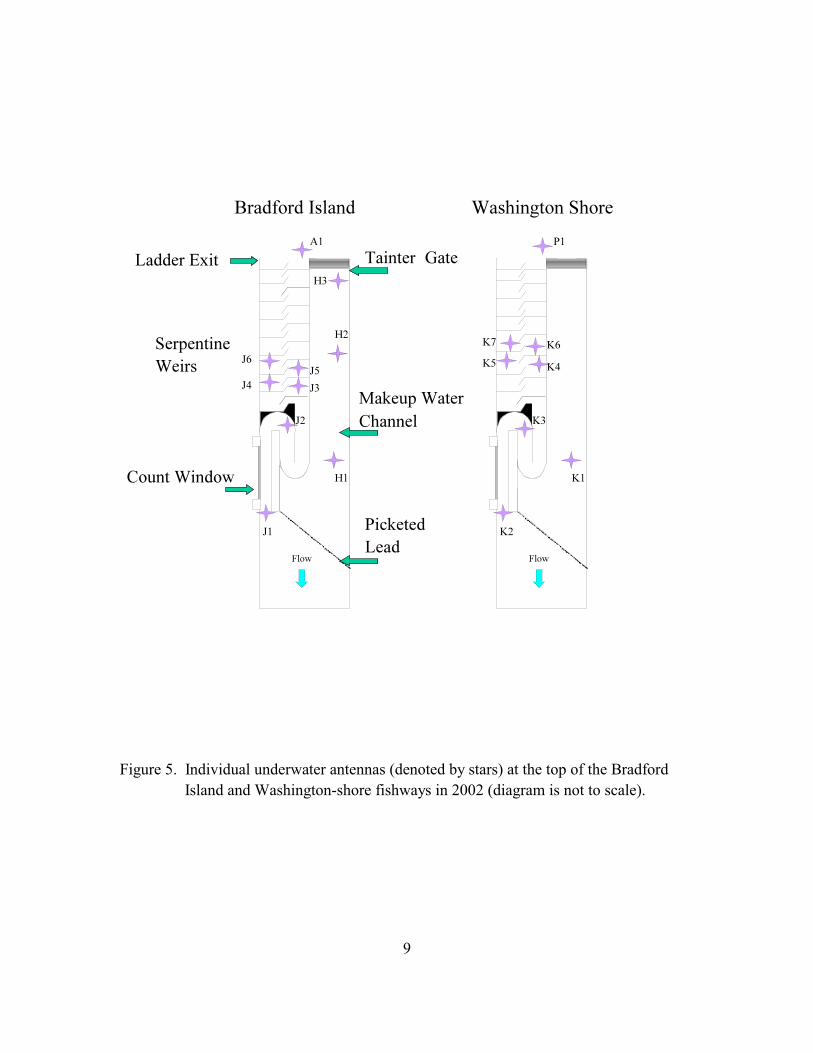
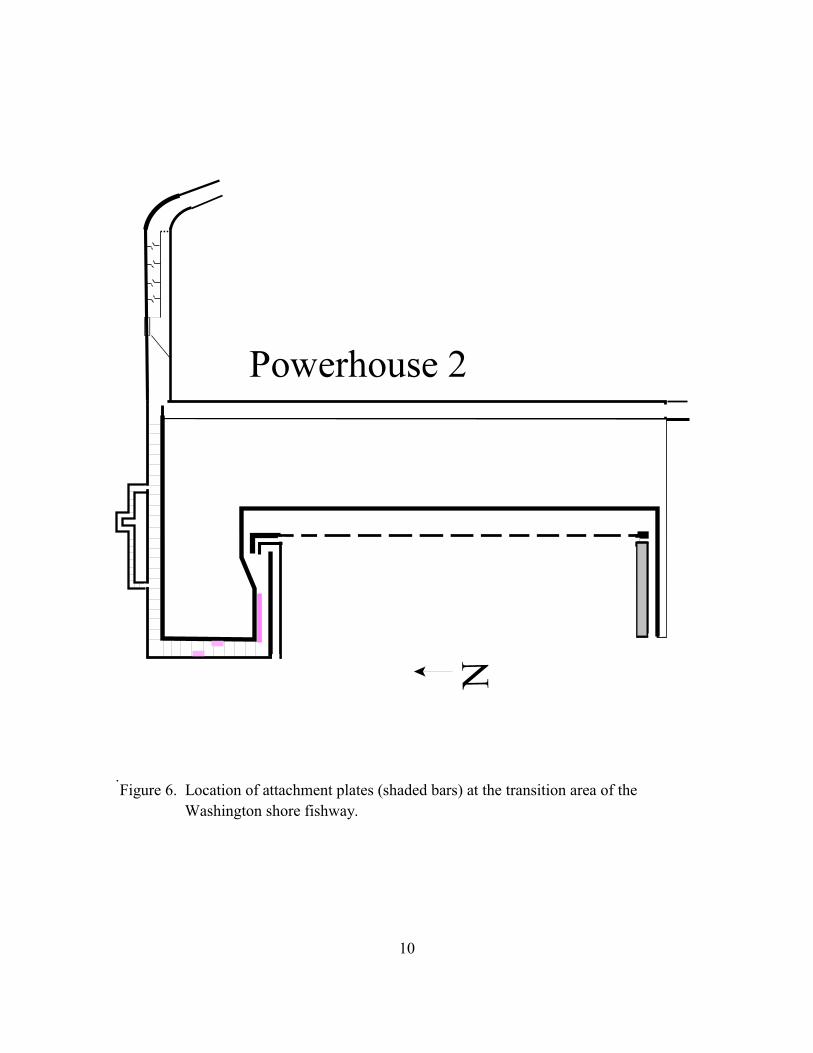
We also tested the efficacy of adding attachment plates for lamprey in areas where
extensive diffuser grating covered the floor of the fishway. In 2001 a metal plate was
fixed over the diffuser grating at the PH2 transition area to test whether it would increase
attachment sites for lamprey and thereby aid passage through this troublesome area. A
41-cm wide metal plate was attached to the diffuser gratings in a strip running parallel to
the walls of the fishway and in line with the orifice openings at the north end of the weirs
(Fig. 6). This treatment was applied from the first to the tenth weirs in the
Washington-shore fishway. We tested whether lamprey approaching the first weir were
more likely to ascend to the tenth weir than in years prior to addition of the attachment
plates. In 2002, attachment plates that were the same width as orifice openings were also
added to alternating pools (those with diffuser grating) in the PH2 fishway between weirs
18 and 21 (Fig. 6).
9
Figure 5. Individual underwater antennas (denoted by stars) at the top of the Bradford
Island and Washington-shore fishways in 2002 (diagram is not to scale).
10
.Figure 6. Location of attachment plates (shaded bars) at the transition area of the
Washington shore fishway.

11
Finally, in 2002 we designed, built, and tested two bypass structures to collect
lamprey from the Bradford Island MWC. If successful, these structures would be
extended to allow lamprey passage directly from the MWC into the forebay of Bonneville
Dam. Bypass structures were deployed on the west wall at the upstream end of the
MWC. Guides were put in place during winter dewatering and were positioned so that
the entrance to the bypass structures could be located either 8 or 15 m downstream from
the Tainter gate (i.e., the entire bypass device could be oriented either in the same
direction as flow or in the opposite direction).
Tagging and Tracking
We captured lamprey during the night in a trap at the Adult Fish Collection and
Monitoring Facility on the Washington shore at Bonneville Dam (Ocker et al. 2001).
Lamprey were anaesthetized, measured (length and girth to the nearest mm) and weighed
(nearest g). A radio transmitter representing less than 0.7% of the fish body weight was
then surgically implanted into the body cavity of each fish. We used either 7.7-g
(3.7-g in water), or 4.5-g (2.9-g in water) radio transmitters (hereafter referred to as large
and small). All transmitters were uniquely coded to allow identification of individual
fish. The battery life was 7 months for large transmitters and 12 months for small
transmitters.
Fish to be tagged were anaesthetized and transferred to a surgery cradle partly
submerged in a 16-L bath of 60 ppm clove oil solution. Surgical tools and tags were
sanitized in a solution of zephiran chloride and rinsed in a freshwater bath. A 3-cm
incision was made approximately 1 cm off the ventral midline using a 3-mm fixed-depth
disposable scalpel, with the posterior end of the incision ending in line with the anterior
insertion of the first dorsal fin. The tag was inserted into the body cavity, and the antenna
was threaded through the body wall approximately 3 cm posterior to the incision using a
cannula. The incision was closed with a 19-mm needle and three to five simple,
interrupted stitches of 3-0 absorbable surgical suture. After closing, a hypodermic needle
was inserted into the incision, and the wound was irrigated with 0.75 cc of
oxytetracycline and coated with an antibiotic ointment as a prophylactic measure.
In addition to the surgery to implant transmitters, we also collected a blood
sample from some of the lamprey prior to tag insertion. A heparinized 1-mL disposable
syringe with a 23-gauge needle was used to draw 1 mL from the caudal vasculature at a
position approximately 2 cm posterior to the vent. The blood was slowly discharged into
a 2-mL heparinized centrifuge tube and placed on ice. Within an hour of taking the
12
blood, the samples were centrifuged at 3000 rpm for 3-5 min and the plasma was
transferred to pre-labeled tubes and saved at -80°C. These samples were then transported
to the U.S. Geological Survey, Columbia River Research Laboratory in Cook,
Washington where they were stored for later sex steroid analysis (Mesa et al. 2003).
After surgery, the lamprey were allowed to recover in an aerated tank for approximately
2 h prior to release.
Radio-tagged lamprey were detected via mobile tracking (using a portable
receiver from a vehicle or vessel) and fixed-site receiving stations (Figs. 1-4). Data from
fixed-site receivers were downloaded every 1-2 weeks and processed following protocols
detailed in Moser et al. (2002a). For each area of interest (entrances, collection channels,
transition areas, ladders, and counting stations) we determined the number of lamprey
that approached an area and the proportion that successfully passed through that area
(passage efficiency). Lamprey moved both upstream and downstream in the fishways
(Matter et al. 2000). For analysis, we determined the farthest upstream position attained
by each fish, even if it required several attempts to reach this position.
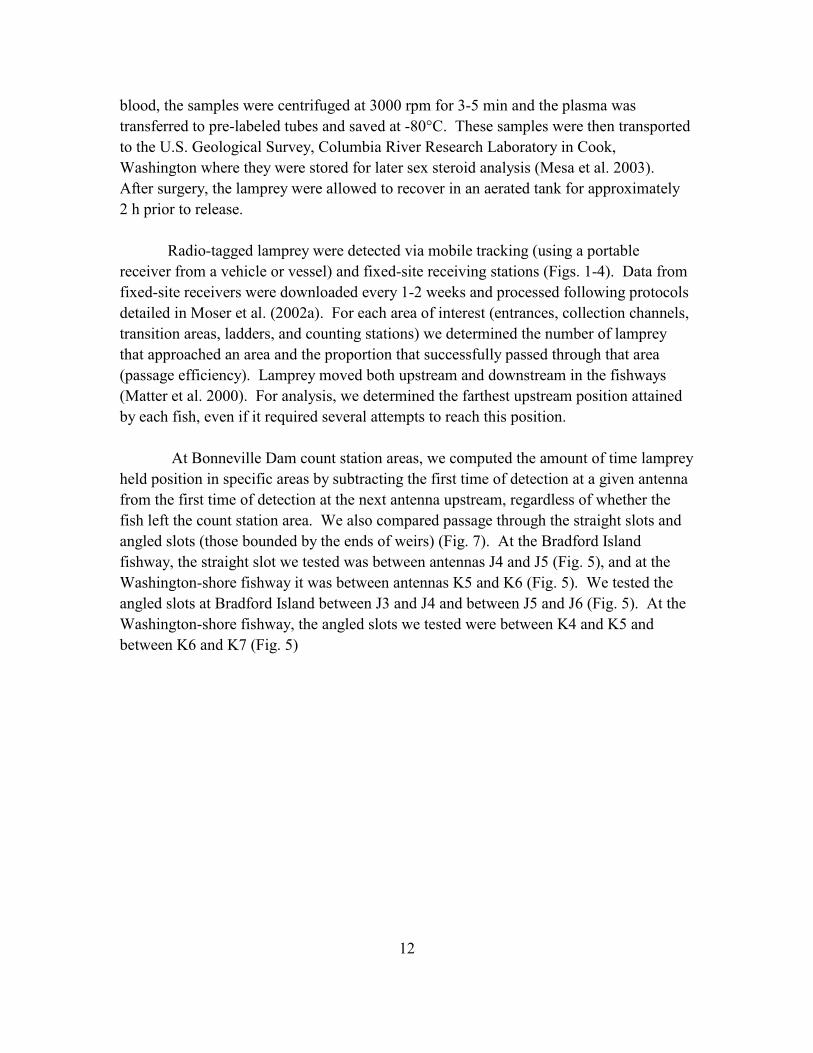
At Bonneville Dam count station areas, we computed the amount of time lamprey
held position in specific areas by subtracting the first time of detection at a given antenna
from the first time of detection at the next antenna upstream, regardless of whether the
fish left the count station area. We also compared passage through the straight slots and
angled slots (those bounded by the ends of weirs) (Fig. 7). At the Bradford Island
fishway, the straight slot we tested was between antennas J4 and J5 (Fig. 5), and at the
Washington-shore fishway it was between antennas K5 and K6 (Fig. 5). We tested the
angled slots at Bradford Island between J3 and J4 and between J5 and J6 (Fig. 5). At the
Washington-shore fishway, the angled slots we tested were between K4 and K5 and
between K6 and K7 (Fig. 5)
13
Figure 7. Photo of serpentine weirs (angled slot on left and straight slot on right) taken
when the fishway was dewatered.
14
Bypass Structure Development and Testing
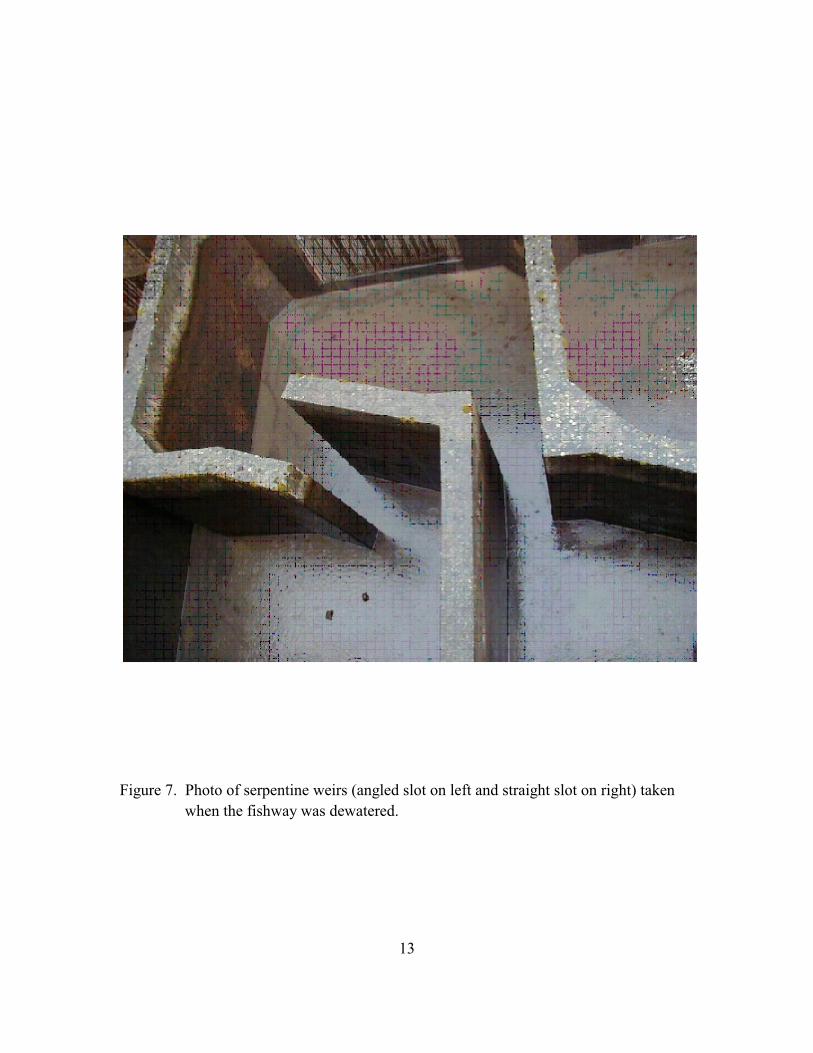
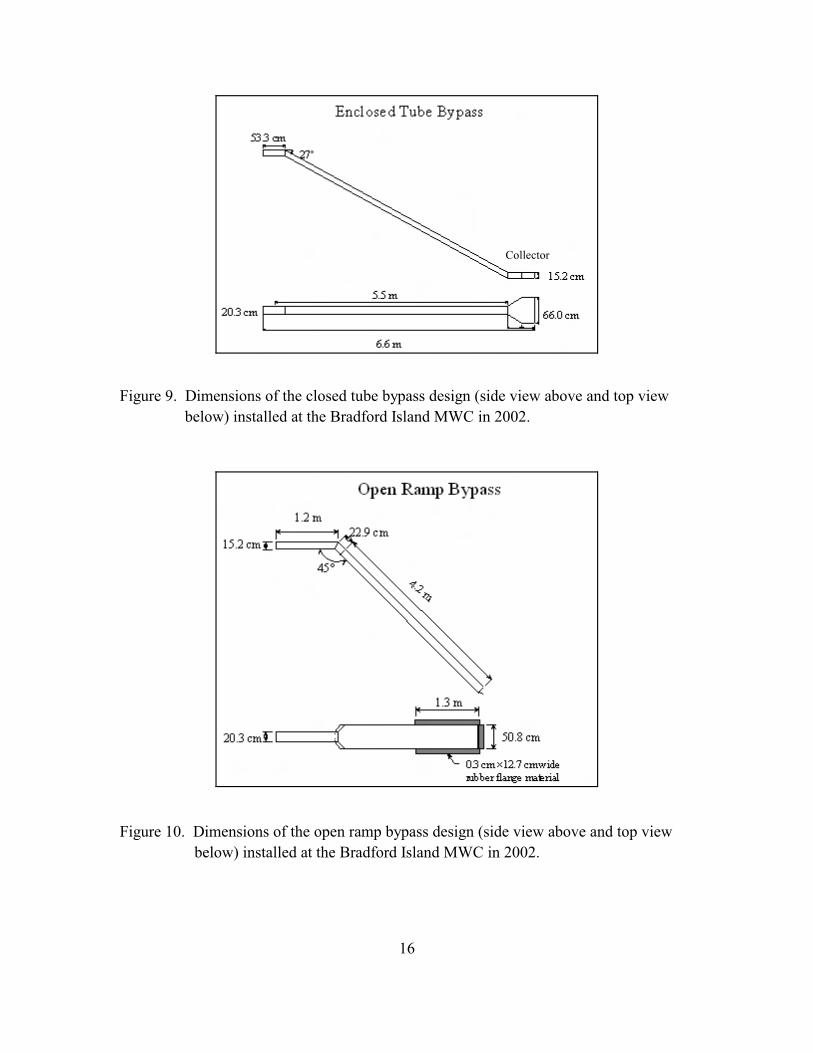
We designed, built, and tested two different bypass prototypes in 2002 (Fig. 8).
The first featured a closed rectangular tube (15.2 cm high × 20.3 cm wide) of schedule 40
aluminum that extended from the bottom of the MWC to the trap box (an elevation of
3.2 m) at a slope of 1.4:1.0. The entire bypass was 6.6 m in length, which included a
0.7-m wide collector that rested on the bottom (Fig. 9). Ambient Columbia River water
was supplied to the trap box via a 10.2-cm diameter flexible corrugated pipe from two,
3-hp submersible pumps. Flow into the trap box was regulated to maintain a 3-cm depth
in the rectangular tube. Attraction flow could be provided at the top of the collector via a
5.1-cm diameter pipe connected to one of the 3-hp submersible pumps.
The second design incorporated an open ramp that extended from the bottom of
the MWC to the level of the trap box (3.2-m elevation). Lamprey could enter the ramp at
any depth in the water column. A heavy rubber flange was used to create a seal against
the wall and floor of the MWC and to help guide lamprey onto the ramp (Fig. 10). After
ascending the 4.4-m long ramp (at a slope of 1:1), lamprey entered a 1.2-m long
rectangular aluminum tube (15.2 cm high × 20.3 cm wide) with an open top that emptied
into the trap box (Fig. 8). Ambient Columbia River water was supplied to the trap box
via a 10.2-cm diameter flexible corrugated pipe from two, 3-hp submersible pumps.
Flow into the trap box was regulated to maintain a 3-cm depth in the rectangular tube.
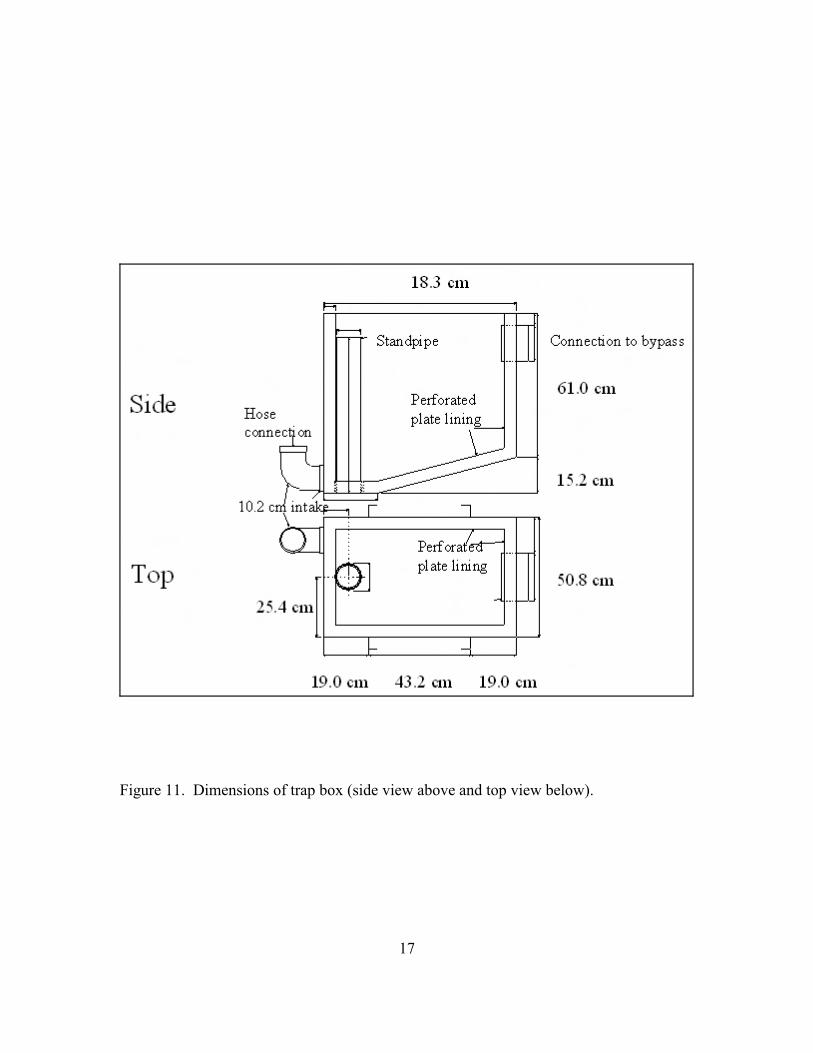
To test the efficacy of the bypass structures, we deployed a trap box at the
upstream end of each structure (Fig. 11). The trap could be retrieved and re-deployed
without moving the rest of the structure, and it was checked each morning and evening.
The time of day and number of lamprey captured were recorded for each sample, and then
the lamprey were released into the forebay of the dam. Catch per unit effort (CPUE) was
defined as the number of lamprey caught during each deployment divided by the number
of hours the trap was operating.
Mean CPUE was determined for four treatments: 1) the closed tube with attraction
flow provided at the collector, 2) the closed tube with no attraction flow, 3) the open
ramp oriented with the collector at the downstream end of the MWC, and 4) the open
ramp oriented with the collector at the upstream end of the MWC (near the Tainter gate
where lamprey tend to accumulate). The first two treatments (closed tube with and
without the attraction flow) were alternated each day. The open ramp was then tested
first oriented downstream and then oriented upstream.
15
Figure 8. Top and side views of the closed tube bypass design (upper panel) and the open
ramp bypass design (bottom panel) at the Bradford Island MWC in 2002.
16
Figure 9. Dimensions of the closed tube bypass design (side view above and top view
below) installed at the Bradford Island MWC in 2002.
Figure 10. Dimensions of the open ramp bypass design (side view above and top view
below) installed at the Bradford Island MWC in 2002.
17
Figure 11. Dimensions of trap box (side view above and top view below).

18
To test the efficiency of each structure, we also conducted a mark-recapture
experiment using lamprey collected at the Adult Fish Collection and Monitoring Facility
(described in the previous section) that were not used for radio tracking or other research.
These fish were collected each day, anaesthetized using 60 ppm clove oil, and marked
with a unique silver nitrate brand, so that their time at large could be determined. They
were then released into the Bradford Island MWC at a position immediately downstream
from the Tainter gate (Fig. 5).
The efficiency of each of the four treatments was computed by dividing the
number of marked lamprey that we recaptured by the number of marked lamprey that
were in the MWC during each treatment. During the first week of experimentation we
released 10 marked lamprey into the bypass trap to ensure that they were not able to
escape after entering the trap. All 10 marked lamprey were still in the trap the following
day.
We were also able to estimate efficiency for each treatment using the counts at the
Bradford Island counting station. Numbers of lamprey in the MWC during each
treatment were estimated by expanding counts made at the Bradford Island counting
station using results from radiotelemetry. Efficiency of each treatment was determined by
dividing the total number of fish trapped during each treatment by the estimated number
of lamprey that were in the MWC during that treatment.
19
RESULTS
Trapping and Tagging
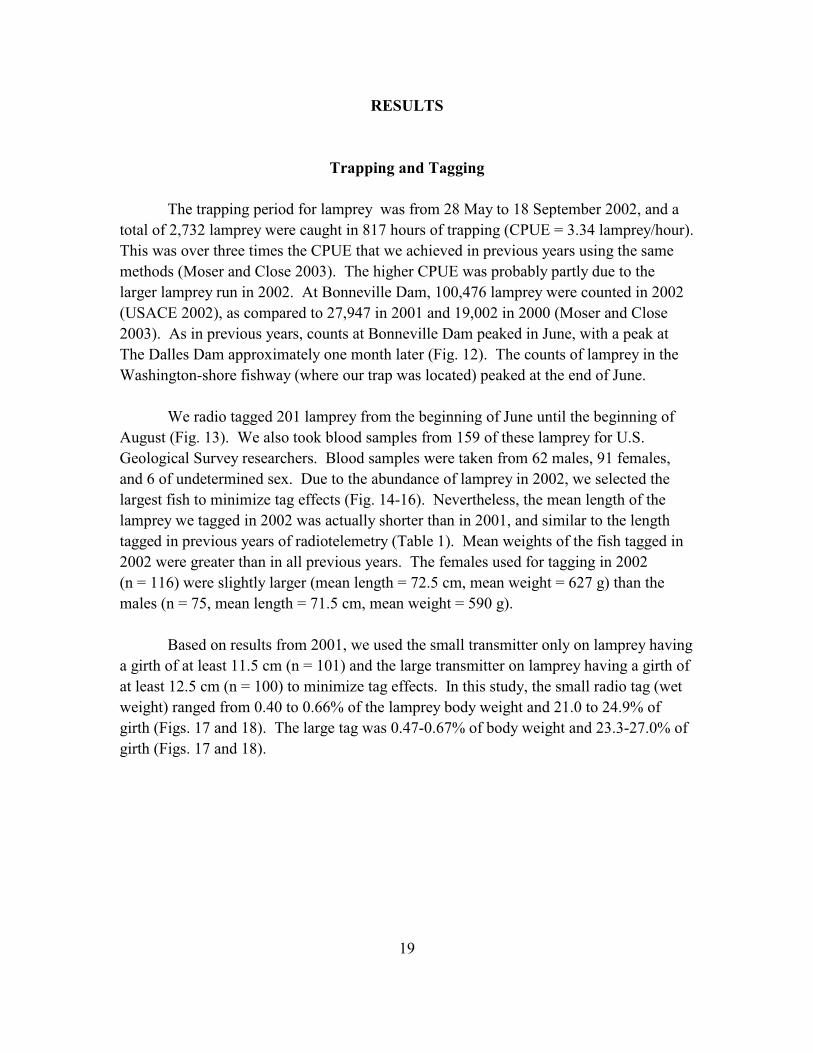
The trapping period for lamprey was from 28 May to 18 September 2002, and a
total of 2,732 lamprey were caught in 817 hours of trapping (CPUE = 3.34 lamprey/hour).
This was over three times the CPUE that we achieved in previous years using the same
methods (Moser and Close 2003). The higher CPUE was probably partly due to the
larger lamprey run in 2002. At Bonneville Dam, 100,476 lamprey were counted in 2002
(USACE 2002), as compared to 27,947 in 2001 and 19,002 in 2000 (Moser and Close
2003). As in previous years, counts at Bonneville Dam peaked in June, with a peak at
The Dalles Dam approximately one month later (Fig. 12). The counts of lamprey in the
Washington-shore fishway (where our trap was located) peaked at the end of June.
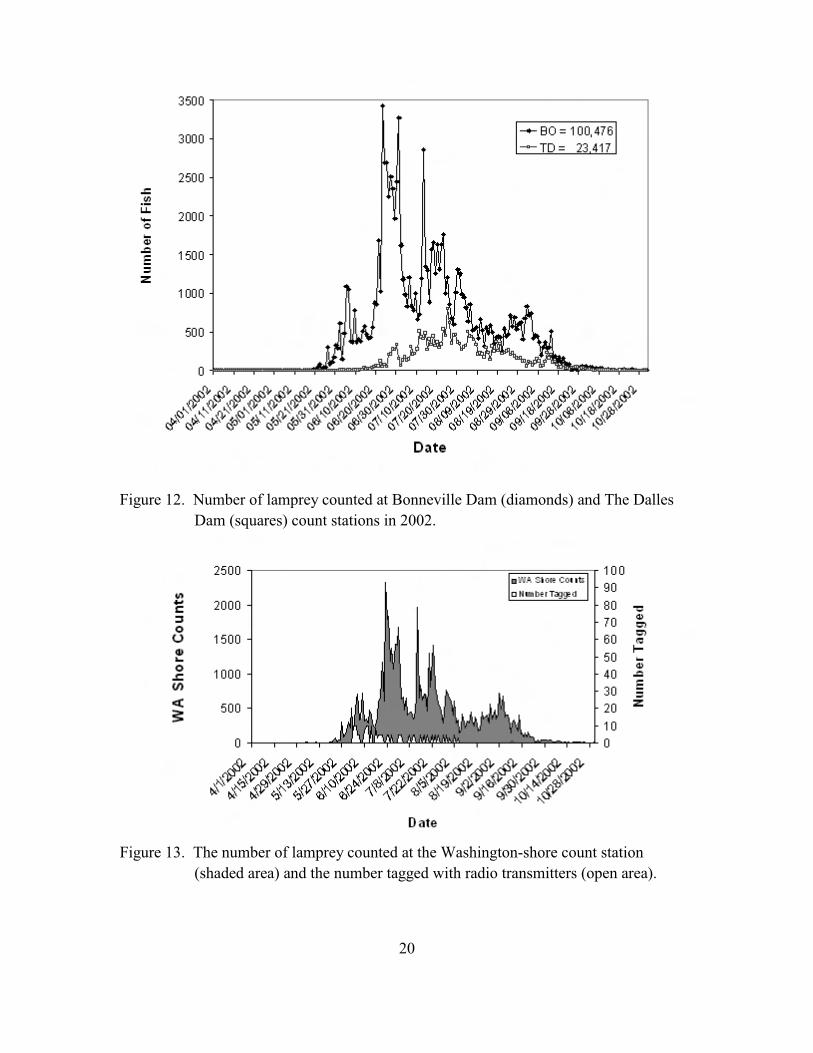
We radio tagged 201 lamprey from the beginning of June until the beginning of
August (Fig. 13). We also took blood samples from 159 of these lamprey for U.S.
Geological Survey researchers. Blood samples were taken from 62 males, 91 females,
and 6 of undetermined sex. Due to the abundance of lamprey in 2002, we selected the
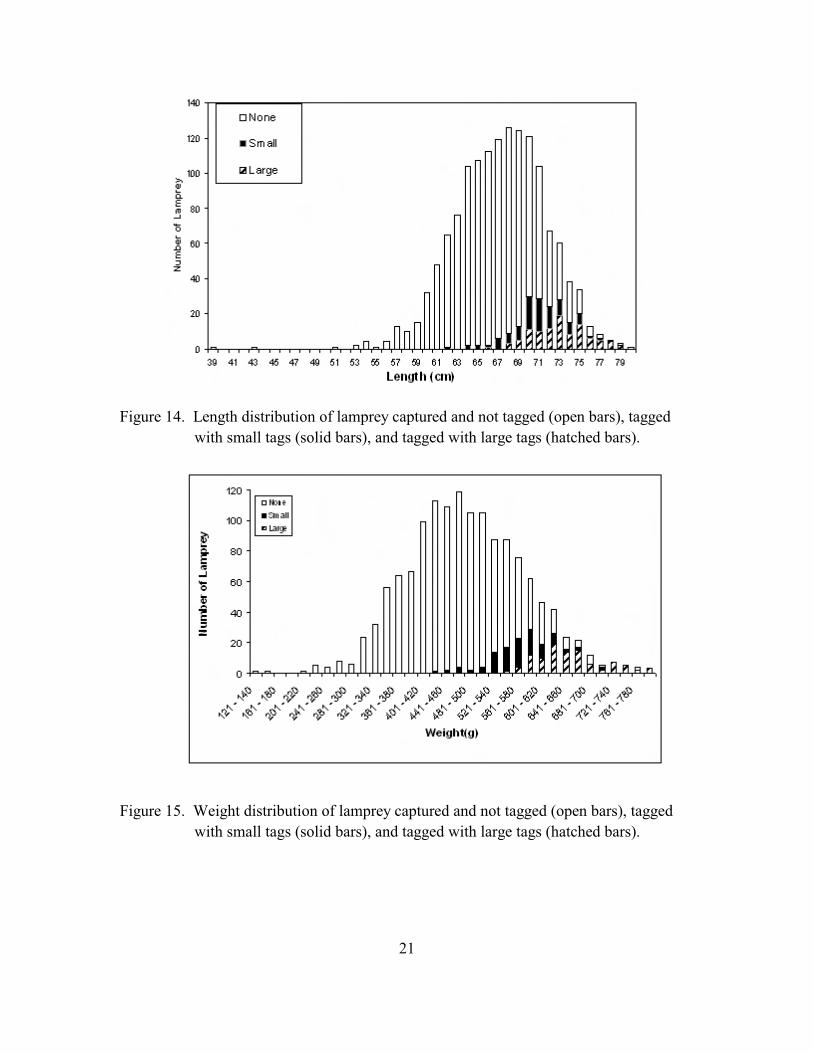
largest fish to minimize tag effects (Fig. 14-16). Nevertheless, the mean length of the
lamprey we tagged in 2002 was actually shorter than in 2001, and similar to the length
tagged in previous years of radiotelemetry (Table 1). Mean weights of the fish tagged in
2002 were greater than in all previous years. The females used for tagging in 2002
(n = 116) were slightly larger (mean length = 72.5 cm, mean weight = 627 g) than the
males (n = 75, mean length = 71.5 cm, mean weight = 590 g).
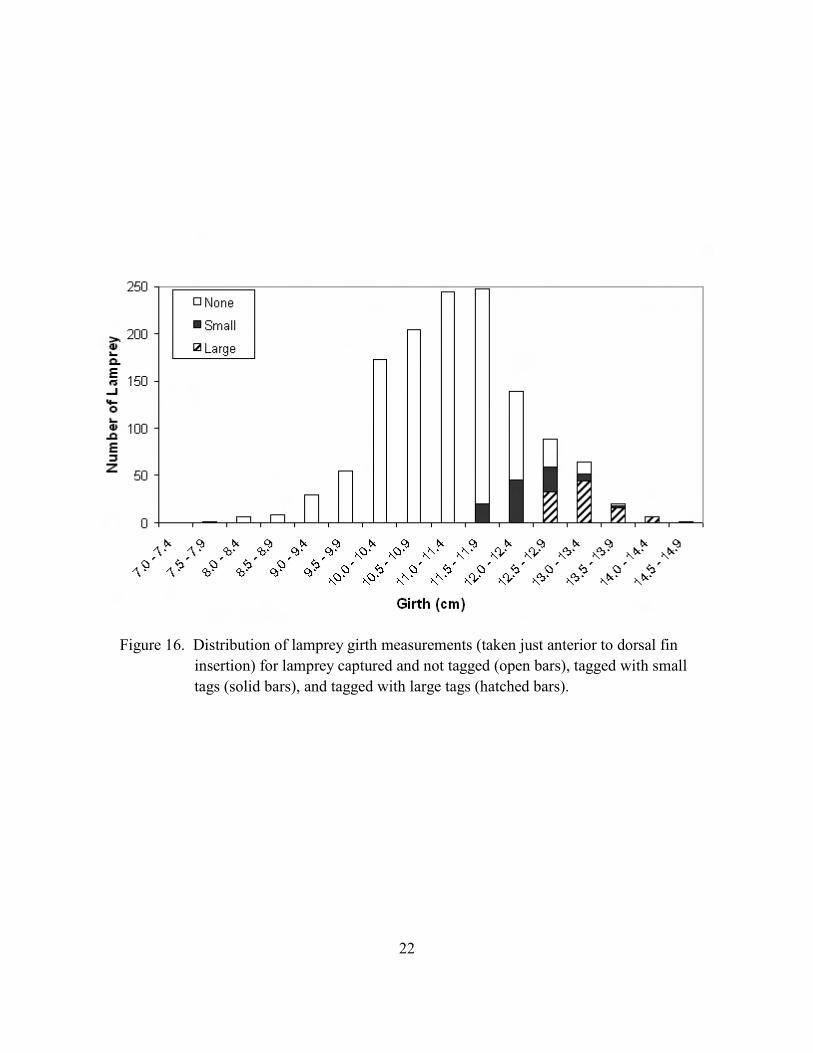
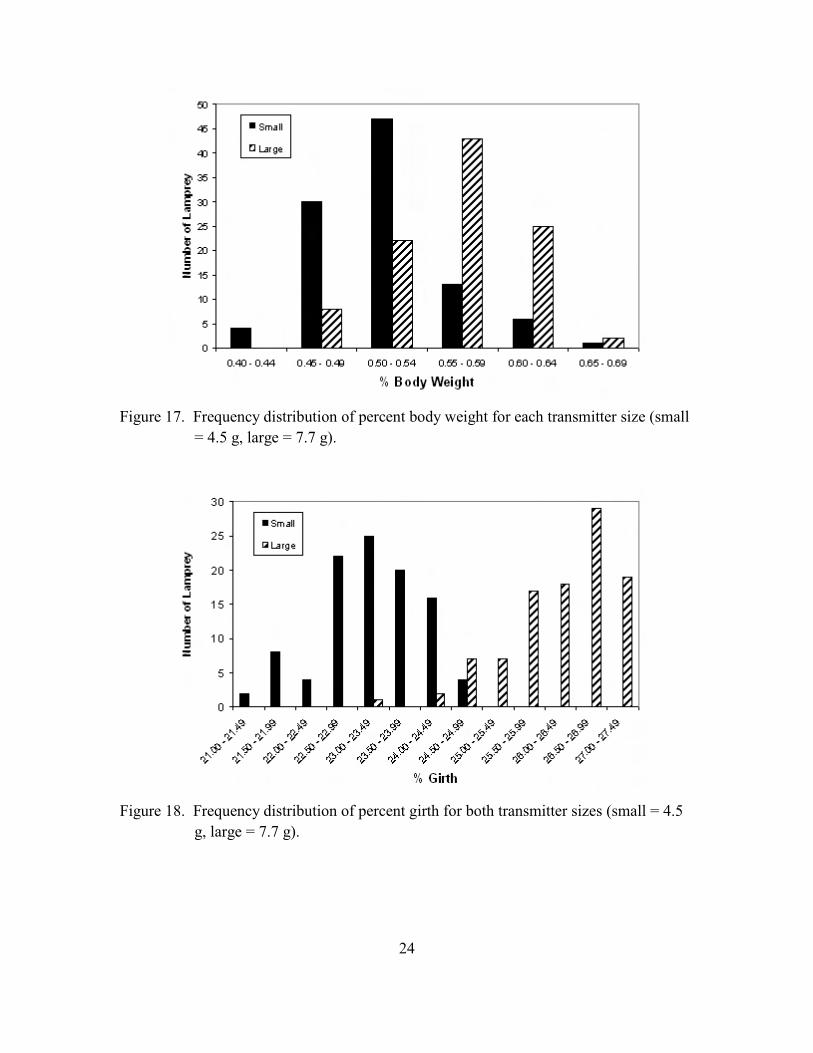
Based on results from 2001, we used the small transmitter only on lamprey having
a girth of at least 11.5 cm (n = 101) and the large transmitter on lamprey having a girth of
at least 12.5 cm (n = 100) to minimize tag effects. In this study, the small radio tag (wet
weight) ranged from 0.40 to 0.66% of the lamprey body weight and 21.0 to 24.9% of
girth (Figs. 17 and 18). The large tag was 0.47-0.67% of body weight and 23.3-27.0% of
girth (Figs. 17 and 18).
20
Figure 12. Number of lamprey counted at Bonneville Dam (diamonds) and The Dalles
Dam (squares) count stations in 2002.
Figure 13. The number of lamprey counted at the Washington-shore count station
(shaded area) and the number tagged with radio transmitters (open area).
21
Figure 14. Length distribution of lamprey captured and not tagged (open bars), tagged
with small tags (solid bars), and tagged with large tags (hatched bars).
Figure 15. Weight distribution of lamprey captured and not tagged (open bars), tagged
with small tags (solid bars), and tagged with large tags (hatched bars).
22
Figure 16. Distribution of lamprey girth measurements (taken just anterior to dorsal fin
insertion) for lamprey captured and not tagged (open bars), tagged with small
tags (solid bars), and tagged with large tags (hatched bars).
23
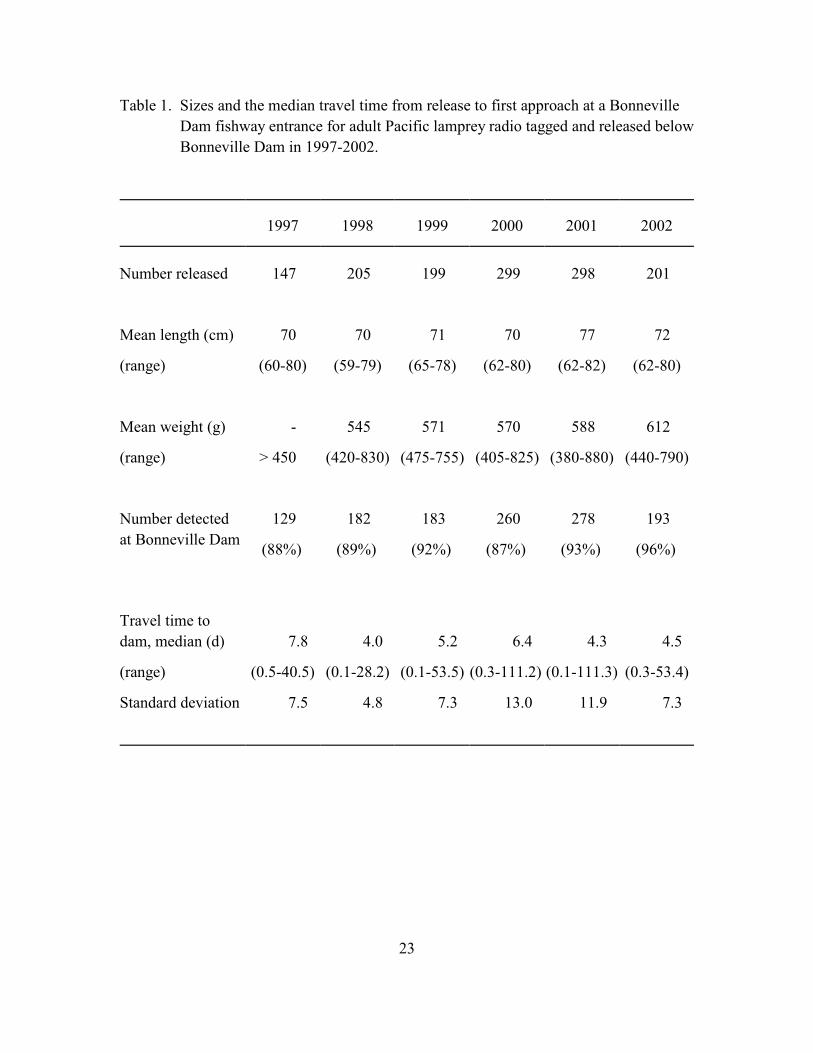
Table 1. Sizes and the median travel time from release to first approach at a Bonneville
Dam fishway entrance for adult Pacific lamprey radio tagged and released below
Bonneville Dam in 1997-2002.
1997 1998 1999 2000 2001 2002
Number released 147 205 199 299 298 201
Mean length (cm) 70 70 71 70 77 72
(range) (60-80) (59-79) (65-78) (62-80) (62-82) (62-80)
Mean weight (g) - 545 571 570 588 612
(range) > 450 (420-830) (475-755) (405-825) (380-880) (440-790)
Number detected
at Bonneville Dam
129 182 183 260 278 193
(88%) (89%) (92%) (87%) (93%) (96%)
Travel time to
dam, median (d) 7.8 4.0 5.2 6.4 4.3 4.5
(range) (0.5-40.5) (0.1-28.2) (0.1-53.5) (0.3-111.2) (0.1-111.3) (0.3-53.4)
Standard deviation 7.5 4.8 7.3 13.0 11.9 7.3
24
Figure 17. Frequency distribution of percent body weight for each transmitter size (small
= 4.5 g, large = 7.7 g).
Figure 18. Frequency distribution of percent girth for both transmitter sizes (small = 4.5
g, large = 7.7 g).
25
Bonneville Dam
We released all 201 lamprey below Bonneville Dam: 112 near the Washington
shore and 89 near the Oregon shore. Ninety-six percent (n = 193) of these fish were later
detected at Bonneville Dam fishway entrances, the highest percentage that have returned
to the dam after release among all years we have studied lamprey migration
(range = 87-96%, Table 1). Median time from release to first detection at the Bonneville
Dam fishway entrances was 4.5 d and was similar to or lower than other years of study
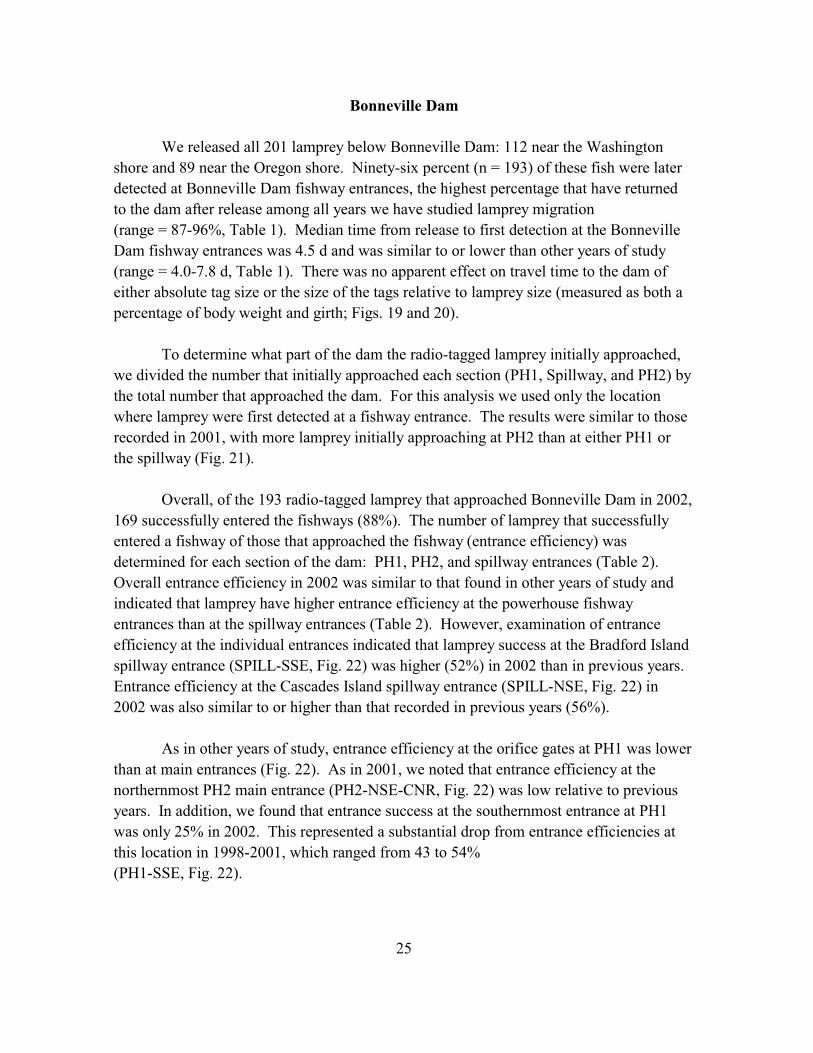
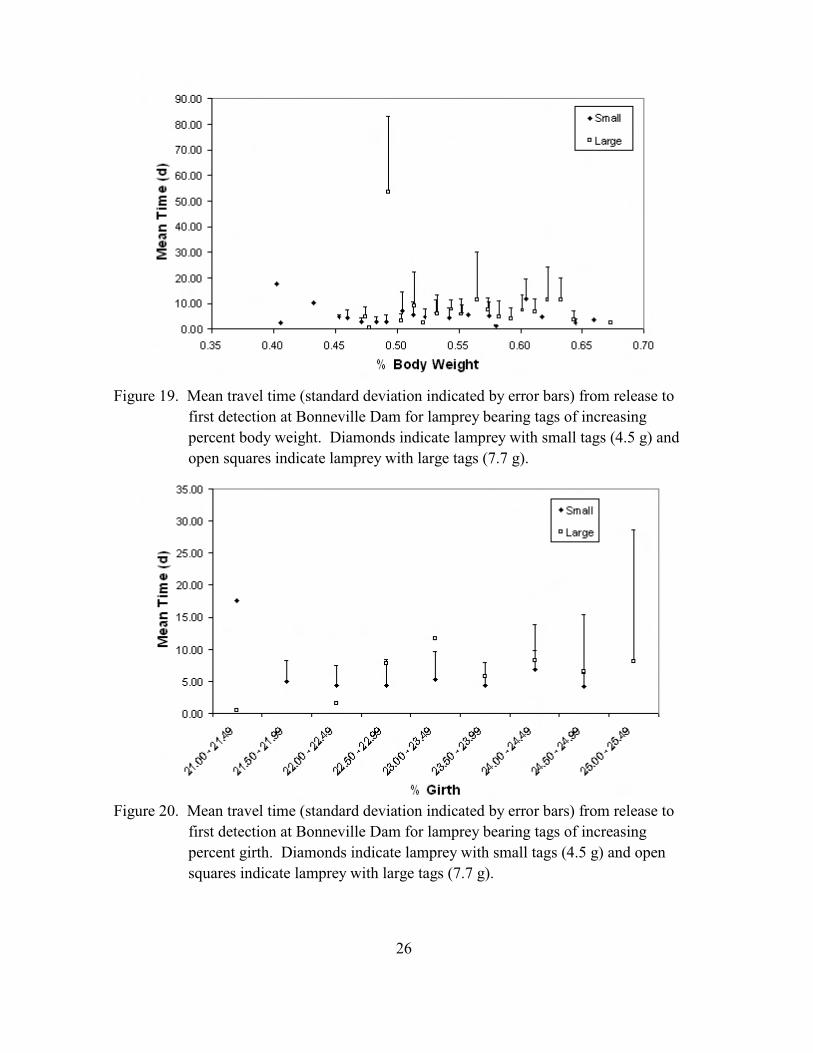
(range = 4.0-7.8 d, Table 1). There was no apparent effect on travel time to the dam of
either absolute tag size or the size of the tags relative to lamprey size (measured as both a
percentage of body weight and girth; Figs. 19 and 20).
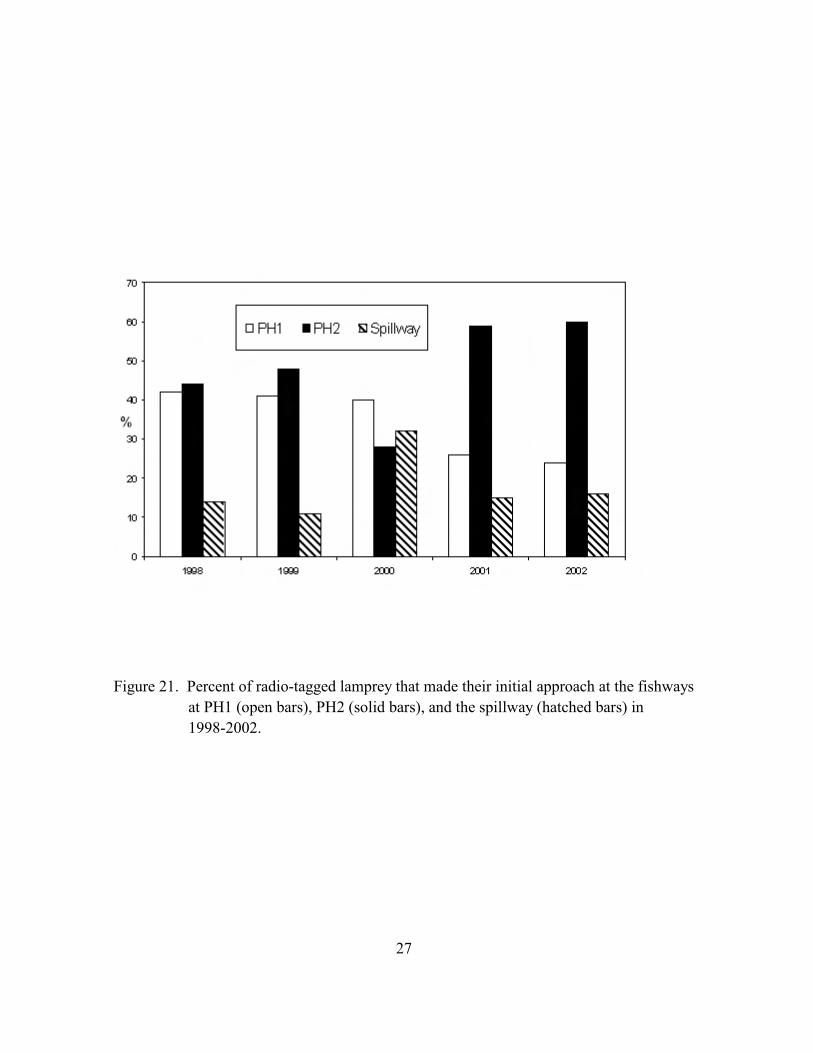
To determine what part of the dam the radio-tagged lamprey initially approached,
we divided the number that initially approached each section (PH1, Spillway, and PH2) by
the total number that approached the dam. For this analysis we used only the location
where lamprey were first detected at a fishway entrance. The results were similar to those
recorded in 2001, with more lamprey initially approaching at PH2 than at either PH1 or
the spillway (Fig. 21).
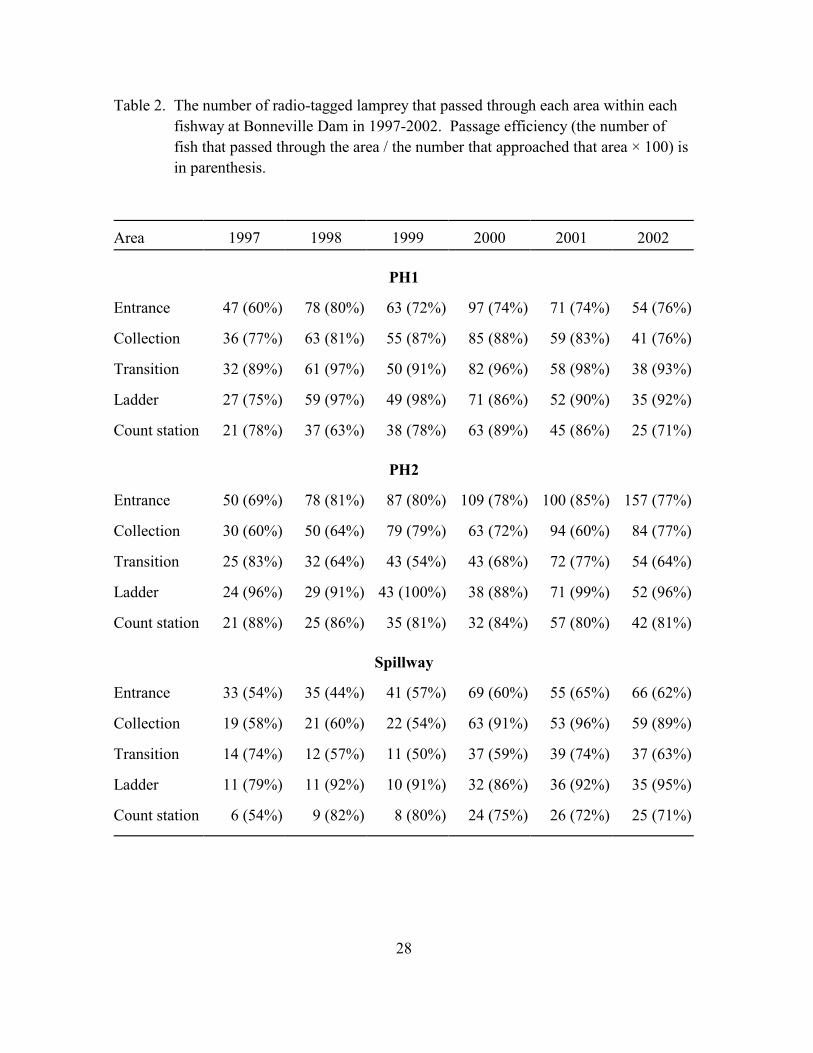
Overall, of the 193 radio-tagged lamprey that approached Bonneville Dam in 2002,
169 successfully entered the fishways (88%). The number of lamprey that successfully
entered a fishway of those that approached the fishway (entrance efficiency) was
determined for each section of the dam: PH1, PH2, and spillway entrances (Table 2).
Overall entrance efficiency in 2002 was similar to that found in other years of study and
indicated that lamprey have higher entrance efficiency at the powerhouse fishway
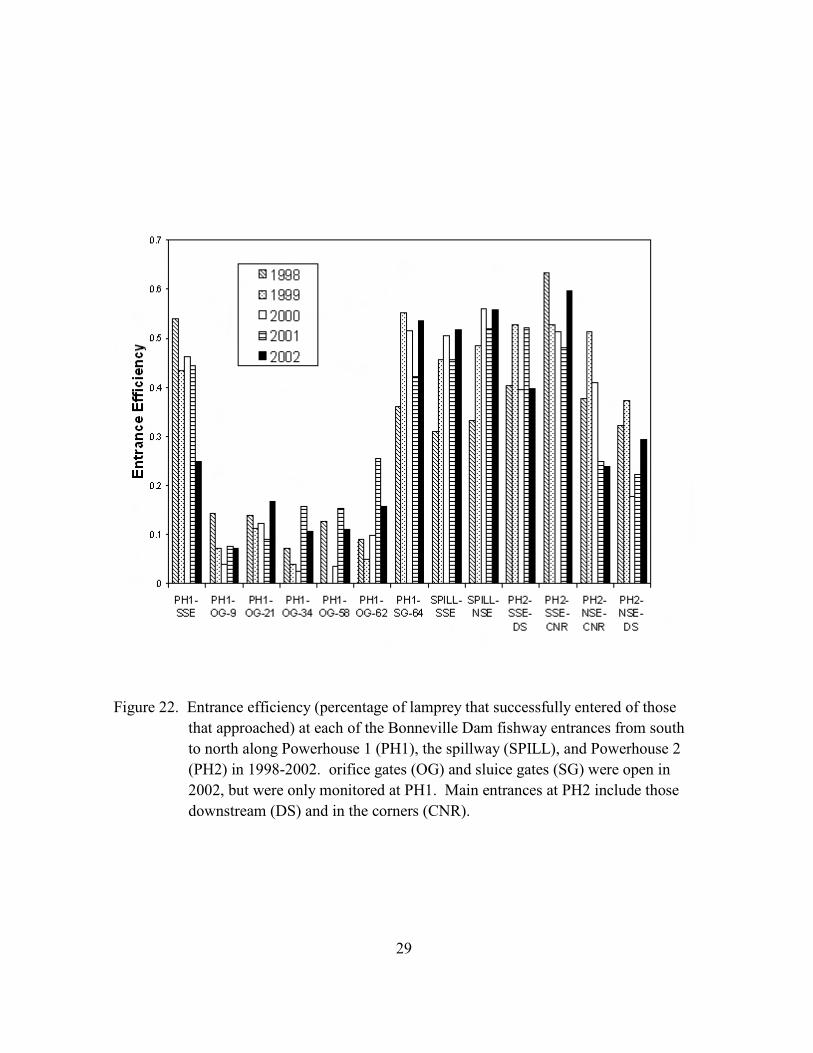
entrances than at the spillway entrances (Table 2). However, examination of entrance
efficiency at the individual entrances indicated that lamprey success at the Bradford Island
spillway entrance (SPILL-SSE, Fig. 22) was higher (52%) in 2002 than in previous years.
Entrance efficiency at the Cascades Island spillway entrance (SPILL-NSE, Fig. 22) in
2002 was also similar to or higher than that recorded in previous years (56%).
As in other years of study, entrance efficiency at the orifice gates at PH1 was lower
than at main entrances (Fig. 22). As in 2001, we noted that entrance efficiency at the
northernmost PH2 main entrance (PH2-NSE-CNR, Fig. 22) was low relative to previous
years. In addition, we found that entrance success at the southernmost entrance at PH1
was only 25% in 2002. This represented a substantial drop from entrance efficiencies at
this location in 1998-2001, which ranged from 43 to 54%
(PH1-SSE, Fig. 22).
26
Figure 19. Mean travel time (standard deviation indicated by error bars) from release to
first detection at Bonneville Dam for lamprey bearing tags of increasing
percent body weight. Diamonds indicate lamprey with small tags (4.5 g) and
open squares indicate lamprey with large tags (7.7 g).
Figure 20. Mean travel time (standard deviation indicated by error bars) from release to
first detection at Bonneville Dam for lamprey bearing tags of increasing
percent girth. Diamonds indicate lamprey with small tags (4.5 g) and open
squares indicate lamprey with large tags (7.7 g).
27
Figure 21. Percent of radio-tagged lamprey that made their initial approach at the fishways
at PH1 (open bars), PH2 (solid bars), and the spillway (hatched bars) in
1998-2002.
28
Table 2. The number of radio-tagged lamprey that passed through each area within each
fishway at Bonneville Dam in 1997-2002. Passage efficiency (the number of
fish that passed through the area / the number that approached that area × 100) is
in parenthesis.
Area 1997 1998 1999 2000 2001 2002
PH1
Entrance 47 (60%) 78 (80%) 63 (72%) 97 (74%) 71 (74%) 54 (76%)
Collection 36 (77%) 63 (81%) 55 (87%) 85 (88%) 59 (83%) 41 (76%)
Transition 32 (89%) 61 (97%) 50 (91%) 82 (96%) 58 (98%) 38 (93%)
Ladder 27 (75%) 59 (97%) 49 (98%) 71 (86%) 52 (90%) 35 (92%)
Count station 21 (78%) 37 (63%) 38 (78%) 63 (89%) 45 (86%) 25 (71%)
PH2
Entrance 50 (69%) 78 (81%) 87 (80%) 109 (78%) 100 (85%) 157 (77%)
Collection 30 (60%) 50 (64%) 79 (79%) 63 (72%) 94 (60%) 84 (77%)
Transition 25 (83%) 32 (64%) 43 (54%) 43 (68%) 72 (77%) 54 (64%)
Ladder 24 (96%) 29 (91%) 43 (100%) 38 (88%) 71 (99%) 52 (96%)
Count station 21 (88%) 25 (86%) 35 (81%) 32 (84%) 57 (80%) 42 (81%)
Spillway
Entrance 33 (54%) 35 (44%) 41 (57%) 69 (60%) 55 (65%) 66 (62%)
Collection 19 (58%) 21 (60%) 22 (54%) 63 (91%) 53 (96%) 59 (89%)
Transition 14 (74%) 12 (57%) 11 (50%) 37 (59%) 39 (74%) 37 (63%)
Ladder 11 (79%) 11 (92%) 10 (91%) 32 (86%) 36 (92%) 35 (95%)
Count station 6 (54%) 9 (82%) 8 (80%) 24 (75%) 26 (72%) 25 (71%)
29
Figure 22. Entrance efficiency (percentage of lamprey that successfully entered of those
that approached) at each of the Bonneville Dam fishway entrances from south
to north along Powerhouse 1 (PH1), the spillway (SPILL), and Powerhouse 2
(PH2) in 1998-2002. orifice gates (OG) and sluice gates (SG) were open in
2002, but were only monitored at PH1. Main entrances at PH2 include those
downstream (DS) and in the corners (CNR).

30
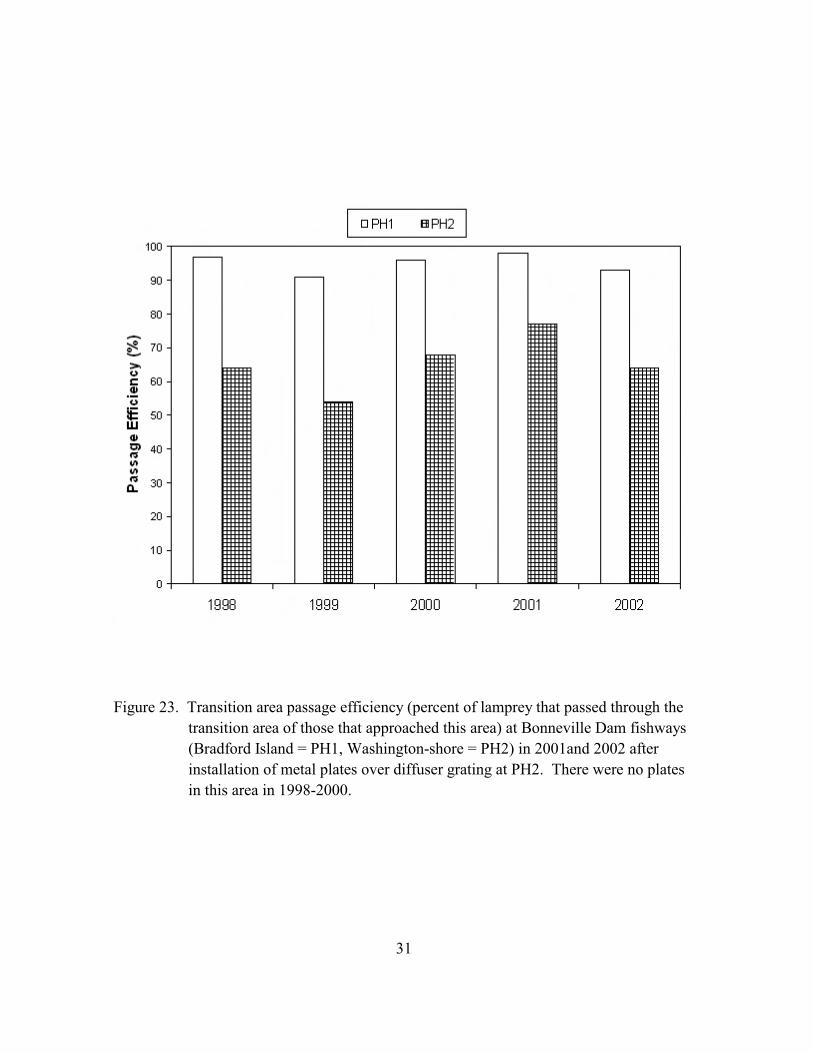
We compared lamprey passage through the transition area at PH2 among years to
assess the efficacy of attachment plates installed in this area. Using the same definitions
of passage success as in previous years, we found that passage through this area was
actually lower in 2002 than in either 2000 or 2001 (Fig. 23). However, this was due in
part to a slight change in the antenna configuration in this area in 2002. An antenna that
detected some of the lamprey entering the transition area via the northwesternmost PH2
collection channel was removed in 2002. When we examined only the area from weirs 1
to 23, we found that passage efficiency through this area was 72% in 2000 (prior to plate
installation), 82% in 2001 (after installation of plates at weirs 1-10) and 74% in 2002
(when plates were added above weir 10). This analysis also revealed that the area
immediately downstream of weir 1 is the most problematic part of the PH2 transition area
for radio-tagged lamprey.
As in previous years, lamprey exhibited very high passage efficiency (>90%)
through the ladder areas (pools and weirs not influenced by tailwater), but were less
successful at counting station areas at the tops of the fishways (Table 2). We intensively
monitored this area to document the fates of lamprey that approached the counting
stations.
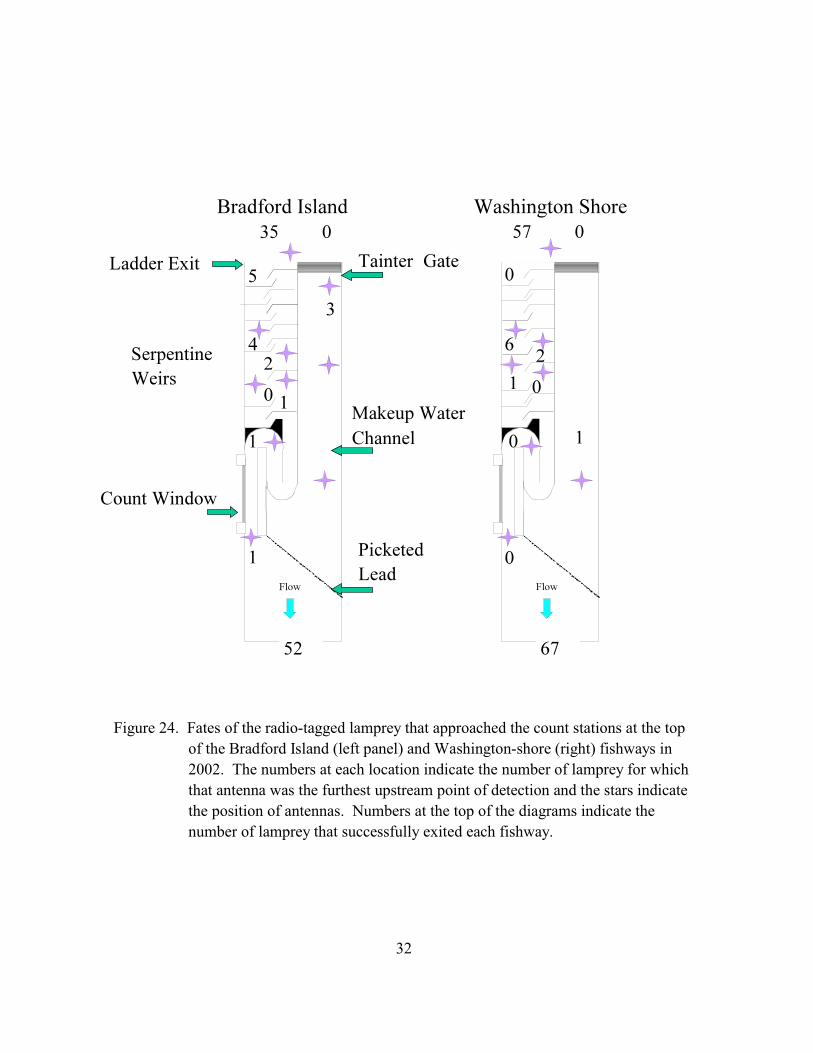
In 2002, 52 radio-tagged lamprey approached the Bradford Island counting station
(Fig. 24). One of these went through the picketed lead and directly into the makeup water
channel (1 of 3 lamprey detected in the MWC). This fish eventually fell back downstream
and then passed the counting station again, but did not get past the serpentine weirs and
instead fell back and out of the fishway altogether. One of the 52 fish did not get past the
counting station, and another did not enter the serpentine weir section (Fig. 24).
Thirty-five lamprey (67% of those that approached the counting station) exited at the top
of the fishway.
Fourteen lamprey were obstructed in the Bradford Island serpentine weir area and
either fell back past the counting station (n = 12, 23%) or crossed from the serpentine weir
section into the makeup water channel via grates in the wall (n = 2, 4%). As indicated in
Fig. 24, most of these lamprey were detected at the uppermost serpentine weirs (at or
upstream from antenna J5, Fig. 5) or near the ladder exit. In fact, 5 fish were detected at
the ladder exit but did not successfully exit the ladder and fell back downstream through
the serpentine weirs.
31
Figure 23. Transition area passage efficiency (percent of lamprey that passed through the
transition area of those that approached this area) at Bonneville Dam fishways
(Bradford Island = PH1, Washington-shore = PH2) in 2001and 2002 after
installation of metal plates over diffuser grating at PH2. There were no plates
in this area in 1998-2000.
32
Figure 24. Fates of the radio-tagged lamprey that approached the count stations at the top
of the Bradford Island (left panel) and Washington-shore (right) fishways in
2002. The numbers at each location indicate the number of lamprey for which
that antenna was the furthest upstream point of detection and the stars indicate
the position of antennas. Numbers at the top of the diagrams indicate the
number of lamprey that successfully exited each fishway.

33
At the Washington-shore ladder, all 67 lamprey that approached the counting
station passed it and successfully entered the serpentine weir section. Ten (15%) of these
fish were last detected in the serpentine weir area before either moving back downstream
(n = 9) or crossing into the makeup water channel through grates in the wall (n = 1). The
other 57 lamprey exited at the top of the fishway.
Six of the nine lamprey that fell back in the serpentine weir section of the
Washington-shore ladder did so upstream from antenna K7 (Fig. 5), indicating that they
were obstructed in the upper section of the serpentine weirs (Fig. 24). However, in
contrast to the results at Bradford Island, all lamprey detected at the Washington-shore exit
successfully entered the forebay.
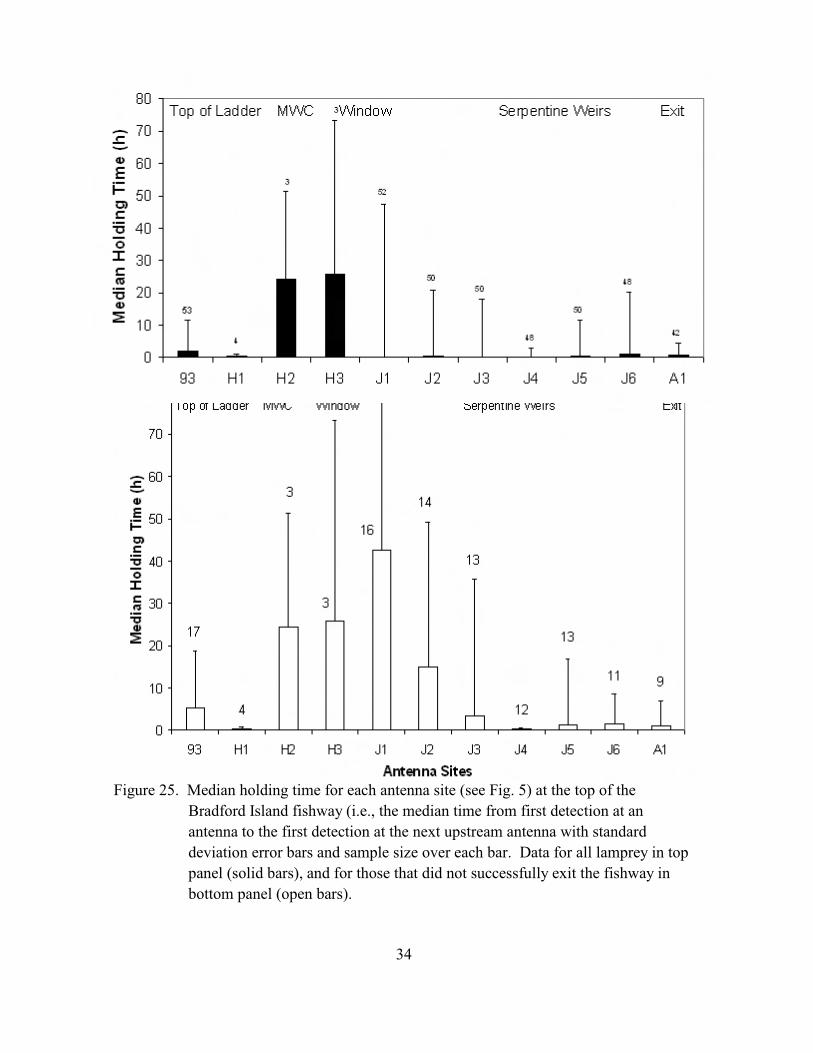
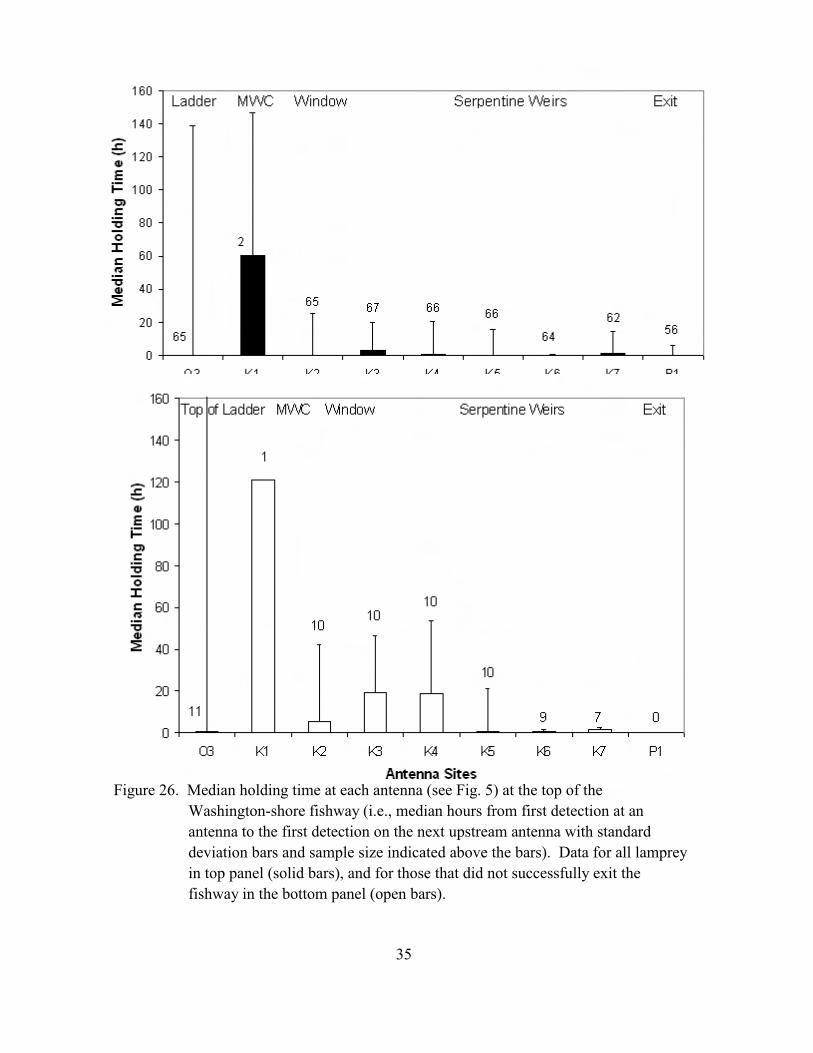
In the serpentine weir areas of both fishways, we found that lamprey moved
through the straight slots more rapidly than through the angled slots (Figs. 25 and 26). At
Bradford Island, lamprey required a median of 7.8 min to pass through the straight slot
but a median of 12.6 and 21.6 min to pass through the angled slots that were immediately
downstream and upstream of the straight slot. Similarly, at the Washington-shore fishway
lamprey required less time to pass through the straight slot (median = 12.6 min) than the
angled slots (medians = 25.2 and 18 min).
Lamprey that did not ultimately pass the dam did not exhibit the same patterns of
delay in the serpentine weirs as lamprey that passed successfully (Figs. 25 and 26).
Median holding times of the unsuccessful fish at the downstream-most serpentine weirs
were longer than those of fish that eventually exited. For the weirs farther upstream
(antennas J4-J 6 at Bradford Island, Fig. 25; antennas K5-K7 at the Washington-shore,
Fig. 26) there was little difference between these two groups.
The few lamprey that entered the MWC resided there for extended periods
(median = 26 h at Bradford Island and median = 61 h at the Washington-shore fishway).
None of these fish were collected in the bypass device deployed in the MWC at Bradford
Island (see following section).
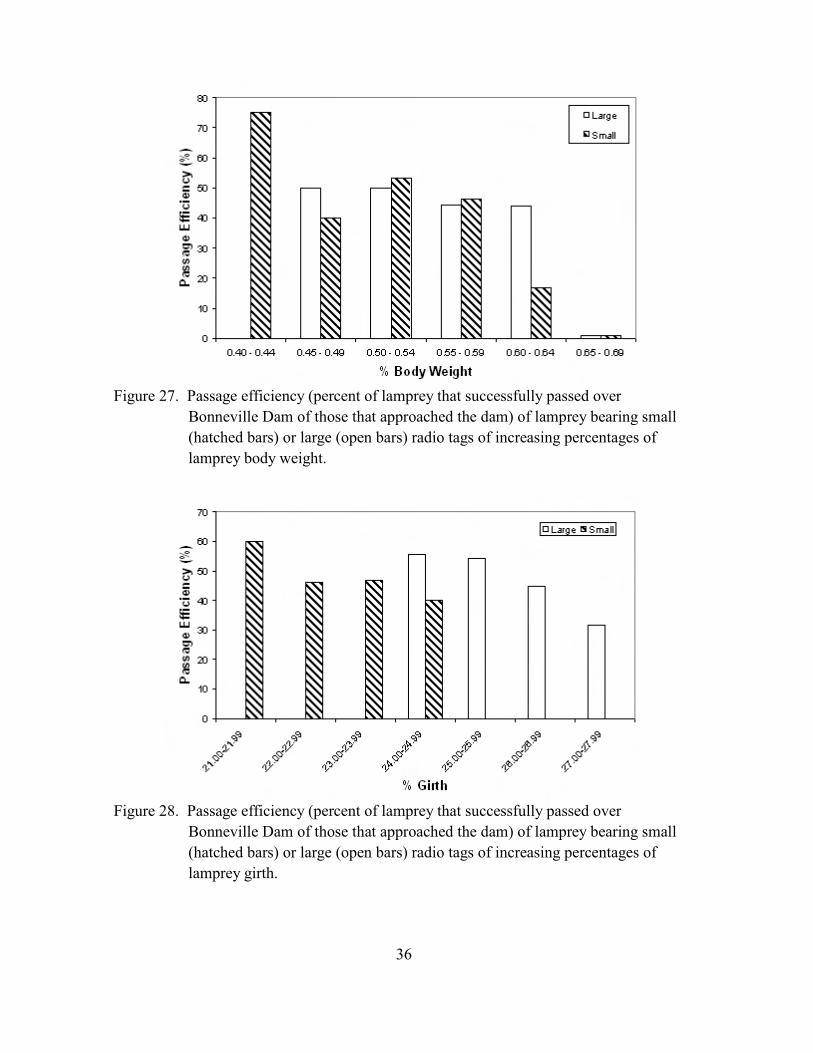
Of the 193 lamprey that approached the fishways at Bonneville Dam, 92 passed
over the dam via the fishways, for a passage efficiency of 48%. No radio-tagged lamprey
were detected in the navigation lock during 2002. Passage efficiency was lower for fish
bearing tags greater than 0.6% of body weight (Fig. 27) or 27% of girth (Fig. 28).
34
Figure 25. Median holding time for each antenna site (see Fig. 5) at the top of the
Bradford Island fishway (i.e., the median time from first detection at an
antenna to the first detection at the next upstream antenna with standard
deviation error bars and sample size over each bar. Data for all lamprey in top
panel (solid bars), and for those that did not successfully exit the fishway in
bottom panel (open bars).
35
Figure 26. Median holding time at each antenna (see Fig. 5) at the top of the
Washington-shore fishway (i.e., median hours from first detection at an
antenna to the first detection on the next upstream antenna with standard
deviation bars and sample size indicated above the bars). Data for all lamprey
in top panel (solid bars), and for those that did not successfully exit the
fishway in the bottom panel (open bars).
36
Figure 27. Passage efficiency (percent of lamprey that successfully passed over
Bonneville Dam of those that approached the dam) of lamprey bearing small
(hatched bars) or large (open bars) radio tags of increasing percentages of
lamprey body weight.
Figure 28. Passage efficiency (percent of lamprey that successfully passed over
Bonneville Dam of those that approached the dam) of lamprey bearing small
(hatched bars) or large (open bars) radio tags of increasing percentages of
lamprey girth.

37
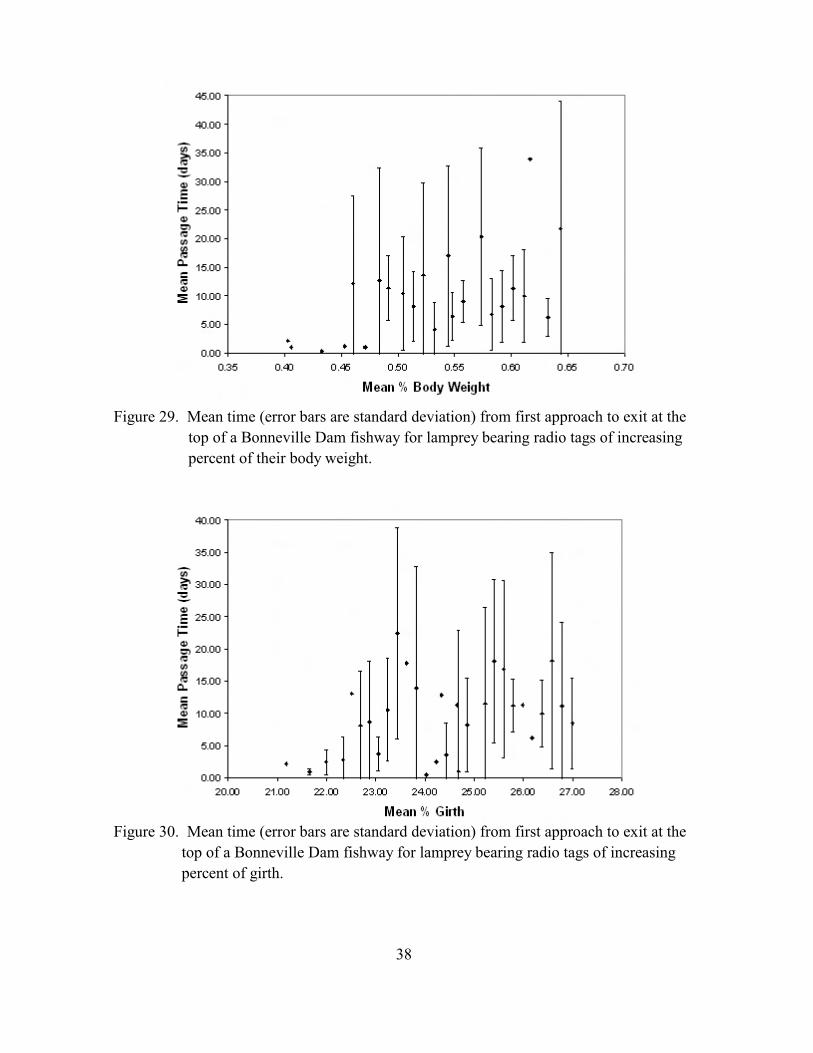
Median passage time at Bonneville Dam (i.e., the time from first detection at the
base of the dam to last detection at the fishway exit) was 9.02 d (range = 0.26!46.22 d,
SD = 11.34 d). We found no indication that either the percent body weight (Fig. 29) or the
percent girth (Fig. 30) of the transmitters had any effect on the length of time lamprey
required to pass through the fishways.
Of the 92 radio-tagged lamprey that passed over Bonneville Dam in 2002, only one
was subsequently detected below the dam (i.e., it fell back over the dam). After initially
passing over Bonneville Dam, this fish migrated to The Dalles Dam but did not approach
any of the fishway entrances there. It then fell back downstream, over Bonneville Dam,
and did not attempt to approach Bonneville Dam again.
38
Figure 29. Mean time (error bars are standard deviation) from first approach to exit at the
top of a Bonneville Dam fishway for lamprey bearing radio tags of increasing
percent of their body weight.
Figure 30. Mean time (error bars are standard deviation) from first approach to exit at the
top of a Bonneville Dam fishway for lamprey bearing radio tags of increasing
percent of girth.
39
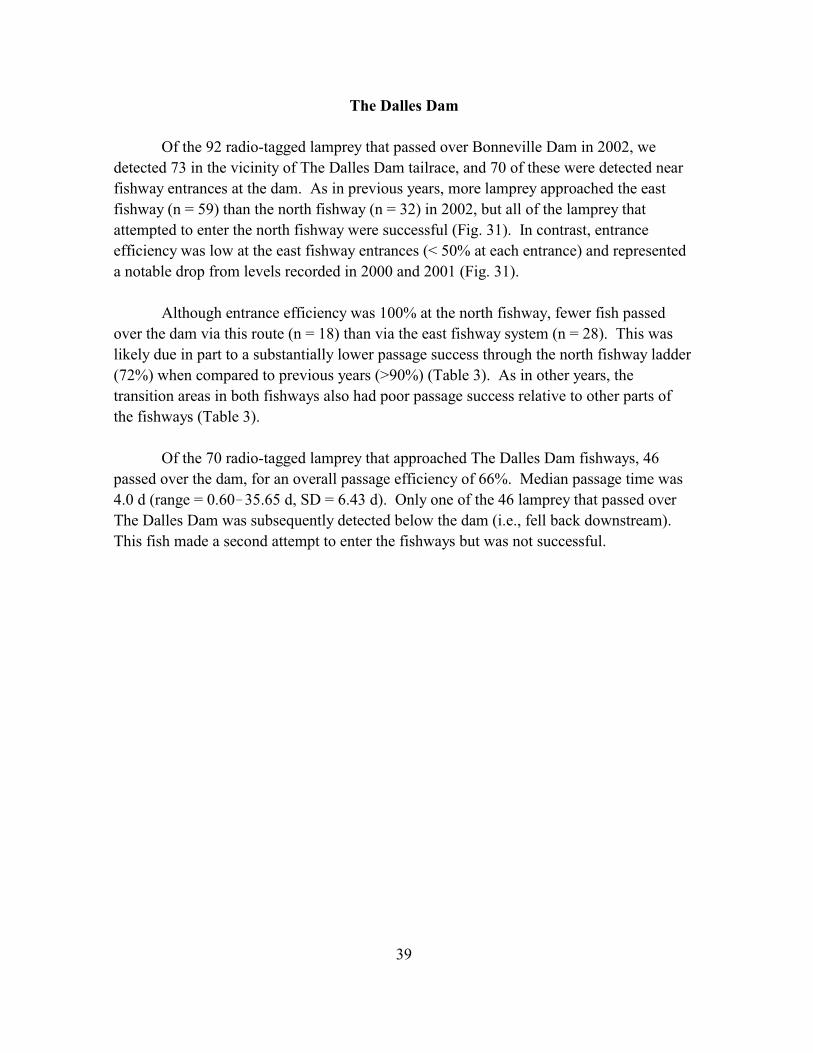
The Dalles Dam
Of the 92 radio-tagged lamprey that passed over Bonneville Dam in 2002, we
detected 73 in the vicinity of The Dalles Dam tailrace, and 70 of these were detected near
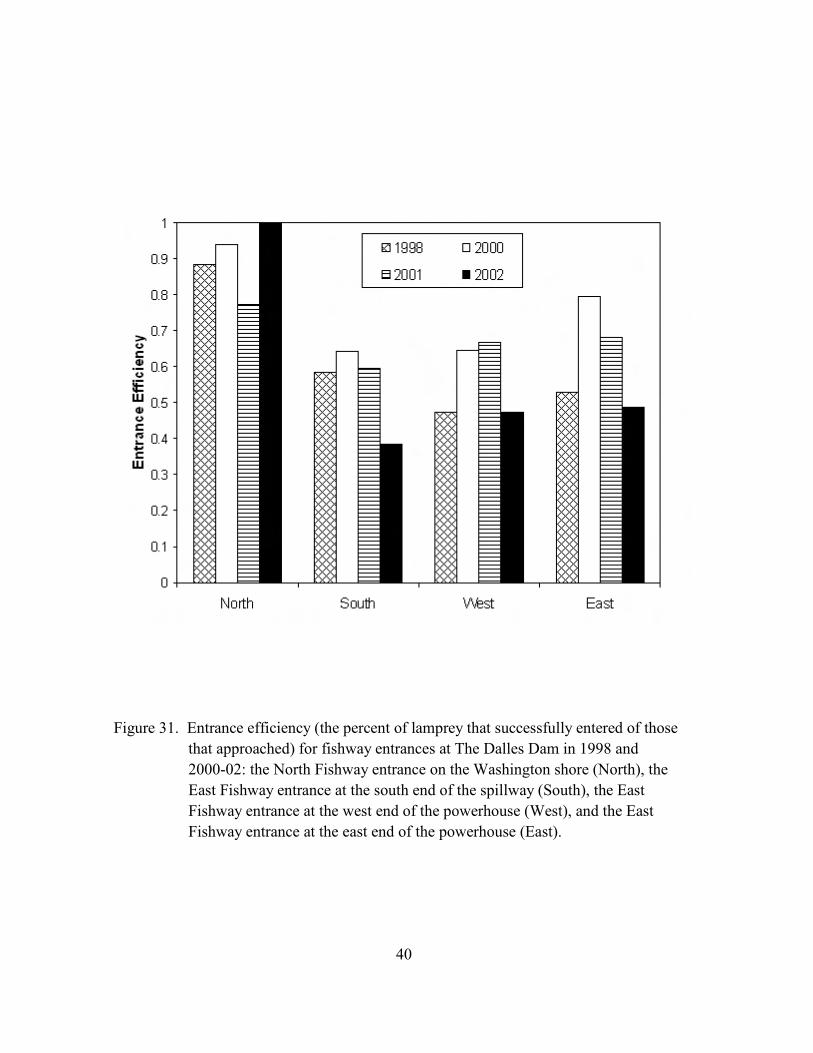
fishway entrances at the dam. As in previous years, more lamprey approached the east
fishway (n = 59) than the north fishway (n = 32) in 2002, but all of the lamprey that
attempted to enter the north fishway were successful (Fig. 31). In contrast, entrance
efficiency was low at the east fishway entrances (< 50% at each entrance) and represented
a notable drop from levels recorded in 2000 and 2001 (Fig. 31).
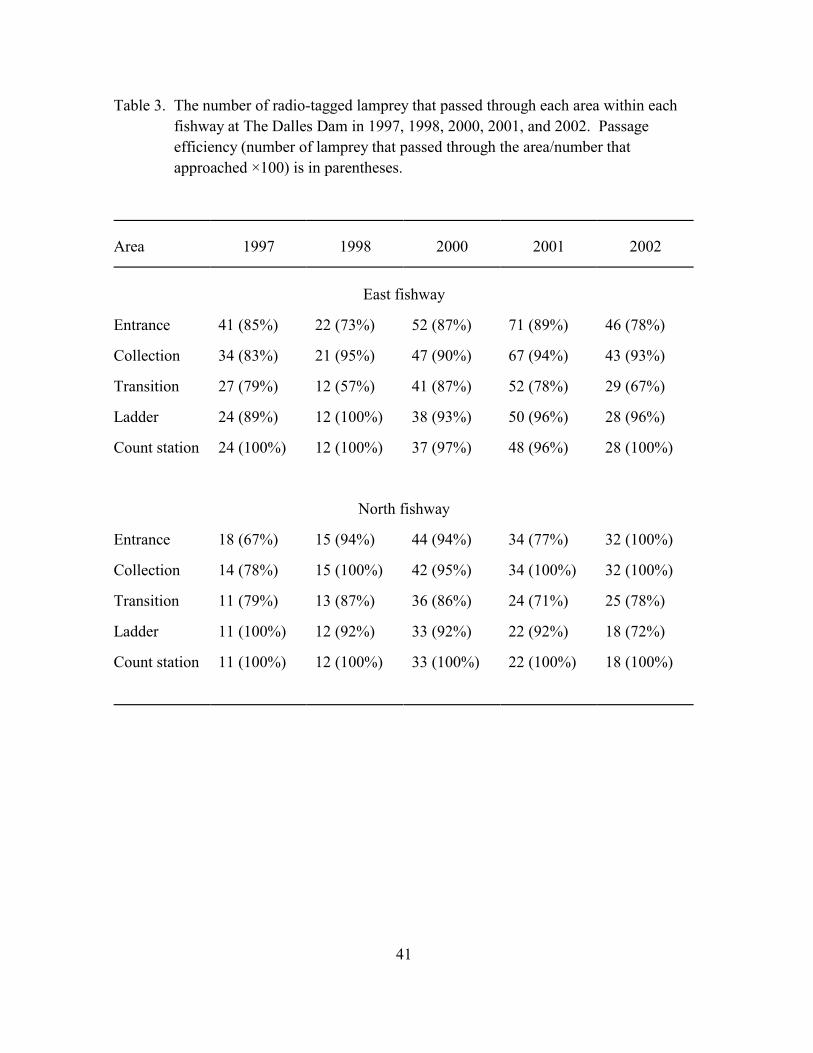
Although entrance efficiency was 100% at the north fishway, fewer fish passed
over the dam via this route (n = 18) than via the east fishway system (n = 28). This was
likely due in part to a substantially lower passage success through the north fishway ladder
(72%) when compared to previous years (>90%) (Table 3). As in other years, the
transition areas in both fishways also had poor passage success relative to other parts of
the fishways (Table 3).
Of the 70 radio-tagged lamprey that approached The Dalles Dam fishways, 46
passed over the dam, for an overall passage efficiency of 66%. Median passage time was
4.0 d (range = 0.60!35.65 d, SD = 6.43 d). Only one of the 46 lamprey that passed over
The Dalles Dam was subsequently detected below the dam (i.e., fell back downstream).
This fish made a second attempt to enter the fishways but was not successful.
40
Figure 31. Entrance efficiency (the percent of lamprey that successfully entered of those
that approached) for fishway entrances at The Dalles Dam in 1998 and
2000-02: the North Fishway entrance on the Washington shore (North), the
East Fishway entrance at the south end of the spillway (South), the East
Fishway entrance at the west end of the powerhouse (West), and the East
Fishway entrance at the east end of the powerhouse (East).
41
Table 3. The number of radio-tagged lamprey that passed through each area within each
fishway at The Dalles Dam in 1997, 1998, 2000, 2001, and 2002. Passage
efficiency (number of lamprey that passed through the area/number that
approached ×100) is in parentheses.
Area 1997 1998 2000 2001 2002
East fishway
Entrance 41 (85%) 22 (73%) 52 (87%) 71 (89%) 46 (78%)
Collection 34 (83%) 21 (95%) 47 (90%) 67 (94%) 43 (93%)
Transition 27 (79%) 12 (57%) 41 (87%) 52 (78%) 29 (67%)
Ladder 24 (89%) 12 (100%) 38 (93%) 50 (96%) 28 (96%)
Count station 24 (100%) 12 (100%) 37 (97%) 48 (96%) 28 (100%)
North fishway
Entrance 18 (67%) 15 (94%) 44 (94%) 34 (77%) 32 (100%)
Collection 14 (78%) 15 (100%) 42 (95%) 34 (100%) 32 (100%)
Transition 11 (79%) 13 (87%) 36 (86%) 24 (71%) 25 (78%)
Ladder 11 (100%) 12 (92%) 33 (92%) 22 (92%) 18 (72%)
Count station 11 (100%) 12 (100%) 33 (100%) 22 (100%) 18 (100%)

42
John Day Dam
Of the 46 radio-tagged lamprey that passed over The Dalles Dam in 2002, we
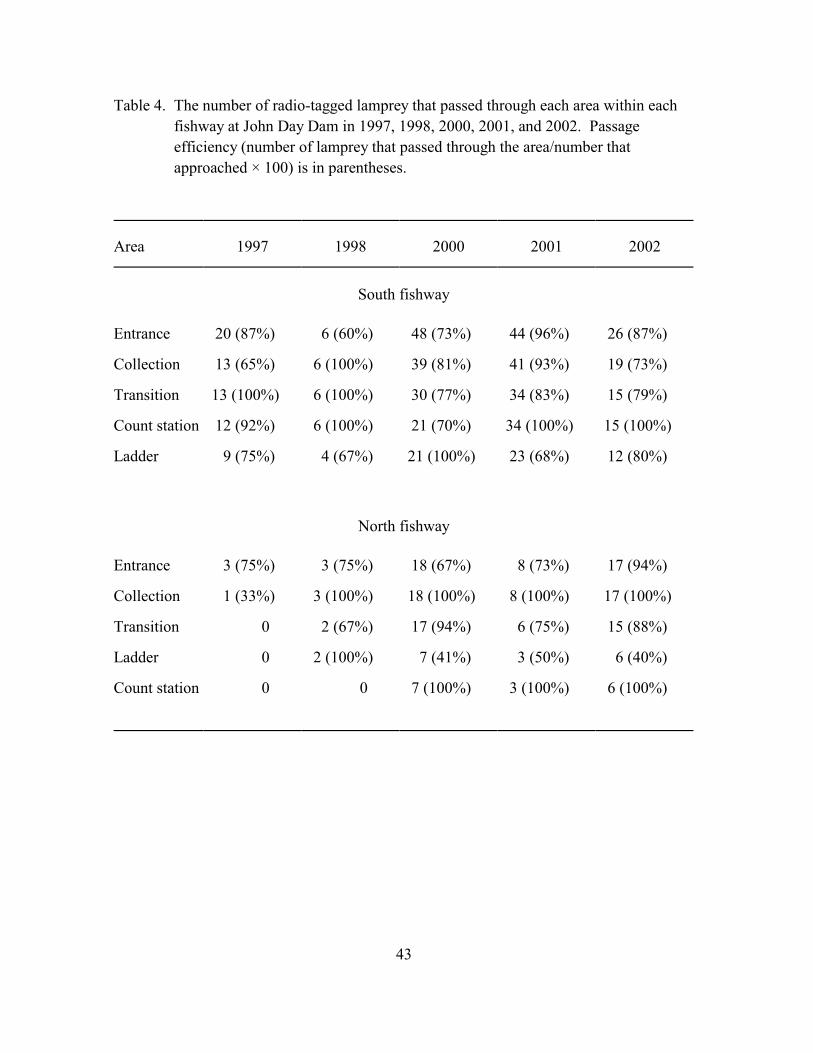
detected 34 (74%) at the fishway entrances at John Day Dam. As in previous years, more
lamprey approached the south fishway (n = 30) than the north fishway (n = 18). However,
in contrast to most other years, lamprey exhibited greater entrance efficiency at the north
fishway entrance than at the south fishway entrances (Table 4).
Overall passage efficiency at John Day Dam was 50% (17 of 34), with 11 fish
passing via the south fishway and 5 passing via the north fishway. One fish passed
through both fishways, using a different ladder after having fallen back downstream. As in
previous years, lamprey had difficulty passing through the ladder section of the north
fishway (Table 4). In the south fishway, lamprey attrition occurred throughout the
collection channel, transition, and ladder areas (Table 4). Median passage time was 4.2 d
(range = 0.48!5.00, SD = 4.68).
As in previous years, a relatively high percentage (35%) of the 17 fish that passed
over John Day Dam fell back downstream over the dam. One of these 6 fish re-entered the
fishway and fell back a second time, then re-entered but did not successfully pass on the
third attempt. Only one fish re-entered and successfully passed over the dam a second
time. Two of the remaining fallback fish did not re-approach the dam, and the remaining
two fish entered the fishways a second time but did not successfully pass over the dam.
Consequently, the effective passage efficiency at John Day Dam in 2002 was only 35%.
43
Table 4. The number of radio-tagged lamprey that passed through each area within each
fishway at John Day Dam in 1997, 1998, 2000, 2001, and 2002. Passage
efficiency (number of lamprey that passed through the area/number that
approached × 100) is in parentheses.
Area 1997 1998 2000 2001 2002
South fishway
Entrance 20 (87%) 6 (60%) 48 (73%) 44 (96%) 26 (87%)
Collection 13 (65%) 6 (100%) 39 (81%) 41 (93%) 19 (73%)
Transition 13 (100%) 6 (100%) 30 (77%) 34 (83%) 15 (79%)
Count station 12 (92%) 6 (100%) 21 (70%) 34 (100%) 15 (100%)
Ladder 9 (75%) 4 (67%) 21 (100%) 23 (68%) 12 (80%)
North fishway
Entrance 3 (75%) 3 (75%) 18 (67%) 8 (73%) 17 (94%)
Collection 1 (33%) 3 (100%) 18 (100%) 8 (100%) 17 (100%)
Transition 0 2 (67%) 17 (94%) 6 (75%) 15 (88%)
Ladder 0 2 (100%) 7 (41%) 3 (50%) 6 (40%)
Count station 0 0 7 (100%) 3 (100%) 6 (100%)

44
Overall Passage Patterns
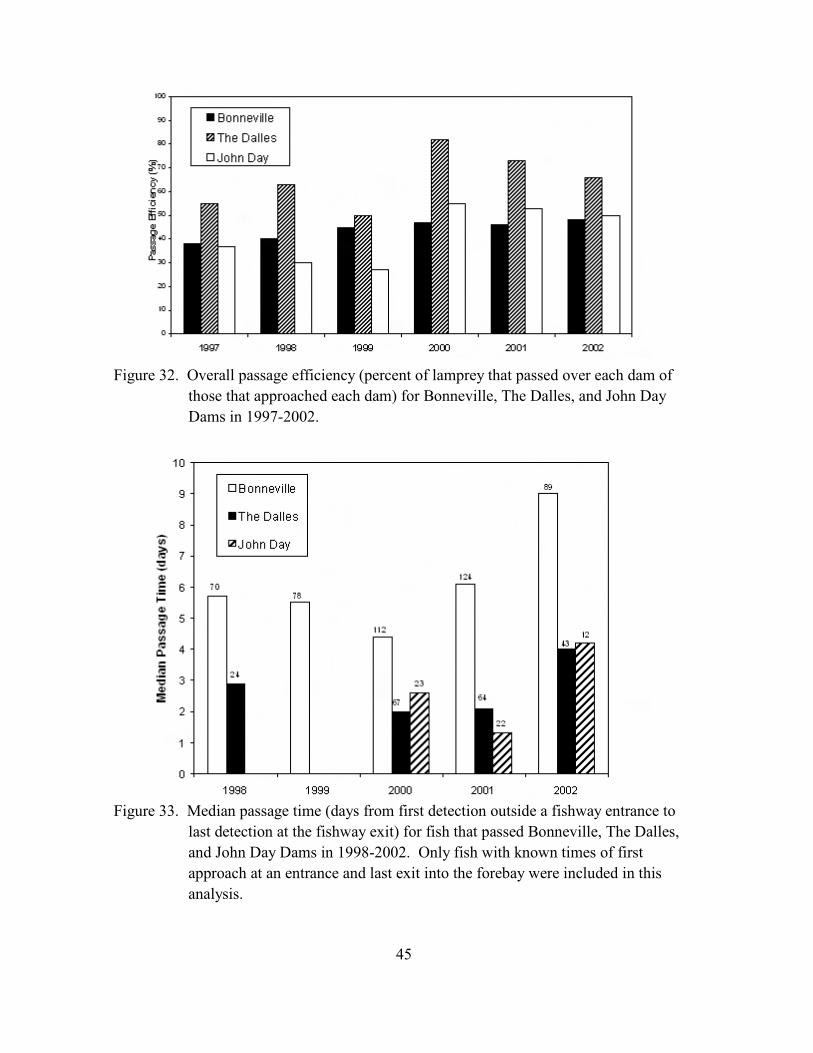
The passage efficiency at each dam was similar to 2001 results, with highest
passage efficiency at The Dalles Dam (Fig. 32). As in 2001, we noted a slight decline in
passage efficiency at The Dalles Dam and John Day Dam relative to 2000. However,
Bonneville Dam passage efficiency in 2002 was slightly higher than in previous years
(Fig. 32).
Median passage time at Bonneville Dam was 50% higher in 2002 than in 2001
(Fig. 33). This represented the greatest increase in passage time recorded to date at this
dam. Similarly, we recorded passage times at The Dalles and John Day Dams in 2002 that
were over twice as long as in previous years (Fig. 33).
Of the 12 fish that passed over the John Day Dam and into Lake Umatilla, 5 were
detected in the tailrace of McNary Dam. Three of these lamprey never approached a
fishway entrance and were not detected upstream from McNary Dam. The remaining two
fish both successfully passed over the dam, one via the south fishway and one via the north
fishway (Fig. 4). One of these fish was then detected passing over Priest Rapids Dam,
Wanapum Dam, Rock Island Dam, and Rocky Reach Dam.
45
Figure 32. Overall passage efficiency (percent of lamprey that passed over each dam of
those that approached each dam) for Bonneville, The Dalles, and John Day
Dams in 1997-2002.
Figure 33. Median passage time (days from first detection outside a fishway entrance to
last detection at the fishway exit) for fish that passed Bonneville, The Dalles,
and John Day Dams in 1998-2002. Only fish with known times of first
approach at an entrance and last exit into the forebay were included in this
analysis.

46
Tributary Use and Seasonal Distribution
Receiving stations at the mouths of all major tributaries between Bonneville Dam
and McNary Dam monitored lamprey entrances into each tributary. In 2002, we detected
lamprey in the Deschutes and John Day Rivers. We found only two lamprey in the
Deschutes River (which enters the Columbia River 20 km upstream from The Dalles
Dam), and both of these fish were detected at Sherar’s Falls (396 km from the mouth of
the Columbia River, 68 km from the mouth of the Deschutes River). In addition, we
detected one lamprey entering the John Day River (which joins the Columbia River 3 km
upstream from John Day Dam).
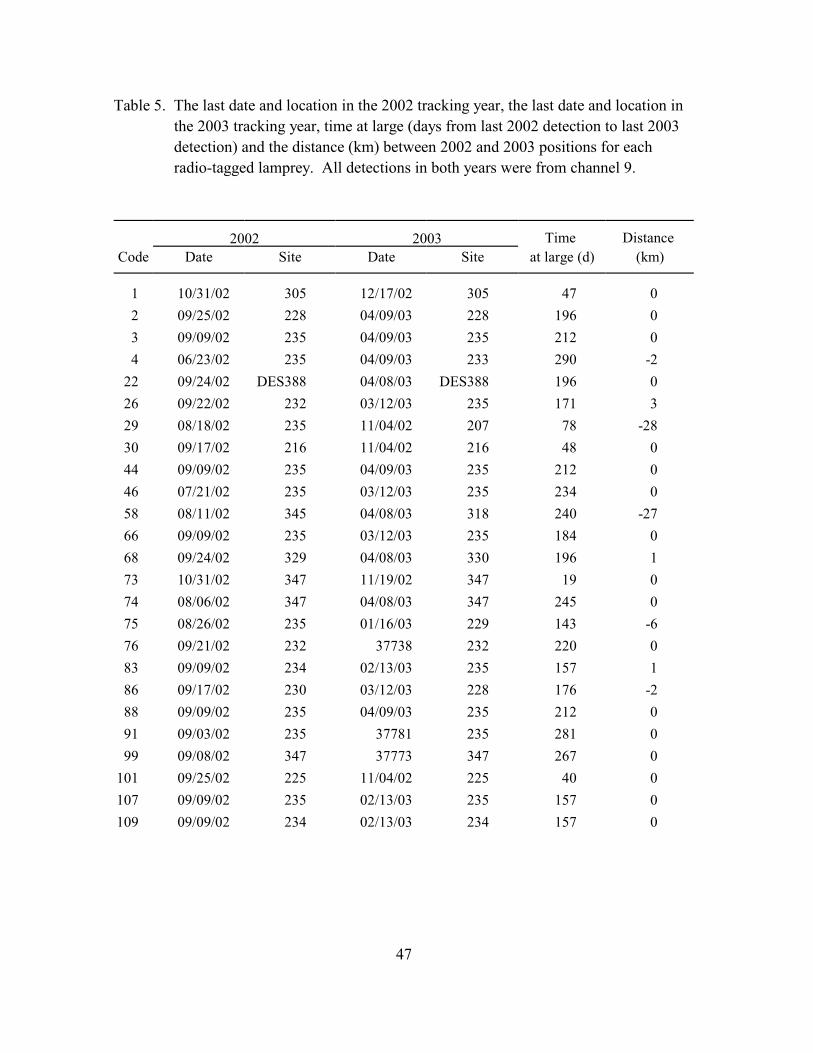
From November 2002 to September 2003 (the 2003 tracking year), we conducted
monthly standardized surveys for radio-tagged lamprey using a portable receiver and an
antenna mounted on a vehicle (mobile tracking). During this period, we detected 45
(22%) of the lamprey tagged in 2002. The mean time at large (number of days between
the last detection in the 2002 tracking year (May-October 2002) and the last detection after
31 October) was 166 d with a minimum of 19 d and a maximum of 290 d (Table 5).
The majority of fish that we detected in 2003 were within 2 km of their last
location in 2002 (Table 5). The few fish that moved longer distances all moved
downstream, except for fish 9-137. This individual was detected below Bonneville Dam
in September 2002 and at the mouth of the Little White Salmon River in early April 2003.
This fish was not detected on at Bonneville Dam in the time between these detections.
Of the 109 lamprey that were unable to successfully pass over Bonneville Dam, 46
(42%) were last detected either in the fishways or near fishway entrances. These fish were
not subsequently detected downstream from the dam. The other 63 fish were either
detected at tailrace receivers (located at rkm 232.3, near the release sites, Fig. 1) or during
mobile tracking sessions.
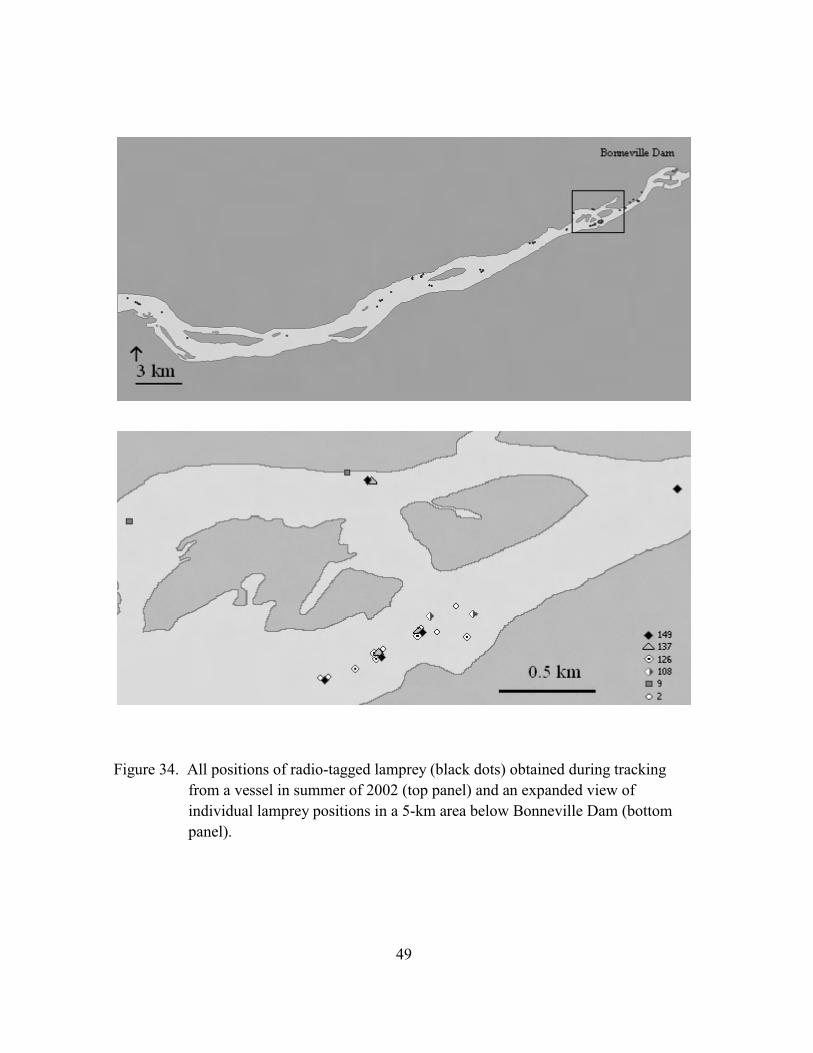
In the summer of 2002, we conducted weekly surveys using a portable receiver
from a vessel in the area downstream from Bonneville Dam to document the fates of
lamprey that did not successfully pass over the dam. In addition, we conducted monthly
surveys in this area from a vehicle during the winter and into the summer of 2003. Of the
36 lamprey that were detected during vessel surveys, 17 were detected more than once. A
Global Positioning System (GPS) position was recorded each time a lamprey was located
(Fig. 34). The lamprey we detected were distributed up to 30 km downstream from
Bonneville Dam.
47
Table 5. The last date and location in the 2002 tracking year, the last date and location in
the 2003 tracking year, time at large (days from last 2002 detection to last 2003
detection) and the distance (km) between 2002 and 2003 positions for each
radio-tagged lamprey. All detections in both years were from channel 9.
Code
2002 2003 Time
at large (d)
Distance
Date Site Date Site (km)
1 10/31/02 305 12/17/02 305 47 0
2 09/25/02 228 04/09/03 228 196 0
3 09/09/02 235 04/09/03 235 212 0
4 06/23/02 235 04/09/03 233 290 -2
22 09/24/02 DES388 04/08/03 DES388 196 0
26 09/22/02 232 03/12/03 235 171 3
29 08/18/02 235 11/04/02 207 78 -28
30 09/17/02 216 11/04/02 216 48 0
44 09/09/02 235 04/09/03 235 212 0
46 07/21/02 235 03/12/03 235 234 0
58 08/11/02 345 04/08/03 318 240 -27
66 09/09/02 235 03/12/03 235 184 0
68 09/24/02 329 04/08/03 330 196 1
73 10/31/02 347 11/19/02 347 19 0
74 08/06/02 347 04/08/03 347 245 0
75 08/26/02 235 01/16/03 229 143 -6
76 09/21/02 232 37738 232 220 0
83 09/09/02 234 02/13/03 235 157 1
86 09/17/02 230 03/12/03 228 176 -2
88 09/09/02 235 04/09/03 235 212 0
91 09/03/02 235 37781 235 281 0
99 09/08/02 347 37773 347 267 0
101 09/25/02 225 11/04/02 225 40 0
107 09/09/02 235 02/13/03 235 157 0
109 09/09/02 234 02/13/03 234 157 0
48
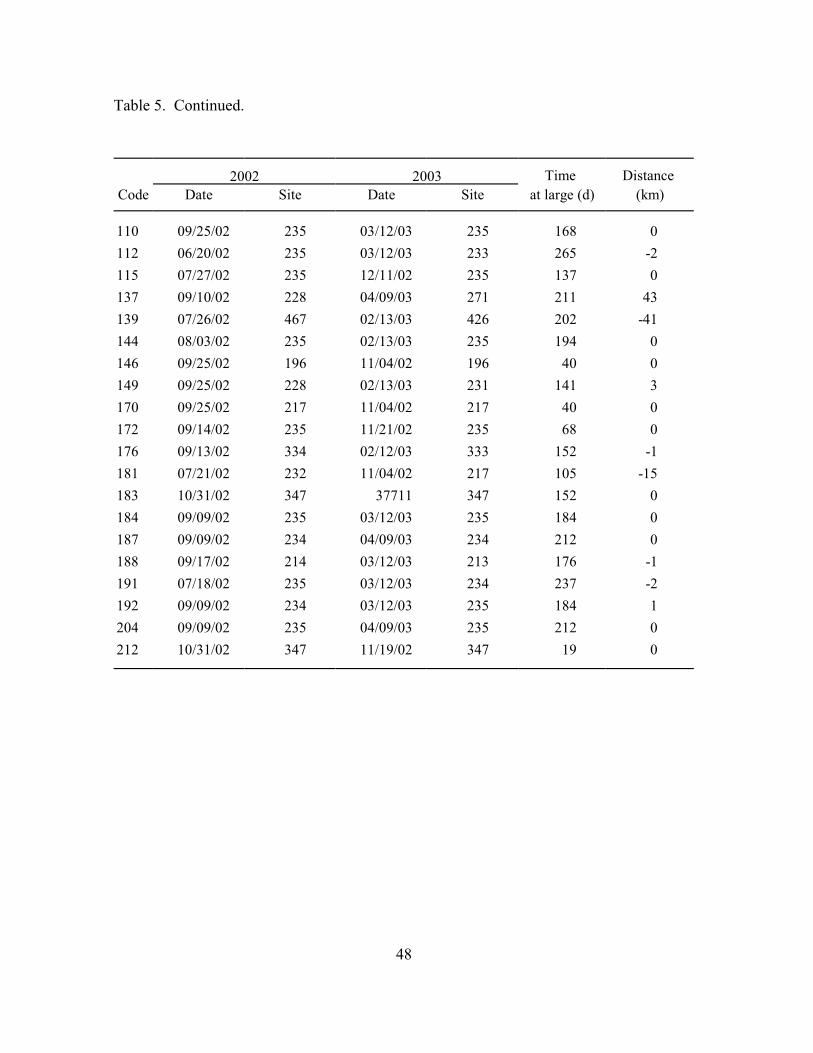
Table 5. Continued.
Code
2002 2003 Time
at large (d)
Distance
Date Site Date Site (km)
110 09/25/02 235 03/12/03 235 168 0
112 06/20/02 235 03/12/03 233 265 -2
115 07/27/02 235 12/11/02 235 137 0
137 09/10/02 228 04/09/03 271 211 43
139 07/26/02 467 02/13/03 426 202 -41
144 08/03/02 235 02/13/03 235 194 0
146 09/25/02 196 11/04/02 196 40 0
149 09/25/02 228 02/13/03 231 141 3
170 09/25/02 217 11/04/02 217 40 0
172 09/14/02 235 11/21/02 235 68 0
176 09/13/02 334 02/12/03 333 152 -1
181 07/21/02 232 11/04/02 217 105 -15
183 10/31/02 347 37711 347 152 0
184 09/09/02 235 03/12/03 235 184 0
187 09/09/02 234 04/09/03 234 212 0
188 09/17/02 214 03/12/03 213 176 -1
191 07/18/02 235 03/12/03 234 237 -2
192 09/09/02 234 03/12/03 235 184 1
204 09/09/02 235 04/09/03 235 212 0
212 10/31/02 347 11/19/02 347 19 0
49
Figure 34. All positions of radio-tagged lamprey (black dots) obtained during tracking
from a vessel in summer of 2002 (top panel) and an expanded view of
individual lamprey positions in a 5-km area below Bonneville Dam (bottom
panel).
50
Multiple detections of the same individual indicated that most lamprey did not
move far between detections (Fig. 34). Some individuals were detected over 1 km from
their previous location; however, others moved less than 0.5 km between detections. Due
to error associated with determining lamprey positions with the portable receiver
(±0.5 km), it is possible that these individuals were not moving and could have been dead.
Interestingly, one lamprey was detected in the mouth of the Washougal River at the end of
the summer, but this fish was not subsequently detected in either vessel or vehicle surveys.
We surveyed the Willamette River from both vehicles and vessels during the course of this
study, but no lamprey were detected.
Bypass Evaluation
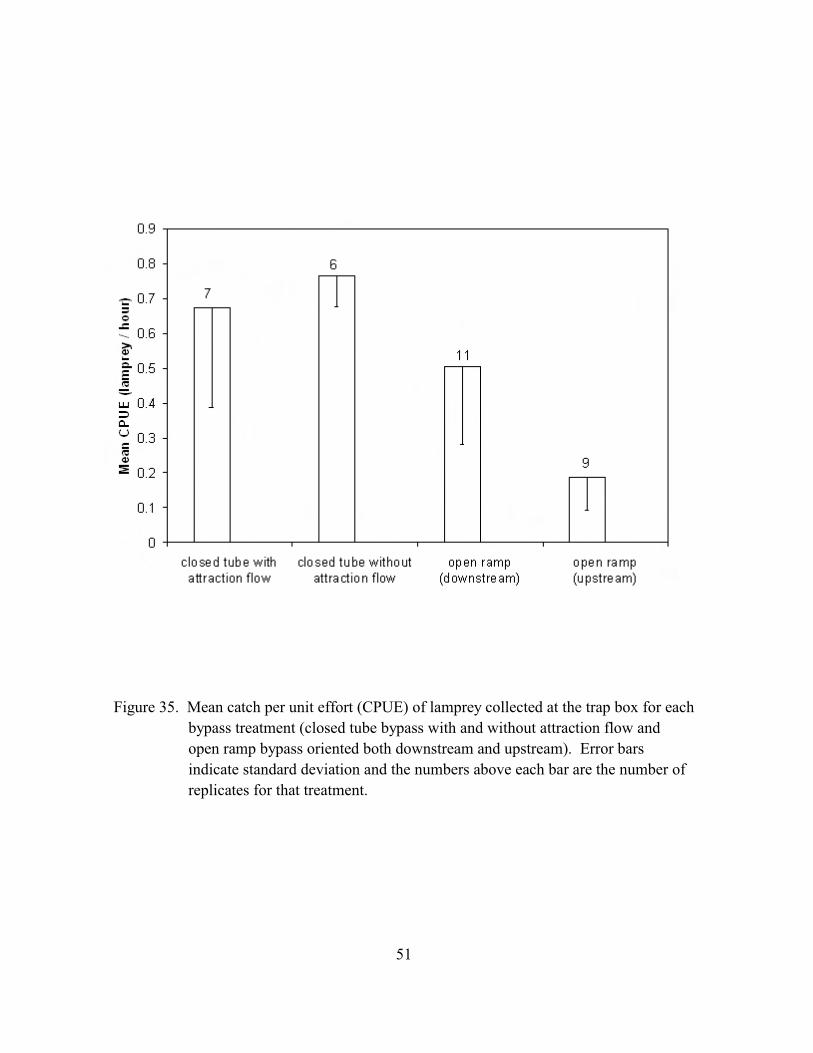
Bypass structures were evaluated from 10 July to 19 September 2002. We caught a
total of 346 lamprey during these experiments. Mean daily CPUE was highest for the
closed tube without attraction flow (0.77 lamprey/hour, Fig. 35) and lowest for the open
ramp oriented upstream (Fig. 35).
In each week of testing, marked lamprey were introduced directly into the MWC
for a total of 272 marked fish during the closed-tube trials and 246 during the open-ramp
trials. Only two of these marked fish were recovered in the bypass trap, both during the
closed-tube trials. Consequently, estimates of collector efficiency based on the
mark-recapture experiment were not possible.
Based on radiotelemetry, 35% of lamprey that passed the Bradford Island counting
station would have been counted (the remainder passed during the night when counts were
not made). Of fish that passed the counting station, 4% entered the MWC. During
closed-tube trials, we estimated that 1,312 lamprey were in the MWC (based on adjusted
Bradford Island count data). We caught a total of 182 lamprey using the closed-tube
collector (13.9% of those in MWC). Based on the Bradford Island count data, we
estimated that there were 892 lamprey in the MWC during the tests using the open ramp
and that 164 (18.4%) of these were caught.
51
Figure 35. Mean catch per unit effort (CPUE) of lamprey collected at the trap box for each
bypass treatment (closed tube bypass with and without attraction flow and
open ramp bypass oriented both downstream and upstream). Error bars
indicate standard deviation and the numbers above each bar are the number of
replicates for that treatment.

52
53
DISCUSSION
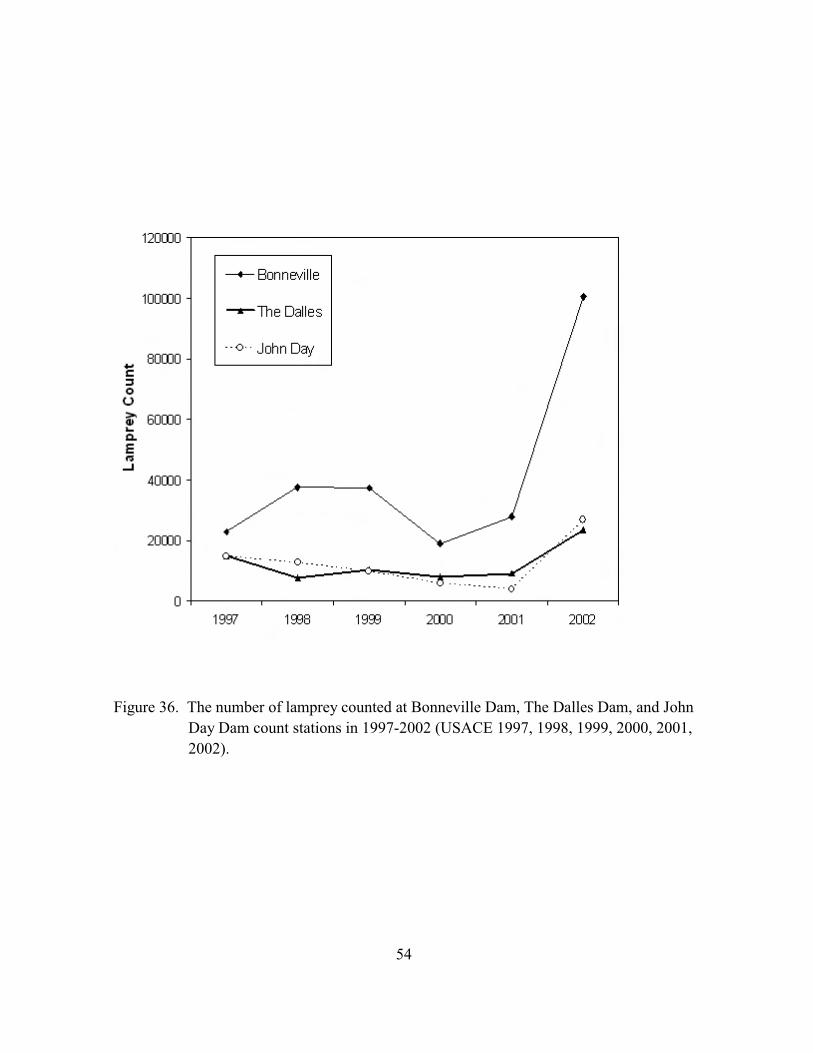
The number of lamprey counted at Bonneville Dam in 2002 was over four times
higher than the number counted in 2001 (Fig. 36). This increase was reflected in our
increased CPUE at the Washington-shore trap. In addition, more lamprey were likely
available to the trap because more lamprey used the PH2 fishway system in 2002 than
either the fishways at PH1 or the spillway.
At Bonneville Dam in 2002, priority for power generation was at PH2. As in 2001
(when PH2 also had priority), more lamprey were initially attracted to the
Washington-shore fishway entrances and more fish passed the dam via this fishway.
However, as in previous years of study, passage efficiency was lower at PH2 fishways than
at PH1. Consequently, it appears that PH2 priority operation may function to reduce
overall passage efficiency at Bonneville Dam by attracting lamprey into fishways where
they are less successful.
Interestingly, the percentage of lamprey that initially approached Bonneville Dam
spillway entrances in 2002 did not differ much from 2001, even though there was more
spill in 2002 than in 2001 (DART 1995). Moreover, the entrance success of lamprey at
individual spillway entrances in 2002 was the same or higher than in previous years. We
speculate that the attraction flow created by spill and the effects of spill on conditions near
spillway entrances do not dictate lamprey behavior when approaching and attempting to
enter fishways at the spillway. Data from 2002 provide further support for the observation
that lamprey entrance efficiency was improved when the spillway bulkheads were rounded
in 2000-01 (Moser et al. 2002a, 2003).
In 2002, the orifice gates at PH1 were open for the entire tracking season, whereas
they were closed intermittently in 2000 and 2001. We noted that passage efficiency
through the PH1 collection channel was lower in 2002 than in previous years. This may
have resulted because lamprey were able to exit the collection channel more easily in 2002
via the open orifice gates. While we were unable to document negative impacts of orifice
gate closure in 2000 and 2001, the 2002 results indicate that orifice gate closure could
have a positive effect on lamprey passage.
54
Figure 36. The number of lamprey counted at Bonneville Dam, The Dalles Dam, and John
Day Dam count stations in 1997-2002 (USACE 1997, 1998, 1999, 2000, 2001,
2002).

55
We continued to test the addition of attachment plates at the PH2 transition area in
2002. The results from this work were equivocal. In 2001, plates were added over grating
in the floor between the downstream-most weirs in the PH2 fishway. This resulted in a
modest improvement in lamprey passage through this area in 2001 (Moser et al. 2003).
However, in 2002 lamprey passage through this area returned to pre-attachment plate
levels.
Video observations also indicated that lamprey did not use the attachment plates in
their current configuration (R. Stansell, U.S. Army Corps of Engineers, personal
communication). It is possible that lamprey did not find the plates because they tend to
move along the walls of the PH2 transition area, rather than in a line down the center of
the orifice openings (the location of the attachment plates). Any further examination of
the use of attachment plates should include testing of attachment plates that allow lamprey
to attach near the walls of the fishway, in addition to providing attachment surfaces in and
directly upstream from orifice openings.
In 2002 we examined lamprey behavior through the top of the ladders at
Bonneville Dam in great detail. Lamprey tended to fall back at the upstream-most
serpentine weirs at both the Washington-shore and Bradford Island fishways. While there
was no evidence that lamprey were more likely to fall back at straight slot than at angled
slot weirs, we did find that lamprey took longer to negotiate the angled slots than the
straight slots. In addition, lamprey that did not successfully exit the fishways exhibited
longer holding times in the serpentine weir area than those that passed successfully. This
was particularly obvious at both the angled and straight weirs that were farthest
downstream.
Of the 201 lamprey that we released below Bonneville Dam, 109 did not pass over
the dam. Of these, 42% were last detected either at a fishway entrance or in the
Bonneville Dam fishways. The fate of these fish is unknown. The remaining fish were
last detected as they passed tailrace receivers or during mobile tracking surveys. Lamprey
that were detected multiple times did not move appreciably between detections; however,
it is impossible to know whether these fish were alive. One of these fish was detected
above Bonneville Dam in 2003. We had no other evidence that the radio-tagged lamprey
attempted to pass over the dam in their second summer.
As in previous years, we found that radio-tagged lamprey entered the MWC and
held there for extended periods. In 2002, we designed and tested two prototype bypass
collectors at the Bradford Island MWC: a closed tube collector and an open ramp

56
collector. In preliminary testing, we found that providing attraction flow at the closed tube
did not improve its efficacy. We also learned that a downstream orientation of the open
ramp collector resulted in higher lamprey use than an upstream orientation.
The bypass collectors that we tested showed great promise, with as many as 50
lamprey collected per night of operation. Moreover, we estimated that as many as 18% of
the lamprey in the MWC could be trapped using collectors of this type. Further testing
and refinement are needed to improve the performance of these devices. In addition,
improvements to the tag recapture methods are needed to provide better measures of
collector efficiency. Many marked fish released in the MWC were later observed at the
Bradford Island count window, indicating that they were are not staying in the study area,
thereby reducing the probability of recapture. Improvements to methods for releasing the
fish into the MWC may result in better retention of fish in the study area.
ACKNOWLEDGMENTS
We thank C. Bernard for his help with all aspects of the field work on this project.
The development, construction, and placement of the bypass structures would not have
been possible without the skills of J. Simonson and J. Moser. In addition, M. Heinrich, S.
Lee, D. Quempts, and many others helped with the capture and/or tracking of lamprey. K.
Tolotti maintained and downloaded the receivers. B. Burke and T. Bohn managed the
telemetry database and helped with data processing. K. Frick and D. Sparks made the
maps for this report. Administrative assistance and/or manuscript review was provided by
J. Butzerin, D. Clugston, D. Dey, and T. Ruehle. Funding for this work was provided by
the U.S. Army Corps of Engineers, Portland District.

57
REFERENCES
Bjornn, T. C., M. L. Keefer, C. A. Peery, K. R. Tolotti, and R. R. Ringe. 2000a. Adult
chinook and sockeye salmon, and steelhead fallback rates at Bonneville Dam,
1996-1998. Technical Report 2000-1. Idaho Cooperative Fish and Wildlife
Research Unit, University of Idaho, Moscow, Idaho.
Bjornn, T. C., M. L. Keefer, and L. C. Stuehrenberg. 2000b. Behavior and survival of
adult chinook salmon that migrate past dams and into tributaries in the Columbia
River drainage as assessed with radio telemetry. Pages 305-312, In: J. H. Eiler, D.
J. Alcorn, and M. R. Neuman (editors). Biotelemetry 15, Proceedings of the 15th
International Symposium on Biotelemetry. Juneau, Alaska, USA. International
Society of Biotelemetry. Wageningen, The Netherlands.
Close, D. A. 2001. Effects of acute stress and tagging on the swimming performance and
physiology of Pacific lampreys (Lampetra tridentata). Masters thesis. Oregon State
University, Corvallis.
Close, D. A., M. S. Fitzpatrick, and H. W. Li. 2002. The ecological and cultural
importance of a species at risk of extinction, Pacific lamprey. Fisheries 27:19-25.
DART (Data Access Real Time). 1995. Columbia River data access in real time.
Columbia Basin Research, School of Aquatic and Fishery Sciences, University of
Washington, Seattle. Interactive database available via the internet at
http://www.cbr.washington.edu/dart/dart.html.
Hammond, R. J. 1979. Larval biology of the Pacific lamprey, Entosphenus tridentatus
(Gairdner), of the Potlatch River Idaho. Masters thesis. University of Idaho,
Moscow.
Kan, T. T. 1975. Systematics, variation, distribution, and biology of lampreys of the genus
Lampetra in Oregon. Doctoral dissertation. Oregon State University, Corvallis.
Kostow, K. 2002. Oregon lampreys: natural history, status, and analysis of management
issues. Oregon Department of Fish and Wildlife, Portland, Oregon.

58
Matter, A. L., J. J. Vella, and L. C. Stuehrenberg. 2000. Migration passage patterns of
Pacific lamprey at Bonneville Dam, 1996-1998. Pages 278-285, In: J. H. Eiler, D.
J. Alcorn, and M. R. Neuman (editors). Biotelemetry 15, International Society of
Biotelemetry, Wageningen, The Netherlands.
Mesa, M. G., J. M. Bayer, and J. G. Seelye. 2003. Annual sex steroid and other
physiological profiles of Pacific lampreys (Lampetra tridentata): implications for
upstream migration past dams? Report to U.S. Army Corps of Engineers, Portland
District, Portland, Oregon.
Moser, M. L., and D. A. Close. 2003. Assessing Pacific lamprey status in the Columbia
River Basin. Northwest Science 77:116-125.
Moser, M. L., A. L. Matter, L. C. Stuehrenberg, and T. C. Bjornn. 2002a. Use of an
extensive radio receiver network to document Pacific lamprey (Lampetra
tridentata) entrance efficiency at fishways in the lower Columbia River.
Hydrobiologia 483:45-53.
Moser, M. L., P. A. Ocker, L. C. Stuehrenberg, and T. C. Bjornn. 2002b. Passage
efficiency of adult Pacific lampreys at hydropower dams on the lower Columbia
River, U.S.A. Transactions of the American Fisheries Society 131:956-965.
Moser, M. L., D. A. Ogden, S. G. McCarthy, and T. C. Bjornn. 2003. Migration behavior
of adult Pacific lamprey in the lower Columbia River and evaluation of Bonneville
Dam modifications to improve passage, 2001. Report to U.S. Army Corps of
Engineers, Portland District, Portland, Oregon.
Ocker, P. A., L. C. Stuehrenberg, M. L. Moser, A. L. Matter, J. J. Vella, B. P. Sandford, T.
C. Bjornn, and K. R. Tolotti. 2001. Monitoring adult Pacific lamprey (Lampetra
tridentata) migration behavior in the lower Columbia River using radiotelemetry,
1998-99. Report to U.S. Army Corps of Engineers, Portland District, Portland,
Oregon.
Scott, W. B., and E. J. Crossman. 1973. Freshwater fishes of Canada. Fisheries Research
Board of Canada, Bulletin 184.
Simpson, J., and R. Wallace. 1982. Fishes of Idaho. University Press of Idaho, Moscow,
Idaho.

59
Starke, G. M., and J. T. Dalen. 1995. Pacific lamprey (Lampetra tridentata) passage
patterns past Bonneville Dam and incidental observations of lamprey at the
Portland District Columbia River dams in 1993. U.S. Army Corps of Engineers,
Bonneville Lock and Dam, Cascade Locks, Oregon.
USACE (U.S. Army Corps of Engineers) 1997. Annual Fish Passage Report: Columbia
and Snake Rivers for Salmon, Steelhead, and Shad. North Pacific Division, U.S.
Army Corps of Engineers, Portland, Oregon.
USACE (U.S. Army Corps of Engineers) 1998. Annual Fish Passage Report: Columbia
and Snake Rivers for Salmon, Steelhead, and Shad. North Pacific Division, U.S.
Army Corps of Engineers, Portland, Oregon.
USACE (U.S. Army Corps of Engineers) 1999. Annual Fish Passage Report: Columbia
and Snake Rivers for Salmon, Steelhead, and Shad. North Pacific Division, U.S.
Army Corps of Engineers, Portland, Oregon.
USACE (U.S. Army Corps of Engineers) 2000. Annual Fish Passage Report: Columbia
and Snake Rivers for Salmon, Steelhead, and Shad. North Pacific Division, U.S.
Army Corps of Engineers, Portland, Oregon.
USACE (U.S. Army Corps of Engineers) 2001. Annual Fish Passage Report: Columbia
and Snake Rivers for Salmon, Steelhead, and Shad. North Pacific Division, U.S.
Army Corps of Engineers, Portland, Oregon.
USACE (U.S. Army Corps of Engineers) 2002. Annual Fish Passage Report: Columbia
and Snake Rivers for Salmon, Steelhead, and Shad. North Pacific Division, U.S.
Army Corps of Engineers, Portland, Oregon.