Embed Size (px)
Citation preview
1
Migration and Technological Change in Rural Households: Complements or Substitutes?
Mariapia Mendola
University of Milano-Bicocca and Centro Studi L. d’Agliano
Last version: July 2006
Abstract In this paper we study the interrelationship between determinants of migration, conceived as a family strategy, and the potential impact of having a migrant household member on the people left behind. Labour migration is often related to poverty but, given its lumpy-investment nature, lack of resources may constitute both a motivation and a hurdle to migrate. We use a cross-sectional household survey from rural Bangladesh to test whether migration is a diversification strategy that enables sending households to uptake high-yielding seed technology. We account for heterogeneity of migration constraints by differentiating between temporary-domestic, permanent-domestic and international movement. We find that households able to engage in costly high-return migration (i.e. international migration) are more likely to employ modern farming technology, thereby achieving higher productivity. Poorer households, on the other hand, are unable to overcome the entry costs of cross-border movement and fall back on low net-return (i.e. domestic) migration, which does not drive production enhancements and may act as a poverty-trap. JEL Classifications: O12, D13, F22, Q12 Keywords: Internal and International Migration, Farm Household Behaviour, Technology Adoption. Acknowledgments: This version of the paper was prepared while I was visiting the Department of Economics at the New York University, whose hospitality I gratefully acknowledge. I wish to thank Giorgio Barba Navaretti, José Cuesta, Eliana La Ferrara, Raffaele Miniaci and Alan Winters for valuable comments and suggestions. I also benefited from insightful discussions with Bruno Bosco, Massimiliano Bratti, Gero Carletto, Francesco Daveri, Benjamin Davis, Carlo Devillanova, Paolo Epifani, Harounan Kazianga, Matteo Manera, Jonathan Morduch, Alessandro Santoro, Matthew Wiswall and participants in the II IZA Annual Migration Meeting at the University of Illinois at Chicago, the 2005 NEUDC at the Brown University, seminars at FAO-ESAE, University of Milan and University of Milano-Bicocca. Usual disclaimers apply. Correspondence: University of Milano-Bicocca, P.za dell’Ateneo Nuovo 1, 20126 Milano, [email protected]
2
1. Introduction
Migration from developing countries has become a central issue in the study of economic
development, but whether this process should be promoted or discouraged is currently hotly
debated. This paper contributes to the debate by shedding some light on the potential
complementarity between rural out-migration and productive activities in farm households at
origin. It looks, in particular, at the economic impact of domestic, both temporary and
permanent, and international outflows from rural Bangladesh on the adoption of modern seed
technology by migrant-sending households.
It is widely recognised that ‘spatially-diversified’ families represent an institution arising
from or influenced by the risky nature of rural production and the difficulties of self-insurance
in low-income rural settings (Rosenzweig, 1988; Morduch, 1994). The insurance motives for
migration have been emphasised by the New Economics of Labour Migration (NELM),
according to which greater income uncertainty may encourage out migration as a risk
diversification strategy (Stark and Levhari, 1982; Katz and Stark, 1986). Moreover,
remittances received from migrant members represent a potential means to overcome credit
constraints for source households (Lucas, 1987; Stark, 1991). Off-setting factors of migration
include the loss of labour force and human capital resources in the place of origin, along with
several fixed and opportunity costs for the whole family, in terms of forgone working capital,
skills, yield, and income. Overall, how migration shapes the productive capacity of household
members left behind and whether it enables risk-taking production behaviour at origin are
open questions. This paper adds to the literature by offering new empirical evidence on the
potential effect of migration on productivity-enhancement choices in source farm households,
such as the adoption of high-yielding varieties (HYVs) of rice. Production of rice is central to
the Bangladeshi agricultural economy and modern seed of the Green Revolution type is a
relatively diffused, divisible and profitable technology, but also notoriously more susceptible
to yield variability than traditional varieties.
We use cross-sectional household data from eight villages in two rural regions of Bangladesh
to examine the simultaneous household decisions about whether to adopt a new agricultural
technology and whether to have a temporary domestic, permanent domestic or international
migrant member. A main contribution of this paper is in accounting for the ‘investment
nature’ of migration by looking at heterogeneous household migration strategies, which entail
different net-returns, in terms of initial costs and the remittances sent home. We argue that the
choice (or chance) between alternative outside destinations – that commonly coexist in
developing rural contexts but are little researched in a simultaneous framework - provides an
interesting testing ground to analyse the potential non-monotonic effects of migration on
3
household productive investments at origin. Our findings show that households able to engage
in costly high-return migration, i.e. international migration, are more likely to employ modern
varieties of rice. Asset-poorer households, on the other hand, are unable to support the costs
of cross-border movement and fall back on domestic migration, which has a negative impact
on yield-increasing technological change, thereby locking them into low productive
performance.
The remaining portion of the paper is organised as follows. Section 2 draws on NELM
insights to briefly discuss migration as a costly household subsistence strategy that may lead
to complementarities or trade-offs between economic opportunities elsewhere and productive
activities at home. Section 3 discusses some specific features of internal and overseas
migration in Bangladesh. In section 4 we outline the data set and descriptive statistics of the
main variables used in the inferential analysis, while in section 5 we present the estimation
strategy and the empirical results. Section 6 concludes.
2. Understanding migration: development-strategy or poverty-trap? Migration is a common subsistence strategy in developing countries and people mobility, for
temporary or permanent labour purposes, is routinely part of life in agricultural contexts.
According to the theoretical literature, no one element can be considered as the single
contributory force in migration pressure, and there are competing insights about the role
migration plays in enhancing (or hindering) economic development in source communities1.
Drawing on the seminal work of Stark (1978), the NELM theory explains migration as an
inter-temporal household strategy entailing interrelationships between determinants and
impacts for the migrant and for the whole household left behind. The motivations behind
migration are conceived in terms of imperfections in credit and risk markets, whereby having
a migrant member working elsewhere is a family strategy to manage uncertainty, diversify the
income portfolio and alleviate liquidity constraints through remittances (Stark, 1991).
Accordingly, the migrant (both temporary and permanent) is part of a spatially extended
household that acts collectively to reduce idiosyncratic risks by maintaining cooperation over
long distances (through remittances sent by migrants, for example, or inheritance left by
people at origin).
There is a growing empirical literature showing that the major impacts of migration and
remittances on source rural areas occur through changes in the patterns of expenditure and
1 See Williamson (1998) and Taylor and Martin (2001) for a review of the theoretical foundations and empirical evidence on migration.
4
investments of households having migrant members2. Indeed, it has been widely claimed that
in many developing countries remittances are a significant component of household income
that enables recipient families to smooth their consumption and improve their wellbeing (see
among others Durand et al., 1996 and Taylor et al.,1996). Moreover, it has been shown that
earnings of international migrants have a positive impact on crop productivity, and may also
serve as a source of capital accumulation in rural households (see Lucas, 1987 on South-
African migration, and Rozelle et al., 1999 on China). What is less clear from the literature,
though, is to what extent the beneficial effects of the migration-strategy are able to ‘protect’
household members left behind and improve their productive-investment capacity. That is to
say, what ‘causes’ the development impact of rural out-migration, and how does migration
affect source households’ production behaviour and their ability to achieve technical
efficiency in agricultural activities.
If the NELM hypothesis holds, remittance-receiving households and/or ‘better-insured’
households – those with migrant members working elsewhere – will be more able to
undertake higher-risk profitable activities than households with no migrants. Yet, migration
entails significant fixed and opportunity costs for the whole household, which may limit the
generality and effectiveness of this informal insurance mechanism for households at origin3.
Moreover, costly diversification may imply an ‘efficiency loss’ for the poor that the rich –
typically better protected via assets and institutional arrangements – may not have to endure
(Dercon, 2002). In this sense, while constituting a motivation for migration, imperfections in
capital and insurance markets may also act as a constraint to migrate (Taylor and Martin,
2001). This would result in the seeming poverty-trap whereby worse-off households are either
not able to send migrants to work elsewhere, or if they do engage in migration, it may involve
scarifying efficiency in order to reduce income fluctuations. In this paper we account for
heterogeneity of migration constraints by specifying a simultaneous framework of
determinants and consequences of migration and by differentiating between domestic – both
temporary and permanent – and international migration choices. The latter typically entail
very different net-returns, in terms of the initial costs and remittances sent back home. Thus,
even though different forms of migration all represent household diversification strategies,
2 Evidence on this includes Katz and Stark (1986); Lucas and Stark (1985, 1988); Lucas (1997); Rosenzweig (1988); Rosenzweig and Stark (1989). 3 Fixed initial financial costs are typically related to travel, and recruiting agency and accommodation expenses. Opportunity costs of migration include forgone working capital, skills, yield, and income. In general, if access to profitable activities requires some initial cash outlay or start-up costs (to be paid in advance to investment returns), then multiple equilibria are likely to occur and poverty traps phenomena may be observed. There are several theoretical and empirical contributions on the consequences of imperfect credit market and initial market constraints in terms of risk-management capacity, low-risk investment by poorer farmers, poverty traps (Eswaran and Kotwal, 1990, Banerjee and Newman, 1993, Dercon 1996, 1998, Morduch, 1995).
5
they may be subject to different selection processes and, at the same time, may result in
different risk-taking behaviour in productive activities at origin. By simultaneously estimating
the determinants and consequences of different forms of migration, this study aims at
shedding light on the role of entry costs in shaping household migration strategies and the
potential non-monotonic impact of these strategies on the farm households left behind.
3. Migration flows in Bangladesh Bangladesh’s economy has registered positive figures with respect to economic and human
development achievements over the last 25 years. Average annual GDP growth rate increased
from 2.4 percent in the 1980s to 4.9 percent during the 1990s (WB, 2000). The human
development index increased from 0.335 in 1975 to 0.478 in 2000 (UNDP, 2002). Literacy
rates also increased, from 23.8 percent in 1981 to 40.8 percent in 2001. However, Bangladesh
still remains one of the least developed countries in the world, with half of its population
living below the poverty line (WDR, 2000)4.
Historically, labour migration within and across national frontiers has been an enduring
component of Bangladesh’s development pattern. After independence in 1971, the labour
markets in the Middle East offered scope for Bangladeshi migrant labour, while later
migration expanded to the newly industrialised countries of South East Asia (IOM, 2005).
There is a paucity of accurate data on labour migration from Bangladesh. However, official
gross figures indicate that between 1976 and 2004 more than 3.8 million Bangladeshis
migrated for employment reasons and since the late 1990s, some 200,000 or more leave the
country every year, officially to work elsewhere (Bureau of Manpower Employment and
Training data reported in IOM, 2005a).
Determinants of both short and long-term migration are complex, and depend on many factors
representing economic, social and cultural realities. According to official figures,
international migrants are predominately young males (females account for only 1 percent of
international migration). This is mainly because the Bangladesh government has banned
certain types of female labour from independent out-migration, although many do emigrate
through unofficial channels (INSTRAW and IOM, 2000).
According to micro-level studies, Bangladeshi labour force in different parts of the world is
primarily constituted by unskilled and semi skilled workers (Hossain, 2001; Siddiqui, 2003).
4 In the late 1970s, 68% of the Bangladeshi population lived below the poverty line; this figure dropped to 44.7% in the second half of 1990s but increased again to 50% in 2000 (WDR, 2000). The three-quarters of the population reside in rural areas where the rate of severe poverty remains twice as high as in urban areas (19%) (World Bank, 2003).
6
In 2001, for example, 58 percent of migrant workers were unskilled or semi-skilled, while the
proportion of professionals was just 3 percent (IOM 2005a).
Bangladesh exports contract labour mostly to Middle Eastern and Southeast Asian countries
(the largest communities are in Saudi Arabia, Kuwait, Malaysia, South Korea, Singapore); in
the west the UK and US are the two main destinations for migration labour from Bangladesh5
(IOM 2005a).
Also migration within Bangladeshi borders has assumed great importance as a component of
people’s living strategies, and in shaping the national economy. According to recent surveys
by the United Nations, the International Labour Organization and the Bangladesh Bureau of
Statistics (BBS), rural to urban migration in Bangladesh accounts for two-third of the overall
migration flow (where the remaining 10 percent is represented by rural-rural migration and 24
percent by international migration) (see Afsar et al., 2000)6. Traditionally, economic migrants
to internal urban areas were mostly young males, but with the recent increase in demand for
female labour in the readymade garment factories of the metropolitan areas of Dhaka Khulna
and Chittagong this has changed significantly (Siddiqui 2003).
Most migrants send part of their earnings home on a regular or irregular basis. According to
official data, in the last 3 decades remittance flows to Bangladesh have increased
dramatically, from US$ 24 million in 1976 to more than US$ 2,600 million in 2002 (IOM,
2005a).
The scanty evidence on Bangladeshi migration shows that remittances are a crucial source of
income for consumption, for loan repayment and to expand business in agricultural products
or construction materials. Remittances also help to generate savings, the major source of
capital in Bangladesh, in the absence of institutional credit on easy terms (IOM, 2005a;
Siddiqui, 2003).
Few studies are available on migration patterns from rural Bangladeshi areas. Based on
anecdotical evidence, it is argued that the extreme poor people are likely to undergo a period
of temporary migration in gradually moving to other parts of the country (Siddiqui, 2003).
Some rural people do migrate abroad but there is little available data on the proportion of
international migrants from rural areas.
5 Australia, Canada, Germany, France are also countries favoured by Bangladeshis migrants (IOM, 2005a). 6 Figures on the rural-rural migration flow seem out of line with evidence on other countries, such as India (IOM 2005b). The figures here comes out from panel data generated from 62 randomly sampled villages drawn from the Bangladesh Bureau of Statistics (BBS) ‘sample vital registration’, which estimates lifetime migration (Rahman et al. 1996 quoted in Afsar 2003). Afsar (2003), though, argues that data from the vital registration system suffer from sampling and non-sampling errors. Moreover, they do not take account of temporary or seasonal rural-rural migration.
7
It has been claimed that international migration typically generates much higher levels of
remittances than rural-rural or rural-urban migration. However, there are financial obligations
for migration across Bangladeshi borders, which include the cost of a visa, the airfare, and
recruiting agency commission charges7 (Afsar et al. 2000). Given the structural problems
involved in the migration process in Bangladesh, and the importance of repayment of the
costs of migration, the migration-development nexus may not be straightforward.
4. Data and descriptive statistics The empirical analysis is based on a household survey of 5062 households from 8 villages in
Chandina and Madhupur thanas in Bangladesh, conducted by the Institute of Development
Studies (Sussex, UK) in 1994/95. The survey collected detailed information on household
characteristics, asset endowment, food production and non-farm activities. Information on
migration of household members was gathered for each household, including information on
duration and destination of migration, moving costs and remittances received from migrants.
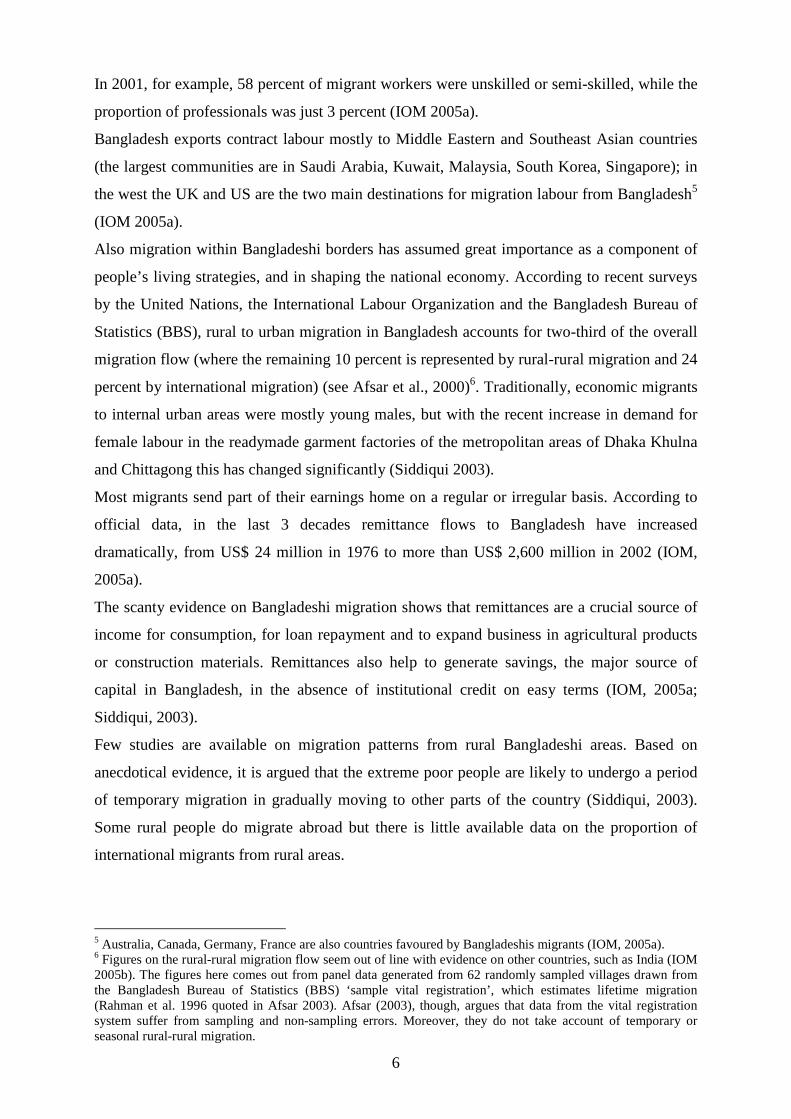
In our study we restrict the sample to 3404 farm households who are operating land in the
survey year, 30 percent of whom have put at least part of their growing area down to new rice
varieties8. Figure 1 reports the average productivity of the main crops cultivated by sample
farmers, and shows the higher productivity of HYVs of rice with respect to other crops9.
020406080
100
HYVpaddy
Otherpaddy
Wheat Dharos Otherpulses
Kochu
Crop
Ave
rag
e p
rod
uct
ivit
y
Figure 1: Average crop productivity (value of output (Tk) per acre of land operated)
7 The recruitment process for migrant workers in Bangladesh is rather complex. A host of intermediaries, some of which are official and formal, while others are rather dubious, dominate the process, which is mostly privatised. Following the selection process, the recruitment agency organises the visa, air ticket and placement of workers in the receiving country for a relatively high fee. Yet, a recent proliferation of recruitment agencies has lowered agency costs somewhat (Afsar et al. 2000). See also IOM (2005a). 8 Including landless households, or household who do not operate any land, would entail a general equilibrium analysis (on the impact of migration on land acquisition, for example). We adopt a partial equilibrium approach instead, as the rather thin Bangladeshi land market reduces the risk of potential sample selection bias. 9 HYVs of rice are reported by the survey respondent to be manly grown in the monsoon (Aman) season (when pests and diseases are widespread and risks high).
8
However, growing modern seeds is risky and the coefficient of variation of the farmer’s
output per acre is 0.48, compared with 0.29 for other crops10.
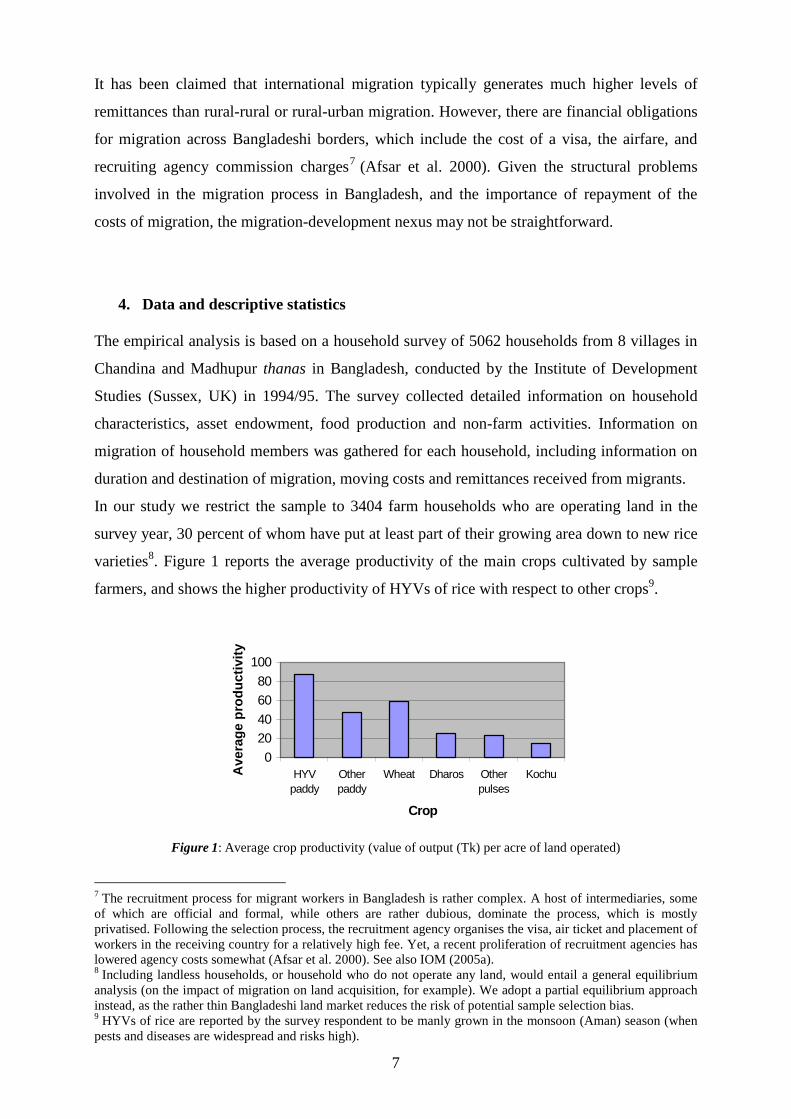
In terms of migration, one third of the sample farm households have at least one member left
to work elsewhere. A key point in this study is mapping three different types of migration,
namely temporary and permanent national migration, and international migration. Migration
categories are identified through household questionnaires: responding households report
whether they have experienced migration for work of family members and provide
information for each migrant about the destination of movement (either abroad or within the
country) and whether it has a temporary or permanent feature11 , plus some other
characteristics of migrants. Overall, the sample involves 1241 migrants, distributed and
characterised as shown in Table 1.
TABLE 1 CHARACTERISTICS OF MIGRANTS
(individual level) MIGRATION TYPE TEMPORARY PERMANENT INTERNATIONAL
521 562 158 Number of migrants (percentage) (42%) (45%) (13%) Average age of migrants 33.34 29.13 31.96 Average education of migrants (year of schooling) 1.24 5.42 6.15 Average migration spell (how many years before 1995 migrants have left for the first time) 8.7 7.6 3.5 Percentage of male migrants 99.62 95.02 100 Percentage of married migrants 84.45 56.23 64.56
Across the different categories, sample migrants are predominately young men, around 30
years old. What differs across types of migration is the migrants’ education level, which is
clearly higher in the case of permanent and international migration. Moreover, international
migration appears the most recent typology of movement in the sample households, as it is
reported to be first experienced on average 3.5 years prior the survey, whilst domestic
permanent migration started earlier and temporary migration first occurred more than 8 years
prior to the year of the survey.
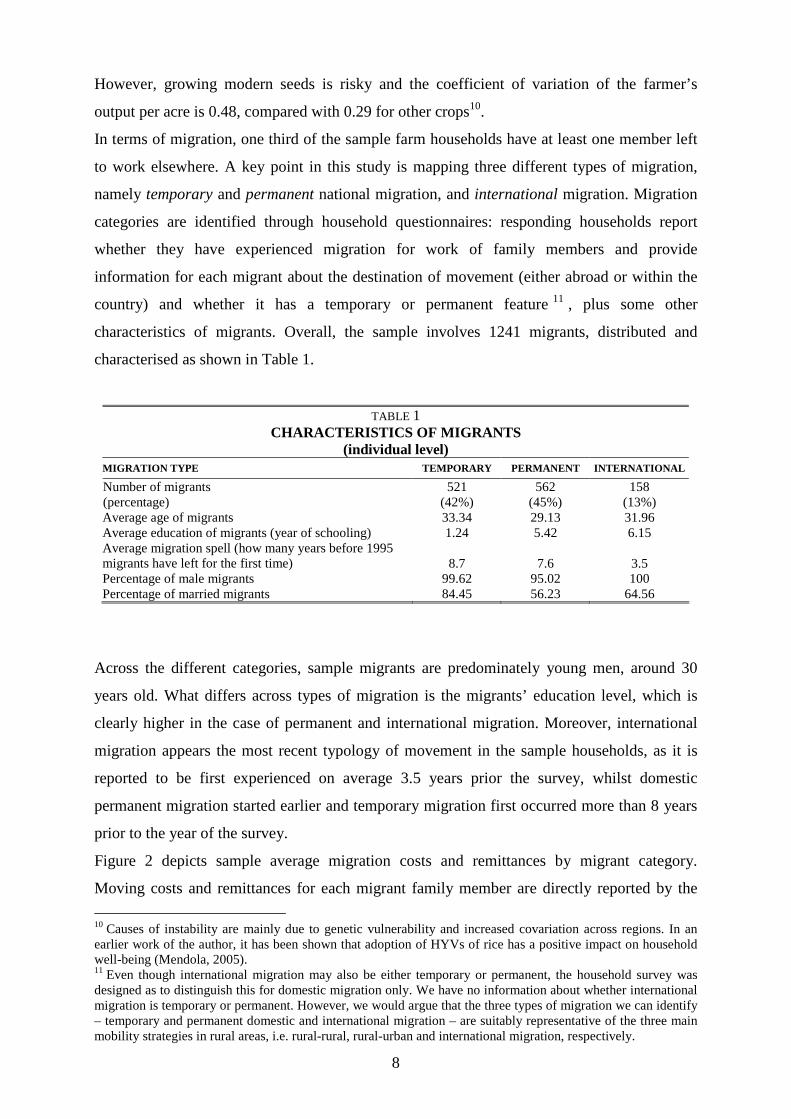
Figure 2 depicts sample average migration costs and remittances by migrant category.
Moving costs and remittances for each migrant family member are directly reported by the
10 Causes of instability are mainly due to genetic vulnerability and increased covariation across regions. In an earlier work of the author, it has been shown that adoption of HYVs of rice has a positive impact on household well-being (Mendola, 2005). 11 Even though international migration may also be either temporary or permanent, the household survey was designed as to distinguish this for domestic migration only. We have no information about whether international migration is temporary or permanent. However, we would argue that the three types of migration we can identify – temporary and permanent domestic and international migration – are suitably representative of the three main mobility strategies in rural areas, i.e. rural-rural, rural-urban and international migration, respectively.
9
survey respondent. They refer to the initial costs sustained by the household to send out a
migrant (i.e. costs of travel, visa, recruiting agency etc.) and the amount of money they
receive from her/him. It can be seen there are significant differences in the net-returns across
typologies of migrants, with international migration yielding the highest level of costs and
remittances12.
0.82 181.55
14493.67
2774.427686.74
52610.76
0.00
10000.00
20000.00
30000.00
40000.00
50000.00
60000.00
Temporary Permanent Internationl
Migration Costs Remittances
Figure 2: Average migration costs and remittances by migrant categories (individual level - in Taka)
Taking the household as the unit of analysis, around 62 percent of sample households have
only one migrant member, 27 percent have two, 9 percent have three and in the remaining 1
percent of families four members have emigrated. When more than one member of the same
household emigrates, in 30 percent of cases they do not belong to the same migration
typology. This is to say that migration types are not mutually exclusive within a household.
Yet, we can map out the different types of mobility at household level by ‘ordering’ the
migration categories such that if there is more than one migrant in the household,
international migration will be always captured, followed by permanent migration and then
temporary migration. In other words, we define a categorical variable as follows:
JiM = 0, if household i has no migrant members;
JiM = 1 if household i has at least one migrant belonging to the Jth category
where J = temporary migration without any permanent or international migrant; permanent
migration without any international migrant; international migration. We define it thus
because, as we could see from Figure 2, the three typologies of migration involve different
net-returns and may represent different household strategies (as it will be analysed in more 12 It is also interesting to note that while international migration produces the largest absolute return, the typology giving the highest rate of return is temporary domestic migration. This perhaps explains the large percentage of people that engage in temporary internal migration. However, here we focus on the net return as this is what can have an impact on people left behind.
10
detail). Therefore, although we are obliged to overlook potential interactions between
household migration strategies, we focus on the ‘affordability’ of migration as a form of
household investment strategy13.
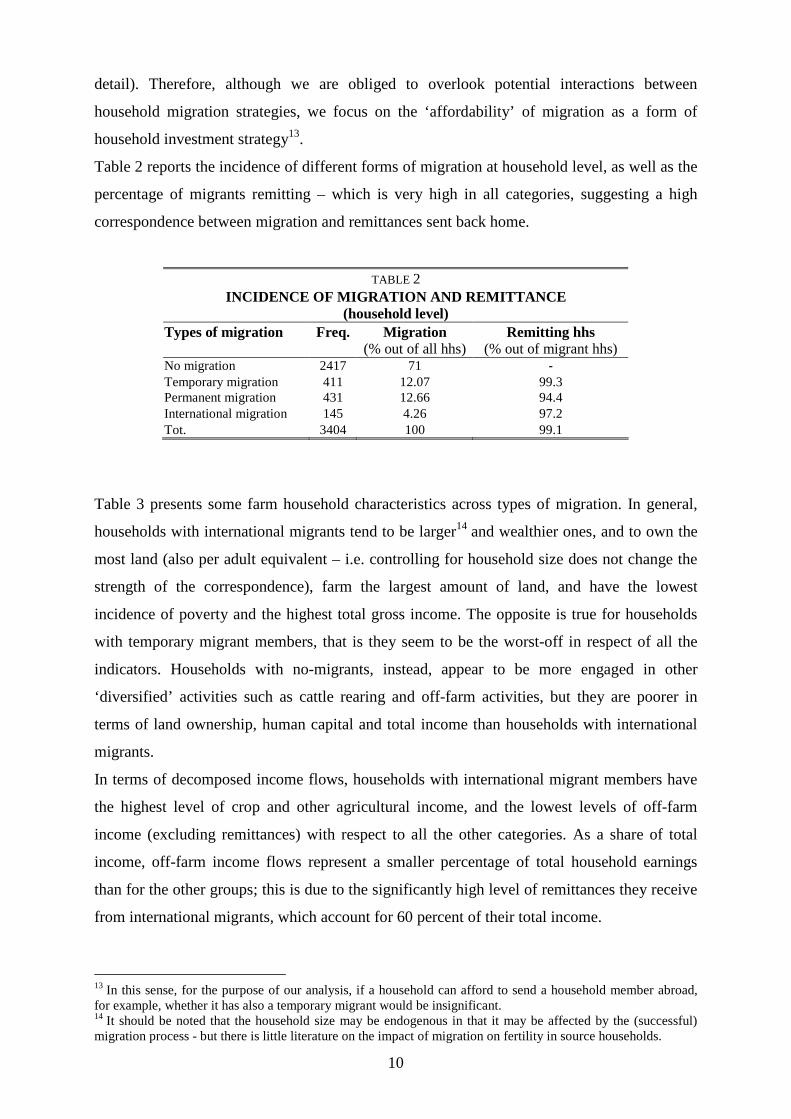
Table 2 reports the incidence of different forms of migration at household level, as well as the
percentage of migrants remitting – which is very high in all categories, suggesting a high
correspondence between migration and remittances sent back home.
TABLE 2 INCIDENCE OF MIGRATION AND REMITTANCE
(household level) Types of migration Freq. Migration
(% out of all hhs) Remitting hhs
(% out of migrant hhs) No migration 2417 71 - Temporary migration 411 12.07 99.3 Permanent migration 431 12.66 94.4 International migration 145 4.26 97.2 Tot. 3404 100 99.1
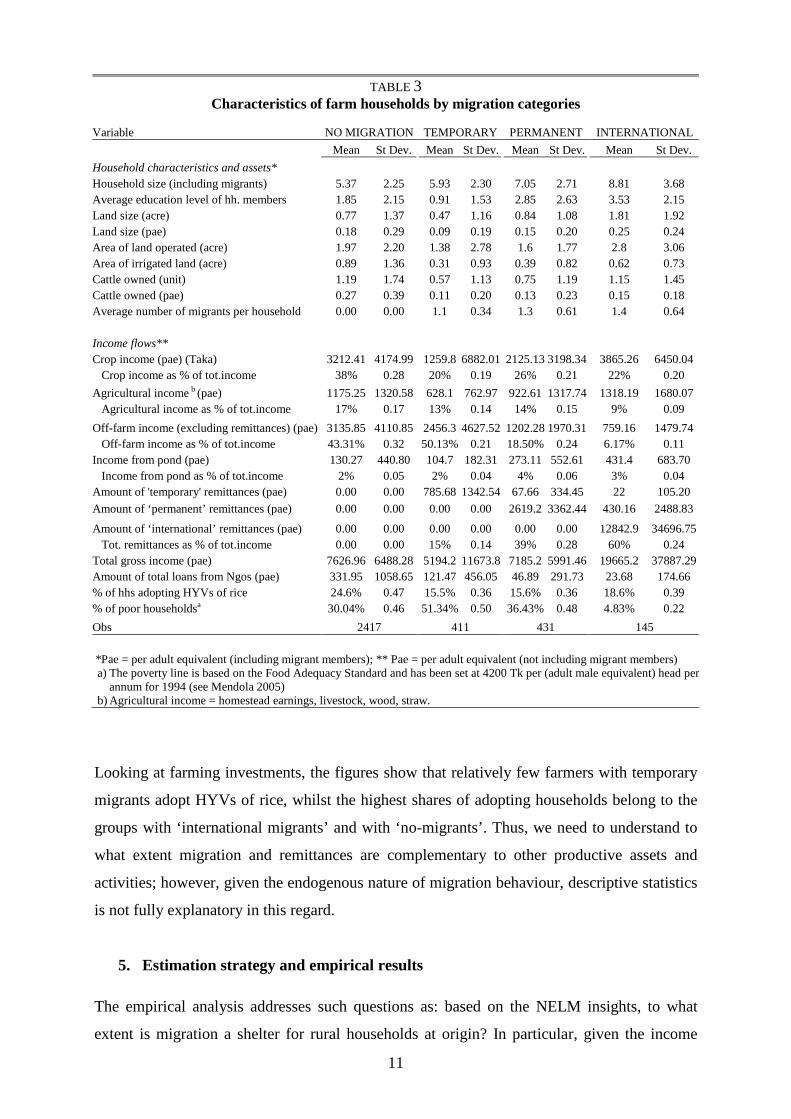
Table 3 presents some farm household characteristics across types of migration. In general,
households with international migrants tend to be larger14 and wealthier ones, and to own the
most land (also per adult equivalent – i.e. controlling for household size does not change the
strength of the correspondence), farm the largest amount of land, and have the lowest
incidence of poverty and the highest total gross income. The opposite is true for households
with temporary migrant members, that is they seem to be the worst-off in respect of all the
indicators. Households with no-migrants, instead, appear to be more engaged in other
‘diversified’ activities such as cattle rearing and off-farm activities, but they are poorer in
terms of land ownership, human capital and total income than households with international
migrants.
In terms of decomposed income flows, households with international migrant members have
the highest level of crop and other agricultural income, and the lowest levels of off-farm
income (excluding remittances) with respect to all the other categories. As a share of total
income, off-farm income flows represent a smaller percentage of total household earnings
than for the other groups; this is due to the significantly high level of remittances they receive
from international migrants, which account for 60 percent of their total income.
13 In this sense, for the purpose of our analysis, if a household can afford to send a household member abroad, for example, whether it has also a temporary migrant would be insignificant. 14 It should be noted that the household size may be endogenous in that it may be affected by the (successful) migration process - but there is little literature on the impact of migration on fertility in source households.
11
TABLE 3 Characteristics of farm households by migration categories
Variable NO MIGRATION TEMPORARY PERMANENT INTERNATIONAL
Mean St Dev. Mean St Dev. Mean St Dev. Mean St Dev.
Household characteristics and assets* Household size (including migrants) 5.37 2.25 5.93 2.30 7.05 2.71 8.81 3.68 Average education level of hh. members 1.85 2.15 0.91 1.53 2.85 2.63 3.53 2.15 Land size (acre) 0.77 1.37 0.47 1.16 0.84 1.08 1.81 1.92 Land size (pae) 0.18 0.29 0.09 0.19 0.15 0.20 0.25 0.24 Area of land operated (acre) 1.97 2.20 1.38 2.78 1.6 1.77 2.8 3.06 Area of irrigated land (acre) 0.89 1.36 0.31 0.93 0.39 0.82 0.62 0.73 Cattle owned (unit) 1.19 1.74 0.57 1.13 0.75 1.19 1.15 1.45 Cattle owned (pae) 0.27 0.39 0.11 0.20 0.13 0.23 0.15 0.18 Average number of migrants per household 0.00 0.00 1.1 0.34 1.3 0.61 1.4 0.64 Income flows** Crop income (pae) (Taka) 3212.41 4174.99 1259.8 6882.01 2125.13 3198.34 3865.26 6450.04 Crop income as % of tot.income 38% 0.28 20% 0.19 26% 0.21 22% 0.20
Agricultural income b (pae) 1175.25 1320.58 628.1 762.97 922.61 1317.74 1318.19 1680.07 Agricultural income as % of tot.income 17% 0.17 13% 0.14 14% 0.15 9% 0.09
Off-farm income (excluding remittances) (pae) 3135.85 4110.85 2456.3 4627.52 1202.28 1970.31 759.16 1479.74 Off-farm income as % of tot.income 43.31% 0.32 50.13% 0.21 18.50% 0.24 6.17% 0.11 Income from pond (pae) 130.27 440.80 104.7 182.31 273.11 552.61 431.4 683.70 Income from pond as % of tot.income 2% 0.05 2% 0.04 4% 0.06 3% 0.04 Amount of 'temporary' remittances (pae) 0.00 0.00 785.68 1342.54 67.66 334.45 22 105.20
Amount of ‘permanent’ remittances (pae) 0.00 0.00 0.00 0.00 2619.2 3362.44 430.16 2488.83
Amount of ‘international’ remittances (pae) 0.00 0.00 0.00 0.00 0.00 0.00 12842.9 34696.75 Tot. remittances as % of tot.income 0.00 0.00 15% 0.14 39% 0.28 60% 0.24 Total gross income (pae) 7626.96 6488.28 5194.2 11673.8 7185.2 5991.46 19665.2 37887.29 Amount of total loans from Ngos (pae) 331.95 1058.65 121.47 456.05 46.89 291.73 23.68 174.66 % of hhs adopting HYVs of rice 24.6% 0.47 15.5% 0.36 15.6% 0.36 18.6% 0.39 % of poor householdsa 30.04% 0.46 51.34% 0.50 36.43% 0.48 4.83% 0.22
Obs 2417 411 431 145 *Pae = per adult equivalent (including migrant members); ** Pae = per adult equivalent (not including migrant members) a) The poverty line is based on the Food Adequacy Standard and has been set at 4200 Tk per (adult male equivalent) head per
annum for 1994 (see Mendola 2005) b) Agricultural income = homestead earnings, livestock, wood, straw.
Looking at farming investments, the figures show that relatively few farmers with temporary
migrants adopt HYVs of rice, whilst the highest shares of adopting households belong to the
groups with ‘international migrants’ and with ‘no-migrants’. Thus, we need to understand to
what extent migration and remittances are complementary to other productive assets and
activities; however, given the endogenous nature of migration behaviour, descriptive statistics
is not fully explanatory in this regard.
5. Estimation strategy and empirical results
The empirical analysis addresses such questions as: based on the NELM insights, to what
extent is migration a shelter for rural households at origin? In particular, given the income
12
uncertainty farm households typically face, does migration have any importance in risk-taking
behaviour in agricultural production? How is this affected by the heterogeneity of migration
constraints (i.e. by the fact that households are selected into different migration strategies)?
Based on the NELM theoretical framework, we take as unit of analysis the household as a
whole, including migrant members; this is to say that the spectrum of factors influencing the
decision to migrate involves the characteristics and wealth - in terms of human, physical and
social capital - of the whole (spatially extended) family.
We are interested in examining the implications of having a temporary, permanent or
international migrant member on source household decision about whether or not to adopt a
modern agricultural technology. The simplest way is to estimate for household i an OLS
regression of the general form:
0 1 2 2 2 i
T T P P I Ii i i i iY X M M Mγ γ γ γ γ ε= + + + + + (5.1)
where Yi denotes technology adoption for household i; iX is a set of observed farm household
variables influencing the choice of technology; JiM , with J=T;P;I, indicates whether the ith
household engages in temporary (T), permanent (P) or international (I) migration
respectively; and i
ε is the random variable of the estimated equation.
However, causal interpretation of the estimated OLS parameters is problematic as such
regression is unlikely to provide a consistent estimate of the impact of migration on
technology adoption. An immediate claim is that migration is a selective process and
observable and unobservable household characteristics shape the choice of engaging in
different forms of migration. Indeed, the selection bias comes from the fact that farm
households might have an ‘implicit’ propensity for migration based on different reasons,
some of which are not observed, and which may be positively or negatively associated with
the likelihood to adopt a new agricultural technology. Furthermore, when a farm household
decides to send out a migrant, this has simultaneous implications on its productive capacity
and may modify productivity-enhancement choices, such as a change of agricultural
technology. Indeed, farm household decides about the allocation of current labour and other
inputs on the one hand, and on investments in the household’s (human and physical)
resources and production strategy on the other.
Hence, we use a system of equations and the instrumental variable (IV) procedure, in order to
solve the potential OLS simultaneity bias and, at the same time, capture the determinants and
causal impact of migration. We argue that in a context of missing or rationed credit and
insurance markets, household characteristics and migration ‘entry barriers’ shape the expected
future return differentials and the decision to participate in (a specific type of) migration.
13
Therefore, we examine the simultaneous household decisions of whether to adopt a modern
seed technology (as a proxy for the household risk-management capacity) and whether to
have a temporary, permanent or international migrant member.
Throughout, the system of equation is estimated using linear probability models, which have
the advantages of being generally more tractable for assessing causation and applicable to
data with limited-dependent outcome variable and dummy endogenous regressors (Angrist,
2001)15. Moreover, explanatory variables of actual household investment decisions are often
of greater analytical and policy interest than latent index structural coefficients. We use a
three stage least squares (3SLS) estimator, which is the most amenable to the objective of
estimating the causal or potential effect of migration on the propensity to adopt risky
technologies (see Angrist, 2001)16. This is because the two-stage and single-stage estimates
are directly comparable and thereby we can assess the determinants of household behaviour
with respect to different migration strategies.
However, since the migration selection process is endogenously shaped by many of the same
characteristics that determine technology adoption in each regime, correct identification of the
model depends on finding instrumental variables that affect technology adoption solely
through their impact on migration choices.
5.1. Empirical analysis design In order to address the casual relationship between engaging in temporary, permanent or
international migration, and farm household propensity to adopt high-yielding seeds, we
estimate a system of equations as follows:
0 1 2Ti
J Ji i i TY X Mγ γ γ ε= + + + (5.2)
0 1 2J J J J J J
i iM iM iMM X Zβ β β ε= + + + ; J=T; P; I, (5.3)
where Yi is a binary variable equal to 1 if household i adopts the new technology; iTX is a set
of observed farm household variables influencing the choice of technology; and i T
ε is the
random variable of the estimated equation.
15 Heckman and MaCurdy (1985) show that in case of simultaneous linear probability models, IV procedure produces consistent estimates. 16 Limited dependent variable models with dummy endogenous regressors were first estimated using distributional assumptions and maximum likelihood (Heckman, 1978; Amemiya, 1978; Newey, 1987). Angrist (2001) argues that if the aim is to estimate causal or potential effects on the outcome of interest - rather than structural parameters of latent variables model - linear models are no less appropriate for binary dependent variables than non-linear models.
14
JiM are binary endogenous variables equal to 1 if the i th household participates in the Jth
migration alternative, i.e. to temporary, permanent or international migration (and zero if
there are no migrant members)17; iMX is a vector of household characteristics influencing the
decision to migrate (different effects may result across the three typologies of migration) and
JiMZ are exogenous variables to be used in the ‘first stage’ of the system as instruments for
the endogenous migration variables; i
JMε is the random variable of each migration equation.
Household behaviour with respect to technology adoption – equation (5.2) – can generally be
thought of as the result of a decision process in which the standard separability condition
between consumption and production does not hold. In particular, based on the literature on
the Green Revolution, the adoption of modern seeds may be explained by a set of family and
farming characteristics such as: household demographic variables (that are also related to
family labour endowment); human capital-related attributes (including age of the household
head as a proxy for experience); the amount of land owned (per consumption unit); land
tenure-security variables (e.g. share of temple-land18, rent-in and mortgaged-out land); own
farm equipment and powered means of ploughing; percentage of irrigated land (as a proxy for
the quality of land); and a regional dummy variable (equal to one if the household is in
Madhupur). We also include a subjective poverty measure (‘self-poor assessment’) that
captures the household’s own perception of its poverty status, and thereby is likely to
influence the household risk-taking behaviour. This binary variable is equal to one if the
household respondent directly reports to consider her/his household to be chronically or
occasionally in food deficit. It should be noted that HYVs technology is relatively well-
known in South Asia and (current) rice growers are particularly responsive to the access to
complementary inputs (e.g. irrigation, farm equipment) and non-agricultural activities (for
risk diversification motives)19.
Overall, production decisions are influenced by some of the same characteristics that
influence migration behaviour, as these both are household decisions about the allocation of
time, labour, and physical resources. In particular, based on the literature, the determinants of
household participation in migration include demographic characteristics, human capital-
related attributes, cultural and social ties (e.g. religion, migration networks), economic and
institutional environment (e.g. domicile region) and the level of household wealth. The last of
these is crucial for our analysis as it is widely recognised that asset ownership mostly 17 This is the same categorical variable as described in section 4. 18 In Bangladesh the local temple may own land (as a result of donations or being purchased to cover its maintenance costs), but it does not have any manpower to cultivate this land. Therefore, it is leased to the nearest villagers for sharecropping. 19 See Hossain (1989, 1992); Hossain and Sen (1992), and Munshi (2004).
15
determines household market participation in rural areas (e.g. credit and risk market
participation). Thus, we include three capital-related variables, i.e. land-holding, the number
of cattle owned (both per adult equivalent) and agricultural capital (i.e farming equipment), in
order to control for differences in physical capital across households.
It is worth mentioning that there are differences in assets, particularly in the illiquid and liquid
nature of land and cattle endowments respectively. Land is the main inheritable form of
wealth for Bangladeshi households, and the main asset (besides labour) that allows people to
invest in widening opportunities. Moreover, land is especially important in Bangladesh
because of its scarcity and because it is used as collateral in credit programmes. Given that the
Bangladeshi land market is very thin or even missing, it is reasonable to treat landholding as
exogenous (see Pitt and Khandker, 1988; Morduch, 1998; Pitt, 1999). The exogeneity of land
ownership challenges the potential inverse relationship between (past) migration and (current)
wealth. Cattle owning, on the other hand, is a form of saving or a liquid asset, whose role is to
cope with risk (see Dercon (1996) among others). Because of this, unlike land, it may suffer
endogeneity drawbacks; therefore, we also present results omitting this variable (in addition
to others) in parsimonious regression specifications20.
In order to examine the determinants of household migration behaviour, we conduct a
multivariate analysis that allows for a non-linear relationship between household wealth (per
adult equivalent) and the propensity for the household to have either a temporary, permanent
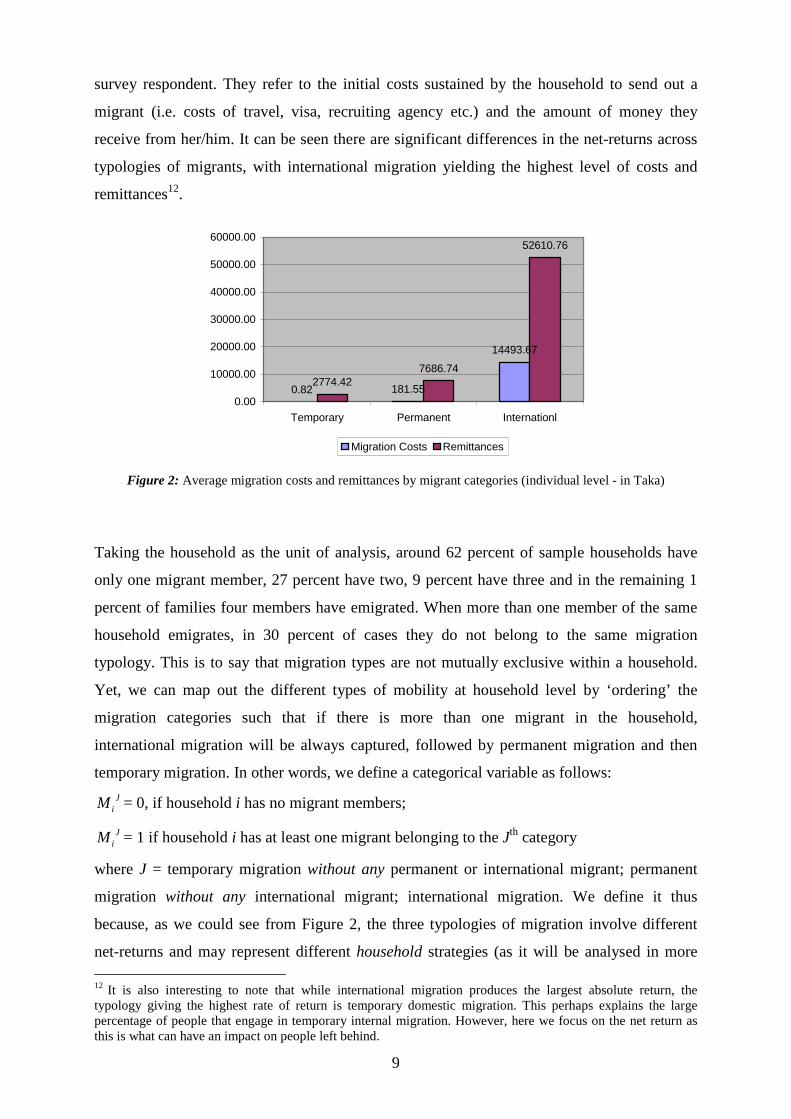
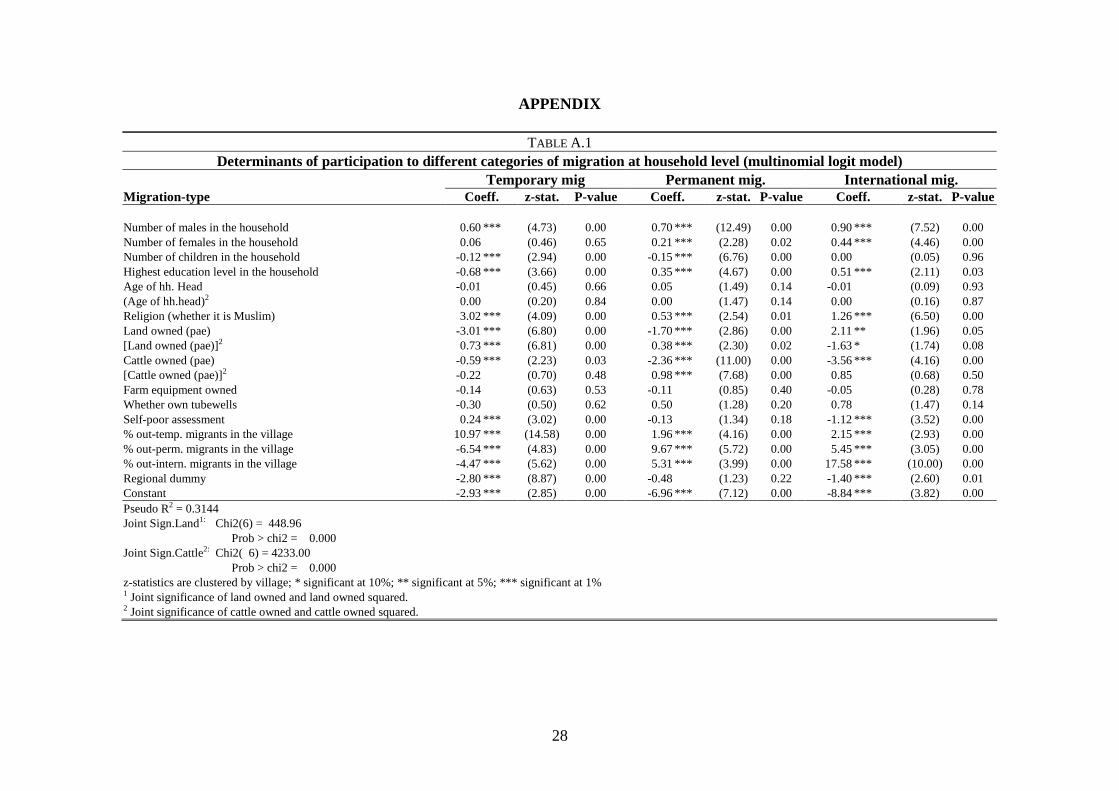
or international migrant. In particular, by estimating equation (5.3) through a multinomial
logit model, we observe a non-monotonic impact of household landholding on the probability
to migrate temporarily, permanently, or abroad, against the option of staying put. Figure 3
illustrates the cumulated predicted probabilities for the three migration outcomes according to
the amount of land owned by the household21 (results are shown in Table A.1 in Appendix).
The shape and areas of predicted probability suggest that at low levels of wealth (land owned)
farm households participate (at a decreasing rate) in temporary or permanent migration, whilst
they do not engage in international migration. At higher levels of wealth, a marginal increase
in land holding increases (at a decreasing rate) only the propensity to migrate abroad. This
20 Livestock is a (liquid) form of savings for rural households and, assuming credit rationing, it plays a similar role as migration, that is providing liquidity and risk alleviation at household level. However, the initial costs and the potential impacts of the two strategies make the investment ‘scale’ rather different for rural households. 21 The lowest line (temporary) plots the probability of having a temporary migrant for a given amount of land owned. The upper line (permanent) plots the sum of the probability of having a temporary migrant or a permanent migrant (i.e. the area between the two lines is the probability of having a permanent migrant only). And the top line (international) plots the summed probability of migrating either temporarily, permanently or internationally against the option of non-migration.
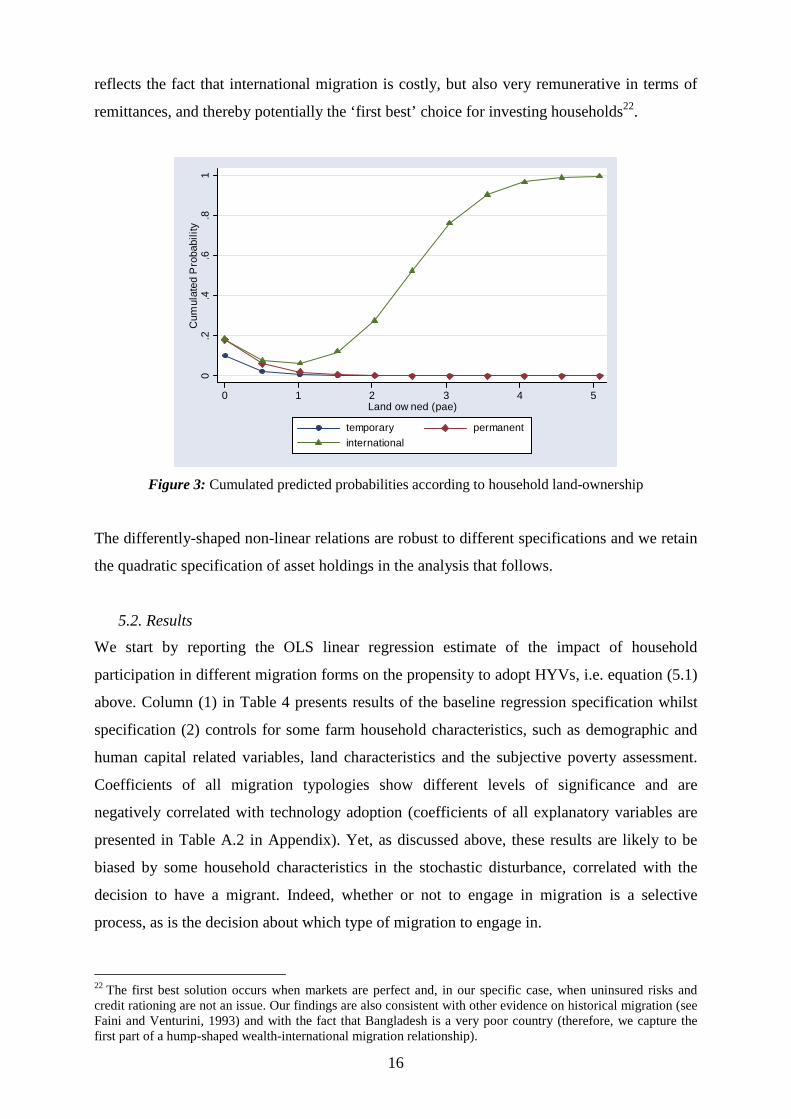
16
reflects the fact that international migration is costly, but also very remunerative in terms of
remittances, and thereby potentially the ‘first best’ choice for investing households22.
0.2
.4.6
.81
Cum
ulat
ed P
roba
bilit
y
0 1 2 3 4 5Land ow ned (pae)
temporary permanent
international
Figure 3: Cumulated predicted probabilities according to household land-ownership
The differently-shaped non-linear relations are robust to different specifications and we retain
the quadratic specification of asset holdings in the analysis that follows.
5.2. Results
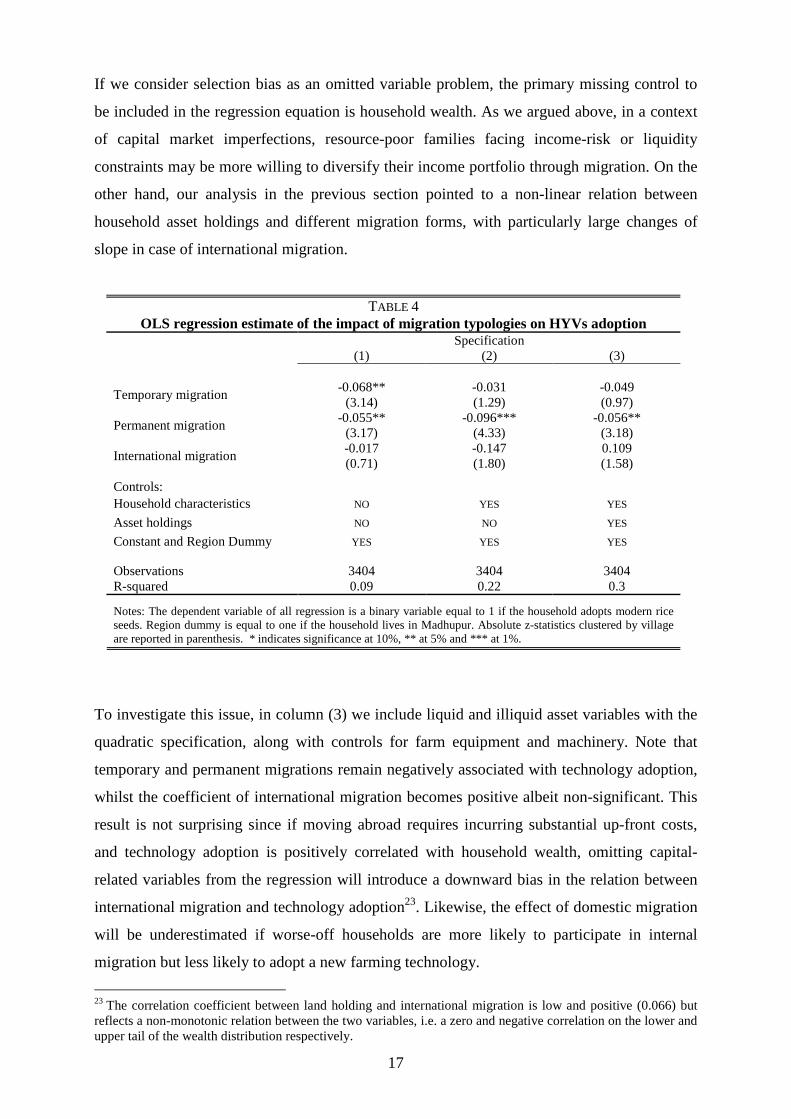
We start by reporting the OLS linear regression estimate of the impact of household
participation in different migration forms on the propensity to adopt HYVs, i.e. equation (5.1)
above. Column (1) in Table 4 presents results of the baseline regression specification whilst
specification (2) controls for some farm household characteristics, such as demographic and
human capital related variables, land characteristics and the subjective poverty assessment.
Coefficients of all migration typologies show different levels of significance and are
negatively correlated with technology adoption (coefficients of all explanatory variables are
presented in Table A.2 in Appendix). Yet, as discussed above, these results are likely to be
biased by some household characteristics in the stochastic disturbance, correlated with the
decision to have a migrant. Indeed, whether or not to engage in migration is a selective
process, as is the decision about which type of migration to engage in.
22 The first best solution occurs when markets are perfect and, in our specific case, when uninsured risks and credit rationing are not an issue. Our findings are also consistent with other evidence on historical migration (see Faini and Venturini, 1993) and with the fact that Bangladesh is a very poor country (therefore, we capture the first part of a hump-shaped wealth-international migration relationship).
17
If we consider selection bias as an omitted variable problem, the primary missing control to
be included in the regression equation is household wealth. As we argued above, in a context
of capital market imperfections, resource-poor families facing income-risk or liquidity
constraints may be more willing to diversify their income portfolio through migration. On the
other hand, our analysis in the previous section pointed to a non-linear relation between
household asset holdings and different migration forms, with particularly large changes of
slope in case of international migration.
TABLE 4 OLS regression estimate of the impact of migration typologies on HYVs adoption
Specification (1) (2) (3)
-0.068** -0.031 -0.049 Temporary migration
(3.14) (1.29) (0.97) -0.055** -0.096*** -0.056**
Permanent migration (3.17) (4.33) (3.18) -0.017 -0.147 0.109
International migration (0.71) (1.80) (1.58)
Controls: Household characteristics NO YES YES
Asset holdings NO NO YES
Constant and Region Dummy YES YES YES
Observations 3404 3404 3404 R-squared 0.09 0.22 0.3
Notes: The dependent variable of all regression is a binary variable equal to 1 if the household adopts modern rice seeds. Region dummy is equal to one if the household lives in Madhupur. Absolute z-statistics clustered by village are reported in parenthesis. * indicates significance at 10%, ** at 5% and *** at 1%.
To investigate this issue, in column (3) we include liquid and illiquid asset variables with the
quadratic specification, along with controls for farm equipment and machinery. Note that
temporary and permanent migrations remain negatively associated with technology adoption,
whilst the coefficient of international migration becomes positive albeit non-significant. This
result is not surprising since if moving abroad requires incurring substantial up-front costs,
and technology adoption is positively correlated with household wealth, omitting capital-
related variables from the regression will introduce a downward bias in the relation between
international migration and technology adoption23. Likewise, the effect of domestic migration
will be underestimated if worse-off households are more likely to participate in internal
migration but less likely to adopt a new farming technology.
23 The correlation coefficient between land holding and international migration is low and positive (0.066) but reflects a non-monotonic relation between the two variables, i.e. a zero and negative correlation on the lower and upper tail of the wealth distribution respectively.
18
Overall, OLS results seem to suggest that different forms of migration are subject to different
selection processes, driven by some observable determinants of household outcomes.
However, further unobservable (by the econometrician) determinants of both the decision to
adopt HYVs and to have a migrant member – such as idiosyncratic shocks or household
implicit propensity for specific investment types – are still unlikely to provide consistent OLS
estimates24 . Furthermore, and most importantly, a simultaneity bias would be present.
Improved well-being due to the adoption of a new farming technology could increase
household savings, enabling family members either to ‘switch’ from one type of migration to
another one or to forego migration and stay put25. In particular, higher farm productivity of
smallholders may increase domestic migration and bias OLS coefficients in a positive
direction. On the other hand, families are likely to allocate more or less resources to
agricultural production depending on the achievement of specific migrant members or may
vary their resources in response to changes in their migrant circumstances. If the general
direction is to spend more resources for international migration, this will bias the specific
migration effect downward26. Therefore, using appropriate instruments for implementing an
IV strategy would better reveal the ‘true’ impact of migration.
In order to address the causal relationship between different migration forms and the adoption
of HYVs in households at origin, we estimate the system of equations (5.2)-(5.3) above
through a 3SLS estimator. The latter applies an IV procedure to produce consistent estimates
and generalised least squares to account for correlation structure in the disturbances across
equations.
The key empirical challenge is to identify the effect of migration on household decision to
adopt modern seeds. For this purpose, we use the following set of instruments: (i) the
education level of the highest educated household member; (ii) the sample proportion of
households in the origin village participating either in temporary, permanent or international
24 It should be noted that contrasting forces could be present. Better-off households may successfully seek to send migrants abroad, but skilled and entrepreneurial people may also be successful at home (engaging in different outside income-generating options for example). Therefore, we may say that the migration selection process operates both between and within different migration forms. 25 As discussed above, an increase in liquidity raises the household’s terminal wealth and may drive the propensity to migrate abroad; on the other hand, the relative attractiveness of a family member departure decreases as the gap between the expected ‘return’ with and without migration closes. 26 In a related study, Yang and Choi (2005) examine the extent to which overseas remittances serve as insurance for recipient households in the Philippines, exploiting rainfall shocks to identify the causal impact. They find that the impact of domestic income on remittances changes sign (from negative to positive) in going from OLS to the IV procedure. They show that this reflects the fact that international migration requires fixed up-front costs so that increases in household income raise overseas migration among initially non-migrant households.
19
migration and (iii) a ‘family chain migration’ variable, that is the presence of more than one
migrant in the household who left more than three years prior to the survey year27.
Based on the literature, we argue that migrants’ self-selection into different forms of mobility
is highly driven by education level. At the same time, evidence on HYV technology is
consistent in finding the level of schooling as a non-significant determinant of adoption. It
should be noted that high-yielding seed varieties were introduced in Asia in the late 1960s,
and farmers are likely to have benefited from the spread of knowledge and information about
how to grow them during the early wave of the ‘Green Revolution’. Therefore, as long as we
control for the average education level of household members, we can assume that the
education level of the highest educated member does not directly influence the household
adoption behaviour, unless through the migration process.
The other instruments we use – the incidence of different typologies of migration at village
level, and family chain migration - are proxy variables respectively for extra-family and
family migration networks. These variables, in turn, capture the role of ‘social learning’ in
shaping household migration behaviour28. Also, it is widely recognised that social networks
(between village neighbours, and within families) contribute to reducing migration costs.
People with indirect experience of migration (within and outside the family) are more likely
to move, and also settle better in the destination region (see among others Massey and
Espinosa, 1997; Munshi, 2003). According to cumulative causation theory, network effects
and previous family migration may even be stronger than economic motivations (Massey et
al., 1993). For this reason different villages’ histories of temporary, permanent and
international migration, and family migration experience are assumed to directly influence
household migration behaviour, while being orthogonal to the propensity to adopt new
farming technologies29.
The validity of instruments is checked through the Sargan overidentification test, according to
which we cannot reject the hypothesis that the instruments are uncorrelated with the error
process (p-value is 0.21). Also, we use the Hausman test to determine whether the IV method
rather than the OLS, or seemingly unrelated regression estimation (SURE) is necessary. Table
27 The choice of a 3 year ‘chain migration’ is made to minimise potential network endogeneity drawbacks and also to have some variability in the dummy variable (as in this case 17 percent of migrant families registered ‘3 year chain migration’). 28 With respect to social learning, it could be argued that there might be also some cross-learning within the village about HYV technology (which would undermine the validity of our instruments). However, it should be noted that we are not observing the onset of the Green Revolution, when social learning would be more likely to occur. Furthermore, the genetic and technical characteristics of HYVs of rice produce a high degree of heterogeneity in farmers’ uptake that significantly hinders social learning (see Munshi, 2004). 29 Rozelle et al (1999) use similar instruments (with the exception of ‘family chain’) to analyse the impact of Chinese rural out-migration on productivity of sending households at origin..
20
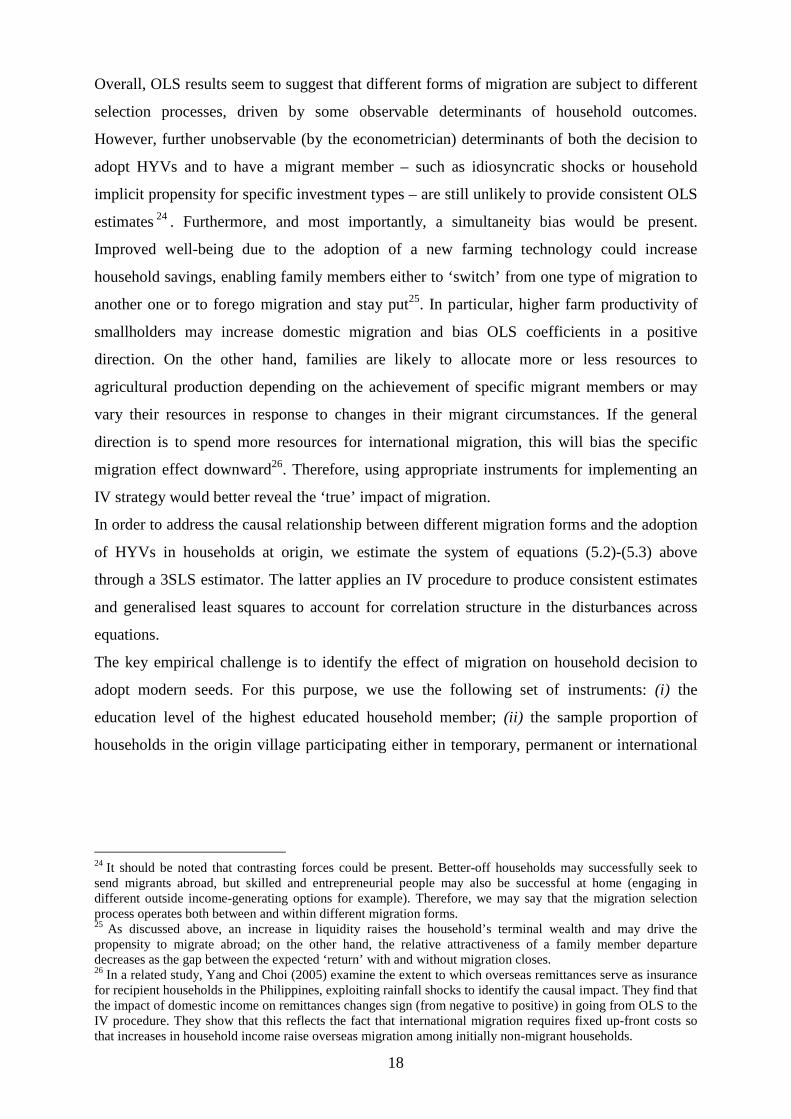
5 presents the results from comparing different estimation models; they suggest that the
model needs an asymptotically efficient IV estimator such as 3SLS.
TABLE 5 Hausman's Specification Test Results
COMPARING TO H-STATISTIC P-VALUE
OLS SURE 15.19 0.438
OLS 3SLS 800.29 0.000
2SLS 3SLS 45.16 0.000
Results based on the 3SLS estimation of model (5.2)-(5.3) are presented in Table 6, where the
quadratic specification of asset holdings is retained when proves significant, i.e. in the first
stage regressions. We perform several robustness checks and findings are consistent with the
model specified in Table 6. In particular, we control for the potential vulnerability of 3SLS to
a specification error (since an error in an equation can be transmitted to all equations) and for
the exclusion of likely endogenous variables – such as cattle and agricultural equipment
endowment (see Table A.3 and A.4 in Appendix). Note also that in all first stage regressions
the F-statistic of the excluded instruments is very high, suggesting that instruments are not
weak.
Results in Table 6 show that explanatory variables included in the adoption equation show the
expected sign. Land ownership is positively related to the propensity to adopt modern seeds
(even if it is not significant, which is consistent with the divisible and scale-neutral nature of
HYVs investment), whilst tenure insecurity (the share of temple-land and mortgaged-out
land) has a negative impact. The percentage of irrigated land and powered means of
ploughing, on the other hand, are positively correlated with HYV adoption, as they are
typically important complementary inputs for growing modern rice varieties.
In terms of migration coefficients, 3SLS estimates are higher and more significant than OLS,
suggesting that correcting for endogeneity does have an effect on the results that, unlike OLS,
represent the causal impact.
In Table 7 we check for sensitivity of migration estimates to specific instrument selection by
using different combinations of the instruments. Results show that international migration is
less sensitive to the choice of instruments than domestic migration, but all combinations lead
to the same coefficient signs and, as shown by p-value of the Sargan test, the exogeneity of
the instruments is never rejected.
21
TABLE 6: 3SLS ESTIMATE OF THE IMPACT OF DIFFERENT TYPOLOGIES OF MIGRATION ON HYV S ADOPTION DEPENDENT VARIABLES ADOPTION OF HYVS TEMPORARY MIG. PERMANENT MIG. INTERNATONAL MIG.
Temporary migration -0.444** (2.04) Permanent migration -0.25** (2.11) International migration 0.718*** (2.69) Number of males in the hh. 0.013 0.016*** 0.031*** 0.02*** (1.07) (2.71) (5.23) (5.28) Number of females in the hh. -0.01 -0.009 0.004 0.024*** (0.76) (1.23) (0.55) (5.17) Number of children in the hh. 0.005 -0.007** -0.011*** 0.006*** (0.93) (2.23) (3.30) (2.69) Average years of schooling in the hh. -0.002 (0.32) Religion (1 if Muslim) 0.053 0.182*** -0.03 0.04*** (0.92) (9.36) (1.53) (3.33) % of temple land -0.026** (2.08) % of cash-in land -0.006 (0.09) % of mortgaged-out land -0.07*** (3.16) Farm equipment owned 0.016 (1.46) Means of ploughing (1 if power) 0.049*** (2.90) Self-poor assessment -0.074*** 0.029** -0.008 -0.037*** (3.67) (2.57) (0.73) (5.22) Regional dummy (1 if Madhupur) 0.069 -0.086*** 0.053 0.031*** (1.25) (3.20) (1.33) (2.70) % of irrigated land 0.273*** (11.48) Land owned (pae) 0.029 -0.139*** -0.132*** 0.058*** (0.8) (4.41) (4.07) (2.94) [Land owned (pae)]2 0.046*** 0.028** -0.021*** (3.64) (2.12) (2.66) Cattle owned (pae) 0.16*** -0.065** -0.099*** -0.056*** (5.65) (2.25) (3.27) (3.08) [Cattle owned (pae)]2 0.037** 0.053*** 0.015 (1.96) (2.66) (1.31) Constant 0.129*** 0.021 -0.097** -0.15*** (2.63) (0.57) (2.05) (7.90) Instruments: Highest education level in the hh -0.061*** 0.048*** 0.015*** (7.67) (5.96) (3.10) Family chain migration 0.001 0.312*** 0.091*** (0.04) (12.10) (5.72) % temp.migrants in the village 0.768*** (5.53) % perm.migrants in the village 1.018*** (5.62) % intern.migrants in the village 1.029*** (8.73) Observations 3404 3404 3404 3404 Sargan test: Chi2 (2) = 3.145 [p-value=0.21]; First-stage F-test (5, 3383) P-value Temporary migration: 10.27 0.0000 Permanent migration: 38.21 0.0000 International migration: 19.21 0.0000 Absolute value of z-statistics in parentheses; * significant at 10%; ** significant at 5%; *** significant at 1%
22
TABLE 7
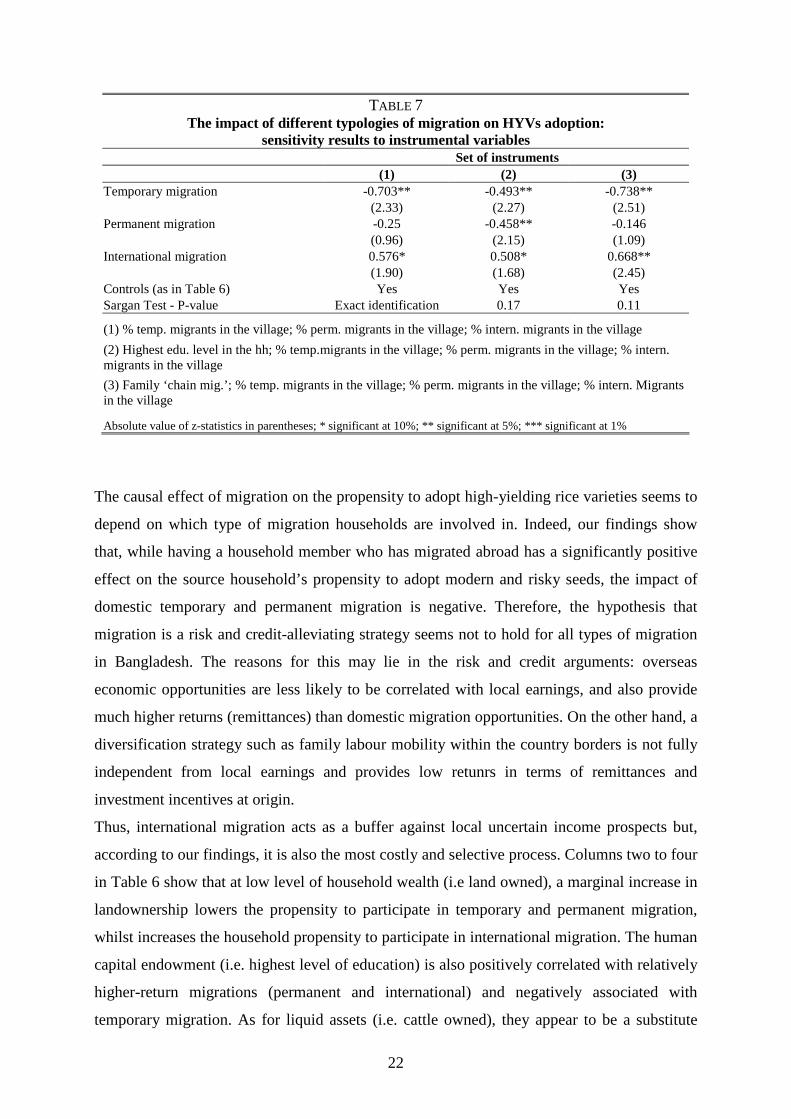
The impact of different typologies of migration on HYVs adoption: sensitivity results to instrumental variables
Set of instruments (1) (2) (3)
Temporary migration -0.703** -0.493** -0.738** (2.33) (2.27) (2.51) Permanent migration -0.25 -0.458** -0.146 (0.96) (2.15) (1.09) International migration 0.576* 0.508* 0.668** (1.90) (1.68) (2.45) Controls (as in Table 6) Yes Yes Yes Sargan Test - P-value Exact identification 0.17 0.11
(1) % temp. migrants in the village; % perm. migrants in the village; % intern. migrants in the village
(2) Highest edu. level in the hh; % temp.migrants in the village; % perm. migrants in the village; % intern. migrants in the village
(3) Family ‘chain mig.’; % temp. migrants in the village; % perm. migrants in the village; % intern. Migrants in the village
Absolute value of z-statistics in parentheses; * significant at 10%; ** significant at 5%; *** significant at 1%
The causal effect of migration on the propensity to adopt high-yielding rice varieties seems to
depend on which type of migration households are involved in. Indeed, our findings show
that, while having a household member who has migrated abroad has a significantly positive
effect on the source household’s propensity to adopt modern and risky seeds, the impact of
domestic temporary and permanent migration is negative. Therefore, the hypothesis that
migration is a risk and credit-alleviating strategy seems not to hold for all types of migration
in Bangladesh. The reasons for this may lie in the risk and credit arguments: overseas
economic opportunities are less likely to be correlated with local earnings, and also provide
much higher returns (remittances) than domestic migration opportunities. On the other hand, a
diversification strategy such as family labour mobility within the country borders is not fully
independent from local earnings and provides low retunrs in terms of remittances and
investment incentives at origin.
Thus, international migration acts as a buffer against local uncertain income prospects but,
according to our findings, it is also the most costly and selective process. Columns two to four
in Table 6 show that at low level of household wealth (i.e land owned), a marginal increase in
landownership lowers the propensity to participate in temporary and permanent migration,
whilst increases the household propensity to participate in international migration. The human
capital endowment (i.e. highest level of education) is also positively correlated with relatively
higher-return migrations (permanent and international) and negatively associated with
temporary migration. As for liquid assets (i.e. cattle owned), they appear to be a substitute
23
investment strategy with respect to migration and, in turn, appear to significantly increase
(although by a smaller percentage than migration) the propensity to adopt high-yielding seed
varieties.
Finally, the household’s perception of its poverty increases the propensity to have a temporary
migrant member, but decreases the propensity to participate in higher remunerative forms of
migration, and to employ HYVs of rice. This is consistent with the idea that high-return
migrations (especially international migration) and adoption of new farming technologies are
high-risk and costly activities, not easily undertaken by (subjective) poor families.
Overall, our findings suggest that wealthy households (i.e. endowed with more land) are able
to overcome entry barriers to the most ‘remunerative’ international migration and, in turn, are
more likely to employ modern farming technology and achieve higher productivity. Asset-
poorer households, on the other hand, are unable to support the costs of cross-border
migration and fall back on domestic migration, which does not help them to overcome
financial or risk constraints, thereby locking them into low productive performance.
6. Conclusions According to the NELM approach, the typical migrant is part of a rural extended family,
which dispatches members to other places of employment to generate capital and to get access
to new investment opportunities (e.g. change of technology) for the family farm.
Underlying this study is the idea that if on the one hand migration is an informal household
insurance mechanism, on the other hand it is also a form of lumpy investment, especially
onerous for households such as those in poor rural areas of Bangladesh. Therefore,
determinants of migration simultaneously shape the economic impact of having a migrant
member on farm households left behind. This has important implications for understanding
the complex linkages between migration opportunities and economic development in local
communities.
We argue that differentiating between alternative household moving strategies in poor rural
communities – where evidence is generally scanty - is an interesting testing ground to analyse
the potential non-monotonic effects of migration in mitigating household credit or risk
constraints at origin. We use a household survey from rural Bangladesh to estimate the
simultaneous decisions of households about whether to adopt a high-yielding farming
technology and whether to have a temporary-domestic, permanent-domestic or international
migrant member. We use an IV simultaneous equations model, in order to take account of
24
both the endogenous migration choice and the cross-correlation of household decisions with
respect to their (human and physical) resource allocation.
Assuming that higher initial asset holdings make it less likely that liquidity constraints will be
binding, our empirical evidence shows that a household’s wealth-related capital (mainly in the
form of land) is crucial in shaping heterogeneous migration behaviour towards different
typologies of migration. Asset-poor farm households are more likely to enter into domestic
migration, which has lower entry costs, and lower absolute returns. Entry into high-return
migration (i.e. international migration), in which most households would engage within a
‘first-best’ perspective, is restricted to richer and large-holder households. Furthermore, our
findings show that international migration has a robust positive effect on adopting a superior
agricultural technology, whilst temporary and permanent internal migrations do not encourage
such a risky farming investment.
We interpret these results as evidence that although migration is a profitable alternative
household activity, entry constraints may limit both access to it and its effectiveness as an
income diversification strategy. Lack of resources needed to bear the costs of migration may
generate a poverty-trap whereby only better-off households are able to exploit a virtuous
circle of complementarities between overseas economic opportunities and productive
activities at origin. This is consistent with a large literature showing that farm households
with poor asset endowment and limited formal protection against income-risk, typically
‘under-invest’ by choosing (ex-ante) safe or conservative strategies. This comes at the cost of
inefficiency and ultimately may keep them into persistent poverty (Rosenzweig and
Binswanger, 1993; Morduch, 1995).
Overall, our findings raise questions about the potential role of different forms of migration in
contributing to fostering economic development in source communities. In particular they
highlight that some households benefit from the ability to engage in international migration,
which allows the people left behind to achieve technical efficiency in agriculture. Poor-
resourced people, though, are excluded from this global process, and this may have persisting
implications in terms of inefficiency and poverty.
25
REFERENCES
Afsar, R. (2003), “Internal Migration and the Development Nexus: the Case of Bangladesh”, Bangladesh Institute of Development Studies, Dhaka, and paper presented at the Regional Conference on Migration Development Pro-Poor Policy Choices in Asia, Dhaka, Bangladesh, June 2003.
Afsar, R., Yunus M., and Shansul Islam ABM. (2000), “A Study of Cost-Benefit Analysis of Overseas Migration by the Bangladesh Labour”, International Organization for Migration (IOM), Regional Office for South Asia, Dhaka.
Amemiya, T. (1978), “The Estimation of a Simultaneous Equation Generalized Probit Model”, Econometrica 46 (5), 1193-1205.
Angrist, J. D. (2001), “Estimation of Limited Dependent Variable Models with Dummy Endogenous Regressors: Simple Strategies for Empirical Practice”, Journal of Business & Economic Statistics 19 (1), 2-16.
Banerjee, A. and Newman, A. (1993), "Occupational Choice and the Process of Development," Journal of Political Economy 101 (2:): 274-298.
Bangladesh Bureau of Statistic (BBS) (1999), Statistical Yearbook of Bangladesh, Dhaka: BBS.
Dercon, S. (1996), “Risk, Crop Choice and Savings: Evidence from Tanzania”, Economic Development and Cultural Change, 44 (3), 485-513.
Dercon, S. (2002), “Income Risk, Coping Strategies and Safety Nets”, World Bank Research Observer, 17, 141-166.
Durand, J., Kandel, W., Parrado, E.A. and Massey, D.S. 1996, “International Migration and Development in Mexican Communities”, Demography 33 (2), 249-264.
Eswaran, M., and Kotwal, A. (1990), "Implications of Credit Constraints for Risk Behaviour in Less Developed Economies” Oxford University Papers, 6, 87-103.
Faini, R. and Venturini, A. (1993), "Trade Aid and Migrations. Some Basic Policy Issues", European Economic Review, 37 (2-3), 435-442.
Heckman, J.J. (1978). “Dummy Endogenous Variables in a Simultaneous Equation System”, Econometrica 46 (5), 931-959.
Heckman, J. and MaCurdy, T. (1985), “A Simultaneous Equations Linear Probability Model”, Canadian Journal of Economics, 18 (1), 28-37.
Hossain, M.Z. (2001), “Rural-urban Migration in Bangladesh: A Micro-level Study”, paper presented at 24th IUSSP General Conference, Salvador, Brazil.
Hossain M. (1989), Green Revolution in Bangladesh: Impact on Growth and Distribution of Income. Dhaka: University Press Ltd.
Hossain, M. (1992), “Green Revolution, Income Distribution and Rural Poverty. The Case of Bangladesh”, Bangladesh Journal of Agricultural Economics, XV , 1, 1-31.
Hossain, M. and Sen, B. (1992), “Rural Poverty in Bangladesh: Trends and Determinants”, Asian Development Review, 10, 1-34.
INSTRAW and IOM (2000), Temporary Labour Migration of Women. Case Studies of Bangladesh and Sri Lanka, Santo Domingo: INSTRAW/IOM.
IOM (2005a) “Dynamics of Remittance Utilization in Bangladesh” Migration Research Series N. 18.
26
IOM (2005b) “Internal Migration and Development: A Global Perspective” Migration Research Series N. 19.
Katz, E. and Stark, O. (1986), “Labor Migration and Risk Aversion in Less Developed Countries”, Journal of Labor Economics, 4 (1), 134-149.
Lucas, R.E.B., (2005), “International Migration Regimes and Economic Development”, Report prepared for the Expert Group on Development Issues in the Swedish Ministry for Foreign Affairs, forthcoming in Edward Elgar Publisher.
Lucas, R.E.B. (1997), “Internal Migration in Developing Countries”, in Rosenzweig M. and Stark, O. (eds) Handbook of Population and Family Economics, Vol, 1B, Elsevier Science B.V., Amsterdam.
Lucas, R.E.B and Stark, O. (1988) “Migration, Remittances and the Family”, Economic Development and Cultural change, 36, 465-82.
Lucas, R.E.B and Stark, O. (1985), “Motivations to Remit: Evidence from Botswana", Journal of Political Economy, 93 (5), 901-18.
Lucas, R.E.B. (1987), “Emigration to South Africa’s Mines”, The American Economic Review, 77 (3), 313-330.
Massey, D. and Espinosa, K. (1997), “What’s Driving Mexico-U.S. Migration? A Theoretical, Empirical, and Policy Analysis.” American Journal of Sociology 102, 939-99.
Massey, D., Arango, J., Hugo, G., Kouaouci, A., Pellegrino, A., & Taylor, J. (1993), “Theories of International Migration - a Review and Appraisal”, Population and Development Review, 19 (3), 431-466.
Mendola, M. (2005), “ Agricultural Technology and Poverty Reduction: A Micro-level Analysis of Causal Effects” , Working Paper No.15.2005, Department of Economics University of Milan, Italy.
Morduch., J., (1994), "Poverty and Vulnerability”, The American Economic Review, 84 (2), Paper and Proceedings of the Hundred and Sixth Annual Meeting of the American Economic Association, 221-225.
Morduch., J., (1995), "Income Smoothing and Consumption Smoothing", Journal of Economic Perspectives, 9 (3), 103-114.
Morduch., J., (1998), “Does Microfinance Really Help the Poor? New Evidence from Flagship Programs in Bangladesh”, Working Paper, NYU.
Munshi, K. (2004), “Social learning in a heterogeneous population: technology diffusion in the Indian Green Revolution”, Journal of Development Economics 73, 185– 213.
Munshi, K. (2003), “Networks in the Modern Economy: Mexican Migrants in the U.S. Labor Market.” 2003. Quarterly Journal of Economics 118 (2), 549-597.
Newey, W.K. (1987). “Efficient Estimation of Limited Dependent Variable Models with Endogenous Explanatory Variables”, Journal of Econometrics 36, 231-250.
Pitt, M. and Khandker, S.R. (1988) “The Impact of Group-Based Credit Programs on Poor Households in Bangladesh: Does the Gender of Participants Matter?”, Journal of Political Economy, 106 (5), 958-96.
Pitt, M. (1999) “Reply to Jonathan Morduch’s ‘Does Microfinance Really Help the Poor? New Evidence from Flagship Programs in Bangladesh’”, mimeo.
Rahman, H.Z., Hossain, M. and Sen, B. (1996), 1987–94 Dynamics of Rural Poverty in Bangladesh, Bangladesh Institute of Development Studies, Dhaka, mimeo.
27
Rosenzweig, M. and Binswanger, H. (1993), “Wealth, Weather Risk and the Composition and Profitability of Agricultural Investments,” The Economic Journal, 103 (146), 56-78.
Rosenzweig M.R. and Stark, O., (1989), “Consumption Smoothing, Migration and Marriage: Evidence from Rural India”, Journal of Political Economy 97 (4), 905-926.
Rosenzweig M. (1988), “Risk, Implicit Contracts and the Family in Rural Areas of Low Income Countries”, The Economic Journal, 98 (393), 1148-1170.
Rozelle, S., Taylor, E. and deBrauw A. (1999), “Migration, Remittances and Agricultural Productivity in China”, The American Economic Review 89 (2), 287-291.
Siddiqui, T. (2003), “Migration as a Livelihood Strategy for the Poor: The Bangladesh Case”, paper presented at Regional Conference on Migration Development Pro-Poor Policy Choices in Asia, Dhaka, Bangladesh, June 2003.
Stark, O. (1978), “Economic-Demographic Interactions in Agricultural Development: The Case of Rural-to-Urban Migration”, Food and Agriculture Organization of the United Nations (FAO), Rome.
Stark, O. (1991), The Migration of Labour, Cambridge: Basil Blackwell.
Stark, O. and Levhari, D (1982), “On Migration and Risk in LDCs”, Economic Development and Cultural Change 31, 191-196.
Taylor J.E. and Martin, P. (2001), “Human Capital: Migration and Rural Population Change” in G. Rausser and B. Gardner, eds., Handbook for Agricultural Economics, pp. 458-511, New York: Elsevier Science Publishers.
Taylor, J. Edward, J. Arango, G. Hugo, A. Kouaouci, D.S. Massey, and A. Pellegrino (1996), International Migration and Community Development, Population Index 62 (3), 397-418.
UNDP (2002) Human Development Report 2002., New York: OUP.
Yang, D. and Choi, H. (2005), “Are Remittances Insurance? Evidence from Rainfall Shocks in the Philippines”, Ford School of Public Policy Working Paper Series N. 05-004.
Williamson, J.G. (1988), ”Migration and Urbanization”, in Chenery, H. and Srinivasan, T.N. (Eds.) ”Handbook of Development Economics, Vol.1”, New York, Elsevier Science Publishers.
World Bank (2003), Poverty in Bangladesh: Building on Progress. Washington DC: The World Bank.
WBR (2000), World Bank Report 2000/2001 - Attacking Poverty, Washington DC: The World Bank.
28
APPENDIX
TABLE A.1 Determinants of participation to different categories of migration at household level (multinomial logit model)
Temporary mig Permanent mig. International mig. Migration-type Coeff. z-stat. P-value Coeff. z-stat. P-value Coeff. z-stat. P-value Number of males in the household 0.60 *** (4.73) 0.00 0.70 *** (12.49) 0.00 0.90 *** (7.52) 0.00 Number of females in the household 0.06 (0.46) 0.65 0.21 *** (2.28) 0.02 0.44 *** (4.46) 0.00 Number of children in the household -0.12 *** (2.94) 0.00 -0.15 *** (6.76) 0.00 0.00 (0.05) 0.96 Highest education level in the household -0.68 *** (3.66) 0.00 0.35 *** (4.67) 0.00 0.51 *** (2.11) 0.03 Age of hh. Head -0.01 (0.45) 0.66 0.05 (1.49) 0.14 -0.01 (0.09) 0.93 (Age of hh.head)2 0.00 (0.20) 0.84 0.00 (1.47) 0.14 0.00 (0.16) 0.87 Religion (whether it is Muslim) 3.02 *** (4.09) 0.00 0.53 *** (2.54) 0.01 1.26 *** (6.50) 0.00 Land owned (pae) -3.01 *** (6.80) 0.00 -1.70 *** (2.86) 0.00 2.11 ** (1.96) 0.05 [Land owned (pae)]2 0.73 *** (6.81) 0.00 0.38 *** (2.30) 0.02 -1.63 * (1.74) 0.08 Cattle owned (pae) -0.59 *** (2.23) 0.03 -2.36 *** (11.00) 0.00 -3.56 *** (4.16) 0.00 [Cattle owned (pae)]2 -0.22 (0.70) 0.48 0.98 *** (7.68) 0.00 0.85 (0.68) 0.50 Farm equipment owned -0.14 (0.63) 0.53 -0.11 (0.85) 0.40 -0.05 (0.28) 0.78 Whether own tubewells -0.30 (0.50) 0.62 0.50 (1.28) 0.20 0.78 (1.47) 0.14 Self-poor assessment 0.24 *** (3.02) 0.00 -0.13 (1.34) 0.18 -1.12 *** (3.52) 0.00 % out-temp. migrants in the village 10.97 *** (14.58) 0.00 1.96 *** (4.16) 0.00 2.15 *** (2.93) 0.00 % out-perm. migrants in the village -6.54 *** (4.83) 0.00 9.67 *** (5.72) 0.00 5.45 *** (3.05) 0.00 % out-intern. migrants in the village -4.47 *** (5.62) 0.00 5.31 *** (3.99) 0.00 17.58 *** (10.00) 0.00 Regional dummy -2.80 *** (8.87) 0.00 -0.48 (1.23) 0.22 -1.40 *** (2.60) 0.01 Constant -2.93 *** (2.85) 0.00 -6.96 *** (7.12) 0.00 -8.84 *** (3.82) 0.00 Pseudo R2 = 0.3144 Joint Sign.Land1: Chi2(6) = 448.96
Prob > chi2 = 0.000 Joint Sign.Cattle2: Chi2( 6) = 4233.00
Prob > chi2 = 0.000 z-statistics are clustered by village; * significant at 10%; ** significant at 5%; *** significant at 1% 1 Joint significance of land owned and land owned squared. 2 Joint significance of cattle owned and cattle owned squared.
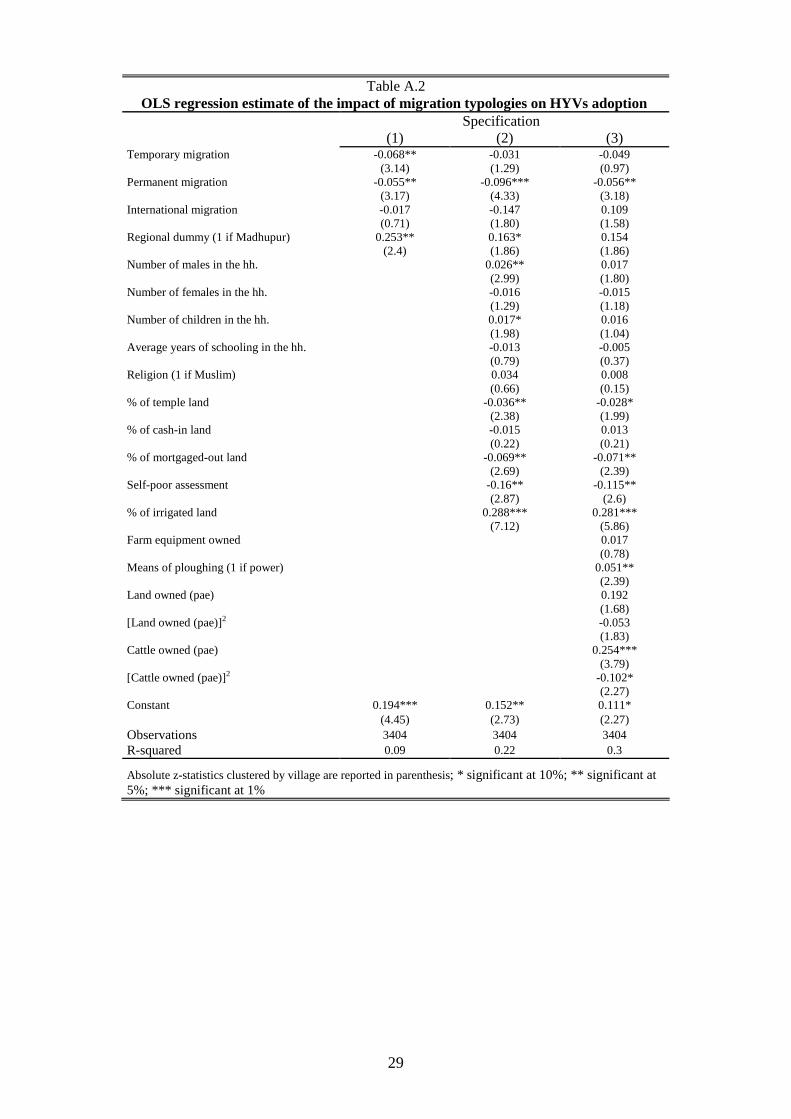
29
Table A.2 OLS regression estimate of the impact of migration typologies on HYVs adoption
Specification (1) (2) (3) Temporary migration -0.068** -0.031 -0.049 (3.14) (1.29) (0.97) Permanent migration -0.055** -0.096*** -0.056** (3.17) (4.33) (3.18) International migration -0.017 -0.147 0.109 (0.71) (1.80) (1.58) Regional dummy (1 if Madhupur) 0.253** 0.163* 0.154 (2.4) (1.86) (1.86) Number of males in the hh. 0.026** 0.017 (2.99) (1.80) Number of females in the hh. -0.016 -0.015 (1.29) (1.18) Number of children in the hh. 0.017* 0.016 (1.98) (1.04) Average years of schooling in the hh. -0.013 -0.005 (0.79) (0.37) Religion (1 if Muslim) 0.034 0.008 (0.66) (0.15) % of temple land -0.036** -0.028* (2.38) (1.99) % of cash-in land -0.015 0.013 (0.22) (0.21) % of mortgaged-out land -0.069** -0.071** (2.69) (2.39) Self-poor assessment -0.16** -0.115** (2.87) (2.6) % of irrigated land 0.288*** 0.281*** (7.12) (5.86) Farm equipment owned 0.017 (0.78) Means of ploughing (1 if power) 0.051** (2.39) Land owned (pae) 0.192 (1.68) [Land owned (pae)]2 -0.053 (1.83) Cattle owned (pae) 0.254*** (3.79) [Cattle owned (pae)]2 -0.102* (2.27) Constant 0.194*** 0.152** 0.111* (4.45) (2.73) (2.27) Observations 3404 3404 3404 R-squared 0.09 0.22 0.3
Absolute z-statistics clustered by village are reported in parenthesis; * significant at 10%; ** significant at 5%; *** significant at 1%
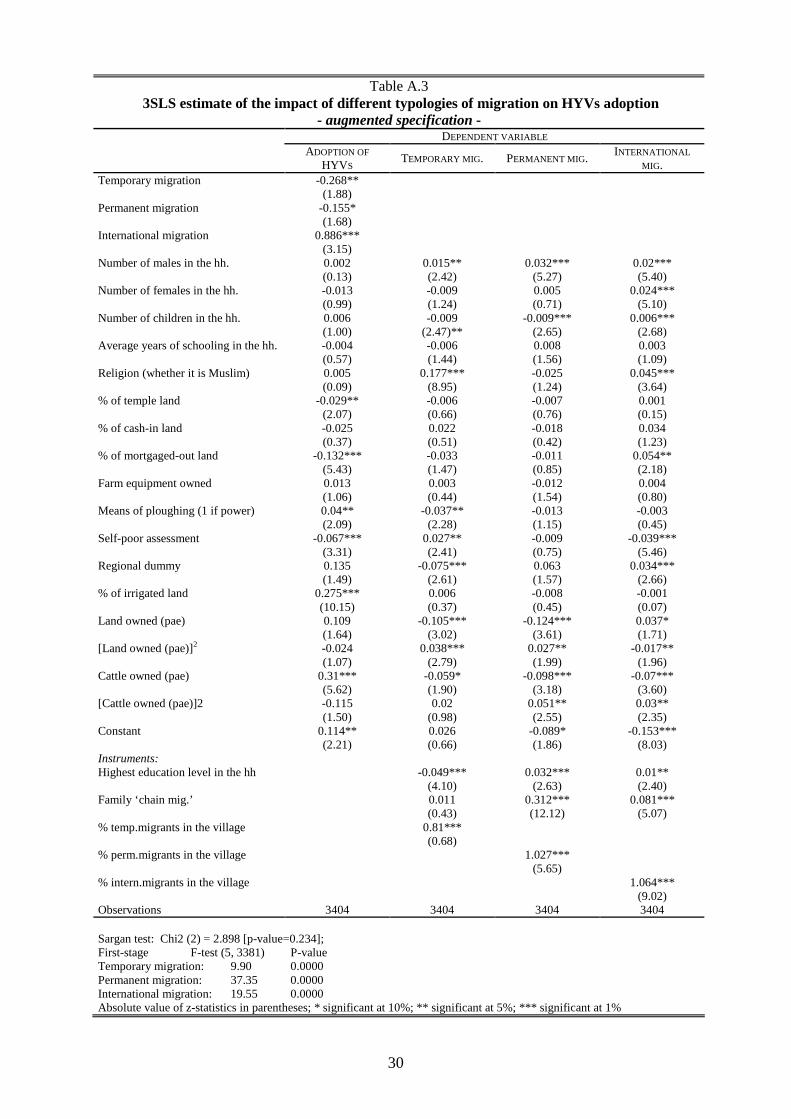
30
Table A.3 3SLS estimate of the impact of different typologies of migration on HYVs adoption
- augmented specification - DEPENDENT VARIABLE
ADOPTION OF
HYVS TEMPORARY MIG. PERMANENT MIG.
INTERNATIONAL
MIG. Temporary migration -0.268** (1.88) Permanent migration -0.155* (1.68) International migration 0.886*** (3.15) Number of males in the hh. 0.002 0.015** 0.032*** 0.02*** (0.13) (2.42) (5.27) (5.40) Number of females in the hh. -0.013 -0.009 0.005 0.024*** (0.99) (1.24) (0.71) (5.10) Number of children in the hh. 0.006 -0.009 -0.009*** 0.006*** (1.00) (2.47)** (2.65) (2.68) Average years of schooling in the hh. -0.004 -0.006 0.008 0.003 (0.57) (1.44) (1.56) (1.09) Religion (whether it is Muslim) 0.005 0.177*** -0.025 0.045*** (0.09) (8.95) (1.24) (3.64) % of temple land -0.029** -0.006 -0.007 0.001 (2.07) (0.66) (0.76) (0.15) % of cash-in land -0.025 0.022 -0.018 0.034 (0.37) (0.51) (0.42) (1.23) % of mortgaged-out land -0.132*** -0.033 -0.011 0.054** (5.43) (1.47) (0.85) (2.18) Farm equipment owned 0.013 0.003 -0.012 0.004 (1.06) (0.44) (1.54) (0.80) Means of ploughing (1 if power) 0.04** -0.037** -0.013 -0.003 (2.09) (2.28) (1.15) (0.45) Self-poor assessment -0.067*** 0.027** -0.009 -0.039*** (3.31) (2.41) (0.75) (5.46) Regional dummy 0.135 -0.075*** 0.063 0.034*** (1.49) (2.61) (1.57) (2.66) % of irrigated land 0.275*** 0.006 -0.008 -0.001 (10.15) (0.37) (0.45) (0.07) Land owned (pae) 0.109 -0.105*** -0.124*** 0.037* (1.64) (3.02) (3.61) (1.71) [Land owned (pae)]2 -0.024 0.038*** 0.027** -0.017** (1.07) (2.79) (1.99) (1.96) Cattle owned (pae) 0.31*** -0.059* -0.098*** -0.07*** (5.62) (1.90) (3.18) (3.60) [Cattle owned (pae)]2 -0.115 0.02 0.051** 0.03** (1.50) (0.98) (2.55) (2.35) Constant 0.114** 0.026 -0.089* -0.153*** (2.21) (0.66) (1.86) (8.03) Instruments: Highest education level in the hh -0.049*** 0.032*** 0.01** (4.10) (2.63) (2.40) Family ‘chain mig.’ 0.011 0.312*** 0.081*** (0.43) (12.12) (5.07) % temp.migrants in the village 0.81*** (0.68) % perm.migrants in the village 1.027*** (5.65) % intern.migrants in the village 1.064*** (9.02) Observations 3404 3404 3404 3404 Sargan test: Chi2 (2) = 2.898 [p-value=0.234]; First-stage F-test (5, 3381) P-value Temporary migration: 9.90 0.0000 Permanent migration: 37.35 0.0000 International migration: 19.55 0.0000 Absolute value of z-statistics in parentheses; * significant at 10%; ** significant at 5%; *** significant at 1%
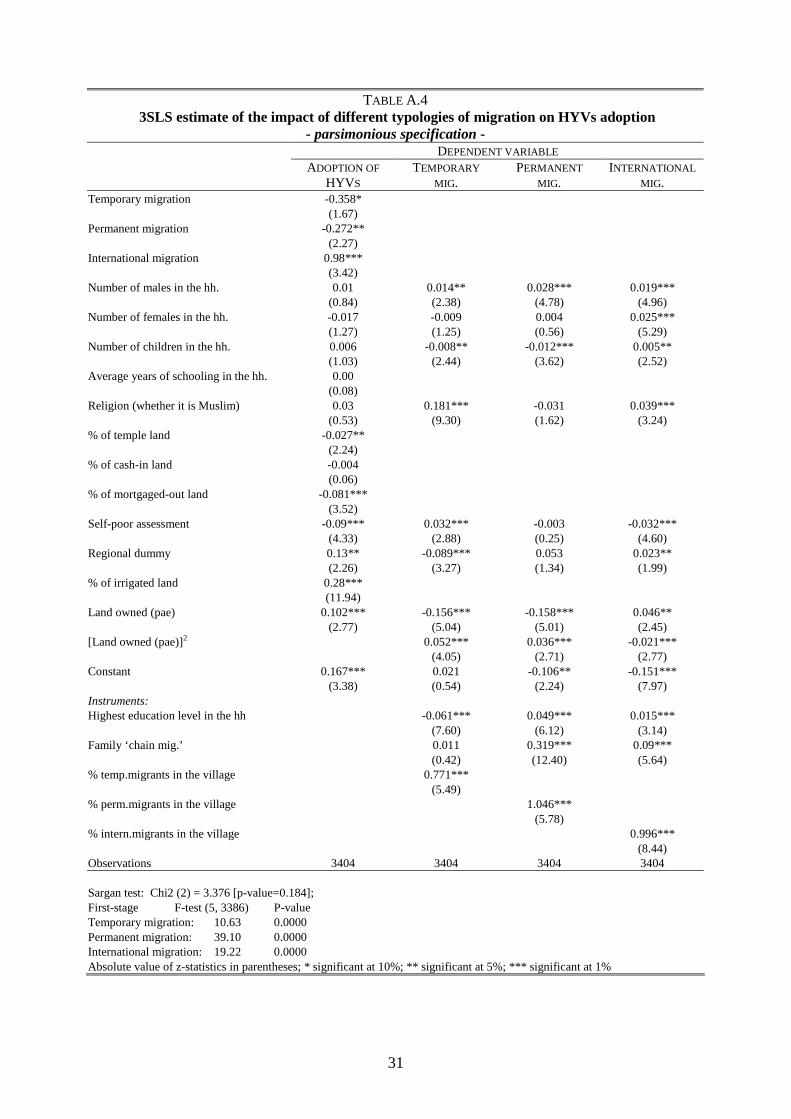
31
TABLE A.4 3SLS estimate of the impact of different typologies of migration on HYVs adoption
- parsimonious specification - DEPENDENT VARIABLE
ADOPTION OF
HYVS TEMPORARY
MIG. PERMANENT
MIG. INTERNATIONAL
MIG. Temporary migration -0.358* (1.67) Permanent migration -0.272** (2.27) International migration 0.98*** (3.42) Number of males in the hh. 0.01 0.014** 0.028*** 0.019*** (0.84) (2.38) (4.78) (4.96) Number of females in the hh. -0.017 -0.009 0.004 0.025*** (1.27) (1.25) (0.56) (5.29) Number of children in the hh. 0.006 -0.008** -0.012*** 0.005** (1.03) (2.44) (3.62) (2.52) Average years of schooling in the hh. 0.00 (0.08) Religion (whether it is Muslim) 0.03 0.181*** -0.031 0.039*** (0.53) (9.30) (1.62) (3.24) % of temple land -0.027** (2.24) % of cash-in land -0.004 (0.06) % of mortgaged-out land -0.081*** (3.52) Self-poor assessment -0.09*** 0.032*** -0.003 -0.032*** (4.33) (2.88) (0.25) (4.60) Regional dummy 0.13** -0.089*** 0.053 0.023** (2.26) (3.27) (1.34) (1.99) % of irrigated land 0.28*** (11.94) Land owned (pae) 0.102*** -0.156*** -0.158*** 0.046** (2.77) (5.04) (5.01) (2.45) [Land owned (pae)]2 0.052*** 0.036*** -0.021*** (4.05) (2.71) (2.77) Constant 0.167*** 0.021 -0.106** -0.151*** (3.38) (0.54) (2.24) (7.97) Instruments: Highest education level in the hh -0.061*** 0.049*** 0.015*** (7.60) (6.12) (3.14) Family ‘chain mig.’ 0.011 0.319*** 0.09*** (0.42) (12.40) (5.64) % temp.migrants in the village 0.771*** (5.49) % perm.migrants in the village 1.046*** (5.78) % intern.migrants in the village 0.996*** (8.44) Observations 3404 3404 3404 3404 Sargan test: Chi2 (2) = 3.376 [p-value=0.184]; First-stage F-test (5, 3386) P-value Temporary migration: 10.63 0.0000 Permanent migration: 39.10 0.0000 International migration: 19.22 0.0000 Absolute value of z-statistics in parentheses; * significant at 10%; ** significant at 5%; *** significant at 1%