Embed Size (px)
Citation preview

1""
Migration and interaction in a contact zone:
mtDNA variation among Bantu-speakers in southern Africa
Chiara Barbieri1,2*, Mário Vicente3,4,5 Sandra Oliveira3,6, Koen Bostoen7,8, Jorge
Rocha3,6, Mark Stoneking1, Brigitte Pakendorf 9*
1. Department of Evolutionary Genetics, MPI for Evolutionary Anthropology,
Leipzig, Germany, 04103
2. Department of Biological, Geological and Environmental Sciences, Laboratory
of Molecular Anthropology, University of Bologna, Bologna, Italy, 40126
3. CIBIO, Centro de Investigação em Biodiversidade e Recursos Genéticos da
Universidade do Porto, Vairão, 4485-661, Portugal
4. STAB VIDA, Investigação e Serviços em Ciências Biológicas, Lda, Oeiras
2780-182, Portugal
5. Division of Biological Anthropology, University of Cambridge, Cambridge CB2
3QG, UK (current affiliation)
6. Departamento de Biologia, Faculdade de Ciências da Universidade do Porto,
Porto, 4169-007, Portugal
7. Department of African Languages and Cultures, Ghent University, KongoKing
Research Group, B-9000 Ghent, Belgium
8. Universite ́ libre de Bruxelles, Faculte ́ de Philosophie et Lettres, B-1050
Brussels, Belgium
9. Laboratoire Dynamique du Langage, UMR5596, CNRS and Université Lyon
Lumière 2, Lyon, France, 69007
*To whom correspondence should be addressed: [email protected],
.CC-BY-NC-ND 4.0 International licenseIt is made available under a (which was not peer-reviewed) is the author/funder, who has granted bioRxiv a license to display the preprint in perpetuity.
The copyright holder for this preprint. http://dx.doi.org/10.1101/002808doi: bioRxiv preprint first posted online Feb. 18, 2014;
2""
ABSTRACT Bantu speech communities expanded over large parts of sub-Saharan Africa within the
last 4000-5000 years, reaching different parts of southern Africa 1200-2000 years ago.
The Bantu languages subdivide in several major branches, with languages belonging to
the Eastern and Western Bantu branches spreading over large parts of Central, Eastern,
and Southern Africa. There is still debate whether this linguistic divide is correlated
with a genetic distinction between Eastern and Western Bantu speakers. During their
expansion, Bantu speakers would have come into contact with diverse local populations,
such as the Khoisan hunter-gatherers and pastoralists of southern Africa, with whom
they may have intermarried. In this study, we analyze complete mtDNA genome
sequences from over 900 Bantu-speaking individuals from Angola, Zambia, Namibia,
and Botswana to investigate the demographic processes at play during the last stages of
the Bantu expansion. Our results show that most of these Bantu-speaking populations
are genetically very homogenous, with no genetic division between speakers of Eastern
and Western Bantu languages. Most of the mtDNA diversity in our dataset is due to
different degrees of admixture with autochthonous populations. Only the pastoralist
Himba and Herero stand out due to high frequencies of particular L3f and L3d lineages;
the latter are also found in the neighboring Damara, who speak a Khoisan language and
were foragers and small-stock herders. In contrast, the close cultural and linguistic
relatives of the Herero and Himba, the Kuvale, are genetically similar to other Bantu-
speakers. Nevertheless, as demonstrated by resampling tests, the genetic divergence of
Herero, Himba, and Kuvale is compatible with a common shared ancestry with high
levels of drift and differential female admixture with local pre-Bantu populations.
.CC-BY-NC-ND 4.0 International licenseIt is made available under a (which was not peer-reviewed) is the author/funder, who has granted bioRxiv a license to display the preprint in perpetuity.
The copyright holder for this preprint. http://dx.doi.org/10.1101/002808doi: bioRxiv preprint first posted online Feb. 18, 2014;

3""
INTRODUCTION Bantu languages started to diffuse from their homeland in the Grassfields of Cameroon
around 4,000-5,000 years ago, reaching the southernmost areas of the continent in only
a few thousand years [1–5]. This spread, strongly associated in its later phases with the
diffusion of technological advances related to metallurgy and an agricultural lifestyle,
was probably the result of a long-distance migration of people who partially replaced
the local forager and pastoralist populations, or intermixed with them [2,6,7]. From a
linguistic perspective, the genealogical unity of the Bantu family is certain, even though
its boundary with other branches of the Niger-Congo phylum is not clear-cut and the
internal classification and distinction between languages and dialects is highly debated
[4,8]. The region close to the putative homeland represents the highest linguistic
diversity. The first Bantu branches to split off, such as Mbam-Bubi and North-West
Bantu, are confined to Cameroon and immediately neighboring regions [9]. The
remainder of the Bantu languages predominantly belongs to two major branches,
namely Eastern Bantu and Western Bantu, which are further divided in several sub-
groups. Although a recent investigation finds a distinct trace of the eastern route of the
Bantu migration in Y-chromosomal variation [10], other molecular anthropological
studies fail to find evidence for a genetic differentiation of the populations speaking
Western and Eastern Bantu languages [11,12].
Southern Africa represents the last phase of the Bantu expansion. Archaeological data
reveal traces of an agricultural way of subsistence in Namibia, Zambia and Botswana
around 2000-1200 years ago [1,13,14], which was preceded by a few centuries by an
immigration of pastoralist cultures [15,16]. Thus, in these areas, the presumably Bantu-
speaking agriculturalist immigrants would have met both populations of hunter-
gatherers as well as pastoralists, whose descendants comprise the linguistically,
culturally, and genetically diverse “Khoisan” populations [17,18].
The Bantu-speaking populations nowadays inhabiting southern Africa are quite diverse
linguistically and culturally, comprising pastoralists, agro-pastoralists, and
agriculturalists who speak languages belonging to several different subgroups of both
Eastern and Western Bantu; these populations share the same territory and are often
involved in trade. From a genetic perspective, these populations appear to be relatively
homogenous, with little differences even among linguistically distinct populations
.CC-BY-NC-ND 4.0 International licenseIt is made available under a (which was not peer-reviewed) is the author/funder, who has granted bioRxiv a license to display the preprint in perpetuity.
The copyright holder for this preprint. http://dx.doi.org/10.1101/002808doi: bioRxiv preprint first posted online Feb. 18, 2014;

4""
[6,11,12,19]. The main genetic signal characterizing the people at the southernmost
edges of the Bantu expansion is the degree of admixture with the autochthonous
populations; this can be explicitly measured by the presence of the characteristic
mtDNA haplogroups L0d and L0k and Y-chromosomal haplogroups A-M51, A-M23,
and B-M112 [20–22]. Admixture with autochthonous peoples in Bantu-speaking
populations is detectable predominantly in the maternal line, in accordance with sex-
biased gene flow [20,23]. The level of admixture differs considerably among
populations; in particular, substantial proportions of mtDNA haplogroups L0d and/or
L0k are observed in the pastoralist Kuvale from southwestern Angola [21], in the Fwe
of southwestern Zambia [20], and in the Zulu and Xhosa from South Africa [24]. In
contrast, in populations from eastern Zambia, Zimbabwe, and Mozambique these
characteristic autochthonous haplogroups are found at a frequency of at most 3%
[19,25,26].
Among the culturally distinct populations in southern Africa are the Herero, Himba, and
Kuvale from northern Namibia and southern Angola, who speak dialects of the same
Bantu language and practice intensive semi-nomadic cattle pastoralism. The Herero and
Himba appear genetically distinct from other Bantu-speaking populations of the area,
including the culturally similar Kuvale [17,21,27,28]. Genetically, the closest relatives
of the Herero and Himba are the Damara [17,18], hunter-gatherers and small stock
herders who speak a Khoisan language of the Khoe-Kwadi family [29]. Intriguingly, the
Herero were known as “Cattle Damara” and the Damara were referred to as “Berg
Damara” in previous literature [29].
In this study we analyzed complete mtDNA genome sequences of 944 Bantu-speaking
individuals from Angola, Zambia, Namibia, and Botswana to investigate the maternal
genetic history of Bantu speakers of southern Africa. We also include 38 Damara
mtDNA genome sequences to further investigate the close genetic relationship between
the Herero, Himba, and Damara that emerged in previous research [18]. We focus on
the following research questions: 1) does the linguistic division into Western and
Eastern Bantu correlate with genetic divergence? 2) To what extent did the immigrating
Bantu-speaking agriculturalists intermarry with autochthonous populations? 3) What
factors can explain the genetic divergence between the culturally and linguistically
closely related Himba, Herero, and Kuvale on the one hand, and the genetic proximity
.CC-BY-NC-ND 4.0 International licenseIt is made available under a (which was not peer-reviewed) is the author/funder, who has granted bioRxiv a license to display the preprint in perpetuity.
The copyright holder for this preprint. http://dx.doi.org/10.1101/002808doi: bioRxiv preprint first posted online Feb. 18, 2014;

5""
of the Himba and Herero to the culturally and linguistically very distinct Damara? Our
results reveal a general homogeneity of the maternal lineages of Bantu speakers of
Angola and Zambia and suggest different demographic histories for the Herero, Himba
and Damara from Namibia as well as for Bantu-speaking populations of southern
Botswana.
MATERIALS AND METHODS Ethics statement
The collection of the samples was approved by the Ethics Committee of the University
of Leipzig and the Research Ethics Committee of the University of Zambia. Published
samples from Botswana and Namibia come from a sample collection authorized by the
governments of Botswana and of Namibia (Research permit CYSC 1/17/2 IV (8) from
the Ministry of Youth Sport and Culture of Botswana, and 17/3/3 from the Ministry of
Health and Social Services of Namibia). Samples from several populations of
southwestern Angola were collected as described by [21]. Each individual gave written
consent after the purpose of the study was explained with the help of local translators.
Individuals were assigned to populations according to the ethnolinguistic affiliation
(i.e., primary language spoken) of their maternal grandmother, as declared during
sample collection.
Samples and mtDNA sequence data
Details on the samples and DNA extraction are given in [12,17,20,21]. Full mtDNA
sequence data were generated from genome libraries tagged with either single or double
indexes, and enriched for mtDNA following protocols described previously [30,31].
The libraries were sequenced on the Illumina GAIIx (Solexa) platform, using either
single or paired end runs of 76 bp length, resulting in an average coverage of ~400x.
Sequences were manually checked with Bioedit
(www.mbio.ncsu.edu/BioEdit/bioedit.html) and read alignments were screened with ma
[32] to confirm indels. To minimize the impact of missing data, we applied imputation
using stringent criteria, replacing missing sites with the nucleotide that was present in at
least two otherwise identical haplotypes of the dataset.
.CC-BY-NC-ND 4.0 International licenseIt is made available under a (which was not peer-reviewed) is the author/funder, who has granted bioRxiv a license to display the preprint in perpetuity.
The copyright holder for this preprint. http://dx.doi.org/10.1101/002808doi: bioRxiv preprint first posted online Feb. 18, 2014;

6""
One hundred and ninety seven sequences from Botswana, Namibia, and Angola were
previously included in studies focusing on haplogroups L0d and L0k as well as on the
prehistory of Khoisan populations [18,33], while a subset of 169 sequences from
Zambia were included in [20]; the GenBank accession numbers of these samples can be
found in Table S1. The remaining 446 sequences from Zambia and 170 sequences from
Angola have not yet been reported and are available from GenBank with accession
numbers KJ185394-KJ186009. The final alignment consists of 982 sequences of 16465
bp. Positions with missing data as well as the poly-C-regions (np 303-315, 16183-
16194) were removed from all analyses; in addition, 45 positions with indels were
removed from all analyses run in Arlequin and from sequences used for network
construction.
Our dataset includes speakers of several Bantu languages belonging to both the Western
and the Eastern branches of Bantu according to the classification found on glottolog 2.2
(http://glottolog.org/). While we were able to group most of the samples into 17
ethnolinguistically homogenous populations that correspond to the identification of
donors' maternal grandmothers, some ethnolinguistic groups were represented by only a
few individuals. In these cases, we united samples in five aggregate “populations” of
speakers of closely related varieties based mainly on linguistic criteria, but ensuring that
the resulting populations were genetically homogeneous as shown by non-significant
between-population variance in AMOVA analyses and non-significant ΦST distances
(see Table S1 for the ethnolinguistic affiliation of each individual and the composition
of the aggregate “populations”). In addition, 49 individuals sampled in Namibia and
Zambia could not be grouped into populations with a meaningful sample size or had an
unclear ethnic affiliation; these were labeled as “others” and included only in lineage-
based analyses (i.e. networks and phylogenetic trees). Supplementary Table S1 provides
details on the country of sampling, ethnolinguistic affiliation, and GenBank accession
number for each sample. We also included the Damara, who speak a Khoe language
rather than a Bantu language, because of their known genetic proximity to Herero and
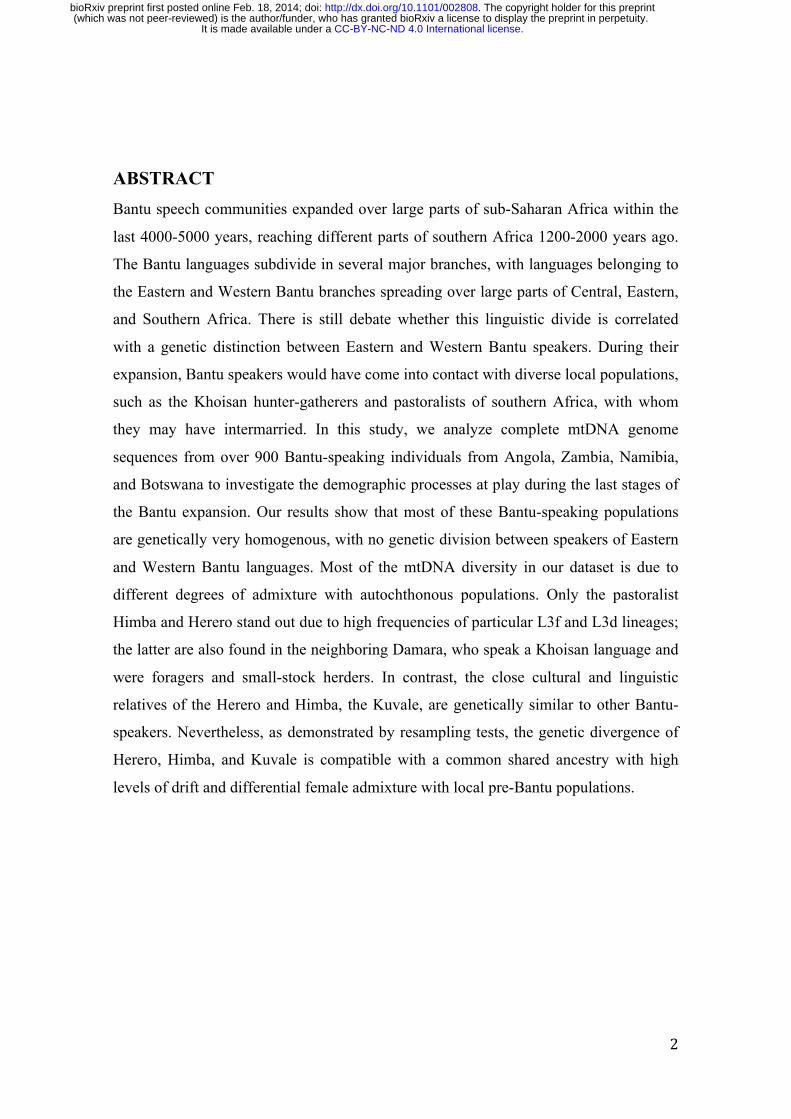
Himba [17,18]. The rough geographic location of the 23 populations included in the
study can be seen in Figure 1, while Table 1 summarizes the information on their
country of origin, linguistic affiliation, and subsistence.
.CC-BY-NC-ND 4.0 International licenseIt is made available under a (which was not peer-reviewed) is the author/funder, who has granted bioRxiv a license to display the preprint in perpetuity.
The copyright holder for this preprint. http://dx.doi.org/10.1101/002808doi: bioRxiv preprint first posted online Feb. 18, 2014;

7""
To investigate the variation in haplogroups L3d and L3f we further included published
data from African populations: for the visual depiction in Surfer maps, haplogroup
frequency data was collected from the literature as summarized in Table S2, while for
networks and BEAST runs, 28 published complete mtDNA genome sequences available
from GenBank were added to the alignment [34–38].
Statistical analyses
Haplogroup assignment was performed with the online tool Haplogrep [39].
Haplogroup affiliation of individuals belonging to haplogroup L0d and L0k was further
defined following the nomenclature reported in [33] (see Table S1). Analyses of
Molecular Variance (AMOVA), values of sequence diversity, and matrices of pairwise
ΦST values were computed in Arlequin ver. 3.11, while values of nucleotide diversity
and variance were calculated in R with the package Pegas [40]. A correspondence
analysis (CA) based on haplogroup frequencies was performed with the package ca
[41], and non-metric Multi-Dimensional Scaling (MDS) analyses based on pairwise ΦST
values were performed with the function “isoMDS” from the package MASS [42]. The
Africa-wide variation in frequency of haplogroups L3d and L3f was visualized on a
map with the software Surfer ver. 10.4.799 (Golden Software Inc.). Median-joining
networks [43] with all sites given equal weights and no pre- or post-processing steps
were computed with Network 4.11 (www.fluxus-engineering.com) and visualized in
Network publisher 1.3.0.0. A Mantel test was performed between genetic (Φst) and
geographic distances with the R package vegan [44]; geographic distances between
populations were averaged over GPS data from the individual sampling locations with
the function rdist.earth of the package fields [45].
BEAST (v1.7.2; [46]) was used to construct Bayesian Skyline Plots and phylogenetic
trees, based on the complete mtDNA sequence and using the mutation rate of 1.665 x
10-8 from Soares et al. [47]. A Generalized Time Reversible model was applied, and
multiple runs were performed for each dataset, using 10, 20 or 30 million chains for
single haplogroups and populations. For the schematic tree of the whole dataset 40
million chains and a GTR mutation model were used. The most probable tree from the
BEAST runs was assembled with TreeAnnotator and drawn with FigTree v 1.4.0.
.CC-BY-NC-ND 4.0 International licenseIt is made available under a (which was not peer-reviewed) is the author/funder, who has granted bioRxiv a license to display the preprint in perpetuity.
The copyright holder for this preprint. http://dx.doi.org/10.1101/002808doi: bioRxiv preprint first posted online Feb. 18, 2014;
8""
Resampling tests were performed in R to investigate the possible shared ancestry of the
Herero, Himba, and Damara on the one hand, and the Herero, Himba, and Kuvale on the
other, notwithstanding the absence of haplogroup L3f in the Damara and the absence of
L3d in the Kuvale and the concomitant high frequencies of these haplogroups in the
Herero and Himba. In both cases we proceeded as follows: the Herero and the Himba
were considered a single population with a sample size of 51 individuals, while for the
Damara and Kuvale we used the actual sample sizes included in the study (i.e. 38 and
53 individuals, respectively). We then created a hypothetical ancestral population with a
range of frequencies of the haplogroup of interest. This ancestral population was split
into two daughter populations with Ne = 1000, which were resampled for a number of
generations proportional to 500, 1000 and 2000 years (with a generation time of 25
years). At the end, a number of individuals corresponding to the population samples of
interest (i.e. 53 for Kuvale, 51 for Himba/Herero, or 38 for Damara) were sampled 100
times from the two daughter populations, and the probability of having a frequency of
the haplogroup of interest within the range of the respective confidence intervals for
both populations was recorded. The whole process was repeated 10,000 times for each
initial haplogroup frequency tested, and the probability values were recorded in a table.
For all simulations, population size was kept constant and no migration between the
daughter populations was considered.
RESULTS
Genetic structure of southern African Bantu-speakers
As can be seen from Table S3 and Figure S1, haplogroups found in relatively high
frequency across most of the populations of the dataset are L0a, L1c, L2a, and L3e.
Other haplogroups, however, are more restricted, being found in only a few populations;
of these, L3d and L3f (discussed in detail below) show a particularly striking
distribution, being found in very high frequency only in the populations of Namibia.
There is very little discernible structure in the maternal genepool of the Bantu-speaking
populations of southern Africa, as shown by a three-dimensional MDS analysis. Only
two distinct groups of populations emerge (Figure 2A): the Himba, Herero, and the non-
.CC-BY-NC-ND 4.0 International licenseIt is made available under a (which was not peer-reviewed) is the author/funder, who has granted bioRxiv a license to display the preprint in perpetuity.
The copyright holder for this preprint. http://dx.doi.org/10.1101/002808doi: bioRxiv preprint first posted online Feb. 18, 2014;
9""
Bantu-speaking Damara from Namibia on the one hand, and the Kuvale from Angola as
well as the Tswana and Kgalagadi from Botswana on the other hand; the Tswana and
Kgalagadi are separated from their geographic neighbors the Wider Shona. The third
dimension, however, splits the Damara from the Himba and Herero. It is notable that the
Kuvale are closer to other Bantu-speaking groups than to the Himba and the Herero,
who are genetically more similar to the Khoe-speaking Damara in spite of being
culturally and linguistically related to the Kuvale.
Haplogroups L0d and L0k are known to be an introgression from autochthonous
populations [18,24,33,35] and are thus indicative of post-immigration contact rather
than reflecting the genetic relationships among Bantu-speakers themselves; the
differential effects of gene flow from autochthonous populations are addressed below.
When excluding these clearly introgressed lineages from the MDS analysis, the same
two distinctive groups of populations, namely the Kuvale, Tswana, and Kgalagadi, and
the Himba, Herero, and Damara, emerge in an even more pronounced manner, with the
third dimension again separating the Damara from the Himba and Herero; all the other
Bantu-speaking populations, in contrast, cluster very closely (Figure 2B).
As can be seen in the CA plots displayed in Figure S2, the distinct position of the
Himba, Herero and Damara populations is driven by their high levels of haplogroup
L3d (Figure S2A), which is completely absent from the Kuvale (Table S3). In contrast,
the Tswana and Kgalagadi, who stand out in the MDS analysis, are no longer separated
in these CA plots, suggesting that their separate position in the MDS plots is mainly due
to divergent sequence types rather than a distinct haplogroup composition. The CA plots
additionally highlight other aspects of the data, separating the Northeast Zambia
population (characterized by the presence of the otherwise largely absent haplogroups
L0f and L4) or the Fwe and Shanjo, who have high frequencies of haplogroup L0k
(Figure S2A). When excluding these outliers, populations with very high frequencies of
haplogroup L0d (Kgalagadi, Tswana, Wider Shona, and Kuvale) stand out (Figure
S2B). The influence of different levels of admixture with autochthonous populations on
the genetic structure of the southern African Bantu-speaking groups is additionally
illustrated by the lack of discernable clusters when the introgressed haplogroups L0d
and L0k are excluded (Figure S2C).
.CC-BY-NC-ND 4.0 International licenseIt is made available under a (which was not peer-reviewed) is the author/funder, who has granted bioRxiv a license to display the preprint in perpetuity.
The copyright holder for this preprint. http://dx.doi.org/10.1101/002808doi: bioRxiv preprint first posted online Feb. 18, 2014;

10""
The difference of the Himba, Herero, and Damara from the other populations included
in this study also becomes apparent from measures of genetic diversity (Table 1): while
diversity is high for the Bantu-speaking populations in general, with many of the
ethnolinguistically defined self-identified groups (e.g. Nyaneka, Ovimbundu,
Kwamashi, Mbukushu) having values of sequence diversity of 0.99-1.00, and with
nucleotide diversity ranging between 0.0033 and 0.0040, the Himba, Herero and
Damara stand out in having both very low sequence diversity (0.93, 0.94, and 0.89,
respectively) and nucleotide diversity (0.0022 for the Herero-speakers, 0.0025 for the
Damara). The Kuvale again differ from the other Herero-speakers: although their
sequence diversity is relatively low (0.95), their nucleotide diversity is twice as high as
that of their linguistic and cultural relatives (0.0040); this diversity pattern resembles
that of the Fwe from southwestern Zambia, who have a sequence diversity of only 0.93,
but nucleotide diversity of 0.0038.
An Analysis of Molecular Variance (Table 2) demonstrates the relative lack of
differentiation among the southern African populations, with only ~6% of the variation
being found between populations, irrespective of whether haplogroups L0d and L0k,
which stem from post-immigration admixture, are included or not. A large proportion of
the variance between populations is due to the differentiation of the Himba, Herero, and
Damara, as shown by the fact that the between-population variance drops to ~3% when
excluding these populations. Affiliation to either of the two major branches of the Bantu
family (Eastern Bantu vs. Western Bantu) does not account for any genetic structure, as
seen by the complete absence of variance between groups. The three pastoralist
populations Herero, Himba, and Kuvale, are somewhat distinct from the non-pastoralist
Bantu-speaking populations, as shown by the significant between-group variance of
2.6% and 3.5%, respectively, depending on whether haplogroups L0d and L0k are
included in the analysis or not. Nevertheless, the genetic variation of the populations
included in the “pastoralist” and “non-pastoralist” grouping is higher than that between
the groups. Only a rough geographic subdivision correlates with some degree of genetic
structure: in this case the between group variance rises to ~5% (as opposed to a within
group variance of ~1.7%). On a finer scale, too, the pairwise geographic distances
correlate with the genetic distances: a Mantel test gives significant correlations both
.CC-BY-NC-ND 4.0 International licenseIt is made available under a (which was not peer-reviewed) is the author/funder, who has granted bioRxiv a license to display the preprint in perpetuity.
The copyright holder for this preprint. http://dx.doi.org/10.1101/002808doi: bioRxiv preprint first posted online Feb. 18, 2014;

11""
when including and excluding L0d and L0k sequences (r = 0.3286/p = 0.015 and r =
0.2575/p = 0.043, respectively).
Haplogroups L0d and L0k
The mtDNA haplogroups L0d and L0k have been convincingly shown to be
characteristic of autochthonous populations of southern Africa [18,24,35]. They
therefore represent an ideal measure for detecting admixture in the maternal line
between the immigrating Bantu-speaking groups and these autochthonous populations.
The frequency of these haplogroups ranges from complete absence in some of the
populations of Zambia to 53% in the Kgalagadi of southern Botswana (Table S3, see
Figure S3A for a graphic representation of the distribution of L0d and L0k lineages in
the populations considered here). Interestingly, hardly any of the L0d and L0k
sequences found in the Bantu-speaking populations are directly shared with extant
Khoisan foragers or pastoralists. As shown previously [33], the L0k sequences found in
Bantu-speaking populations diverge considerably from those found in extant Khoisan
populations. With respect to haplogroup L0d, as shown by the network only three
Bantu-speaking populations (involving four Herero, two Tswana, and one Kgalagadi
individual) share sequences directly with Khoisan (Figure 3). Three branches of the
network are found nearly exclusively in Bantu-speaking populations: one of these
(belonging to subhaplogroup L0d1a and indicated by arrow 1 in Figure 3) is derived
from a sequence type restricted to Khoe-speaking Shua from northeastern Botswana and
is found in Kuvale and Himba, with one Kuvale type shared with Nyaneka. The two
others (belonging to subhaplogroup L0d1b1 and indicated by arrow 2 and 3 in the
figure) are at least 11 mutations distant from the closest Khoisan haplotype; the eight
divergent haplotypes found on these branches again belong to Kuvale as well as to
different populations of Zambia and Angola. The only population found in this branch
that does not speak a Bantu language is the Damara.
Haplogroups L3d and L3f
The Himba and Herero stand out among the Bantu-speaking populations of southern
Africa in having very high frequencies of haplogroups L3d (38% and 47%,
respectively) and L3f (29% and 33%, respectively), while in their cultural and linguistic
.CC-BY-NC-ND 4.0 International licenseIt is made available under a (which was not peer-reviewed) is the author/funder, who has granted bioRxiv a license to display the preprint in perpetuity.
The copyright holder for this preprint. http://dx.doi.org/10.1101/002808doi: bioRxiv preprint first posted online Feb. 18, 2014;
12""
relatives, the Kuvale, L3d is absent and L3f has a frequency of only 6% (Table S3). In
contrast, the geographic neighbors of the Himba and Herero, the Khoe-speaking
Damara, have 63% L3d but completely lack L3f (cf. Table S3). The high levels of these
two haplogroups are thus clearly of key importance for understanding the prehistory of
the Herero, Himba, Kuvale, and Damara populations.
While haplogroup L3d is found across Africa at low frequency (Figure 4A, see
Supplementary Table S2 for the populations included in the Surfer map), the lineages
found at high frequency in southwestern Africa mostly belong to a single, highly
divergent branch, namely L3d3a1 (Figure 4B, Figure S3B). This can be further divided
into two clusters: one major node predominating in Khoisan, from which several
haplotypes found in Zambian populations radiate, and a derived starlike cluster found
mainly in the Himba, Herero, and Damara (indicated by an asterisk in Figure 4B).
Dating the signal of expansion detectable in the L3d3a1 branch with the rho statistic
[48] and the calculator from Soares et al. [47] gives an age of 395-6668 years BP, while
the expansion detectable in the Himba, Herero, and Damara dates to 711-2130 BP. The
first date is in good accordance with the pronounced branching dating to 2,500-3,000
years ago in a Bayesian tree of L3d sequences (highlighted in Figure S4A).
In contrast to L3d, L3f is found in frequencies >20% not only in southwestern Africa,
but also in some populations of the Cameroon/Chad border areas ([49,50]; Figure 4C,
Table S2). Nevertheless, the sequences found in the Himba and Herero all fall onto one
restricted branch L3f1b4a (Figure 4D, Figure S3B). Several other Bantu-speaking
populations from Namibia and Angola fall into this cluster as well, and the Himba and
Herero share two haplotypes with their cultural and linguistic relatives, the Kuvale. This
cluster exhibits a signal of expansion which can be dated with the rho statistic to
between 526 and 4234 years BP; this corresponds to a pronounced branching 2,500-
3,000 years ago in the Bayesian tree of L3f sequences (highlighted in Supplementary
Figure S4B).
The Damara, who have the highest frequency of L3d and who share a highly frequent
L3d haplotype with the Herero and Himba, entirely lack L3f. This finding is compatible
with two scenarios: 1) The mtDNA pool of the Damara, the Himba, and Herero is
derived from a single ancestral population, and haplogroup L3f was lost in the Damara
due to genetic drift. 2) The Damara mtDNA lineages stem from a different ancestral
.CC-BY-NC-ND 4.0 International licenseIt is made available under a (which was not peer-reviewed) is the author/funder, who has granted bioRxiv a license to display the preprint in perpetuity.
The copyright holder for this preprint. http://dx.doi.org/10.1101/002808doi: bioRxiv preprint first posted online Feb. 18, 2014;

13""
population than the Himba and Herero, and the Himba and Herero incorporated large
amounts of haplogroup L3d sequences through gene flow from Damara. In order to
distinguish between these hypotheses, we performed resampling tests, assuming a
frequency of 31% L3f (with 95% confidence intervals (C.I.) 19-46%) in the
Himba/Herero as well as 24% of the single L3d3a haplotype shared with the Damara
(C.I. 13-37%). For the Damara, a lack of haplogroup L3f (C.I. 0-9%) and 32% of the
L3d3a haplotype shared with Himba and Herero (C.I. 18-49%) was assumed. In
addition, in the resampling test in which we tried to assess the probability that the
Himba, Herero, and Damara would have retained a single shared haplotype at high
frequency, we included a probability of change of the L3d3a haplotype each generation
with a rate of one mutation every 3533 years following the rate of Soares et al. [47] for
the full mtDNA genome. As can be seen from Table 3, the presence of the L3d
haplotype shared at high frequency by the Himba, Herero, and Damara is expected with
a probability >0.05 even after a split of 2000 years if the frequency of this haplotype in
the ancestral population ranged from ~10-50%. Conversely, if haplogroup L3f was
present in the ancestral population at a frequency of ~5-30%, it could have drifted to
high frequency in the Himba and Herero and subsequently been lost in the Damara if
the split took place 2000 years ago. Thus, the scenario of shared ancestry of Damara,
Himba and Herero with subsequent loss through drift in the Damara of haplogroup L3f
cannot be excluded.
It is likewise intriguing that the culturally and linguistically closely related Herero,
Himba, and Kuvale have such divergent mtDNA genepools. This might be explained in
two ways: 1) these populations stem from a common ancestral population, and
differential gene flow led to their strong divergence; 2) these populations have distinct
maternal ancestors and their cultural and linguistic relationship is due to a shift in
language and culture. These two alternatives were also assessed with a resampling test,
assuming a frequency of 31% L3f (with 95% confidence intervals (C.I.) 19-46%) and
43% haplogroup L3d (C.I. 29-58%) in the Himba/Herero and a frequency of 5.7% L3f
(C.I. 1-16%) and a lack of haplogroup L3d (C.I. 0-7%) in the Kuvale. As can be seen
from Table 3, the hypothesis of a shared ancestor who carried both L3f and L3d is not
compatible with the data: even though haplogroup L3f could have drifted to the
observed frequencies if its frequency in the ancestral population ranged from ~8-31%,
.CC-BY-NC-ND 4.0 International licenseIt is made available under a (which was not peer-reviewed) is the author/funder, who has granted bioRxiv a license to display the preprint in perpetuity.
The copyright holder for this preprint. http://dx.doi.org/10.1101/002808doi: bioRxiv preprint first posted online Feb. 18, 2014;

14""
haplogroup L3d could not have been simultaneously lost from the Kuvale and drifted to
the high frequencies currently observed in the Himba and Herero.
DISCUSSION
Genetic diversity of Bantu-speaking populations and Western-Eastern Bantu
division
Overall, the Bantu-speaking populations of southern Africa are genetically quite
homogenous, with a few exceptions such as the Herero and Himba or Tswana and
Kgalagadi. While linguistically the populations can be divided into those speaking
Western Bantu languages and those speaking Eastern Bantu languages, this division is
not detectable in the maternal genepool, with none of the variance among populations
corresponding to this linguistic grouping (Table 2). Furthermore, the amount of
haplotypes shared between Eastern and Western Bantu speakers does not differ from the
amount of haplotypes shared within each linguistic group: 51 of 258 haplotypes are
shared among Eastern Bantu speakers, 80 of 381 haplotypes are shared among Western
Bantu speakers, and 52 haplotypes are shared between Eastern and Western Bantu
speakers. These results are in good accordance with a previous study [11] and support
the suggestion that any potential genetic signal of the split between Eastern and Western
populations was subsequently erased through admixture [51]. An alternative
explanation for the lack of genetic differentiation between the populations speaking
West and East Bantu languages is their possibly quite recent split, since East Bantu
languages might be an offshoot of West Bantu languages [51]. Furthermore, the so-
called Urewe pottery, the first Early Iron Age ceramic tradition of the Great Lakes
region, is often linked with the arrival and spread of Bantu speakers in Eastern Africa
[1]. The date of its emergence around 2500 years BP [52,53] can thus serve as an
approximate starting point of the Eastern Bantu dispersal [54].
Nevertheless, within the homogenous mtDNA landscape of southern African Bantu-
speakers some populations do stand out. The most notable outliers are the Herero and
Himba (discussed in detail below); apart from these, the Kgalagadi and Tswana as well
.CC-BY-NC-ND 4.0 International licenseIt is made available under a (which was not peer-reviewed) is the author/funder, who has granted bioRxiv a license to display the preprint in perpetuity.
The copyright holder for this preprint. http://dx.doi.org/10.1101/002808doi: bioRxiv preprint first posted online Feb. 18, 2014;

15""
as Northeast Zambia are separated in the MDS and CA analysis, respectively. The
Tswana and Kgalagadi, who speak closely related languages belonging to the Sotho-
Tswana group [55], are characterized by very high frequencies of haplogroup L0d,
which provides good evidence for extensive admixture in the maternal line with
autochthonous populations (Figure S3A). Nevertheless, this high level of indigenous
admixture is not the only reason for their distinctiveness, since they remain separate
from other populations in the MDS analysis even when haplogroups L0d and L0k are
excluded (Figure 2B). That this separation is mainly due to divergent sequence types
rather than a distinct haplogroup composition is demonstrated by the fact that they do
not stand out in the CA analysis (Figure S2). The Tswana and Kgalagadi speak closely
related languages belonging to the homogenous and close-knit Sotho-Tswana group,
which is clearly distinct from surrounding language groups [55,56]. Speakers of these
languages immigrated from further southeast into what is now Botswana only 500-800
years BP [57]; they would thus have been relatively isolated from the other Bantu-
speaking populations included in this study. The admixture of the Kgalagadi and
Tswana with autochthonous populations is likely to have taken place to a large extent
before their immigration into their current area of settlement while they were still settled
further to the southeast. This is evidenced by their complete lack of L0k (which is found
in high frequency in Khoisan populations of western Botswana [33]) and by the
distinctiveness of most of their L0d lineages, with only one Kgalagadi and two Tswana
L0d sequences shared with Khoisan populations from Namibia and Botswana (Figure
3). The Northeast Zambia population shows some affinities with populations further to
the northeast. For instance, it is the only population included here to carry haplogroups
L0f and L4; for both of these haplogroups an eastern African origin has been suggested
[19,58,59]. The presence of these haplogroups highlights the role played by admixture
in the diversification of Bantu-speaking populations [59,60].
Admixture with autochthonous populations
The degree of admixture between the immigrating Bantu-speaking agriculturalists and
autochthonous populations is highly variable. On the one hand, some Zambian
populations, such as the Nkoya, the Eastern Tonga, or the Totela, carry no
autochthonous lineages at all, while on the other hand the Kuvale, Fwe, Tswana,
.CC-BY-NC-ND 4.0 International licenseIt is made available under a (which was not peer-reviewed) is the author/funder, who has granted bioRxiv a license to display the preprint in perpetuity.
The copyright holder for this preprint. http://dx.doi.org/10.1101/002808doi: bioRxiv preprint first posted online Feb. 18, 2014;

16""
Wider_Shona, and Kgalagadi have 21-53% of haplogroups L0d and/or L0k. There is a
noticeable geographical cline in the presence of these two different autochthonous
haplogroups (cf. [33]), with L0d being present at high frequency in Bantu-speaking
populations from the southern range of our dataset (Botswana, Namibia, and southern
Angola), while L0k is practically absent from these populations (Figure S3A). While
the frequency distribution of L0d in our Bantu-speaking populations matches that of
extant Khoisan populations (where the highest frequencies of L0d are found in
populations of South Africa, Botswana, and Namibia), the highest frequencies of L0k in
extant Khoisan populations are found in western Botswana and northeastern Namibia
[33]. Together with the fact that practically all of the L0k lineages found in Bantu-
speaking populations are highly divergent, this distribution of L0k provides good
evidence that the Bantu-speaking immigrants into Zambia intermarried with genetically
distinct autochthonous populations who are nowadays extinct [20,33].
L0d, too, provides evidence that the gene flow between indigenous populations and
immigrating Bantu speech communities involved genetically distinct autochthonous
populations. For instance, there are two divergent branches belonging to subhaplogroup
L0d1b1 that are practically restricted to Bantu-speaking populations, being found in the
Kuvale and Nyaneka of southwestern Angola and in some populations of western
Zambia as well as one Damara (see arrows 2 and 3 in Figure 3). In addition, only the
Herero, Tswana, and Kgalagadi share L0d haplotypes directly with neighboring
Khoisan populations, and this to differing degrees. The admixture between Herero and
Khoisan populations is likely to have taken place quite recently, as they share four out
of their five L0d sequences (Table S4). In contrast, the Tswana share only two of their
five L0d sequences with different Khoisan populations, while two sequences are at least
four to five mutational steps distant from any Khoisan haplotypes. Rather surprisingly,
the Kgalagadi, who are the Bantu-speaking population with the highest level of
autochthonous haplogroups, share only one out of their ten L0d sequences directly with
the neighboring Khoe-speaking G|ui; the other haplotypes are between one and at least
eight mutational steps distant from the closest Khoisan sequence type (Table S4). These
data indicate that the gene flow from autochthonous populations into most of the Bantu-
speaking populations included in the dataset took place a long time ago and/or involved
Khoisan populations who did not survive into the present. It is furthermore notable that
.CC-BY-NC-ND 4.0 International licenseIt is made available under a (which was not peer-reviewed) is the author/funder, who has granted bioRxiv a license to display the preprint in perpetuity.
The copyright holder for this preprint. http://dx.doi.org/10.1101/002808doi: bioRxiv preprint first posted online Feb. 18, 2014;

17""
the Mbukushu, who are reported to have been closely associated with Khwe
populations, sharing villages and intermarrying with them [61], do not share any
sequences with Khwe.
Relationships of Kuvale, Himba, Herero, and Damara
The most striking results of this study concern the genetic differences between the
culturally and linguistically closely related Himba, Herero, and Kuvale on the one hand
and the genetic similarity of the Herero and Himba to the culturally and linguistically
distinct Damara, on the other. The Himba, Herero, and Damara differ in their maternal
lineages from all other populations included here, as shown by the AMOVA results
(Table 2) and the MDS and CA analyses (Figure 2 and Figure S2). This is in good
accordance with analyses of genomewide SNP data in which the Himba and Damara
also stand out as being distinct from other populations speaking Niger-Congo languages
[17]. The results of the resampling tests (Table 3) indicate that it is possible that the
Himba, Herero, and Damara all derive their mtDNA pool from the same ancestral
population (cf. [28]), a suggestion that fits well with the fact that in previous literature
both the Damara and the Herero were referred to as Damara, with the specification
"Berg Damara" for the former and "Cattle Damara" for the latter [29]. The low diversity
values found in these populations (Table 1) as well as the very high frequencies of only
one or two haplogroups (L3d and L3f) indicate that they have undergone a severe
founder event or bottleneck (cf. [62]), plausibly at the stage of their common ancestor.
As suggested by the starlike pattern evident in the networks of haplogroups L3d and L3f
(Figure 4B and 4D) and by the profusion of branches highlighted in the Bayesian trees
(Figure S4A and S4B), this bottleneck was followed by an expansion in all three
populations. Given the age of the expansion of 2,500-3,000 years, this demographic
scenario is not compatible with the known recent genocide experienced by the Herero,
which took place only 100 years ago [63]. The signal of the genocide-induced recent
bottleneck in the Herero might have subsequently been erased through adoption of a
Herero identity by Himba.
However, the complete lack of haplogroup L3f in the Damara suggests that they have
had a different demographic trajectory from the Himba and Herero – a hypothesis that is
further supported by the Bayesian Skyline Plots for these populations (Figure S5): these
.CC-BY-NC-ND 4.0 International licenseIt is made available under a (which was not peer-reviewed) is the author/funder, who has granted bioRxiv a license to display the preprint in perpetuity.
The copyright holder for this preprint. http://dx.doi.org/10.1101/002808doi: bioRxiv preprint first posted online Feb. 18, 2014;

18""
show a strong signal of recent expansion for the Herero and Himba but not the Damara.
Given the difference in life-style between the Himba and Herero on the one hand and
the Damara on the other, it is plausible that the stronger signal of expansion detectable
in the former is due to their intensive pastoralism, while the foraging and small-stock
herding subsistence of the latter did not permit any major increases in population size.
Whether the shared ancestral mtDNA pool derives from a pastoralist population, and the
Damara subsequently lost their livestock and reverted to foraging, or whether the
ancestral population was largely foraging and the Herero and Himba subsequently
adopted cattle pastoralism, cannot be elucidated with these data.
Intriguingly, although the Kuvale are linguistically and culturally closely related to the
Herero and the Himba, their mtDNA pool is closest to other Bantu-speaking populations
of Angola and Zambia, while displaying high levels of introgression of autochthonous
L0d lineages. There are two possible explanations for this discrepancy: 1) the Herero,
Himba, and Kuvale stem from genetically distinct ancestral populations but converged
culturally and linguistically through language/cultural replacement. In this case, the
small amount of haplotypes shared by the Kuvale, Herero, and Himba would stem from
recent admixture. 2) The Herero, Himba, and Kuvale all stem from a shared ancestor
but subsequently diverged through gene replacement, with admixture with now extinct
geographically structured autochthonous populations leading to the strong differences in
their mtDNA lineages. According to this hypothesis, the Kuvale would have retained
most of the ancestral mtDNA genepool, but would have admixed with peoples
essentially bearing L0d lineages, while the Himba, Herero and Damara would have
undergone large-scale admixture with people bearing haplogroups L3d and L3f (Figure
S3). The results of the resampling test (Table 3) demonstrate that if the Himba, Herero,
and Kuvale indeed stem from a common maternal ancestral population, this could have
carried haplogroup L3f, but not L3d, so that these populations must have undergone
both strong genetic drift as well as differential admixture. That the demographic
trajectory of the Kuvale differs from that of the Himba and Herero can also be seen in
the Bayesian Skyline plot (Figure S5), where the Kuvale, like the Damara, lack the
signal of recent expansion detectable for the Himba and Herero.
The L0d lineages in the Kuvale were previously suggested to possibly stem from
admixture with the now extinct Angolan Kwadi [21]. These were a pastoralist
.CC-BY-NC-ND 4.0 International licenseIt is made available under a (which was not peer-reviewed) is the author/funder, who has granted bioRxiv a license to display the preprint in perpetuity.
The copyright holder for this preprint. http://dx.doi.org/10.1101/002808doi: bioRxiv preprint first posted online Feb. 18, 2014;
19""
population who lived within the Kuvale territory and spoke a language related to the
Khoe languages, a family that has been suggested to have been brought to southern
Africa by a pre-Bantu migration of pastoralists [64]. Since haplogroup L0d is
widespread across Khoisan foragers and pastoralists [18], it is difficult to
unambiguously assign the Kuvale L0d lineages to a relatively recent pastoralist
migration. However, a branch of haplogroup L0d that is restricted to the Kuvale,
Himba, and Nyaneka (indicated by arrow 1 in Figure 3) derives from a sequence type
found in seven Shua. These are a Khoe-speaking population of northeastern Botswana
who are considered possible descendants of the Khoe-Kwadi-speaking pastoralists who
would also have been the ancestors of the Kwadi [64]. Since the Shua are settled so far
to the east of the Kuvale, direct admixture seems implausible, raising the possibility that
these lineages derive from admixture with Kwadi.
In contrast, subhaplogroup L3d3a has a much more confined distribution and is more
likely to have been brought to the area by Khoe-speaking pastoralists as previously
suggested [18]. This suggestion is in good accordance with the signal of expansion
detectable in these lineages ~2,500-3000 years BP (Figure S4), since archaeological
evidence of pastoralism is detectable from ~2,200 years in the region [16]. Surprisingly,
while roughly 50% of the maternal genepool of the Himba, Herero and Damara appear
to stem from this putative Khoe admixture, in analyses of genomewide SNP data the
Himba and Damara show no affinities with Khoe-speaking populations [17]. However,
since the putative incorporation of Khoe maternal lineages might have involved only a
few women related in the maternal line, followed by an expansion of this lineage in the
Damara, Himba and Herero ancestor, this lineage would have been retained unchanged
due to the specific characteristics of mtDNA. In contrast, the signal of relationship with
Khoe-speaking populations may have been lost from the autosomal DNA if this single
admixture event was followed by several generations of intermarriage with non-Khoe
populations. It thus appears likely that the maternal ancestors of the Kuvale, Herero,
Himba, and Damara had a haplogroup composition similar to that found in the Kuvale
today, albeit with somewhat higher frequencies of L3f, whereas the shared ancestor of
the modern-day Herero, Himba, and Damara incorporated Khoe-speaking women
carrying haplogroup L3d; subsequently, haplogroup L3f would have drifted to high
frequency in the shared pastoralist ancestor of the Himba and Herero while it was lost
.CC-BY-NC-ND 4.0 International licenseIt is made available under a (which was not peer-reviewed) is the author/funder, who has granted bioRxiv a license to display the preprint in perpetuity.
The copyright holder for this preprint. http://dx.doi.org/10.1101/002808doi: bioRxiv preprint first posted online Feb. 18, 2014;
20""
from the Damara. Detailed Y-chromosomal analyses of the Damara, Himba, Herero and
other Bantu-speaking populations of southern Africa are needed to further investigate
the prehistory of these groups.
CONCLUSIONS In summary, we have been able to show that the maternal genepool of the Bantu-
speaking populations of southern Africa is very homogenous. While the linguistic
division into Western and Eastern Bantu does not correlate with genetic divergence, the
results of the AMOVA and Mantel analyses demonstrate the impact of geography in
structuring the genetic variation. Furthermore, there are big differences in the extent of
intermarriage between Bantu-speaking agriculturalists and autochthonous peoples, with
some populations showing no evidence of gene flow, while others, like the populations
of Botswana, carrying substantial proportions of autochthonous lineages. The lack of
L0d/k sequences shared between Bantu and Khoisan populations suggests that the
admixture undergone by most of the Bantu-speaking immigrants into southern Africa
took place soon after their entering the region and partly involved now-extinct
autochthonous populations. Lastly, as shown by the results of our resampling tests, a
common ancestral population of the Kuvale, Himba, Herero, and Damara cannot be
ruled out. Given that these populations currently differ considerably in lifestyle and
language, the history of these populations was clearly complex, with language and
culture contact as well as genetic admixture playing important roles. Analyses of the Y-
chromosomal diversity will shed further light on these processes.
ACKNOWLEDGMENTS
This study focuses on the prehistory of populations as reflected in their genetic
variation. It does not intend to evaluate the self-identification or cultural identity of any
group, which consist of much more than just genetic ancestry. We sincerely thank: all
the sample donors for their participation in this study and the governments of Botswana,
Namibia, and Zambia for supporting our research; Roland Schröder and Madhusudan
Reddy Nandineni for assistance with library preparation; Hongyang Xu for help with
the imputation process; Ana Duggan for assistance with the tree analysis; and Mingkun
Li for assistance with the bioinformatics analysis. This work was funded by the Max
.CC-BY-NC-ND 4.0 International licenseIt is made available under a (which was not peer-reviewed) is the author/funder, who has granted bioRxiv a license to display the preprint in perpetuity.
The copyright holder for this preprint. http://dx.doi.org/10.1101/002808doi: bioRxiv preprint first posted online Feb. 18, 2014;

21""
Planck Society; CB was supported by the European Research Council ERC-2011-AdG
295733 grant (Langelin); MV was supported by STAB VIDA, Investigação e Serviços
em Ciências Biológicas, Lda., and by the Portuguese Ministry for Science, Technology
and Higher Education through PhD grant SFRH/BDE/51828/2012.
References:
1. Phillipson DW (2005) African archaeology. Cambridge: Cambridge University Press.
2. Bostoen K (2007) Pots, words and the Bantu problem: On lexical reconstruction and early African history. J Afr Hist 48.
3. Blench R (2006) Archaeology, Language, and the African Past. Rowman Altamira.
4. Nurse D, Philippson G (2003) Towards a historical classification of the Bantu languages. In: Nurse D, Philippson G, editors. The Bantu Languages. London/New York, Routledge. pp. 164–181.
5. Vansina J (1995) New Linguistic Evidence and “The Bantu Expansion.” J Afr Hist 36: 173–195. doi:10.1017/S0021853700034101.
6. Pakendorf B, Bostoen K, de Filippo C (2011) Molecular perspectives on the Bantu expansion: a synthesis. Lang Dyn Chang 1: 50–88.
7. Diamond J, Bellwood P (2003) Farmers and Their Languages: The First Expansions. Science (80- ) 300: 597–603.
8. Schadeberg TC (2003) Historical linguistics. In: Nurse D, Philippson G, editors. The Bantu Languages. London: Routeledge. pp. 143–163.
9. Bostoen K, Grollemund R, Koni Muluwa J (2013) Climate-induced vegetation dynamics and the Bantu Expansion: Evidence from Bantu names for pioneer trees (Elaeis guineensis, Canarium schweinfurthii, and Musanga cecropioides). Comptes Rendus Geosci 345: 336–349.
10. Pour NA, Plaster CA, Bradman N (2012) Evidence from Y-chromosome analysis for a late exclusively eastern expansion of the Bantu-speaking people. Eur J Hum Genet 21: 423–429.
11. Alves I, Coelho M, Gignoux C, Damasceno A, Prista A, et al. (2011) Genetic homogeneity across Bantu-speaking groups from Mozambique and Angola challenges early split scenarios between East and West Bantu populations. Hum Biol 83: 13–38.
.CC-BY-NC-ND 4.0 International licenseIt is made available under a (which was not peer-reviewed) is the author/funder, who has granted bioRxiv a license to display the preprint in perpetuity.
The copyright holder for this preprint. http://dx.doi.org/10.1101/002808doi: bioRxiv preprint first posted online Feb. 18, 2014;

22""
12. De Filippo C, Barbieri C, Whitten M, Mpoloka SW, Gunnarsdóttir ED, et al. (2011) Y-chromosomal variation in sub-Saharan Africa: insights into the history of Niger-Congo groups. Mol Biol Evol 28: 1255–1269. doi:10.1093/molbev/msq312.
13. Reid A, Sadr K, Hanson-James N (1998) Herding traditions. In: Lane P, Reid A, Segobye A, editors. Ditswa MMung: The Archaeology of Botswana. Gaborone: Pula Press and The Botswana Society. pp. 81–100.
14. Kinahan J (2011) From the beginning: the archaeological evidence. A History of Namibia: From the Beginning to 1990. London: Hurst and Company. pp. 15–43.
15. Mitchell P (2002) The Archaeology of Southern Africa. Cambridge: Cambridge University Press.
16. Pleurdeau D, Imalwa E, Detroit F, Lesur J, Veldman A, et al. (2012) “Of sheep and men”: earliest direct evidence of caprine domestication in southern Africa at leopard cave (Erongo, Namibia). PLoS One 7: e40340.
17. Pickrell JK, Patterson N, Barbieri C, Berthold F, Gerlach L, et al. (2012) The genetic prehistory of southern Africa. Nat Commun 3: 1143. doi:10.1038/ncomms2140.
18. Barbieri C, Güldemann T, Naumann C, Gerlach L, Berthold F, et al. (2014) Unraveling the complex maternal history of Southern African Khoisan populations. Am J Phys Anthropol 153: 435–448.
19. Salas A, Richards M, De la Fe T, Lareu M V, Sobrino B, et al. (2002) The making of the African mtDNA landscape. Am J Hum Genet 71: 1082–1111.
20. Barbieri C, Butthof A, Bostoen K, Pakendorf B (2013) Genetic perspectives on the origin of clicks in Bantu languages from southwestern Zambia. Eur J Hum Genet 21: 430–436.
21. Coelho M, Sequeira F, Luiselli D, Beleza S, Rocha J (2009) On the edge of Bantu expansions: mtDNA, Y chromosome and lactase persistence genetic variation in southwestern Angola. BMC Evol Biol 9: 80.
22. Wood ET, Stover DA, Ehret C, Destro-Bisol G, Spedini G, et al. (2005) Contrasting patterns of Y chromosome and mtDNA variation in Africa: evidence for sex-biased demographic processes. Eur J Hum Genet 13: 867–876.
23. Quintana-Murci L, Harmant C, Quach H, Balanovsky O, Zaporozhchenko V, et al. (2010) Strong Maternal Khoisan Contribution to the South African Coloured Population: A Case of Gender-Biased Admixture. Am J Hum Genet 86: 611–620.
.CC-BY-NC-ND 4.0 International licenseIt is made available under a (which was not peer-reviewed) is the author/funder, who has granted bioRxiv a license to display the preprint in perpetuity.
The copyright holder for this preprint. http://dx.doi.org/10.1101/002808doi: bioRxiv preprint first posted online Feb. 18, 2014;

23""
24. Schlebusch CM, Lombard M, Soodyall H (2013) MtDNA control region variation affirms diversity and deep sub-structure in populations from southern Africa. BMC Evol Biol 13: 1–21.
25. De Filippo C, Heyn P, Barham L, Stoneking M, Pakendorf B (2010) Genetic perspectives on forager-farmer interaction in the Luangwa valley of Zambia. Am J Phys Anthr 141: 382–394.
26. Castrì L, Tofanelli S, Garagnani P, Bini C, Fosella X, et al. (2009) mtDNA variability in two Bantu-speaking populations (Shona and Hutu) from Eastern Africa: Implications for peopling and migration patterns in sub-Saharan Africa. Am J Phys Anthropol 140: 302–311.
27. Güldemann T, Stoneking M (2008) A Historical Appraisal of Clicks: A Linguistic and Genetic Population Perspective. Annual Review of Anthropology. Annual Reviews, Vol. 37. pp. 93–109.
28. Soodyall H, Jenkins T (1992) Mitochondrial DNA polymorphisms in Khoisan populations from southern Africa. Ann Hum Genet 56: 315–324.
29. Barnard ACN (1992) Hunters and herders of southern Africa: a comparative ethnography of the Khoisan peoples. Cambridge"; New York: Cambridge University Press.
30. Maricic T, Whitten M, Pääbo S (2010) Multiplexed DNA Sequence Capture of Mitochondrial Genomes Using PCR Products. PLoS One 5: e14004–e14004.
31. Meyer M, Kircher M (2010) Illumina sequencing library preparation for highly multiplexed target capture and sequencing. Cold Spring Harb Protoc 2010: pdb–prot5448.
32. Briggs AW, Good JM, Green RE, Krause J, Maricic T, et al. (2009) Targeted retrieval and analysis of five Neandertal mtDNA genomes. Science (80- ) 325: 318.
33. Barbieri C, Vicente M, Rocha J, Mpoloka SW, Stoneking M, et al. (2013) Ancient substructure in early mtDNA lineages of southern Africa. Am J Hum Genet 92: 285–292. doi:10.1016/j.ajhg.2012.12.010.
34. Gonder MK, Mortensen HM, Reed FA, de Sousa A, Tishkoff SA (2007) Whole-mtDNA genome sequence analysis of ancient African lineages. Mol Biol Evol 24: 757–768.
35. Behar DM, Villems R, Soodyall H, Blue-Smith J, Pereira L, et al. (2008) The Dawn of Human Matrilineal Diversity. Am J Hum Genet 82: 1130–1140.
.CC-BY-NC-ND 4.0 International licenseIt is made available under a (which was not peer-reviewed) is the author/funder, who has granted bioRxiv a license to display the preprint in perpetuity.
The copyright holder for this preprint. http://dx.doi.org/10.1101/002808doi: bioRxiv preprint first posted online Feb. 18, 2014;

24""
36. Batini C, Lopes J, Behar DM, Calafell F, Jorde LB, et al. (2011) Insights into the Demographic History of African Pygmies from Complete Mitochondrial Genomes. Mol Biol Evol 28: 1099–1110.
37. Hartmann A, Thieme M, Nanduri LK, Stempfl T, Moehle C, et al. (2009) Validation of Microarray-Based Resequencing of 93 Worldwide Mitochondrial Genomes. Hum Mutat 30: 115–122.
38. Torroni A, Achilli A, Macaulay V, Richards M, Bandelt H-J (2006) Harvesting the fruit of the human mtDNA tree. TRENDS Genet 22: 339–345.
39. Kloss-Brandstätter A, Pacher D, Schönherr S, Weissensteiner H, Binna R, et al. (2011) HaploGrep: a fast and reliable algorithm for automatic classification of mitochondrial DNA haplogroups. Hum Mutat 32: 25–32.
40. Paradis E (2010) pegas: an R package for population genetics with an integrated–modular approach. Bioinformatics 26: 419.
41. Nenadic O, Greenacre M (2007) Correspondence analysis in R, with two-and three-dimensional graphics: the ca package. J Stat Softw 20: 1–13.
42. Venables WN, Ripley BD (2002) MASS: modern applied statistics with S. New York: Springer.
43. Bandelt HJ, Forster P, Rohl A (1999) Median-joining networks for inferring intraspecific phylogenies. Mol Biol Evol 16: 37–48.
44. Oksanen J, Blanchet FG, Kindt R, Legendre P, Minchin PR, et al. (2012) vegan: Community Ecology Package. R package version 2.0-5. http://cran.r-project.org/web/packages/vegan/index.html.
45. Furrer R, Nychka D, Sain S (2012) fields: Tools for spatial data. R Packag version 6: http://CRAN.R–project.org/package=fields.
46. Drummond AJ, Suchard MA, Xie D, Rambaut A (2012) Bayesian Phylogenetics with BEAUti and the BEAST 1.7. Mol Biol Evol 29: 1969–1973.
47. Soares P, Ermini L, Thomson N, Mormina M, Rito T, et al. (2009) Correcting for purifying selection: an improved human mitochondrial molecular clock. Am J Hum Genet 84: 740–759.
48. Forster P, Harding R, Torroni A, Bandelt HJ (1996) Origin and evolution of Native American mtDNA variation: a reappraisal. Am J Hum Genet 59: 935–945.
49. Černỳ V, Salas A, Hajek M, Žaloudková M, Brdička R (2007) A Bidirectional Corridor in the Sahel-Sudan Belt and the Distinctive Features of the Chad Basin
.CC-BY-NC-ND 4.0 International licenseIt is made available under a (which was not peer-reviewed) is the author/funder, who has granted bioRxiv a license to display the preprint in perpetuity.
The copyright holder for this preprint. http://dx.doi.org/10.1101/002808doi: bioRxiv preprint first posted online Feb. 18, 2014;
25""
Populations: A History Revealed by the Mitochondrial DNA Genome. Ann Hum Genet 71: 433–452.
50. Cerezo M, Černỳ V, Carracedo Á, Salas A (2011) New insights into the Lake Chad Basin population structure revealed by high-throughput genotyping of mitochondrial DNA coding SNPs. PLoS One 6.
51. De Filippo C, Bostoen K, Stoneking M, Pakendorf B (2012) Bringing together linguistic and genetic evidence to test the Bantu expansion. Proc R Soc B-Biological Sci 279: 3256–3263.
52. Clist B (1987) A critical reappraisal of the chronological framework of the early Urewe Iron Age industry. Muntu 6: 35–62.
53. Ashley CZ (2010) Towards a socialised archaeology of ceramics in Great Lakes Africa. African Archaeol Rev 27: 135–163.
54. Neumann K, Bostoen K, Höhn A, Kahlheber S, Ngomanda A, et al. (2012) First farmers in the Central African rainforest: A view from southern Cameroon. Quat Int 249: 53–62. doi:10.1016/j.quaint.2011.03.024.
55. Gowlett DF (2003) The Bantu Languages. In: Nurse D, Philippson G, editors. Routledge. pp. 609–638.
56. Creissels D (1999) Remarks on the Sound Correspondences between Proto-Bantu and Tswana (S. 31), with Particular Attention to Problems Involving* j (or* y),* i and sequences* NC. In: Hombert J-M, Hyman LM, editors. Bantu Historical Linguistics. Theoretical and Empirical Perspectives. Stanford": CSLI (Center for the Study of Language and Information) Publications. pp. 297–334.
57. Solway JS (1991) Tswana. In: Middleton J, Rassam A, editors. Encyclopedia of World Cultures, Volume IX - Africa and the Middle East. Boston, G.K. Hall & Company. pp. 360–365.
58. Kivisild T, Reidla M, Metspalu E, Rosa A, Brehm A, et al. (2004) Ethiopian mitochondrial DNA heritage: tracking gene flow across and around the gate of tears. Am J Hum Genet 75: 752–770.
59. Batai K, Babrowski KB, Arroyo JP, Kusimba CM, Williams SR (2013) Mitochondrial DNA Diversity in Two Ethnic Groups in Southeastern Kenya: Perspectives from the Northeastern Periphery of the Bantu Expansion. Am J Phys Anthropol 150: 482–491.
60. Sikora M, Laayouni H, Calafell F, Comas D, Bertranpetit J (2010) A genomic analysis identifies a novel component in the genetic structure of sub-Saharan African populations. Eur J Hum Genet 19: 84–88.
.CC-BY-NC-ND 4.0 International licenseIt is made available under a (which was not peer-reviewed) is the author/funder, who has granted bioRxiv a license to display the preprint in perpetuity.
The copyright holder for this preprint. http://dx.doi.org/10.1101/002808doi: bioRxiv preprint first posted online Feb. 18, 2014;

26""
61. Fisch M (2005) The Mbukushu in Angola (1730-2002): A History of Migration, Flight and Royal Rainmaking. Rüdiger Köppe.
62. Spurdle AB, Hammer MF, Jenkins T (1994) The Y Alu polymorphism in southern African populations and its relationship to other Y-specific polymorphisms. Am J Hum Genet 54: 319–330.
63. Wallace M (2011) A History of Namibia: From the Beginning to 1990. Columbia University Press.
64. Güldemann T (2008) A linguist’s view: Khoe-Kwadi speakers as the earliest food-producers of southern Africa. South African Humanit 20: 93–132.
.CC-BY-NC-ND 4.0 International licenseIt is made available under a (which was not peer-reviewed) is the author/funder, who has granted bioRxiv a license to display the preprint in perpetuity.
The copyright holder for this preprint. http://dx.doi.org/10.1101/002808doi: bioRxiv preprint first posted online Feb. 18, 2014;

27##
Table 1: List of populations included in the study with their linguistic affiliation, geographic location, and values of genetic diversity.
Population Country of Sampling Code Linguistic Affiliation Subsistence N n S seq div SD π SD Nyaneka Angola NYA West Bantu agropastoralist 59 50 481 0.99 0.00 0.0037 1.80E-03 Ovimbundu Angola OVM West Bantu agriculturalist 60 53 494 1.00 0.00 0.0036 1.73E-03 Ganguela Angola GAN West Bantu agriculturalist 20 16 290 0.97 0.03 0.0040 2.02E-03 Chokwe, Luchazi, Luvale1 Zambia CHO West Bantu agriculturalist 33 32 319 1.00 0.01 0.0038 1.88E-03 Mbunda Zambia MBN West Bantu agriculturalist 67 55 551 0.99 0.01 0.0038 1.84E-03 Kuvale Angola KUV West Bantu pastoralist 53 29 369 0.95 0.02 0.0040 1.93E-03 Herero Namibia HER West Bantu pastoralist 30 20 160 0.94 0.03 0.0022 1.12E-03 Himba Namibia HIM West Bantu pastoralist 21 13 147 0.93 0.04 0.0022 1.11E-03 Kgalagadi Botswana KGA East Bantu agropastoralist 19 15 205 0.97 0.03 0.0033 1.68E-03 Tswana Botswana TSW East Bantu agropastoralist 20 19 188 0.99 0.02 0.0034 1.72E-03 Wider Shona1 Botswana SHO East Bantu agriculturalist 20 20 317 1.00 0.02 0.0040 2.03E-03 Lozi Zambia LOZ East Bantu agriculturalist 118 94 613 0.99 0.00 0.0037 1.80E-03 Kwamashi Zambia KWA West Bantu agriculturalist 35 27 319 0.97 0.02 0.0036 1.76E-03 Mbukushu Zambia MBK West Bantu agriculturalist 23 21 316 0.99 0.02 0.0038 1.91E-03 Shanjo Zambia SHA East Bantu agriculturalist 25 18 299 0.97 0.02 0.0038 1.89E-03 Wider Luyana1 Zambia LUY West Bantu agriculturalist 106 83 545 0.99 0.00 0.0036 1.72E-03 Nkoya Zambia NKO West Bantu agriculturalist 32 25 323 0.98 0.01 0.0036 1.78E-03 Eastern Tonga1 Zambia TNG East Bantu agriculturalist 48 47 444 1.00 0.00 0.0038 1.86E-03 Fwe Zambia FWE East Bantu agriculturalist 33 20 292 0.93 0.03 0.0038 1.87E-03 Subiya Zambia SUB East Bantu agriculturalist 20 17 229 0.98 0.02 0.0035 1.78E-03 Totela Zambia TOT East Bantu agriculturalist 29 25 306 0.99 0.01 0.0036 1.78E-03 Northeast Zambia1 Zambia NEZ East Bantu agriculturalist 24 23 334 1.00 0.01 0.0038 1.91E-03 Damara Namibia DAM Khoisan forager/small stock 38 20 250 0.89 0.04 0.0025 1.23E-03 1Aggregate populations: ethnolinguistic affiliation of each individual can be traced in Supplementary Table S1. code = abbreviation used in figures; N = sample size; n = number of haplotypes; S = number of segregating sites; seq div = sequence diversity; SD = standard deviation; π = nucleotide diversity.
.CC-BY-NC-ND 4.0 International licenseIt is made available under a (which was not peer-reviewed) is the author/funder, who has granted bioRxiv a license to display the preprint in perpetuity.
The copyright holder for this preprint. http://dx.doi.org/10.1101/002808doi: bioRxiv preprint first posted online Feb. 18, 2014;

28##
Table 2: Results of AMOVA analyses n of
groups between groups
between pops (within groups)
within pops
a) Including haplogroups L0d/L0k
All 23 populations 1 5.51** 94.49 20 populations (excl. HER, HIM, DAM)
1 3.22** 96.78
Linguistic criteria (West vs East Bantu) a
2 -0.14 4.72** 95.42
Subsistence criteria (Pastoralists vs non-pastoralists) a
2 2.64* 3.97** 93.39
Geographic Criteria (NW, SW, SE, Centre, NE) b
5 4.80** 1.77** 93.43
b) Excluding haplogroups L0d/L0k
All 23 populations 1 5.94** 94.06 20 populations (excl. HER, HIM, DAM)
1 2.58** 97.42
Linguistic criteria (West vs East Bantu) a
2 -0.33 4.85** 95.48
Subsistence criteria (Pastoralists vs non-pastoralists) a
2 3.50* 3.83** 92.67
Geographic Criteria (NW, SW, SE, Centre, NE) b
5 5.31** 1.64** 93.06
* significant at 0.05 level; ** significant at 0.01 level a The grouping by linguistic and subsistence criteria followed the assignment in Table 1 b Geographic grouping: NW = OVM, NYA, KUV, GAN; SW = HER, HIM; SE = KGA, TSW, SHO; NE = NEZ; CENTRE = CHO, MBN, NKO, LOZ, LUY, KWA, SHA, MBK, TOT, FWE, SUB, TNG Note: The groupings by linguistic, subsistence, and geographic criteria were performed without the Damara, as these cannot be assigned to the linguistic grouping West Bantu or East Bantu
.CC-BY-NC-ND 4.0 International licenseIt is made available under a (which was not peer-reviewed) is the author/funder, who has granted bioRxiv a license to display the preprint in perpetuity.
The copyright holder for this preprint. http://dx.doi.org/10.1101/002808doi: bioRxiv preprint first posted online Feb. 18, 2014;

29##
Table 3: Results of resampling tests
Initial Percentage 0.09 0.13 0.17 0.21 0.25 0.29 0.33 0.37 0.41 0.45 0.49 0.53 0.57
500 ya a 0.02 0.11 0.32 0.47 0.62 0.65 0.51 0.47 0.22 0.11 0.08 0.01 0.00 1000 ya a 0.04 0.11 0.26 0.40 0.55 0.58 0.52 0.39 0.18 0.11 0.09 0.03 0.01 2000 ya a 0.03 0.12 0.24 0.31 0.41 0.42 0.36 0.30 0.22 0.20 0.10 0.05 0.02
Initial Percentage 0.01 0.05 0.09 0.13 0.17 0.21 0.25 0.29 0.32 0.34 0.36 0.38 0.4
500 ya b 0.00 0.00 0.04 0.06 0.08 0.05 0.01 0.01 0.00 0.00 0.00 0.00 0.00 1000 ya b 0.00 0.01 0.05 0.11 0.09 0.09 0.04 0.02 0.01 0.01 0.01 0.00 0.00 2000 ya b 0.01 0.03 0.09 0.10 0.10 0.08 0.07 0.03 0.02 0.02 0.01 0.01 0.01 500 ya c 0.00 0.02 0.04 0.20 0.17 0.13 0.15 0.10 0.05 0.05 0.03 0.01 0.01 1000 ya c 0.00 0.02 0.07 0.14 0.27 0.25 0.11 0.07 0.08 0.03 0.02 0.01 0.01 2000 ya c 0.00 0.03 0.08 0.13 0.16 0.17 0.18 0.10 0.10 0.07 0.05 0.04 0.04 500 ya d 0.00 0.00 0.00 0.02 0.03 0.01 0.01 0.00 0.00 0.00 0.00 0.00 0.00 1000 ya d 0.00 0.00 0.01 0.01 0.02 0.01 0.01 0.01 0.00 0.00 0.00 0.00 0.00 2000 ya d 0.00 0.01 0.02 0.03 0.03 0.02 0.02 0.01 0.01 0.01 0.01 0.00 0.00
a Probability of retaining the shared L3d haplotype in Himba/Herero and Damara for different time splits (Years Ago) b Probability of retaining L3f in Himba and Herero and losing it in Damara for different time splits (Years Ago) c Probability of retaining L3f in Himba and Herero and having it at low percentage in Kuvale for different time splits (Years Ago) d Probability of retaining L3d in Himba and Herero and losing it in Kuvale for different time splits (Years Ago)
.CC-BY-NC-ND 4.0 International licenseIt is made available under a (which was not peer-reviewed) is the author/funder, who has granted bioRxiv a license to display the preprint in perpetuity.
The copyright holder for this preprint. http://dx.doi.org/10.1101/002808doi: bioRxiv preprint first posted online Feb. 18, 2014;

NYA
OVM
GANCHO
MBN
KUV
HER
HIMDAM
KGATSW
SHO
LOZKWA
MBKSHALUY
NKO
TNGFWE SUBTOT
NEZ
Khoisan
East BantuWest Bantu
Figure 1: Map showing the rough geographical location of populations, colored by linguistic affiliation. Abbreviations of population labels are as specified in Table 1.
�2 �1 ���� ���1 ����
���
��
5�����
����
5�����
���
���
�����
�����
NYA
OVM
GAN
CHOMBN
KUV
HERHIM KGA
TSW
LUY LOZKWA
MBK
SHA
SHO
NKO
TNG
FWE
SUB
TOT NEZ
DAM
Dimension 1
Dim
ensi
on 3
Dimen
sion 2
A B
�� �8 �6 �4 �2 ���� ���2 ���4 ���6 ����
�4
�3
�2
�1
����
���1
���2
���3
����
��
��
����
����
����
NYA
OVM
GANCHO
MBNKUV
HERHIM KGA
TSW
LUYLOZ
KWA
MBK
SHA
SHONKO
TNG
FWE
SUB
TOT
NEZ
DAM
Dimension 1
Dim
ensi
on 3
Dimen
sion 2
)LJXUH����7KUHH�GLPHQVLRQDO�0'6�DQDO\VLV�EDVHG�RQ�SDLUZLVH�ĭ67�YDOXHV�EHWZHHQ�populations. Color coding by linguistic affiliation; abbreviations of population labels are DV�VSHFLILHG�LQ�7DEOH����$��,QFOXGLQJ�DOO�VHTXHQFHV��VWUHVV� ������%��([FOXGLQJ�/�G�DQG�/�N�VHTXHQFHV��VWUHVV� �������3RSXODWLRQV�GLVFXVVHG�LQ�WKH�PDLQ�WH[W�DUH�KLJKOLJKWHG�with bold font and a red line in the plot.
.CC-BY-NC-ND 4.0 International licenseIt is made available under a (which was not peer-reviewed) is the author/funder, who has granted bioRxiv a license to display the preprint in perpetuity.
The copyright holder for this preprint. http://dx.doi.org/10.1101/002808doi: bioRxiv preprint first posted online Feb. 18, 2014;

LegendDamaraHereroHimba
KgalagadiTswana
Khoisan
KuvaleOther Bantu
L0d3
L0d2
L0d1
L0d2a1
L0d2
d
L0d2
a2
L0d2b
L0d2
c
L0d1
a
L0d1b2aL0d1b1
L0d1b2b
L0d1c L0d1
c2
L0d1c1
1
2
3
Figure 3: Network of complete mtDNA genome sequences from southern Africa belonging to haplogroup L0d. Branches highlighted by arrows are discussed in the text. Only sublineages of L0d2a1, L0d1b2a, L0d1b2b and L0d1c1 are shared directly between Bantu-speaking and Khoisan-speaking populations.
.CC-BY-NC-ND 4.0 International licenseIt is made available under a (which was not peer-reviewed) is the author/funder, who has granted bioRxiv a license to display the preprint in perpetuity.
The copyright holder for this preprint. http://dx.doi.org/10.1101/002808doi: bioRxiv preprint first posted online Feb. 18, 2014;
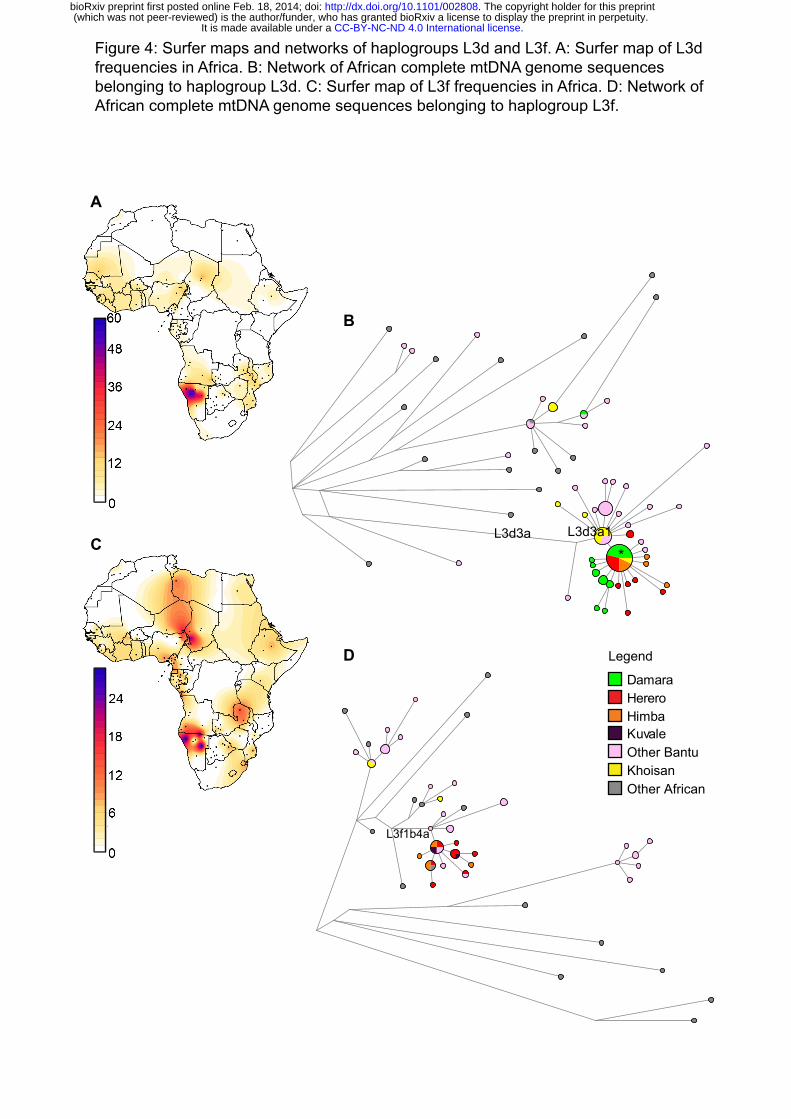
L3f1b4a
Legend
DamaraHereroHimba
KhoisanOther African
Other Bantu
L3d3a
Kuvale
L3d3a1
*
A
B
C
D
Figure 4: Surfer maps and networks of haplogroups L3d and L3f. A: Surfer map of L3d frequencies in Africa. B: Network of African complete mtDNA genome sequences belonging to haplogroup L3d. C: Surfer map of L3f frequencies in Africa. D: Network of African complete mtDNA genome sequences belonging to haplogroup L3f.
.CC-BY-NC-ND 4.0 International licenseIt is made available under a (which was not peer-reviewed) is the author/funder, who has granted bioRxiv a license to display the preprint in perpetuity.
The copyright holder for this preprint. http://dx.doi.org/10.1101/002808doi: bioRxiv preprint first posted online Feb. 18, 2014;