Embed Size (px)
Citation preview
CHAPTER44Migration and EducationChristian Dustmann* and Albrecht Glitz**1�Economics Department, University College London, London WC1E6BT, UK and Centre for Research and Analysis ofMigration (CReAM)��Department of Economics and Business, Universitat Pompeu Fabra, 08005 Barcelona, Spain and Centre for Research andAnalysis of Migration (CReAM)
Contents
1. Introduction 3292. Empirical Evidence 331
2.1. Educational Attainment of Migrants 3312.2. Migration and Acquisition of Education 3392.3. Return Migration 3432.4. The Next Generation 346
3. The Migrant 3493.1. The Migration Decision and Human Capital Investment 3493.2. A Simple Model of Return Migration and Investment in Human Capital 351
3.2.1 Skill Enhancement and Return Decisions of Migrants 3533.2.2 Skill Investment in the Home Country 3543.2.3 The Migration Decision 355
3.3. Implications of the Model 3553.3.1 The Optimal Investment in Human Capital and the Optimal Migration Duration 3553.3.2 Permanent Migration 3563.3.3 Temporary Migration with Exogenous Return Date 3573.3.4 Temporary Migration with Endogenous Return Date 3583.3.5 The Optimal Investment in Learning in the First Period 360
3.4. Empirical Studies 3623.4.1 Assimilation and Adaptation 3623.4.2 Extensions of the Basic Approach 3653.4.3 Return Migration 3683.4.4 Language 3703.4.5 Downgrading and Ethnic Networks 3743.4.6 Observed Postmigration Schooling Investment and Learning Centers 375
4. The Effect of Migration on the Skill Base and Educational Attainment of Nonmigrants 3764.1. The Selection of Migrants 377
4.1.1 A Multiple-Skill Model of Migrant Selection 378
1 We would like to thank Jérôme Adda, Andrew Mountford, Ian Preston, and Yoram Weiss for helpful comments, andAndrew Aitken, Gianandrea Lanzara, Anna Raute, and Anna Rosso for excellent research assistance. Albrecht Glitzacknowledges the support of the Barcelona GSE Research Network, the Government of Catalonia, and the SpanishMinistry of Science (Project No. ECO2008-06395-C05-01). Christian Dustmann acknowledges the support of theNORFACE programme on migration.
Handbook of the Economics of Education, Volume 4 © 2011 Elsevier B.V.ISSN 0169-7218, DOI: 10.1016/B978-0-444-53444-6.00004-3 All rights reserved. 327
4.1.2 Skill Prices, Productive Capacity, and Selection 3824.1.3 Explaining Different Selection Patterns 384
4.2. Selection and Return Migration 3874.3. Learning, Multidimensional Skills, and Return Migration 3884.4. Empirical Studies 391
4.4.1 Emigration and Human Capital Investment in the Sending Country 3924.4.2 Immigration and Human Capital Investment in the Receiving Country 395
5. The Children of Immigrants 3975.1. Immigrants and Intergenerational Mobility 3995.2. A Model of Intergenerational Mobility of Immigrants 4015.3. Empirical Evidence 404
5.3.1 Schooling Outcomes of Immigrant Children 4045.3.2 Intergenerational Transmission of Human Capital 4075.3.3 Intergenerational Transmission and Language 4105.3.4 Intergenerational Transmission and Ethnic Networks 411
6. Conclusion 412References 429
Abstract
Sjaastad (1962) viewed migration in the same way as education: as an investment in the human agent.Migration and education are decisions that are indeed intertwined in many dimensions. Educationand skill acquisition play an important role at many stages of an individual’s migration. Differential returnsto skills in origin and destination country are a main driver of migration. The economic success of theimmigrant in the destination country is to a large extent determined by his or her educational back-ground, how transferable these skills are to the host country labor market and how much he or sheinvests in further skills after arrival. The desire to acquire skills in the host country that have a high returnin the country of origin may be another important reason for a migration. From an intertemporal point ofview, the possibility of a later migration may affect educational decisions in the home country longbefore a migration is realized. In addition, the decisions of migrants regarding their own educationalinvestment and their expectations about future migration plans may affect the educational attainmentof their children. But migration and education are not only related for those whomigrate or their descen-dants. Migrations of some individuals may have consequences for educational decisions of those who donot migrate, both in the home and in the host country. By easing credit constraints through remittances,migration of some may help others to go to school. By changing the skill base of the receiving country,migration may change incentives to invest in certain types of human capital. In addition, migrants andtheir children may create externalities that influence educational outcomes of nonmigrants in the desti-nation country. This chapter will discuss some of the key areas that connect migration and education.
Keywords
MigrationEducationHuman CapitalReturn MigrationImmigrant SelectionSecond-generation Immigrants
328 Christian Dustmann and Albrecht Glitz
1. INTRODUCTION
Starting with Homo erectus about 2 million years ago, the first humans were organized ingroups of hunters and gatherers. These groups were nomadic, and the economic founda-tion of their existence was making migrations a necessity, forcing them to move continu-ously according to food supplies. Constant migration was the normality. Today,populations that pursue a nomadic lifestyle are the exception. The abandonment of thehunting and gathering lifestyle by humans about 10,000 years ago, when this lifestylewas replaced by one based on agriculture, changed the technology of subsistenceproduction. It led to social and political structures that built on nonnomadic forms ofeconomizing. If migrations took place nevertheless, then for two main reasons: eitherbecause people were forced to move by natural disasters or man-made circumstances(such as persecution due to distinct political or religious views) or because economicprospects seemed more favorable in other regions. Immigrant-receiving countries todaydraw distinctions between these two different motives for movement. The GenevaConvention of 1951 defines a refugee as any person “who owing to a well-founded fearof being persecuted for reasons of race, religion, nationality, membership of a particularsocial group or political opinion, is outside the country of his nationality and is unableor, owing to such fear, is unwilling to avail himself of the protection of that country—or return to it.” Its signatories committed to not sending an individual back into asituation of possible persecution. According to United Nations figures, 7.1% of allinternational migrants in 2005 are refugees from their countries of origin.2
In this chapter, we will deal mainly with migrations due to the second motive:movements that are due to individual decisions based on some optimizing considera-tions. We will focus our discussion on international migrations, although much of whatwe discuss also holds for migrations within national borders.3 Deliberate migrations aredriven by economic motives and considerations and can therefore be subjected to eco-nomic analysis and investigation. Hicks noted in his Theory of Wages in 1932 (p. 76) thatit is differences in net economic advantages, chiefly differences in wages, [that] are the main causesof migration.
Education, in turn, is a main determinant of wages, both in the country of originand the potential destination country.4 Although the decisions about how much educa-tion to obtain and whether to migrate are often sequential, individuals may in many
2 Source: United Nations, Department of Economic and Social Affairs, Population Division. International Migrant Stock:The 2008 Revision, 2009.
3 We follow the convention in most of the literature in economics and define an “immigrant” as an individual whoresides and works in a country other than the country where he or she was born. This is the standard definition ofimmigrants in the Anglo-Saxon countries; however, some countries (like Germany) define immigrants based onnationality rather than country of birth.
4 We will use the terms country of destination and host country and the terms country of origin and home countryinterchangeably throughout this chapter.
Migration and Education 329
cases make these choices simultaneously, choosing education at home with a view tomigrating later. Once migrated, choices about skill acquisition in the host country arecrucial for the economic payoff of the migration decision. These investment decisionsare, in turn, related to future migration plans and therefore the forms that migrationstake over the individuals’ life cycles. Furthermore, acquisition of education may bethe sole reason for a migration—student migrations are an example. Some countries,such as the United States, the United Kingdom, and Australia, are established “learningcenters,” offering educational products to an international market. The acquisition ofskills abroad that are more productive at home may also take place on the job, forinstance, through the acquisition of language skills or learning of particular productiontechnologies. Thus, individual migration decisions and decisions about educationalattainment are strongly intertwined, and we will shed light on this relationship inSection 3 of this chapter.
But migrations may also affect educational attainments of those who do not chooseto move, both in the destination and the origin countries. Migrations may lead to achange in the skill base of both sets of countries, affecting average levels of educationand possibly generating educational externalities and new incentives for human capitalinvestments. For instance, if immigration is selective in the sense that only better-ableindividuals move, then this may enhance the skill base in the destination country, whileit may deplete the skill base in the country of origin, with consequences for the popu-lations of those who have chosen not to move. However, there may be situationswhere migration enhances the skill base of both countries. Immigration may lead to aspecialization of nonmigrant workers in the destination country in areas where theyhave a competitive advantage. It may also lead to an improvement of the economicsituation of migrants’ families, for instance, through remittances, thus enabling childrento attend school instead of working. Remittances may also help to create educationalinfrastructures that foster educational attainment of those who do not have familymembers who migrate. We will discuss immigrant selection and the interrelationbetween migration and education of those who do not move in Section 4 of thischapter.
Finally, migration is a long-term process, with many immigrants bringing their chil-dren with them or founding families in their host countries. In this context, it is impor-tant to understand how the children of immigrants are accommodated by the hostcountry’s education system and how they perform in it relative to native children. Whatis the role intergenerational transmission of human capital plays for the longer run inte-gration process and how does it affect the immigrants’ long-term convergence to thenative population? These are key questions in the current debate about immigration,in particular in those countries that only recently received large immigrant populations.We will discuss the educational achievement of the children of immigrants and theirintergenerational mobility in Section 5 of this chapter.
330 Christian Dustmann and Albrecht Glitz
There are therefore three related cornerstones to this chapter. These cover the keyeconomic aspects of the individual migration decision, their connection to educationand the skill selection of immigrants, and the nature of intergenerational spillovers.The analysis of these three cornerstones provides a comprehensive overview of theeconomic connections between migration and education.
Before considering these three interrelated areas in detail, we begin in Section 2 bysetting the scene with the presentation of some empirical evidence about immigrantpopulations in OECD countries, their educational attainment, their labor marketperformance, and how they compare to natives and to those in their home countrieswho decided not to move. We will demonstrate the large diversity of immigrant popu-lations in different countries, which is often due to historical reasons, such as colonialpasts, historical trade links, or particular recruitment policies at earlier points in time.At the same time, the descriptive evidence we present shows many common featuresacross populations of immigrants in different destination countries. We will return tosome of these features later in the individual sections that deal with the migrant, thenonmigrants, and the children of immigrants where we will embed them into a morestructural framework. In order to ensure comparability, we focus on OECD countriesfor which detailed and standardized data are available.
2. EMPIRICAL EVIDENCE
2.1. Educational Attainment of MigrantsWhen thinking about the educational attainment of migrants, two points of referencenaturally come to mind: the educational attainment of the migrants relative to the nativepopulation in the destination country and the educational attainment of the migrantsrelative to their compatriots who remained in their country of origin. To provide anoverview, Table 4.1 shows the educational attainment of the foreign-born (FB) popula-tion in the 10 most important immigrant-receiving OECD countries around the year2000.5 These 10 countries together host 86% of the around 76 million foreign-bornindividuals aged 15 years and older who live in one of the 28 OECD countries for whichdata are available (data for Chile and Iceland are not available). Not surprisingly, giventhe heterogeneity in countries of origin and migration policies in place, there is sub-stantial variation in the educational composition of the foreign-born population across
5 We report OECD data for the year 2000, as these are the most recent ones that include comparable information oneducational attainment. With the exception of Germany and France, the overall stocks of migrants have furtherincreased across the OECD countries listed in Table 4.1 between the year 2000 and 2008, with an overall growth rateof approximately 37% (based on data from the International Migration Database). The most noticeable change overthis period took place in Spain where the foreign-born population tripled to around 6.4 million in 2008. However,with the exception of Japan, whose stock of foreign workers increased particularly fast in this period, the countrieslisted in Table 4.1 remain the main OECD destination countries also in 2008.
Migration and Education 331
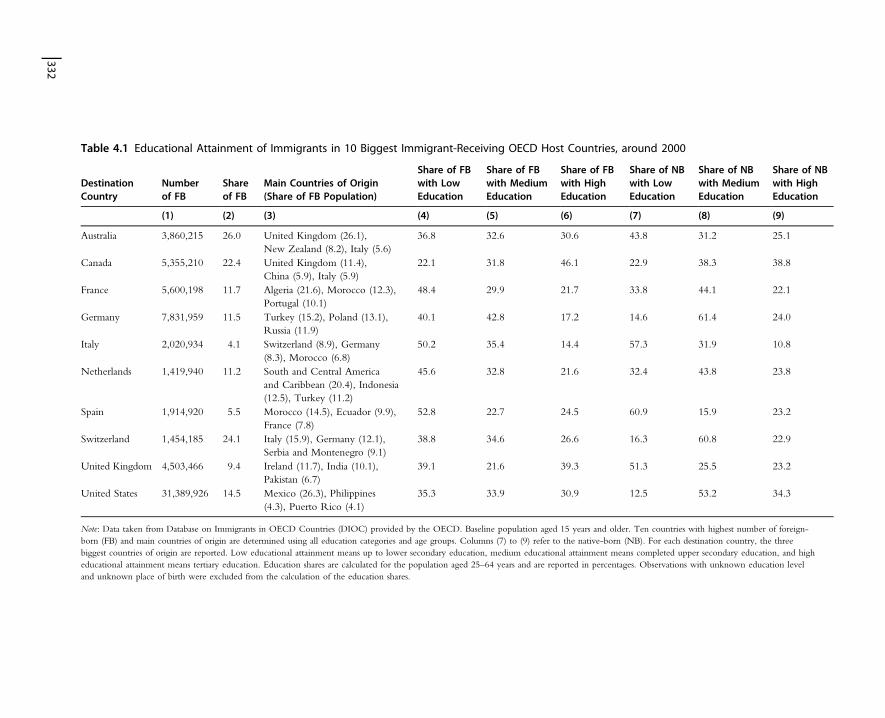
Table 4.1 Educational Attainment of Immigrants in 10 Biggest Immigrant-Receiving OECD Host Countries, around 2000
DestinationCountry
Numberof FB
Shareof FB
Main Countries of Origin(Share of FB Population)
Share of FBwith LowEducation
Share of FBwith MediumEducation
Share of FBwith HighEducation
Share of NBwith LowEducation
Share of NBwith MediumEducation
Share of NBwith HighEducation
(1) (2) (3) (4) (5) (6) (7) (8) (9)
Australia 3,860,215 26.0 United Kingdom (26.1),New Zealand (8.2), Italy (5.6)
36.8 32.6 30.6 43.8 31.2 25.1
Canada 5,355,210 22.4 United Kingdom (11.4),China (5.9), Italy (5.9)
22.1 31.8 46.1 22.9 38.3 38.8
France 5,600,198 11.7 Algeria (21.6), Morocco (12.3),Portugal (10.1)
48.4 29.9 21.7 33.8 44.1 22.1
Germany 7,831,959 11.5 Turkey (15.2), Poland (13.1),Russia (11.9)
40.1 42.8 17.2 14.6 61.4 24.0
Italy 2,020,934 4.1 Switzerland (8.9), Germany(8.3), Morocco (6.8)
50.2 35.4 14.4 57.3 31.9 10.8
Netherlands 1,419,940 11.2 South and Central Americaand Caribbean (20.4), Indonesia(12.5), Turkey (11.2)
45.6 32.8 21.6 32.4 43.8 23.8
Spain 1,914,920 5.5 Morocco (14.5), Ecuador (9.9),France (7.8)
52.8 22.7 24.5 60.9 15.9 23.2
Switzerland 1,454,185 24.1 Italy (15.9), Germany (12.1),Serbia and Montenegro (9.1)
38.8 34.6 26.6 16.3 60.8 22.9
United Kingdom 4,503,466 9.4 Ireland (11.7), India (10.1),Pakistan (6.7)
39.1 21.6 39.3 51.3 25.5 23.2
United States 31,389,926 14.5 Mexico (26.3), Philippines(4.3), Puerto Rico (4.1)
35.3 33.9 30.9 12.5 53.2 34.3
Note: Data taken from Database on Immigrants in OECD Countries (DIOC) provided by the OECD. Baseline population aged 15 years and older. Ten countries with highest number of foreign-born (FB) and main countries of origin are determined using all education categories and age groups. Columns (7) to (9) refer to the native-born (NB). For each destination country, the threebiggest countries of origin are reported. Low educational attainment means up to lower secondary education, medium educational attainment means completed upper secondary education, and higheducational attainment means tertiary education. Education shares are calculated for the population aged 25–64 years and are reported in percentages. Observations with unknown education leveland unknown place of birth were excluded from the calculation of the education shares.
332
destination countries. In Canada, for example, only 22% of the foreign-born populationaged 25–64 years report lower secondary education (“low education”) as their highesteducational attainment, whereas in France, Italy, and Spain, about 50% of the foreign-born population have at most completed lower secondary education. At the other endof the educational spectrum, the share of foreign-born individuals with tertiary education(“high education”) exceeds 30% in Australia, Canada, the United Kingdom, and theUnited States, whereas in Germany and Italy, this share is below 20%. The compositionof the foreign-born population in terms of their educational attainment becomes particu-larly relevant when seen in relation with the educational attainment of the native-bornpopulation (NB). Based on such comparisons, one can broadly divide the OECD desti-nation countries into two groups: one group characterized by a high-skilled foreign-bornpopulation consisting of Australia, Canada, and the United Kingdom, and one groupcharacterized by a low-skilled foreign-born population consisting of France, Germany,the Netherlands, Switzerland, and the United States, with Spain’s and Italy’s foreign-and native-born populations showing relatively comparable educational structures. Forexample, in Australia, Canada, and the United Kingdom, the share of the foreign-bornpopulation with high education exceeds the share of the native-born population withhigh education by 5.5, 7.3, and 16.1 percentage points, respectively. On the other hand,in France, Germany, and the United States, the share of the foreign-born populationwith low education exceeds the share of the native-born population with loweducation by 14.6, 25.5, and 22.8 percentage points, respectively.6
But the relative educational attainment of the foreign-born in their destination coun-tries is only one side of the coin. The other natural comparison group consists of themigrants’ compatriots who have remained in their country of origin. Table 4.2 providessome evidence for the 11 biggest immigrant-sending countries within the group of OECDcountries.7 Though again subject to substantial variation, a prominent feature in thesefigures is that for the majority of origin countries, the share of movers with high educationis substantially larger than the share of stayers with high education. For example, whileabout 23, 22, and 34% of the native-born British, French, and Americans still living in theircountry of birth have high education (Column (7)), the corresponding shares among thegroup of those who left these countries are 40, 40, and 61% (Column (4)), respectively.
6 For a detailed analysis of worldwide international mobility by educational attainment, see Docquier and Marfouk(2006).
7 The figures are constructed from OECD data by aggregating across all OECD countries all foreign-born by country oforigin, restricting the sample of origin countries to OECD countries, and then selecting the 11 countries from whichthe largest number of foreign-born individuals originated. Since not all potential countries of origin are separatelyrecorded for each OECD country, this is not entirely accurate, but, given that for each OECD country, the mostimportant countries of origin are separately reported (and often many more), this procedure should correctly pickup the 11 biggest OECD immigrant-sending countries. Of course, there are additional important non-OECD coun-tries of origin such as (in descending order) China, India, the Philippines, Russia, and Vietnam for which, however, wedo not observe the educational attainment of the population in the home country in the OECD data.
Migration and Education 333
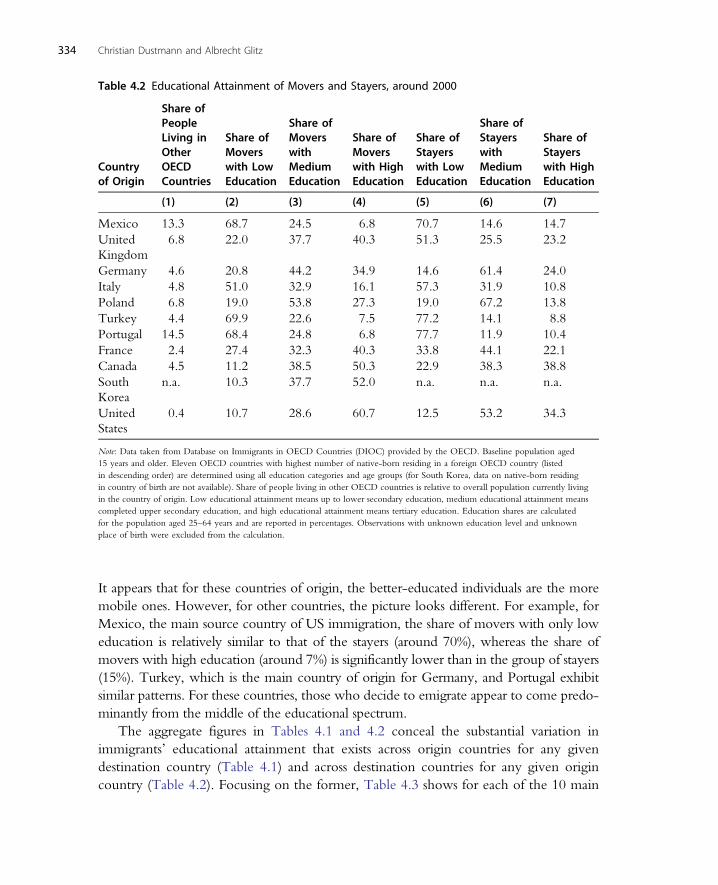
It appears that for these countries of origin, the better-educated individuals are the moremobile ones. However, for other countries, the picture looks different. For example, forMexico, the main source country of US immigration, the share of movers with only loweducation is relatively similar to that of the stayers (around 70%), whereas the share ofmovers with high education (around 7%) is significantly lower than in the group of stayers(15%). Turkey, which is the main country of origin for Germany, and Portugal exhibitsimilar patterns. For these countries, those who decide to emigrate appear to come predo-minantly from the middle of the educational spectrum.
The aggregate figures in Tables 4.1 and 4.2 conceal the substantial variation inimmigrants’ educational attainment that exists across origin countries for any givendestination country (Table 4.1) and across destination countries for any given origincountry (Table 4.2). Focusing on the former, Table 4.3 shows for each of the 10 main
Table 4.2 Educational Attainment of Movers and Stayers, around 2000
Countryof Origin
Share ofPeopleLiving inOtherOECDCountries
Share ofMoverswith LowEducation
Share ofMoverswithMediumEducation
Share ofMoverswith HighEducation
Share ofStayerswith LowEducation
Share ofStayerswithMediumEducation
Share ofStayerswith HighEducation
(1) (2) (3) (4) (5) (6) (7)
Mexico 13.3 68.7 24.5 6.8 70.7 14.6 14.7UnitedKingdom
6.8 22.0 37.7 40.3 51.3 25.5 23.2
Germany 4.6 20.8 44.2 34.9 14.6 61.4 24.0Italy 4.8 51.0 32.9 16.1 57.3 31.9 10.8Poland 6.8 19.0 53.8 27.3 19.0 67.2 13.8Turkey 4.4 69.9 22.6 7.5 77.2 14.1 8.8Portugal 14.5 68.4 24.8 6.8 77.7 11.9 10.4France 2.4 27.4 32.3 40.3 33.8 44.1 22.1Canada 4.5 11.2 38.5 50.3 22.9 38.3 38.8SouthKorea
n.a. 10.3 37.7 52.0 n.a. n.a. n.a.
UnitedStates
0.4 10.7 28.6 60.7 12.5 53.2 34.3
Note: Data taken from Database on Immigrants in OECD Countries (DIOC) provided by the OECD. Baseline population aged15 years and older. Eleven OECD countries with highest number of native-born residing in a foreign OECD country (listedin descending order) are determined using all education categories and age groups (for South Korea, data on native-born residingin country of birth are not available). Share of people living in other OECD countries is relative to overall population currently livingin the country of origin. Low educational attainment means up to lower secondary education, medium educational attainment meanscompleted upper secondary education, and high educational attainment means tertiary education. Education shares are calculatedfor the population aged 25–64 years and are reported in percentages. Observations with unknown education level and unknownplace of birth were excluded from the calculation.
334 Christian Dustmann and Albrecht Glitz
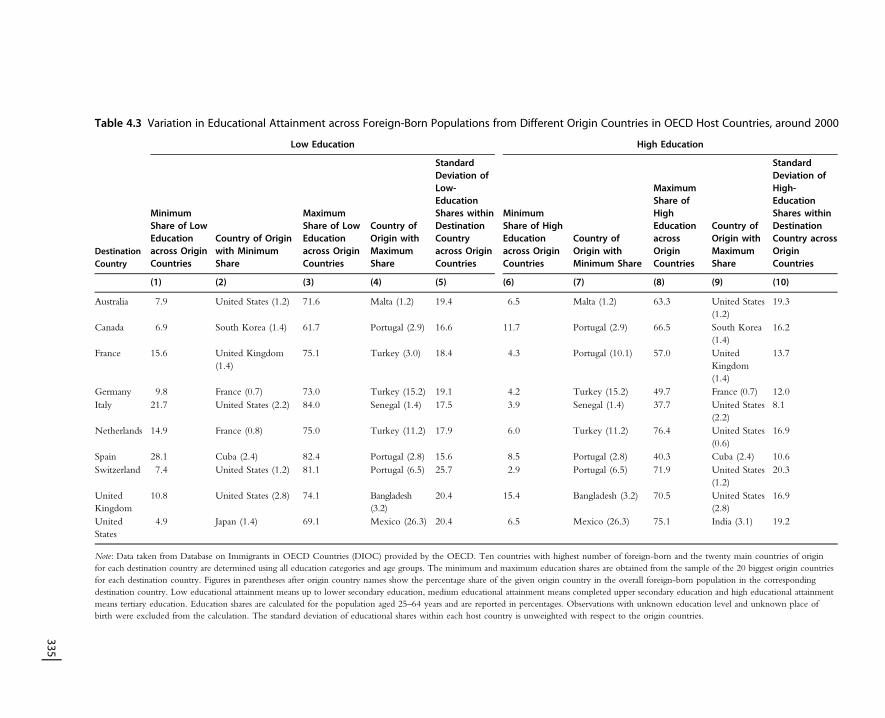
Table 4.3 Variation in Educational Attainment across Foreign-Born Populations from Different Origin Countries in OECD Host Countries, around 2000
DestinationCountry
Low Education High Education
MinimumShare of LowEducationacross OriginCountries
Country of Originwith MinimumShare
MaximumShare of LowEducationacross OriginCountries
Country ofOrigin withMaximumShare
StandardDeviation ofLow-EducationShares withinDestinationCountryacross OriginCountries
MinimumShare of HighEducationacross OriginCountries
Country ofOrigin withMinimum Share
MaximumShare ofHighEducationacrossOriginCountries
Country ofOrigin withMaximumShare
StandardDeviation ofHigh-EducationShares withinDestinationCountry acrossOriginCountries
(1) (2) (3) (4) (5) (6) (7) (8) (9) (10)
Australia 7.9 United States (1.2) 71.6 Malta (1.2) 19.4 6.5 Malta (1.2) 63.3 United States(1.2)
19.3
Canada 6.9 South Korea (1.4) 61.7 Portugal (2.9) 16.6 11.7 Portugal (2.9) 66.5 South Korea(1.4)
16.2
France 15.6 United Kingdom(1.4)
75.1 Turkey (3.0) 18.4 4.3 Portugal (10.1) 57.0 UnitedKingdom(1.4)
13.7
Germany 9.8 France (0.7) 73.0 Turkey (15.2) 19.1 4.2 Turkey (15.2) 49.7 France (0.7) 12.0Italy 21.7 United States (2.2) 84.0 Senegal (1.4) 17.5 3.9 Senegal (1.4) 37.7 United States
(2.2)8.1
Netherlands 14.9 France (0.8) 75.0 Turkey (11.2) 17.9 6.0 Turkey (11.2) 76.4 United States(0.6)
16.9
Spain 28.1 Cuba (2.4) 82.4 Portugal (2.8) 15.6 8.5 Portugal (2.8) 40.3 Cuba (2.4) 10.6Switzerland 7.4 United States (1.2) 81.1 Portugal (6.5) 25.7 2.9 Portugal (6.5) 71.9 United States
(1.2)20.3
UnitedKingdom
10.8 United States (2.8) 74.1 Bangladesh(3.2)
20.4 15.4 Bangladesh (3.2) 70.5 United States(2.8)
16.9
UnitedStates
4.9 Japan (1.4) 69.1 Mexico (26.3) 20.4 6.5 Mexico (26.3) 75.1 India (3.1) 19.2
Note: Data taken from Database on Immigrants in OECD Countries (DIOC) provided by the OECD. Ten countries with highest number of foreign-born and the twenty main countries of originfor each destination country are determined using all education categories and age groups. The minimum and maximum education shares are obtained from the sample of the 20 biggest origin countriesfor each destination country. Figures in parentheses after origin country names show the percentage share of the given origin country in the overall foreign-born population in the correspondingdestination country. Low educational attainment means up to lower secondary education, medium educational attainment means completed upper secondary education and high educational attainmentmeans tertiary education. Education shares are calculated for the population aged 25–64 years and are reported in percentages. Observations with unknown education level and unknown place ofbirth were excluded from the calculation. The standard deviation of educational shares within each host country is unweighted with respect to the origin countries.
335
immigrant-receiving OECD countries the foreign-born populations with the highestand lowest educational attainment. For instance, looking at the last row of the Table 4.3,of all the main countries of origin of immigration to the United States, the foreign-bornpopulation originating from Mexico are the least well educated with 69.1% having onlylow education (Column (3)). On the other hand, the most highly educated group inthe United States is the group of Indians of whom 75.1% have high education (Column(8)). For Germany, the country of origin with the highest share of immigrants with onlylow education is Turkey with 73.0% (Column (3)), compared with French immigrantsof whom only 9.8% have low education (Column (1)). The (unweighted) standarddeviations reported in Columns (5) and (10) provide a summary measure of the extentof educational heterogeneity of each country’s immigrant population across differentcountries of origin, showing that in many cases, a given destination country attractsimmigrants with high educational background from some countries, but with pooreducational background from other countries.
Table 4.4 shows for each of the 11 main immigrant-sending countries in the OECDthe destination countries that receive the highest and the lowest educated group of itsemigrating population. For instance, looking at the first row of the table, only 5.0%of all Mexicans living in Sweden have low education (Column (1)), whereas this is thecase for 69.0% of all Mexicans living in the United States (Column (3)). Similarly, only7.0% of Poles living in the Czech Republic have high education (Column (6)), whereasthe corresponding share in the United Kingdom is 48.7% (Column (8)). Clearly, highlyheterogeneous subgroups of individuals from a given country of origin decide to moveto specific host countries, as again summarized by the standard deviations reported inColumns (5) and (10). We will discuss possible reasons for these differences below.
The educational attainment of the foreign-born population serves as a key indicatorof their performance in the host country’s labor market. However, even if the foreign-born population in a given host country is as well educated as the native-born popula-tion in terms of the level of formal qualification or completed years of schooling, theyare unlikely to perform equally well in the labor market. The educational skills immi-grants bring with them may not be easily transferable to the host country’s labor market(e.g., due to language deficiencies), and a highly skilled immigrant is unlikely to com-mand the same wage as a native-born worker with the same educational background, atleast in the first few years after arrival.
We illustrate this in Column (1) of Table 4.5, which shows the median wage ofthe foreign-born relative to the median wage of the native-born in a selected set ofOECD destination countries. Columns (2) to (4) show the corresponding wage ratiosseparately by education group. With the exception of Australia, the foreign-bornearn overall less than the native-born, in particular in the United States where themedian wage gap amounts to 21%. While in the lowest education group, immigrantstend to earn slightly more than comparable natives (with the exception of France and
336 Christian Dustmann and Albrecht Glitz
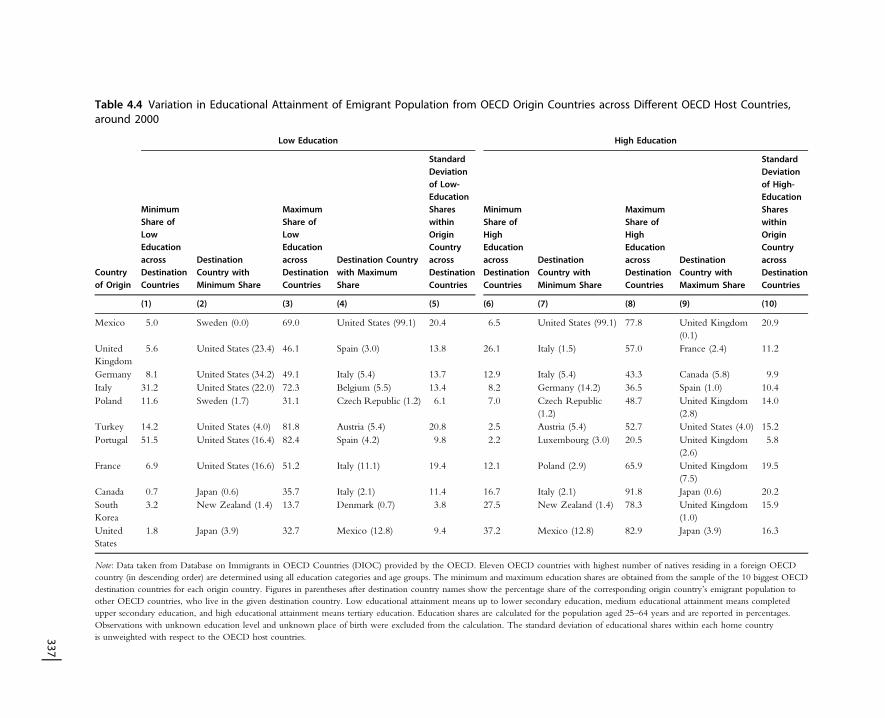
Table 4.4 Variation in Educational Attainment of Emigrant Population from OECD Origin Countries across Different OECD Host Countries,around 2000
Countryof Origin
Low Education High Education
MinimumShare ofLowEducationacrossDestinationCountries
DestinationCountry withMinimum Share
MaximumShare ofLowEducationacrossDestinationCountries
Destination Countrywith MaximumShare
StandardDeviationof Low-EducationShareswithinOriginCountryacrossDestinationCountries
MinimumShare ofHighEducationacrossDestinationCountries
DestinationCountry withMinimum Share
MaximumShare ofHighEducationacrossDestinationCountries
DestinationCountry withMaximum Share
StandardDeviationof High-EducationShareswithinOriginCountryacrossDestinationCountries
(1) (2) (3) (4) (5) (6) (7) (8) (9) (10)
Mexico 5.0 Sweden (0.0) 69.0 United States (99.1) 20.4 6.5 United States (99.1) 77.8 United Kingdom(0.1)
20.9
UnitedKingdom
5.6 United States (23.4) 46.1 Spain (3.0) 13.8 26.1 Italy (1.5) 57.0 France (2.4) 11.2
Germany 8.1 United States (34.2) 49.1 Italy (5.4) 13.7 12.9 Italy (5.4) 43.3 Canada (5.8) 9.9Italy 31.2 United States (22.0) 72.3 Belgium (5.5) 13.4 8.2 Germany (14.2) 36.5 Spain (1.0) 10.4Poland 11.6 Sweden (1.7) 31.1 Czech Republic (1.2) 6.1 7.0 Czech Republic
(1.2)48.7 United Kingdom
(2.8)14.0
Turkey 14.2 United States (4.0) 81.8 Austria (5.4) 20.8 2.5 Austria (5.4) 52.7 United States (4.0) 15.2Portugal 51.5 United States (16.4) 82.4 Spain (4.2) 9.8 2.2 Luxembourg (3.0) 20.5 United Kingdom
(2.6)5.8
France 6.9 United States (16.6) 51.2 Italy (11.1) 19.4 12.1 Poland (2.9) 65.9 United Kingdom(7.5)
19.5
Canada 0.7 Japan (0.6) 35.7 Italy (2.1) 11.4 16.7 Italy (2.1) 91.8 Japan (0.6) 20.2SouthKorea
3.2 New Zealand (1.4) 13.7 Denmark (0.7) 3.8 27.5 New Zealand (1.4) 78.3 United Kingdom(1.0)
15.9
UnitedStates
1.8 Japan (3.9) 32.7 Mexico (12.8) 9.4 37.2 Mexico (12.8) 82.9 Japan (3.9) 16.3
Note: Data taken from Database on Immigrants in OECD Countries (DIOC) provided by the OECD. Eleven OECD countries with highest number of natives residing in a foreign OECDcountry (in descending order) are determined using all education categories and age groups. The minimum and maximum education shares are obtained from the sample of the 10 biggest OECDdestination countries for each origin country. Figures in parentheses after destination country names show the percentage share of the corresponding origin country’s emigrant population toother OECD countries, who live in the given destination country. Low educational attainment means up to lower secondary education, medium educational attainment means completedupper secondary education, and high educational attainment means tertiary education. Education shares are calculated for the population aged 25–64 years and are reported in percentages.Observations with unknown education level and unknown place of birth were excluded from the calculation. The standard deviation of educational shares within each home countryis unweighted with respect to the OECD host countries.337
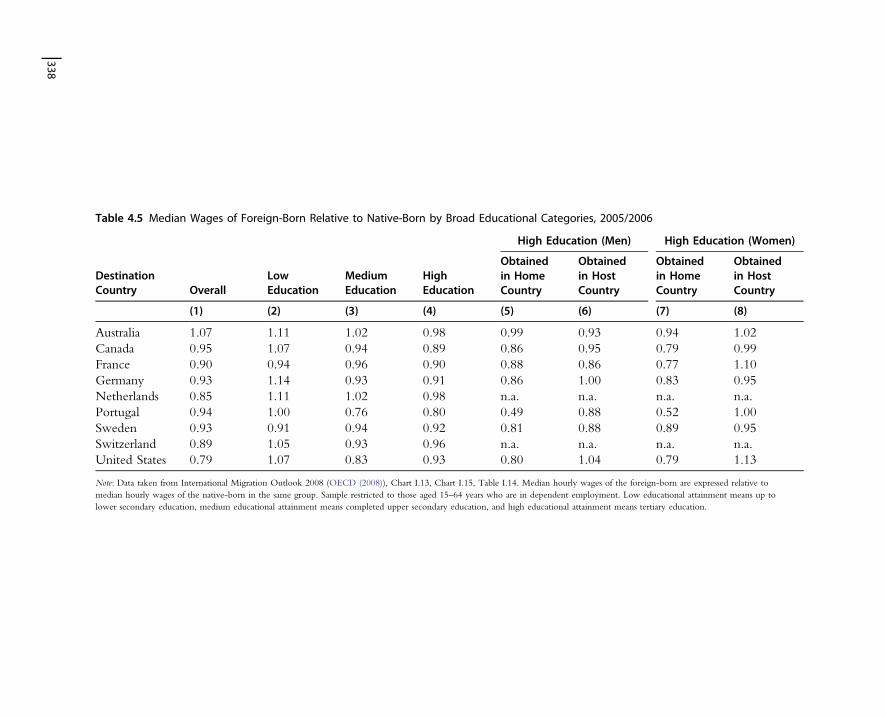
Table 4.5 Median Wages of Foreign-Born Relative to Native-Born by Broad Educational Categories, 2005/2006
DestinationCountry Overall
LowEducation
MediumEducation
HighEducation
High Education (Men) High Education (Women)
Obtainedin HomeCountry
Obtainedin HostCountry
Obtainedin HomeCountry
Obtainedin HostCountry
(1) (2) (3) (4) (5) (6) (7) (8)
Australia 1.07 1.11 1.02 0.98 0.99 0.93 0.94 1.02Canada 0.95 1.07 0.94 0.89 0.86 0.95 0.79 0.99France 0.90 0.94 0.96 0.90 0.88 0.86 0.77 1.10Germany 0.93 1.14 0.93 0.91 0.86 1.00 0.83 0.95Netherlands 0.85 1.11 1.02 0.98 n.a. n.a. n.a. n.a.Portugal 0.94 1.00 0.76 0.80 0.49 0.88 0.52 1.00Sweden 0.93 0.91 0.94 0.92 0.81 0.88 0.89 0.95Switzerland 0.89 1.05 0.93 0.96 n.a. n.a. n.a. n.a.United States 0.79 1.07 0.83 0.93 0.80 1.04 0.79 1.13
Note: Data taken from International Migration Outlook 2008 (OECD (2008)), Chart I.13, Chart I.15, Table I.14. Median hourly wages of the foreign-born are expressed relative tomedian hourly wages of the native-born in the same group. Sample restricted to those aged 15–64 years who are in dependent employment. Low educational attainment means up tolower secondary education, medium educational attainment means completed upper secondary education, and high educational attainment means tertiary education.
338

Sweden), they earn substantially less than natives in the medium- and high-educationgroup. In Canada, France, and Portugal, for example, immigrants with high educa-tion earn at least 10% less than natives with high education. Overall, wages of immi-grants seem to rise more slowly with educational attainment than wages of natives,suggesting that immigrants face a lower return to schooling in the host country thannatives do.
Columns (5) to (8) focus on the high-education group and show relative wages offoreign-born men and women with high education, now distinguishing between indi-viduals who received their tertiary education in their home country and those whoreceived it in the host country. The difference between the relative returns reportedthus addresses, at least in part, the issue of transferability of human capital from the ori-gin to the destination country.8 The less transferable the skills acquired in the homecountry, the lower their return relative to the return obtained from domesticallyacquired tertiary education. With the exception of men in France and Australia, thefigures show that wages are always higher for foreign-born graduates with host country–specific tertiary education, in some cases even exceeding the wages earned by native-borngraduates with tertiary education.
2.2. Migration and Acquisition of EducationAs pointed out in the previous section, it is important to distinguish between educationacquired in the home country before migrating and education acquired in the hostcountry. In particular, minors who arrive together with their parents and young adultswho immigrate to attend one of the host country’s universities add to their existingstock of human capital by acquiring further formal host country–specific education.With education being a tradable good, some countries have specialized in its produc-tion. For instance, Australia’s third largest export article (after coal and iron ore) is inter-national education.9
This specialization in the provision of educational services is apparent from Table 4.6,which shows for the 10 biggest immigrant-receiving OECD countries the share offoreign students enrolled in tertiary education. Across all destination countries, foreign
8 Although a lack of transferability of human capital will be necessarily reflected in lower relative wage ratios, it cannotbe easily distinguished from differences in the quality of education obtained because of different educational systemsand institutions in the origin and destination countries. Although the OECD data reported in Tables 4.1 to 4.5 arebased on the International Standard Classification of Education (ISCED 1997) that, in principle, is based on the edu-cational content of the programs assessed rather than institutional idiosyncrasies, an accurate and consistent measure-ment of actual educational achievements across different countries remains difficult (see also Hanushek and Zhang(2009)).
9 In 2007/2008, international education contributed 13.7 billion AUD to the Australian economy, measured throughexport earnings, which is the sum of international student expenditure on tuition fees, goods, and services related toliving in Australia, and tourism associated with visits from relatives (see http://www.idp.com/research/statistics/education_export_statistics.aspx).
Migration and Education 339
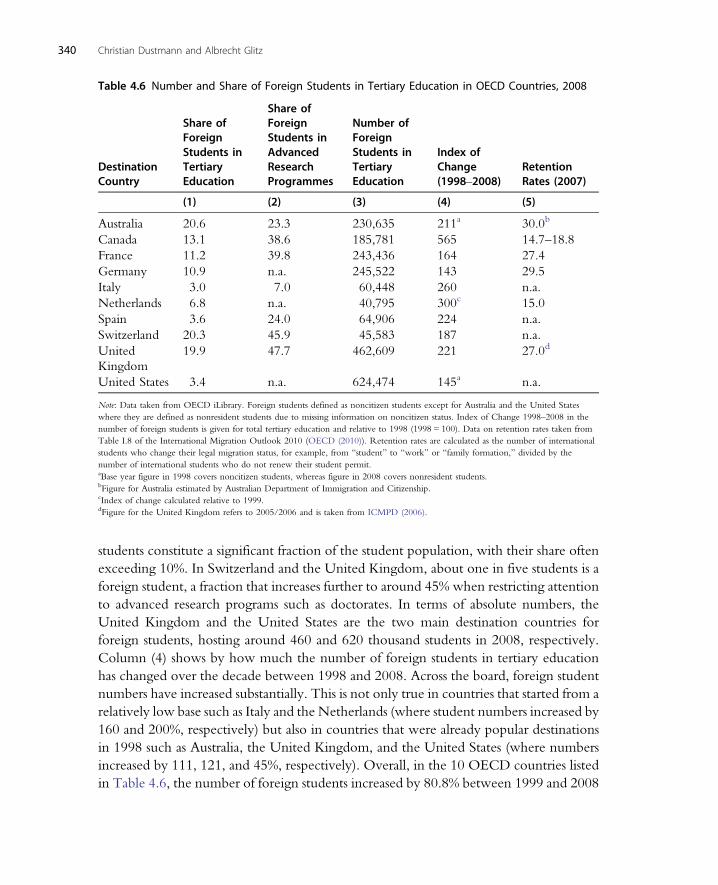
students constitute a significant fraction of the student population, with their share oftenexceeding 10%. In Switzerland and the United Kingdom, about one in five students is aforeign student, a fraction that increases further to around 45% when restricting attentionto advanced research programs such as doctorates. In terms of absolute numbers, theUnited Kingdom and the United States are the two main destination countries forforeign students, hosting around 460 and 620 thousand students in 2008, respectively.Column (4) shows by how much the number of foreign students in tertiary educationhas changed over the decade between 1998 and 2008. Across the board, foreign studentnumbers have increased substantially. This is not only true in countries that started from arelatively low base such as Italy and the Netherlands (where student numbers increased by160 and 200%, respectively) but also in countries that were already popular destinationsin 1998 such as Australia, the United Kingdom, and the United States (where numbersincreased by 111, 121, and 45%, respectively). Overall, in the 10 OECD countries listedin Table 4.6, the number of foreign students increased by 80.8% between 1999 and 2008
Table 4.6 Number and Share of Foreign Students in Tertiary Education in OECD Countries, 2008
DestinationCountry
Share ofForeignStudents inTertiaryEducation
Share ofForeignStudents inAdvancedResearchProgrammes
Number ofForeignStudents inTertiaryEducation
Index ofChange(1998–2008)
RetentionRates (2007)
(1) (2) (3) (4) (5)
Australia 20.6 23.3 230,635 211a 30.0b
Canada 13.1 38.6 185,781 565 14.7–18.8France 11.2 39.8 243,436 164 27.4Germany 10.9 n.a. 245,522 143 29.5Italy 3.0 7.0 60,448 260 n.a.Netherlands 6.8 n.a. 40,795 300c 15.0Spain 3.6 24.0 64,906 224 n.a.Switzerland 20.3 45.9 45,583 187 n.a.UnitedKingdom
19.9 47.7 462,609 221 27.0d
United States 3.4 n.a. 624,474 145a n.a.
Note: Data taken from OECD iLibrary. Foreign students defined as noncitizen students except for Australia and the United Stateswhere they are defined as nonresident students due to missing information on noncitizen status. Index of Change 1998–2008 in thenumber of foreign students is given for total tertiary education and relative to 1998 (1998 = 100). Data on retention rates taken fromTable I.8 of the International Migration Outlook 2010 (OECD (2010)). Retention rates are calculated as the number of internationalstudents who change their legal migration status, for example, from “student” to “work” or “family formation,” divided by thenumber of international students who do not renew their student permit.aBase year figure in 1998 covers noncitizen students, whereas figure in 2008 covers nonresident students.bFigure for Australia estimated by Australian Department of Immigration and Citizenship.cIndex of change calculated relative to 1999.dFigure for the United Kingdom refers to 2005/2006 and is taken from ICMPD (2006).
340 Christian Dustmann and Albrecht Glitz
which, given an increase in the corresponding overall stock of immigrants over the sameperiod of around 42.5%,10 indicates that the acquisition of formal education in foreigncountries is not only a widespread phenomenon, but also one that has been rapidlygaining importance in recent years.
The last column in Table 4.6 shows estimated retention rates of graduates in theirhost countries following the completion of their studies. Although the calculation ofthese figures is not unproblematic (for details, see OECD (2010)), the estimates showthat between 15 and 30% of all foreign graduates remain in their host countries aftergraduation, evidently to a large extent for work purposes.11 These numbers suggest thatthe acquisition of education in countries that have established themselves as “learningcenters” is a main reason for migration and that individuals choose to return to theircountries of origin in order to apply the skills acquired (see Dustmann, Fadlon, andWeiss (2010) for modeling of such migrations and our discussion in Sections 3.2 and4.3). Of course, these numbers may also partly be driven by regulations that do notallow individuals to remain after the completion of their studies. Indeed, in many coun-tries, particularly in Europe, existing policies make it difficult for foreign students to stayand obtain a work permit. In recent years, the transition from study to work has beenfacilitated in many student destination countries, for example, by enabling students towork while studying, or by extending the period granted to search for work followingthe completion of study (see ICMPD (2006), for a comparative study on retention poli-cies in a large number of industrialized countries). For instance, several countries haverecently started to issue a special residence permit to foreign graduates for the purposeof seeking a job, including the United Kingdom (for 1–2 years, introduced in 2004/2005), Germany (for 1 year, introduced in 2005), and France (for 6 months, introducedin 2006).12 Other special provisions introduced to facilitate the transition from study towork for foreign graduates include the allocation of extra points for a degree from anational institution of higher education (Canada, Australia, and New Zealand), a waiverof an obligatory work experience record (Australia and the Czech Republic), theexemption from the regular quota for “key workers” (Austria), and a specific category
10 The calculation of this figure is based on the data from the International Migration Database and refers to the changeof the sum of the foreign-born population in Australia, Canada, France, the Netherlands, Spain, and the United Statesand the population with foreign citizenship in Germany, Italy, Switzerland, and the United Kingdom between 1999and 2008. The missing immigrant stocks for Canada and France were linearly extrapolated from available figures in2001 and 2006 (Canada) and in 1999 and 2006 (France).
11 Retention rates are calculated as the number of international students who change their legal migration statusbetween 2006 and 2007, for example, from “student” to “work” or to “family formation,” divided by the numberof international students who do not renew their student permit. On average 61% of international students changetheir status for work-related reasons (OECD (2010)).
12 While in France and Germany these jobs have to correspond to the graduate’s qualification and are subject to labormarket testing, permit holders in the United Kingdom are free to take up any employment they like. Contrary to theUnited States and Canada, the applicants in these countries do not already need to have a job offer at hand.
Migration and Education 341

with a special quota for foreign graduates (Australia, Italy, United States). These policychanges are a reflection of the increasing global competition in attracting and retaininghighly skilled workers. Kato and Sparber (2010) show that students are indeed respon-sive to such immigration policies. Studying the effect of the sharp reduction in thenumber of available H-1B visas—the primary means of legal employment forcollege-educated foreign nationals in the United States—in 2003, they find that thisrestrictive immigration policy has had a negative impact on the quality of prospectiveinternational applicants to US colleges. The intuition is that only the high-ability stu-dents are affected by the new policy, since low-ability foreign students are unlikely tofind US employment even in the absence of visa quotas. Faced with a reduced prospectof gaining access to the US labor market after graduation, the “best and brightest” ofthe global talent pool appear to choose other host countries to provide them with bothvaluable education and the possibility of applying this education in the local labormarket.
For the United States, which is host to the largest number of foreign students in theworld, there are no overall retention rates of graduate students available. However,Finn (2007) shows that for the group of foreigners who have earned a doctorate inan American university, the retention rate 5 years after they received their degree isaround 65–70%. In a cross-country comparison, this is likely to be at the upper endof the spectrum of retention rates.
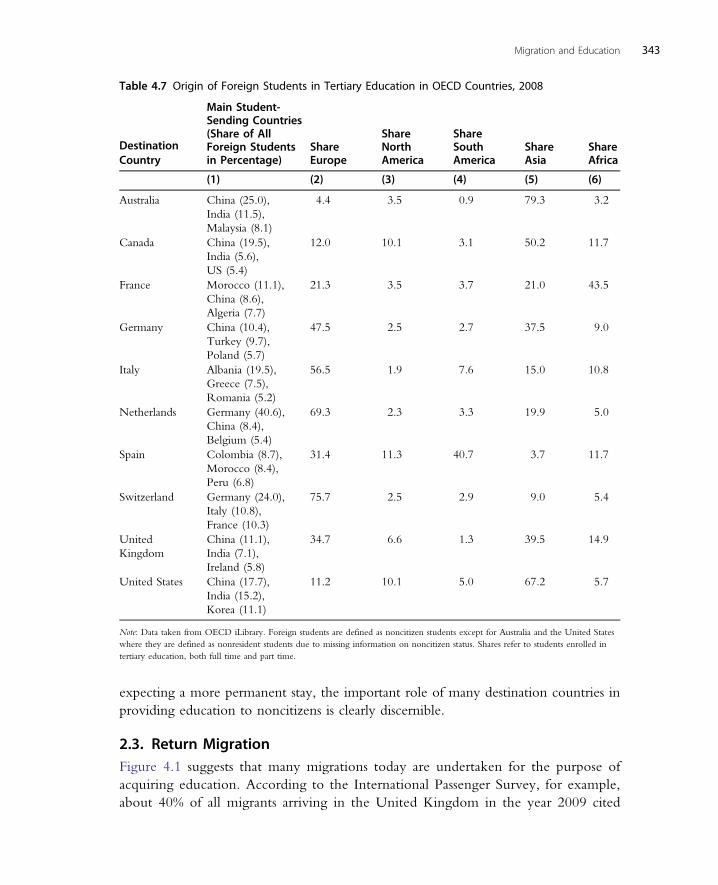
In terms of the students’ origin, there is once again substantial heterogeneity acrossdestination countries. Looking at Table 4.7, three factors appear important for thechoice of students where to obtain education: geographical distance, language, and for-mer colonial ties. For instance, the majority of students in Australia (79.3%) originatefrom Asia, and in particular from China, which supplies a quarter of all foreign students.In Europe, Italy and Switzerland are countries that attract mostly foreign students fromother European countries, whereas France has a large share of students from its formercolonies in Africa (43.5%, of which 25.5% are from Morocco and 17.7% from Algeria),and Spain has a relatively large share of students from Spanish-speaking South America(40.7%, of which 21.4% are from Colombia and 16.7% from Peru). In the two biggeststudent-receiving countries, the United Kingdom and the United States, most foreignstudents originate from Asia (39.5 and 67.2%, respectively, of which 28.1 and 26.3%are from China).
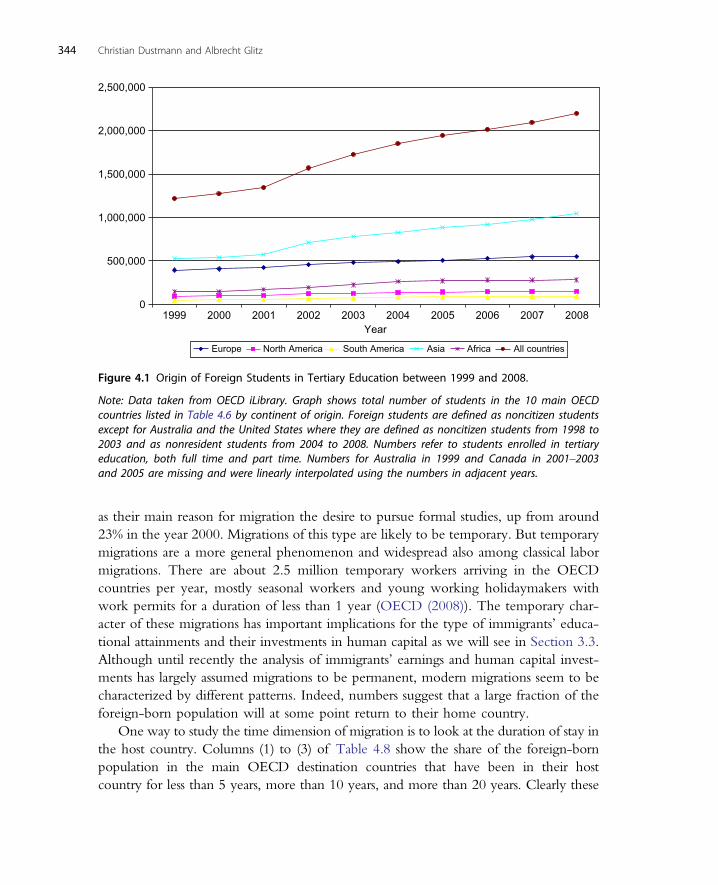
Figure 4.1 shows the development of the overall number of foreign students study-ing in the 10 main OECD destination countries listed in Table 4.6 between 1999 and2008. There is a clear upward trend, in particularly from 2001 onwards, with studentnumbers increasing from a little more than 1.2 million in 1999 to more than 2.2 millionin 2008. Most of this increase is driven by increasing numbers of students from Asia and,to a lesser extent, from Europe and Africa. Although we cannot tell from these datawhether these students came to their destination countries for the sole purpose of study-ing or whether they already arrived as young children with their parents and are
342 Christian Dustmann and Albrecht Glitz
expecting a more permanent stay, the important role of many destination countries inproviding education to noncitizens is clearly discernible.
2.3. Return MigrationFigure 4.1 suggests that many migrations today are undertaken for the purpose ofacquiring education. According to the International Passenger Survey, for example,about 40% of all migrants arriving in the United Kingdom in the year 2009 cited
Table 4.7 Origin of Foreign Students in Tertiary Education in OECD Countries, 2008
DestinationCountry
Main Student-Sending Countries(Share of AllForeign Studentsin Percentage)
ShareEurope
ShareNorthAmerica
ShareSouthAmerica
ShareAsia
ShareAfrica
(1) (2) (3) (4) (5) (6)
Australia China (25.0),India (11.5),Malaysia (8.1)
4.4 3.5 0.9 79.3 3.2
Canada China (19.5),India (5.6),US (5.4)
12.0 10.1 3.1 50.2 11.7
France Morocco (11.1),China (8.6),Algeria (7.7)
21.3 3.5 3.7 21.0 43.5
Germany China (10.4),Turkey (9.7),Poland (5.7)
47.5 2.5 2.7 37.5 9.0
Italy Albania (19.5),Greece (7.5),Romania (5.2)
56.5 1.9 7.6 15.0 10.8
Netherlands Germany (40.6),China (8.4),Belgium (5.4)
69.3 2.3 3.3 19.9 5.0
Spain Colombia (8.7),Morocco (8.4),Peru (6.8)
31.4 11.3 40.7 3.7 11.7
Switzerland Germany (24.0),Italy (10.8),France (10.3)
75.7 2.5 2.9 9.0 5.4
UnitedKingdom
China (11.1),India (7.1),Ireland (5.8)
34.7 6.6 1.3 39.5 14.9
United States China (17.7),India (15.2),Korea (11.1)
11.2 10.1 5.0 67.2 5.7
Note: Data taken from OECD iLibrary. Foreign students are defined as noncitizen students except for Australia and the United Stateswhere they are defined as nonresident students due to missing information on noncitizen status. Shares refer to students enrolled intertiary education, both full time and part time.
Migration and Education 343
as their main reason for migration the desire to pursue formal studies, up from around23% in the year 2000. Migrations of this type are likely to be temporary. But temporarymigrations are a more general phenomenon and widespread also among classical labormigrations. There are about 2.5 million temporary workers arriving in the OECDcountries per year, mostly seasonal workers and young working holidaymakers withwork permits for a duration of less than 1 year (OECD (2008)). The temporary char-acter of these migrations has important implications for the type of immigrants’ educa-tional attainments and their investments in human capital as we will see in Section 3.3.Although until recently the analysis of immigrants’ earnings and human capital invest-ments has largely assumed migrations to be permanent, modern migrations seem to becharacterized by different patterns. Indeed, numbers suggest that a large fraction of theforeign-born population will at some point return to their home country.
One way to study the time dimension of migration is to look at the duration of stay inthe host country. Columns (1) to (3) of Table 4.8 show the share of the foreign-bornpopulation in the main OECD destination countries that have been in their hostcountry for less than 5 years, more than 10 years, and more than 20 years. Clearly these
0
500,000
1,000,000
1,500,000
2,000,000
2,500,000
Year1999 2000 2001 2002 2003 2004 2005 2006 2007 2008
Europe North America South America Asia Africa All countries
Figure 4.1 Origin of Foreign Students in Tertiary Education between 1999 and 2008.
Note: Data taken from OECD iLibrary. Graph shows total number of students in the 10 main OECDcountries listed in Table 4.6 by continent of origin. Foreign students are defined as noncitizen studentsexcept for Australia and the United States where they are defined as noncitizen students from 1998 to2003 and as nonresident students from 2004 to 2008. Numbers refer to students enrolled in tertiaryeducation, both full time and part time. Numbers for Australia in 1999 and Canada in 2001–2003and 2005 are missing and were linearly interpolated using the numbers in adjacent years.
344 Christian Dustmann and Albrecht Glitz
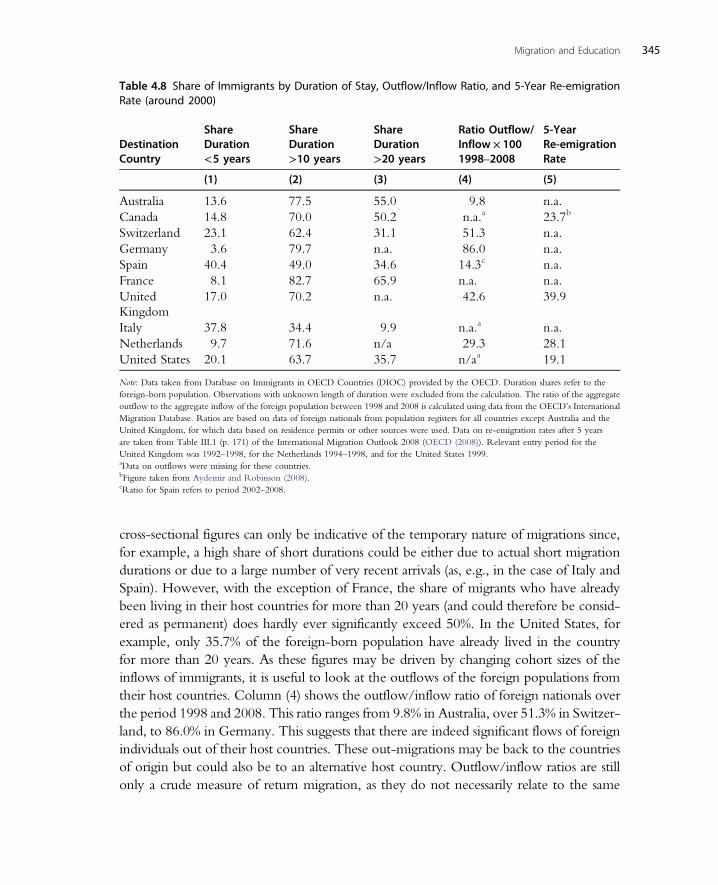
cross-sectional figures can only be indicative of the temporary nature of migrations since,for example, a high share of short durations could be either due to actual short migrationdurations or due to a large number of very recent arrivals (as, e.g., in the case of Italy andSpain). However, with the exception of France, the share of migrants who have alreadybeen living in their host countries for more than 20 years (and could therefore be consid-ered as permanent) does hardly ever significantly exceed 50%. In the United States, forexample, only 35.7% of the foreign-born population have already lived in the countryfor more than 20 years. As these figures may be driven by changing cohort sizes of theinflows of immigrants, it is useful to look at the outflows of the foreign populations fromtheir host countries. Column (4) shows the outflow/inflow ratio of foreign nationals overthe period 1998 and 2008. This ratio ranges from 9.8% in Australia, over 51.3% in Switzer-land, to 86.0% in Germany. This suggests that there are indeed significant flows of foreignindividuals out of their host countries. These out-migrations may be back to the countriesof origin but could also be to an alternative host country. Outflow/inflow ratios are stillonly a crude measure of return migration, as they do not necessarily relate to the same
Table 4.8 Share of Immigrants by Duration of Stay, Outflow/Inflow Ratio, and 5-Year Re-emigrationRate (around 2000)
DestinationCountry
ShareDuration<5 years
ShareDuration>10 years
ShareDuration>20 years
Ratio Outflow/Inflow × 1001998–2008
5-YearRe-emigrationRate
(1) (2) (3) (4) (5)
Australia 13.6 77.5 55.0 9.8 n.a.Canada 14.8 70.0 50.2 n.a.a 23.7b
Switzerland 23.1 62.4 31.1 51.3 n.a.Germany 3.6 79.7 n.a. 86.0 n.a.Spain 40.4 49.0 34.6 14.3c n.a.France 8.1 82.7 65.9 n.a. n.a.UnitedKingdom
17.0 70.2 n.a. 42.6 39.9
Italy 37.8 34.4 9.9 n.a.a n.a.Netherlands 9.7 71.6 n/a 29.3 28.1United States 20.1 63.7 35.7 n/aa 19.1
Note: Data taken from Database on Immigrants in OECD Countries (DIOC) provided by the OECD. Duration shares refer to theforeign-born population. Observations with unknown length of duration were excluded from the calculation. The ratio of the aggregateoutflow to the aggregate inflow of the foreign population between 1998 and 2008 is calculated using data from the OECD’s InternationalMigration Database. Ratios are based on data of foreign nationals from population registers for all countries except Australia and theUnited Kingdom, for which data based on residence permits or other sources were used. Data on re-emigration rates after 5 yearsare taken from Table III.1 (p. 171) of the International Migration Outlook 2008 (OECD (2008)). Relevant entry period for theUnited Kingdom was 1992–1998, for the Netherlands 1994–1998, and for the United States 1999.aData on outflows were missing for these countries.bFigure taken from Aydemir and Robinson (2008).cRatio for Spain refers to period 2002–2008.
Migration and Education 345
individuals. For a more precise measure, one requires data that follow immigrant entrycohorts over time. Column (5) in Table 4.8 provides some estimates of the share of for-eign-born individuals that re-emigrate from their host country within the first 5 years ofarrival. The estimates show the generally substantial extent of re-emigration, ranging from19.1% in the United States to 39.9% in the United Kingdom.13 Evidently, relativelyshort migration spells are a widespread phenomenon and, although the destination of there-emigrating population is generally not observable, one can assume that a large fractionconstitutes return migration to the country of origin.14 As we will see later, this particularmigration pattern has important implications for an immigrant’s behavior both in thehost and in the home country, and therefore requires particular attention. For an informativeoverview of the return migration issue including a detailed description of methodologicalapproaches to measure it, see OECD (2008, Part III).
2.4. The Next GenerationThe focus of the descriptive evidence presented so far has been on the educationalattainment and investment, as well as the labor market performance of the working-age immigrant population. Given that a substantial fraction of immigrants will remainin the host country for a considerable amount of time, their children, whether bornin the home country before arrival or thereafter, will spend a large part or even theirentire childhood in the host country, passing through its educational system and makingeducational investment decisions along the way. These decisions have wider conse-quences not only for the performance of this next generation of immigrants in boththe host and—in the case of a later return migration—the home country but also forthe host country more generally, for example, through the immigrants’ impact on thefiscal balance (see, e.g., Storesletten (2000) and Dustmann, Frattini, and Halls (2010))or their integration prospects (see, e.g., Constant and Zimmermann (2008)). Giventhe often substantial differences in family backgrounds and language proficiencies, it isnot surprising that in many destination countries immigrant children do significantly
13 The OECD also provides corresponding re-emigration rates for Ireland (60.4%), Belgium (50.4%), and Norway(39.6%). Additional studies that estimate comparable 5-year re-emigration rates are Borjas and Bratsberg (1996) forthe United States (17.5%), Bijwaard (2004) for the Netherlands (35%), Shortland (2006) for New Zealand (23%),Dustmann and Weiss (2007) for the United Kingdom (40% males and 55% females), Bratsberg, Raaum, and Sorlie(2007) for Norway (50%), Jensen and Pedersen (2007) for Denmark (55%), and Aydemir and Robinson (2008) forCanada (23.7% males).
14 Nekby (2004) is one of the few who distinguishes between return migration and secondary migration to a thirdcountry, using data for Sweden for the period 1991–2000. According to her results, the share that constitutes returnmigration is around 90% for Nordic immigrants, 70% for Western Europeans and North Americans, 50% for EasternEuropeans, 40% for Asians, and around 30% for Africans. Bratsberg, Raaum, and Sorlie (2007) estimate the returnmigration share for Norway and find similar magnitudes. Over the period 1967–2003, the share of those who leftNorway to return to their home country is 93% for Danes and Swedes, 86% for US Americans, 87% for UK immi-grants, 78% for Turks, 81% for Iraqis, 70% for Somalis, and 33% for Vietnamese immigrants.
346 Christian Dustmann and Albrecht Glitz
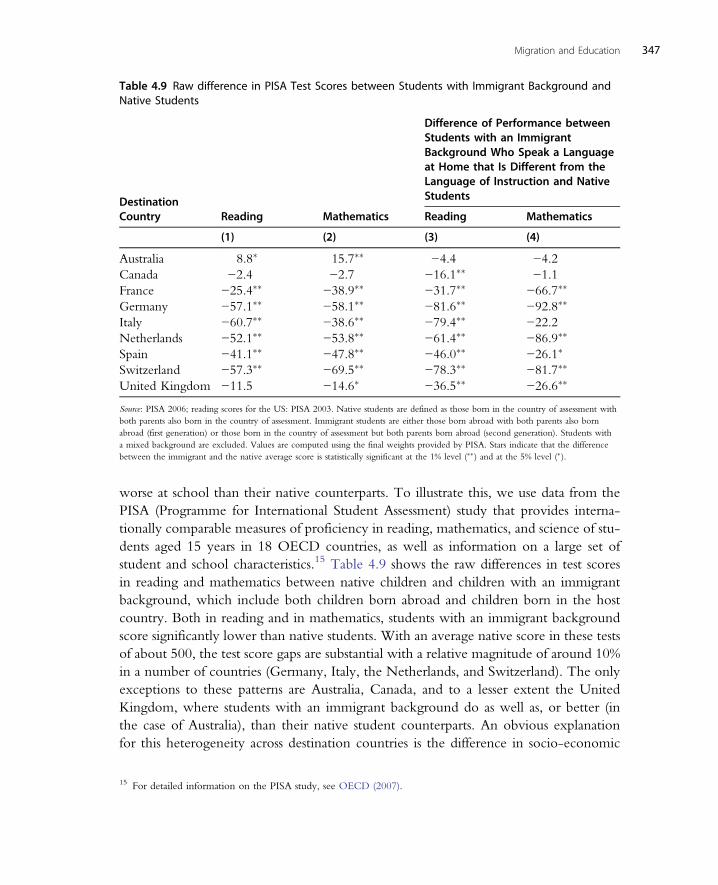
worse at school than their native counterparts. To illustrate this, we use data from thePISA (Programme for International Student Assessment) study that provides interna-tionally comparable measures of proficiency in reading, mathematics, and science of stu-dents aged 15 years in 18 OECD countries, as well as information on a large set ofstudent and school characteristics.15 Table 4.9 shows the raw differences in test scoresin reading and mathematics between native children and children with an immigrantbackground, which include both children born abroad and children born in the hostcountry. Both in reading and in mathematics, students with an immigrant backgroundscore significantly lower than native students. With an average native score in these testsof about 500, the test score gaps are substantial with a relative magnitude of around 10%in a number of countries (Germany, Italy, the Netherlands, and Switzerland). The onlyexceptions to these patterns are Australia, Canada, and to a lesser extent the UnitedKingdom, where students with an immigrant background do as well as, or better (inthe case of Australia), than their native student counterparts. An obvious explanationfor this heterogeneity across destination countries is the difference in socio-economic
Table 4.9 Raw difference in PISA Test Scores between Students with Immigrant Background andNative Students
DestinationCountry Reading Mathematics
Difference of Performance betweenStudents with an ImmigrantBackground Who Speak a Languageat Home that Is Different from theLanguage of Instruction and NativeStudents
Reading Mathematics
(1) (2) (3) (4)
Australia 8.8� 15.7�� −4.4 −4.2Canada −2.4 −2.7 −16.1�� −1.1France −25.4�� −38.9�� −31.7�� −66.7��
Germany −57.1�� −58.1�� −81.6�� −92.8��
Italy −60.7�� −38.6�� −79.4�� −22.2Netherlands −52.1�� −53.8�� −61.4�� −86.9��
Spain −41.1�� −47.8�� −46.0�� −26.1�
Switzerland −57.3�� −69.5�� −78.3�� −81.7��
United Kingdom −11.5 −14.6� −36.5�� −26.6��
Source: PISA 2006; reading scores for the US: PISA 2003. Native students are defined as those born in the country of assessment withboth parents also born in the country of assessment. Immigrant students are either those born abroad with both parents also bornabroad (first generation) or those born in the country of assessment but both parents born abroad (second generation). Students witha mixed background are excluded. Values are computed using the final weights provided by PISA. Stars indicate that the differencebetween the immigrant and the native average score is statistically significant at the 1% level (��) and at the 5% level (�).
15 For detailed information on the PISA study, see OECD (2007).
Migration and Education 347

characteristics between the corresponding immigrant populations, largely driven by theselectiveness of each host countries’ migration policies. Australia, Canada, and theUnited Kingdom are all countries that have been applying a point system to selectthe immigrants they admit, which strongly favors individuals with characteristicsconducive to their performance in the labor market, such as education and languageskills. Through the intergenerational transmission of human capital, these beneficialcharacteristics are likely to be reflected in their children’s performance at school. Forillustration, we report in Columns (3) and (4) the test score gaps (relative to natives)of students with an immigrant background who do not speak the language of instruc-tion at home. In all but three cases (Canada, Italy, and Spain in mathematics), these gapsare substantially larger than the gaps for the entire immigrant student population. Forexample, in the United Kingdom, those who do not speak English at home score36.5 points below the native average in reading and 26.6 points below the nativeaverage in mathematics while overall the test score gaps only amount to 11.5 and14.6 points, respectively. We will analyze the role language and parents’ education playin explaining the achievement gaps between immigrant and native students moresystematically in Section 5.3.
Do the lower test scores of immigrant children at age 15 carry over into their adult-hood? One measure to assess this is to compare the average school-leaving age of first-and second-generation immigrant adults relative to the native population. Figure 4.2
FRFR
FR
FRFR
FR
FRDE
DE
DEDE
DE
DE
UKUK UK
UK
UKSlope 0.526
Sec
ond
gene
ratio
n
First generation
Age left education: men
0
0
−2
−4
−4 −2
4
4
2
2
FR
FR
FR
FRFR
FR
FR
DEDE
DEDE
DE
DE
UK
UK
UK UKUK
UK
Slope 0.360
−0.2
−0.2
−0.4
−0.4
−0.6
−0.6
0.2
0.2
0
0
Sec
ond
gene
ratio
n
First generation
Log wage: men
Figure 4.2 Gaps in Educational Attainment and Log Wages of First- and Second-Generation Immi-grant Men Relative to Native Men.
Source: Algan, Dustmann, Glitz, and Manning (2010). Data sources are the French Labour Force Survey2005–2007, the German Microcensus 2005–2006, and the UK Labour Force Survey 1993–2007. Datapoints reflect estimated gaps in age left education and log wages of different origin groups of first-and second-generation immigrant men relative to native men. Additional controls in the regressionsfrom which these estimates were obtained are a quadratic in year of birth, region dummies, and timedummies in the age left education censored regression, and a quadratic in potential experience, regiondummies, and time dummies in the linear wage regression.
348 Christian Dustmann and Albrecht Glitz
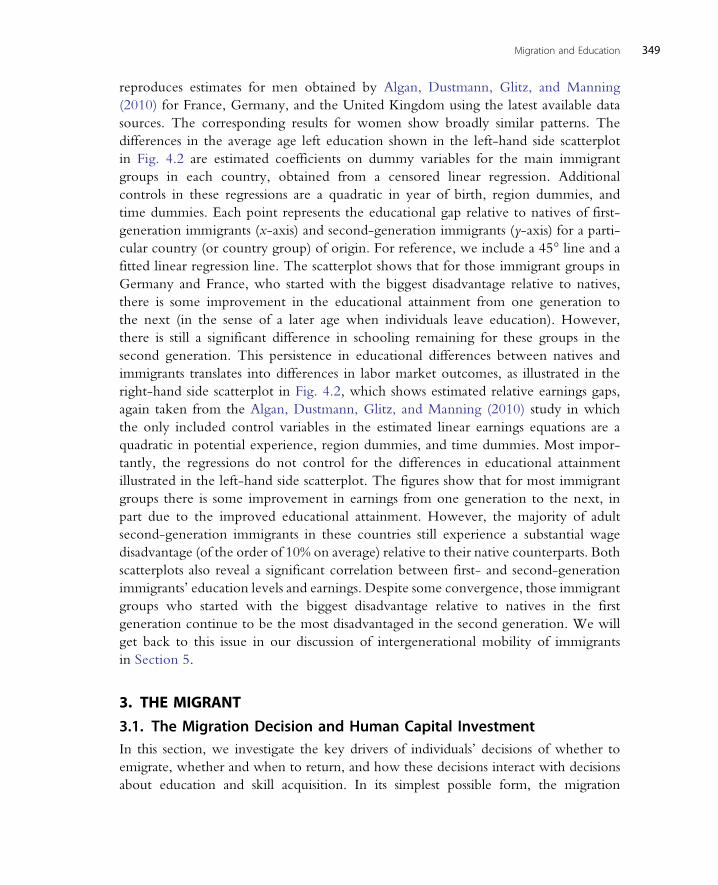
reproduces estimates for men obtained by Algan, Dustmann, Glitz, and Manning(2010) for France, Germany, and the United Kingdom using the latest available datasources. The corresponding results for women show broadly similar patterns. Thedifferences in the average age left education shown in the left-hand side scatterplotin Fig. 4.2 are estimated coefficients on dummy variables for the main immigrantgroups in each country, obtained from a censored linear regression. Additionalcontrols in these regressions are a quadratic in year of birth, region dummies, andtime dummies. Each point represents the educational gap relative to natives of first-generation immigrants (x-axis) and second-generation immigrants (y-axis) for a parti-cular country (or country group) of origin. For reference, we include a 45° line and afitted linear regression line. The scatterplot shows that for those immigrant groups inGermany and France, who started with the biggest disadvantage relative to natives,there is some improvement in the educational attainment from one generation tothe next (in the sense of a later age when individuals leave education). However,there is still a significant difference in schooling remaining for these groups in thesecond generation. This persistence in educational differences between natives andimmigrants translates into differences in labor market outcomes, as illustrated in theright-hand side scatterplot in Fig. 4.2, which shows estimated relative earnings gaps,again taken from the Algan, Dustmann, Glitz, and Manning (2010) study in whichthe only included control variables in the estimated linear earnings equations are aquadratic in potential experience, region dummies, and time dummies. Most impor-tantly, the regressions do not control for the differences in educational attainmentillustrated in the left-hand side scatterplot. The figures show that for most immigrantgroups there is some improvement in earnings from one generation to the next, inpart due to the improved educational attainment. However, the majority of adultsecond-generation immigrants in these countries still experience a substantial wagedisadvantage (of the order of 10% on average) relative to their native counterparts. Bothscatterplots also reveal a significant correlation between first- and second-generationimmigrants’ education levels and earnings. Despite some convergence, those immigrantgroups who started with the biggest disadvantage relative to natives in the firstgeneration continue to be the most disadvantaged in the second generation. We willget back to this issue in our discussion of intergenerational mobility of immigrantsin Section 5.
3. THE MIGRANT
3.1. The Migration Decision and Human Capital InvestmentIn this section, we investigate the key drivers of individuals’ decisions of whether toemigrate, whether and when to return, and how these decisions interact with decisionsabout education and skill acquisition. In its simplest possible form, the migration
Migration and Education 349
decision is based on a comparison of expected lifetime earnings in the current region ofresidence and in an alternative region, to which the migrant has the possibility toemigrate. In most cases, there is more than one possible destination region in the choiceset of potential migrants. For simplicity, we will abstract from that and consider onlyone potential destination country.16
What are the factors that determine the emigration decision? Abstracting for themoment from amenities that arise from living in the home or potential host country,the decision problem of the potential migrant is based on the comparison of the netmonetary returns of that decision. In the simplest possible model, where migrationsare permanent and the acquisition of human capital is completed before the migration,these will depend on the skill prices in the origin and destination country, as well as thedegree to which skills acquired in the origin country are transferable to the economy ofthe destination country. In a more dynamic setting, the migrant compares lifetime netdiscounted earnings in the two countries, allowing for the possibility that additionalhuman capital investment is undertaken.
After migration, individuals will potentially acquire further skills in the host country.As skills obtained in the home country are not always fully transferable to the hostcountry’s labor market, new immigrants should have lower earnings than natives, evenwhen they belong to the same skill group as measured, for instance, by the years ofschooling obtained. However, the subsequent transfer of existing skills, facilitated, forexample, through the acquisition of complementary skills like language, and the acqui-sition of new skills lead to an increase in earnings, possibly at a faster rate than that ofcomparable native workers. A large literature has developed around measuring thisprocess (starting with Chiswick’s, (1978) seminal paper), and we will review some ofthis literature in Section 3.4.
As we have shown in Section 2, many migrations are temporary, with immigrantsremaining for a limited amount of time in the host country, and then returning backhome. This behavior can be optimal despite consistently more favorable economic con-ditions in the destination country (see Dustmann (2003) and Dustmann (1994a, 1995),for an early analysis of different return motives). But if immigrants plan to return to theirhome countries (or to move on to a third country), then this may affect many aspects oftheir behavior, including their human capital investment. In particular, any investmentdecisions in further skills will now depend not only on the return to these skills in the hostcountry but also on the return to these skills back in the home country. Thus, under-standing the distinct forms of migration is key to understanding immigrants’ humancapital investment behavior.
16 Papers by Dahl (2002), Grogger and Hanson (2008), Bishop (2008), Ortega and Peri (2009), Kennan (2010), andKennan and Walker (2010) consider the choice problem of individuals when deciding between more than onepotential destination region.
350 Christian Dustmann and Albrecht Glitz
Return decisions may be driven by preferences (if, for instance, the home countryprovides the migrant with amenities that are valuable itself or complementary to con-sumption) or purchasing power considerations (if, for instance, the host country currencyhas a high value in the home country). However, they may also be the outcome of anoptimizing strategy that consists of obtaining human capital in the destination countryin order to apply it in the origin country. Examples of this type of human capital are uni-versity education or foreign language skills. In that case, return migration is the outcomeof an optimal human capital investment plan over the individual’s life cycle. In addition,the possibility of a migration later in the individual’s life may already induce human capi-tal investment in the home country. One reason may be that skills acquired at home havea high return in the host country. Another reason may be that skills acquired at home area prerequisite for the possibility to acquire further valuable skills abroad, either directlybecause of minimum education requirements due to immigration policies or becauseof the sequential nature of skill accumulation.
3.2. A Simple Model of Return Migration and Investmentin Human CapitalIn what follows, we set up a simple model that serves to clarify some key ideas ofmigrants’ decision processes. The model shows how individuals reach a decision ofwhether to emigrate and how this decision is intricately linked to the human capitalthey accumulate over their life cycle. It illustrates how the possibility of a temporarymigration affects optimal human capital investment profiles, what these profiles implyfor individuals’ earnings and their growth over time, and how these patterns dependon initial observable skills and ability. The model will also help us to structure the vastempirical literature that exists on migrants’ education and skill investment decisions intheir home and host countries. This literature has focused particularly on the analysisof earnings profiles of immigrants as a reflection of their human capital investments,on how these profiles depend on the time horizon of the migration as well as the lan-guage proficiency of the migrant, and on the issues of skill transferability, skill down-grading, and the role of ethnic networks.
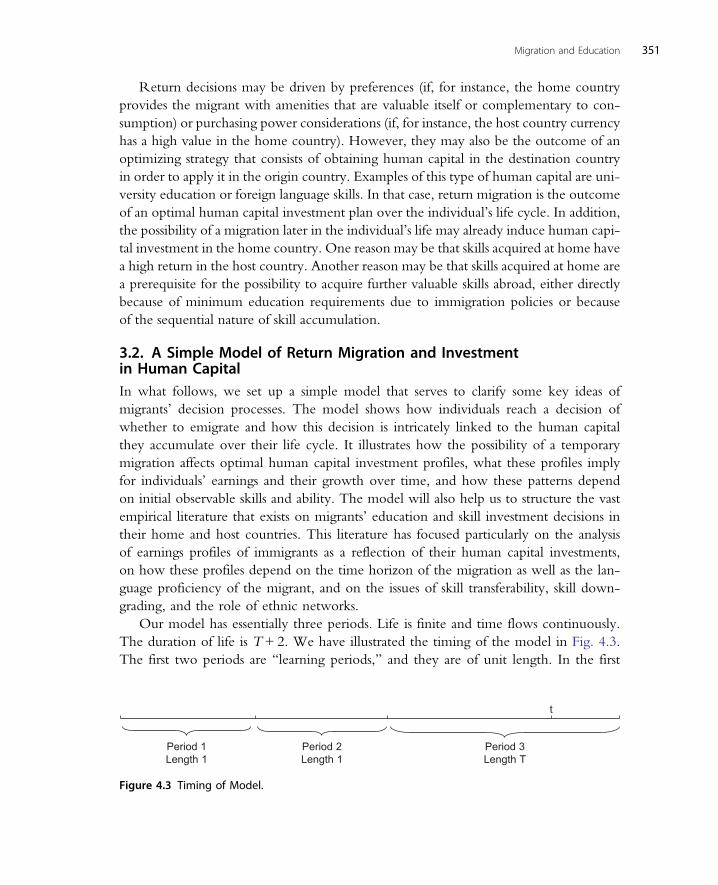
Our model has essentially three periods. Life is finite and time flows continuously.The duration of life is T+ 2. We have illustrated the timing of the model in Fig. 4.3.The first two periods are “learning periods,” and they are of unit length. In the first
Period 1Length 1
Period 2Length 1
Period 3Length T
t
Figure 4.3 Timing of Model.
Migration and Education 351
period, individuals live in the home country. In that period, individuals do not work butcan acquire education and choose how much to acquire. Acquisition of education iscostly, and individuals differ in their efficiency to acquire education. After the first period,individuals decide whether to emigrate.17 In the second period, individuals live either inthe home or in the host country, depending on whether they have chosen to emigrateafter the first period. During this second period, individuals have another opportunityto acquire education. They divide their time between learning and working in the labormarket. Thus, abstracting from direct costs of education such as fees, the cost of acquiringfurther education is equal to the opportunity cost of forgone earnings. We think aboutthis period as a period where postsecondary education is obtained. This may take theform of vocational training or college education. The third period has length T. If indi-viduals decide not to emigrate after the first period, they will spend both the second andthe entire third period in the home country. If individuals decide to emigrate, then theyhave the possibility to return to the home country either right after the second period, orafter a duration t in the host country, with t≤ T. Therefore, the length of the migration isgiven by t+ 1, and the remaining time in the home country after remigration is T− t.A permanent migration corresponds to the case where t = T.
In case no migration takes place, individuals stay at home until death, which occursat T. Although there is no explicit learning in the third period, we allow the returnback in the home country of human capital acquired in the host country in the secondperiod to increase with the length of stay in the host country.
In our model, individuals make a number of choices. These choices are made at thestart of the first period and at the start of the second period. To solve the model, we firstconsider the decision problem at the start of the second period. In case no migrationtakes place, the individual decides about the optimal investment in learning in the homecountry in the second period. In case a migration does take place, the individual decidesabout the optimal investment in learning in the host country and the optimal time tospend in the host country. Given these decisions, we then go back to the start of thefirst period, where individuals decide about the optimal investment in their educationwhile they are still in the home country. This decision depends on the returns to anysuch investment in the future, given the optimal decisions about human capital invest-ment and the duration of migration at the start of the second period. Finally, the migra-tion decision is based on a comparison of the net present value of their lifetime earningsif migration does or does not take place.
We will first consider the decisions at the start of the second period. We will thenconsider the educational investment decision before a potential migration has takenplace and the migration decision itself.
17 For simplicity, we assume that immigrants have only the opportunity to emigrate after the first period.
352 Christian Dustmann and Albrecht Glitz
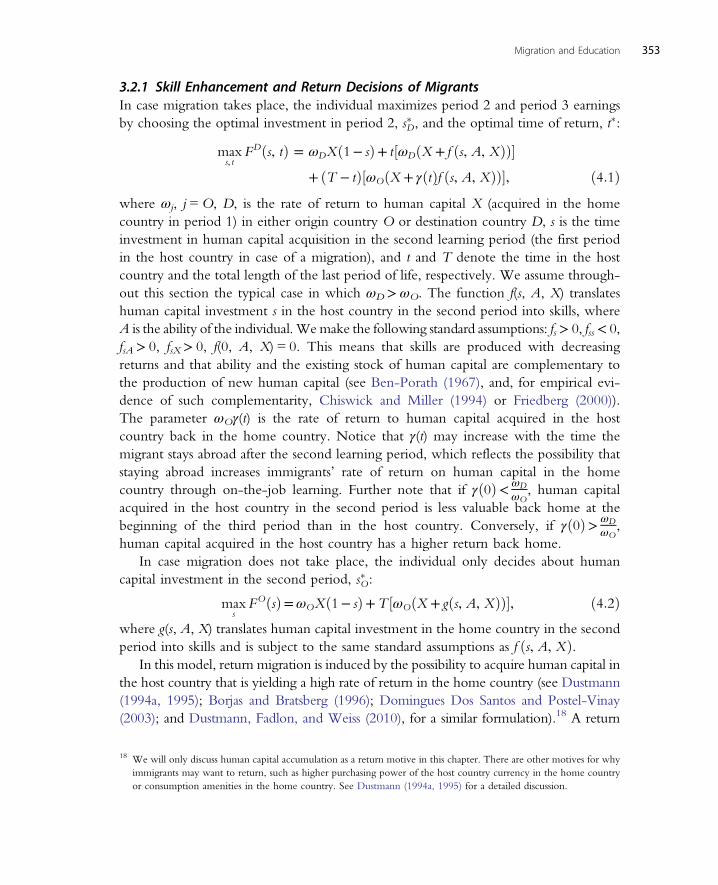
3.2.1 Skill Enhancement and Return Decisions of MigrantsIn case migration takes place, the individual maximizes period 2 and period 3 earningsby choosing the optimal investment in period 2, s�D, and the optimal time of return, t�:
maxs, t
FDðs, tÞ = ωDXð1− sÞ+ t½ωDðX + f ðs, A, XÞÞ�+ ðT − tÞ½ωOðX + γðtÞf ðs, A, XÞÞ�, ð4:1Þ
where ωj, j=O, D, is the rate of return to human capital X (acquired in the homecountry in period 1) in either origin country O or destination country D, s is the timeinvestment in human capital acquisition in the second learning period (the first periodin the host country in case of a migration), and t and T denote the time in the hostcountry and the total length of the last period of life, respectively. We assume through-out this section the typical case in which ωD>ωO. The function f(s, A, X) translateshuman capital investment s in the host country in the second period into skills, whereA is the ability of the individual.Wemake the following standard assumptions: fs> 0, fss< 0,fsA> 0, fsX> 0, f(0, A, X) = 0. This means that skills are produced with decreasingreturns and that ability and the existing stock of human capital are complementary tothe production of new human capital (see Ben-Porath (1967), and, for empirical evi-dence of such complementarity, Chiswick and Miller (1994) or Friedberg (2000)).The parameter ωOγ(t) is the rate of return to human capital acquired in the hostcountry back in the home country. Notice that γ(t) may increase with the time themigrant stays abroad after the second learning period, which reflects the possibility thatstaying abroad increases immigrants’ rate of return on human capital in the homecountry through on-the-job learning. Further note that if γð0Þ< ωD
ωO, human capital
acquired in the host country in the second period is less valuable back home at thebeginning of the third period than in the host country. Conversely, if γð0Þ> ωD
ωO,
human capital acquired in the host country has a higher return back home.In case migration does not take place, the individual only decides about human
capital investment in the second period, s�O:
maxs
FOðsÞ=ωOXð1− sÞ+T ½ωOðX + gðs, A, XÞÞ�, ð4:2Þwhere g(s, A, X) translates human capital investment in the home country in the secondperiod into skills and is subject to the same standard assumptions as f ðs, A, XÞ.
In this model, return migration is induced by the possibility to acquire human capital inthe host country that is yielding a high rate of return in the home country (see Dustmann(1994a, 1995); Borjas and Bratsberg (1996); Domingues Dos Santos and Postel-Vinay(2003); and Dustmann, Fadlon, and Weiss (2010), for a similar formulation).18 A return
18 We will only discuss human capital accumulation as a return motive in this chapter. There are other motives for whyimmigrants may want to return, such as higher purchasing power of the host country currency in the home countryor consumption amenities in the home country. See Dustmann (1994a, 1995) for a detailed discussion.
Migration and Education 353
to the home country may happen at the beginning of the third period if γð0Þ> ωDωO
.An example is “student migrations,” where a migration takes place to acquire skills abroadthat have a higher return in the home country.19 Return migration can also be induced bya high return in the home country to human capital acquired in the host country “on thejob”.20 In our model, this is reflected by γ′ðtÞ> 0. Even if γð0Þ< ωD
ωOso that an immediate
return after the second period is not optimal, returning before Tmay be an optimal strategy.
3.2.2 Skill Investment in the Home CountryAfter having chosen the optimal duration abroad t� and the optimal investment in learnings�, where we denote the payoff of these choices as FDðt�, s�DÞ in case of emigrating andFOðs�OÞ in case of not emigrating, we will now consider the first-period problem. Beforemaking the migration decision, individuals have the possibility to acquire education in thehome country in the first period. To allow for this, we assume that X, the human capitalstock after the first period,is a function of first-period investment i:X =XðiÞ. We furtherassume that the amount of skills acquired in the first period is concave with respect toinvestment: Xi > 0, Xii ≤ 0. The choice of i will depend on the possibility of a futuremigration. In case of migrating, the value function is then given by
VD = maxi
FDðs�DðiÞ, t�ðiÞ, iÞ−Cði, AÞ, ð4:3Þwhere C(i, A) is the cost of investing in education in the home country, which has theproperties Ci> 0, Cii> 0, CA< 0, CiA< 0: costs are increasing in investment, convex,and lower as well as increasing at a slower rate for high-ability individuals. In case ofremaining in the home country, the value function is given by
VO = maxi
FOðs�OðiÞ, iÞ−Cði, AÞ: ð4:4Þ
19 There is relatively little direct empirical evidence on the returns of foreign education in the home country of animmigrant after he or she returned. One obvious problem for empirical analysis is the selection of both those whodecide to study abroad and those who return to their home country, which makes it difficult to identify a causaleffect. Oosterbeek and Webbink (2006) exploit a discontinuity in awarding a specific grant to Dutch students forstudying abroad. Their OLS estimates show a wage gain of around 4–7% for graduates who studied abroad relativeto graduates who did not. However, their RD estimates, though of broadly similar magnitude, are inconclusivedue to large standard errors. Wiers-Jenssen and Try (2005) find a wage premium of around 3.5% for Norwegianworkers who graduated abroad, whereas Palifka (2003), using survey data covering a complete cohort of graduatesfrom a single Mexican university, finds a premium of around 20% 6 months after graduation for graduates who spentat least some time studying abroad.
20 There is evidence that, for migrants who returned to their home country, the work experience acquired abroadenhances earnings by more than the work experience acquired in the home country. Reinhold and Thom (2009)analyzed earnings of Mexican emigrants who returned from the United States. They find that, for these immigrants,the labor market experience accumulated in the United States increases earnings by twice as much as the experienceaccumulated in Mexico. Papers by Barrett and O’Connell (2001) and Iara (2006) report similar findings for Irelandand migrants who returned to Eastern Europe from Western European countries. Co, Gang, and Yun (2000) reporta wage premium for having been abroad for female return migrants in Hungary.
354 Christian Dustmann and Albrecht Glitz
3.2.3 The Migration DecisionThe choice whether to migrate will depend on the comparison of the optimal valuefunctions:
V =max½VD − k+ ηD, VO + ηO�: ð4:5Þ
Assume that ηj, j =O, D, are iid extreme value distributed error terms capturingheterogeneity in the choice, and k is the cost of migration. It follows that for a givenindividual, the probability of a migration is given by
Probmigrate =1
1+ eVO + k−VD :
Thus, if we assume that abilities follow a distribution G, with support ½0, A �, thenthe proportion of individuals who migrate from country O to country D is given by
Proportionmigrate = ∫A
0ProbmigrateðAÞdGðAÞ:
This model is simple, but instructive, as it allows for a variety of cases that have beenstudied in the empirical literature. For a permanent migration, the second-period pro-blem in Eq. (4.1) corresponds to the simple human capital model that underlies theearly empirical papers on immigrant assimilation (see, e.g., Chiswick (1978)). Addingthe possibility of return migration with a predetermined migration period leads to morecomplex empirical specifications, as we will illustrate below. The problem becomeseven more difficult if the migrant chooses the time of return optimally. The model alsoallows consideration of the relationship between migration and return migration,and human capital accumulation in the host country. It includes the special case of stu-dent migrations, in which some countries are “learning centers,” as documented inTable 4.6, and provide education that has a high return in the home country.
The choices made in the first period add additional insight into learning incentivesinduced by migration possibilities. For instance, acquisition of education in the home countryin the first period may be a prerequisite for acquiring further and higher education in the hostcountry in the second period. Furthermore, the model allows for the possibility that humancapital in the home country is acquired because it has a high return in the host country. InSection 3.3, we will explore some of the implications of this model for empirical work. Wewill then discuss the empirical literature, using the model as a framework of reference.
3.3. Implications of the Model3.3.1 The Optimal Investment in Human Capital and the OptimalMigration DurationWe first consider the problem of the individual at the beginning of the second period.For those who do not migrate, the optimal investment in the second period s�O is
Migration and Education 355
simply obtained by differentiating Eq. (4.2) with respect to s and equating theadditional forgone earnings in the learning period from an extra unit of time invest-ment, ωOX, to the benefit arising from a higher earnings potential in the subsequentperiod, ωOgsT.
For those who migrate, the problem at the beginning of the second period corre-sponds to the decision about how much to invest in host country human capital andwhen and whether to return to the home country. The FOCs are given by
dFDðs, tÞds
: −ωDX + fs½tωD + ðT − tÞγðtÞωO�= 0 ð4:6aÞ
dFDðs, tÞdt
:ωDðX + f ð:ÞÞ−ωOðX + γðtÞf ð:ÞÞ+ωOðT − tÞγ′ðtÞf ð:Þ= 0: ð4:6bÞ
The equilibrium condition in Eq. (4.6a) for the optimal investment in human capitalwhile being in the host country indicates that the cost in terms of forgone earnings inthe learning period from an additional unit of time investment (first term) must be equalto the benefit arising from a higher earnings potential in the subsequent period (as in thecase of no migration). This, in turn, depends on the time spent in the host country t, onthe increase in productivity in the second period through investments in human capitalin the first period fs, and on the transferability of human capital acquired abroad to thehome country’s labor market γ(t), which may depend on the time spent in the hostcountry.
The optimal migration duration derived from Eq. (4.6b) depends, for the optimallychosen human capital investment, on a comparison between spending a marginal unitof time in the host country and spending the same unit of time back in the home country.The individual chooses the optimal s and t simultaneously. The optimal human capitalinvestment s�D will change in response to changes in exogenous parameter (for instance,the rate of return to human capital ωD) directly, and indirectly, because any parameterchange affects the optimal migration duration, t�, which in turn changes investment.Given our assumptions about f(.) and γ(t), it is straightforward to show that, in caseof an interior solution, a unique optimum for s and t exists. To derive the comparativestatics is likewise straightforward. We will now investigate some special cases, whichrelate to the empirical literature in the area.
3.3.2 Permanent MigrationAssume first that the migration is permanent, that is, t= T. One way to generate apermanent migration in our model is to assume that γ= 1, γ′ = 0, and ωD>ωO: humancapital acquired abroad has the same value at home, the value is not increasing withexperience abroad, and the rental rate on human capital is higher in the host country.
356 Christian Dustmann and Albrecht Glitz
In that case, the optimal investment in human capital during the second period is cho-sen so that ωDX=ωD fsT: forgone earnings in the second period are equalized to thegain from human capital investment in the third period. Given our assumptions ofthe function f(.), we immediately obtain a number of results: First, human capital invest-ment s in the host country increases in T. A direct implication of this is that immigrantswho arrive early in life will invest more into their skills, as their payoff period is longer(Friedberg (1992), Schaafsma and Sweetman (2001), and Wilkins (2003), explore thisissue empirically). Second, investment may increase or decrease with the stock ofhuman capital X upon arrival. Well-educated immigrants may lose considerably whenspending time in learning activities. On the other hand, as human capital is productivein its own production, well-educated immigrants acquire additional skills more effec-tively. The larger the complementarity between skills upon arrival and the acquisitionof additional skills ( fsX), the more likely it is that human capital investment after immi-gration is higher for well-educated immigrants (see Borjas (2000), for a detailed discus-sion). Finally, the higher the ability A of immigrants, the higher is their human capitalinvestment.21
How is wage growth for permanent migrants in the host country related to theseparameters? Wage growth from period 2 to period 3 is given by ΔwD = ωD( f(.) + sX).Thus, for a given investment s, wages grow faster the higher the skills the individualhas upon arrival. However, the effect of an increase in the initial skill level at arrivalon skill investment itself is ambiguous so that the overall effect of higher education atarrival on wage growth is likewise ambiguous.22 Wage growth is unambiguouslypositively related to the level of the immigrant’s ability, as this raises third-periodwages per unit of investment and human capital investment itself. Finally, wagegrowth is higher for immigrants who arrive at a younger age, as their investment inthe second period is higher. We will contrast these results with the empirical literaturein Section 3.4.
3.3.3 Temporary Migration with Exogenous Return DateThe next case we will consider is that of a temporary migration, in which the length ofthe migration period is exogenously determined. This could, for instance, be the resultof a contract migration or migrations that are restricted to a limited time period forother reasons. Let t denote the exogenously set migration duration We assume thatthe optimally chosen migration duration would be longer than the predeterminedone, so that the constraint is binding, and (for simplicity) that γðtÞ= γ < ωD
ωOso that
21 The results follow from totally differentiating Eq. (4.6a) after setting t= T, where the total differential is given bydsfssT = dxð1− fsXTÞ− dTfs − dAfsAT .
22 dΔwD =ωD ð fX + sÞ+ ð fs +XÞ dsdXh i
dX .
Migration and Education 357
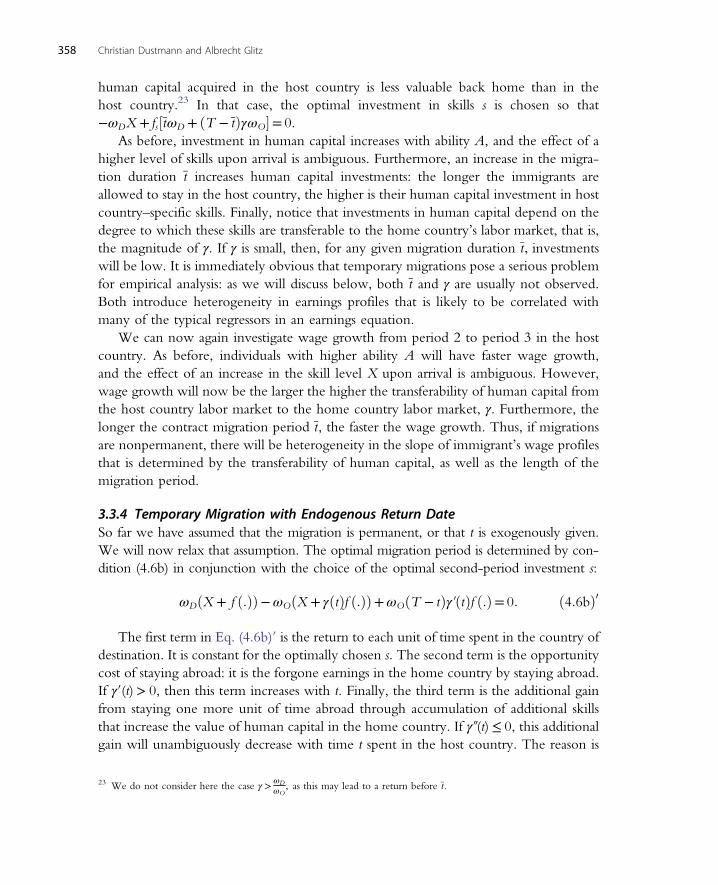
human capital acquired in the host country is less valuable back home than in thehost country.23 In that case, the optimal investment in skills s is chosen so that−ωDX + fs½tωD + ðT − tÞγωO�= 0.
As before, investment in human capital increases with ability A, and the effect of ahigher level of skills upon arrival is ambiguous. Furthermore, an increase in the migra-tion duration t increases human capital investments: the longer the immigrants areallowed to stay in the host country, the higher is their human capital investment in hostcountry–specific skills. Finally, notice that investments in human capital depend on thedegree to which these skills are transferable to the home country’s labor market, that is,the magnitude of γ. If γ is small, then, for any given migration duration t, investmentswill be low. It is immediately obvious that temporary migrations pose a serious problemfor empirical analysis: as we will discuss below, both t and γ are usually not observed.Both introduce heterogeneity in earnings profiles that is likely to be correlated withmany of the typical regressors in an earnings equation.
We can now again investigate wage growth from period 2 to period 3 in the hostcountry. As before, individuals with higher ability A will have faster wage growth,and the effect of an increase in the skill level X upon arrival is ambiguous. However,wage growth will now be the larger the higher the transferability of human capital fromthe host country labor market to the home country labor market, γ. Furthermore, thelonger the contract migration period t, the faster the wage growth. Thus, if migrationsare nonpermanent, there will be heterogeneity in the slope of immigrant’s wage profilesthat is determined by the transferability of human capital, as well as the length of themigration period.
3.3.4 Temporary Migration with Endogenous Return DateSo far we have assumed that the migration is permanent, or that t is exogenously given.We will now relax that assumption. The optimal migration period is determined by con-dition (4.6b) in conjunction with the choice of the optimal second-period investment s:
ωDðX + f ð:ÞÞ−ωOðX + γðtÞf ð:ÞÞ+ωOðT − tÞγ′ðtÞf ð:Þ= 0: ð4:6bÞ0
The first term in Eq. (4.6b)′ is the return to each unit of time spent in the country ofdestination. It is constant for the optimally chosen s. The second term is the opportunitycost of staying abroad: it is the forgone earnings in the home country by staying abroad.If γ′(t)> 0, then this term increases with t. Finally, the third term is the additional gainfrom staying one more unit of time abroad through accumulation of additional skillsthat increase the value of human capital in the home country. If γ″(t)≤ 0, this additionalgain will unambiguously decrease with time t spent in the host country. The reason is
23 We do not consider here the case γ > ωDωO
, as this may lead to a return before t.
358 Christian Dustmann and Albrecht Glitz
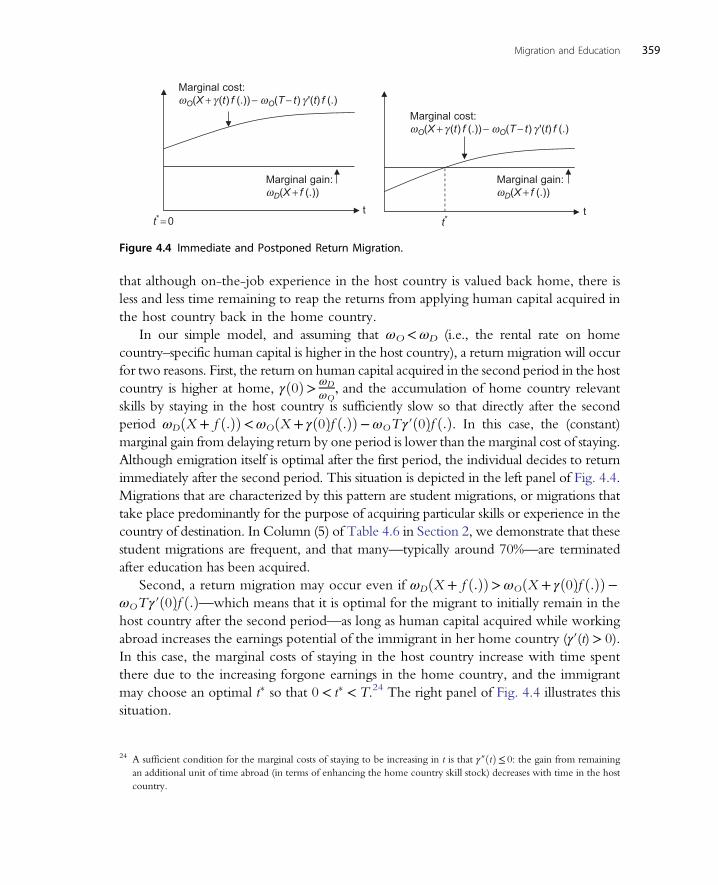
that although on-the-job experience in the host country is valued back home, there isless and less time remaining to reap the returns from applying human capital acquired inthe host country back in the home country.
In our simple model, and assuming that ωO<ωD (i.e., the rental rate on homecountry–specific human capital is higher in the host country), a return migration will occurfor two reasons. First, the return on human capital acquired in the second period in the hostcountry is higher at home, γð0Þ> ωD
ωO, and the accumulation of home country relevant
skills by staying in the host country is sufficiently slow so that directly after the secondperiod ωDðX + f ð:ÞÞ<ωOðX + γð0Þf ð:ÞÞ−ωOTγ′ð0Þf ð:Þ. In this case, the (constant)marginal gain from delaying return by one period is lower than the marginal cost of staying.Although emigration itself is optimal after the first period, the individual decides to returnimmediately after the second period. This situation is depicted in the left panel of Fig. 4.4.Migrations that are characterized by this pattern are student migrations, or migrations thattake place predominantly for the purpose of acquiring particular skills or experience in thecountry of destination. In Column (5) of Table 4.6 in Section 2, we demonstrate that thesestudent migrations are frequent, and that many—typically around 70%—are terminatedafter education has been acquired.
Second, a return migration may occur even if ωDðX + f ð:ÞÞ>ωOðX + γð0Þf ð:ÞÞ−ωOTγ′ð0Þf ð:Þ—which means that it is optimal for the migrant to initially remain in thehost country after the second period—as long as human capital acquired while workingabroad increases the earnings potential of the immigrant in her home country (γ′(t)> 0).In this case, the marginal costs of staying in the host country increase with time spentthere due to the increasing forgone earnings in the home country, and the immigrantmay choose an optimal t� so that 0< t� < T.24 The right panel of Fig. 4.4 illustrates thissituation.
Marginal cost:ωO(X + γ (t) f (.)) − ωO(T − t) γ '(t) f (.)
Marginal cost:ωO(X + γ (t) f (.)) − ωO(T − t) γ '(t) f (.)
t*= 0tt
Marginal gain:ωD(X + f (.))
Marginal gain:ωD(X + f (.))
t*
Figure 4.4 Immediate and Postponed Return Migration.
24 A sufficient condition for the marginal costs of staying to be increasing in t is that γ″ðtÞ≤ 0: the gain from remainingan additional unit of time abroad (in terms of enhancing the home country skill stock) decreases with time in the hostcountry.
Migration and Education 359
It is apparent that, if the return time is optimally chosen, the analysis of immigrants’earnings paths becomes more complex than before, as the optimal migration durationmay affect human capital investment and is in turn affected by the optimal skill accumu-lation. The earnings paths of immigrants who choose their migration duration optimallywill therefore depend on parameters that determine their return choice as well. Thisfurther complicates the analysis of immigrants’ earnings profiles, as we will discussbelow.25
3.3.5 The Optimal Investment in Learning in the First PeriodSo far we have not considered the decisions in the first period. Having solved thesecond-period problem by choosing the optimal migration period t� and the optimalinvestment s�, the individual will now choose the optimal investment in learning inthe first period. Assuming that individuals are endowed with a base level of productivity(which could include compulsory schooling: X(0) =X0), the optimal investment in thecase of migrating is given by (invoking the envelope theorem)
ωDð1−s�DðiÞÞXi+ t�ðiÞωDXið1+ fXÞ+ðT− t�ðiÞÞωOXið1+ γðt�ðiÞÞfXÞ=BDðiÞ=Ciði,AÞ,ð4:7aÞ
and in case of nonmigrating by
ωOð1−s�OðiÞÞXi+TωOXið1+ gXÞ=BOðiÞ=Ciði,AÞ, ð4:7bÞwhere Xi=
∂X∂i .
Thus, in the migration case, the individual will compare the marginal cost of investingin the first period (which are costs invoked by effort, and possibly monetary cost) with themarginal benefit, which is the impact of an extra unit of investment in the first period onfuture lifetime earnings.26 Given our assumptions about the cost function and the learn-ing technology in the first period, the individual will invest in learning in period 1 ifthe expressions on the left-hand side of Eqs (4.7a) and (4.7b) are larger than the marginalcost for the first unit of investment. Note that—as the marginal cost schedule decreases inability—higher-able individuals will always invest more in learning. Once the optimalinvestment in the first period i� has been obtained for both the migration case (togetherwith s�D and t�) and the nonmigration case (together with s�O), the migration decision ofthe individual is based on a comparison of VD − k and VO.
25 Derivation of the partial effects is straightforward, although tedious. For the assumptions made and for ωD −ωO > 0,an increase in ωD decreases investments in human capital s, whereas an increase in ωO leads to an increase in invest-ments. Those with higher ability A will invest more, whereas the effect of an increase in human capital upon arrival Xon s is ambiguous.
26 To simplify the analysis, we assume here that the preference shocks ηD and ηO are drawn after the investment decisionis made.
360 Christian Dustmann and Albrecht Glitz
This framework allows us to explore a number of interesting cases. Let us firstconsider the simple case in which migration is permanent and no investment in humancapital after period 1 is allowed (s= 0). In this case, conditions (4.7a) and (4.7b) simplifyto ωDXið1+TÞ=Ciði, AÞ and ωOXið1+TÞ=Ciði, AÞ. If (as we assume throughout)ωD >ωO, the return to the period 1 investment is clearly larger in the case of a migra-tion and investment in learning in the first period will be higher for the case of a per-manent migration than for the case of nonmigration. This is the core of the argumentby Mountford (1997). In his model, individuals have an (exogenous) probability ofmigrating π so that the optimal investment is given by
ðπωD + ð1− πÞωOÞXið1+TÞ=Ciði, AÞ:
There are two insights from this relationship. First, there is (for a given π) a par-ticular ability level A, only above which it will be worthwhile to invest in learning.Second, even if the probability of emigration is small, individuals will invest more inlearning, as long as the return in the country of destination is sufficiently high.Thus, an increase in π may lead to more accumulation of human capital than inthe nonmigration case. Furthermore, although emigrants take with them the humancapital they acquire in the home country (which is usually associated with a braindrain), some of those who acquired more skills remain in the home country andmay therefore increase the overall per capita level of skills in that country, com-pared with the case where no migration is possible. This may then lead to a braingain rather than a brain drain. Thus, the country of origin could overall benefitfrom a migration of skilled workers—see Mountford (1997) for an insightful discus-sion. In Section 4.4, we discuss papers that investigate the empirical relevance of thishypothesis.
Another situation that is encompassed by this model is the acquisition of humancapital in the home country as a prerequisite to enter the destination country. Supposethe potential host country has particular entry requirements such as a specific educa-tional degree. The recently introduced point-based immigration system in the UnitedKingdom and similar existing systems in Australia and Canada ref lect this scenario.Thus, if (for optimally chosen s� and t�) the value of migrating is sufficiently higher thanthe value of nonmigrating, then individuals will invest in education in the home coun-try to obtain the critical level of Xmin that then allows an emigration in the next period,given that
VD − k jXðiÞ≥Xmin >VO:
Again, such a policy will lead to a selection of high-ability immigrants to invest inthe minimum necessary level of education, as for them the cost of acquiring educationis lower.
Migration and Education 361
Another (but similar) situation occurs if learning in the second period in the countryof destination requires a certain level of education to be obtained at home. For instance,PhD studies in the United States may require a Bachelor’s degree in the country of ori-gin. In that case, optimal investment in the home country will take this requirementinto account.
3.4. Empirical Studies3.4.1 Assimilation and AdaptationThe first generation of papers that studies the performance of immigrants in their coun-tries of destination, starting with Chiswick (1978), concentrates on the earnings profilesof immigrants after arrival in their destination country, viewing these as a reflection ofthe human capital investments undertaken by the migrants and the skill transferabilitybetween origin and destination country. These studies do not distinguish between per-manent and temporary migrations, and there is no consideration of immigrants havingundertaken investments in the home country with a view of obtaining returns in thehost country as illustrated in the previous section. The key question these studies addressis whether immigrants perform similarly, worse, or better than natives with the same setof characteristics. This depends on two factors: (1) their quality and (2) their effort toinvest in further knowledge.
Why is this important and why have so many papers been published that address thisissue? Mainly because the relative position of immigrants in the distribution of earningsdetermines the contribution they make to the host country economy. Higher earnerscontribute more to tax and benefit systems and may increase per capita GDP. For manyyears, the study of immigrant assimilation was perhaps the largest empirical literature onimmigration in the economic discipline (see Table 4.L1 at the end of this chapter for acomprehensive overview of studies).
Chiswick’s (1978) work suggests that immigrants—although starting with a lowerlevel of earnings than comparative natives—experience a higher earnings growth andeventually outperform natives after about 10–15 years.27 He obtains these results by“augmenting” a simple Mincer wage equation and allowing immigrants to have—conditional on education and potential experience at entry—different entry wages thannatives, as well as different earnings growth. Earnings of immigrants grow because oftwo types of work experience: (1) experience accumulated in the home country and(2) experience accumulated in the host country. Experience accumulated in the hostcountry has two components: (1) new, host country–specific human capital and(2) human capital that allows already existing knowledge to be used in the destinationcountry. An example for the latter is language proficiency. Chiswick concludes that the
27 Holding other characteristics constant, Chiswick’s results show that the earnings of the foreign-born are 9.5% lowerthan those of the native-born after 5 years, equal after 13 years, and 6.4% higher after 20 years in the country.
362 Christian Dustmann and Albrecht Glitz
foreign-born seem to be able to compensate any potential earnings disadvantage arisingfrom initially lower host country–specific human capital by greater investments in train-ing, higher work motivation, and greater ability, due to being positively selected. Somesubsequent papers supported these findings (Carliner (1980) and De Freitas (1980));thus, at least for the United States, the early literature on immigrant assimilation drawsa picture of immigrants as being high achievers, who—after initial disadvantages—out-perform natives through ability, hard work, and investment in their human capital andproductivity.
However, this positive picture of immigration to the United States was soon chal-lenged by a series of papers starting with Borjas (1985). Borjas argues that estimationof earnings equations based on simple cross-sectional data—as in Chiswick (1978)—does not allow a distinction between cohort and years since migration effects. Animmigrant who has been in the United States for 10 years in 1970 arrived in 1960,while an immigrant who has been in the United States for 20 years in 1970 arrivedin 1950. Thus, if the composition of immigrants changed over time (as it had sincethe abolition of country quotas - originally established by the US Immigration Actof 1924 - through the Immigration and Nationality Act of 1965 significantly increasedthe share of immigrants from South and Central America), estimated earnings profilesbased on cross-sectional data may over- or understate the earnings growth of immi-grants. In the case of the United States, Borjas argues that entry wages of subsequentcohorts have gone down so that a cross-sectional analysis overestimates the earningspaths of immigrants. He shows that distinction between cohort and years sincemigration effects is possible by simply adding an additional census year to the data.More specifically, Borjas (1985) proposes the so-called synthetic panel methodologyin which earnings of migrants and natives are given by the following two equations:28
yIit = αI + βIEDi + γIEXit + δIYSMit +∑mλImCim +∑
kπIkΤik + εIit ð4:8aÞ
yNit = αN + βNEDi + γNEXit +∑kπNk Τik + εNit , ð4:8bÞ
where yIit and yNit are log earnings of individual i in year t, Τik is an indicator variablefor the year in which individual i is observed that is set equal to unity if k= t, and πI
k
and πNk are time effects on log earnings for immigrants and natives, respectively. The
variable Cim is an indicator variable for the year m in which individual i arrived in thehost country, and ED, EX, and YSM measure educational attainment, potential(overall) labor market experience, and potential labor market experience in the
28 Originally, many studies did not allow the effect of education and experience to vary between immigrants andnatives, assuming βI = βN and γI = γN .
Migration and Education 363
United States (years since migration), respectively.29 The parameter of interest is givenby θ= δI + γI − γN , with immigrants’ earnings converging to those of natives whenθ> 0.30 The coefficient βI shows the return to education obtained in the home coun-try on the host country labor market (assuming the migrant worker arrived in thehost country as an adult). It thus reveals, in conjunction with βN, the transferabilityof human capital between home and host country. This setup is called the syntheticpanel methodology since it typically uses repeated cross-sectional data, for instancefrom US Censuses, to construct a pseudo-panel of cohorts that can be followed overtime without actually observing any worker more than once.
A fundamental problem with estimating Eq. (4.8a) is that years since migration equalthe difference between calendar year of observation and the cohort entry year so thatthese variables are perfectly collinear. This means that the coefficients δI, λIm, and πI
k
cannot be separately identified without imposing additional identification restrictions.To identify the model, Borjas (1985, 1995a) assumes equal time effects for immi-
grants and natives, that is, πNt = πIt , while allowing cohort quality to vary freely over
time. In this case, time effects are effectively estimated from the native earnings equa-tion which in turn ensures identification of the cohort effects in the immigrant equa-tion. In contrast, Chiswick (1978) who only had one cross section of data at hisdisposal assumed in addition to constant time effects that cohort effects did not changeover time so that, after normalization, λIm = 0, for all m.31
Using data from the 1970 and 1980 US Census, Borjas (1985) shows that thequality of immigrants admitted to the United States declined over time. As a conse-quence, the positive impact of the years since migration variable in cross-sectionalearnings equations is picking up not only the intended effect of US-specific humancapital accumulation but also the effect of the higher quality of earlier immigrantcohorts. Separating these effects by looking at within-cohort earnings growth revealsthat the assimilation profiles of immigrants’ earnings are significantly flatter than pre-viously estimated, with the true growth rate being up to 20 percentage points lowerin some immigrant cohorts so that the point of overtaking happens much later in thelife cycle, if at all. Borjas (1995a) confirmed these results in a follow-up study thatincluded the 1990 US Census: the decline in cohort quality continued till the1980s, albeit at a slower rate than in the 1970s, and for the bulk of first-generationimmigrants, earnings parity with the typical native-born worker will never bereached over the life cycle.
29 To simplify the notation, we ignore higher-order terms of years since migration and experience.30 In a similar setting, LaLonde and Topel (1992) define assimilation differently as occurring if δI > 0, hence comparing
the economic value of spending an additional year in the host country relative to a year spent in the home country.31 Assume for simplicity that cohort effects are linear, so that ∑
mλImCim = λICim. As Cim =Tik −YSMit , the parameter
Chiswick estimates on YSM is δI − λI clearly if λI < 0 (cohort quality deteriorates), the estimate is upward biased.
364 Christian Dustmann and Albrecht Glitz
Motivated by these first studies, a large literature has developed that examinesthe earnings paths of immigrants for different countries and different time periods. InTable 4.L1, we provide an extensive overview, focusing on the estimated returns toeducation and experience, both in the home and the host country, and the transferabil-ity of home country human capital to the host country labor market.
3.4.2 Extensions of the Basic ApproachAlthough more flexible than Chiswick’s (1978) cross-sectional approach, there are anumber of restrictive assumptions underlying the synthetic panel methodology in itsstandard formulation in Eqs (4.8a) and (4.8b). First, it assumes that—although the entrywage of different immigrant cohorts may differ—their wage growth is the same. Ourmodel in Section 3.2 shows that this assumption may be quite restrictive. We show thatimmigrants who are more able do not necessarily start off with higher earnings, as theymay initially invest more in their human capital, but that their wage growth is likely tobe steeper than that of less able immigrants.32 If we distinguish cohort quality by theamount of measured human capital, X, then wage growth is—as described in our model—likewise affected. Thus, the assumption that wage growth is the same for different entrycohorts if these differ in terms of their average ability or their measured human capitalappears quite strong. As in the benchmark study by Borjas (1995a), it should be justifiedin each individual case, in particular since the common interpretation of the estimatedentry wages of different immigrant cohorts as a measure of their “quality” hinges cru-cially upon the validity of this assumption. Duleep and Regets (1999, 2002) and Greenand Worswick (2004) provide a detailed discussion of the issues involved in the estima-tion of immigrant earnings profiles in the context of a human capital investmentmodel. They make a strong case for not relying on entry earnings as a measure ofrelative cohort quality, with Green and Worswick (2004) suggesting instead a morecomprehensive measure based on the estimated present value of all future earnings inthe host country.
Another strong assumption in the standard synthetic panel methodology is that busi-ness cycle and time effects for natives and immigrants are the same. This assumptionimplies that macroeconomic trends and transitory shocks, as well as aggregate labormarket conditions, affect immigrants’ and natives’ earnings in the same way. This isunlikely, as immigrants and natives have—as we illustrate in Section 2—usually differ-ent skills and are allocated to different occupations and industries. Dustmann, Glitz, andVogel (2010) illustrate for Germany and the United Kingdom that the economic cyclehas—even conditional on education, potential experience, and industry allocation—a
32 This seems to suggest that it is important to use wages rather than earnings for assimilation studies. However, evenwages may reflect an increased human capital investment, if contracts are of the Lazear (1979) type in which employ-ees accept lower wages in return for training.
Migration and Education 365
stronger impact on the employment of immigrants than on the employment ofnonimmigrants and that these differences are more pronounced for non-OECD immi-grants than for OECD immigrants. Two studies by Barth, Bratsberg, and Raaum (2004,2006) for Norway and the United States, respectively, argue that failure to considerthese differences may severely bias the assessment of the earnings assimilation processof immigrant workers. As a solution, the authors suggest to augment the earningsequations by including measures of local unemployment and allowing their impacton earnings to vary between immigrants and natives. Conditional on unemployment,time effects can then be assumed to be equal for both groups. Using data from the Cur-rent Population Survey (CPS) from 1979 to 2003, Barth, Bratsberg, and Raaum (2006)show that wages of immigrants in the United States are indeed more sensitive tochanges in local unemployment than wages of natives. As a result, since the native-immigrant wage gap reduces during economic expansions, the standard estimation strat-egy with equal time effects yields upwardly biased estimates of both the cohort qualityof recent immigrant arrivals in the United States and of the immigrant wage growth, asthe wage effects of the improving labor market conditions in the 1990s are erroneouslyattributed to immigrant quality and wage assimilation.
In light of our model in Section 3.2, another shortcoming of the standard modelstated in Eqs (4.8a) and (4.8b) is that there is no distinction between returns to educa-tion obtained in the home country and returns to education obtained in the hostcountry. The proposed strategy yields meaningful estimates under the assumption thatall immigrants arrive in the host country after they finished education. In this case, βI
measures the returns to education obtained in the home country. However, if someimmigrants arrive at an age when they are still in the process of obtaining formaleducation, the estimated parameter βI compounds the potentially different returns toeducation obtained in the home and host country. In a study for Israel, Friedberg(2000) explicitly distinguishes education obtained in the host country from educationobtained in the home country. She shows that the return to an additional year ofschooling obtained in Israel is 10.0% for natives and 8.0% for immigrants, whereasthe return to schooling obtained in the immigrants’ home countries is only 7.1%.She also finds very low returns to work experience accumulated before arrival. Anadditional year of experience in the country of origin yields a return of only 0.1%compared with 1.1% for an additional year of experience in Israel’s labor marketand a 1.7% return to experience for natives. The finding of low returns to homecountry education and experience in comparison with host country education andexperience has been confirmed in a number of additional studies for a variety of des-tination countries, for example, Kossoudji (1989), Schoeni (1997), and Bratsberg andRagan (2002) for the United States; Beggs and Chapman (1988a, 1988b) for Australia;Kee (1995) for the Netherlands; Schaafsma and Sweetman (2001) for Canada; Cohen-Goldner and Eckstein (2008) for Israel; Sanromá, Ramos, and Simón (2009) for Spain;
366 Christian Dustmann and Albrecht Glitz
and Basilio and Bauer (2010) for Germany (for details of these studies, see Table 4.L1).Thus, transferability of human capital from home to host country tends to be quite lowin many migration contexts. The only exception appears to be human capital that wasacquired in developed countries of origin, which typically yields relatively high returnsin developed host countries (see, e.g., Schoeni (1997), Friedberg (2000), or Bratsbergand Ragan (2002)). This could be either because home and host country are more simi-lar in terms of cultural, institutional, and technological aspects of their economies so thatskills are easily transferable or because more-developed countries of origin simply havehigher quality education systems. Interestingly, immigrants from developed countriesalso receive higher returns to human capital acquired in the host countries after theirarrival compared with migrants from less-developed countries, pointing toward com-plementarities between education obtained at home and education obtained in the hostcountry (see, e.g., Sanromá, Ramos, and Simón (2009) and Basilio and Bauer (2010)).Such complementarities are also supported by the observation that obtaining educationin the host country tends to have a positive effect on the return to home country–specific education (see Friedberg (2001)). One reason is that host country educationenables the migrant to transfer their premigration skills more effectively to the hostcountry’s labor market.
A related literature concerned with the transferability of human capital has studiedthe extent of overeducation of immigrants that is defined as the difference betweenthe formal qualifications held by the immigrants and the typical qualifications requiredin the occupations they hold (see, e.g., Chiswick and Miller (2007, 2008), Green, Kler,and Leeves (2007), Lindley and Lenton (2006), Nielsen (2007), and Sanromá, Ramos,and Simón (2008)). The main findings from this literature show that immigrants aremore likely to be overeducated than natives, but that with time in the host country, thisdifference in overeducation relative to natives decreases, a pattern reminiscent of theassimilation of immigrants’ earnings to those of natives over time.
One important implication arising from the theoretical model set up in Section 3.2is that the expected time the migrant will spend in the host country has an importanteffect on the decision to invest in host country–specific human capital, as it determinesthe time horizon over which the benefits from such investments can be reaped by theimmigrant. The longer the horizon, the higher are the investment incentives. Evenunder the assumption that migrations are permanent, this implies that immigrantswho arrive at a younger age should have more incentives to invest in host country–specific human capital and thus experience a larger initial earnings gap and steeper earningsprofile. Wilkins (2003) confirms these predictions using Australian survey data for 1997,distinguishing four age-at-migration groups: 0–14, 15–24, 25–34, and 35+ years of age.His results show that, for a given stock of human capital at the time of migration, initialwages of immigrants who arrive as children are significantly lower, at least 15%, than thoseof any other age-at-migration group, but their wage growth with time in Australia is
Migration and Education 367

significantly higher.33 More explicitly focusing on the human capital acquisition,Gonzalez (2003) shows that for Mexicans arriving in the United States before theage of 19, each year of delayed entry results in about 0.25–0.30 less years of overallschooling and, because this reduction in schooling is due to less US-specific education,significantly lower future earnings. This negative relationship between the eventualeducational attainment of immigrants who arrive in the host country in theiryouth and their age at arrival is a fairly consistent finding in the literature (see, e.g.,Hirschman (2001); Chiswick and DebBurman (2004); Cortes (2006); and Perreira,Harris, and Lee (2006)).
3.4.3 Return MigrationRelaxing the assumption that all migrations are permanent and allowing for nonperma-nent migrations, the estimation of immigrant earnings profiles becomes far more com-plex. Consider first the case of a temporary migration, in which the return time isexogenously given and where this constraint is binding (in the sense that the migrantwould otherwise wish to stay longer). As we have shown in Section 3.3.3, in that case,the immigrant’s investment in learning in the host country depends on the level of skillsupon arrival and on the expected economic opportunities in the home country, whichare directly affected by the return to any human capital investment when back home.Estimating equations as stated in Eqs (4.8a) and (4.8b) would therefore omit an impor-tant set of conditioning variables. The evolution of earnings of the migrant in the hostcountry (measured by the return to experience and the return to the number of yearssince migration) should depend on the length of the migration. This in turn should alsodepend on the labor market characteristics in the home country, introducing additionalheterogeneity if immigrants come from different origin countries. Neglecting thesevariables may lead to biased estimates of earnings profiles.34
The situation becomes more complex when return migrations are chosen by theimmigrant. In that case, investment in human capital in the host country and the opti-mal migration time are chosen simultaneously and should be modeled accordingly.Table 4.8 in Section 2 shows that return migrations are very common, and in most cases,returns and total migration durations are chosen by the migrant. In principle, the
33 Friedberg (1992) and Borjas (1995a) find that age at migration has an important overall negative effect on immigrantearnings in the United States. According to their results, a worker who arrived at age of 30 earns about 5% less thanone who already arrived at age of 20, all else equal. See also Schaafsma and Sweetman (2001) and van Ours and Veen-man (2006) for related work for Canada and the Netherlands, respectively.
34 For instance, our model in Section 3.2 suggests lower initial earnings (due to larger human capital investments), but asteeper earnings profiles for immigrants who have a longer expected duration in the host country. Thus, assimilationprofiles will depend on the duration of migration. Omission of variables that capture this in the estimation of earningsprofiles will lead to sample-specific returns to time in the host country, which depend on the distribution of antici-pated migration durations. Our model also suggests that an increase in migration durations will lead to steeper earn-ings paths for higher-able immigrants, which adds further identification problems.
368 Christian Dustmann and Albrecht Glitz
remigration decision and the human capital investment decision have to be estimatedsimultaneously. This poses a number of difficulties for the empirical researcher. Althoughthe simple model we describe earlier is deterministic, remigration decisions in the realworld are unlikely to remain unrevised over the migrants’ migration history. Thus, evenif (as is possible now in some register data sets) completed migration histories were obser-vable, the completed migration duration may have been different than the migrationduration that was intended when human capital decisions were made. But what mattersfor economic decisions is the expected migration duration at the time a decision is taken,and not the actual migration duration.
The data thus required are information on the expected duration of a migration ratherthan on the completed duration of a migration. Unfortunately, these return intentions areusually unobserved. An exception is the German Socio-Economic Panel, which asks aboost sample of immigrants in each wave how long they would like to remain inGermany, and whether they would like to return home at all. In an early paper, Dustmann(1993) uses this information to estimate earnings profiles of immigrants. Only about athird of all male immigrants intend to stay in Germany for 30 more years or forever,whereas slightly more than 60% of immigrants intend to return to their home countrieswithin the next 10 years, most of them before they reach retirement age. Allowing assim-ilation profiles to vary by the intended years of stay in Germany, he finds that “permanent”immigrants have indeed steeper earnings profiles than “temporary” immigrants. After5 years of residence, an additional year in the host country improves immigrants’ earningsby 0.4% if the total intended duration of stay is 10 years, 1.05% if it is 20 years, and 1.26% ifit is 30 years. Dustmann (1997, 1999, and 2000) provides additional evidence of differentiallabor market behavior of immigrants with different return intentions.
Following this line of argument, Cortes (2004) suggests that one of the main reasonsfor the steeper earnings profile of refugee migrants compared with economic migrantsin the United States is the implicit difference in their expected duration of stay. As refu-gees are typically unable or unwilling to return to their home countries for fear of per-secution or violent conflict, they have a longer time horizon in the host country andtherefore more incentives to invest in country-specific human capital. Her empiricalfindings support this hypothesis, as do those of Khan (1997) who finds a higher propen-sity of Cuban and Vietnamese refugees in the United States to invest in schooling com-pared with other foreign-born immigrants.
Thus, although—as we show in Section 2—return migrations nowadays are likelyto be the rule rather than the exception, the empirical literature has so far largelyignored the implications for the estimation of immigrants’ earnings profiles. Carefulestimation of earnings profiles of immigrants with different migration plans, taken inconjunction with their human capital investment decisions, requires modeling of theprocesses of human capital investments and return plans simultaneously. This needs tobe addressed within a well-defined structural setting.
Migration and Education 369
An additional problem with return migration, apart from the behavioral reasonsstated earlier, is that it is likely to be selective, in the sense that those who return arenot randomly chosen. Returning migrants may be either those who do not performvery strongly in the host country’s labor market or those who perform above average.In the latter case, for example, the average quality of a given immigrant cohort in thehost country will decrease over time, leading to an underestimation of the true earningsprofiles of immigrants of that cohort relative to natives. Lubotsky (2007) addressesthis problem by using longitudinal earnings data from US Social Security records thatallow following individual migrants over time. His results show that in the US case,out-migrants are negatively selected, implying that previous studies have systematicallyoverestimated the wage progress of immigrants who remained in the United States, by afactor of around 2.35 We will discuss some reasons for selective immigration andout-migration in Section 4.1.
3.4.4 LanguageOne dimension of human capital that deserves particular attention in the context ofmigration is language capital. Language is, on the one hand, a crucial human capital fac-tor for the productivity of immigrants in the host country. Not only is language impor-tant in its own right, but it is complementary to many other skill components. Forinstance, a qualified physician is unlikely to be able to work as a general practitionerwhen she does not master the language of the host country. On the other hand, invest-ments in language skills are likely to be of little use in the home country. For instance, amigrant from Bosnia to Sweden is unlikely to benefit much from speaking Swedishafter having returned home.36 Thus, although being very important as a complementto existing and future skills, language may at the same time be less transferable to othercountries’ labor markets in the future. In any case, the improvement in language skillsover the time spent in the host country is an important driver of the observed earningsassimilation profiles of immigrants in their host countries.
A key question in this context concerns the return to language capital: what is thepercentage increase in earnings if an immigrant speaks the host country language wellas compared to speaking it poorly? This parameter has important policy implications,as it helps assessing the benefits of language schemes or of selective migration policiesthat discriminate according to language proficiency. However, this parameter is difficultto measure for several reasons. First, immigrants who acquire language proficiency may
35 It is, however, not clear that the hypothetical assimilation profile of immigrants had no return migration taken place isthe interesting policy parameter. If the interest in wage profiles of immigrants is driven by their potential contributionsto the economy and the tax and benefit system, what matters are those immigrants who remain in the host country.
36 English may be an exception, with the acquisition of English being an important reason for a migration in the firstplace. It is not surprising in this context that the most popular destination countries for tertiary education areEnglish-speaking countries: the United Kingdom and the United States (see Table 4.6).
370 Christian Dustmann and Albrecht Glitz
be positively selected, thus introducing a classical selection bias in estimations thatregress economic outcomes on language proficiency measures. Second, most availablelanguage measures are self-reported. This introduces two types of measurement error:(1) a classical measurement error, due to the interviewer reporting with error and (2) asystematic measurement error, due to the fact that individuals have different “scales”on which they assess their own language skills: the same proficiency may be evaluatedas “poor” by one individual and as “good” by another individual. We will discussbelow attempts to address these problems after reviewing the literature and its mainfindings.
In much of the literature, the return to language proficiency is obtained by estimat-ing a standard earnings equation in which a measure of language skills is added as anadditional regressor (see, for instance, early work by Carliner (1981); McManus, Gould,and Welch (1983); Grenier (1984); Kossoudji (1988); Tainer (1988); Rivera-Batiz(1990, 1992); Chiswick (1991); Chiswick and Miller (1992, 1995); and Dustmann(1994b)). These studies rely on self-reported language information in survey question-naires, typically on either a 4-point or 5-point scale, and ignore the problems pointedout earlier. In all these papers, language proficiency is found to be strongly positivelyassociated with earnings in the host country. For instance, for a sample of illegal immi-grants in the United States, Chiswick (1991) estimates that immigrants who can readthe English language well or very well have earnings that are about 30% higher thanthose of immigrants with low English reading skills. He also finds that reading skillsdominate speaking skills and that the latter does not have an additional separate effecton earnings. For a more representative sample of adult foreign-born immigrants inthe United States, Chiswick and Miller (1992) report that English-language fluency isassociated with around 17% higher earnings. Dustmann (1994b) estimates that immi-grants in Germany who speak German well or very well earn about 7% more thanimmigrants who speak German on an intermediate level, badly, or not at all. Similarly,those who have good or very good German writing skills earn between 7.3% (males)and 15.3% (females) more than those with bad or no German writing skills.37
Language proficiency is also found to have a complementary effect on the transfer-ability of preimmigration human capital in the form of education and experience.Chiswick and Miller (2002, 2003) show that language skills enhance the return tohuman capital obtained before migration so that a migrant’s greater proficiency in thelanguages spoken in the host country enhances the effects on earnings of his or herpreimmigration schooling and labor market experience. These results hence supportthe hypothesis that language is an important complementary skill to other forms of
37 Additional studies show an earnings advantage associated with host country language fluency of 12% in Canada(Chiswick and Miller (1992)), 8% in Australia (Chiswick and Miller (1995)), and 12% in Israel (Chiswick (1998)and Chiswick and Repetto (2001)).
Migration and Education 371

human capital: if immigrants cannot conduct a conversation in the host countrylanguage, human capital acquired prior to immigration cannot be translated into higherearnings in the host country.
The importance of language as a factor to enhance the productivity of other formsof human capital is also demonstrated in studies that investigate the capacity of differentimmigrant communities in acquiring further human capital. Sanromá, Ramos, andSimón (2009) show that returns to schooling obtained in Spain are significantly higherfor immigrants from Latin America (4.4%), who speak Spanish, than for immigrantsfrom other less-developed countries such as those situated in Eastern Europe (3.6%).Beggs and Chapman (1988b) show that the return to schooling in the Australian labormarket in 1981 was 9.0% for the native-born, 8.4% for immigrants from English-speaking countries, and only 4.9% for immigrants from non-English-speaking countries.These findings are suggestive for language being important for the acquisition of furtherskills, although estimates may be compromised by selection, and do not isolate theeffect of language from other country of origin-specific factors that may be drivingthe differential returns to human capital.
Language proficiency is also a key factor in explaining the educational outcomes ofthe children of immigrants. Dustmann, Machin, and Schönberg (2010) show that thesingle most important factor explaining achievement gaps between children of immi-grants and natives in the United Kingdom is language spoken at home. In Section5.3.1, we will discuss the importance of language for children of foreign-born parentsin more detail.
As we discussed earlier, a key difficulty in determining the impact language has oneconomic outcomes is selection, likely leading to an upward bias in the return to lan-guage proficiency in straightforward earnings equations, and measurement error inself-reported language measures. Dustmann and van Soest (2001, 2002) were the firstto argue that measurement error may lead to a substantial downward bias in simpleOLS regressions, which possibly overcompensates the upward bias through selection.To illustrate the possible magnitude of the attenuation bias, they use repeated infor-mation on self-reported language proficiency from a panel of immigrants in Germany.Assuming that from year t to year t + 1, deterioration in language proficiency is notpossible, Dustmann and van Soest (2001) estimate that 85% of the within-individualvariance and at least 24% of the overall variance in language measures are due tounsystematic measurement error, in the sense that it varies unsystematically overtime. They discuss as a further difficulty of self-reported language information thatindividuals may have different scales of evaluation. In a cross section, these indivi-dual-specific scales cannot be distinguished from measurement error. However, withpanel data, and if differences in scales across individuals are constant over time, such adistinction is possible. Dustmann and van Soest (2001) develop an estimator thatseparates time-varying from time-persistent misclassification. Further, to address the
372 Christian Dustmann and Albrecht Glitz
endogeneity problem, they use parental education as an instrument for languageproficiency conditional on individuals’ education, noting that this is less problematicthan instrumenting individuals’ education with parental education. The findingsshow that overreporting language ability is more frequent than underreportingand that there is substantial time-persistent misclassification. According to theirresults, the return to a one standard deviation increase in true German language flu-ency decreases from 2.8 percentage points to 0.9 percentage points once unobservedheterogeneity is taken into account. However, controlling subsequently for bothtime-varying measurement error and time-persistent misclassification, the returnto German language fluency increases to approximately 7.3 percentage points. Thus,measurement error may lead to a large downward bias of the estimated return tolanguage proficiency that overcompensates any upward bias due to unobservedability.38
If repeated information on language ability is available, an alternative way to addressthe endogeneity problem is by conditioning on individual-specific effects (or estimatingdifference equations). However, the downward bias through measurement error in thelanguage variable will be greatly enhanced by such techniques. In most panel data setsthat contain repeated information on language ability, immigrant populations have beenresident for a large number of years, so that the noise-to-signal ratio is too large to allowestimation.39 Berman, Lang, and Siniver (2003) use repeated information on the lan-guage proficiency of male immigrants from the former Soviet Union, who moved toIsrael after 1989, focusing on the first few years after arrival in which typically the largestimprovements in language skills take place. They find large wage gains of language pro-ficiency for workers in high-skilled, but not low-skilled professions as well as evidencefor an upward ability bias in cross-sectional estimates, particularly for workers in low-skilled professions.
Bleakley and Chin (2004) present a further strategy to address the endogeneity pro-blem of language proficiency. Based on census cross sections, they devise an IV strategythat exploits the psychobiological phenomenon that young children tend to learn lan-guages more easily than adolescents and adults. Focusing on childhood immigrants, animmigrant’s age at arrival in the host country is therefore a strong predictor of his or herlanguage proficiency later in life. It can be used as a valid instrument once its effect onearnings through other channels than language is controlled for. Bleakley and Chin(2004) use immigrants from English-speaking countries as a control group to netout the effects of age at arrival that are not associated with language. Their findings
38 Dustmann and Fabbri (2003) find a similarly large downward bias due to measurement error for the United Kingdom,whereas Dustmann and van Soest (2004) compare parametric and semiparametric estimators to address measurementerror in language variables.
39 See Dustmann and van Soest (2002) for a discussion.
Migration and Education 373
show that OLS estimates of the returns to English language fluency in the United Statesare severely downward biased, which is unexpected if selection is the only problem.They explain this by the IV estimator possibly revealing a local average treatment effect,and by measurement error. Using data on language test results, they estimate thatattenuation bias due to measurement error may lead to a reduction of the estimatedcoefficient by one-half, which is similar in magnitude to the effects found by Dustmannand van Soest (2001).
One particular feature of language capital is that it is in most cases not transferable tothe country of origin. Thus, in the formulation of our model in Section 3.2, languagecapital should be sensitive to the duration individual immigrants would like to spend inthe country of destination. This hypothesis is analyzed by Dustmann (1999) who inves-tigates the impact of immigrants’ intended duration of stay on their language skills. Asmigration durations are endogenous in a language equation, he uses an indicator forwhether parents who are residing in the home country are still alive as an instrumentfor the planned migration duration. The findings show that an increase in the totalintended duration in Germany by 10 years is associated with a 5 percentage pointhigher probability of being fluent in German.
3.4.5 Downgrading and Ethnic NetworksThe low wages immigrants often receive upon arrival may be partly explained byinitial “downgrading,” possibly due to a lack of important complementary skills thatallow individuals to fully utilize their human capital in the host country’s labormarket. The stereotypical cab-driving physician vividly captures this phenomenon.Friedberg (2001) and Eckstein and Weiss (2004) study directly the type of jobs immi-grant workers perform after arrival using data for Israel. They find substantial occupa-tional downgrading of Russian immigrants who arrived in Israel in the 1990s.Although these immigrants worked in Russia predominantly as engineers, managers,physicians, and teachers, their most important occupations in Israel turned out to beoccupations such as service workers, locksmiths/welders, and housemaids. However,over time, particularly highly educated immigrants climb up the occupational ladder.Eckstein and Weiss (2004) show that the proportion of highly educated immigrantsworking in high-paid professional occupations increases from about 30% at arrivalto about 70% 20 years later, compared with an increase from 60 to 80% for equallyeducated natives over the same time interval. Overall, around 17% of immigrants’wage growth in the first 10 years after arrival in Israel can be attributed to occupa-tional transitions. Mattoo, Neagu, and Özden (2008) provide similar evidence of“underplacement” of immigrants in the US labor market, where in particular skilledimmigrants from countries with lower expenditures on tertiary education andnon-English languages of instruction, such as Latin American or Eastern Europeancountries, tend to end up in unskilled jobs.
374 Christian Dustmann and Albrecht Glitz
An important consequence of this occupational downgrading is that an allocation ofimmigrants to particular skill groups based on observed measurable skills such as theireducation—for example, in order to assess with which subgroup of the native work-force they are most likely to compete in the labor market—is likely to be highly inac-curate and not reflecting the true section of the labor market in which the immigrantsare active. Dustmann, Frattini, and Preston (2008) illustrate how, due to downgrading,an allocation of immigrants in the United Kingdom based on their observed educationlevels misrepresents their true position in the native wage distribution: although theseimmigrants are on average significantly better educated than natives, they earn wagesat the lower end of the native wage distribution in the United Kingdom.
Not only complementary skills (such as language) may be important for immi-grants to being able to fully utilize their human capital, but also the reduction in infor-mational deficiencies with respect to the host country’s labor market. Here ethnicnetworks may play an important role. Bartel (1989) and Jaeger (2007) demonstratethe tendency of immigrants to settle in areas where there are already established com-munities of their ethnic group. Chiswick and Miller (2005) show that living in aregion of the United States with a high linguistic concentration of the immigrant’smother tongue has a negative effect on the immigrant’s own English language skills,which in turn tends to reduce his or her earnings potential. This would speak againstethnic networks operating to the advantage of immigrants. However, straightforwardcorrelations of ethnic segregation and economic outcomes may be affected by a sort-ing problem. In two papers, Edin, Fredriksson, and Åslund (2003) and (Damm (2009))use random dispersal policies of refugee immigrants in Sweden and Denmark to inves-tigate the effects of living in enclaves on labor market outcomes. By using the ethnicconcentration in the initial assignment area (Edin et al. (2003)) and the past inflow ofassigned conationals (Damm (2009)) as an instrument, these authors convincinglyaddress the sorting problem. They find that living in an ethnic enclave has positiveeffects on wages and employment, in particular for workers who have low skill levels.Dustmann, Glitz, and Schönberg (2010) find similar evidence of a positive effect ofobtaining a job through an ethnicity-based network on wages and job stability inthe German context. This speaks in favor of networks as a mechanism to reduce infor-mational uncertainties.
3.4.6 Observed Postmigration Schooling Investment and Learning CentersMost of the assimilation literature discussed so far draws conclusions about the humancapital investment of immigrants after arrival in the host country indirectly from theobserved earnings patterns. A more direct approach, given suitable data, is to look atthe actual acquisition of additional education by immigrants and the factors that deter-mine it. Using data from the 1976 Survey of Income and Education (SIE) and the 1980US Census and focusing on the years of schooling obtained after migration and the
Migration and Education 375
enrolment status as dependent variables, Khan (1997) finds that the acquisition ofhuman capital of foreign-born adult men decreases with age at migration, and is higherfor refugee immigrants and those who are naturalized, and in states with low tuition feesand better quality of schooling. In the SIE data, she also finds that preimmigrationschooling up to the postbachelor professional level is a substitute for schooling in theUnited States, a finding in support of an earlier study of male Hispanic immigrants byBorjas (1982). In contrast, Chiswick and Miller (1994), who study adult immigrantsin Australia, find a positive effect of preimmigration schooling and occupational statuson postimmigration schooling, concluding that these are complementary.
As briefly pointed out in Section 3, one reason for immigration can be the acquisi-tion of human capital in a host country. This was a particular aspect of our model,which encompasses migration situations where the sole purpose of a migration is theacquisition of human capital that has a high value upon return to the home country(see Section 3.3.4 for details). This phenomenon is particularly pronounced in highereducation and in countries such as Australia, the United States, and the United Kingdom,which receive large numbers of foreign students to study at their universities (compareTable 4.6).40 In the United States, for example, foreign-born students (mostly from India,Taiwan, South Korea, and China) accounted for 31% of all PhD recipients in 2006, witheven higher shares in specific fields such as physical science (44%), engineering (59%), andeconomics (59%).41 Bound, Turner, and Walsh (2009) provide an excellent overview ofthe latest developments in the US context. In the United Kingdom, foreign studentsaccount for 42% of all PhD recipients and 55% of all recipients of a Master’s degree in2007/2008.42 Many students who acquire doctoral degrees stay on after completing theirstudies. Finn (2007), for example, estimates that about 58 (71)% of foreign citizens whoreceived a PhD in science or engineering from a US university in 1991 (1999) are stillliving in the United States in 2001.
4. THE EFFECT OF MIGRATION ON THE SKILL BASE ANDEDUCATIONAL ATTAINMENT OF NONMIGRANTS
In the previous section, we discuss the relationship between education and migrationfrom the perspective of the migrant. In this section, we address the issue from the per-spective of those who have chosen not to migrate both in the origin and in the destina-tion country. Our focus will be on the consequences of migration for the skill base andthe acquisition of education in the two countries. Migration can affect the skill base of
40 This type of immigration is institutionalized in many host countries by issuing specific visas created explicitly to permittemporary study (e.g., the F-1 visa in the United States or the Student Visas in the United Kingdom).
41 Source: National Science Foundation: Science and Engineering Doctorate Awards 2006. Own calculations. Foreignstudents are defined as non-US citizens with temporary visa.
42 Source: Higher Education Statistics Agency. Foreign students are identified as those with non-UK domicile.
376 Christian Dustmann and Albrecht Glitz
the origin country directly, by changing the skill composition and the talent base.Here the question of selection—who migrates—becomes important. Migration can alsoaffect the skill base of the origin country indirectly by generating incentives to invest inlearning and skill acquisition. In the destination country, besides the direct effect becauseof the inflow of immigrants, migration may change the skill base through responses of thenative population, by creating incentives for additional skill accumulation, or for specializ-ing in particular skills where natives have a comparative advantage. Migration can alsocreate spillover effects, for example, through complementarity of the migrant populationwith the existing populations. In this section, we will discuss some of these aspects.
We start with reinvestigating one of the key questions in the literature on migration,which has important consequences for the issues we raise here: Who migrates? In an earlypaper, Borjas (1987) uses the Roy (1951) model to relate the skills and abilities of immi-grants to the distribution of wages and earnings in the host and home country. His ana-lysis provides deep insights and has been empirically tested in a number of subsequentpapers. However, many of these papers have focused on a particular case of Roy’s model,where skills are one-dimensional. Here we will reexamine the original Roy model andexplore more closely the implications of multidimensionality in skills. We believe thatin the context of migration, this will provide much additional insight.
4.1. The Selection of MigrantsWe will start with addressing the question of who migrates. In Section 3, we discuss theincentives to emigrate from the perspective of the potential migrant and show that thesedepend—among others—on the capacity of the individual to produce knowledge,which we termed “ability.” The optimal migration plan—in the simplest setting wherethe return to human capital is higher in the host country—usually provides highermigration incentives to those who have a lower cost of human capital production: thosewith higher ability. In those considerations, we only looked at the migration decision ofa single individual, the “average” individual. We did not compare this individual toother individuals in the origin or destination country by characterizing a distributionof skills. Further, we thought about “skills” as a one-dimensional concept—an indivi-dual who has more skills is more productive in both countries.
In this section, we give up this assumption by introducing multiple skills, which—added up and weighted by skill prices that may differ across the two countries—determinethe productive capacity, or human capital, of an individual in a particular country. Weargue that viewing skills as a multidimensional concept, with different prices in differentcountries, is particularly sensible in the context of migration. We investigate the selectionof individuals along the distribution of these skills and state the conditions for positiveand negative selection.
Our considerations are based on the Roy (1951) model that we will formalize as amultiple-skill model (concentrating on the special case of two skills), and in which we
Migration and Education 377
allow for the possibility that one skill has a higher price in one country, whereas theother skill has a higher price in the other country.43 This generates the possibility of“nonhierarchical sorting” (to use the terminology of Willis (1987)), in which thosewho are most productive in the host country migrate and those who are most produc-tive in the home country do not migrate.44 We will develop this aspect of the Roymodel which, as we believe, has not received sufficient attention in the migration con-text. In our view, thinking about migration as a decision that considers the prices formultiple skills is appropriate in a world where diversely structured national economiestrade their comparative and absolute advantages on globalized markets. We show thatsome of the observedmigration patterns that seem not compatible with the one-dimensionalskill version of the Roy model can be accommodated by a multidimensional skill model.Drawing on Dustmann, Fadlon, and Weiss (2010), we then show how the basic staticRoy model can be extended to a dynamic Roy model by allowing for learning of skillsin the two countries so that each country is characterized not only by prices for skills butalso by learning opportunities.
4.1.1 A Multiple-Skill Model of Migrant SelectionConsider two countries, an origin country (O) and a destination country (D). Further,suppose individuals have two latent skills, S1 and S2 (this can be easily generalized tomore skills). We will here refer to these skills as “analytical skills” (S1) and “manual”or “trade” skills (S2). Suppose the two countries have different technologies and indus-try structures. Thus, we can think about the two countries rewarding the two skills dif-ferently according to the two equations:
YDi = ln yDi = μD + bD1S1i + bD2S2i = μD + uDi ð4:9aÞ
YOi = ln yOi = μO + bO1S1i + bO2S2i = μO + uOi: ð4:9bÞ
In Eqs (4.9a) and (4.9b), bj1 and bj2 represent the prices for the two skills in country j,j=O, D. Notice that this setup allows for many interesting combinations. For instance,
43 The Roy model goes back to a paper by Andrew D. Roy published in the Oxford Economic Papers in 1951. In thispaper, Roy develops the implications of multidimensional abilities for occupational choice, the structure of wages, andthe earnings distributions. The model has in later years been formalized and developed further (see, e.g., Heckmanand Honoré (1990); Willis and Rosen (1979); and Willis (1987)).
44 Borjas does, in principle, consider this case, which he terms “refugee sorting,” but he does not develop its implicationsin much detail. Most of the literature (e.g., Chiquiar and Hanson (2005); Orrenius and Zavodny (2005); McKenzieand Rapoport (2007); Ibarrarán and Lubotsky (2007); Belot and Hatton (2008); Fernández-Huertas Moraga (2010);and Kaestner and Malamud (2010)) considers a special case of the Roy model, where skills are one-dimensional,which leads to hierarchical sorting. A very interesting and insightful extension is provided by Gould and Moav(2010) who distinguish between observable skills (such as education) and unobservable skills. Bertoli (2010) considersthe case in which there is uncertainty about the earnings potential in the destination country, showing that suchuncertainty leads to negative selection becoming more likely.
378 Christian Dustmann and Albrecht Glitz
if countries specialize in particular industries and exchange goods in global markets, then inone country the price for skill 1 may be high and the price for skill 2 low, whereas in theother country the price for skill 2 may be high and that of skill 1 low. If both countries areequipped with the same distribution of skills, migration in both directions may create amore efficient skill allocation.
To compare this with the notation used in much of the literature (e.g., Borjas (1987)),we combine the weighted skills to two measures uD = lnKD = bD1S1 + bD2S2 anduO = lnKO = bO1S1 + bO2S2, where Kj is the productive capacity of a person if he or sheworks in country j. Therefore, we can characterize every worker by either a pair of latentskills (S1 and S2) or a pair of productive capacities in the two countries (KD and KO).
We can think of μj as the log of the rental rate to human capital in country j so thatyj = eYj =RjKj, with μj = lnRj. The rental rate of human capital in the country of des-tination, D, for example, could be persistently higher if it had a superior technology andif it regulated the inflow of immigrants so that only some of those who wish to enterare allowed in.
We assume that both countries have identical distributions of the two skills S1 andS2 before migration and that these distributions are normal and independent withmean zero and variance 1: Sk �N(0,1).45 It then follows that the random variablesYD and YO are likewise normally distributed, with means μD and μO and variancesand covariance.46
VarðYDÞ=VarðuDÞ= σ2D = b2D1 + b2D2; VarðYOÞ=VarðuOÞ= σ2O = b2O1 + b2O2 ð4:10aÞ
CovðYD,YOÞ=CovðuD,uOÞ= σDO = bD1bO1 + bD2bO2: ð4:10bÞWe define σ2 =VarðuD − uOÞ= σ2D + σ2O − 2σDO = b2D1 + b2D2 + b2O1 + b2O2 − 2bD1bO1 −
2bD2bO2, which is the variance of the difference in the log of productive capacity betweencountry D and country O. Further, let u= ðuD − uOÞ/σ and z= ðμO + k− μDÞ/σ, wherek are migration costs (in time-equivalent units). Also, let
σDU =CovðuD,uÞ= ðσ2D − σDOÞ�σ = ½bD1ðbD1 − bO1Þ+ bD2ðbD2 − bO2Þ�
�σ ð4:11aÞ
and
σOU =CovðuO,uÞ= ðσDO − σ2OÞ�σ = ½bO1ðbD1 − bO1Þ+ bO2ðbD2 − bO2Þ�
�σ: ð4:11bÞ
These covariances are the weighted sums of the differences in skill prices betweenhost and home country, where the weights are the skill prices for the host and homecountry, normalized by σ. Notice that σDU = σOU + σ so that σDU − σOU > 0:
45 The latter assumption simplifies notation but can easily be relaxed.46 Notice that productive capacities are correlated, although we assume that the skills S1 and S2 are independent.
Migration and Education 379
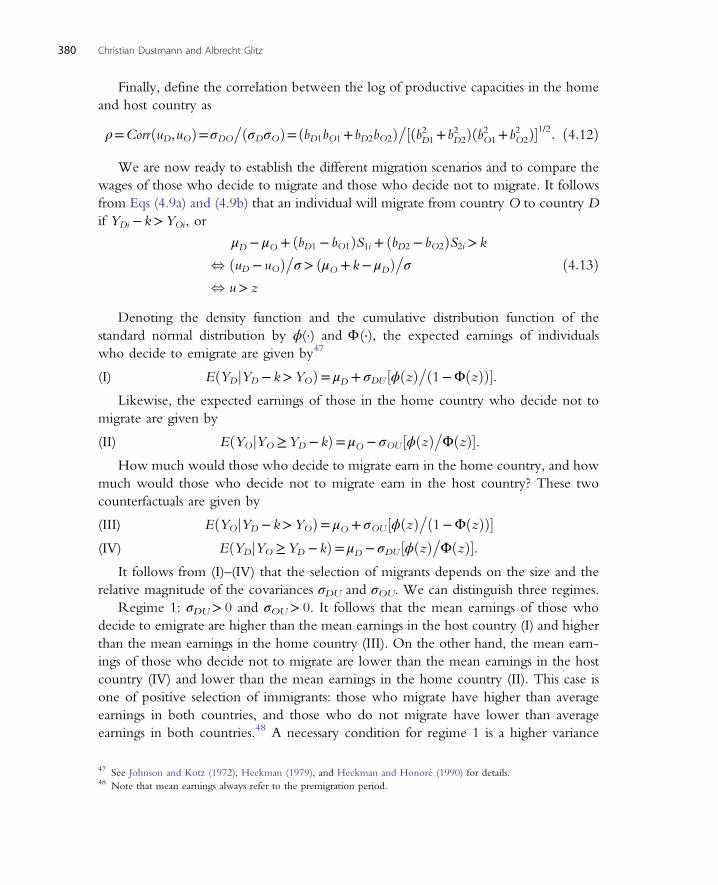
Finally, define the correlation between the log of productive capacities in the homeand host country as
ρ=CorrðuD,uOÞ=σDO
�ðσDσOÞ=ðbD1bO1+bD2bO2Þ�½ðb2D1+b2D2Þðb2O1+b2O2Þ�1/2: ð4:12Þ
We are now ready to establish the different migration scenarios and to compare thewages of those who decide to migrate and those who decide not to migrate. It followsfrom Eqs (4.9a) and (4.9b) that an individual will migrate from country O to country Dif YDi − k>YOi, or
μD − μO + ðbD1 − bO1ÞS1i + ðbD2 − bO2ÞS2i > k
, ðuD − uOÞ�σ > ðμO + k− μDÞ
�σ
, u> z
ð4:13Þ
Denoting the density function and the cumulative distribution function of thestandard normal distribution by ϕ(⋅) and Φ(⋅), the expected earnings of individualswho decide to emigrate are given by47
(I) EðYDjYD − k>YOÞ= μD + σDU ½ϕðzÞ�ð1−ΦðzÞÞ�.
Likewise, the expected earnings of those in the home country who decide not tomigrate are given by
(II) EðYOjYO ≥YD − kÞ= μO − σOU ½ϕðzÞ�ΦðzÞ�.
How much would those who decide to migrate earn in the home country, and howmuch would those who decide not to migrate earn in the host country? These twocounterfactuals are given by
(III) EðYOjYD − k>YOÞ= μO + σOU ½ϕðzÞ�ð1−ΦðzÞÞ�
(IV) EðYDjYO ≥YD − kÞ= μD − σDU ½ϕðzÞ�ΦðzÞ�.
It follows from (I)–(IV) that the selection of migrants depends on the size and therelative magnitude of the covariances σDU and σOU. We can distinguish three regimes.
Regime 1: σDU> 0 and σOU> 0. It follows that the mean earnings of those whodecide to emigrate are higher than the mean earnings in the host country (I) and higherthan the mean earnings in the home country (III). On the other hand, the mean earn-ings of those who decide not to migrate are lower than the mean earnings in the hostcountry (IV) and lower than the mean earnings in the home country (II). This case isone of positive selection of immigrants: those who migrate have higher than averageearnings in both countries, and those who do not migrate have lower than averageearnings in both countries.48 A necessary condition for regime 1 is a higher variance
47 See Johnson and Kotz (1972), Heckman (1979), and Heckman and Honoré (1990) for details.48 Note that mean earnings always refer to the premigration period.
380 Christian Dustmann and Albrecht Glitz
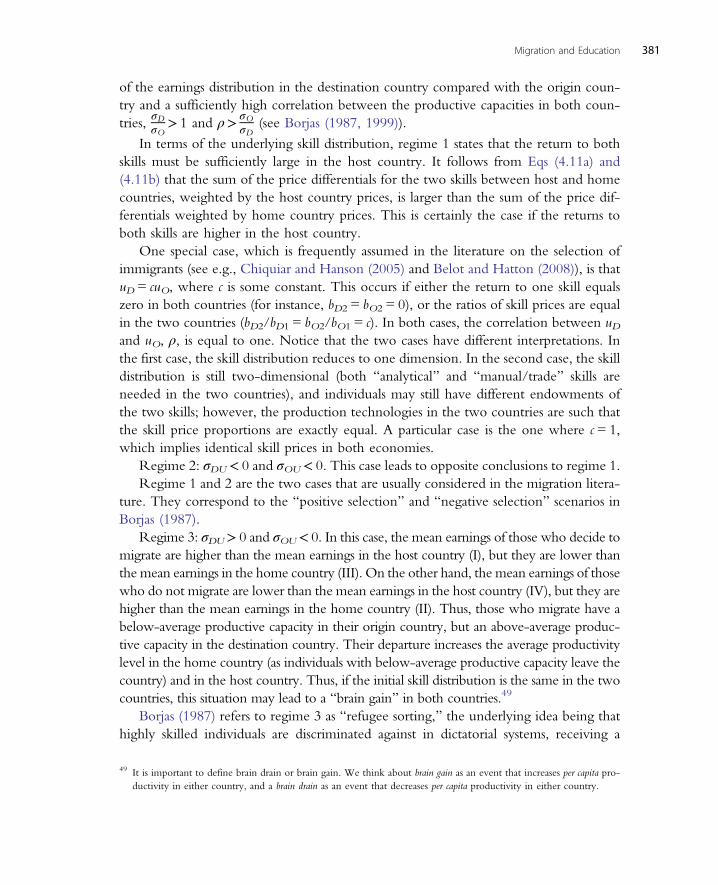
of the earnings distribution in the destination country compared with the origin coun-try and a sufficiently high correlation between the productive capacities in both coun-tries, σDσO > 1 and ρ> σO
σD(see Borjas (1987, 1999)).
In terms of the underlying skill distribution, regime 1 states that the return to bothskills must be sufficiently large in the host country. It follows from Eqs (4.11a) and(4.11b) that the sum of the price differentials for the two skills between host and homecountries, weighted by the host country prices, is larger than the sum of the price dif-ferentials weighted by home country prices. This is certainly the case if the returns toboth skills are higher in the host country.
One special case, which is frequently assumed in the literature on the selection ofimmigrants (see e.g., Chiquiar and Hanson (2005) and Belot and Hatton (2008)), is thatuD= cuO, where c is some constant. This occurs if either the return to one skill equalszero in both countries (for instance, bD2 = bO2 = 0), or the ratios of skill prices are equalin the two countries (bD2/bD1 = bO2/bO1 = c). In both cases, the correlation between uDand uO, ρ, is equal to one. Notice that the two cases have different interpretations. Inthe first case, the skill distribution reduces to one dimension. In the second case, the skilldistribution is still two-dimensional (both “analytical” and “manual/trade” skills areneeded in the two countries), and individuals may still have different endowments ofthe two skills; however, the production technologies in the two countries are such thatthe skill price proportions are exactly equal. A particular case is the one where c= 1,which implies identical skill prices in both economies.
Regime 2: σDU< 0 and σOU< 0. This case leads to opposite conclusions to regime 1.Regime 1 and 2 are the two cases that are usually considered in the migration litera-
ture. They correspond to the “positive selection” and “negative selection” scenarios inBorjas (1987).
Regime 3: σDU> 0 and σOU< 0. In this case, the mean earnings of those who decide tomigrate are higher than the mean earnings in the host country (I), but they are lower thanthe mean earnings in the home country (III). On the other hand, the mean earnings of thosewho do not migrate are lower than the mean earnings in the host country (IV), but they arehigher than the mean earnings in the home country (II). Thus, those who migrate have abelow-average productive capacity in their origin country, but an above-average produc-tive capacity in the destination country. Their departure increases the average productivitylevel in the home country (as individuals with below-average productive capacity leave thecountry) and in the host country. Thus, if the initial skill distribution is the same in the twocountries, this situation may lead to a “brain gain” in both countries.49
Borjas (1987) refers to regime 3 as “refugee sorting,” the underlying idea being thathighly skilled individuals are discriminated against in dictatorial systems, receiving a
49 It is important to define brain drain or brain gain. We think about brain gain as an event that increases per capita pro-ductivity in either country, and a brain drain as an event that decreases per capita productivity in either country.
Migration and Education 381
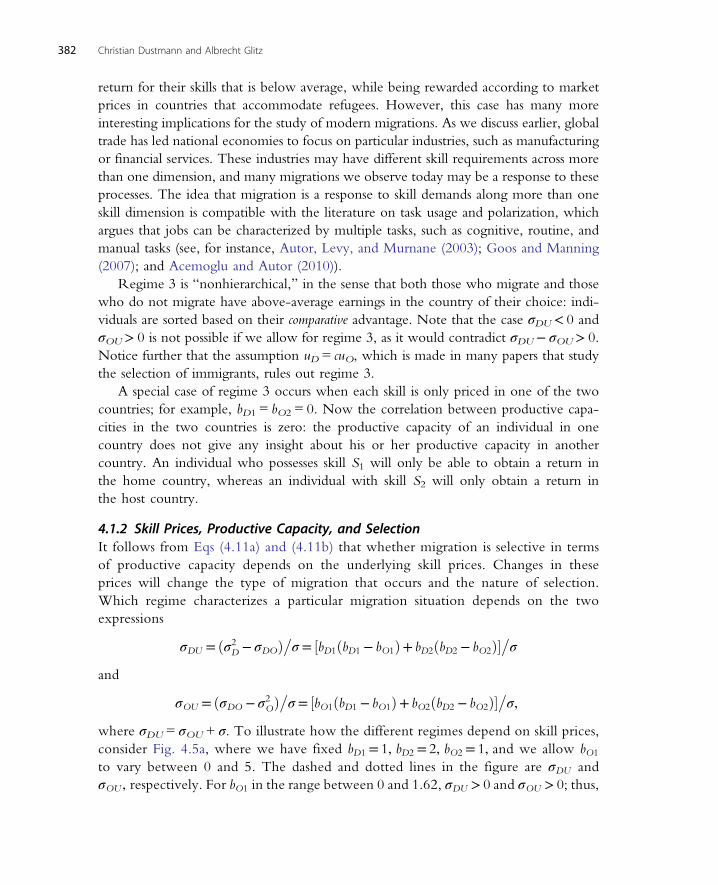
return for their skills that is below average, while being rewarded according to marketprices in countries that accommodate refugees. However, this case has many moreinteresting implications for the study of modern migrations. As we discuss earlier, globaltrade has led national economies to focus on particular industries, such as manufacturingor financial services. These industries may have different skill requirements across morethan one dimension, and many migrations we observe today may be a response to theseprocesses. The idea that migration is a response to skill demands along more than oneskill dimension is compatible with the literature on task usage and polarization, whichargues that jobs can be characterized by multiple tasks, such as cognitive, routine, andmanual tasks (see, for instance, Autor, Levy, and Murnane (2003); Goos and Manning(2007); and Acemoglu and Autor (2010)).
Regime 3 is “nonhierarchical,” in the sense that both those who migrate and thosewho do not migrate have above-average earnings in the country of their choice: indi-viduals are sorted based on their comparative advantage. Note that the case σDU< 0 andσOU> 0 is not possible if we allow for regime 3, as it would contradict σDU− σOU> 0.Notice further that the assumption uD= cuO, which is made in many papers that studythe selection of immigrants, rules out regime 3.
A special case of regime 3 occurs when each skill is only priced in one of the twocountries; for example, bD1 = bO2 = 0. Now the correlation between productive capa-cities in the two countries is zero: the productive capacity of an individual in onecountry does not give any insight about his or her productive capacity in anothercountry. An individual who possesses skill S1 will only be able to obtain a return inthe home country, whereas an individual with skill S2 will only obtain a return inthe host country.
4.1.2 Skill Prices, Productive Capacity, and SelectionIt follows from Eqs (4.11a) and (4.11b) that whether migration is selective in termsof productive capacity depends on the underlying skill prices. Changes in theseprices will change the type of migration that occurs and the nature of selection.Which regime characterizes a particular migration situation depends on the twoexpressions
σDU = ðσ2D − σDOÞ�σ = ½bD1ðbD1 − bO1Þ+ bD2ðbD2 − bO2Þ�
�σ
and
σOU = ðσDO − σ2OÞ�σ = ½bO1ðbD1 − bO1Þ+ bO2ðbD2 − bO2Þ�
�σ,
where σDU = σOU + σ. To illustrate how the different regimes depend on skill prices,consider Fig. 4.5a, where we have fixed bD1 = 1, bD2 = 2, bO2 = 1, and we allow bO1
to vary between 0 and 5. The dashed and dotted lines in the figure are σDU andσOU , respectively. For bO1 in the range between 0 and 1.62, σDU > 0 and σOU > 0; thus,
382 Christian Dustmann and Albrecht Glitz
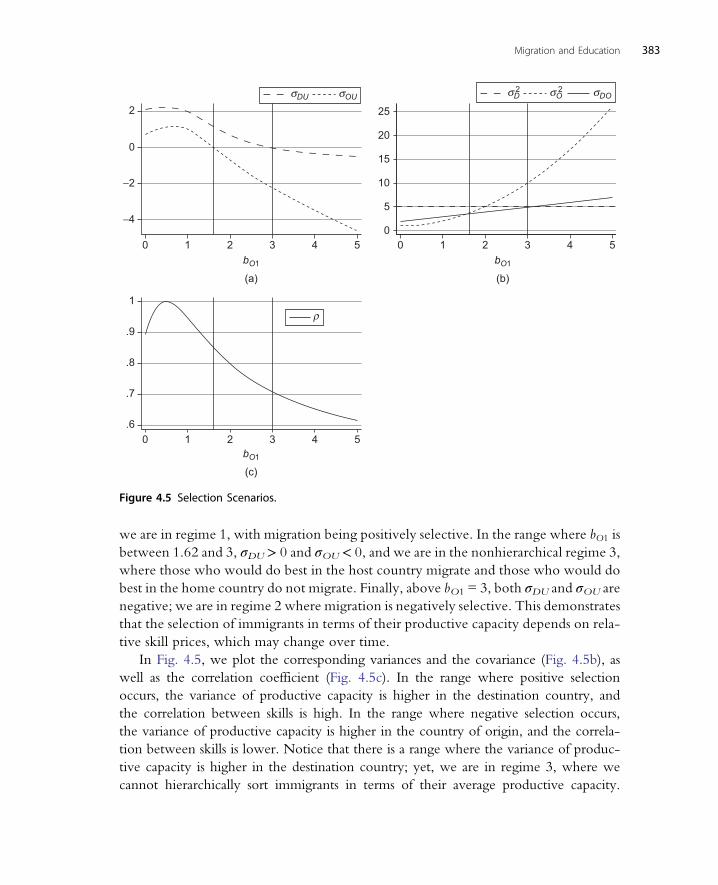
we are in regime 1, with migration being positively selective. In the range where bO1 isbetween 1.62 and 3, σDU > 0 and σOU < 0, and we are in the nonhierarchical regime 3,where those who would do best in the host country migrate and those who would dobest in the home country do not migrate. Finally, above bO1 = 3, both σDU and σOU arenegative; we are in regime 2 where migration is negatively selective. This demonstratesthat the selection of immigrants in terms of their productive capacity depends on rela-tive skill prices, which may change over time.
In Fig. 4.5, we plot the corresponding variances and the covariance (Fig. 4.5b), aswell as the correlation coefficient (Fig. 4.5c). In the range where positive selectionoccurs, the variance of productive capacity is higher in the destination country, andthe correlation between skills is high. In the range where negative selection occurs,the variance of productive capacity is higher in the country of origin, and the correla-tion between skills is lower. Notice that there is a range where the variance of produc-tive capacity is higher in the destination country; yet, we are in regime 3, where wecannot hierarchically sort immigrants in terms of their average productive capacity.
−4
−2
0
2
0 1 2 3 4 50
5
10
15
20
25
0 1 2 3 4 5
.6
.7
.8
.9
1
0 1 2 3 4 5
(a)
bO1
(c)
bO1
(b)
bO1
ρ
σOUσDU σDOσD2 σO
2
Figure 4.5 Selection Scenarios.
Migration and Education 383
The migration decision of an individual migrant is based on a comparison of individualearnings in the home and host country. Using Eqs (4.9a), (4.9b), and (4.13), an indivi-dual will emigrate if YD − k>YO, or
S2 >μO − μD + kbD2 − bO2
− bD1 − bO1
bD2 − bO2S1:
4.1.3 Explaining Different Selection PatternsThere is by now a large empirical literature that attempts to assess the direction ofmigrant selection. Most of the papers in this literature draw on Borjas (1987) as anunderlying theoretical framework, but consider the special case where uD = cuO.The evidence these papers establish is mixed. Some papers (including Borjas’ (1987)original analysis) find evidence that is compatible with the predictions of the simpleone-dimensional skill model, namely that selection is positive from country O tocountry D if skill prices are higher in country D, and that selection is negative if skillprices are lower in country D. Examples are Cobb-Clark (1993) or Ramos (1992),who find that, consistent with negative selection, nonmigrants in Puerto Rico aremore educated than individuals migrating from Puerto Rico to the United Statesand that those individuals migrating back from the United States to Puerto Rico aremore educated than those who remain in the United States. Others (e.g., Feliciano(2005), Orrenius and Zavodny (2005), McKenzie and Rapoport (2007), and Belotand Hatton (2008)) find limited or no evidence that is compatible with this simplemodel.
In an influential paper, Chiquiar and Hanson (2005) analyze migration from Mexicoto the United States. They argue that as the return to schooling is higher in Mexico,individuals with high levels of schooling are less likely to migrate. They compare actualwage densities for residents of Mexico with counterfactual wage densities that would beobtained were Mexican immigrants paid according to skill prices in Mexico, thuscomparing the conditional distributions whose means are given by (I) and (III). Thefindings suggest that, were Mexican immigrants in the United States paid accordingto Mexican skill prices, they would fall disproportionately in the middle and uppermiddle of Mexico’s wage distribution. As Chiquiar and Hanson (2005) point out, thisdoes not support negative selection, but rather suggests intermediate or moderatepositive selection of Mexican immigrants. This empirical finding is not compatible withthe original model they started off with, which is our model discussed earlier, butrestricted to the special case where uD= cuO. To reconcile the empirical evidence withthe model, they introduce nonlinear migration costs. They assume that costs are large,but decrease in schooling at a decreasing rate, so that the net advantage of migration ishighest for those in the middle of the distribution of skills. We reproduce their expla-natory graph in Fig. 4.6, which illustrates the case of constant migration costs (YD)
384 Christian Dustmann and Albrecht Glitz

and varying migration costs that are nonlinear in schooling ðY �DÞ.50 Note that skills are
one-dimensional and migration costs k in the latter case are equal to k= expðμπ − δπSÞ.The way we have drawn the figure for the constant migration cost case ðδπ = 0Þ impliesthat the rent on human capital is higher in the destination country (United States),μD > μO, but the return to skill S is higher in the origin country (Mexico). Thus, in thiscase, those with levels of skill S below S� will emigrate, but those with levels of skill Sabove S� will remain in Mexico—which is what Chiquiar and Hanson expected to findin the data. However, if δπ > 0 and if the fixed costs of migration are sufficiently high,those at the low end of the skill distribution, below level SL, may find it too costly toemigrate, whereas for those in the middle of the skill distribution, between level SL
and level SU , migration is advantageous. Chiquiar and Hanson conclude that suchnonlinear cost schedules may provide a possible explanation for the observed migrationpattern from Mexico to the United States.51
Nonlinear migration costs are one reason why the one-dimensional model may notfit the data. Another reason may be that the one-dimensional model is overly restrictiveand omits an important aspect of migration decisions. Our discussion in the previoussection has illustrated that migration decisions may be taken by considering the pricesof multiple skills in the home and potential host country. Clearly, education is a one-dimensional measure of skills, which may for instance reflect well the academic skillsof individuals but may measure less well manual and trade skills. If the latter are highlyvalued in the destination country and are more prevalent for individuals in the middle
SL S* SU
μD− eμπ
μo
YO= μO+ bOS
S
Y
Y*D= μD+ bDS − e(μπ −δπS)
YD= μD+ bDS − eμπ
Figure 4.6 Nonlinear Migration Costs.
50 The case of migration costs that are linear in schooling is straightforward in that it either leaves the overall selectionpattern unchanged or reverses it entirely, depending on the pace at which migration costs decrease with educationalattainment.
51 For a further discussion of how different assumptions regarding the migration costs affect predicted selection patterns—for example, whether migration costs are assumed to be fixed in time-equivalent units or in monetary units—seeRosenzweig (2007) and Hanson (2010).
Migration and Education 385

of the education distribution, then migration patterns like those illustrated by Chiquiarand Hanson (2005) can be explained without making specific assumptions about migra-tion costs, as the following example illustrates.
Consider the case where the skill distribution is two-dimensional. Suppose furtherthat the first skill (which we termed “analytical” skill) is strongly correlated with educa-tion, but the second skill (which we termed “manual” or “trade” skill) is more stronglypresent in individuals with intermediate years of education. A multidimensional educa-tion system like the German apprenticeship system could produce such patterns, withindividuals with intermediate levels of education having often gone through vocationaltraining in crafts and trades. In countries without well-developed vocational trainingschemes, those with intermediate years of education may still have specialized inmanual- or trade-related skills, as development of many of these skills requires some basiclevel of schooling. Measured education may reflect mainly skill S1, but not necessarilyskill S2.
For the case of Mexican–US migration, the manual- or trade-related skill dimen-sion, although probably not highly valued in Mexico (as these skills are in plentiful sup-ply), may command a relatively high price in the United States. This seems to becompatible with the occupational distribution of Mexican immigrant workers in theUnited States, with the three main occupations falling exactly into this category of skills:cooks (6.1% of workers), construction laborers (5.8%), and grounds maintenance work-ers (4.9%).52
In Table 4.10, we give a numerical example. We distinguish among three educationgroups, “low,” “medium,” and “high.” We have chosen the skill prices such that skill 1has a higher return in the origin country, and skill 2 has a higher return in the destinationcountry. Skill 1 increases with education but skill 2 is particularly high for those in themiddle of the education distribution, and less developed for those who are either loweducated or highly educated. For simplicity, suppose migration costs are zero and therental rate of human capital is identical in both countries and normalized to zero. The dif-ferentials between wages that can be obtained in the destination and the origin countryare reported in the last column of Table 4.10. Those who are low educated will not
Table 4.10 Example Intermediate Selection
S1 S2 bD1 bD2 bO1 bO2 YD(=bD1S1 + bD2S2) YO(=bO1S1 + bO2S2) YD-YO
Low 1 0.5 1 2 2 1 2 2.5 −0.5Medium 2 2.5 1 2 2 1 7 6.5 0.5High 3 2 1 2 2 1 7 8 −1
52 Figures calculated from the 2009 IPUMS CPS sample using all Mexican-born individuals in the United States whoare currently at work and aged above 16 years.
386 Christian Dustmann and Albrecht Glitz
migrate and are better off in their country of origin, whereas those with intermediatelevels of education will gain from migration, and those with high levels of education willagain lose. Thus, this scenario creates a migration situation where only those in the middleof the education distribution will want to emigrate.
The scenario corresponds to the empirical evidence of intermediate selectionprovided by Chiquiar and Hanson (2005) without introducing nonlinear migrationcost. This illustrates the capacity of the multidimensional Roy model to accommodatedifferent migration patterns that remain unexplained in a simple one-dimensional skillmodel.
To conclude, we believe that the full potential of the Roy model has not beenexplored in the migration context. The situation where individuals are characterizedby multiple skills, and where these skills are priced differently in different countries,is, in our view, important in an ever more globalized world economy where individualcountries specialize in particular industries.
4.2. Selection and Return MigrationThe framework above explains selection of immigrants but does not address returnmigration. Borjas and Bratsberg (1996) use the one-dimensional Roy model to explorethe selection of emigrants and those who return. We will briefly introduce the mainfeatures of their model and extend it below to a multidimensional skill model.
Using our notation, log earnings in the origin and destination country in theirmodel are given by YO= μO+ uO and YD= μD+ uD, respectively. They further assumethat uO= cuD. Thus, VarðuDÞ= 1, VarðuOÞ= c2, and CorrðuD,uOÞ= 1 so that the var-iance of earnings is higher in the host country when c< 1. They allow workers to havethree options: (1) to stay at home, (2) to migrate temporarily, or (3) to migrate perma-nently. A return migration may be optimal for the same reason we discuss in Section3.3.4: staying abroad for a period t increases human capital that is valuable at homeby an amount κ. Thus, earnings when emigrating and returning are given byYDO = tðμD + uDÞ+ ð1− tÞðμO + uO + κÞ. No migration will take place if YO >YD andYO >YDO; a permanent migration will take place when YD >YO and YD >YDO; andmigration and return migration will take place when YDO >YD and YDO >YO. Weillustrate the ensuing regimes in Fig. 4.7 for the case where c< 1 (which is the casewhere the variance of earnings—and the price of skills—is higher in the destinationcountry).
The figure shows the distribution of skills, where those with the lowest skills (belowthe threshold μO − μD − κð1− τÞ/τ) will decide not to emigrate, those with the highestskills (above the threshold μO − μD + κ) will decide to emigrate and remain perma-nently, and those between the two thresholds will decide to emigrate but return homeafter spending time t abroad. Thus, those who return have higher skills than those whohave not emigrated, but lower skills than those who decide to remain permanently.
Migration and Education 387
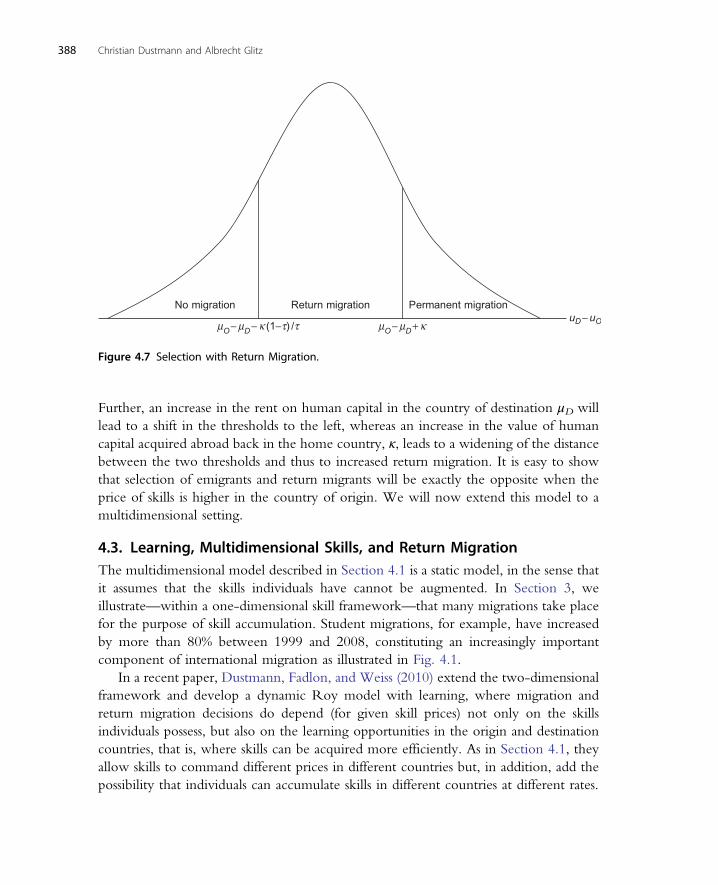
Further, an increase in the rent on human capital in the country of destination μD willlead to a shift in the thresholds to the left, whereas an increase in the value of humancapital acquired abroad back in the home country, κ, leads to a widening of the distancebetween the two thresholds and thus to increased return migration. It is easy to showthat selection of emigrants and return migrants will be exactly the opposite when theprice of skills is higher in the country of origin. We will now extend this model to amultidimensional setting.
4.3. Learning, Multidimensional Skills, and Return MigrationThe multidimensional model described in Section 4.1 is a static model, in the sense thatit assumes that the skills individuals have cannot be augmented. In Section 3, weillustrate—within a one-dimensional skill framework—that many migrations take placefor the purpose of skill accumulation. Student migrations, for example, have increasedby more than 80% between 1999 and 2008, constituting an increasingly importantcomponent of international migration as illustrated in Fig. 4.1.
In a recent paper, Dustmann, Fadlon, and Weiss (2010) extend the two-dimensionalframework and develop a dynamic Roy model with learning, where migration andreturn migration decisions do depend (for given skill prices) not only on the skillsindividuals possess, but also on the learning opportunities in the origin and destinationcountries, that is, where skills can be acquired more efficiently. As in Section 4.1, theyallow skills to command different prices in different countries but, in addition, add thepossibility that individuals can accumulate skills in different countries at different rates.
uD− uOμO− μD+ κμO− μD− κ (1−τ) /τ
Return migration Permanent migrationNo migration
Figure 4.7 Selection with Return Migration.
388 Christian Dustmann and Albrecht Glitz
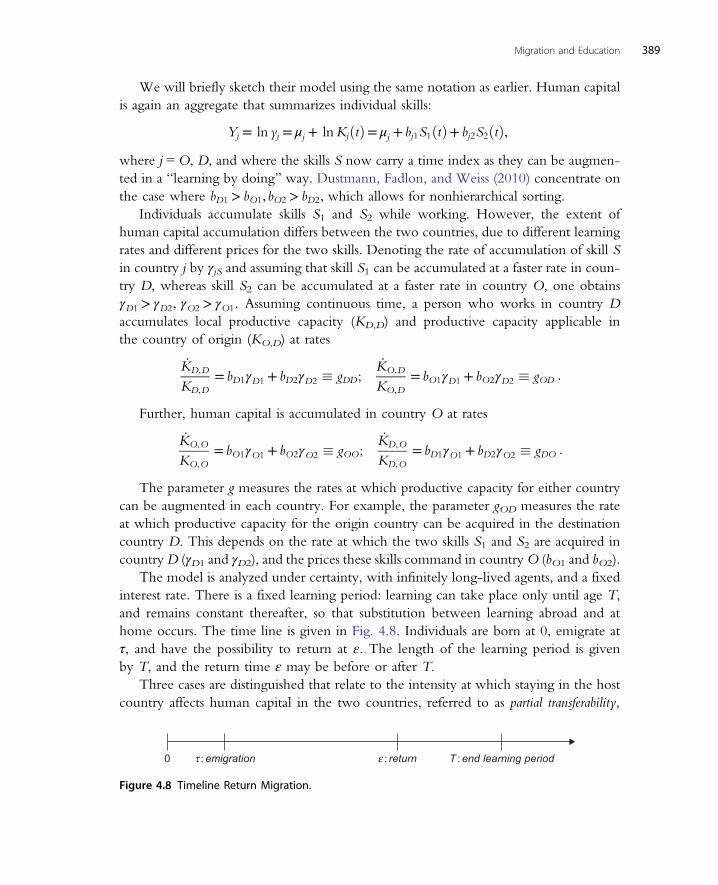
We will briefly sketch their model using the same notation as earlier. Human capitalis again an aggregate that summarizes individual skills:
Yj = ln yj = μj + lnKjðtÞ= μj + bj1S1ðtÞ+ bj2S2ðtÞ,where j =O, D, and where the skills S now carry a time index as they can be augmen-ted in a “learning by doing” way. Dustmann, Fadlon, and Weiss (2010) concentrate onthe case where bD1 > bO1,bO2 > bD2, which allows for nonhierarchical sorting.
Individuals accumulate skills S1 and S2 while working. However, the extent ofhuman capital accumulation differs between the two countries, due to different learningrates and different prices for the two skills. Denoting the rate of accumulation of skill Sin country j by γjS and assuming that skill S1 can be accumulated at a faster rate in coun-try D, whereas skill S2 can be accumulated at a faster rate in country O, one obtainsγD1 > γD2, γO2 > γO1. Assuming continuous time, a person who works in country Daccumulates local productive capacity (KD,D) and productive capacity applicable inthe country of origin (KO,D) at rates
_KD,D
KD,D= bD1γD1 + bD2γD2 � gDD;
_KO,D
KO,D= bO1γD1 + bO2γD2 � gOD :
Further, human capital is accumulated in country O at rates
_KO,O
KO,O= bO1γO1 + bO2γO2 � gOO;
_KD,O
KD,O= bD1γO1 + bD2γO2 � gDO :
The parameter g measures the rates at which productive capacity for either countrycan be augmented in each country. For example, the parameter gOD measures the rateat which productive capacity for the origin country can be acquired in the destinationcountry D. This depends on the rate at which the two skills S1 and S2 are acquired incountryD (γD1 and γD2), and the prices these skills command in countryO (bO1 and bO2).
The model is analyzed under certainty, with infinitely long-lived agents, and a fixedinterest rate. There is a fixed learning period: learning can take place only until age T,and remains constant thereafter, so that substitution between learning abroad and athome occurs. The time line is given in Fig. 4.8. Individuals are born at 0, emigrate atτ, and have the possibility to return at ε. The length of the learning period is givenby T, and the return time ε may be before or after T.
Three cases are distinguished that relate to the intensity at which staying in the hostcountry affects human capital in the two countries, referred to as partial transferability,
0 τ :emigration ε : return T :end learning period
Figure 4.8 Timeline Return Migration.
Migration and Education 389
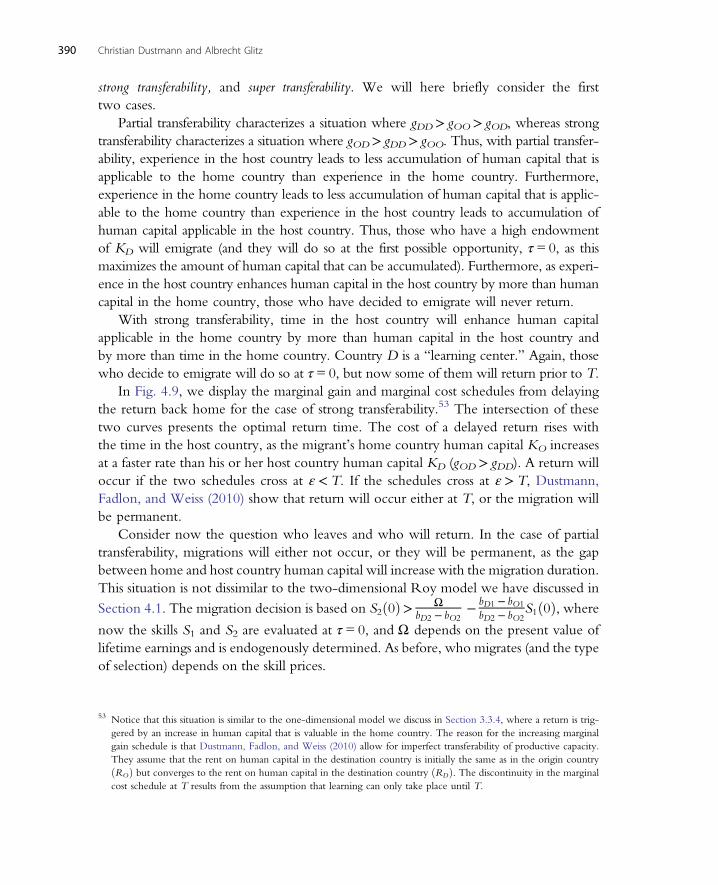
strong transferability, and super transferability. We will here briefly consider the firsttwo cases.
Partial transferability characterizes a situation where gDD> gOO> gOD, whereas strongtransferability characterizes a situation where gOD> gDD> gOO. Thus, with partial transfer-ability, experience in the host country leads to less accumulation of human capital that isapplicable to the home country than experience in the home country. Furthermore,experience in the home country leads to less accumulation of human capital that is applic-able to the home country than experience in the host country leads to accumulation ofhuman capital applicable in the host country. Thus, those who have a high endowmentof KD will emigrate (and they will do so at the first possible opportunity, τ= 0, as thismaximizes the amount of human capital that can be accumulated). Furthermore, as experi-ence in the host country enhances human capital in the host country by more than humancapital in the home country, those who have decided to emigrate will never return.
With strong transferability, time in the host country will enhance human capitalapplicable in the home country by more than human capital in the host country andby more than time in the home country. Country D is a “learning center.” Again, thosewho decide to emigrate will do so at τ= 0, but now some of them will return prior to T.
In Fig. 4.9, we display the marginal gain and marginal cost schedules from delayingthe return back home for the case of strong transferability.53 The intersection of thesetwo curves presents the optimal return time. The cost of a delayed return rises withthe time in the host country, as the migrant’s home country human capital KO increasesat a faster rate than his or her host country human capital KD (gOD> gDD). A return willoccur if the two schedules cross at ε< T. If the schedules cross at ε> T, Dustmann,Fadlon, and Weiss (2010) show that return will occur either at T, or the migration willbe permanent.
Consider now the question who leaves and who will return. In the case of partialtransferability, migrations will either not occur, or they will be permanent, as the gapbetween home and host country human capital will increase with the migration duration.This situation is not dissimilar to the two-dimensional Roy model we have discussed inSection 4.1. The migration decision is based on S2ð0Þ> Ω
bD2 − bO2− bD1 − bO1
bD2 − bO2S1ð0Þ, where
now the skills S1 and S2 are evaluated at τ= 0, and Ω depends on the present value oflifetime earnings and is endogenously determined. As before, who migrates (and the typeof selection) depends on the skill prices.
53 Notice that this situation is similar to the one-dimensional model we discuss in Section 3.3.4, where a return is trig-gered by an increase in human capital that is valuable in the home country. The reason for the increasing marginalgain schedule is that Dustmann, Fadlon, and Weiss (2010) allow for imperfect transferability of productive capacity.They assume that the rent on human capital in the destination country is initially the same as in the origin countryðROÞ but converges to the rent on human capital in the destination country ðRDÞ. The discontinuity in the marginalcost schedule at T results from the assumption that learning can only take place until T.
390 Christian Dustmann and Albrecht Glitz
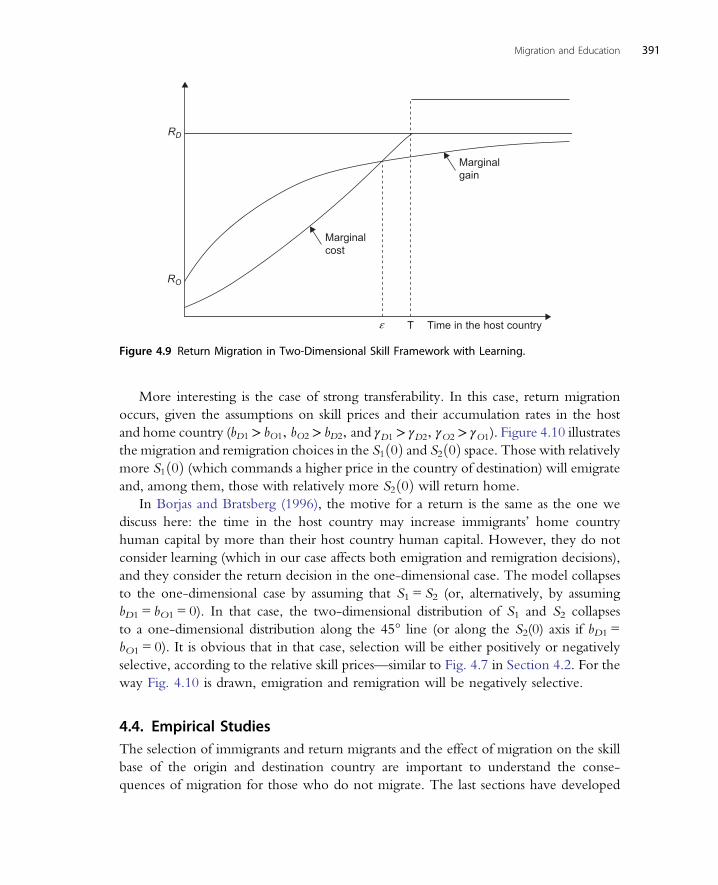
More interesting is the case of strong transferability. In this case, return migrationoccurs, given the assumptions on skill prices and their accumulation rates in the hostand home country (bD1 > bO1, bO2 > bD2, and γD1 > γD2, γO2 > γO1). Figure 4.10 illustratesthe migration and remigration choices in the S1ð0Þ and S2ð0Þ space. Those with relativelymore S1ð0Þ (which commands a higher price in the country of destination) will emigrateand, among them, those with relatively more S2ð0Þ will return home.
In Borjas and Bratsberg (1996), the motive for a return is the same as the one wediscuss here: the time in the host country may increase immigrants’ home countryhuman capital by more than their host country human capital. However, they do notconsider learning (which in our case affects both emigration and remigration decisions),and they consider the return decision in the one-dimensional case. The model collapsesto the one-dimensional case by assuming that S1 = S2 (or, alternatively, by assumingbD1 = bO1 = 0). In that case, the two-dimensional distribution of S1 and S2 collapsesto a one-dimensional distribution along the 45° line (or along the S2(0) axis if bD1 =bO1 = 0). It is obvious that in that case, selection will be either positively or negativelyselective, according to the relative skill prices—similar to Fig. 4.7 in Section 4.2. For theway Fig. 4.10 is drawn, emigration and remigration will be negatively selective.
4.4. Empirical StudiesThe selection of immigrants and return migrants and the effect of migration on the skillbase of the origin and destination country are important to understand the conse-quences of migration for those who do not migrate. The last sections have developed
T Time in the host country
Marginalcost
Marginalgain
RD
RO
ε
Figure 4.9 Return Migration in Two-Dimensional Skill Framework with Learning.
Migration and Education 391
a framework within which these processes can be understood and analyzed. We havealso discussed some empirical papers that try to assess the direction of selection, andwe have suggested some possibilities of how to think about selection in a multidimen-sional skill world.
In this section, we will discuss some of the empirical papers that study additionalways in which migrations affect nonmigrants and their skills and skill accumulation.Much of this work can be directly related to the theoretical models we discussed inthe previous sections.
4.4.1 Emigration and Human Capital Investment in the Sending CountryEmigration, or the possibility of emigration, may have important consequences for theskill accumulation in the origin country through several channels. First, emigrants mayredistribute some of the surplus they capture to family members back home by means ofremittances, which may then be used for educational investments that would otherwisenot have been possible due to a lack of available funds and credit constraints (for aformal model describing this mechanism, see Rapoport and Docquier (2006)). A num-ber of studies suggest that this is happening. Yang (2008), for instance, studies howsudden shocks in exchange rates due to the Asian financial crisis in 1997 affected childschooling and educational expenditures in the Philippines through their effect on remit-tances, taking advantage of the diverse set of host countries Filipino emigrants arelocated in. He finds positive effects on human capital accumulation in the origin house-holds. Similarly, Cox Edwards and Ureta (2003) and Acosta (2006) provide evidence
Move andreturn
Stay in home country
Move and stay abroad
5
4
3
2
1
1 43 520
S2(0
)
S1(0)
Figure 4.10 Selection in Two-Dimensional Skill Space with Learning.
392 Christian Dustmann and Albrecht Glitz

that remittances increase educational attainment of children in El Salvador, andLópez-Córdova (2005) shows that municipalities in Mexico that receive more remit-tances have higher literacy and school attendance rates among their 6- to 14-year-oldchildren.
Second, the possibility of a future migration may increase the incentives to invest infurther education. This point has first been made by Mountford (1997), and we haveillustrated the basic idea in Section 3.3.5: if the return to education is higher in a poten-tial destination country and if there is a positive probability of a future migration, thenthis will lead to a higher incentive to invest in human capital. Although higher returnsto education in the host country have a negative direct effect on the home country’sskill base by inducing skilled emigration, it encourages human capital formation inthe longer run. Mountford shows that this can potentially be beneficial for the countryof origin (“beneficial brain drain”), as long as the probability of an actual future emigra-tion is smaller than 1 (see also Stark, Helmenstein, and Prskawetz (1997); Vidal (1998);and Beine, Docquier, and Rapoport (2001)). Such uncertainty of migration couldresult, for example, from the unpredictability and restrictiveness of migration policiesin potential destination countries.
In a series of empirical studies, Beine, Docquier, and Rapoport (2001, 2008) andBeine, Defoort, and Docquier (2010) assess the possibility of a beneficial brain drainusing both cross-sectional and panel data for a large set of developing countries. Theirfindings provide some evidence that higher emigration rates may indeed have a positiveeffect on average human capital levels. For example, their work shows that in thosecountries that are characterized by low levels of human capital, low income and rela-tively low emigration rates of skilled workers (not exceeding 20–30%), the net effecton the average human capital level of the remaining population is positive, implyinga beneficial brain drain effect. Such a positive incentive effect of emigration on humancapital accumulation may be further reinforced in the presence of positive externalitiesof human capital in production (Stark and Wang (2002)) and perpetuated through theintergenerational transmission of human capital from one generation to the next. Schiff(2005) takes a more sceptical view regarding the likelihood and magnitude of a bene-ficial brain drain through the incentive effect of skilled emigration, a view supportedby empirical evidence provided by Lucas (2005) and Checchi, De Simone, and Faini(2007). These studies suggest that in many countries that experience emigration of theirskilled workers, the net effect on the average educational attainment of those remainingin the country is likely to be negative.54
54 This is more likely for those countries where skilled emigration rates are excessively high, such as many sub-SaharanAfrican and Central American countries where they often exceed 40%. See also Marchiori, Shen, and Docquier(2009) who come to this conclusion based on an overlapping-generations general equilibrium model.
Migration and Education 393
Third, selective emigration, as discussed in the previous section, may affect skillacquisition in the origin country by changing the existing skill base, which in turnaffects the return to education. For example, if emigrants are predominantly highskilled, then the reduction in the relative supply of high-skilled workers in the homecountry should lead to an increase in skilled workers’ wage rates. Mishra (2007)analyzes this relationship for the Mexican case. Following an empirical strategy first sug-gested by Borjas (2003), she finds that Mexican emigration to the United States has hada significant positive effect on Mexican wages, a conclusion supported by evidence pro-vided by Hanson (2007) and Aydemir and Borjas (2007). According to Mishra’s results,a 10% decrease of Mexican workers in a skill group (measured by education andexperience) due to emigration increases average wages in that group by 4%. Sinceemigrants are disproportionately drawn from the middle of the Mexican skill distribu-tion (high school graduates and those with some college education), wages of medium-educated workers in Mexico have increased the most as a result of emigration. Theresulting increase in the return to education may induce more individuals to invest inadditional schooling.
Lastly, as discussed by Dustmann, Fadlon, and Weiss (2010), emigration andreturn migration may lead to an increase in the productive human capital stock inthe sending country if a sufficiently large fraction of the migrations are temporaryand the returning migrants accumulate valuable human capital while being abroad.One channel through which human capital of return migrants may lead to economicgrowth in their home countries is through facilitating knowledge and technologyspillovers from the typically more advanced host countries. Domingues Dos Santosand Postel-Vinay (2004) derive the theoretical conditions required for such an overallpositive effect to occur.
Although each of the four channels presented may individually lead to a positiveeffect of migration on educational attainment in the origin country, there are alsocounteracting factors, likely to depend on the particularities of the considered migra-tion situation that tend to reduce educational attainment. For example, although thepositive income effect through remittances may well alleviate credit constraints andlead to higher investments in education, the absence of a parent, and in particularof a mother, is likely to negatively affect overall parental inputs into the children’sdevelopment. It may also force children to undertake additional household choresor other work to help maintaining the household. Cortés (2010), for instance, pro-vides evidence that children of migrant mothers in the Philippines are approximately10 percentage points more likely to be lagging behind in school compared withchildren of migrant fathers.
Also, the possibility of a future migration may create opposite incentive effects if thereturn to education in occupations potential emigrants consider as attainable is lower inthe destination country than in the origin country (this could be due to a high return to
394 Christian Dustmann and Albrecht Glitz
trade (manual) skills and low returns to academic skills), or if migration is seen as analternative to the acquisition of education. Due to these counteracting factors, the over-all effect of migration on human capital acquisition in the home country is a prioriambiguous. McKenzie and Rapoport (2010) empirically assess this net effect of migra-tion for the Mexican case based on data from the National Survey of DemographicDynamics using historical migration rates to instrument for current migration. Theirfindings show a significant negative effect of migration on school attendance and edu-cational attainment of 12- to 18-year-old boys and 16- to 18-year-old girls: living in amigrant household is estimated to lower the probability of completing high school by13% for males and 14% for females. These effects are somewhat mitigated for childrenfrom a poorer background, which is consistent with a more prominent role of creditconstraints in these households. Overall, most of the negative effect of migration oneducational attainment is due to young males migrating themselves rather than attend-ing school and young females dropping out of school to work at home.55 For a detaileddiscussion of this literature, including earlier work, see Commander, Kangasniemi, andWinters (2004) and Docquier and Rapoport (2009).
4.4.2 Immigration and Human Capital Investment in the Receiving CountryIn the last section, we considered the possible channels by which emigration can affectskill accumulation and education of those in the country of origin who do not emi-grate. We now turn to the destination country. Again, there are various channels bywhich immigration may affect the accumulation of skills and education. First—andsimilar to what we discussed in the previous section—immigration may affect the priceof skills by changing the relative factor supplies in the host country’s economy. Forexample, a large inflow of low-skilled immigrants could lead to a decrease in the rela-tive wages of low-skilled workers and an increase in the relative wages of high-skilledworkers. Most of the existing papers do not find large wage effects of immigration,although there is still a lot of controversy in the literature investigating this issue, whichincludes studies by Card (1990); Altonji and Card (1991); Butcher and Card (1991);Borjas, Freeman, and Katz (1997); Card (2001); Friedberg (2001); Borjas (2003);Dustmann, Fabbri, and Preston (2005); Manacorda, Manning, and Wadsworth (2011);Ottaviano and Peri (2011); Dustmann, Frattini, and Preston (2008); and Glitz (2011).56
In the simplest model of an economy with one sector and unskilled and skilledlabor, the effect of immigration depends on assumptions about the elasticity of capitalsupply and the share of skilled immigrants relative to the share of skilled workers in
55 See also De Brauw and Giles (2006) and Antman (2009) who similarly find a negative overall effect of migration oninvestments in education in China and Mexico, respectively, and Hanson and Woodruff (2003) who find a positiveeffect on the schooling of less-educated mothers’ teenage daughters in Mexico.
56 For a comprehensive overview of this literature, see Okkerse (2008).
Migration and Education 395

the native population. We have seen in Table 4.1 in Section 2 that this share differs sub-stantially across countries so that we cannot expect immigration to have the same effectsin different countries. If immigration is unskilled and affects skill prices by, for example,generating higher returns to education, then this may create incentives to invest in edu-cation. Findings for the United States by Jackson (2010) show that a 1% increase in rela-tively unskilled immigrant labor increases the rate of native college enrolment by0.33%. This crowd-in effect is driven primarily by natives aged 18–24 because of theirhigher sensitivity to the returns to college education relative to older natives. In a morespecific case, if immigrants are complementing labor supply of highly skilled women byproviding domestic services that are otherwise not available or considerably more costly,then this is likely to increase the return to higher education for women. Such immigra-tion should then lead to not only higher female labor supply (as shown by Cortés andTessada (2009); Cortés and Pan (2009); and Farré, González, and Ortega (2009)) butalso more human capital investment.
Second, immigration may create incentives for native-born workers to specialize inareas where they have a comparative advantage, for instance through their knowledgeof the host country language or of existing networks. Such specialization may wellimply the accumulation of additional skills. More generally, if immigrants and nativeshave different comparative advantages in the labor market, then immigration will leadto shifts in the skill distribution of the native workforce. For example, Peri and Sparber(2009) show that natives reallocate their task supply toward occupations that are morecommunication and language intensive when faced with an inflow of immigrants thatincreases the supply of manual and physical labor intensive occupations. Task specializa-tion also extends to the highly educated segment of the labor market, where immigrantswith a graduate degree tend to specialize in occupations demanding quantitative andanalytical skills, whereas native-born graduates specialize in occupations requiring inter-active and communicative skills (Peri and Sparber (2008)).
Third, immigrants may affect the human capital acquisition of natives through theirpresence in the educational system, both on the tertiary and prior levels. Borjas (2006a)finds that admitting foreign students to doctoral programs has a negative effect on theearnings of native doctoral recipients in the corresponding field. According to hisresults, a 10% increase in the supply of doctorates in a specific field reduces earningsof competing workers by 3–4%, half of which is due to a shift toward lower-paid post-doctoral appointments. He also finds some evidence of foreign students crowding outwhite native men (Borjas (2007)) which, although in line with earlier evidence pro-vided by Hoxby (1998), stands somewhat in contrast to other findings showing no sig-nificant crowd-out effect of native students (Jackson (2010)). Crowding-out of nativestudents has also been found at the secondary school level. Betts and Fairlie (2003)found evidence that for every four immigrants who arrive in public high schools, onenative student switches to a private school and that this “native flight” is particularly
396 Christian Dustmann and Albrecht Glitz
pronounced among white native students and in response to the arrival of non-English-speaking immigrant children. Gould, Lavy, and Paserman, (2009) show that the pres-ence of immigrants during elementary school has a negative long-term effect on theprobability of passing the high school matriculation exam in Israel, which enablesstudents to attend college. Neymotin (2009), on the other hand, provides evidence thatimmigration did not negatively affect the SAT scores of native high school students inCalifornia and Texas.
Finally, in a wider context, immigration may affect the stock of human capital in thehost country by its contribution to new innovations. For instance, Hunt and Gauthier-Loiselle (2010), using the 2003 National Survey of College Graduates, show that thelarge number of immigrants with science and engineering degrees in the United Statesadd significantly to the number of patents granted: a single percentage point increase inthe immigrant college graduates’ population accordingly leads to an increase in patentsper capita by 9–18%. Hunt (2010) and Kerr and Lincoln (2010) find complementaryevidence regarding immigrants’ contribution to general productivity-increasing activ-ities such as patenting, publishing, and company start-ups.
5. THE CHILDREN OF IMMIGRANTS
In the previous sections, we have considered the relationship among education, skillaccumulation, and migration. We focused on the way education interacts with migra-tion decisions and how migration affects skill accumulation and the skill base of thosepopulations who do not migrate. In this context, we have touched on the educationalachievements of the children of emigrants in the home countries and on the incentivesto invest in education for young people in the host countries as a result of immigration.In this section, we will focus explicitly on the children of immigrants in the countries ofdestination. We will study their educational achievements and ensuing labor marketoutcomes and relate these to their parent generation and their peers born to nativeparents.
The educational achievement of the children of immigrants is one of the key issuesin the immigration debate in many countries. Underachievement of immigrant childrenis often seen as a major factor for the long-term segregation of immigrant communities,and educational achievements of immigrant children in comparison to their native-bornpeers are considered an important indicator of successful immigration policy (see, e.g.,OECD (2006)). As Table 4.9 in Section 2 shows, the test score results for children witha migration background, based on the PISA data, are indeed on average below those ofchildren of native-born parents, although there is quite some variation across countries.This is in line with the limited set of findings for individual countries that are based onalternative standardized performance measures. For instance, Rampney, Dion, andDonahue (2009) show that the reading (mathematics) score gap in the National
Migration and Education 397
Assessment of Educational Progress (NAEP) between White and Hispanic studentsin the United States in 2008 was 9.2 (6.4)% for the 9-year-olds, 9.7 (7.9)% for the13-year-olds, and 8.8 (6.7)% for the 17-year-olds.
As Fig. 4.2 shows, educational achievement of immigrant children is related to theeducational achievement of their parents. This suggests that the relatively low achieve-ment of immigrant children in some countries is at least partly due to the lower educa-tional background of their parent generation and does not necessarily reflect the failureof the host society to educate second-generation immigrants. However, in the publicdebate, the comparison between children born to immigrants and native parents is oftenunconditional on parental characteristics—a comparison that seems not very meaningful.If the first generation of immigrants is less educated than the native population (which isthe case for a number of countries, see Section 2), then even a strong educationalprogress of immigrant children may still result in educational outcomes that are lowerthan those of natives. We will discuss this issue below.
How should we then think about the dynastic assimilation of immigrant commu-nities? What is it exactly that determines the educational outcomes of immigrant chil-dren? There are at least three factors that matter: First, as just argued, the educationalachievements of immigrant children are linked to their parental background. There isa large literature on the intergenerational transmission of human capital, for exampleBehrman and Taubman (1985); Solon (1992); Zimmermann (1992); Björklund andJäntti (1997); Corak and Heisz (1999); or Blanden, Goodman, Gregg, and Machin(2004), which shows that there is considerable intergenerational immobility acrossgenerations in a large number of outcomes.
Second, immigrant children may be differently affected by the institutional settingand support structures of the host countries’ education systems. Another large literaturein economics studies the different features of educational production and how it relatesto resources, institutions, and parental input (see, e.g., Todd and Wolpin (2003);Cunha, Heckman, Lochner, and Masterov (2006); or Hanushek and Woessmann(2008, 2010)). Even without differential access to these educational institutions acrosspopulations in the same country, the same resources may affect immigrant children’seducational outcomes in a different way than those of children born to native-bornparents—for example, due to complementary forms of knowledge that are not sufficientlyavailable in immigrant communities57—and prevent immigrants’ children from makingfull use of existing educational support structures.
Third, the social context in which immigrant children grow up is an important deter-minant of their educational outcomes. Borjas (1992, 1995a) was among the first toemphasize what he calls the effect of “ethnic capital” on the educational achievements
57 One of those is, for instance, language. Dustmann, Machin, and Schönberg (2010) illustrate that language is the keyfactor that holds children of ethnic minority background back in the first years of full-time education.
398 Christian Dustmann and Albrecht Glitz
of immigrant children. The ethnic context of immigrants shapes their own, and theirparents’ values and incentives. For instance, immigrant children who grow up in anethnic environment that is characterized by particular educational and occupational choicesare likely to make similar choices. Ethnic capital summarizes things, such as peer effects, rolemodels, and community ambitions, which may all be strongly related to immigrants’educational outcomes. This may reduce the overall educational attainment of second-generation immigrants, but it may also enhance it. A good example is the success ofsouth and south east Asian immigrant children that may be partly due to the high valueattached to education within their communities (which in turn may be related to theConfucian tradition, which emphasizes the importance of study). In the United Kingdom,for example, Chinese students, who at the beginning of their compulsory schooling at age6/7 start off with a 7.6% of a standard deviation lower English test score thanWhite Britishstudents, outperform their native counterparts by more than 50% of a standard deviation bythe time they reach age 15/16 (Dustmann, Machin, and Schönberg (2010)).
There are other important factors that relate to the educational achievement ofimmigrant children. Parental considerations that affect their own investment in learn-ing may also influence decisions about their children. For instance, we have seen thatin the case of temporary migrations, and if skills acquired in the host country are onlypartially transferable to the home country labor market, immigrants will invest less intheir human capital than they would in case of a permanent migration. In the sameway, it is not unlikely that parental decisions about the educational investments oftheir children are affected by where parents see their children’s future. For instance,if a migrant household intends to return to the home country, and if this plannedreturn migration is including the children, then this may induce parents to invest lessin their children’s education than they would do in the case of a permanent migra-tion. Dustmann (2008) has made this point and provides empirical evidence thatsupports this hypothesis.
As earlier, we will commence with a formal discussion, laying out some of the keyissues. We will then review and interpret the empirical evidence that exists to date.
5.1. Immigrants and Intergenerational MobilityThe empirical approach to study the relationship between outcomes of parents andoutcomes of children is to regress a permanent outcome measure of the child on a per-manent outcome measure of the parent by applying a Least Squares estimator to theregression equation
log y jit = α j + ρ j log y j
it−1 + ε jit , ð4:14Þ
where log y jit and log y j
it−1 are some permanent measures for outcomes (such as educa-tion, wealth, or earnings) of a child and parent, respectively, belonging to group j(which could be immigrants and their children, or natives and their children). For
Migration and Education 399
simplification, in what follows, we will refer to the outcome as “earnings.” Accordingto Eq. (4.14), the earnings of family i’s child is determined by family i’s parental earningsand other influences ε (which we will discuss further below). The parameter α j can bethought of as the average effect of these other influences on earnings, which can differbetween groups. Assuming that the variances of log y j
it and log y jit−1 are the same, ρ j is
the population correlation coefficient between log y jit and log y j
it−1. Assume that the ε jit
are iid distributed with mean zero and Varðlog y jitÞ=Varðlog y j
it−1Þ= σ2, jy , so that
estimation of Eq. (4.14) gives a consistent estimate of ρ j, ρ̂ j.58 The coefficient ρ j repre-sents the fraction of economic advantage (in terms of earnings, education, or wealth)that is on average transmitted across the generations. It is called the intergenerationalcorrelation coefficient or transmission parameter. A coefficient close to zero suggestshigh intergenerational mobility, whereas a coefficient close to one indicates lowmobility. The coefficient ð1− ρ jÞ is often referred to as the degree of regression tothe mean.
For immigrants, the study of intergenerational mobility has a particular significance.If first-generation immigrants are disadvantaged, in the sense that they are less welleducated or have lower earnings than the native population, then immigrant and nativepopulations may differ for many generations, depending on the magnitude of ρ.
To illustrate this point, consider Eq. (4.14) and index outcomes of immigrants andnatives by I and N, respectively. Further, allow the intergenerational transmission para-meter to differ between the two groups so that ρN= ρI + ζ. Then, the wage differentialbetween the two populations in generation t is given by
Eðlog yNt Þ−Eðlog yIt Þ=αN −αI + ρNðEðlog yNt−1Þ−Eðlog yIt−1ÞÞ+ ζEðlog yIt−1Þ: ð4:15ÞConsider the case where ζ = 0 (intergenerational transmission ρ is the same in the
two populations) and assume for simplicity that αN = αI . In this case, the native-immigrant gap in outcomes disappears from one generation to the next only ifρ= ρN = ρI = 0. If ρ= 1, the initial outcome differential will be fully transmitted tothe next generation. If ρ is smaller than 1, inequality between the two groups will falland assimilation across groups will take place, but not within one generation. Themagnitude of ρ determines the speed of convergence. For example, for ρ= 0.4, a20% average earnings disadvantage for immigrants in the parent generation translatesinto an 8% earnings disadvantage in their children’s generation. Now, suppose “otherinfluences” determining outcomes as captured by the parameter α differ across thetwo groups. If αN− αI> 0, the difference in outcomes in the next generation may evenbe larger than in the parent generation, despite regression to the mean, as indicatedby ρ< 1.
58 If the variance of log wages differs across the two generations, the OLS estimator ρ̂ measures ρσyt /σyt−1.
400 Christian Dustmann and Albrecht Glitz
Now, consider the case where ζ≠ 0: the intergenerational transmission parameterdiffers between the two groups. It follows from Eq. (4.15) that if ζ> 0. (i.e., inter-generational mobility in the advantaged groups, natives, is smaller than in the disadvan-taged group), outcome differentials in the next generation may even be larger thanthose in the previous generation despite regression to the mean in both groups. Thedegree of assimilation between the two groups across generations depends on theparameters ζ, ρN, and αN− αI.
In general, earnings of immigrants in the next generation will converge to the earn-ings of natives (in the sense of Eðlog yNt Þ−Eðlog yIt Þ<Eðlog yNt−1Þ−Eðlog yIt−1Þ) if
αN− αI
ð1− ρNÞEðlog yIt−1Þ+
1− ρN + ζð1− ρNÞ <
Eðlog yNt−1ÞEðlog yIt−1Þ
:
Thus, if mean log earnings of natives are larger than those of immigrants in generationt− 1, there will always be convergence as long as αN− αI= 0, ζ= 0 and ρN= ρI= ρ< 1.On the other hand, both a higher ζ (less intergenerational mobility of natives) and ahigher αN− αI (stronger effect of other influences on native earnings than on immigrantearnings) lead to slower convergence. For sufficiently high values of either of theseparameters, the difference in expected earnings between immigrants and natives in thenext generation could be larger than in the previous generation.
What is the interpretation of the parameters ρ and α, and how do they relate to anunderlying structural model and its parameters? This is what we will explore next. We willshow why these parameters are likely to differ between immigrants and natives and gen-erate different intergenerational correlation coefficients and intercepts and hence differentintergenerational persistence of outcomes for these groups. We will also demonstrate whythe assumption that εit is iid is unlikely to hold in reality, which may affect the actualestimation of the parameter ρ.
5.2. A Model of Intergenerational Mobility of ImmigrantsBecker and Tomes (1979) develop a theoretical model for the intergenerational trans-mission of wealth and human capital, and Solon (2004) provides a parameterizationthat derives an intergenerational transmission function of the type illustrated above.In the following, we will draw on Solon’s formulation, simplify, and adjust it toemphasize what we believe are some key insights for the study of educational attain-ments of the children of immigrants in comparison with natives. The model is a per-manent income model of intergenerational mobility with parental investments in thechild’s earnings potential. Consider a one-person household with one child, situatedin the host country. There are two periods. In the first period (period t− 1), the parenthas earnings equal to yt− 1 and the child is in full-time education. In the second period(period t), the parent retires while the child participates in the labor market and has
Migration and Education 401

earnings yt, which depend in magnitude on investments in education in the first period.The parent is altruistic and maximizes an intertemporal utility function by choosingfirst-period savings St− 1, and investment in the child’s human capital in the first period,It − 1:
V = uðct − 1Þ+ δ½uðctÞ+ γlog yt�, ð4:16Þ
where u(.) is the parent’s utility from consuming ct and ct−1 in periods t and t− 1,respectively, and δ is a discount factor. The parameter γ is an altruistic weight. Ifγ= 0, the parent does not consider the child’s earnings in period t. Assume that paren-tal investments It− 1 translate into human capital of the child (Ht) according to thefollowing production technology:
logHt = h= θ log It−1 + et: ð4:17Þ
The parameter θ is a technology parameter measuring the productivity of invest-ments. This parameter can be viewed as the “talent” or the “ability” of the child butmay also be related to institutional settings and school quality. The term et is the humancapital the child receives without any direct parental investments. This term representsthe attributes endowed upon the child, depending on characteristics of the parents, thechild’s upbringing, genetic factors, environment, and luck. It may also depend on existingnetworks, as well as the lack of opportunity to move out of social and economic struc-tures from one generation to the next. Becker and Tomes (1979) refer to this term asendowments of capital that “are determined by the reputation and ‘connections’ of theirfamilies, the contribution to the ability, race, and other characteristics of children fromthe genetic constitutions of their families, and the learning, skills, goals, and other‘family commodities’ acquired through belonging to a particular family culture. Obviously,endowments depend on many characteristics of parents, grandparents, and otherfamily members and may also be culturally influenced by other families.” The influ-ence of cultural factors and family background may be particularly important forimmigrants, and we will discuss the implications in Section 5.2.3. These factorsinclude what Borjas (1992) calls “ethnic capital,” the quality of the environment inwhich parental investments are made.
Human capital translates into earnings of parents and children according to thefollowing relationship:
log yt−1 = μt−1 + rt−1ht−1, ð4:18aÞlog yt = μt + rtht: ð4:18bÞ
Our formulation allows for different “rental rates” on human capital in the diff-erent periods, μ, as well as different returns to human capital, r. It follows from
402 Christian Dustmann and Albrecht Glitz
Eqs (4.17) and (4.18.b) that the child’s earnings in the second period are related toparental investments by
log yt = μt + rtθ log It−1 + rtet: ð4:19Þ
The parent’s consumption in period t− 1 equals ct−1 = yt−1− It−1− St−1, where yt−1are earnings in period t− 1. For simplicity, we assume that the parent cannot borrowagainst the child’s future earnings and does not bequeath financial assets to the child.As the parent retires in period t, period t consumption is equal to period t− 1 savings,ct= St−1.
Choosing a simple logarithmic utility function for consumption and substitutingEq. (4.19) for the child’s earnings in Eq. (4.16), the optimization problem of the parentcan be expressed as
maxS, I
V = logðyt−1 − It−1 − St−1Þ+ δ½log St−1 + γðμt + rtθ log It−1 + rtetÞ�: ð4:20Þ
Maximizing Eq. (4.20) with respect to savings and investment, and solving the first-order conditions for the optimal investment It−1 yields
It−1 =δγθ rt
ð1+ δÞ+ δγθ rtyt−1: ð4:21Þ
The term in the numerator (which is the same as the second term in the denomi-nator) is the expected discounted utility gain to one log unit of parental investmentin the child’s human capital. The first term in the denominator is the expected lifetimeutility gain from one log unit of additional lifetime consumption. Thus, investments inthe child as a fraction of income equal the expected fraction of utility resulting from thisinvestment. Simple comparative statics show that investment in the child’s human capi-tal increases with altruism γ, the productivity of investment θ, the return to humancapital rt, and the discount rate δ.
Human capital and earnings of the child are related to human capital and earnings ofthe parent as follows:
ht = θ logδγθ rt
ð1+ δÞ+ δγθ rt
� �+ θμt−1 + θ rt−1ht−1 + et ð4:22aÞ
log yt = μt + rtθ logδγθ rt
ð1+ δÞ+ δγθ rt
� �+ θ rt log yt−1 + rtet: ð4:22bÞ
Equations like (4.22a) and (4.22b) are usually estimated in the literature whenregressing education (or earnings) of children on those of their parents. Consider firstEq. (4.22a). The level of education obtained by the child depends on all the parametersthat affect investment. These may differ between immigrants and natives. If, for
Migration and Education 403
instance, the rate of return to skills rt, is perceived to be lower for immigrants, the levelof human capital acquired by immigrant children will also be lower as will be theirearnings. Neal (2006), for example, discusses statistical discrimination as one reason thathas frequently been brought forward to explain the low attainment levels of blackyouth in the United States, in the sense that employers are not likely to view themas skilled no matter what their level of education is. Also, a lower price for human capi-tal, μt−1, in the parent generation of immigrants relative to natives due to, for instance, alack of important complementary skills such as language, leads to a lower level of edu-cation of their children. Finally, education of children depends on “inherited” traits andinstitutional features such as access to schooling and school quality, which are all cap-tured in the term et. If these differ between the immigrant and native population, boththeir education and earnings may differ due to this channel, too (see, e.g., Parent(2009)).
Suppose now that we regress log earnings (or education) of immigrant children onlog earnings (or education) of their parents, following much of the literature that wewill discuss below. What does the OLS coefficient we estimate measure? FollowingBecker and Tomes (1979) and Solon (2004), assume that et follows an AR(1) process,reflecting a serial correlation in the parent’s and the child’s human capital endow-ments, so that et = λ0 + λ1et − 1 + vt, where vt is a white noise error term andλ1∈ ð0, 1Þ. As discussed earlier, these endowments may include ability but may alsobe related to networks, ethnic reference groups, or other “ethnic capital.” Then, insteady state, the probability limit of the OLS estimate of the coefficients on ht−1
and yt−1 are given by θ rt−1 + λ11+ θ rt−1λ1
and θ rt + λ11+ θ rtλ1
, respectively. Thus, the coefficient esti-
mate of ρ in the simple model we discussed at the beginning of Section 5.1 is largerthe larger the return to human capital and the productivity of human capital produc-tion, rt and θ, and it also increases in the correlation in heritable traits, λ1. All theseparameters can differ between populations. For instance, if the heritability parameteris larger in the immigrant population because family structures are tighter, the interge-nerational correlation coefficient will also be larger for this population, implying lessmobility from one generation to the next.
5.3. Empirical Evidence5.3.1 Schooling Outcomes of Immigrant ChildrenWe start in this section with the first important period in an immigrant’s life, his orher childhood. To this end, we return to the data from the PISA study that wealready introduced in Section 2. As we have seen in Table 4.9, with the exceptionof Australia and Canada, the student population with immigrant background tendsto score significantly lower than the native population in both mathematics and read-ing. One of the main explanations for these differences could be the lack of fluency
404 Christian Dustmann and Albrecht Glitz
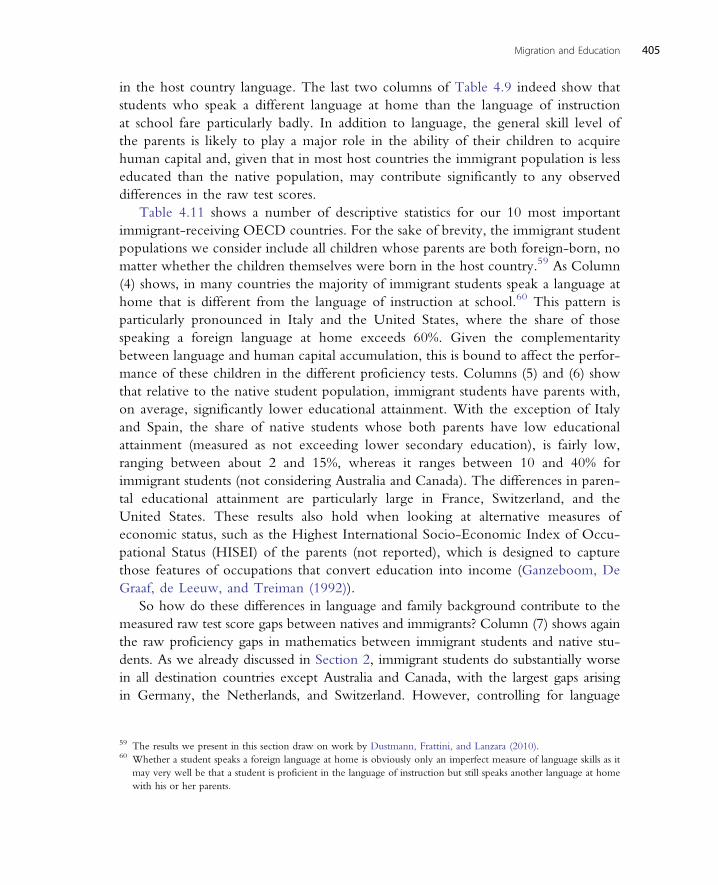
in the host country language. The last two columns of Table 4.9 indeed show thatstudents who speak a different language at home than the language of instructionat school fare particularly badly. In addition to language, the general skill level ofthe parents is likely to play a major role in the ability of their children to acquirehuman capital and, given that in most host countries the immigrant population is lesseducated than the native population, may contribute significantly to any observeddifferences in the raw test scores.
Table 4.11 shows a number of descriptive statistics for our 10 most importantimmigrant-receiving OECD countries. For the sake of brevity, the immigrant studentpopulations we consider include all children whose parents are both foreign-born, nomatter whether the children themselves were born in the host country.59 As Column(4) shows, in many countries the majority of immigrant students speak a language athome that is different from the language of instruction at school.60 This pattern isparticularly pronounced in Italy and the United States, where the share of thosespeaking a foreign language at home exceeds 60%. Given the complementaritybetween language and human capital accumulation, this is bound to affect the perfor-mance of these children in the different proficiency tests. Columns (5) and (6) showthat relative to the native student population, immigrant students have parents with,on average, significantly lower educational attainment. With the exception of Italyand Spain, the share of native students whose both parents have low educationalattainment (measured as not exceeding lower secondary education), is fairly low,ranging between about 2 and 15%, whereas it ranges between 10 and 40% forimmigrant students (not considering Australia and Canada). The differences in paren-tal educational attainment are particularly large in France, Switzerland, and theUnited States. These results also hold when looking at alternative measures ofeconomic status, such as the Highest International Socio-Economic Index of Occu-pational Status (HISEI) of the parents (not reported), which is designed to capturethose features of occupations that convert education into income (Ganzeboom, DeGraaf, de Leeuw, and Treiman (1992)).
So how do these differences in language and family background contribute to themeasured raw test score gaps between natives and immigrants? Column (7) shows againthe raw proficiency gaps in mathematics between immigrant students and native stu-dents. As we already discussed in Section 2, immigrant students do substantially worsein all destination countries except Australia and Canada, with the largest gaps arisingin Germany, the Netherlands, and Switzerland. However, controlling for language
59 The results we present in this section draw on work by Dustmann, Frattini, and Lanzara (2010).60 Whether a student speaks a foreign language at home is obviously only an imperfect measure of language skills as it
may very well be that a student is proficient in the language of instruction but still speaks another language at homewith his or her parents.
Migration and Education 405
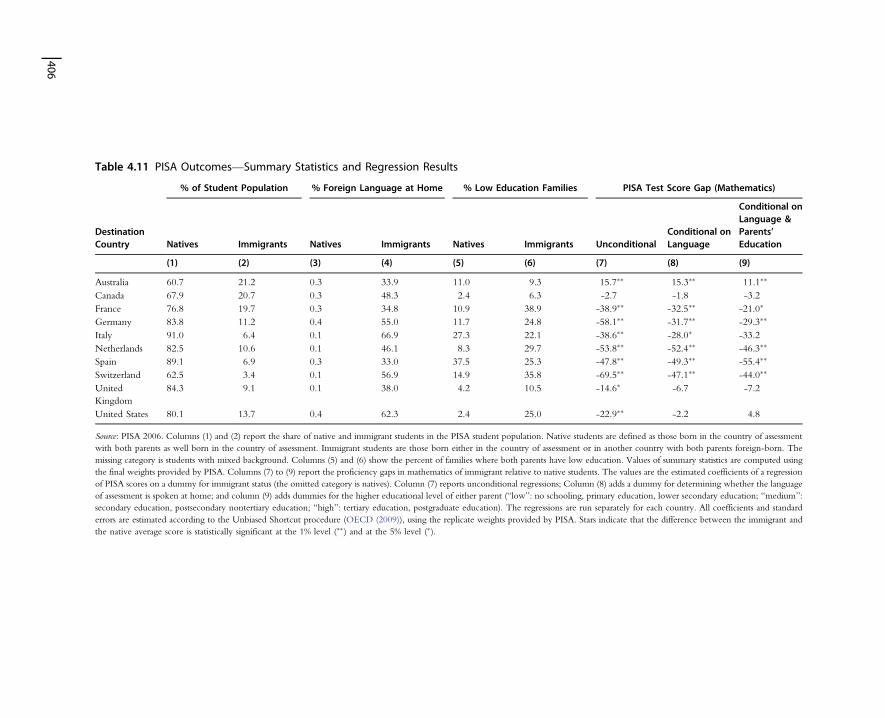
Table 4.11 PISA Outcomes—Summary Statistics and Regression Results
DestinationCountry
% of Student Population % Foreign Language at Home % Low Education Families PISA Test Score Gap (Mathematics)
Natives Immigrants Natives Immigrants Natives Immigrants UnconditionalConditional onLanguage
Conditional onLanguage &Parents’Education
(1) (2) (3) (4) (5) (6) (7) (8) (9)
Australia 60.7 21.2 0.3 33.9 11.0 9.3 15.7�� 15.3�� 11.1��
Canada 67.9 20.7 0.3 48.3 2.4 6.3 -2.7 -1.8 -3.2France 76.8 19.7 0.3 34.8 10.9 38.9 -38.9�� -32.5�� -21.0�
Germany 83.8 11.2 0.4 55.0 11.7 24.8 -58.1�� -31.7�� -29.3��
Italy 91.0 6.4 0.1 66.9 27.3 22.1 -38.6�� -28.0� -33.2Netherlands 82.5 10.6 0.1 46.1 8.3 29.7 -53.8�� -52.4�� -46.3��
Spain 89.1 6.9 0.3 33.0 37.5 25.3 -47.8�� -49.3�� -55.4��
Switzerland 62.5 3.4 0.1 56.9 14.9 35.8 -69.5�� -47.1�� -44.0��
UnitedKingdom
84.3 9.1 0.1 38.0 4.2 10.5 -14.6� -6.7 -7.2
United States 80.1 13.7 0.4 62.3 2.4 25.0 -22.9�� -2.2 4.8
Source: PISA 2006. Columns (1) and (2) report the share of native and immigrant students in the PISA student population. Native students are defined as those born in the country of assessmentwith both parents as well born in the country of assessment. Immigrant students are those born either in the country of assessment or in another country with both parents foreign-born. Themissing category is students with mixed background. Columns (5) and (6) show the percent of families where both parents have low education. Values of summary statistics are computed usingthe final weights provided by PISA. Columns (7) to (9) report the proficiency gaps in mathematics of immigrant relative to native students. The values are the estimated coefficients of a regressionof PISA scores on a dummy for immigrant status (the omitted category is natives). Column (7) reports unconditional regressions; Column (8) adds a dummy for determining whether the languageof assessment is spoken at home; and column (9) adds dummies for the higher educational level of either parent (“low”: no schooling, primary education, lower secondary education; “medium”:secondary education, postsecondary nontertiary education; “high”: tertiary education, postgraduate education). The regressions are run separately for each country. All coefficients and standarderrors are estimated according to the Unbiased Shortcut procedure (OECD (2009)), using the replicate weights provided by PISA. Stars indicate that the difference between the immigrant andthe native average score is statistically significant at the 1% level (��) and at the 5% level (�).
406
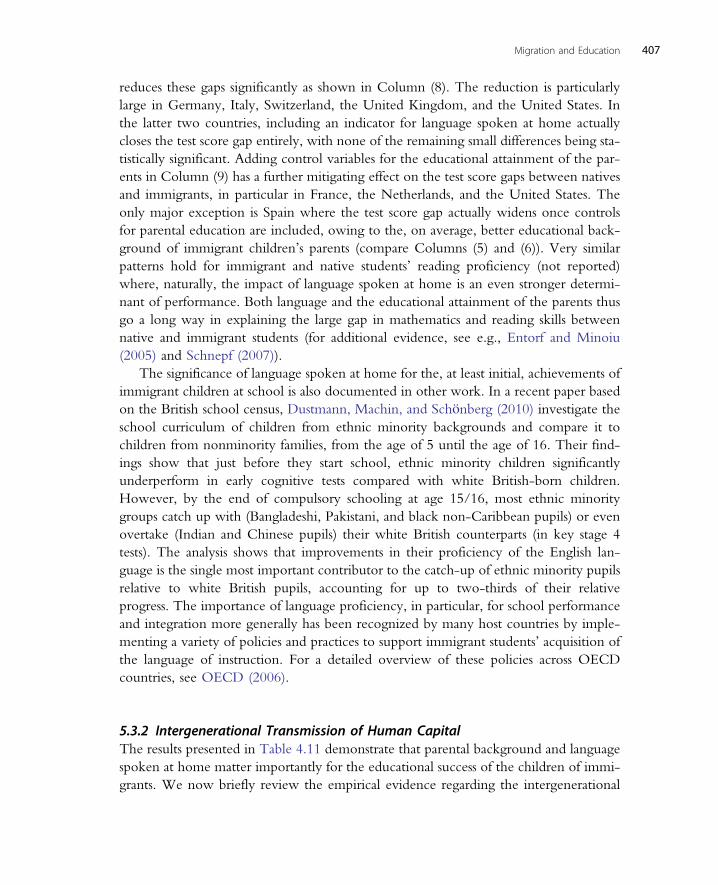
reduces these gaps significantly as shown in Column (8). The reduction is particularlylarge in Germany, Italy, Switzerland, the United Kingdom, and the United States. Inthe latter two countries, including an indicator for language spoken at home actuallycloses the test score gap entirely, with none of the remaining small differences being sta-tistically significant. Adding control variables for the educational attainment of the par-ents in Column (9) has a further mitigating effect on the test score gaps between nativesand immigrants, in particular in France, the Netherlands, and the United States. Theonly major exception is Spain where the test score gap actually widens once controlsfor parental education are included, owing to the, on average, better educational back-ground of immigrant children’s parents (compare Columns (5) and (6)). Very similarpatterns hold for immigrant and native students’ reading proficiency (not reported)where, naturally, the impact of language spoken at home is an even stronger determi-nant of performance. Both language and the educational attainment of the parents thusgo a long way in explaining the large gap in mathematics and reading skills betweennative and immigrant students (for additional evidence, see e.g., Entorf and Minoiu(2005) and Schnepf (2007)).
The significance of language spoken at home for the, at least initial, achievements ofimmigrant children at school is also documented in other work. In a recent paper basedon the British school census, Dustmann, Machin, and Schönberg (2010) investigate theschool curriculum of children from ethnic minority backgrounds and compare it tochildren from nonminority families, from the age of 5 until the age of 16. Their find-ings show that just before they start school, ethnic minority children significantlyunderperform in early cognitive tests compared with white British-born children.However, by the end of compulsory schooling at age 15/16, most ethnic minoritygroups catch up with (Bangladeshi, Pakistani, and black non-Caribbean pupils) or evenovertake (Indian and Chinese pupils) their white British counterparts (in key stage 4tests). The analysis shows that improvements in their proficiency of the English lan-guage is the single most important contributor to the catch-up of ethnic minority pupilsrelative to white British pupils, accounting for up to two-thirds of their relativeprogress. The importance of language proficiency, in particular, for school performanceand integration more generally has been recognized by many host countries by imple-menting a variety of policies and practices to support immigrant students’ acquisition ofthe language of instruction. For a detailed overview of these policies across OECDcountries, see OECD (2006).
5.3.2 Intergenerational Transmission of Human CapitalThe results presented in Table 4.11 demonstrate that parental background and languagespoken at home matter importantly for the educational success of the children of immi-grants. We now briefly review the empirical evidence regarding the intergenerational
Migration and Education 407
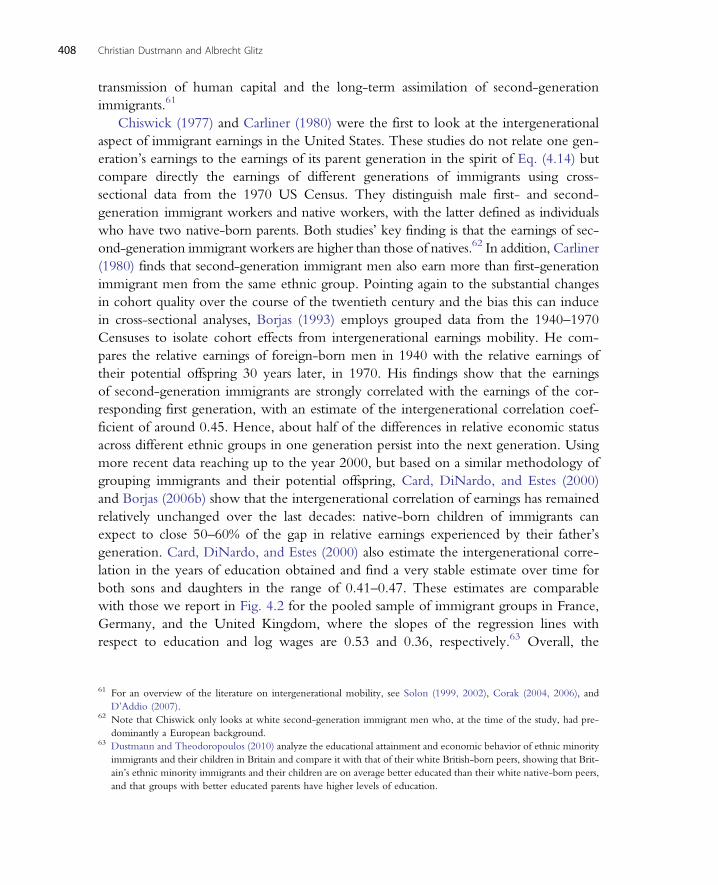
transmission of human capital and the long-term assimilation of second-generationimmigrants.61
Chiswick (1977) and Carliner (1980) were the first to look at the intergenerationalaspect of immigrant earnings in the United States. These studies do not relate one gen-eration’s earnings to the earnings of its parent generation in the spirit of Eq. (4.14) butcompare directly the earnings of different generations of immigrants using cross-sectional data from the 1970 US Census. They distinguish male first- and second-generation immigrant workers and native workers, with the latter defined as individualswho have two native-born parents. Both studies’ key finding is that the earnings of sec-ond-generation immigrant workers are higher than those of natives.62 In addition, Carliner(1980) finds that second-generation immigrant men also earn more than first-generationimmigrant men from the same ethnic group. Pointing again to the substantial changesin cohort quality over the course of the twentieth century and the bias this can inducein cross-sectional analyses, Borjas (1993) employs grouped data from the 1940–1970Censuses to isolate cohort effects from intergenerational earnings mobility. He com-pares the relative earnings of foreign-born men in 1940 with the relative earnings oftheir potential offspring 30 years later, in 1970. His findings show that the earningsof second-generation immigrants are strongly correlated with the earnings of the cor-responding first generation, with an estimate of the intergenerational correlation coef-ficient of around 0.45. Hence, about half of the differences in relative economic statusacross different ethnic groups in one generation persist into the next generation. Usingmore recent data reaching up to the year 2000, but based on a similar methodology ofgrouping immigrants and their potential offspring, Card, DiNardo, and Estes (2000)and Borjas (2006b) show that the intergenerational correlation of earnings has remainedrelatively unchanged over the last decades: native-born children of immigrants canexpect to close 50–60% of the gap in relative earnings experienced by their father’sgeneration. Card, DiNardo, and Estes (2000) also estimate the intergenerational corre-lation in the years of education obtained and find a very stable estimate over time forboth sons and daughters in the range of 0.41–0.47. These estimates are comparablewith those we report in Fig. 4.2 for the pooled sample of immigrant groups in France,Germany, and the United Kingdom, where the slopes of the regression lines withrespect to education and log wages are 0.53 and 0.36, respectively.63 Overall, the
61 For an overview of the literature on intergenerational mobility, see Solon (1999, 2002), Corak (2004, 2006), andD’Addio (2007).
62 Note that Chiswick only looks at white second-generation immigrant men who, at the time of the study, had pre-dominantly a European background.
63 Dustmann and Theodoropoulos (2010) analyze the educational attainment and economic behavior of ethnic minorityimmigrants and their children in Britain and compare it with that of their white British-born peers, showing that Brit-ain’s ethnic minority immigrants and their children are on average better educated than their white native-born peers,and that groups with better educated parents have higher levels of education.
408 Christian Dustmann and Albrecht Glitz
empirical evidence suggests that most of the strong intergenerational linkages betweenimmigrant fathers and their native-born children work through education.
With increasing data availability and the passing of time, it has become possible insome cases to analyze the correlation between first- and third-generation immigrants.Using data from the 1910 US Census and the General Social Surveys to link a sampleof American-born workers to their grandparents who arrived in the United States duringthe first Great Migration at the beginning of the twentieth century, Borjas (1994, 2006b)estimates an intergenerational correlation in relative wages between the first and the thirdgeneration of about 0.22, which implies that 22% of the wage gap between any twogroups in the immigrant generation persisted into the third generation. Note that thisis compatible with a correlation coefficient across subsequent generations of about 0.5,similar to the one estimated in the studies discussed above. Current differences in eco-nomic status among first-generation immigrants are thus likely to shape the labor marketexperience of their offspring for generations to come.64 Table 4.L2 at the end of thischapter summarizes the existing literature on the intergenerational mobility in earningsand educational attainment of immigrants across a variety of different countries. Column(7) reports estimated intergenerational correlation coefficients based on specifications suchas the one in Eq. (4.14).Overall, the evidence suggests that intergenerational mobility is lowerfor immigrants than for natives, higher for immigrant women than for immigrant men, rela-tively high in Scandinavian countries (with an estimated correlation coefficient for men ofaround 0.1–0.2), relatively low in the United States (with estimates of around 0.5–0.6), andsomewhere in the middle in Canada and Germany (with estimates of around 0.2–0.4).
As we discussed earlier, the investment decisions of immigrants in their own educa-tion, and that of their children, may be shaped by their return intentions. Dustmann(2008) extends the standard permanent income model of intergenerational mobility assketched in Section 5.2 by allowing for the possibility of return migration. As we havealready alluded to on various occasions throughout this chapter, the prospect of return-ing home has important consequences for an immigrant’s human capital investment inthe host country. In an intergenerational context with altruistic parents, such considera-tions also affect the parents’ investment in the human capital of their children (under theassumption that the child’s perceived return probability increases with the return prob-ability of the parent) and thus the measured intergenerational earnings mobility. Morespecifically, Dustmann (2008) shows that as long as the return to human capital is higherand the preference for consumption lower in the host than in the home country,investments in the children’s human capital will increase with the probability of a per-manent migration. This is because the latter increases the expected monetary gain froman additional unit of human capital for the child, and because it decreases the expected
64 Deutsch, Epstein, and Lecker (2006) and Hammarstedt (2009) provide evidence on the relative outcomes of first-,second-, and third-generation immigrants in Israel and Sweden, respectively.
Migration and Education 409
utility gain from consuming in the home country, leading to a reduction in parents’ sav-ings for future consumption and an increase of their investments in their children. UsingGerman panel data on father–son pairs that include information on parental returnintentions, Dustmann (2008) shows, first, that parental investment in children’s educa-tion increases with the permanent migration probability of the parent and, second, thatthe son’s permanent earnings increase with the father’s permanent migration probabil-ity, conditional on father’s permanent earnings and education. Accounting for measure-ment error in parental earnings by using repeated wage observations reveals substantialdownward bias in a standard estimation of the intergenerational earnings correlation,increasing the parameter estimate from about 0.140 to 0.344. The corresponding esti-mates for native father–son pairs are 0.177 and 0.251, which, although not statisticallydifferent, suggest less intergenerational mobility for immigrants than for natives.
5.3.3 Intergenerational Transmission and LanguageIn Section 3.4.4, we discussed language as one of the key human capital characteristicsdetermining the economic outcomes of immigrants in their host country. Since the lan-guage skills of parents are likely to at least partly determine the language skills of theirchildren, they could be an important factor underlying the observed persistence in eco-nomic status between first- and second-generation immigrants. A number of studies haveinvestigated the link between the language proficiency of children and their parents. ForAustralia, Chiswick, Lee, and Miller (2005) find strong links between parents’ measuredand unmeasured determinants of language proficiency and the language skills of theirchildren, in particular between mothers and their children. Bleakley and Chin (2008)show that parental language skills have a significant positive causal effect on US-bornchildren’s ability to speak English. Interestingly, this positive effect is only present whilethe children are young but fades out by the time they reach middle school. However, thepoorer language skills when young turn out to have detrimental long-term consequencesfor the children’s educational outcomes in terms of drop-out rates, attendance of age-appropriate grades and attendance of preschool.65 Unlike Bleakley and Chin (2008),who use data from the 2000 US Census, and Chiswick, Lee, and Miller (2005), whouse data from the 1996 Australian Census, Casey and Dustmann (2008) use repeatedinformation on both parents and their children from the German Socio-Economic Panel.This allows them, first, to address the problem of measurement error that is widespread inself-reported data on language proficiency (see Dustmann and van Soest (2001)), second,to avoid sample selection due to children leaving the parental household, and third, toanalyze the association between parental language proficiency and children’s later
65 As in Bleakley and Chin (2004), the authors use the parents’ age at arrival interacted with a dummy for non-English-speaking country of origin as an instrument for their English language skills, making this the probably most convin-cing strategy to deal with the endogeneity of parental language skills.
410 Christian Dustmann and Albrecht Glitz
economic outcomes. The results from this study show a significant and sizeable effect ofparental language fluency on that of their children. Although for males, language profi-ciency does not significantly affect any of the labor market outcomes considered (wages,labor market participation, employment, and unemployment), it has a beneficial effectfor the labor market outcomes of women, in particular those who were born abroadbut arrived in Germany before the age of 10. This differential pattern could be due towomen’s higher propensity to work in occupations where language fluency is important,such as white-collar jobs in the service sector. Overall, the empirical evidence so far sug-gests a strong intergenerational transmission of language skills, in particular at youngerages of the second-generation immigrants, which may contribute to the relatively lowintergenerational mobility in educational attainment and earnings that characterizes manyimmigrant groups in the host countries studied.
5.3.4 Intergenerational Transmission and Ethnic NetworksIn an important contribution, Borjas (1992) extends the standard framework for analyzingthe intergenerational transmission of human capital by assuming that ethnicity acts as anexternality in the human capital accumulation process. In the model outlined in Section5.2, such an externality would be captured in the term et. This implies that a correctly spe-cified economic model of intergenerational mobility should not only include parentalinputs as a determinant of the children’s skills but also the average quality of the ethnicenvironment in which the child is raised, the so-called “ethnic capital”. As long as ethniccapital plays an important role in the intergenerational transmission of skills, ignoring itin a regression based on individual level data may lead to a severe underestimation of thetrue persistence in earnings across generations. Using data from the General Social Surveysand the National Longitudinal Surveys of Youth that include information on both therespondents’ and their parents’ educational attainment and occupation, as well as therespondents’ wages (NLSY only), Borjas (1992) finds overall intergenerational correlationsof educational attainment, occupations, and log wages of around 0.35–0.40, 0.57, and 0.60,respectively, where all of these estimates reflect the sum of the effects due to parental vari-ables on the one hand, and ethnic capital on the other hand. The latter, measured by themean of the characteristic in the corresponding ethnic group, has a positive and significanteffect of roughly similar (for education and wages) or greater (occupations) magnitude asthe corresponding parental variable, suggesting an important role in the intergenerationaltransmission process. Neglecting ethnic capital will thus lead to an underestimation of theintergenerational correlation coefficient and hence to an overestimation of the speed ofeconomic convergence of ethnic groups across generations.66 Aydemir, Chen, and Corak
66 In later work, Borjas (1995b) shows that segregation into particular neighbourhoods could be one reason for theexternal effects of ethnicity, a point that has been reemphasized by Nielsen, Rosholm, Smith, and Husted (2003)and Rooth and Ekberg (2003). See also Cutler, Glaeser, and Vigdor (2005).
Migration and Education 411
(2009) work with a somewhat broader interpretation of what the average group character-istics may capture, including social factors such as discrimination or lack of access to goodschools and credit markets. Using grouped data from the 2001 Canadian Census, theyemploy quantile regression methods to separate the influence of social capital from theinfluence of broader social institutions. Their findings suggest that social institutions limitintergenerational earnings mobility and that parental education is the key ingredientnecessary to circumvent the restrictions imposed by such social institutions.
6. CONCLUSION
This chapter addresses the relationship between migration and education. What seems atfirst view a small and rather specific area in the research on the Economics of Migrationturns out to be at its front and center. The chapter attempts to provide a first overview ofthe issues we consider important when studying migration in relation to education.
Overall, this is a rapidly growing field, illustrated by the rising number of papersover the last decades,67 and there are exciting new research avenues at its frontier. Itis also an area that reflects the challenge to single economies to develop competitivestructures that prevail on increasingly globalized markets, and that are based on a flex-ible and highly responsive skill base. Both education and migration are key ingredientsto achieve this.
Our first reference is to Sjaastad (1962), who viewed migration—as education—asan investment in the human agent. As the various sections of this chapter show, migrationdecisions and decisions about learning and human capital investments are indeed closelyrelated. Migration is not only intertwined with human capital investment decisions ofthose who move but also has important consequences for education and knowledgeacquisition of those who do not move, both in the home and in the host countries.Migrations are dynamic and dynastic processes, forming countries for generations tocome, and one of the key determinants of the success of the children of immigrantsis their educational attainment. We decided to focus in this chapter on three aspects thatwe believe are the cornerstones of the connection between migration and education:the economic aspects of the individual migration decisions and how they relate tothe acquisition of education, the connection between the acquisition of educationand the skill selection of immigrants, and the nature of intergenerational spillovers.Although we attempted to be exhaustive in our coverage, we have almost certainlymissed important additional contributions that investigate these subjects.
The chapter commences with a section (Section 2) that provides an overview of thestylized facts that connect immigration and education. The following three sections
67 Searching on Google for papers written in Economics, Business, or Finance with migration, immigration, or emigra-tion and education, human capital, or skill in the title gives 36 papers between 1991 and 1999, 40 papers between2000 and 2004, and 65 papers between 2005 and 2009.
412 Christian Dustmann and Albrecht Glitz
(Sections 3–5) each start off with a discussion of a simple theoretical framework, whichhelps to structure the large empirical literature that exists in each of the areas considered.In Section 3, where we focus on the migrant, we show that educational choices and theaccumulation of skills are inherently connected to migration and remigration decisions.We emphasize that decisions about nonpermanent forms of migration are key to under-stand educational choices and decisions about skill acquisition, and we demonstrate thechallenges for obtaining estimates of immigrant career paths that are generated if migra-tions are nonpermanent and if migration decisions are taken in conjunction with deci-sions on human capital investment. In our view, this is an area where many researchquestions are still unexplored. For instance, as we show in Section 2, in many casesthe acquisition of education rather than the pursuit of higher wages may be the mainmotive of migration: a hypothesis that is supported by the growing fraction of studentmigrations in the overall migration flows. Also, the forms of migration and impliedcareer paths of immigrants have been changing, with temporary migrations today beingthe rule rather than the exception. Yet, most papers that study career paths of immi-grants are still assuming permanent forms of migration.
In Section 4, we discuss the way in which migration affects educational choices andskill accumulation of individuals who do not migrate, both in the home and in thepotential host countries. This area overlaps with many issues in development econom-ics. We argue that while, as in the quote of Sjaastad, the return to education has been themain motive for migration, it is the acquisition of education itself that is becoming animportant trigger for migration movements, and we explore the consequences for thedestination and the origin countries. Another important aspect, from the perspectiveof both sets of countries, is who migrates. The answer to this question has importantimplications for the effect of immigration on the economies of both countries, throughmechanisms such as the brain gain and the brain drain. We argue that additional insightscan be gained when considering an application of the Roy (1951) model to the migra-tion context that takes account of the multidimensionality of skills, in order to be ableto explain recent migration patterns. Modern economies have specialized in differentindustries to gain competitiveness in international markets. As a consequence, the returnto different skills may differ across countries, changing the incentives underlying indivi-dual migration decisions. Yet, most of the literature that studies the selection of immi-grants focuses on a special case of the Roy model where skills are one-dimensional.
In the final section, we take a more dynastic view of immigration. Here, we focuson the children of immigrants, their educational achievements, and their human capitalaccumulation and ensuing career paths. This long-term aspect of immigrant integrationand assimilation is likely to be a particular focus of research over the next decade due tothe increasing number of countries that have recently experienced significant increasesin their foreign-born populations. The existing evidence we discuss suggests that educa-tion is the key factor determining both the degree and the pace of the economic inte-gration of immigrants and their descendants.
Migration and Education 413
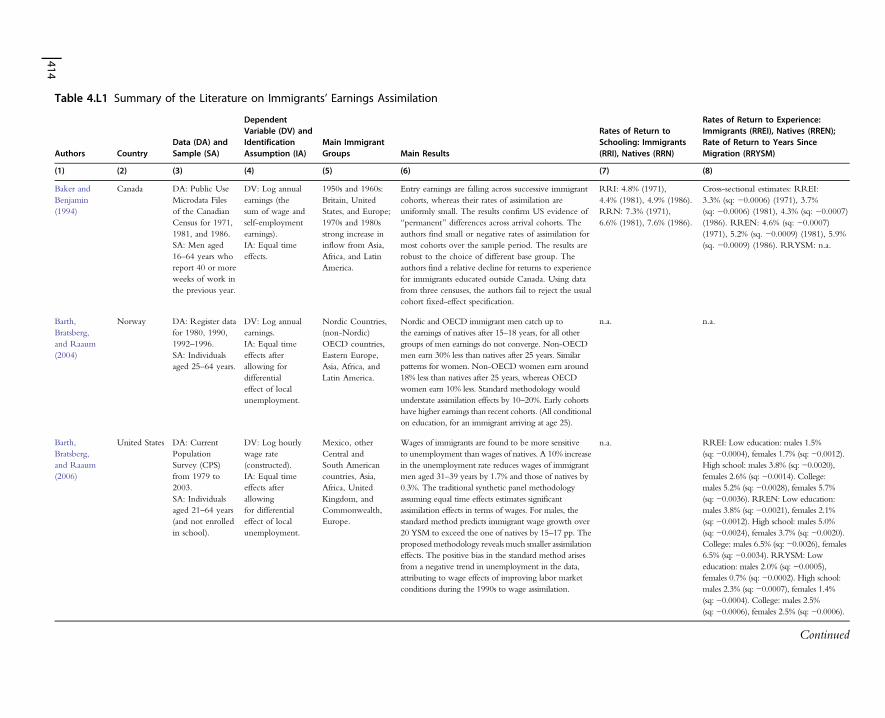
Table 4.L1 Summary of the Literature on Immigrants’ Earnings Assimilation
Authors CountryData (DA) andSample (SA)
DependentVariable (DV) andIdentificationAssumption (IA)
Main ImmigrantGroups Main Results
Rates of Return toSchooling: Immigrants(RRI), Natives (RRN)
Rates of Return to Experience:Immigrants (RREI), Natives (RREN);Rate of Return to Years SinceMigration (RRYSM)
(1) (2) (3) (4) (5) (6) (7) (8)
Baker andBenjamin(1994)
Canada DA: Public UseMicrodata Filesof the CanadianCensus for 1971,1981, and 1986.SA: Men aged16–64 years whoreport 40 or moreweeks of work inthe previous year.
DV: Log annualearnings (thesum of wage andself-employmentearnings).IA: Equal timeeffects.
1950s and 1960s:Britain, UnitedStates, and Europe;1970s and 1980sstrong increase ininflow from Asia,Africa, and LatinAmerica.
Entry earnings are falling across successive immigrantcohorts, whereas their rates of assimilation areuniformly small. The results confirm US evidence of“permanent” differences across arrival cohorts. Theauthors find small or negative rates of assimilation formost cohorts over the sample period. The results arerobust to the choice of different base group. Theauthors find a relative decline for returns to experiencefor immigrants educated outside Canada. Using datafrom three censuses, the authors fail to reject the usualcohort fixed-effect specification.
RRI: 4.8% (1971),4.4% (1981), 4.9% (1986).RRN: 7.3% (1971),6.6% (1981), 7.6% (1986).
Cross-sectional estimates: RREI:3.3% (sq: −0.0006) (1971), 3.7%(sq: −0.0006) (1981), 4.3% (sq: −0.0007)(1986). RREN: 4.6% (sq: −0.0007)(1971), 5.2% (sq. −0.0009) (1981), 5.9%(sq. −0.0009) (1986). RRYSM: n.a.
Barth,Bratsberg,and Raaum(2004)
Norway DA: Register datafor 1980, 1990,1992–1996.SA: Individualsaged 25–64 years.
DV: Log annualearnings.IA: Equal timeeffects afterallowing fordifferentialeffect of localunemployment.
Nordic Countries,(non-Nordic)OECD countries,Eastern Europe,Asia, Africa, andLatin America.
Nordic and OECD immigrant men catch up tothe earnings of natives after 15–18 years, for all othergroups of men earnings do not converge. Non-OECDmen earn 30% less than natives after 25 years. Similarpatterns for women. Non-OECD women earn around18% less than natives after 25 years, whereas OECDwomen earn 10% less. Standard methodology wouldunderstate assimilation effects by 10–20%. Early cohortshave higher earnings than recent cohorts. (All conditionalon education, for an immigrant arriving at age 25).
n.a. n.a.
Barth,Bratsberg,and Raaum(2006)
United States DA: CurrentPopulationSurvey (CPS)from 1979 to2003.SA: Individualsaged 21–64 years(and not enrolledin school).
DV: Log hourlywage rate(constructed).IA: Equal timeeffects afterallowingfor differentialeffect of localunemployment.
Mexico, otherCentral andSouth Americancountries, Asia,Africa, UnitedKingdom, andCommonwealth,Europe.
Wages of immigrants are found to be more sensitiveto unemployment than wages of natives. A 10% increasein the unemployment rate reduces wages of immigrantmen aged 31–39 years by 1.7% and those of natives by0.3%. The traditional synthetic panel methodologyassuming equal time effects estimates significantassimilation effects in terms of wages. For males, thestandard method predicts immigrant wage growth over20 YSM to exceed the one of natives by 15–17 pp. Theproposed methodology reveals much smaller assimilationeffects. The positive bias in the standard method arisesfrom a negative trend in unemployment in the data,attributing to wage effects of improving labor marketconditions during the 1990s to wage assimilation.
n.a. RREI: Low education: males 1.5%(sq: −0.0004), females 1.7% (sq: −0.0012).High school: males 3.8% (sq: −0.0020),females 2.6% (sq: −0.0014). College:males 5.2% (sq: −0.0028), females 5.7%(sq: −0.0036). RREN: Low education:males 3.8% (sq: −0.0021), females 2.1%(sq: −0.0012). High school: males 5.0%(sq: −0.0024), females 3.7% (sq: −0.0020).College: males 6.5% (sq: −0.0026), females6.5% (sq: −0.0034). RRYSM: Loweducation: males 2.0% (sq: −0.0005),females 0.7% (sq: −0.0002). High school:males 2.3% (sq: −0.0007), females 1.4%(sq: −0.0004). College: males 2.5%(sq: −0.0006), females 2.5% (sq: −0.0006).
Continued
414
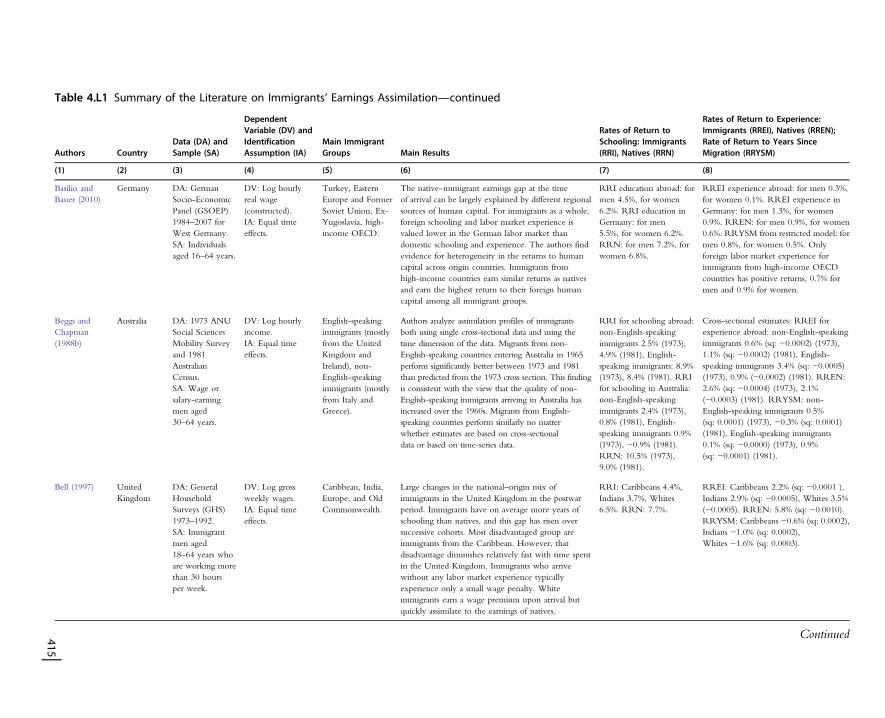
Table 4.L1 Summary of the Literature on Immigrants’ Earnings Assimilation—continued
Authors CountryData (DA) andSample (SA)
DependentVariable (DV) andIdentificationAssumption (IA)
Main ImmigrantGroups Main Results
Rates of Return toSchooling: Immigrants(RRI), Natives (RRN)
Rates of Return to Experience:Immigrants (RREI), Natives (RREN);Rate of Return to Years SinceMigration (RRYSM)
(1) (2) (3) (4) (5) (6) (7) (8)
Basilio andBauer (2010)
Germany DA: GermanSocio-EconomicPanel (GSOEP)1984–2007 forWest Germany.SA: Individualsaged 16–64 years.
DV: Log hourlyreal wage(constructed).IA: Equal timeeffects.
Turkey, EasternEurope and FormerSoviet Union, Ex-Yugoslavia, high-income OECD.
The native–immigrant earnings gap at the timeof arrival can be largely explained by different regionalsources of human capital. For immigrants as a whole,foreign schooling and labor market experience isvalued lower in the German labor market thandomestic schooling and experience. The authors findevidence for heterogeneity in the returns to humancapital across origin countries. Immigrants fromhigh-income countries earn similar returns as nativesand earn the highest return to their foreign humancapital among all immigrant groups.
RRI education abroad: formen 4.5%, for women6.2%. RRI education inGermany: for men5.5%, for women 6.2%.RRN: for men 7.2%, forwomen 6.8%.
RREI experience abroad: for men 0.3%,for women 0.1%. RREI experience inGermany: for men 1.3%, for women0.9%. RREN: for men 0.9%, for women0.6%. RRYSM from restricted model: formen 0.8%, for women 0.5%. Onlyforeign labor market experience forimmigrants from high-income OECDcountries has positive returns, 0.7% formen and 0.9% for women.
Beggs andChapman(1988b)
Australia DA: 1973 ANUSocial SciencesMobility Surveyand 1981AustralianCensus.SA: Wage orsalary-earningmen aged30–64 years.
DV: Log hourlyincome.IA: Equal timeeffects.
English-speakingimmigrants (mostlyfrom the UnitedKingdom andIreland), non-English-speakingimmigrants (mostlyfrom Italy andGreece).
Authors analyze assimilation profiles of immigrantsboth using single cross-sectional data and using thetime dimension of the data. Migrants from non-English-speaking countries entering Australia in 1965perform significantly better between 1973 and 1981than predicted from the 1973 cross section. This findingis consistent with the view that the quality of non-English-speaking immigrants arriving in Australia hasincreased over the 1960s. Migrants from English-speaking countries perform similarly no matterwhether estimates are based on cross-sectionaldata or based on time-series data.
RRI for schooling abroad:non-English-speakingimmigrants 2.5% (1973),4.9% (1981), English-speaking immigrants: 8.9%(1973), 8.4% (1981). RRIfor schooling in Australia:non-English-speakingimmigrants 2.4% (1973),0.8% (1981), English-speaking immigrants 0.9%(1973), −0.9% (1981).RRN: 10.5% (1973),9.0% (1981).
Cross-sectional estimates: RREI forexperience abroad: non-English-speakingimmigrants 0.6% (sq: −0.0002) (1973),1.1% (sq: −0.0002) (1981), English-speaking immigrants 3.4% (sq: −0.0005)(1973), 0.9% (−0.0002) (1981). RREN:2.6% (sq: −0.0004) (1973), 2.1%(−0.0003) (1981). RRYSM: non-English-speaking immigrants 0.5%(sq: 0.0001) (1973), −0.3% (sq: 0.0001)(1981), English-speaking immigrants0.1% (sq: −0.0000) (1973), 0.9%(sq: −0.0001) (1981).
Bell (1997) UnitedKingdom
DA: GeneralHouseholdSurveys (GHS)1973–1992.SA: Immigrantmen aged18–64 years whoare working morethan 30 hoursper week.
DV: Log grossweekly wages.IA: Equal timeeffects.
Caribbean, India,Europe, and OldCommonwealth.
Large changes in the national–origin mix ofimmigrants in the United Kingdom in the postwarperiod. Immigrants have on average more years ofschooling than natives, and this gap has risen oversuccessive cohorts. Most disadvantaged group areimmigrants from the Caribbean. However, thatdisadvantage diminishes relatively fast with time spentin the United Kingdom. Immigrants who arrivewithout any labor market experience typicallyexperience only a small wage penalty. Whiteimmigrants earn a wage premium upon arrival butquickly assimilate to the earnings of natives.
RRI: Caribbeans 4.4%,Indians 3.7%, Whites6.5%. RRN: 7.7%.
RREI: Caribbeans 2.2% (sq: −0.0001 ),Indians 2.9% (sq: −0.0005), Whites 3.5%(−0.0005). RREN: 5.8% (sq: −0.0010).RRYSM: Caribbeans −0.6% (sq: 0.0002),Indians −1.0% (sq: 0.0002),Whites −1.6% (sq: 0.0003).
Continued415

Table 4.L1 Summary of the Literature on Immigrants’ Earnings Assimilation—continued
Authors CountryData (DA) andSample (SA)
DependentVariable (DV) andIdentificationAssumption (IA)
Main ImmigrantGroups Main Results
Rates of Return toSchooling: Immigrants(RRI), Natives (RRN)
Rates of Return to Experience:Immigrants (RREI), Natives (RREN);Rate of Return to Years SinceMigration (RRYSM)
(1) (2) (3) (4) (5) (6) (7) (8)
Borjas (1985) United States DA: 1970, 1980US Census.SA: Men aged18–54 years in1970 and 28–64years in 1980.
DV: Log hourlywage rate(constructed).IA: Equal timeeffects.
Mexico, Cuba,Other Hispanic,Asian, Whites,Blacks.
Only white immigrants overtake the earnings ofstatistically comparable white native workers after10–15 years. All other groups have slower or evennegative rates of convergence to their specific nativecomparison groups. Quality of immigrant cohortsdeclined over time.
RRI: between 2.8%(Mexicans) and 7.1%(Asians) (1970), between2.9% (Mexicans) and 5.9%(Asians) (1980). RRN:between 4.9% (Cubans)and 6.9% (Whites) (1970),between 4.6% (Cubans)and 6.0% (Other Hispanics)(1980). Return to schoolingsignificantly lower forMexicans, Cubans and otherHispanics relative to nativecounterparts. For othergroups about the same.
Cross-sectional estimates. RREI: between0.5% (Asians, sq: 0.0000) and 4.0%(Whites, sq: −0.0007) (1970), between−0.2% (Cubans, sq: −0.0000) and 3.9%(Whites, sq: −0.0006) (1980). RREN:between 2.6% (Blacks, sq: −0.0004) and11.2% (Cubans, sq: −0.0026) (1970),between 0.6% (Blacks, sq: −0.0000) and3.5% (Asians, sq: −0.0005) (1980).RRYSM: n.a.
Borjas (1995a) United States DA: 1970, 1980,1990 US Census.SA: Men aged25–64 years.
DV: Log hourlywage rate(constructed).IA: Equal timeeffects.
Mexican, OtherHispanic, Asian,Whites.
Relative wages of immigrants grow by about 10 ppduring the first two decades after arrival, very littlethereafter. For 1970 and 1980 cohorts, eventual wage gapis about 5–10 pp. Immigrants who arrived in the late1980s (1970, 1960) earned about 19.3% (13.4%, 8%) lessthan natives at the time of entry (all conditional oneducation, for an immigrant arriving at age 20).
RRI: 4.7%, RRN: 6% RREI: 8.8% (sq: −0.0016). RREN:9.4% (sq: −0.0015). RRYSM: 1.9%(sq. −0.0004)
Bratsberg andRagan (2002)
United States DA: 1970, 1980and 1990 USCensus andNationalLongitudinalSurvey of Youth.SA: Foreign-bornmen aged 25–64years (workedpositive hours andearned at least US$1000 wage orsalary income in1989 and notenrolled at schoolat time of census)
DV: Log of weeklyearnings. IA: Equalcohort effects.
Mexico and otherCentral AmericanCountries, SouthAmerica, UnitedKingdom andEurope,Commonwealth,Asia, and NorthAfrica.
Immigrants with US schooling earn higher wages thanimmigrants with non-US schooling. This wageadvantage results from both greater educationalattainment and higher returns to education and cannotbe attributed to greater English proficiency. Returnsto years of non-US schooling are higher forimmigrants who complete their schooling in theUnited States and can be interpreted as US schoolingupgrading education received in the source country.For immigrants without US schooling, returns arehigher for immigrants from highly developedcountries and countries in which English is anofficial language.
RRI (linear splinefunction): for non-USschooling: less or equal 11years of schooling 0.8%,more than 11 years ofschooling 8.9%. For USschooling: less or equal 11years of schooling 4.1%,more than 11 years ofschooling 10.2%. RRN:n.a.
RREI: for those with non-US schooling1.8% (sq. −0.0003), for those with USschooling 4.2% (sq. −0.0007). RREN n.a. RRYSM: for those with non-USschooling 2.5% (sq. −0.0003), for thosewith US schooling 1.0% (−0.0001).
Continued
416
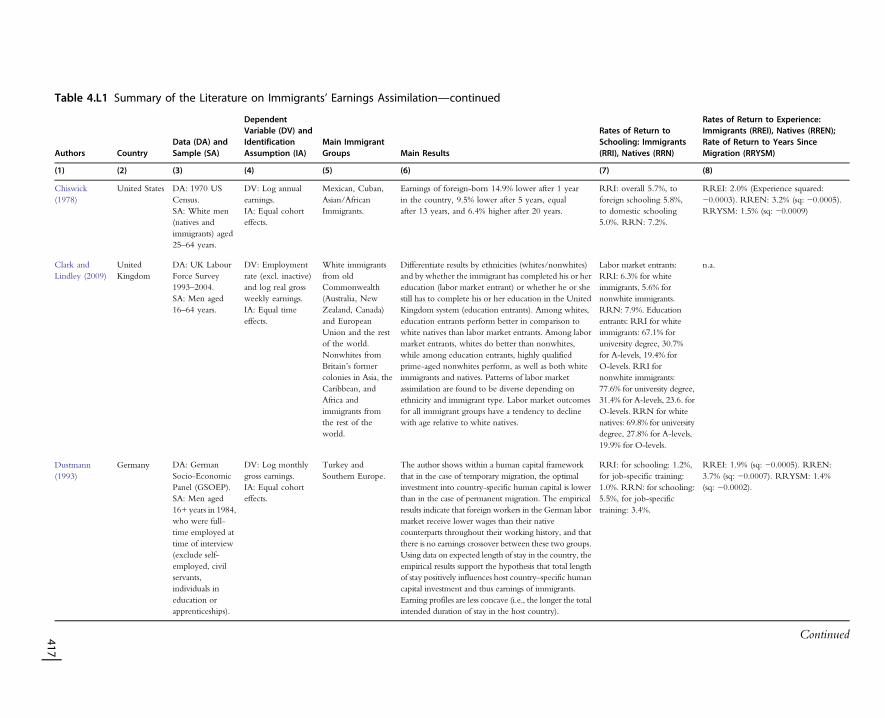
Table 4.L1 Summary of the Literature on Immigrants’ Earnings Assimilation—continued
Authors CountryData (DA) andSample (SA)
DependentVariable (DV) andIdentificationAssumption (IA)
Main ImmigrantGroups Main Results
Rates of Return toSchooling: Immigrants(RRI), Natives (RRN)
Rates of Return to Experience:Immigrants (RREI), Natives (RREN);Rate of Return to Years SinceMigration (RRYSM)
(1) (2) (3) (4) (5) (6) (7) (8)
Chiswick(1978)
United States DA: 1970 USCensus.SA: White men(natives andimmigrants) aged25–64 years.
DV: Log annualearnings.IA: Equal cohorteffects.
Mexican, Cuban,Asian/AfricanImmigrants.
Earnings of foreign-born 14.9% lower after 1 yearin the country, 9.5% lower after 5 years, equalafter 13 years, and 6.4% higher after 20 years.
RRI: overall 5.7%, toforeign schooling 5.8%,to domestic schooling5.0%. RRN: 7.2%.
RREI: 2.0% (Experience squared:−0.0003). RREN: 3.2% (sq: −0.0005).RRYSM: 1.5% (sq: −0.0009)
Clark andLindley (2009)
UnitedKingdom
DA: UK LabourForce Survey1993–2004.SA: Men aged16–64 years.
DV: Employmentrate (excl. inactive)and log real grossweekly earnings.IA: Equal timeeffects.
White immigrantsfrom oldCommonwealth(Australia, NewZealand, Canada)and EuropeanUnion and the restof the world.Nonwhites fromBritain’s formercolonies in Asia, theCaribbean, andAfrica andimmigrants fromthe rest of theworld.
Differentiate results by ethnicities (whites/nonwhites)and by whether the immigrant has completed his or hereducation (labor market entrant) or whether he or shestill has to complete his or her education in the UnitedKingdom system (education entrants). Among whites,education entrants perform better in comparison towhite natives than labor market entrants. Among labormarket entrants, whites do better than nonwhites,while among education entrants, highly qualifiedprime-aged nonwhites perform, as well as both whiteimmigrants and natives. Patterns of labor marketassimilation are found to be diverse depending onethnicity and immigrant type. Labor market outcomesfor all immigrant groups have a tendency to declinewith age relative to white natives.
Labor market entrants:RRI: 6.3% for whiteimmigrants, 5.6% fornonwhite immigrants.RRN: 7.9%. Educationentrants: RRI for whiteimmigrants: 67.1% foruniversity degree, 30.7%for A-levels, 19.4% forO-levels. RRI fornonwhite immigrants:77.6% for university degree,31.4% for A-levels, 23.6. forO-levels. RRN for whitenatives: 69.8% for universitydegree, 27.8% for A-levels,19.9% for O-levels.
n.a.
Dustmann(1993)
Germany DA: GermanSocio-EconomicPanel (GSOEP).SA: Men aged16+ years in 1984,who were full-time employed attime of interview(exclude self-employed, civilservants,individuals ineducation orapprenticeships).
DV: Log monthlygross earnings.IA: Equal cohorteffects.
Turkey andSouthern Europe.
The author shows within a human capital frameworkthat in the case of temporary migration, the optimalinvestment into country-specific human capital is lowerthan in the case of permanent migration. The empiricalresults indicate that foreign workers in the German labormarket receive lower wages than their nativecounterparts throughout their working history, and thatthere is no earnings crossover between these two groups.Using data on expected length of stay in the country, theempirical results support the hypothesis that total lengthof stay positively influences host country–specific humancapital investment and thus earnings of immigrants.Earning profiles are less concave (i.e., the longer the totalintended duration of stay in the host country).
RRI: for schooling: 1.2%,for job-specific training:1.0%. RRN: for schooling:5.5%, for job-specifictraining: 3.4%.
RREI: 1.9% (sq: −0.0005). RREN:3.7% (sq: −0.0007). RRYSM: 1.4%(sq: −0.0002).
Continued417
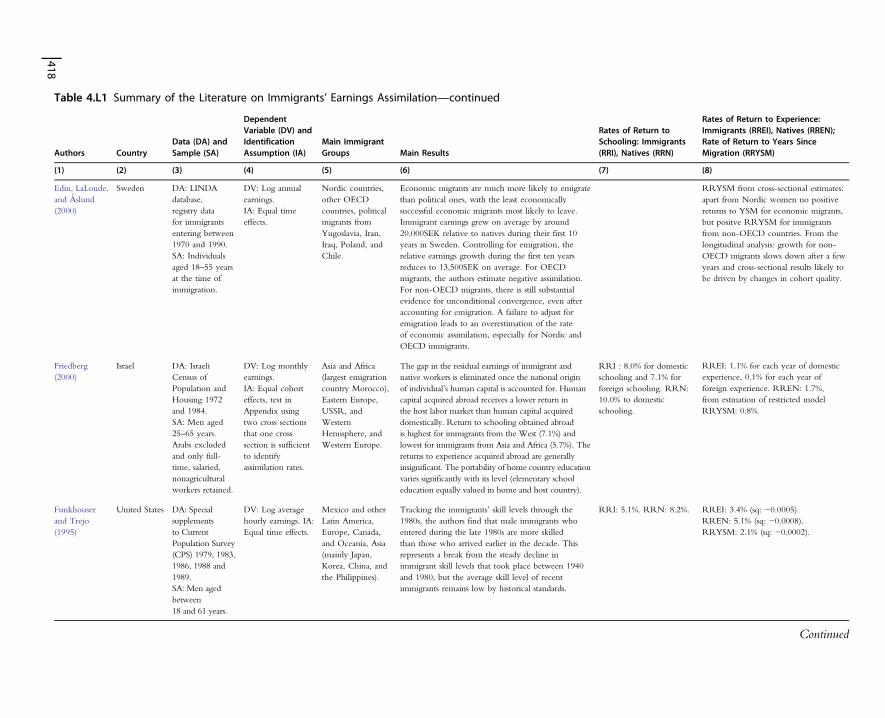
Table 4.L1 Summary of the Literature on Immigrants’ Earnings Assimilation—continued
Authors CountryData (DA) andSample (SA)
DependentVariable (DV) andIdentificationAssumption (IA)
Main ImmigrantGroups Main Results
Rates of Return toSchooling: Immigrants(RRI), Natives (RRN)
Rates of Return to Experience:Immigrants (RREI), Natives (RREN);Rate of Return to Years SinceMigration (RRYSM)
(1) (2) (3) (4) (5) (6) (7) (8)
Edin, LaLonde,and Åslund(2000)
Sweden DA: LINDAdatabase,registry datafor immigrantsentering between1970 and 1990.SA: Individualsaged 18–55 yearsat the time ofimmigration.
DV: Log annualearnings.IA: Equal timeeffects.
Nordic countries,other OECDcountries, politicalmigrants fromYugoslavia, Iran,Iraq, Poland, andChile.
Economic migrants are much more likely to emigratethan political ones, with the least economicallysuccessful economic migrants most likely to leave.Immigrant earnings grew on average by around20,000SEK relative to natives during their first 10years in Sweden. Controlling for emigration, therelative earnings growth during the first ten yearsreduces to 13,500SEK on average. For OECDmigrants, the authors estimate negative assimilation.For non-OECD migrants, there is still substantialevidence for unconditional convergence, even afteraccounting for emigration. A failure to adjust foremigration leads to an overestimation of the rateof economic assimilation, especially for Nordic andOECD immigrants.
RRYSM from cross-sectional estimates:apart from Nordic women no positivereturns to YSM for economic migrants,but positve RRYSM for immigrantsfrom non-OECD countries. From thelongitudinal analysis: growth for non-OECD migrants slows down after a fewyears and cross-sectional results likely tobe driven by changes in cohort quality.
Friedberg(2000)
Israel DA: IsraeliCensus ofPopulation andHousing 1972and 1984.SA: Men aged25–65 years.Arabs excludedand only full-time, salaried,nonagriculturalworkers retained.
DV: Log monthlyearnings.IA: Equal cohorteffects, test inAppendix usingtwo cross sectionsthat one crosssection is sufficientto identifyassimilation rates.
Asia and Africa(largest emigrationcountry Morocco),Eastern Europe,USSR, andWesternHemisphere, andWestern Europe.
The gap in the residual earnings of immigrant andnative workers is eliminated once the national originof individual’s human capital is accounted for. Humancapital acquired abroad receives a lower return inthe host labor market than human capital acquireddomestically. Return to schooling obtained abroadis highest for immigrants from the West (7.1%) andlowest for immigrants from Asia and Africa (5.7%). Thereturns to experience acquired abroad are generallyinsignificant. The portability of home country educationvaries significantly with its level (elementary schooleducation equally valued in home and host country).
RRI : 8.0% for domesticschooling and 7.1% forforeign schooling. RRN:10.0% to domesticschooling.
RREI: 1.1% for each year of domesticexperience, 0.1% for each year offoreign experience. RREN: 1.7%,from estmation of restricted modelRRYSM: 0.8%.
Funkhouserand Trejo(1995)
United States DA: Specialsupplementsto CurrentPopulation Survey(CPS) 1979, 1983,1986, 1988 and1989.SA: Men agedbetween18 and 61 years.
DV: Log averagehourly earnings. IA:Equal time effects.
Mexico and otherLatin America,Europe, Canada,and Oceania, Asia(mainly Japan,Korea, China, andthe Philippines).
Tracking the immigrants’ skill levels through the1980s, the authors find that male immigrants whoentered during the late 1980s are more skilledthan those who arrived earlier in the decade. Thisrepresents a break from the steady decline inimmigrant skill levels that took place between 1940and 1980, but the average skill level of recentimmigrants remains low by historical standards.
RRI: 5.1%. RRN: 8.2%. RREI: 3.4% (sq: −0.0005).RREN: 5.1% (sq: −0.0008).RRYSM: 2.1% (sq: −0.0002).
Continued
418
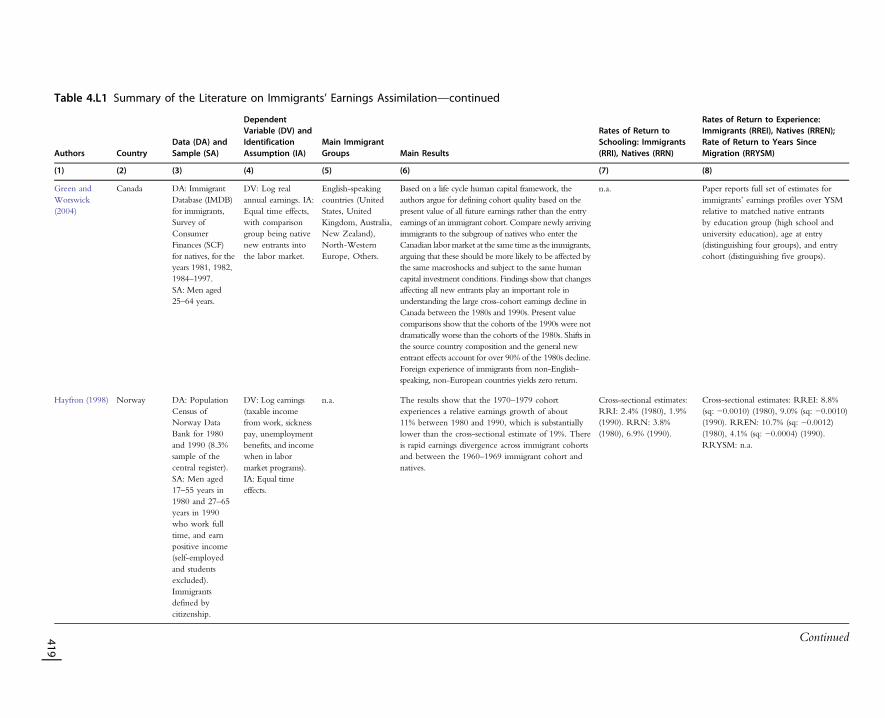
Table 4.L1 Summary of the Literature on Immigrants’ Earnings Assimilation—continued
Authors CountryData (DA) andSample (SA)
DependentVariable (DV) andIdentificationAssumption (IA)
Main ImmigrantGroups Main Results
Rates of Return toSchooling: Immigrants(RRI), Natives (RRN)
Rates of Return to Experience:Immigrants (RREI), Natives (RREN);Rate of Return to Years SinceMigration (RRYSM)
(1) (2) (3) (4) (5) (6) (7) (8)
Green andWorswick(2004)
Canada DA: ImmigrantDatabase (IMDB)for immigrants,Survey ofConsumerFinances (SCF)for natives, for theyears 1981, 1982,1984–1997.SA: Men aged25–64 years.
DV: Log realannual earnings. IA:Equal time effects,with comparisongroup being nativenew entrants intothe labor market.
English-speakingcountries (UnitedStates, UnitedKingdom, Australia,New Zealand),North-WesternEurope, Others.
Based on a life cycle human capital framework, theauthors argue for defining cohort quality based on thepresent value of all future earnings rather than the entryearnings of an immigrant cohort. Compare newly arrivingimmigrants to the subgroup of natives who enter theCanadian labor market at the same time as the immigrants,arguing that these should be more likely to be affected bythe same macroshocks and subject to the same humancapital investment conditions. Findings show that changesaffecting all new entrants play an important role inunderstanding the large cross-cohort earnings decline inCanada between the 1980s and 1990s. Present valuecomparisons show that the cohorts of the 1990s were notdramatically worse than the cohorts of the 1980s. Shifts inthe source country composition and the general newentrant effects account for over 90% of the 1980s decline.Foreign experience of immigrants from non-English-speaking, non-European countries yields zero return.
n.a. Paper reports full set of estimates forimmigrants’ earnings profiles over YSMrelative to matched native entrantsby education group (high school anduniversity education), age at entry(distinguishing four groups), and entrycohort (distinguishing five groups).
Hayfron (1998) Norway DA: PopulationCensus ofNorway DataBank for 1980and 1990 (8.3%sample of thecentral register).SA: Men aged17–55 years in1980 and 27–65years in 1990who work fulltime, and earnpositive income(self-employedand studentsexcluded).Immigrantsdefined bycitizenship.
DV: Log earnings(taxable incomefrom work, sicknesspay, unemploymentbenefits, and incomewhen in labormarket programs).IA: Equal timeeffects.
n.a. The results show that the 1970–1979 cohortexperiences a relative earnings growth of about11% between 1980 and 1990, which is substantiallylower than the cross-sectional estimate of 19%. Thereis rapid earnings divergence across immigrant cohortsand between the 1960–1969 immigrant cohort andnatives.
Cross-sectional estimates:RRI: 2.4% (1980), 1.9%(1990). RRN: 3.8%(1980), 6.9% (1990).
Cross-sectional estimates: RREI: 8.8%(sq: −0.0010) (1980), 9.0% (sq: −0.0010)(1990). RREN: 10.7% (sq: −0.0012)(1980), 4.1% (sq: −0.0004) (1990).RRYSM: n.a.
Continued419
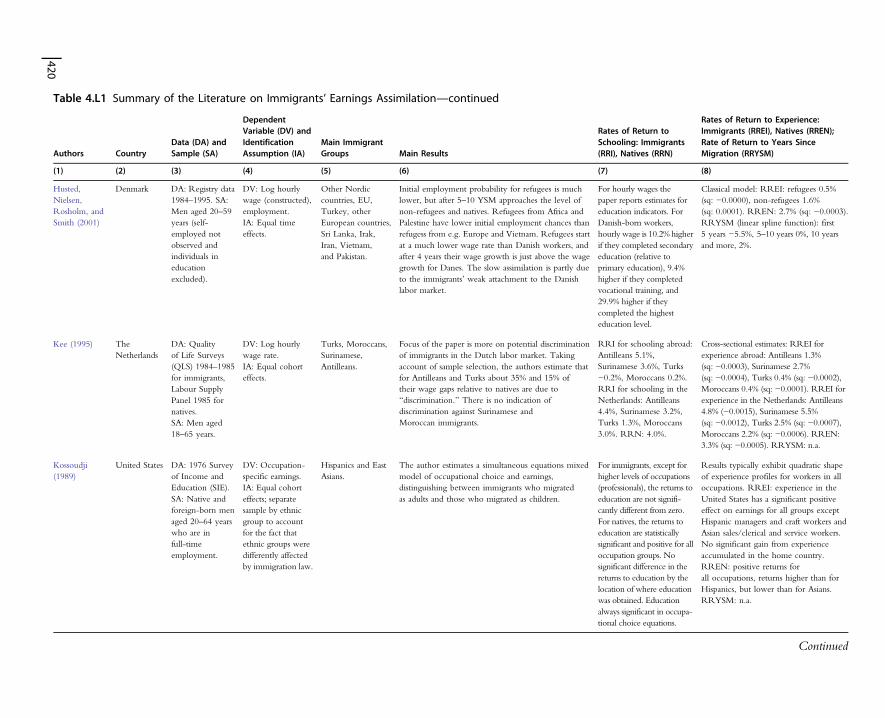
Table 4.L1 Summary of the Literature on Immigrants’ Earnings Assimilation—continued
Authors CountryData (DA) andSample (SA)
DependentVariable (DV) andIdentificationAssumption (IA)
Main ImmigrantGroups Main Results
Rates of Return toSchooling: Immigrants(RRI), Natives (RRN)
Rates of Return to Experience:Immigrants (RREI), Natives (RREN);Rate of Return to Years SinceMigration (RRYSM)
(1) (2) (3) (4) (5) (6) (7) (8)
Husted,Nielsen,Rosholm, andSmith (2001)
Denmark DA: Registry data1984–1995. SA:Men aged 20–59years (self-employed notobserved andindividuals ineducationexcluded).
DV: Log hourlywage (constructed),employment.IA: Equal timeeffects.
Other Nordiccountries, EU,Turkey, otherEuropean countries,Sri Lanka, Irak,Iran, Vietnam,and Pakistan.
Initial employment probability for refugees is muchlower, but after 5–10 YSM approaches the level ofnon-refugees and natives. Refugees from Africa andPalestine have lower initial employment chances thanrefugess from e.g. Europe and Vietnam. Refugees startat a much lower wage rate than Danish workers, andafter 4 years their wage growth is just above the wagegrowth for Danes. The slow assimilation is partly dueto the immigrants’ weak attachment to the Danishlabor market.
For hourly wages thepaper reports estimates foreducation indicators. ForDanish-born workers,hourly wage is 10.2% higherif they completed secondaryeducation (relative toprimary education), 9.4%higher if they completedvocational training, and29.9% higher if theycompleted the highesteducation level.
Classical model: RREI: refugees 0.5%(sq: −0.0000), non-refugees 1.6%(sq: 0.0001). RREN: 2.7% (sq: −0.0003).RRYSM (linear spline function): first5 years −5.5%, 5–10 years 0%, 10 yearsand more, 2%.
Kee (1995) TheNetherlands
DA: Qualityof Life Surveys(QLS) 1984–1985for immigrants,Labour SupplyPanel 1985 fornatives.SA: Men aged18–65 years.
DV: Log hourlywage rate.IA: Equal cohorteffects.
Turks, Moroccans,Surinamese,Antilleans.
Focus of the paper is more on potential discriminationof immigrants in the Dutch labor market. Takingaccount of sample selection, the authors estimate thatfor Antilleans and Turks about 35% and 15% oftheir wage gaps relative to natives are due to“discrimination.” There is no indication ofdiscrimination against Surinamese andMoroccan immigrants.
RRI for schooling abroad:Antilleans 5.1%,Surinamese 3.6%, Turks−0.2%, Moroccans 0.2%.RRI for schooling in theNetherlands: Antilleans4.4%, Surinamese 3.2%,Turks 1.3%, Moroccans3.0%. RRN: 4.0%.
Cross-sectional estimates: RREI forexperience abroad: Antilleans 1.3%(sq: −0.0003), Surinamese 2.7%(sq: −0.0004), Turks 0.4% (sq: −0.0002),Moroccans 0.4% (sq: −0.0001). RREI forexperience in the Netherlands: Antilleans4.8% (−0.0015), Surinamese 5.5%(sq: −0.0012), Turks 2.5% (sq: −0.0007),Moroccans 2.2% (sq: −0.0006). RREN:3.3% (sq: −0.0005). RRYSM: n.a.
Kossoudji(1989)
United States DA: 1976 Surveyof Income andEducation (SIE).SA: Native andforeign-born menaged 20–64 yearswho are infull-timeemployment.
DV: Occupation-specific earnings.IA: Equal cohorteffects; separatesample by ethnicgroup to accountfor the fact thatethnic groups weredifferently affectedby immigration law.
Hispanics and EastAsians.
The author estimates a simultaneous equations mixedmodel of occupational choice and earnings,distinguishing between immigrants who migratedas adults and those who migrated as children.
For immigrants, except forhigher levels of occupations(professionals), the returns toeducation are not signifi-cantly different from zero.For natives, the returns toeducation are statisticallysignificant and positive for alloccupation groups. Nosignificant difference in thereturns to education by thelocation of where educationwas obtained. Educationalways significant in occupa-tional choice equations.
Results typically exhibit quadratic shapeof experience profiles for workers in alloccupations. RREI: experience in theUnited States has a significant positiveeffect on earnings for all groups exceptHispanic managers and craft workers andAsian sales/clerical and service workers.No significant gain from experienceaccumulated in the home country.RREN: positive returns forall occupations, returns higher than forHispanics, but lower than for Asians.RRYSM: n.a.
Continued
420
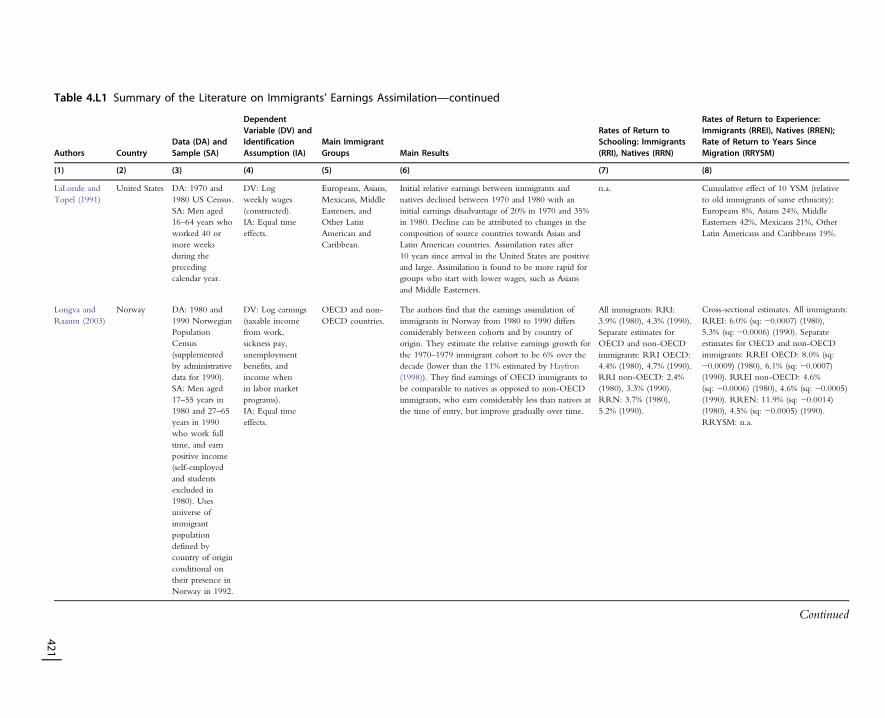
Table 4.L1 Summary of the Literature on Immigrants’ Earnings Assimilation—continued
Authors CountryData (DA) andSample (SA)
DependentVariable (DV) andIdentificationAssumption (IA)
Main ImmigrantGroups Main Results
Rates of Return toSchooling: Immigrants(RRI), Natives (RRN)
Rates of Return to Experience:Immigrants (RREI), Natives (RREN);Rate of Return to Years SinceMigration (RRYSM)
(1) (2) (3) (4) (5) (6) (7) (8)
LaLonde andTopel (1991)
United States DA: 1970 and1980 US Census.SA: Men aged16–64 years whoworked 40 ormore weeksduring theprecedingcalendar year.
DV: Logweekly wages(constructed).IA: Equal timeeffects.
Europeans, Asians,Mexicans, MiddleEasteners, andOther LatinAmerican andCaribbean.
Initial relative earnings between immigrants andnatives declined between 1970 and 1980 with aninitial earnings disadvantage of 20% in 1970 and 35%in 1980. Decline can be attributed to changes in thecomposition of source countries towards Asian andLatin American countries. Assimilation rates after10 years since arrival in the United States are positiveand large. Assimilation is found to be more rapid forgroups who start with lower wages, such as Asiansand Middle Easterners.
n.a. Cumulative effect of 10 YSM (relativeto old immigrants of same ethnicity):Europeans 8%, Asians 24%, MiddleEasterners 42%, Mexicans 21%, OtherLatin Americans and Caribbeans 19%.
Longva andRaaum (2003)
Norway DA: 1980 and1990 NorwegianPopulationCensus(supplementedby administrativedata for 1990).SA: Men aged17–55 years in1980 and 27–65years in 1990who work fulltime, and earnpositive income(self-employedand studentsexcluded in1980). Usesuniverse ofimmigrantpopulationdefined bycountry of originconditional ontheir presence inNorway in 1992.
DV: Log earnings(taxable incomefrom work,sickness pay,unemploymentbenefits, andincome whenin labor marketprograms).IA: Equal timeeffects.
OECD and non-OECD countries.
The authors find that the earnings assimilation ofimmigrants in Norway from 1980 to 1990 differsconsiderably between cohorts and by country oforigin. They estimate the relative earnings growth forthe 1970–1979 immigrant cohort to be 6% over thedecade (lower than the 11% estimated by Hayfron(1998)). They find earnings of OECD immigrants tobe comparable to natives as opposed to non-OECDimmigrants, who earn considerably less than natives atthe time of entry, but improve gradually over time.
All immigrants: RRI:3.9% (1980), 4.3% (1990).Separate estimates forOECD and non-OECDimmigrants: RRI OECD:4.4% (1980), 4.7% (1990).RRI non-OECD: 2.4%(1980), 3.3% (1990).RRN: 3.7% (1980),5.2% (1990).
Cross-sectional estimates. All immigrants:RREI: 6.0% (sq: −0.0007) (1980),5.3% (sq: −0.0006) (1990). Separateestimates for OECD and non-OECDimmigrants: RREI OECD: 8.0% (sq:−0.0009) (1980), 6.1% (sq: −0.0007)(1990). RREI non-OECD: 4.6%(sq: −0.0006) (1980), 4.6% (sq: −0.0005)(1990). RREN: 11.9% (sq: −0.0014)(1980), 4.5% (sq: −0.0005) (1990).RRYSM: n.a.
Continued
421
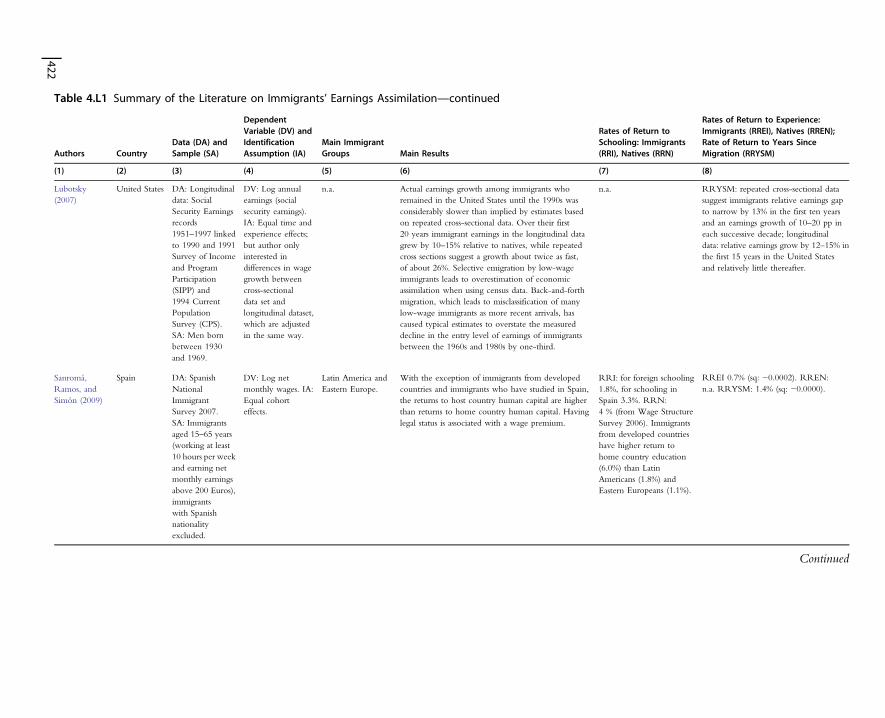
Table 4.L1 Summary of the Literature on Immigrants’ Earnings Assimilation—continued
Authors CountryData (DA) andSample (SA)
DependentVariable (DV) andIdentificationAssumption (IA)
Main ImmigrantGroups Main Results
Rates of Return toSchooling: Immigrants(RRI), Natives (RRN)
Rates of Return to Experience:Immigrants (RREI), Natives (RREN);Rate of Return to Years SinceMigration (RRYSM)
(1) (2) (3) (4) (5) (6) (7) (8)
Lubotsky(2007)
United States DA: Longitudinaldata: SocialSecurity Earningsrecords1951–1997 linkedto 1990 and 1991Survey of Incomeand ProgramParticipation(SIPP) and1994 CurrentPopulationSurvey (CPS).SA: Men bornbetween 1930and 1969.
DV: Log annualearnings (socialsecurity earnings).IA: Equal time andexperience effects;but author onlyinterested indifferences in wagegrowth betweencross-sectionaldata set andlongitudinal dataset,which are adjustedin the same way.
n.a. Actual earnings growth among immigrants whoremained in the United States until the 1990s wasconsiderably slower than implied by estimates basedon repeated cross-sectional data. Over their first20 years immigrant earnings in the longitudinal datagrew by 10–15% relative to natives, while repeatedcross sections suggest a growth about twice as fast,of about 26%. Selective emigration by low-wageimmigrants leads to overestimation of economicassimilation when using census data. Back-and-forthmigration, which leads to misclassification of manylow-wage immigrants as more recent arrivals, hascaused typical estimates to overstate the measureddecline in the entry level of earnings of immigrantsbetween the 1960s and 1980s by one-third.
n.a. RRYSM: repeated cross-sectional datasuggest immigrants relative earnings gapto narrow by 13% in the first ten yearsand an earnings growth of 10–20 pp ineach successive decade; longitudinaldata: relative earnings grow by 12–15% inthe first 15 years in the United Statesand relatively little thereafter.
Sanromá,Ramos, andSimón (2009)
Spain DA: SpanishNationalImmigrantSurvey 2007.SA: Immigrantsaged 15–65 years(working at least10 hours per weekand earning netmonthly earningsabove 200 Euros),immigrantswith Spanishnationalityexcluded.
DV: Log netmonthly wages. IA:Equal cohorteffects.
Latin America andEastern Europe.
With the exception of immigrants from developedcountries and immigrants who have studied in Spain,the returns to host country human capital are higherthan returns to home country human capital. Havinglegal status is associated with a wage premium.
RRI: for foreign schooling1.8%, for schooling inSpain 3.3%. RRN:4 % (from Wage StructureSurvey 2006). Immigrantsfrom developed countrieshave higher return tohome country education(6.0%) than LatinAmericans (1.8%) andEastern Europeans (1.1%).
RREI 0.7% (sq: −0.0002). RREN:n.a. RRYSM: 1.4% (sq: −0.0000).
Continued
422
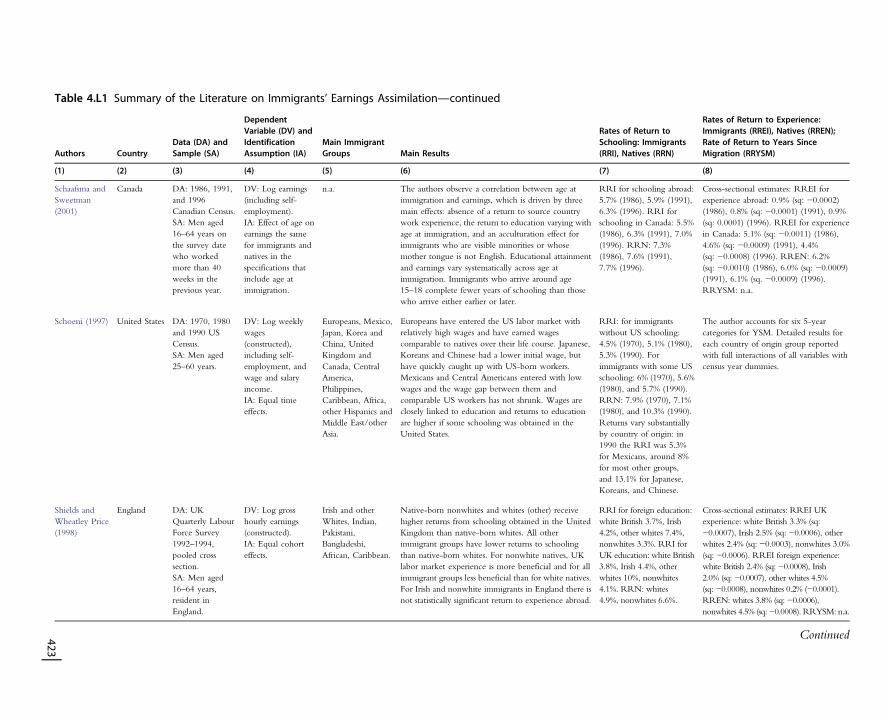
Table 4.L1 Summary of the Literature on Immigrants’ Earnings Assimilation—continued
Authors CountryData (DA) andSample (SA)
DependentVariable (DV) andIdentificationAssumption (IA)
Main ImmigrantGroups Main Results
Rates of Return toSchooling: Immigrants(RRI), Natives (RRN)
Rates of Return to Experience:Immigrants (RREI), Natives (RREN);Rate of Return to Years SinceMigration (RRYSM)
(1) (2) (3) (4) (5) (6) (7) (8)
Schaafsma andSweetman(2001)
Canada DA: 1986, 1991,and 1996Canadian Census.SA: Men aged16–64 years onthe survey datewho workedmore than 40weeks in theprevious year.
DV: Log earnings(including self-employment).IA: Effect of age onearnings the samefor immigrants andnatives in thespecifications thatinclude age atimmigration.
n.a. The authors observe a correlation between age atimmigration and earnings, which is driven by threemain effects: absence of a return to source countrywork experience, the return to education varying withage at immigration, and an acculturation effect forimmigrants who are visible minorities or whosemother tongue is not English. Educational attainmentand earnings vary systematically across age atimmigration. Immigrants who arrive around age15–18 complete fewer years of schooling than thosewho arrive either earlier or later.
RRI for schooling abroad:5.7% (1986), 5.9% (1991),6.3% (1996). RRI forschooling in Canada: 5.5%(1986), 6.3% (1991), 7.0%(1996). RRN: 7.3%(1986), 7.6% (1991),7.7% (1996).
Cross-sectional estimates: RREI forexperience abroad: 0.9% (sq: −0.0002)(1986), 0.8% (sq: −0.0001) (1991), 0.9%(sq: 0.0001) (1996). RREI for experiencein Canada: 5.1% (sq: −0.0011) (1986),4.6% (sq: −0.0009) (1991), 4.4%(sq: −0.0008) (1996). RREN: 6.2%(sq: −0.0010) (1986), 6.0% (sq: −0.0009)(1991), 6.1% (sq. −0.0009) (1996).RRYSM: n.a.
Schoeni (1997) United States DA: 1970, 1980and 1990 USCensus.SA: Men aged25–60 years.
DV: Log weeklywages(constructed),including self-employment, andwage and salaryincome.IA: Equal timeeffects.
Europeans, Mexico,Japan, Korea andChina, UnitedKingdom andCanada, CentralAmerica,Philippines,Caribbean, Africa,other Hispanics andMiddle East/otherAsia.
Europeans have entered the US labor market withrelatively high wages and have earned wagescomparable to natives over their life course. Japanese,Koreans and Chinese had a lower initial wage, buthave quickly caught up with US-born workers.Mexicans and Central Americans entered with lowwages and the wage gap between them andcomparable US workers has not shrunk. Wages areclosely linked to education and returns to educationare higher if some schooling was obtained in theUnited States.
RRI: for immigrantswithout US schooling:4.5% (1970), 5.1% (1980),5.3% (1990). Forimmigrants with some USschooling: 6% (1970), 5.6%(1980), and 5.7% (1990).RRN: 7.9% (1970), 7.1%(1980), and 10.3% (1990).Returns vary substantiallyby country of origin: in1990 the RRI was 5.3%for Mexicans, around 8%for most other groups,and 13.1% for Japanese,Koreans, and Chinese.
The author accounts for six 5-yearcategories for YSM. Detailed results foreach country of origin group reportedwith full interactions of all variables withcensus year dummies.
Shields andWheatley Price(1998)
England DA: UKQuarterly LabourForce Survey1992–1994,pooled crosssection.SA: Men aged16–64 years,resident inEngland.
DV: Log grosshourly earnings(constructed).IA: Equal cohorteffects.
Irish and otherWhites, Indian,Pakistani,Bangladeshi,African, Caribbean.
Native-born nonwhites and whites (other) receivehigher returns from schooling obtained in the UnitedKingdom than native-born whites. All otherimmigrant groups have lower returns to schoolingthan native-born whites. For nonwhite natives, UKlabor market experience is more beneficial and for allimmigrant groups less beneficial than for white natives.For Irish and nonwhite immigrants in England there isnot statistically significant return to experience abroad.
RRI for foreign education:white British 3.7%, Irish4.2%, other whites 7.4%,nonwhites 3.3%. RRI forUK education: white British3.8%, Irish 4.4%, otherwhites 10%, nonwhites4.1%. RRN: whites4.9%, nonwhites 6.6%.
Cross-sectional estimates: RREI UKexperience: white British 3.3% (sq:−0.0007), Irish 2.5% (sq: −0.0006), otherwhites 2.4% (sq: −0.0003), nonwhites 3.0%(sq: −0.0006). RREI foreign experience:white British 2.4% (sq: −0.0008), Irish2.0% (sq: −0.0007), other whites 4.5%(sq: −0.0008), nonwhites 0.2% (−0.0001).RREN: whites 3.8% (sq: −0.0006),nonwhites 4.5% (sq:−0.0008). RRYSM: n.a.
Continued423
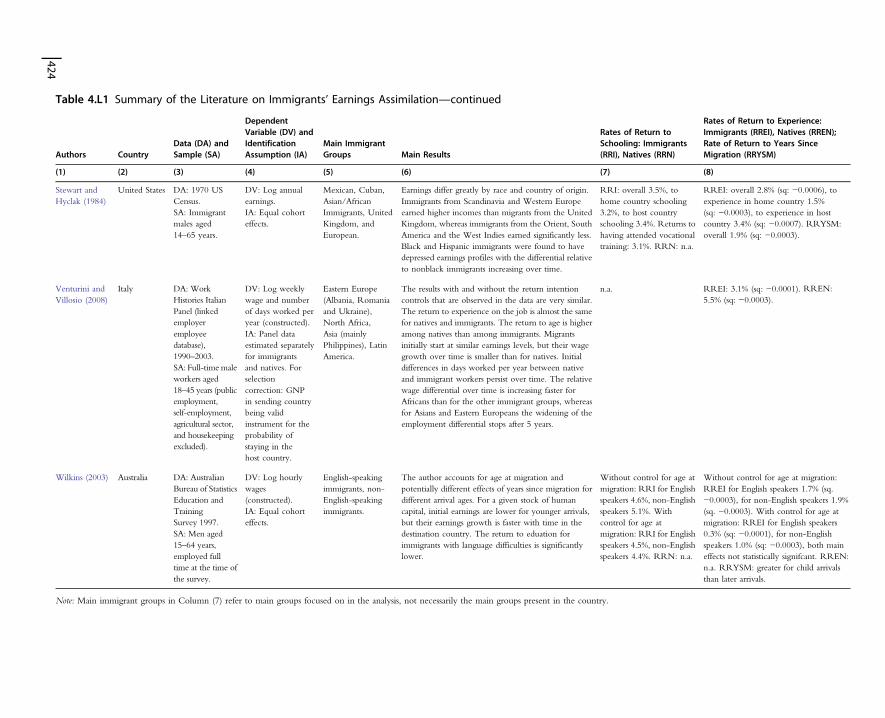
Table 4.L1 Summary of the Literature on Immigrants’ Earnings Assimilation—continued
Authors CountryData (DA) andSample (SA)
DependentVariable (DV) andIdentificationAssumption (IA)
Main ImmigrantGroups Main Results
Rates of Return toSchooling: Immigrants(RRI), Natives (RRN)
Rates of Return to Experience:Immigrants (RREI), Natives (RREN);Rate of Return to Years SinceMigration (RRYSM)
(1) (2) (3) (4) (5) (6) (7) (8)
Stewart andHyclak (1984)
United States DA: 1970 USCensus.SA: Immigrantmales aged14–65 years.
DV: Log annualearnings.IA: Equal cohorteffects.
Mexican, Cuban,Asian/AfricanImmigrants, UnitedKingdom, andEuropean.
Earnings differ greatly by race and country of origin.Immigrants from Scandinavia and Western Europeearned higher incomes than migrants from the UnitedKingdom, whereas immigrants from the Orient, SouthAmerica and the West Indies earned significantly less.Black and Hispanic immigrants were found to havedepressed earnings profiles with the differential relativeto nonblack immigrants increasing over time.
RRI: overall 3.5%, tohome country schooling3.2%, to host countryschooling 3.4%. Returns tohaving attended vocationaltraining: 3.1%. RRN: n.a.
RREI: overall 2.8% (sq: −0.0006), toexperience in home country 1.5%(sq: −0.0003), to experience in hostcountry 3.4% (sq: −0.0007). RRYSM:overall 1.9% (sq: −0.0003).
Venturini andVillosio (2008)
Italy DA: WorkHistories ItalianPanel (linkedemployeremployeedatabase),1990–2003.SA: Full-timemaleworkers aged18–45 years (publicemployment,self-employment,agricultural sector,and housekeepingexcluded).
DV: Log weeklywage and numberof days worked peryear (constructed).IA: Panel dataestimated separatelyfor immigrantsand natives. Forselectioncorrection: GNPin sending countrybeing validinstrument for theprobability ofstaying in thehost country.
Eastern Europe(Albania, Romaniaand Ukraine),North Africa,Asia (mainlyPhilippines), LatinAmerica.
The results with and without the return intentioncontrols that are observed in the data are very similar.The return to experience on the job is almost the samefor natives and immigrants. The return to age is higheramong natives than among immigrants. Migrantsinitially start at similar earnings levels, but their wagegrowth over time is smaller than for natives. Initialdifferences in days worked per year between nativeand immigrant workers persist over time. The relativewage differential over time is increasing faster forAfricans than for the other immigrant groups, whereasfor Asians and Eastern Europeans the widening of theemployment differential stops after 5 years.
n.a. RREI: 3.1% (sq: −0.0001). RREN:5.5% (sq: −0.0003).
Wilkins (2003) Australia DA: AustralianBureau of StatisticsEducation andTrainingSurvey 1997.SA: Men aged15–64 years,employed fulltime at the time ofthe survey.
DV: Log hourlywages(constructed).IA: Equal cohorteffects.
English-speakingimmigrants, non-English-speakingimmigrants.
The author accounts for age at migration andpotentially different effects of years since migration fordifferent arrival ages. For a given stock of humancapital, initial earnings are lower for younger arrivals,but their earnings growth is faster with time in thedestination country. The return to eduation forimmigrants with language difficulties is significantlylower.
Without control for age atmigration: RRI for Englishspeakers 4.6%, non-Englishspeakers 5.1%. Withcontrol for age atmigration: RRI for Englishspeakers 4.5%, non-Englishspeakers 4.4%. RRN: n.a.
Without control for age at migration:RREI for English speakers 1.7% (sq.−0.0003), for non-English speakers 1.9%(sq. −0.0003). With control for age atmigration: RREI for English speakers0.3% (sq: −0.0001), for non-Englishspeakers 1.0% (sq: −0.0003), both maineffects not statistically signifcant. RREN:n.a. RRYSM: greater for child arrivalsthan later arrivals.
Note: Main immigrant groups in Column (7) refer to main groups focused on in the analysis, not necessarily the main groups present in the country.
424
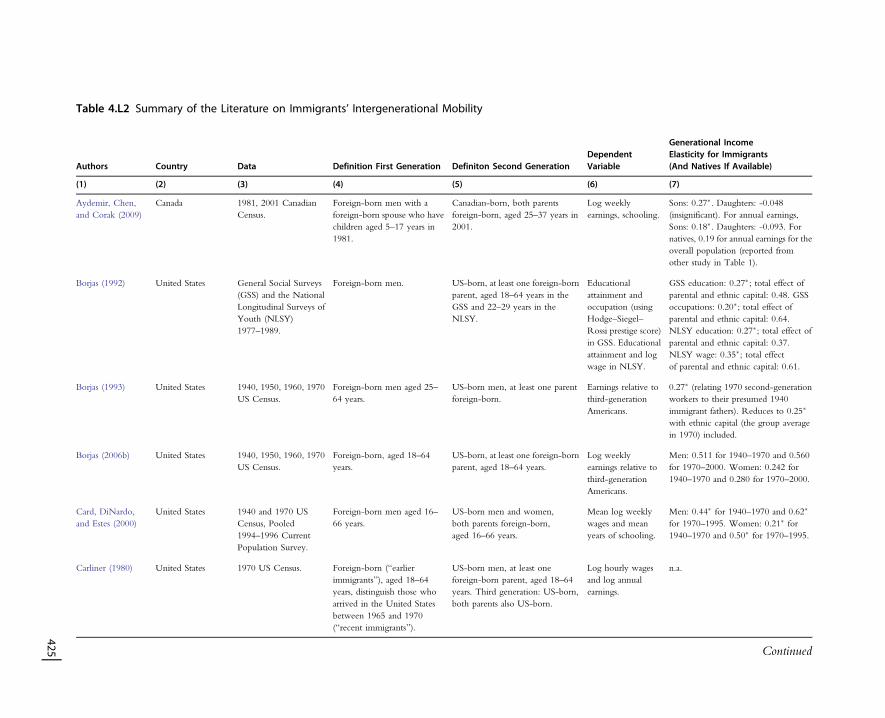
Table 4.L2 Summary of the Literature on Immigrants’ Intergenerational Mobility
Authors Country Data Definition First Generation Definiton Second GenerationDependentVariable
Generational IncomeElasticity for Immigrants(And Natives If Available)
(1) (2) (3) (4) (5) (6) (7)
Aydemir, Chen,and Corak (2009)
Canada 1981, 2001 CanadianCensus.
Foreign-born men with aforeign-born spouse who havechildren aged 5–17 years in1981.
Canadian-born, both parentsforeign-born, aged 25–37 years in2001.
Log weeklyearnings, schooling.
Sons: 0.27�. Daughters: -0.048(insignificant). For annual earnings,Sons: 0.18�. Daughters: -0.093. Fornatives, 0.19 for annual earnings for theoverall population (reported fromother study in Table 1).
Borjas (1992) United States General Social Surveys(GSS) and the NationalLongitudinal Surveys ofYouth (NLSY)1977–1989.
Foreign-born men. US-born, at least one foreign-bornparent, aged 18–64 years in theGSS and 22–29 years in theNLSY.
Educationalattainment andoccupation (usingHodge–Siegel–Rossi prestige score)in GSS. Educationalattainment and logwage in NLSY.
GSS education: 0.27�; total effect ofparental and ethnic capital: 0.48. GSSoccupations: 0.20�; total effect ofparental and ethnic capital: 0.64.NLSY education: 0.27�; total effect ofparental and ethnic capital: 0.37.NLSY wage: 0.35�; total effectof parental and ethnic capital: 0.61.
Borjas (1993) United States 1940, 1950, 1960, 1970US Census.
Foreign-born men aged 25–64 years.
US-born men, at least one parentforeign-born.
Earnings relative tothird-generationAmericans.
0.27� (relating 1970 second-generationworkers to their presumed 1940immigrant fathers). Reduces to 0.25�
with ethnic capital (the group averagein 1970) included.
Borjas (2006b) United States 1940, 1950, 1960, 1970US Census.
Foreign-born, aged 18–64years.
US-born, at least one foreign-bornparent, aged 18–64 years.
Log weeklyearnings relative tothird-generationAmericans.
Men: 0.511 for 1940–1970 and 0.560for 1970–2000. Women: 0.242 for1940–1970 and 0.280 for 1970–2000.
Card, DiNardo,and Estes (2000)
United States 1940 and 1970 USCensus, Pooled1994–1996 CurrentPopulation Survey.
Foreign-born men aged 16–66 years.
US-born men and women,both parents foreign-born,aged 16–66 years.
Mean log weeklywages and meanyears of schooling.
Men: 0.44� for 1940–1970 and 0.62�
for 1970–1995. Women: 0.21� for1940–1970 and 0.50� for 1970–1995.
Carliner (1980) United States 1970 US Census. Foreign-born (“earlierimmigrants”), aged 18–64years, distinguish those whoarrived in the United Statesbetween 1965 and 1970(“recent immigrants”).
US-born men, at least oneforeign-born parent, aged 18–64years. Third generation: US-born,both parents also US-born.
Log hourly wagesand log annualearnings.
n.a.
Continued
425
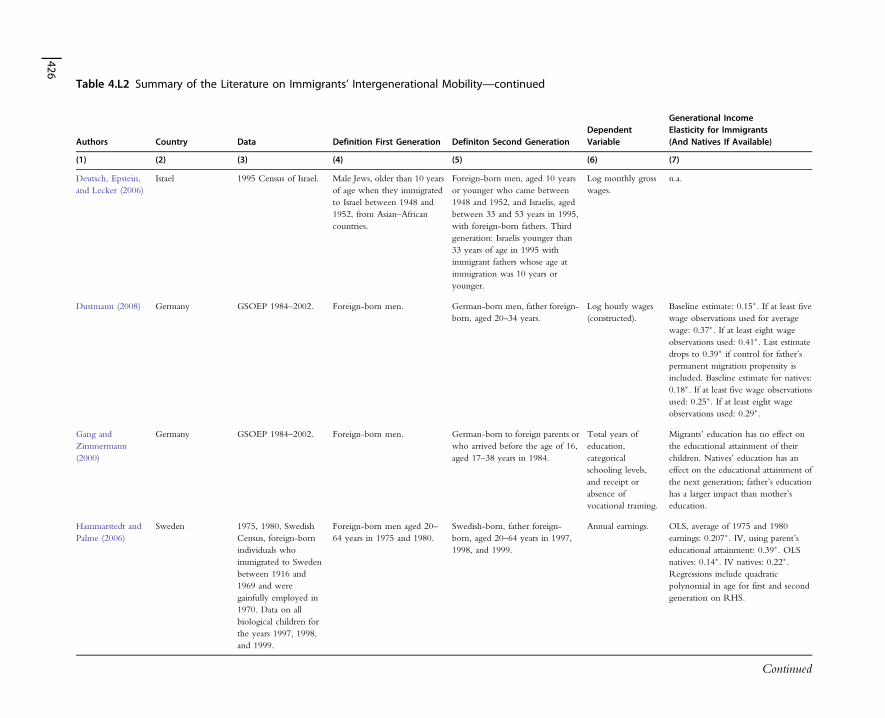
Table 4.L2 Summary of the Literature on Immigrants’ Intergenerational Mobility—continued
Authors Country Data Definition First Generation Definiton Second GenerationDependentVariable
Generational IncomeElasticity for Immigrants(And Natives If Available)
(1) (2) (3) (4) (5) (6) (7)
Deutsch, Epstein,and Lecker (2006)
Israel 1995 Census of Israel. Male Jews, older than 10 yearsof age when they immigratedto Israel between 1948 and1952, from Asian–Africancountries.
Foreign-born men, aged 10 yearsor younger who came between1948 and 1952, and Israelis, agedbetween 33 and 53 years in 1995,with foreign-born fathers. Thirdgeneration: Israelis younger than33 years of age in 1995 withimmigrant fathers whose age atimmigration was 10 years oryounger.
Log monthly grosswages.
n.a.
Dustmann (2008) Germany GSOEP 1984–2002. Foreign-born men. German-born men, father foreign-born, aged 20–34 years.
Log hourly wages(constructed).
Baseline estimate: 0.15�. If at least fivewage observations used for averagewage: 0.37�. If at least eight wageobservations used: 0.41�. Last estimatedrops to 0.39� if control for father’spermanent migration propensity isincluded. Baseline estimate for natives:0.18�. If at least five wage observationsused: 0.25�. If at least eight wageobservations used: 0.29�.
Gang andZimmermann(2000)
Germany GSOEP 1984–2002. Foreign-born men. German-born to foreign parents orwho arrived before the age of 16,aged 17–38 years in 1984.
Total years ofeducation,categoricalschooling levels,and receipt orabsence ofvocational training.
Migrants’ education has no effect onthe educational attainment of theirchildren. Natives’ education has aneffect on the educational attainment ofthe next generation; father’s educationhas a larger impact than mother’seducation.
Hammarstedt andPalme (2006)
Sweden 1975, 1980, SwedishCensus, foreign-bornindividuals whoimmigrated to Swedenbetween 1916 and1969 and weregainfully employed in1970. Data on allbiological children forthe years 1997, 1998,and 1999.
Foreign-born men aged 20–64 years in 1975 and 1980.
Swedish-born, father foreign-born, aged 20–64 years in 1997,1998, and 1999.
Annual earnings. OLS, average of 1975 and 1980earnings: 0.207�. IV, using parent’seducational attainment: 0.39�. OLSnatives: 0.14�. IV natives: 0.22�.Regressions include quadraticpolynomial in age for first and secondgeneration on RHS.
Continued
426
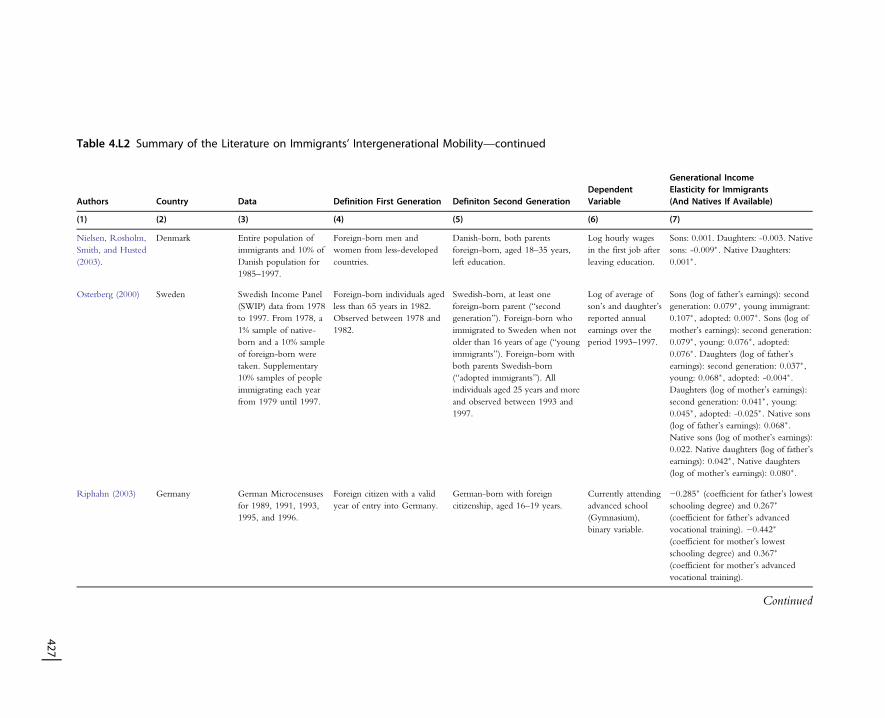
Table 4.L2 Summary of the Literature on Immigrants’ Intergenerational Mobility—continued
Authors Country Data Definition First Generation Definiton Second GenerationDependentVariable
Generational IncomeElasticity for Immigrants(And Natives If Available)
(1) (2) (3) (4) (5) (6) (7)
Nielsen, Rosholm,Smith, and Husted(2003).
Denmark Entire population ofimmigrants and 10% ofDanish population for1985–1997.
Foreign-born men andwomen from less-developedcountries.
Danish-born, both parentsforeign-born, aged 18–35 years,left education.
Log hourly wagesin the first job afterleaving education.
Sons: 0.001. Daughters: -0.003. Nativesons: -0.009�. Native Daughters:0.001�.
Osterberg (2000) Sweden Swedish Income Panel(SWIP) data from 1978to 1997. From 1978, a1% sample of native-born and a 10% sampleof foreign-born weretaken. Supplementary10% samples of peopleimmigrating each yearfrom 1979 until 1997.
Foreign-born individuals agedless than 65 years in 1982.Observed between 1978 and1982.
Swedish-born, at least oneforeign-born parent (“secondgeneration”). Foreign-born whoimmigrated to Sweden when notolder than 16 years of age (“youngimmigrants”). Foreign-born withboth parents Swedish-born(“adopted immigrants”). Allindividuals aged 25 years and moreand observed between 1993 and1997.
Log of average ofson’s and daughter’sreported annualearnings over theperiod 1993–1997.
Sons (log of father’s earnings): secondgeneration: 0.079�, young immigrant:0.107�, adopted: 0.007�. Sons (log ofmother’s earnings): second generation:0.079�, young: 0.076�, adopted:0.076�. Daughters (log of father’searnings): second generation: 0.037�,young: 0.068�, adopted: -0.004�.Daughters (log of mother’s earnings):second generation: 0.041�, young:0.045�, adopted: -0.025�. Native sons(log of father’s earnings): 0.068�.Native sons (log of mother’s earnings):0.022. Native daughters (log of father’searnings): 0.042�, Native daughters(log of mother’s earnings): 0.080�.
Riphahn (2003) Germany German Microcensusesfor 1989, 1991, 1993,1995, and 1996.
Foreign citizen with a validyear of entry into Germany.
German-born with foreigncitizenship, aged 16–19 years.
Currently attendingadvanced school(Gymnasium),binary variable.
−0.285� (coefficient for father’s lowestschooling degree) and 0.267�
(coefficient for father’s advancedvocational training). −0.442�
(coefficient for mother’s lowestschooling degree) and 0.367�
(coefficient for mother’s advancedvocational training).
Continued
427

Table 4.L2 Summary of the Literature on Immigrants’ Intergenerational Mobility—continued
Authors Country Data Definition First Generation Definiton Second GenerationDependentVariable
Generational IncomeElasticity for Immigrants(And Natives If Available)
(1) (2) (3) (4) (5) (6) (7)
Smith (2003) United States Census (1940–1970)and Current PopulationSurvey (CPS); specialsupplements from1979, 1983, 1986, and1988 and CPS from1994–1998.
Foreign-born men. US-born men, at least oneforeign-born parent. Thirdgeneration or more: both parentsUS-born.
Years of schoolingand log wages.
Years of schooling: 0.50� (secondgeneration regressed on first) and 0.22�
(third generation regressed on second).Log wages: 0.46� (second generationregressed on first) and 0.27� (thirdgeneration regressed on second).
Trejo (2003) United States Current PopulationSurvey, 1979 and 1989.
Foreign-born, parents alsoforeign-born, aged over 16years.
US-born men, at least oneforeign-born parent, aged 18–61years. Third generation: US-bornwhose parents are also US-born.
Log hourly earnings(constructed).
n.a.
Note: A (�) indicates statistical significance at the 5 percent level.
428
REFERENCESAcemoglu, D., Autor, D., 2010. Skills, Tasks and Technologies: Implications for Employment and Earn-
ings. In: Ashenfelter, O., Card, D. (Eds.), Handbook of Labor Economics. Vol. 4. Elsevier-North Hol-land, Amsterdam forthcoming.
Acosta, P., 2006. Labor Supply, School Attendance, and Remittances from International Migration: theCase of El Salvador World Bank Policy Research Working Paper No. 3903.
Algan, Y., Dustmann, C., Glitz, A., Manning, A., 2010. The Economic Situation of First- and Second-Generation Immigrants in France, Germany, and the UK. Econ. J. 120 (542), F4–F30.
Altonji, J.G., Card, D., 1991. The Effects of Immigration on the Labor Market Outcomes of Less-skilledNatives. In: Abowd, J.M., Freeman, R.B. (Eds.), Immigration, Trade, and the Labor Market. Univer-sity of Chicago Press, Chicago, pp. 201–234 (Chapter 7).
Antman, F., 2009. The Intergenerational Effects of Paternal Migration on Schooling: What Can We Learnfrom Children’s Time Allocations? Department of Economics, University of Colorado at BoulderWorking Paper No. 08‒03.
Aydemir, A., Borjas, G.J., 2007. Cross-Country Variation in the Impact of International Migration:Canada, Mexico, and the United States. J. Eur. Econ. Assoc. 5 (4), 663–708.
Aydemir, A., Chen, W.-H., Corak, M., 2009. Intergenerational Earnings Mobility Among the Children ofCanadian Immigrants. Rev. Econ. Stat. 91 (2), 377–397.
Aydemir, A., Robinson, C., 2008. Global Labour Markets, Return and Onward Migration. Can. J. Econ.41 (4), 1285–1311.
Autor, D.H., Levy, F., Murnane, R.J., 2003. The Skill Content of Recent Technological Change: AnEmpirical Exploration. Q. J. Econ. 118 (4), 1279–1334.
Baker, M., Benjamin, D., 1994. The Performance of Immigrants in the Canadian Labor Market. J. LaborEcon. 12 (3), 369–405.
Barrett, A., O’Connell, P.J., 2001. Is There a Wage Premium for Returning Irish Migrants? Econ. Soc.Rev. 32 (1), 1–21.
Bartel, A., 1989. Where Do the New U.S. Immigrants Live? J. Labor Econ. 7 (4), 371–391.Barth, E., Bratsberg, B., Raaum, O., 2004. Identifying Earnings Assimilation of Immigrants under Chang-
ing Macroeconomic Conditions. Scand. J. Econ. 106 (1), 1–22.Barth, E., Bratsberg, B., Raaum, O., 2006. Local Unemployment and the Relative Wages of Immigrants:
Evidence from the Current Population Surveys. Rev. Econ. Stat. 88 (2), 243–263.Basilio, L., Bauer, T., 2010. Transferability of Human Capital and Immigrant Assimilation: An Analysis for
Germany. IZA Discussion Paper No. 4716.Becker, G.S., Tomes, N., 1979. An Equilibrium Theory of the Distribution of Income and Intergenera-
tional Mobility. J. Polit. Econ. 87 (6), 1153–1189.Beggs, J.J., Chapman, B.J., 1988a. The International Transferability of Human Capital: Immigrant Labour
Market Outcomes in Australia. In: Baker, L., Miller, P. (Eds.), The Economics of Immigration. Aus-tralian Government Publishing Service, Canberra, pp. 143–147.
Beggs, J.J., Chapman, B.J., 1988b. Immigrant Wage Adjustment in Australia: Cross Section and Time-Ser-ies Estimates. Econ. Rec. 64 (186), 161–167.
Behrman, J., Taubman, P., 1985. Intergenerational Earnings Mobility in the United States: Some Esti-mates and a Test of Becker’s Intergenerational Endowment’s Model. Rev. Econ. Stat. 67 (1),141–151.
Beine, M., Defoort, C., Docquier, F., 2010. A Panel Data Analysis of the Brain Gain. World Dev.forthcoming.
Beine, M., Docquier, F., Rapoport, H., 2001. Brain Drain and Economic Growth: Theory and Evidence.J. Dev. Econ. 64 (1), 275–289.
Beine, M., Docquier, F., Rapoport, H., 2008. Brain Drain and Human Capital Formation in DevelopingCountries: Winners and Losers. Econ. J. 118 (528), 631–652.
Bell, B.D., 1997. The Performance of Immigrants in the United Kingdom: Evidence from the GHS. Econ.J. 107 (441), 333–344.
Migration and Education 429
Belot, M.V.K., Hatton, T.J., 2008. Immigrant Selection in the OECD. CEPR Discussion Paper No. 6675.Ben-Porath, Y., 1967. The Production of Human Capital and the Life Cycle of Earnings. J. Polit. Econ.
75 (4), 352–365.Berman, E., Lang, K., Siniver, E., 2003. Language-skill Complementarity: Returns to Immigrant Language
Acquisition. Labour Econ. 10, 265–290.Bertoli, Simone, 2010. The Informational Structure of Migration Decision and Migrants Self-Selection.
Economics Letters, Vol. 108 (1), pp. 89–92.Betts, J., Fairlie, R., 2003. Does Immigration Induce ‘Native Flight’ from Public Schools into Private
Schools? J. Public Econ. 87 (5‒6), 987–1012.Bijwaard, G.E., 2004. Dynamic Economic Aspects of Migration. Medium Econometrische Toepassingen
12 (3), 26–30.Bishop, K.C., 2008. A Dynamic Model of Location Choice and Hedonic Valuation Unpublished Working
Paper.Björklund, A., Jäntti, M., 1997. Intergenerational Income Mobility in Sweden Compared to the United
States. Am. Econ. Rev. 87 (5), 1009–1018.Blanden, J., Goodman, A., Gregg, P., Machin, S., 2004. Changes in Intergenerational Mobility in Britain.
In: Corak, M. (Ed.), Generational Income Mobility in North America and Europe. CambridgeUniversity Press, pp. 122–146.
Bleakley, H., Chin, A., 2004. Language Skills and Earnings: Evidence from Childhood Immigrants. Rev.Econ. Stat. 86 (2), 481–496.
Bleakley, H., Chin, A., 2008. What Holds Back the Second Generation? The Intergenerational Transmis-sion of Language Human Capital among Immigrants. J. Hum. Resour. 43 (2), 267–298.
Borjas, G.J., 1982. The Earnings of Male Hispanic Immigrants in the United States. Ind. Labor Relat. Rev.35, 343–353.
Borjas, G.J., 1985. Assimilation, Changes in Cohort Quality, and the Earnings of Immigrants. J. LaborEcon. 3 (4), 463–489.
Borjas, G.J., 1987. Self-Selection and the Earnings of Immigrants. Am. Econ. Rev. 77 (4), 531–553.Borjas, G.J., 1992. Ethnic Capital and Intergenerational Mobility. Q. J. Econ. 107 (1), 123–150.Borjas, G.J., 1993. The Intergenerational Mobility of Immigrants. J. Labor Econ. 11 (1), 113–135.Borjas, G.J., 1994. Long-Run Convergence of Ethnic Skill Differentials: The Children and Grandchildren
of the Great Migration. Ind. Labor Relat. Rev. 47 (4), 553–573.Borjas, G.J., 1995a. Assimilation and Changes in Cohort Quality Revisited: What Happened to Immigrant
Earnings in the 1980s? J. Labor Econ. 13 (2), 201–245.Borjas, G.J., 1995b. Ethnicity, Neighborhoods, and Human-Capital Externalities. Am. Econ. Rev. 85 (3),
365–390.Borjas, G.J., 1999. The Economic Analysis of Immigration. In: Ashenfelter, O., Card, D. (Eds.), Handbook
of Labor Economics Vol. 3. (3), 1697–1760 (Chapter 28).Borjas, G.J., 2000. The Economic Progress of Immigrants. In: Borjas, G.J. (Ed.), Issues in the Economics of
Immigration, NBER Books, pp. 15–50 (Chapter 1).Borjas, G.J., 2003. The Labor Demand Curve Is Downward Sloping: Reexamining the Impact of Immi-
gration on the Labor Market. Q. J. Econ. 118 (4), 1335–1374.Borjas, G.J., 2006a. Immigration in High-Skill Labor Markets: The Impact of Foreign Students on the
Earnings of Doctorates. NBER Working Paper 12085.Borjas, G.J., 2006b. Making It in America: Social Mobility in the Immigrant Population. Future Child 16
(2), 55–71.Borjas, G.J., 2007. Do Foreign Students Crowd Out Native Students from Graduate Programs? In:
Stephan, P.E., Ehrenberg, R.G. (Eds.), Science and the University (Science and Technology inSociety). University of Wisconsin Press.
Borjas, G.J., Bratsberg, B., 1996. Who Leaves? The Outmigration of the Foreign-Born. Rev. Econ. Stat.78 (1), 165–176.
Borjas, G.J., Freeman, R.B., Katz, L.F., 1997. How Much Do Immigration and Trade Affect Labor MarketOutcomes? Brookings Pap. Econ. Act 1, 1–67.
430 Christian Dustmann and Albrecht Glitz
Bound, J., Turner, S., Walsh, P., 2009. Internationalization of U.S. Doctorate Education. PopulationStudies Center Research Report 09-675, University of Michigan.
Bratsberg, B., Raaum, O., Sorlie, K., 2007. Foreign-Born Migration to and from Norway. In: Özden, Ç.,Schiff, M. (Eds.), International Migration, Economic Development and Policy. Palgrave Macmillan,New York, pp. 259–290 (Chapter 9).
Bratsberg, B., Ragan, Jr., J.F. 2002. The Impact of Host-Country Schooling on Earnings: A Study of MaleImmigrants in the United States. J. Hum. Resour. 37 (1), 63–105.
Butcher, K.F., Card, D., 1991. Immigration and Wages: Evidence from the 1980s. Am. Econ. Rev. 81 (2),292–296.
Card, D., 1990. The Impact of the Mariel Boatlift on the Miami Labor Market. Ind. Labor Relat. Rev.43 (2), 245–257.
Card, D., 2001. Immigrant Inflows, Native Outflows, and the Local Labor Market Impacts of HigherImmigration. J. Labor Econ. 19 (1), 22–64.
Card, D., DiNardo, J., Estes, E., 2000. The More Things Change: Immigrants Children of Immigrants inthe 1940s, the 1970s, and the 1990s. In: Borjas, G.J. (Ed.), Issues in the Economics of Immigration.NBER, and University of Press, Chicago.
Carliner, G., 1980. Wages, Earnings, and Hours of First, Second and Third Generation American Males.Econ. Inquiry 18 (1), 87–102.
Carliner, G., 1981. Wage Differences by Language Group and the Market for Language Skills in Canada.J. Hum. Resour. 16 (3), 384–399.
Casey, T., Dustmann, C., 2008. Intergenerational Transmission of Language Capital and Economic Out-comes. J. Hum. Resour. 43 (3), 660–687.
Checchi, D., De Simone, G., Faini, R., 2007. Skilled Migration, FDI, and Human Capital Investment.IZA Discussion Paper No. 2795.
Chiquiar, D., Hanson, G.H., 2005. International Migration, Self-Selection and the Distribution of Wages:Evidence from Mexico and the United States. J. Polit. Econ. 113 (2), 239–281.
Chiswick, B.R., 1977. Sons of Immigrants: Are They at an Earnings Disadvantage? Am. Econ. Rev. Pap.Proc. 67, 376–380.
Chiswick, B.R., 1978. The Effect of Americanization on the Earnings of Foreign-born Men. J. Polit.Econ. 86 (5), 897–921.
Chiswick, B.R., 1991. Speaking, Reading, and Earnings among Low-Skilled Immigrants. J. Labor Econ.9 (2), 149–170.
Chiswick, B.R., 1998. Hebrew Language Usage: Determinants and Effects on Earnings among Immigrantsin Israel. J. Popul. Econ. 11 (2), 253–271.
Chiswick, B.R., DebBurman, N., 2004. Educational Attainment: Analysis by Immigrant Generation.Econ. Educ. Rev. 23 (4), 361–379.
Chiswick, B.R., Lee, Y.L., Miller, P.W., 2005. Parents and Children Talk: English Language Proficiencywithin Immigrant Families. Rev. Econ. Househ. 3 (3), 243–268.
Chiswick, B.R., Miller, P.W., 1992. Language in the Immigrant Labor Market: The ImmigrantExperience in Canada and the United States. In: Chiswick, B.R. (Ed.), Immigration, Languageand Ethnicity: Canada and the United States. American Enterprise Institute, Washington, DC,pp. 229–296.
Chiswick, B.R., Miller, P.W., 1994. The Determinants of Post-Immigration Investments in Education.Econ. Educ. Rev. 13 (2), 163–177.
Chiswick, B.R., Miller, P.W., 1995. The Endogeneity between Language and Earnings: InternationalAnalyses. J. Labor Econ. 13 (2), 246–288.
Chiswick, B.R., Miller, P.W., 2002. Immigrant Earnings: Language Skills, Linguistic Concentration andthe Business Cycle. J. Popul. Econ. 15 (1), 31–57.
Chiswick, B.R., Miller, P.W., 2003. The Complementarity of Language and Other Human Capital:Immigrant Earnings in Canada. Econ. Educ. Rev. 22 (5), 469–480.
Chiswick, B.R., Miller, P.W., 2005. Do Enclaves Matter in Immigrant Adjustment? City Community 4(1), 5–35.
Migration and Education 431
Chiswick, B.R., Miller, P.W., 2007. The International Transferability of Immigrants’Human Capital Skills.IZA Discussion Paper No. 2670.
Chiswick, B.R., Miller, P.W., 2008. Why is the Payoff to Schooling Smaller for Immigrants? Labour Econ.15 (6), 1317–1340.
Chiswick, B.R., Repetto, G., 2001. Immigrant Adjustment in Israel: The Determinants of Literacy andFluency in Hebrew and Their Effects on Earnings. In: Djajic, S. (Ed.), International Migration: Trends,Policies and Economic Impact. Routledge, London, pp. 204–228.
Clark, K., Lindley, J.K., 2009. Immigrant Assimilation Pre and Post Labour Market Entry: Evidence fromthe UK Labour Force Survey. J. Popul. Econ. 22 (1), 175–198.
Co, C.Y., Gang, I., Yun, M.-S., 2000. Returns to Returning. J. Popul. Econ. 13 (1), 57–79.Cobb-Clark, D.A., 1993. Immigrant Selectivity and Wages—The Evidence for Women. Am. Econ. Rev.
83 (4), 986–993.Cohen-Goldner, S., Eckstein, Z., 2008. Labor Mobility of Immigrants: Training, Experience, Language,
and Opportunities. Int. Econ. Rev. 49 (3), 837–872.Commander, S., Kangasniemi, M., Winters, L.A., 2004. The Brain Drain: Curse or Boon? A Survey of the
Literature. In: Baldwin, R., Winters, L.A. (Eds.), Challenges to Globalization. University of ChicagoPress, Chicago, pp. 235–272.
Constant, A.F., Zimmermann, K.F., 2008. Measuring Ethnic Identity and Its Impact on Economic Beha-vior. J. Eur. Econ. Assoc. 6 (2-3), 424–433.
Corak, M. (Ed.), 2004. Generational Income Mobility in North America and Europe. Cambridge Univer-sity Press, Cambridge.
Corak, M., 2006. Do Poor Children Become Poor Adults? Lessons for Public Policy from a Cross CountryComparison of Generational Earnings Mobility. In: Creedy, J., Kalb, G. (Eds.), Research on EconomicInequality, Vol. 13. Dynamics of Inequality and Poverty. Elsevier Press, Amsterdam.
Corak, M., Heisz, A., 1999. The Intergenerational Earnings and Income Mobility of Canadian Men: Evi-dence from Longitudinal Income Tax Data. J. Hum. Resour. 34 (3), 504–533.
Cortes, K.E., 2004. Are Refugees Different from Economic Immigrants? Some Empirical Evidence on theHeterogeneity of Immigrant Groups in the United States. Rev. Econ. Stat. 86 (2), 465–480.
Cortes, K.E., 2006. The Effects of Age at Arrival and Enclave Schools on the Academic Performance ofImmigrant Children. Econ. Educ. Rev. 25 (2), 121–132.
Cortés, P., 2010. The Feminization of International Migration and its Effects on the Families Left Behind:Evidence from the Philippines. unpublished manuscript.
Cortés, P., Pan, J., 2009. Outsourcing Household Production: The Demand for Foreign Domestic Helpersand Native Labor Supply in Hong Kong. Working Paper, University of Chicago, Booth School ofBusiness.
Cortés, P., Tessada, J., 2009. Low-Skilled Immigration and the Labor Supply of Highly Educated Women.unpublished manuscript.
Cox Edwards, A., Ureta, M., 2003. International Migration, Remittances and Schooling: Evidence from ElSalvador. J. Development Economics 72 (2), 429–461.
Cunha, F., Heckman, J.J., Lochner, L., Masterov, D.V., 2006. Interpreting the Evidence on Life CycleSkill Formation. In: Hanushek, E.A., Welch, F. (Eds.), Handbook of the Economics of Education.North-Holland, Amsterdam, pp. 697–812 (Chapter 12).
Cutler, D.M., Glaeser, E.L., Vigdor, J.L., 2005. Ghettos and the Transmission of Ethnic Capital. In:Loury, G., Modood, T., Teles, S.M. (Eds.), Ethnicity, Social Mobility and Public Policy: Comparingthe US and UK. Cambridge University Press, UK, pp. 204–222.
D’Addio, A.C., 2019. Intergenerational Transmission of Disadvantage: Mobility or Immobility across Gen-erations? A Review of the Evidence for OECD Countries. OECD Social, Employment and MigrationWorking Paper No. 52.
Dahl, G., 2002. Mobility and the Return to Education: Testing a Roy Model with Multiple Markets.Econometrica 70 (6), 2367–2420.
De Brauw, A., Giles, J., 2006. Migrant Opportunity and the Educational Attainment of Youth in RuralChina. IZA Discussion Paper No. 2326.
432 Christian Dustmann and Albrecht Glitz
De Freitas, G., 1980. The Earnings of Immigrants in the American Labor Market. PhD dissertation,Columbia University.
Deutsch, J., Epstein, G.S., Lecker, T., 2006. Multi-Generation Model of Immigrant Earnings: Theory andApplication. In: Polachek, S.W., Chiswick, C., Rapoport, H. (Eds.), Research in Labor Economics.Vol. 24. Elsevier, Amsterdam, pp. 217–234.
Docquier, F., Marfouk, A., 2006. International Migration by Educational Attainment (1990‒2000). In:Özden, Ç., Schiff, M. (Eds.), Remittances and Development. Palgrave Macmillan, New York.
Docquier, F., Rapoport, H., 2009. Skilled Migration: The Perspective of Developing Countries. In:Baghwati, J., Hanson, G. (Eds.), Skilled Immigration Today: Prospects, Problems and Policies. RussellSage Foundation, New York, pp. 247–284 (Chapter 9).
Domingues Dos Santos, M., Postel-Vinay, F., 2003. Migration as a Source of Growth: the Perspective of aDeveloping Country. J. Popul. Econ. 16 (1), 161–175.
Domingues Dos Santos, M., Postel-Vinay, F., 2004. The Impact of Temporary Migration on HumanCapital Accumulation and Economic Development. Brussels Econ. Rev. 47 (1), 77–88.
Duleep, H.O., Regets, M.C., 1999. Immigrants and Human-Capital Investment. Am. Econ. Rev. Pap.Proc. 89 (2), 186–191.
Duleep, H.O., Regets, M.C., 2002. The Elusive Concept of Immigrant Quality. IZA Discussion PaperNo. 631.
Dustmann, C., 1993. Earnings Adjustment of Temporary Migrants. J. Popul. Econ. 6 (2), 153–168.Dustmann, C., 1994a. Return Intentions of Migrants: Theory and Evidence. CEPR Discussion Paper
No. 906.Dustmann, C., 1994b. Speaking Fluency, Writing Fluency and Earnings of Migrants. J. Popul. Econ. 7 (2),
133–156.Dustmann, C., 1995. Savings Behavior of Migrant Workers—a Life Cycle Analysis. Zeitschrift fuer
Wirtschafts-und Sozialwissenschaften 4, 511–533.Dustmann, C., 1997. Differences in the Labour Market Behaviour between Temporary and Permanent
Migrant Women. Labour Econ. 4 (1), 29–46.Dustmann, C., 1999. Temporary Migration, Human Capital, and Language Fluency of Migrants. Scand.
J. Econ. 101 (2), 297–314.Dustmann, C., 2000. Temporary Migration and Economic Assimilation. Swedish Econ. Policy Rev. 7,
213–244.Dustmann, C., 2003. Return Migration, Wage Differentials and the Optimal Migration Duration. Eur.
Econ. Rev. 47 (2), 353–369.Dustmann, C., 2008. Return Migration, Investment in Children, and Intergenerational Mobility: Compar-
ing Sons of Foreign- and Native-Born Fathers. J. Hum. Resour. 43 (2), 299–324.Dustmann, C., Fabbri, F., 2003. Language Proficiency and Labour Market Performance of Immigrants in
the UK. Econ. J. 113 (489), 695–717.Dustmann, C., Fabbri, F., Preston, I., 2005. The Impact of Immigration on the British Labour Market.
Econ. J. 115 (507), F324–F341.Dustmann, C., Fadlon, I., Weiss, Y., 2010. Return Migration, Human Capital Accumulation and the Brain
Drain. J. Dev. Econ. forthcoming.Dustmann, C., Frattini, T., Halls, C., 2010. Assessing the Fiscal Costs and Benefits of A8 Migration to the
UK. Fisc. Stud. 31 (1), 1–41.Dustmann, C., Frattini, T., Lanzara, G., 2010. Educational Achievements and Ambitions of Second Gen-
eration Immigrants—An International Comparison. mimeo, UCL.Dustmann, C., Frattini, T., Preston, I., 2008. The Effect of Immigration along the Distribution of Wages.
CReAM Discussion Paper No. 03/08.Dustmann, C., Glitz, A., Schönberg, U., 2010. Referral-based Job Search Networks. unpublished manuscript.Dustmann, C., Glitz, A., Vogel, T., 2010. Employment, Wages, and the Economic Cycle: Differences
between Immigrants and Natives. Eur. Econ. Rev. 54 (1), 1–17.Dustmann, C., Machin, S., Schönberg, U., 2010. Ethnicity and Educational Achievement in Compulsory
Schooling. Econ. J. 120 (546), F272–F297.
Migration and Education 433
Dustmann, C., Theodoropoulos, N., 2010. Ethnic Minority Immigrants and Their Children in Britain.Oxf. Econ. Pap. 62 (2), 209–233.
Dustmann, C., van Soest, A., 2001. Language Fluency and Earnings: Estimation with Misclassified Lan-guage Indicators. Rev. Econ. Stat. 83 (4), 663–674.
Dustmann, C., van Soest, A., 2002. Language and the Earnings of Immigrants. Ind. Labor Relat. Rev.55 (3), 473–492.
Dustmann, C., van Soest, A., 2004. An Analysis of Speaking Fluency of Immigrants Using OrderedResponse Models With Classification Errors. J. Bus. Econ. Stat. 22 (3), 312–321.
Dustmann, C., Weiss, Y., 2007. Return Migration: Theory and Empirical Evidence from the UK. Br.J. Ind. Relat. 45, 236–256.
Eckstein, Z., Weiss, Y., 2004. On the Wage Growth of Immigrants: Israel 1990‒2000. J. Eur. Econ. Assoc.2 (4), 665–695.
Edin, P.-A., Fredriksson, P., Åslund, O., 2003. Ethnic Enclaves and the Economic Success of Immigrants—Evidence from a Natural Experiment. Q. J. Econ. 118 (1), 329–357.
Edin, P.-A., LaLonde, R.J., Åslund, O., 2000. Emigration of Immigrants and Measures of ImmigrantAssimilation: Evidence from Sweden. Swedish Econ. Policy Rev. (7), 163–204.
Entorf, H., Minoiu, N., 2005. What a Difference Immigration Policy Makes: A Comparison ofPISA Scores in Europe and Traditional Countries of Immigration. German Econ. Rev. 6 (2),355–376.
Farré, L., González, L., Ortega, F., 2009. Immigration, Family Responsibilities and the Labor Supply ofSkilled Native Women. CReAM Discussion Paper No. 16/09.
Feliciano, C., 2005. Educational Selectivity in U.S. Immigration: How Do Immigrants Compare to ThoseLeft Behind? Demography 42 (1), 131–152.
Fernández-Huertas Moraga, J., 2010. New Evidence on Emigrant Selection. Rev. Econ. Stat. forthcoming.Finn, M.G., 2007. Stay Rates of Foreign Doctorate Recipients from US Universities, 2005. Oak Ridge
Institute for Science and Education, Oak Ridge.Friedberg, R.M., 1992. The Labor Market Assimilation of Immigrants in the United States: The Role of
Age at Arrival. Unpublished Manuscript, Brown University, Providence, RI.Friedberg, R.M., 2000. You Can’t Take It with You? Immigrant Assimilation and the Portability of
Human Capital. J. Labor Econ. 18 (2), 221–251.Friedberg, R.M., 2001. The Impact of Mass Migration on the Israeli Labor Market. Q. J. Econ. 116 (4),
1373–1408.Funkhouser, E., Trejo, S.J., 1995. The Labor Market Skills of Recent Male Immigrants: Evidence from the
Current Population Survey. Ind. Labor Relat. Rev. 48 (4), 792–811.Gang, I.N., Zimmermann, K.F., 2000. Is Child Like Parent? Educational Attainment and Ethnic Origin.
J. Hum. Resour. 35 (3), 550–569.Ganzeboom, H.B.G., De Graaf, P.M., de Leeuw, J., Treiman, D.J., 1992. A Standard Internacional Socio-
Economic Index of Occupational Status. Soc. Sci. Res. 21 (1), 1–56.Glitz, A., 2011. The Labor Market Impact of Immigration: A Quasi-Experiment Exploiting Immigrant
Location Rules in Germany. J. Labor Econ. forthcoming.Gonzalez, A., 2003. The Education and Wages of Immigrant Children: The Impact of Age at Arrival.
Econ. Educ. Rev. 22 (2), 203–212.Goos, M., Manning, A., 2007. Lousy and Lovely Jobs: The Rising Polarization of Work in Britain. Rev.
Econ. Stat. 89 (1), 118–133.Gould, E.D., Lavy, V., Paserman, M.D., 2009. Does Immigration Affect the Long-term Educational Out-
comes of Natives? Quasi-Experimental Evidence. Econ. J. 119 (540), 1243–1269.Gould, E.D., Moav, O., 2010. When is ‘Too Much’ Inequality Not Enough? The Selection of Israeli Emi-
grants. CReAM Discussion Paper No. 14/10.Green, C., Kler, P., Leeves, G., 2007. Immigrant Overeducation: Evidence from Recent Arrivals to Aus-
tralia. Econ. Educ. Rev. 26 (4), 420–432.Green, D.A., Worswick, C., 2004. Immigrant Earnings Profiles in the Presence of Human Capital Invest-
ment: Measuring Cohort and Macro Effects. IFS Working Paper 04/13.
434 Christian Dustmann and Albrecht Glitz
Grenier, G., 1984. The Effect of Language Characteristics on the Wages of Hispanic American Males.J. Hum. Resour. 19 (1), 35–52.
Grogger, J., Hanson, G., 2008. Income Maximization and the Selection and Sorting of InternationalMigrants. NBER Working Paper No. 13821, Cambridge, MA.
Hanson, G., 2007. Emigration, Labor Supply, and Earnings in Mexico. In: Borjas, G.J. (Ed.), MexicanImmigration. University of Chicago Press, Chicago, pp. 117–142.
Hanson, G., 2010. International Migration and the Developing World. In: Rodrik, D., Rosenzweig, M.(Eds.), Handbook of Development Economics. Vol. 5. North Holland, Amsterdam, pp. 4363–4414(Chapter 66).
Hanson, G., Woodruff, C., 2003. Emigration and Educational Attainment in Mexico. Mimeo, Universityof California at San Diego.
Hanushek, E.A., Woessmann, L., 2008. The Role of Cognitive Skills in Economic Development. J. Econ.Literature 46 (3), 607–668.
Hanushek, E.A., Woessmann, L., 2010. The Economics of International Differences in EducationalAchievement. In: Hanushek, E.A., Machin, S., Woessmann, L. (Eds.), Handbook of the Economicsof Education. Vol. 3. North Holland, Amsterdam forthcoming.
Hanushek, E.A., Zhang, L., 2009. Quality-Consistent Estimates of International Schooling and SkillGradients. J. Hum. Capital 3 (2), 107–143.
Hammarstedt, M., Palme, M., 2006. Intergenerational Mobility, Human Capital Transmission and theEarnings of Second-Generation Immigrants in Sweden. IZA Discussion Paper No. 1943.
Hammarstedt, M., 2009. Intergenerational Mobility and the Earnings Position of First-, Second-, andThird-Generation Immigrants. Kyklos 62 (2), 275–292.
Hayfron, J.E., 1998. The Performance of Immigrants in the Norwegian Labor Market. J. Popul. Econ. 11(2), 293–303.
Heckman, J.J., 1979. Sample Selection Bias as a Specification Error. Econometrica 47 (1), 153–161.Heckman, J.J., Honoré, B., 1990. The Empirical Content of the Roy Model. Econometrica 58 (5),
1121–1149.Hicks, J., 1932. The Theory of Wages. MacMillan, New York.Hirschman, C., 2001. The Educational Enrollment of Immigrant Youth: A Test of the Segmented-
Assimilation Hypothesis. Demography 39 (3), 317–336.Hoxby, C.M., 1998. Do Immigrants Crowd Disadvantaged American Natives out of Higher Education?
In: Hamermesh, D.S., Bean, F.D. (Eds.), Help or Hindrance? The Economic Implications ofImmigration for African Americans. Russell Sage Foundation, New York, pp. 282–321.
Hunt, J., 2010. Which Immigrants Are Most Innovative and Entrepreneurial? Distinctions by Entry Visa.IZA Discussion Paper No. 4745.
Hunt, J., Gauthier-Loiselle, M., 2010. How Much Does Immigration Boost Innovation? Am. Econ. J.:MacroEcon. 2 (2), 31–56.
Husted, L., Nielsen, H.S., Rosholm, M., Smith, N., 2001. Employment and Wage Assimilation of MaleFirst Generation Immigrants in Denmark. Int. J. Manpower 22, 39–68.
Iara, A., 2006. Skill Diffusion by Temporary Migration? Returns to Western European Working Experi-ence in the EU Accession Countries. A Global Development Network Working Paper.
Ibarrarán, P., Lubotsky, D., 2007. Immigration and Self-Selection: New Evidence from the 2000 MexicanCensus. In: Borjas, G.J. (Ed.), Mexican Immigration to the United States. University of Chicago Press,pp. 159–192 (Chapter 5).
ICMPD, 2006. Comparative Study on Policies towards Foreign Graduates. Study on Retention Policiestowards Foreign Students in Industrialised Countries. ICMPD, Vienna.
Jackson, O., 2010. Does Immigration Crowd Natives Into or Out of Higher Education? University ofMichigan Working Paper.
Jaeger, D.A., 2007. Green Cards and the Location Choices of Immigrants in the United States, 1971‒2000.Res. Labor Econ. 27, 131–183.
Jensen, P., Pedersen, P.J., 2007. To Stay or Not To Stay? Out-Migration of Immigrants from Denmark.Int. Migr. 45 (5), 87–113.
Migration and Education 435

Johnson, N., Kotz, S., 1972. Distribution in Statistics: Continuous Multivariate Distributions. John Wiley& Sons, New York.
Kaestner, R., Malamud, O., 2010. Self-selection and International Migration: New Evidence fromMexico. NBER Working Paper No. 15765.
Kato, T., Sparber, C., 2010. Quotas and Quality: The Effect of H-1B Visa Restrictions on the Pool ofProspective Undergraduate Students from Abroad. CReAM Discussion Paper No. 10/10.
Kee, P., 1995. Native-Immigrant Wage Differentials in the Netherlands: Discrimination? Oxf. Econ. Pap.47 (2), 302–317.
Kennan, J., 2010. Higher Education Subsidies and Human Capital Mobility. Working Paper.Kennan, J., Walker, J.R., 2010. The Effect of Expected Income on Individual Migration Decisions.
Econometrica forthcoming.Kerr, W.R., Lincoln, W., 2010. The Supply Side of Innovation: H-1B Visa Reforms, U.S. Ethnic
Invention. NBER Working Paper No. 15768.Khan, A., 1997. Post-migration Investment in Education by Immigrants in the United States. Q. Rev.
Econ. Finance 37 (Supplement 1), 285–313.Kossoudji, S.A., 1988. English Language Ability and the Labor Market Opportunities of Hispanic and East
Asian Immigrant Men. J. Labor Econ. 6 (2), 205–228.Kossoudji, S.A., 1989. Immigrant Worker Assimilation: Is It a Labor Market Phenomenon? J. Hum.
Resour. 24 (3), 494–527.LaLonde, R.J., Topel, R.H., 1991. Immigrants in the American Labor Market: Quality, Assimilation, and
Distributional Effects. Am. Econ. Rev. Pap. Proc. 81 (2), 297–302.LaLonde, R.J., Topel, R.H., 1992. The Assimilation of Immigrants in the U.S. Labor Market. In:
Borjas, G.J., Freeman, R.B. (Eds.), Immigration and the Work Force: Economic Consequences forthe United States and Source Areas. University of Chicago Press, Chicago, pp. 67–92.
Lazear, E.P., 1979. Why Is There Mandatory Retirement? J. Polit. Econ. 87 (6), 1261–1284.Lindley, J., Lenton, P., 2006. The Over-Education of UK Immigrants: Evidence from the Labour Force
Survey. Sheffield Economic Research Paper Series No. 2006001.Longva, P., Raaum, O., 2003. Earnings Assimilation of Immigrants in Norway—A Reappraisal. J. Popul.
Econ. 16 (1), 177–193.López-Córdova, J.E., 2005. Globalization, Migration, and Development: The Role of Mexican Migrant
Remittances. Economía 6 (1), 217–256.Lubotsky, D., 2007. Chutes or Ladders? A Longitudinal Analysis of Immigrant Earnings. J. Polit. Econ. 115
(5), 820–867.Lucas, R.E.B., 2005. International Migration: Lessons from Recent Data. World Bank. Washington, DC.
Presentation in the Migration Seminar Series.Manacorda, M., Manning, A., Wadsworth, J., 2011. The Impact of Immigration on the Structure of Male
Wages: Theory and Evidence from Britain. J. Eur. Econ. Assoc. forthcoming.Marchiori, L., Shen, I.-L., Docquier, F., 2009. Brain Drain in Globalization: A General Equilibrium
Analysis from the Sending Countries’ Perspective. IZA Discussion Paper No. 4207.Mattoo, A., Neagu, I.C., Özden, C., 2008. Brain Waste? Educated Immigrants in the US Labor Market.
J. Dev. Econ. 87 (2), 255–269.McKenzie, D.J., Rapoport, H., 2007. Self-selection Patterns in Mexico-U.S. Migration: The Role of
Migration Networks. CReAM Discussion Paper No. 01/07.McKenzie, D., Rapoport, H., 2010. Can Migration Reduce Educational Attainment? Evidence from
Mexico. J. Popul. Econ. forthcoming.McManus, W., Gould, W., Welch, F., 1983. Earnings of Hispanic Men: The Role of English Language
Proficiency. J. Labor Econ. 1 (2), 101–130.Mishra, P., 2007. Emigration andWages in Source Countries: Evidence fromMexico. J. Dev. Econ. 82 (1), 180–199.Mountford, A., 1997. Can A Brain Drain Be Good for Growth in the Economy? J. Dev. Econ. 53 (2),
287–303.Neal, D., 2006. Why Has Black-White Skill Convergence Stopped? In: Hanushek, E., Welch, F. (Eds.),
Handbook of the Economics of Education. Vol. 1. Elsevier, Amsterdam, pp. 511–576 (Chapter 9).
436 Christian Dustmann and Albrecht Glitz

Nekby, L., 2004. The Emigration of Immigrants, Return vs. Onward Migration: Evidence from Sweden.Research Papers in Economics No. 2004:7, Stockholm University, Department of Economics.
Neymotin, F., 2009. Immigration and its Effect on the College-Going Outcomes of Natives. Econ. Educ.Rev. 28 (5), 538–550.
Nielsen, C.P., 2007. Immigrant Overeducation: Evidence from Denmark. World Bank Policy ResearchWorking Paper 4234.
Nielsen, H.S., Rosholm, M., Smith, N., Husted, L., 2003. The School-to-Work Transition of 2nd Gen-eration Immigrants in Denmark. J. Popul. Econ. 16 (4), 755–786.
OECD, 2006. Where Immigrant Students Succeed—A Comparative Review of Performance and Engage-ment in PISA 2003. OECD Publishing, Paris.
OECD, 2007. PISA 2006—Science Competencies for Tomorrow’s World. OECD Publishing, Paris.OECD, 2008. International Migration Outlook. OECD Publishing, Paris.OECD, 2009. PISA 2006 Technical Report. OECD Publishing, Paris.OECD, 2010. International Migration Outlook. OECD Publishing, Paris.Okkerse, L., 2008. How to Measure Labour Market Effects of Immigration: A Review. J. Econ. Surv.
22 (1), 1–30.Oosterbeek, H., Webbink, D., 2006. Assessing the Returns to Studying Abroad. CPB Working Paper
No. 64.Orrenius, P.M., Zavodny, M., 2005. Self-selection Among Undocumented Immigrants from Mexico.
J. Dev. Econ. 78 (1), 215–240.Ortega, F., Peri, G., 2009. The Causes and Effects of International Migrations: Evidence from OECD
Countries 1980-2005. NBER Working Paper No. 14833.Osterberg, T., 2000. Economic Perspectives on Immigrants and Intergenerational Transmissions. Ekono-
miska Studier 102, 115–149.Ottaviano, G.I.P., Peri, G., 2011. Rethinking the Effects of Immigration on Wages. J. Eur. Econ. Assoc.
forthcoming.Palifka, B., 2003. Study Abroad and the Transition from School to Work for Mexican College Graduates.
Working Paper.Parent, D., 2009. Intergenerational Progress in Educational Attainment When Institutional Change Really
Matters: A Case Study of Franco-Americans vs. French-Speaking Quebecers. CLSRN Working PaperNo. 2009‒36.
Peri, G., Sparber, C., 2008. Highly Educated Immigrants and Occupational Choice. CReAM DiscussionPaper No. 13/08.
Peri, G., Sparber, C., 2009. Task Specialization, Immigration, and Wages. Am. Econ. J.: Appl. Econ. 1 (3),135–169.
Perreira, K.M., Harris, K.M., Lee, D., 2006. Making it in America: High School Completion byImmigrant and Native Youth. Demography 43 (3), 511–536.
Piil Damm, A., 2009. Ethnic Enclaves and Immigrant Labor Market Outcomes: Quasi-ExperimentalEvidence. J. Labor Econ. 27 (2), 281–314.
Ramos, F.A., 1992. Out-Migration and Return Migration of Puerto Ricans. In: Borjas, G.J.,Freeman, R.B. (Eds.), Immigration and the Work Force: Economic Consequences for the UnitedStates and Source Areas. University of Chicago Press, Chicago, pp. 49–66 (Chapter 2).
Rampney, B.D., Dion, G.S., Donahue, P.L., 2009. NAEP 2008 Trends in Academic Progress (NCES-2009-479), National Center for Education Statistics, Institute of Education Sciences. U.S. Departmentof Education, Washington, DC.
Rapoport, H., Docquier, F., 2006. The Economics of Migrants’Remittances. In: Kolm, S.-C., Ythier, J.M.(Eds.), Handbook on the Economics of Giving, Reciprocity and Altruism. Vol. 2. North Holland,Amsterdam, pp. 1135–1198 (Chapter 17).
Reinhold, S., Thom, K., 2009. Temporary Migration and Skill Upgrading: Evidence from MexicanMigrants. MEA Discussion Paper No. 09182.
Riphahn, R.T., 2003. Cohort Effects in the Educational Attainment of Second Generation Immigrants inGermany: An Analysis of Census Data. J. Popul. Econ. 16 (4), 711–737.
Migration and Education 437
Rivera-Batiz, F., 1990. English Language Proficiency and the Economic Progress of Immigrants. Econ.Lett. 34 (3), 295–300.
Rivera-Batiz, F., 1992. English Language Proficiency and the Earnings of Young Immigrants in U.S..Labor Markets. Rev. Policy Res. 11 (2), 165–175.
Rooth, D.-O., Ekberg, J., 2003. Unemployment and Earnings for Second Generation Immigrants inSweden. Ethnic Background and Parent Composition. J. Popul. Econ. 16 (4), 787–814.
Rosenzweig, M., 2007. Education and Migration: A Global Perspective. Yale University, Mimeo.Roy, A.D., 1951. Some Thoughts on the Distribution of Earnings. Oxf. Econ. Pap. 3 (2), 135–146.Sanromá, E., Ramos, R., Simón, H., 2008. The Portability of Human Capital Immigrant Assimilation:
Evidence for Spain. IZA Discussion Paper No. 3649.Sanromá, E., Ramos, R., Simón, H., 2009. Immigrant Wages in the Spanish Labour Market: Does the
Origin of Human Capital Matter? IZA Discussion Paper No. 4157.Schaafsma, J., Sweetman, A., 2001. Immigrant Earnings: Age at Immigration Matters. Can. J. Econ. 34 (4),
1066–1099.Schiff, M., 2005. Brain Gain: Claims about Its Size and Impact on Welfare and Growth Are Greatly
Exaggerated. IZA Discussion Paper No. 1599.Schnepf, S.V., 2007. Immigrants’ Educational Disadvantage: An Examination across Ten Countries and
Three Surveys. J. Popul. Econ. 20 (3), 527–545.Schoeni, R., 1997. New Evidence on the Economic Progress of Foreign-Born Men in the 1970s and
1980s. J. Hum. Resour. 32 (4), 683–740.Shields, M.A., Wheatley Price, S., 1998. The Earnings of Male Immigrants in England: Evidence from the
Quarterly LFS. Appl. Econ. 30 (9), 1157–1168.Shortland, P., 2006. People on the Move: A Study of Migrant Movement Patterns to and from New
Zealand. New Zealand Department of Labour, Wellington.Sjaastad, L.A., 1962. The Costs and Returns of Human Migration. J. Polit. Econ. 70 (5), 80–93.Smith, J., 2003. Assimilation across the Latino generations. Am. Econ. Rev. Pap. Proc. 93 (2), 315–319.Solon, G., 1992. Intergenerational Income Mobility in the United States. Am. Econ. Rev. 82 (3),
393–408.Solon, G., 1999. Intergenerational Mobility in the Labor Market. In: Ashenfelter, O.C., Card, D. (Eds.),
Handbook of Labor Economics. Vol. 3A. North-Holland, Amsterdam, pp. 1761–1800 (Chapter 29).Solon, G., 2002. Cross-Country Differences in Intergenerational Earnings Mobility. J. Econ. Perspect.
16 (3), 59–66.Solon, G., 2004. A Model of Intergenerational Mobility Variation over Time and Place. In: Corak, M.
(Ed.), Generational Income Mobility in North America and Europe. Cambridge University Press,Cambridge, England, pp. 38–47 (Chapter 2).
Stark, O., Helmenstein, C., Prskawetz, A., 1997. A Brain Drain with a Brain Gain. Econ. Lett. 55 (2),227–234.
Stark, O., Wang, Y., 2002. Inducing Human Capital Formation: Migration as a Substitute for Subsidies.J. Public Econ. 86 (1), 29–46.
Stewart, J.B., Hyclak, T., 1984. An Analysis of the Earnings Profiles of Immigrants. Rev. Econ. Stat. 66 (2),292–296.
Storesletten, K., 2000. Sustaining Fiscal Policy through Immigration. J. Polit. Econ. 108 (2), 300–323.Tainer, E., 1988. English Language Proficiency and the Determination of Earnings among Foreign-born
Men. J. Hum. Resour. 23 (1), 108–122.Todd, P.E., Wolpin, K.I., 2003. On the Specification and Estimation of the Production Function for Cog-
nitive Achievement. Econ. J. 113 (485), F3–F33.Trejo, S., 2003. Intergenerational Progress of Mexican-Origin Workers in the US Labor Market. J. Hum.
Resour. 38 (3), 467–489.Van Ours, J.C., Veenman, J., 2006. Age at Immigration and Educational Attainment of Young Immi-
grants. Econ. Lett. 90, 310–316.Venturini, A., Villosio, C., 2008. Labour-Market Assimilation of Foreign Workers in Italy. Oxf. Rev.
Econ. Policy 24 (3), 517–541.
438 Christian Dustmann and Albrecht Glitz

Vidal, J.-P., 1998. The Effect of Emigration on Human Capital Formation. J. Popul. Econ. 11 (4),589–600.
Wiers-Jenssen, J., Try, S., 2005. Labour Market Outcomes of Higher Education Undertaken Abroad.Studies High. Educ. 30 (6), 681–705.
Wilkins, R., 2003. Immigrant Earnings Adjustment: The Impact of Age at Migration. Australian Econ.Pap. 42 (3), 292–315.
Willis, R.J., 1987. Wage Determinants: A Survey and Reinterpretation of Human Capital Earnings Func-tions. In: Ashenfelter, O., Layard, R. (Eds.), first ed. Handbook of Labor Economics. Vol. 1. first ed.Elsevier, Amsterdam, pp. 525–602 (Chapter 10).
Willis, R.J., Rosen, S., 1979. Education and Self-Selection. J. Polit. Econ. 87 (5), S7–S36.Yang, D., 2008. International Migration, Remittances, and Household Investment: Evidence from
Philippine Migrants’ Exchange Rate Shocks. Econ. J. 118 (528), 591–630.Zimmerman, D.J., 1992. Regression Toward Mediocrity in Economic Stature. Am. Econ. Rev. 82 (3),
409–429.
Migration and Education 439