Embed Size (px)
Citation preview
HAL Id: halshs-02866942https://halshs.archives-ouvertes.fr/halshs-02866942
Preprint submitted on 12 Jun 2020
HAL is a multi-disciplinary open accessarchive for the deposit and dissemination of sci-entific research documents, whether they are pub-lished or not. The documents may come fromteaching and research institutions in France orabroad, or from public or private research centers.
L’archive ouverte pluridisciplinaire HAL, estdestinée au dépôt et à la diffusion de documentsscientifiques de niveau recherche, publiés ou non,émanant des établissements d’enseignement et derecherche français ou étrangers, des laboratoirespublics ou privés.
Migrants’ Remittances and inclusive growth insub-Saharan Africa
Narcisse Cha’Ngom, Georges Tamokwe P., Edgard Manga
To cite this version:Narcisse Cha’Ngom, Georges Tamokwe P., Edgard Manga. Migrants’ Remittances and inclusivegrowth in sub-Saharan Africa. 2020. �halshs-02866942�
Migrants’ Remittances and inclusive growth in
sub-Saharan Africa
Narcisse Cha’ngom1; Georges Bertrand Tamokwé Piaptie2 and
Edgard Engama Manga3
Abstract
This study assesses the contribution of remittances to the improvement of inclusive growth in sub-
Saharan Africa, taking into account the role of institutions. Based on panel data of 24 countries for the
period 1985-2014, results show that remittances positively contribute to the inclusiveness of economic
growth in sub-Saharan Africa. Controlling for quality of institutions, it came out that poor institutions
rather hamper this contribution in the short run with the risk of neutralizing it in the long run.
Key words: remittances, inclusive growth, institutions, Sub-Saharan Africa
JEL: F24, O15, O43, O55
1 CERDI, Université Clermont Auvergne, France. [email protected] 2 ESSEC, Université de Douala, Cameroun. [email protected] 3 ESSEC, Université de Douala, Cameroun. [email protected]
1. Introduction
In developing regions, the wide gap between saving and investment needs as well as budget deficits
have often been presented as the main obstacles to growth (Ndikumana, 2014). Among these regions,
sub-Saharan Africa (SSA) is considered as the one where these obstacles are the most pronounced
especially because of very low income and large budget and current account deficits (UNCTAD, 2014).
However, during the last two decades, precisely since the mid-nineties, SSA witnessed a regular growth.
The real GDP of the whole region has on average increased by 4.6% on average per year over the
period 1995 - 2016 while the real GDP per capita increased by 1.6% over the same period (World
Bank, 2017). It is important to underline that since the Seventies, this appears to be the first time such
a large number of countries witness a regular growth. IMF (2008) has explained this regularity of growth,
at least partially, by the fact that while enjoying an overall macroeconomic stability, controlled inflation,
and a sustainable debt, SSA countries succeeded in implementing healthy economic policies while
gradually reinforcing their institutions. The additional borrowing avenues, thanks to the drop in debt
servicing within the framework of the HIPC initiative, contributed to this growth recovery (Martinez
and Mlachila, 2013). Following this reasoning, the financing of the growth achieved is strongly related
to external sources brought by non-nationals. It is therefore important for countries of the region to
seek new levers which are both complementary and possibly alternative forms of financing in order to
ensure the regularity of this growth which constitutes a precondition to poverty reduction.
Migrants’ remittances are one of these levers. In fact, during the period mentioned, an important
increase in the total inflow of remittances was witnessed in various countries. Remittances entering
developing countries increased from approximately 30 billion US dollars in 1990 to more than 466
billion US dollars in 2017 (World Bank, 2017). The same trend was witnessed in SSA where the inflow
of remittances increased from 3 billion US dollars in 1990 to 38 billion US dollars in 2017. In gross
values, the most important recipients were: Nigeria (22 billion USD), Senegal and Ghana (2.2 billion
USD each), Kenya (2 billion USD), Uganda (1.4 billion USD) and Mali (1 billion USD). As a proportion
of GDP, the highest beneficiaries were: Liberia (27%), the Comoros Islands (21%), Gambia (21%),
Lesotho (15%) and Senegal (14%). As a whole, migrants’ remittances outclassed public development
aid to become the second foreign source of funding after foreign direct investments (FDI). This makes
migrants’ remittances one of the main sources of external development finance for the beneficiary
countries, thus reinforcing the importance of reflections on its contribution to growth.
However, since remittances largely contribute to increase households’ income, taking them into
account when analyzing growth naturally brings us to consider the inclusive nature of growth. This
concern is the focus of this study which, following OECD (2014), associates the concept of inclusive
growth to the idea of a large increase in the welfare of all the segments of the population, with an
equitable distribution of the fruits of growth between the individuals and groups. We thus seek to
answer the following question: do migrants’ remittances favour inclusive growth in SSA countries? In
order to provide a relevant answer to this question, five year interval panel data on a sample of 24 SSA
countries for the 1985 - 2014 period is used for the empirical assessment. The estimation technique
used to evaluate the contribution of remittances to inclusive growth in these countries is the difference
generalized method of moments (DGMM) which makes it possible to control for the bias of omission
of important variables, endogeneity, measurement errors, and non-observable heterogeneity between
countries. The dynamics of the institutions is also taken into account by using variables that capture
the quality of bureaucracy and the investment profile.
The remaining is organized in four sections. Section 2 presents a brief summary of literature review on
the remittances – growth nexus by highlighting the various variables of the analysis. Section 3 presents
the methodology and section 4 presents the main findings as well as their discussion. Section 5 presents
our concluding remarks as well as policy recommendations.
2. Literature review
Studies on migrants’ remittances can analytically be classified into three main categories based on
whether they are optimistic, pessimistic or inconclusive in assessing the role of remittances on growth.
2.1. Migrants’ remittances and growth: optimistic views
According to this first class of studies, the IMF and World Bank (2009) recognize that remittances are
a stable and counter cyclical source of external finance in developing countries. This is in line with
Ratha and Mohapatra (2007) who showed that migrants’ remittances tend to increase when the
receiving countries face economic recession following a shock (financial crisis, natural disaster, political
instability, etc). Migrants then tend to transfer more during hard times to help their families and friends.
The transfers by this channel make it possible to support consumption and thus contribute to the
stability of the receiving economies albeit the risk of using the money received for imported goods
exist (Lipton, 1980).
As pointed out by the IMF and the World Bank (2009), these large volumes of migrants’ transfers can
constitute securities for these economies, enabling them to have a greater access to external debt
financing. This additional borrowing potential can then be used to fund productive investment which
will in the long run make it possible to have a faster and more sustained economic growth. In fact, the
debt sustainability framework launched in 2009 jointly by the World Bank and the International
Monetary Fund enables receiving countries to have access to higher levels of debt, especially when
remittances represent more than 10% of their national income or more than 20% of their exports of
goods and services.
According to Ratha (2013), when remittances enable the receiving households to escape from poverty,
they can devote less time and effort to the satisfaction of their basic needs. They thus have more time
to allocate to productive activities with a higher added-value and more suitable to increase the wealth
of the community or country. From a Keynesian perspective, an increase in remittances leads to an
increase in consumption and production. On this basis, Ramirez (2013) holds that remittances have a
positive effect on the growth of the receiving countries, especially when they improve the stock of domestic
savings and the amount of financial resources available for investment. Mishra (2005) shows that a 1%
increase in remittances in 13 Caribbean countries leads to an increase in private domestic investment
of 0.6% while according to Yang (2004), remittances reduce the credit constraints of receiving
households in Philippines and encourage entrepreneurship. Following this same reasoning, Mesnard
(2001) notes that through the Tunisian workers abroad, migration favours investment in more
productive activities in Tunisia. Also, the tests performed by Leon-Ledesma and Piracha (2001) on 11
Central and East European countries and Drinkwater et al. (2003) on 20 developing countries show
that remittances inflows leads to an increase in the level of investments in source countries. Although
these studies establish a positive relationship between remittances and growth, many other studies find
opposites results.
2.2. Migrants’ remittances and growth: pessimistic view
Unlike the optimists, pessimists support the hypothesis of a potential negative relationship between
migrants’ remittances and economic growth in developing countries. According to these authors,
remittances are likely to generate negative incentives since they can be perceived as a permanent source
of income. From this perspective, Jadotte (2009) highlights the negative effects of remittances on the
number of hours worked and labor market participation in Haiti. Its finding suggest that remittances
can reduce the labor force participation of beneficiaries and increase their consumption expenditures,
especially that of imported goods, rather than increase his savings and financing of investments (Azam
and Gubert, 2006; Chami et al., 2003). This phenomenon puts the migrant in a situation of the dilemma
of the Samaritan as exposed by Buchanan (1975). In a similar manner, Barajas et al. (2009) and El-
Sakka (1999) show that an increase in the consumption of beneficiaries can lead to an increase in prices
on the local market and an appreciation of the exchange rate. Such a situation exposes the economy
to the “Dutch disease” as it can cause a decline in the country’s tradable sector, an increase of its
current account deficit. Consequently, this can favored an uncontrolled inflation in case of a lax
monetary policy (Kirejev, 2006). Also, increasing pressure on wages can lead to a decline in labor supply
in the tradable goods sector while the sudden increase in prices could lead to an increase in the cost of
labor in the sector of non-tradable goods resulting in a sharp decline in competitiveness. These results
were observed in Latin America and in Cape Verde (Bourdet and Falck, 2006).
Beside these studies that conclude on the existence of either a positive or a negative relationship
between remittances, growth, and poverty reduction, many others conclude that both the existence
and the direction of the relationship between these economic phenomena are preconditioned by many
factors.
2.3. Migrants’ remittances and growth: the conditional view
Despite the optimistic results according to which remittances are likely to directly reduce poverty by
putting means to satisfy their basic needs at the disposal of the beneficiary households and indirectly
by providing resources that can help to create new productive investments which will benefit the
community, other studies show that the effects of remittances can be temporary and conditional both
at the micro and macroeconomic levels. Rusell (1995) highlights the fact that the development potential
of remittances is likely be realized at the national level only in the long run while Chami and Fullencamp
(2013) hold that there are several channels through which remittances affect economic activity and
none of these channels is automatically active at a given time since it depends on many economic,
social, and institutional. Moreover, many of these channels have negative effects on economic activity.
Consequently, the evaluation of the impact of remittances on economic growth involves a large range
of causal and multi-directional relationships which have positive and negative effects that can vary
depending on the socio-economic and institutional factors in each country. Thus, according to some
authors, the debate on the impact of remittances on economic growth (negative, positive, or neutral)
is due to the fact that the remittances-growth nexus is not linear and depends on the context prevailing
in the receiving country. Besides the level of development of the financial sector as determinant of the
impact of remittances on economic growth (Giuliano and Ruiz-Arranz, 2006; Singh et al., 2011), some
authors focus on the role played by the institutional framework (Tamokwe, 2009). A common
limitation of the study by Giuliano and Ruiz-Arranz (2006) is that their study does not take into account
the institutional aspects. Catrinescu et al. (2006) propose a solution to this limitation through the use
institutional variables extracted from the ICRG (Index Country Risk Guide) database with a system
generalized method of moments in a dynamic panel data model. Their results show a positive effect of
the interaction variable between remittances and institutions on growth, thus highlighting the positive
effect of the remittances on growth in the presence of good institutions. These results also suggest that
the most important institutional variables for this interaction are: the rule of law, stability of the
government, and socio-economic conditions. Their study is used as a foundation of this study which
modestly ambition to consider the specific situation of sub-Saharan African countries while paying
special attention to inclusive growth and accounting from business environment through the
investment profile.
3. Methodology
3.1 Data and description of variables
The absence of many time series on the study period (1984-2014) for some sub-Sahara African
countries leads us to exclude them. Consequently, based on the availability of data, we retain 24
countries in the study sample.
3.1.1 The dependent variable
In order to determine if the growth induced by remittances is inclusive or not, this study retains
inclusive growth as the dependent variable. This variable is captured here by the index of quality of
growth developed by three economists from the international monetary fund (Mlachila et al., 2014).
Using data from World Development Indicators 2017, we apply the methodology developed by these
authors to calculate the index of the quality of growth for the 24 countries of our sample over the
study period using 5 year intervals. The quality of growth index (QGI) is composed of two sub-indices
relating to growth fundamentals and the social dimension of growth.
The growth fundamentals have four properties generally expected from growth in an economy,
namely: its strength, its stability, its diversification of its sources, and its degree of outward orientation.
The strength of the growth is measured here by the annual change in real GDP per capita which is
more related pro-poor growth. Given that the coefficient of variation cancels the relative apparent
dispersion and allows direct comparison between countries whatever their level of growth, the stability
of the growth is measured by the inverse of the coefficient of variation of the measure of growth. The
level of diversification of the sources of growth is captured using the complement to 1 of the
Herfindahl-Hirschmann index of the concentration of exports of each country (i.e. 1-IHH). The
sources of growth are more diversified when this indicator is closer to 1. The outward orientation of
growth is approximated by the share of net external demand as a percentage of the GDP. By taking
into account this characteristic we defend the idea that growth that is outward oriented is more likely
to improve domestic productivity through Learning by doing, importation of more advanced
technologies, transfer of knowledge, discipline of the world market, FDI, and competition (Diao et al.,
2006).
The social dimension of growth incorporates two basic elements of the formation of human capital,
namely : health and education which are widely accepted as the main determinants of poverty reduction
(Schultz, 1999). The health component is captured by the aggregation of two sub-elements: the inverse
of the infant mortality rate and life expectancy at birth. Faced with the lack of data for all countries of
the sample, education is measured by the average number of years needed for the completion of
primary education.
Given these different components, the construction of the QGI is done in two stages: the first stage
is the standardization of the scale of measurement of the individual components for the calculation of
sub-indices while the second is the aggregation of the sub-indices into a single index.
Given that the proxy variables used are not measured in the same units, it is necessary to bring them
to the same scale. Two approaches can be used to do this: the Z – Score approach and the Min – Max
approach.
The Z–Score approach which corresponds to the centered-reduced normalization consists in
transforming a variable X with a mean and standard deviation into a Z-score given by :
XZ
−=
which follows a centered-reduced normal distribution if X is normally distributed. The
sensitivity of the transformed variable Z in the presence of outliers is however a problem in this
approach.
The Min Max− approach consists in transforming the variable X into an index 'Z given by
' Min
Max Min
X XZ
X X
−=
−
whereMinX and
MaxX respectively represent the minimum of X and the maximum
of X. Unlike the Z-score variable, 'Z is bounded by values from 0 to 1 and is therefore less likely to
have a much dispersed distribution, thus making it more adapted to countries in view of ranking them.
As concerns weighting, Mlachila et al. (2014) use 50% for fundamental growth and 50% for the social
dimension. In the fundamental sources, each sub-index is weighted at 25%. In the social dimension,
each of the sub-indices is weighted at 50%. This weighting is based on their simplicity and the
transparency although as Guillaumont (2009) puts it, this equal weighting is arbitrary. Other methods
of weighting exist in the literature, based for example on Principal Components Analysis (PCA) or
regression analysis, but they also have their own limits which including for instance: the difficulty to
include more than three variables. This is the case with PCA for the growth fundamentals (Mlachila et
al., 2014) or the quality of the regressions in the presence of endogeneity bias.
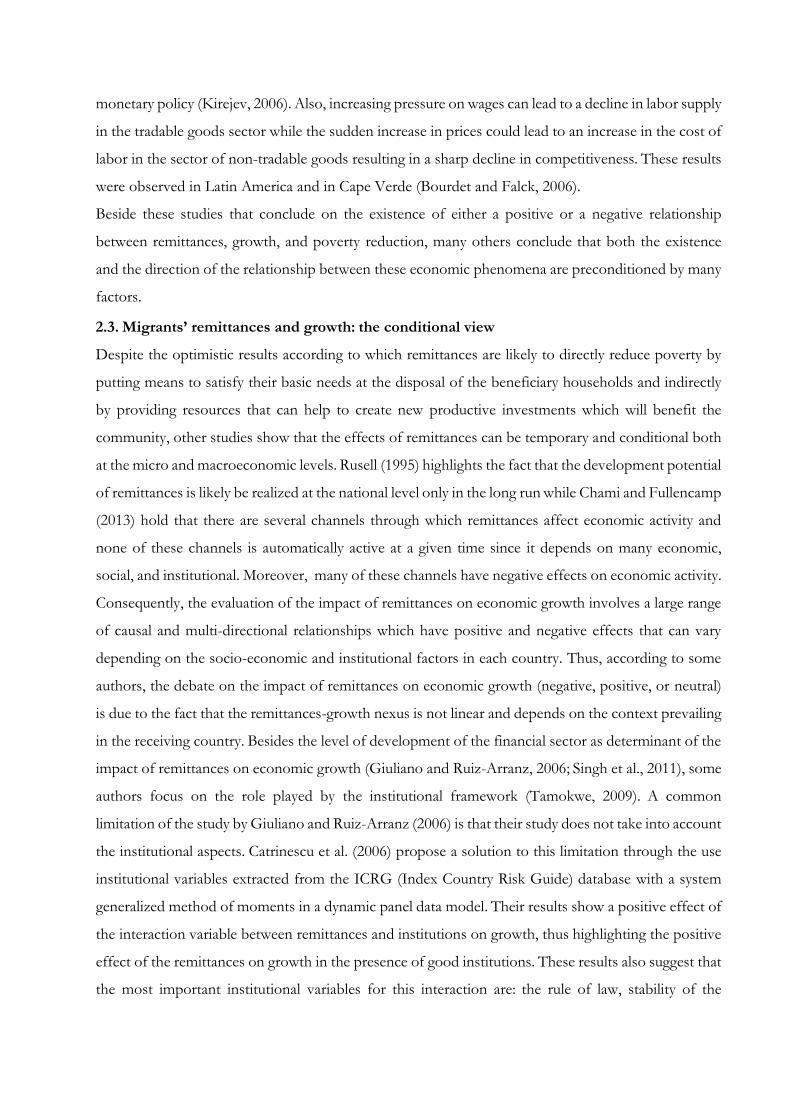
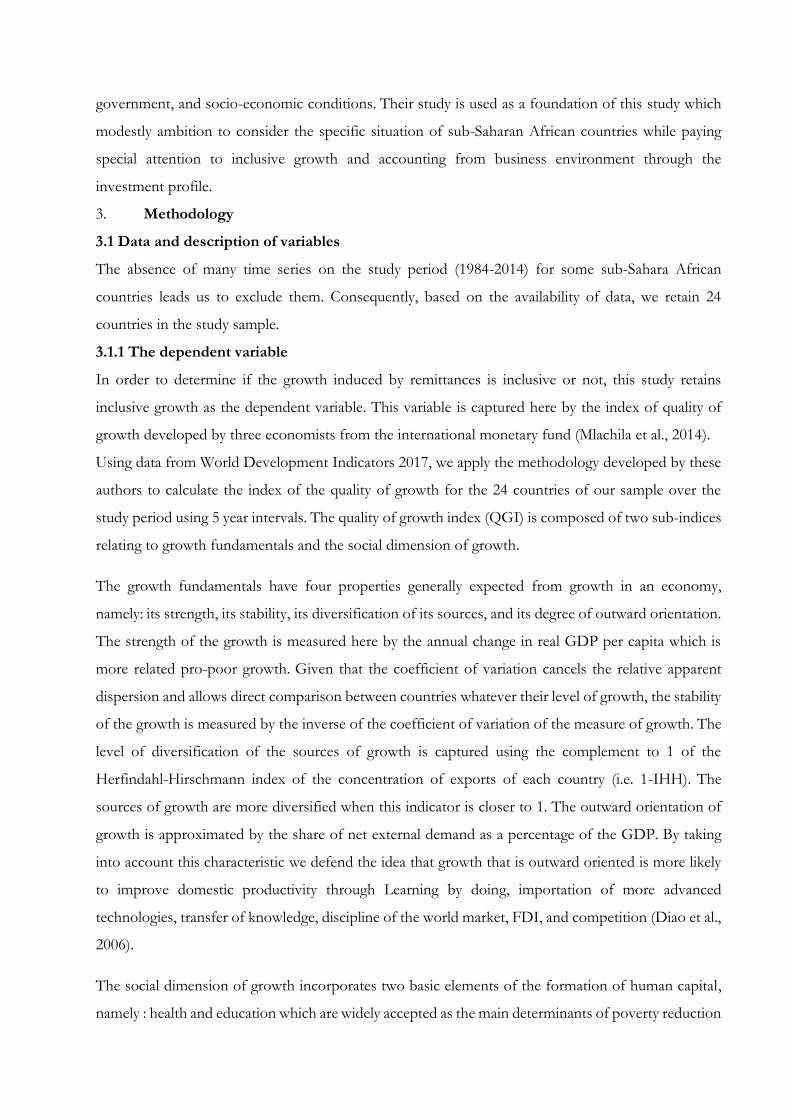
As depicted on the figure 1 below, for countries present both in our sample and that of Mlachila et al.
(2014), figures of QGI are highly similar and the correlation coefficient between the two series stands
at 90.01% albeit marginal differences persist for a limited number of countries mainly explain by
difference in data sources.
Figure 1: correlation between our estimates and that of Mlachila et al. (2014)
Source: Authors and Mlachila et al. (2014)
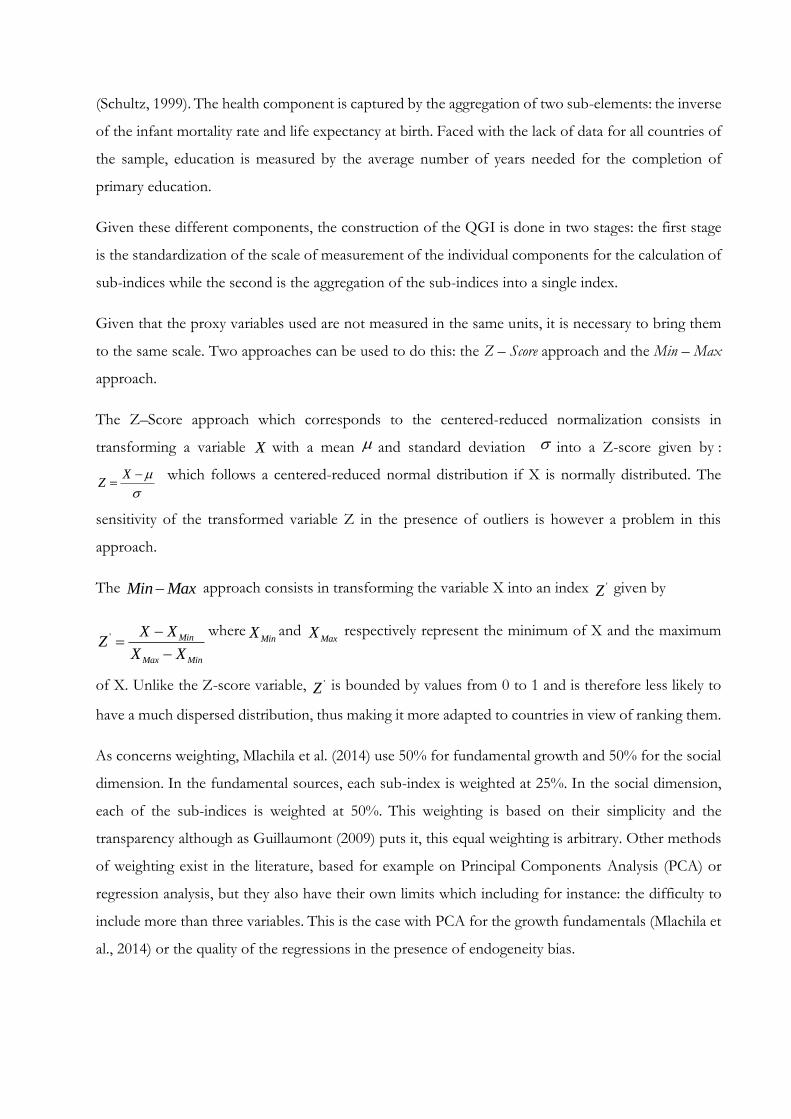
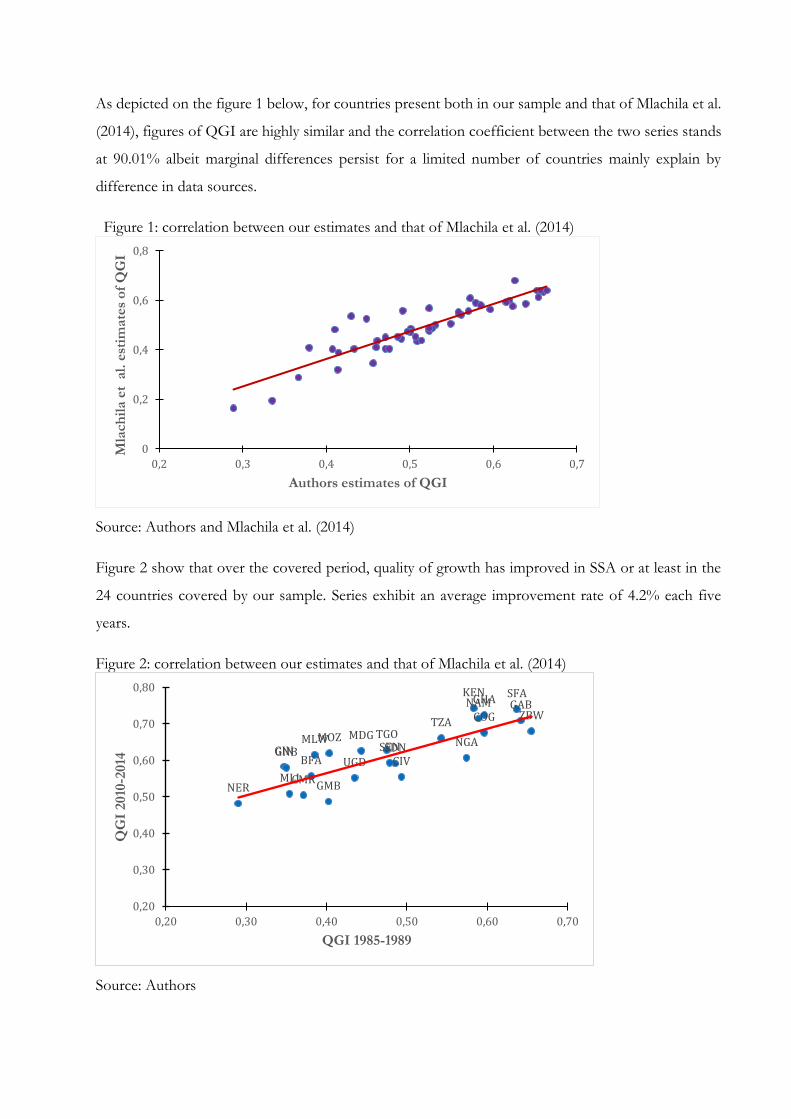
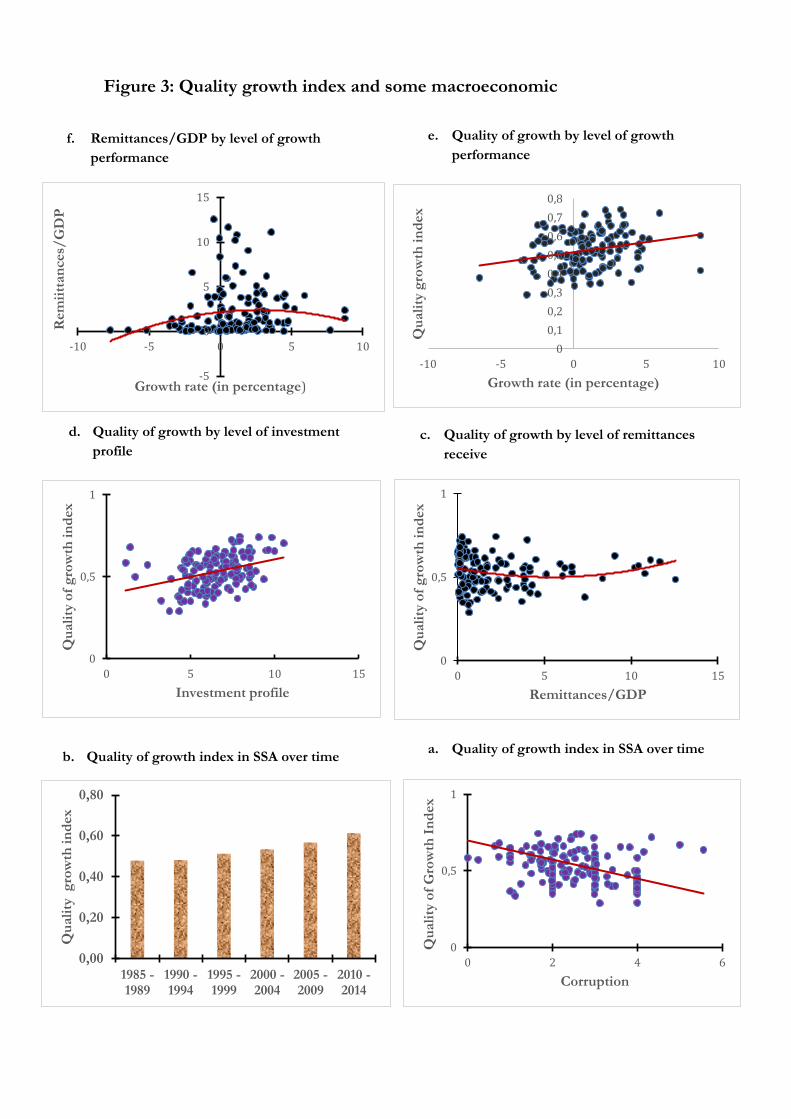
Figure 2 show that over the covered period, quality of growth has improved in SSA or at least in the
24 countries covered by our sample. Series exhibit an average improvement rate of 4.2% each five
years.
Figure 2: correlation between our estimates and that of Mlachila et al. (2014)
Source: Authors
0
0,2
0,4
0,6
0,8
0,2 0,3 0,4 0,5 0,6 0,7
Mla
ch
ila e
t a
l. e
stim
ate
s o
f Q
GI
Authors estimates of QGI
BFA CIV
CMR
COGGABGHA
GIN
GMB
GNB
KEN
MDG
MLI
MOZMLW
NAM
NER
NGASDNSENTGO
TZA
UGD
SFA
ZBW
0,20
0,30
0,40
0,50
0,60
0,70
0,80
0,20 0,30 0,40 0,50 0,60 0,70
QG
I 2010
-2014
QGI 1985-1989
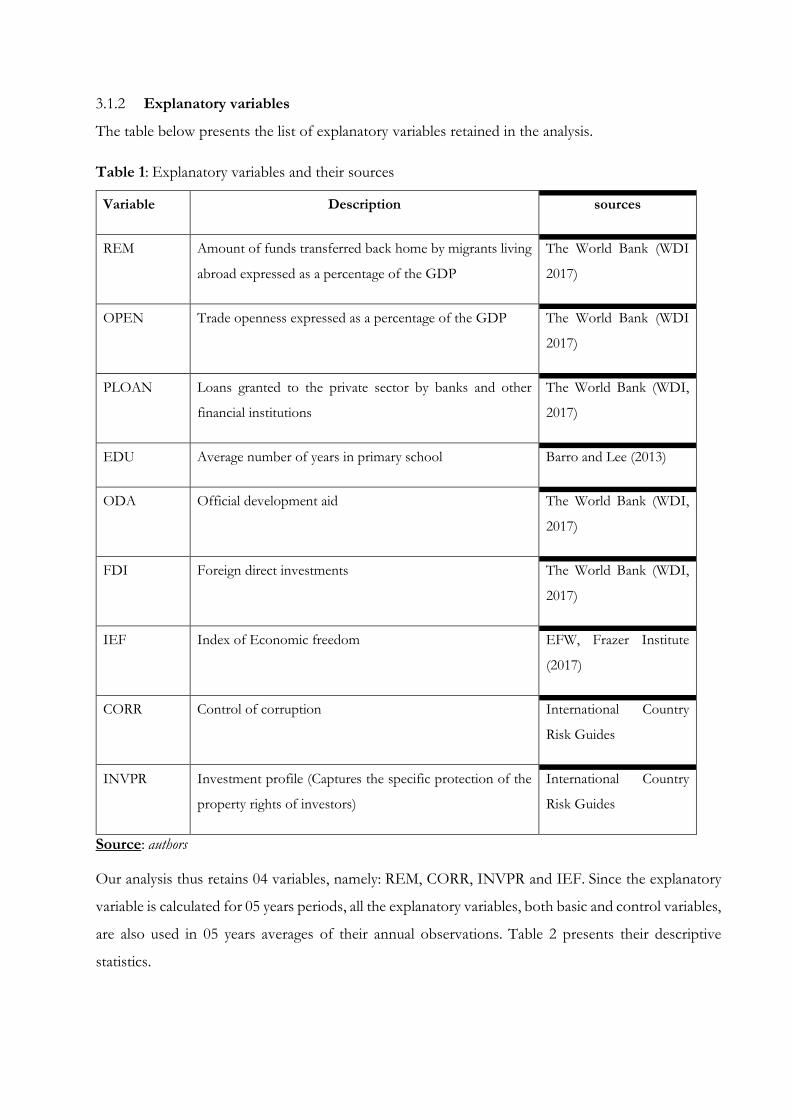
3.1.2 Explanatory variables
The table below presents the list of explanatory variables retained in the analysis.
Table 1: Explanatory variables and their sources
Variable Description sources
REM Amount of funds transferred back home by migrants living
abroad expressed as a percentage of the GDP
The World Bank (WDI
2017)
OPEN Trade openness expressed as a percentage of the GDP The World Bank (WDI
2017)
PLOAN Loans granted to the private sector by banks and other
financial institutions
The World Bank (WDI,
2017)
EDU Average number of years in primary school Barro and Lee (2013)
ODA Official development aid The World Bank (WDI,
2017)
FDI Foreign direct investments The World Bank (WDI,
2017)
IEF Index of Economic freedom EFW, Frazer Institute
(2017)
CORR Control of corruption International Country
Risk Guides
INVPR Investment profile (Captures the specific protection of the
property rights of investors)
International Country
Risk Guides
Source: authors
Our analysis thus retains 04 variables, namely: REM, CORR, INVPR and IEF. Since the explanatory
variable is calculated for 05 years periods, all the explanatory variables, both basic and control variables,
are also used in 05 years averages of their annual observations. Table 2 presents their descriptive
statistics.
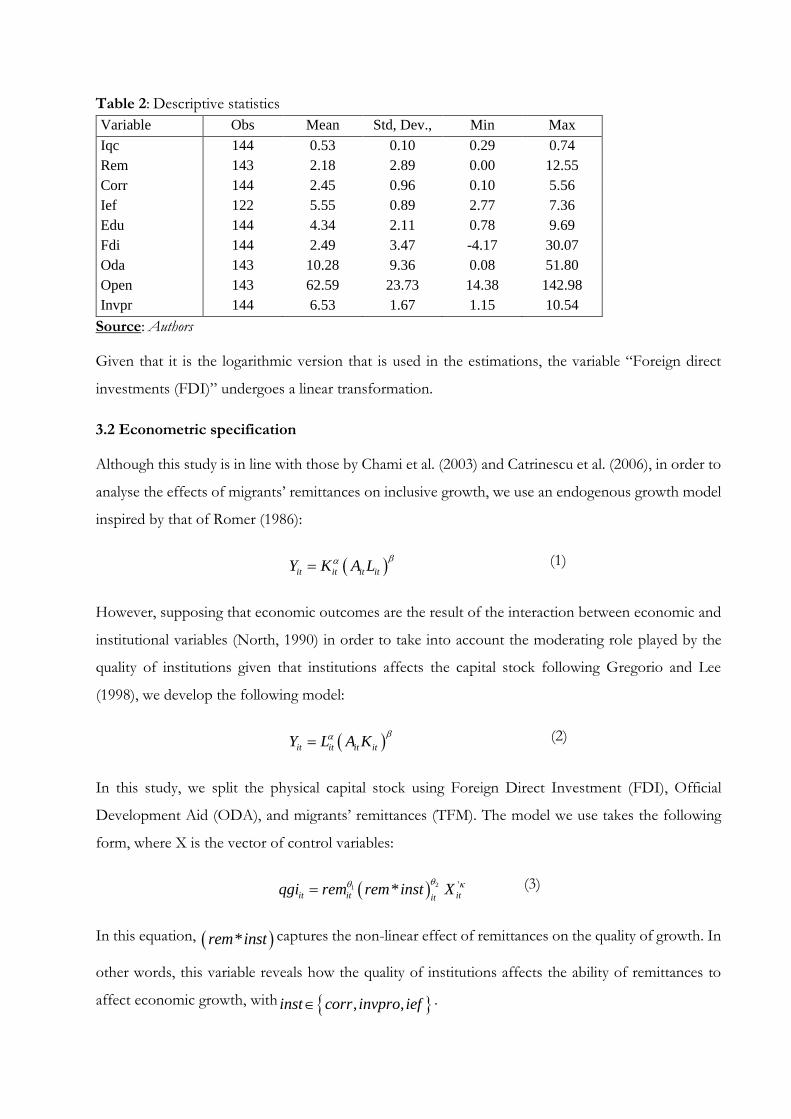
Table 2: Descriptive statistics
Variable Obs Mean Std, Dev., Min Max
Iqc 144 0.53 0.10 0.29 0.74
Rem 143 2.18 2.89 0.00 12.55
Corr 144 2.45 0.96 0.10 5.56
Ief 122 5.55 0.89 2.77 7.36
Edu 144 4.34 2.11 0.78 9.69
Fdi 144 2.49 3.47 -4.17 30.07
Oda 143 10.28 9.36 0.08 51.80
Open 143 62.59 23.73 14.38 142.98
Invpr 144 6.53 1.67 1.15 10.54
Source: Authors
Given that it is the logarithmic version that is used in the estimations, the variable “Foreign direct
investments (FDI)” undergoes a linear transformation.
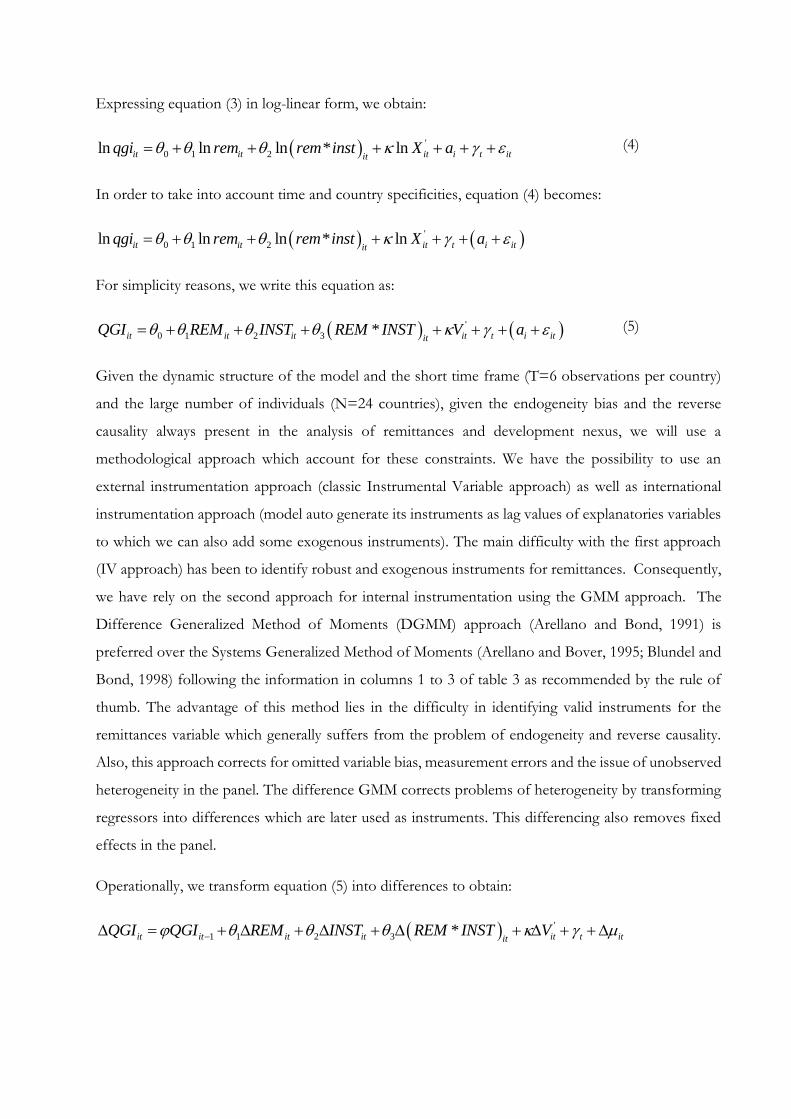
3.2 Econometric specification
Although this study is in line with those by Chami et al. (2003) and Catrinescu et al. (2006), in order to
analyse the effects of migrants’ remittances on inclusive growth, we use an endogenous growth model
inspired by that of Romer (1986):
( )it it it itY K A L= (1)
However, supposing that economic outcomes are the result of the interaction between economic and
institutional variables (North, 1990) in order to take into account the moderating role played by the
quality of institutions given that institutions affects the capital stock following Gregorio and Lee
(1998), we develop the following model:
( )it it it itY L A K= (2)
In this study, we split the physical capital stock using Foreign Direct Investment (FDI), Official
Development Aid (ODA), and migrants’ remittances (TFM). The model we use takes the following
form, where X is the vector of control variables:
( ) 21 '*it it ititqgi rem rem inst X
= (3)
In this equation, ( )*rem inst captures the non-linear effect of remittances on the quality of growth. In
other words, this variable reveals how the quality of institutions affects the ability of remittances to
affect economic growth, with , ,inst corr invpro ief .
Expressing equation (3) in log-linear form, we obtain:
( ) '
0 1 2ln ln ln * lnit it it i t ititqgi rem rem inst X a = + + + + + + (4)
In order to take into account time and country specificities, equation (4) becomes:
( ) ( )'
0 1 2ln ln ln * lnit it it t i ititqgi rem rem inst X a = + + + + + +
For simplicity reasons, we write this equation as:
( ) ( )'
0 1 2 3 *it it it it t i ititQGI REM INST REM INST V a = + + + + + + + (5)
Given the dynamic structure of the model and the short time frame (T=6 observations per country)
and the large number of individuals (N=24 countries), given the endogeneity bias and the reverse
causality always present in the analysis of remittances and development nexus, we will use a
methodological approach which account for these constraints. We have the possibility to use an
external instrumentation approach (classic Instrumental Variable approach) as well as international
instrumentation approach (model auto generate its instruments as lag values of explanatories variables
to which we can also add some exogenous instruments). The main difficulty with the first approach
(IV approach) has been to identify robust and exogenous instruments for remittances. Consequently,
we have rely on the second approach for internal instrumentation using the GMM approach. The
Difference Generalized Method of Moments (DGMM) approach (Arellano and Bond, 1991) is
preferred over the Systems Generalized Method of Moments (Arellano and Bover, 1995; Blundel and
Bond, 1998) following the information in columns 1 to 3 of table 3 as recommended by the rule of
thumb. The advantage of this method lies in the difficulty in identifying valid instruments for the
remittances variable which generally suffers from the problem of endogeneity and reverse causality.
Also, this approach corrects for omitted variable bias, measurement errors and the issue of unobserved
heterogeneity in the panel. The difference GMM corrects problems of heterogeneity by transforming
regressors into differences which are later used as instruments. This differencing also removes fixed
effects in the panel.
Operationally, we transform equation (5) into differences to obtain:
( ) '
1 1 2 3 *it it it it it t ititQGI QGI REM INST REM INST V − = + + + + + +
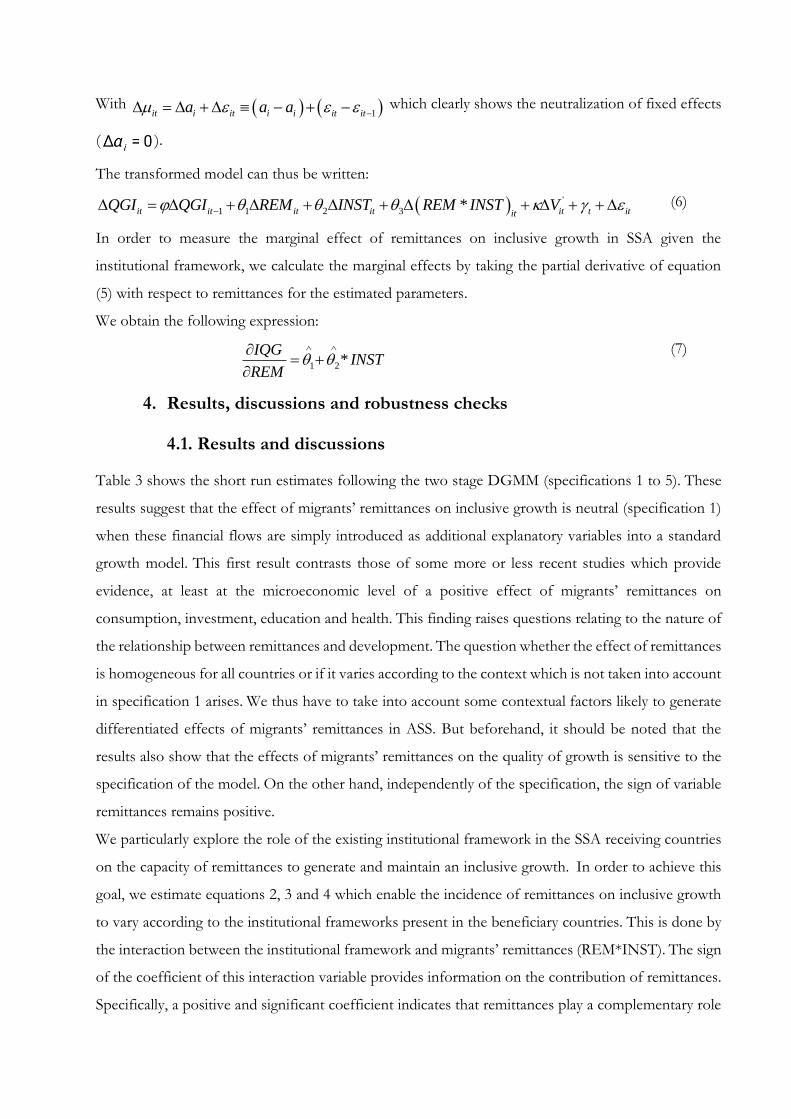
With ( ) ( )1it i it i i it ita a a − = + − + − which clearly shows the neutralization of fixed effects
( ).
The transformed model can thus be written:
( ) '
1 1 2 3 *it it it it it t ititQGI QGI REM INST REM INST V − = + + + + + + (6)
In order to measure the marginal effect of remittances on inclusive growth in SSA given the
institutional framework, we calculate the marginal effects by taking the partial derivative of equation
(5) with respect to remittances for the estimated parameters.
We obtain the following expression:
1 2*IQG
INSTREM
= +
(7)
4. Results, discussions and robustness checks
4.1. Results and discussions
Table 3 shows the short run estimates following the two stage DGMM (specifications 1 to 5). These
results suggest that the effect of migrants’ remittances on inclusive growth is neutral (specification 1)
when these financial flows are simply introduced as additional explanatory variables into a standard
growth model. This first result contrasts those of some more or less recent studies which provide
evidence, at least at the microeconomic level of a positive effect of migrants’ remittances on
consumption, investment, education and health. This finding raises questions relating to the nature of
the relationship between remittances and development. The question whether the effect of remittances
is homogeneous for all countries or if it varies according to the context which is not taken into account
in specification 1 arises. We thus have to take into account some contextual factors likely to generate
differentiated effects of migrants’ remittances in ASS. But beforehand, it should be noted that the
results also show that the effects of migrants’ remittances on the quality of growth is sensitive to the
specification of the model. On the other hand, independently of the specification, the sign of variable
remittances remains positive.
We particularly explore the role of the existing institutional framework in the SSA receiving countries
on the capacity of remittances to generate and maintain an inclusive growth. In order to achieve this
goal, we estimate equations 2, 3 and 4 which enable the incidence of remittances on inclusive growth
to vary according to the institutional frameworks present in the beneficiary countries. This is done by
the interaction between the institutional framework and migrants’ remittances (REM*INST). The sign
of the coefficient of this interaction variable provides information on the contribution of remittances.
Specifically, a positive and significant coefficient indicates that remittances play a complementary role
and that the institutional framework functions correctly to increase the capacity of remittances to
promote inclusive growth. On the other hand, a negative and significant coefficient indicates that
remittances and the institutional framework act as substitutes in the promotion of inclusive growth.
Within the framework of this study, we retain three measures of the institutional quality: the investment
profile, the level of corruption (Country Risk Guide Index) and the index of economic freedom
(Economic Freedom of the World of the Frazer Institute). Specifications 2, 3 and 4 present the effects
of remittances when these various institutional measures are taken into account. It appears that that
the investment profile does not affect the remittances-inclusive growth nexus significantly although
the coefficient of the variable of interaction is negative. According to specifications 2 and 4, the
coefficient of the remittances variable is positive and significant at the 5% level and shows that when
the level of corruption as well as economic freedom are controlled, remittances contribute to boost
inclusive growth in sub-Saharan Africa. In fact, all things being equal, a 1% increase in remittances
leads to an improvement of the quality of growth of 0.07% and 0.39% respectively with the control of
corruption and the control of the level of economic freedom. Also, in both cases, the interaction
variable has a negative coefficient that is significant at the 5% level and has a value of -0.042 for the
level of corruption and -0.219 for the level of economic freedom. These results suggest that the effect
of remittances on the quality of growth is positive but decreases with poor institutions in SSA. In other
words, remittances contribute to reduce the social costs of corruption. Also, they reduce the losses in
welfare resulting from the poor business environment and difficulties in protecting private property
which, while making it difficult to protect the interests of the small entrepreneurs, reduces their
incentives to start income new businesses, thus reducing entrepreneurship and explaining the
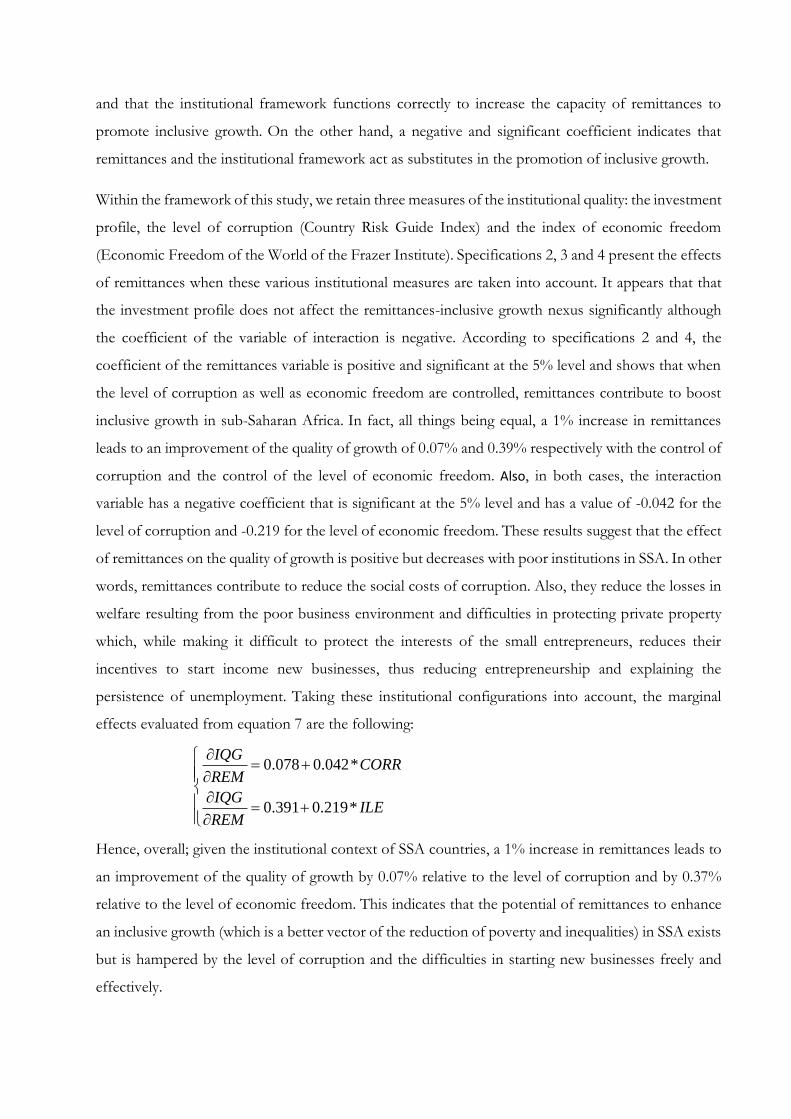
persistence of unemployment. Taking these institutional configurations into account, the marginal
effects evaluated from equation 7 are the following:
0.078 0.042*
0.391 0.219*
IQGCORR
REM
IQGILE
REM
= +
= +
Hence, overall; given the institutional context of SSA countries, a 1% increase in remittances leads to
an improvement of the quality of growth by 0.07% relative to the level of corruption and by 0.37%
relative to the level of economic freedom. This indicates that the potential of remittances to enhance
an inclusive growth (which is a better vector of the reduction of poverty and inequalities) in SSA exists
but is hampered by the level of corruption and the difficulties in starting new businesses freely and
effectively.
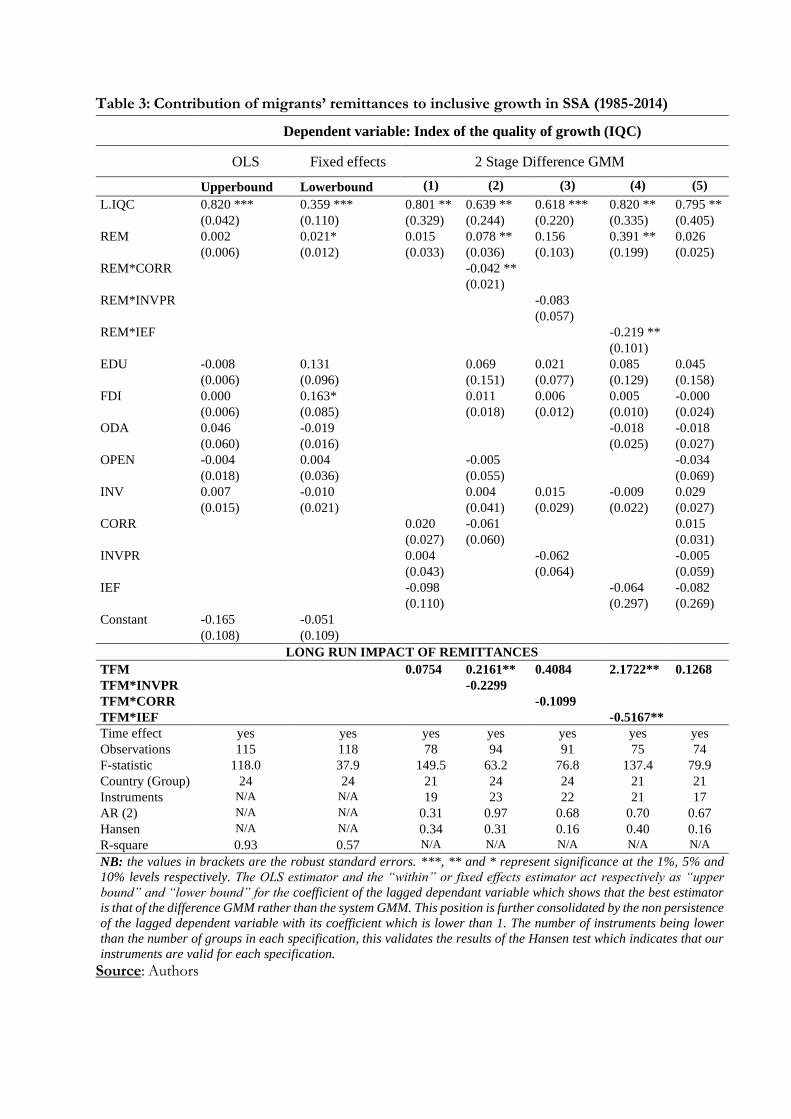
Table 3: Contribution of migrants’ remittances to inclusive growth in SSA (1985-2014)
Dependent variable: Index of the quality of growth (IQC)
OLS Fixed effects 2 Stage Difference GMM
Upperbound Lowerbound (1) (2) (3) (4) (5)
L.IQC 0.820 *** 0.359 *** 0.801 ** 0.639 ** 0.618 *** 0.820 ** 0.795 **
(0.042) (0.110) (0.329) (0.244) (0.220) (0.335) (0.405)
REM 0.002 0.021* 0.015 0.078 ** 0.156 0.391 ** 0.026
(0.006) (0.012) (0.033) (0.036) (0.103) (0.199) (0.025)
REM*CORR -0.042 **
(0.021)
REM*INVPR -0.083
(0.057)
REM*IEF -0.219 **
(0.101)
EDU -0.008 0.131 0.069 0.021 0.085 0.045
(0.006) (0.096) (0.151) (0.077) (0.129) (0.158)
FDI 0.000 0.163* 0.011 0.006 0.005 -0.000
(0.006) (0.085) (0.018) (0.012) (0.010) (0.024)
ODA 0.046 -0.019 -0.018 -0.018
(0.060) (0.016) (0.025) (0.027)
OPEN -0.004 0.004 -0.005 -0.034
(0.018) (0.036) (0.055) (0.069)
INV 0.007 -0.010 0.004 0.015 -0.009 0.029
(0.015) (0.021) (0.041) (0.029) (0.022) (0.027)
CORR 0.020 -0.061 0.015
(0.027) (0.060) (0.031)
INVPR 0.004 -0.062 -0.005
(0.043) (0.064) (0.059)
IEF -0.098 -0.064 -0.082
(0.110) (0.297) (0.269)
Constant -0.165 -0.051
(0.108) (0.109)
LONG RUN IMPACT OF REMITTANCES
TFM 0.0754 0.2161** 0.4084 2.1722** 0.1268
TFM*INVPR -0.2299
TFM*CORR -0.1099
TFM*IEF -0.5167**
Time effect yes yes yes yes yes yes yes
Observations 115 118 78 94 91 75 74
F-statistic 118.0 37.9 149.5 63.2 76.8 137.4 79.9
Country (Group) 24 24 21 24 24 21 21
Instruments N/A N/A 19 23 22 21 17
AR (2) N/A N/A 0.31 0.97 0.68 0.70 0.67
Hansen N/A N/A 0.34 0.31 0.16 0.40 0.16
R-square 0.93 0.57 N/A N/A N/A N/A N/A
NB: the values in brackets are the robust standard errors. ***, ** and * represent significance at the 1%, 5% and
10% levels respectively. The OLS estimator and the “within” or fixed effects estimator act respectively as “upper
bound” and “lower bound” for the coefficient of the lagged dependant variable which shows that the best estimator
is that of the difference GMM rather than the system GMM. This position is further consolidated by the non persistence
of the lagged dependent variable with its coefficient which is lower than 1. The number of instruments being lower
than the number of groups in each specification, this validates the results of the Hansen test which indicates that our
instruments are valid for each specification.
Source: Authors
The results in table 3 above show the short run effects. Table 3 also presents the long run effects of
the remittances on inclusive growth obtained from the short run effects with the DGMM approach.
These long run effects are obtained going from the equation
( ) 1
i
i LR
=
−
Where i is the short run value of the coefficient of our variable of interest (i.e. REM or REM*INST).
Stands for the coefficient of the lag value of dependent variable.
These results show that in the long run, in the presence of corruption, remittances no longer have any
effect on inclusive growth in SSA. However, the coefficient of the interaction variable remains negative
showing the direction of the relationship between the variables. On the other hand, the absence of
freedom to start a new business has an important negative and significant effect on the capacity of
remittances to promote inclusive growth (- 0.51) in the long run.
As a whole, these findings highlight two main problems: (1) in the short run, remittances appear as a
substitute for poor institutions and absorb the negative consequences of corruption and the difficulties
in starting new businesses on inclusive growth while boosting the latter slightly; (2) in the long run on
the other hand, the positive role played by remittances ends up vanishing if nothing is done to improve
the institutional framework. Consequently, it appears that beneficiaries of remittances only devote the
amounts received to productive activities if some key conditions are met and that migrants will only
transfer more if business opportunities are exploitable in total safety.
4.2. Robustness checks
In order to find out whether our results are sensitive to the specification made, we have alter the
specification of our model by considering only lag values of all the explanatories variables (see table 4
below). Moreover, we have also run two additional estimations in which we have not considered any
control variable (see table 5 and 6 in appendix). In the specification without control variables, we have
considered two different cases: case in which remittances are contemporaneous and another case in
which one period lag value of remittances are used as explanatory variable. Results remain globally
unchanged.
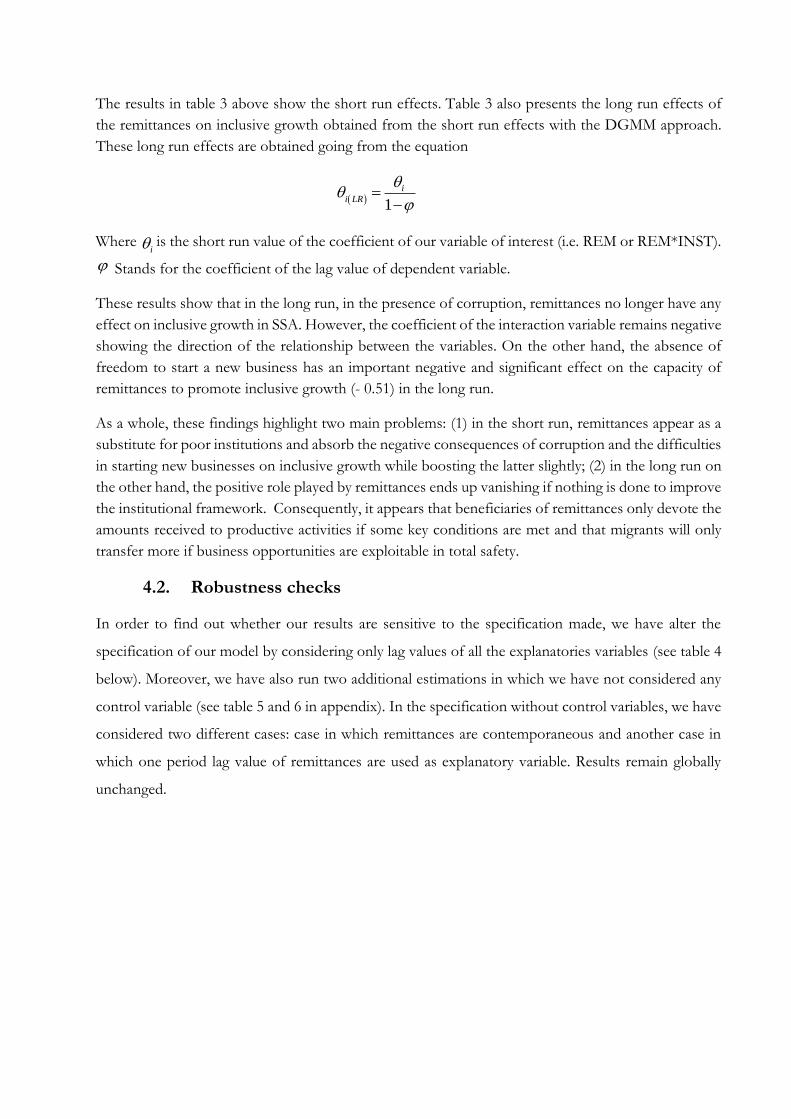
Tableau 4. Impact of lag inflows of remittances on the quality of growth in SSA
(1) (2) (3) (4) (5)
QGI QGI QGI QGI QGI
L.QGI 0.914*** 0.945*** 0.966*** 0.905*** 0.963***
(0.007) (0.052) (0.051) (0.043) (0.043)
L.TFM 0.019*** 0.012*** 0.008 0.018** 0.008
(0.005) (0.004) (0.031) (0.007) (0.006)
L.FDI -0.017 -0.061 -0.053 -0.012
(0.052) (0.050) (0.044) (0.051)
L.APD -0.000 0.005 0.003 0.002
(0.007) (0.008) (0.008) (0.008)
L.SEC -0.045*** -0.045*** -0.031* -0.037***
(0.014) (0.015) (0.018) (0.012)
L.INV 0.034*** 0.025*** 0.028*** 0.039***
(0.007) (0.008) (0.007) (0.008)
L.INVPR 0.017
(0.015) L.TFM*INVPR -0.000
(0.018) L.CORR -0.042***
(0.012) L.TFM*CORR -0.009
(0.006) L.IEF -0.018
(0.016)
L.TFM*IEF 0.007
(0.010)
LONG RUN IMPACT OF REMITTANCES
L.TFM 0.2209*** 0.2182*** 0.2353 0.1895** 0.2162
L.TFM*INVPR 0.0000
L.TFM*CORR -0.0947
L.TFM*IEF 0.1892
Observations 119 119 119 119 119
Number of country 24 24 24 24 24
Wald 19757.04 69910.93 357897.84 134964.19 71313.11
Pvalue (Wald) 0.000 0.000 0.000 0.000 0.000
Instruments 15 19 21 21 21
AR(1) 0.007 0.007 0.006 0.0049 0.007
AR(2) 0.946 0.997 0.969 0.952 0.859
Sargan 0.314 0.287 0.241 0.246 0.274
Standard errors in parentheses. *** p<0.01, ** p<0.05, * p<0.1
5. Conclusion and recommendations
In this study, we evaluate the effects of migrants’ remittances on inclusive growth measured by “the
index of quality of growth”. This study is done on a sample of 24 countries sub-Sahara African
countries over the 1985-2014 period using 5 year intervals. We follow the methodology suggested by
Mlachila et al. (2014) to calculate the index of the quality of growth which enables us to assess the
socio-economic benefits of remittances better than the growth rate of the real GDP per capita which
is the indicator commonly used in similar studies. We also evaluate the role played by the quality of the
institutions in the migrants’ remittances-inclusive growth relationship. By applying the estimator of the
DGMM, our results show that remittances significantly contribute to inclusive growth in sub-Saharan
Africa, although the effect is relatively sensitive to the specification of the model and the indicator of
the quality of the institutions used. In fact, it appears that a 1% increase in remittances leads to an
improvement of the index of the quality of growth of 0.04% and 0.39% respectively with the control
of corruption and the control of the level of economic freedom. On the other hand, the level of
corruption and economic freedoms reduces the contribution of remittances to inclusive growth.
Institutions thus play a key role in the development of the inclusive growth potential of the countries
and SSA governments should consider improving the business environment and reducing corruption
since it is well established that an inclusive growth constitutes a major weapon to fight against poverty
and inequality and is even better than direct government interventions for this purpose. This is even
more important since public policies aimed at reducing poverty by direct government interventions
(cash transfers, conditional cash transfers) have shown their limits. Migrants’ remittances being
financial flows arriving directly into the hands of the target recipients, a better institutional framework
will make it possible to better use these funds on the one hand and encourage migrants to transfer
more, particularly in a context where capital is scarce (FDI, ODA) and domestic saving is by far
insufficient and SSA countries highly indebted.
References Arellano, M., and Bond, S. (1991). “Some tests of specification for panel data: Monte Carlo evidence
and an application to employment equations”. The review of economic studies, 58(2), 277-297.
Arellano, M., and Bover, O. (1995). “Another look at the instrumental-variable estimation of error
components models”. Journal of Econometrics, 68, 29–52. https://doi.org/10.1016/0304-4076(94)01642-
D.
Azam, J. P. and F.Gubert (2006).‖Migrants’ Remittance and the Households in Africa: A review of the
Evidence‖ Journal of African Economies, Vol. 15, AERC supplement 2, pp. 426-462.
Barajas A., Chami R., Fullenkamp C., Gapen M. T, andMontiel P., (2009) “Do workers’ remittances
promote economic growth?,” IMF Working Paper 09/153, International Monetary Fund 2009.
Blundell, R., and Bond, S. (1998). Initial conditions and moment restrictions in dynamic panel data
models. Journal of Econometrics, 87(1), 115–143. https://doi.org/10.1016/S0304-4076(98)00009-8.
BM (2017), World Development Indicators 2016.Washington, DC: World Bank.
BM(2009), “The Quality of Growth”, New York: Oxford University Press for the World Bank.
Bourdet, Y., and H. Falck (2006), “Emigrants’ Remittances and Dutch Disease in Cape Verde”.
International Economic Journal, 20, 267-284.
Buchanan, J. M. (1975), "The Samaritan's Dilemma", in Altruism, Morality and Economic Theory, Edmund
S. Phelps, ed., New York: Russell Sage Foundation, pp. 71-85.
Catrinescu N., Leon-Ledesma M., Piracha M., & Quillin B., (2006) “Remittances, institutions, and
economic growth,” World Development, 2006, 37 (1), 81– 30 92.Center for Latin American Monetary
Studies (CEMLA) International Remittances in El Salvador. Inter-American Development Bank,
Washington, D.C.http://www.cemlaremesas.org/informes/report-elsalvador.pdf, 2006.
Chami R. &Fullencamp C. (2013) « Au delà de la famille ». Finances & Développement Septembre
2013
Chami, R., Fullenkamp C., &Jahjah S., (2003), “Are Immigrants’ Remittance Flows a Source of Capital
for Development?” IMF Staff Papers, Vol. 25 (Washington: International Monetary Fund).
De Haas, H. (2007) Remittances, Migration and Social Development.UNRISDProgramme Paper.
De Gregorio, J. (1992), “Economic growth in Latin America”, Journal of Development Economics, 39, pp.
58-84.
Diao, X., J. Rattso, and H. E. Stokke, (2006), “Learning by Exporting and Structural Change: A Ramsey
Growth Model of Thailand”, Journal of Policy Modeling, Vol. 28, pp. 293–306.
El-Sakka, M. and McNabb, R. (1999). “The Macroeconomic Determinants of Emigrants’
Remittances”. World Development, 27 (8): 1493-1502.
Guillaumont, P., (2009), “An Economic Vulnerability Index: Its Design and Use for International
Development Policy”, Oxford Development Studies, 37 (3), 193–228
Giuliano, P. and M. Ruiz-Arranz. (2006). “Remittances, Financial Development, and Growth”,
International Monetary Fund, Working Paper 05/234
Jadotte, E. (2009), “International Migration, Remittances and Labour Supply. The Case of the Republic
of Haiti”. United Nations University. World Institute for Development Economics Research. UNU-
WIDER. Research Paper No. 2009/28.
Kapur, D., (2004), “Remittances: The New Development Mantra?” G24 Discussion Paper No 29.
Kireyev, A. (2006). “The Macroeconomics of Remittances: the Case of Tajikistan”. IMF Working Paper,
(06/02), International Monetary Fund.
Lartey E.K.K. (2011) Remittances, investment and growth in sub-Saharan Africa, The Journal of
International Trade & Economic Development: An International and Comparative Review, 22:7,
1038-1058, DOI:10.1080/09638199.2011.632692
León-Ledesma, M. andPiracha, M. (2001). International migration and the role of remittances in
Eastern Europe. University of Kent Discussion Paper, No. 01/13, Canterbury, University of Kent.
Lipton, M. (1980). Migration from rural areas of poor countries: the impact on rural productivity and
income distribution. World development, 8(1), 1-24.
Martinez, M., and M. Mlachila, 2013, “The Quality of the Recent High-Growth Episode in Sub-
Saharan Africa,” IMF Working Paper 13/53 (Washington: International Monetary Fund).
Mesnard, Alice (2004). Temporary migration and capital market imperfections. Oxford Economic
Papers (Oxford, England), vol. 56 (April), pp. 242-262.
Mishra, P. (2005), ―Macroeconomic Impact of Remittances in the Caribbean‖, Unpublished paper,
International Monetary Fund, Washington, DC.
Mlachila M., Tapsoba R. and S. J. A. Tapsoba (2014), “A quality of growth index for developing
countries: a proposal”, IMF Working Paper, WP/14/172
Ndikumana L. (2014), “Capital Flight from Africa and Development Inequality: Domestic and Global
Dimensions”. Conference of the Institute for New Economic Thinking (INET), Paris, 10 April 2015.
North, D. C. (1990), “Institutions, Institutional Change and Economic Performance”, Cambridge
University Press, UK.
OCDE (2014), “Croissance inclusive”. Réunion du conseil de l’OCDE au niveau des ministres, 6-7
Mai 2014, Paris
Ramirez, D.M. (2013). Do financial and institutional variables enhance the impact of remittances on
economic growth in Latin America and the Caribbean? A panel cointegration analysis. International
Atlantic Economic Society, Vol. 19, 273-288
Ratha D. and Mohapatra S. (2007). Increasing the Macroeconomic Impact of Remittances on
Development. Development Prospects Group, The World Bank. Washington D.C. 20433. November
26, 2007
Ratha, D. (2013). “The impact of remittances on economic growth and poverty reduction”. Migration
Policy Institute. No 8, September 2013.
Rodrik, D. (2000a). Trade Policy Reform as Institutional Reform in Handbook on "Developing
Countries and the Next Round of WTO Negotiations," edited by Bernard Hoekman
Romer, P.M.(1986), “Increasing Returns and Long Run Growth”, Journal of Political Economy, 94, pp.
1002-1037.
Russell, S.S. (1995). “Remittances from International Migration: A Review in Perspectives”. World
Development, 14 (6): 677-696.
Schultz, T. P. (1999). “Women's Role in the Agricultural Household: Bargaining and Human Capital” (No. 803). Center discussion paper.
Singh, Raju Jan, Markus Haacker, Kyung woo Lee, and Maëlan Le Goff, (2011) “Determinants and
macroeconomic impact of remittances in Sub-Saharan Africa,” Journal of African Economies, 2011,
20 (2), 312–340.
Sobiech I. (2018) “Remittances, finance and growth: does financial development foster the impact of
remittances on economic growth?”, World Development 113 (2018) 44-59
Tamokwe Piaptie G.B.(2009), « Institutional Framework and Diaspora’s Investment in developing
Countries», In proceedings of the African economic conference 2007, ECONOMICA, Paris. PP. 259-283.
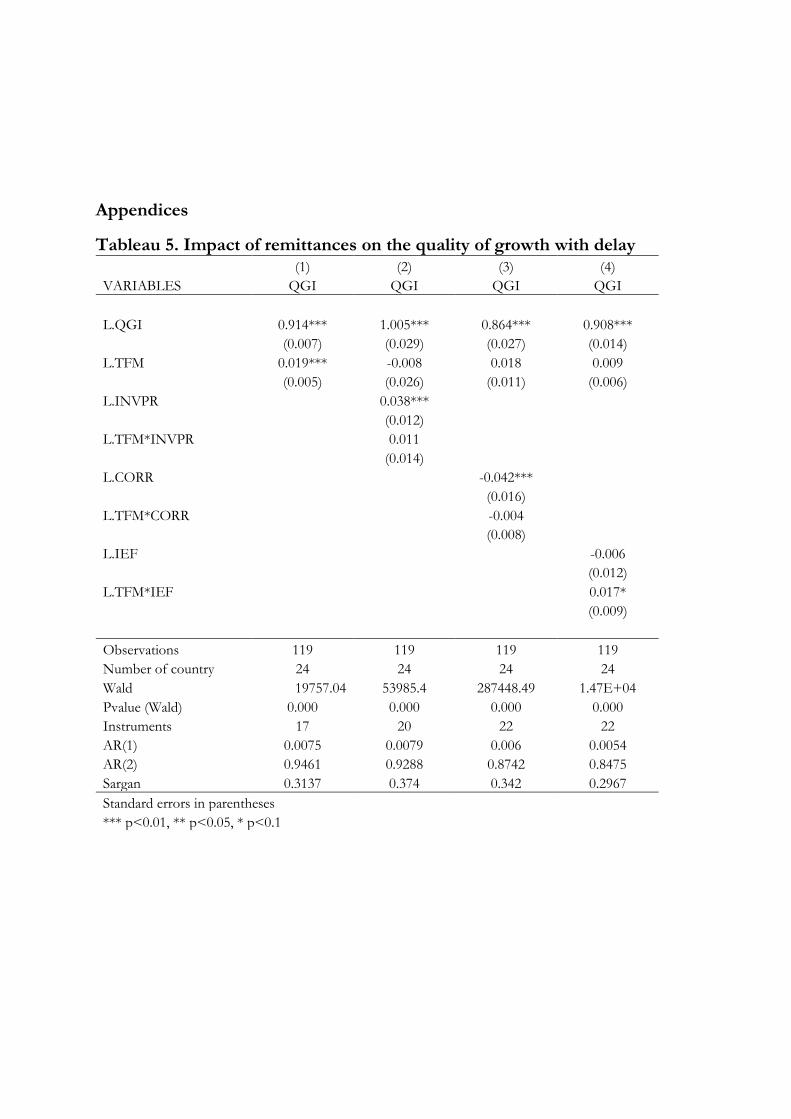
Appendices
Tableau 5. Impact of remittances on the quality of growth with delay (1) (2) (3) (4)
VARIABLES QGI QGI QGI QGI
L.QGI 0.914*** 1.005*** 0.864*** 0.908***
(0.007) (0.029) (0.027) (0.014)
L.TFM 0.019*** -0.008 0.018 0.009
(0.005) (0.026) (0.011) (0.006)
L.INVPR 0.038***
(0.012) L.TFM*INVPR 0.011
(0.014) L.CORR -0.042***
(0.016) L.TFM*CORR -0.004
(0.008) L.IEF -0.006
(0.012)
L.TFM*IEF 0.017*
(0.009)
Observations 119 119 119 119
Number of country 24 24 24 24
Wald 19757.04 53985.4 287448.49 1.47E+04
Pvalue (Wald) 0.000 0.000 0.000 0.000
Instruments 17 20 22 22
AR(1) 0.0075 0.0079 0.006 0.0054
AR(2) 0.9461 0.9288 0.8742 0.8475
Sargan 0.3137 0.374 0.342 0.2967
Standard errors in parentheses *** p<0.01, ** p<0.05, * p<0.1
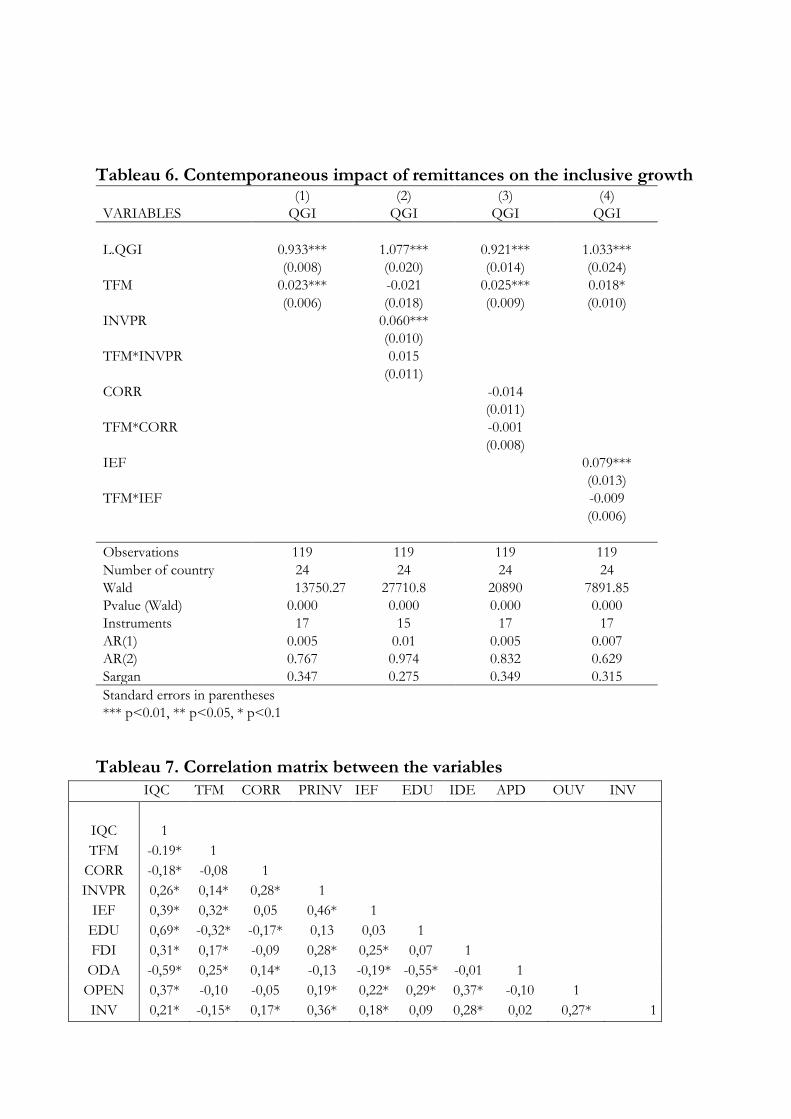
Tableau 6. Contemporaneous impact of remittances on the inclusive growth (1) (2) (3) (4)
VARIABLES QGI QGI QGI QGI
L.QGI 0.933*** 1.077*** 0.921*** 1.033***
(0.008) (0.020) (0.014) (0.024)
TFM 0.023*** -0.021 0.025*** 0.018*
(0.006) (0.018) (0.009) (0.010)
INVPR 0.060***
(0.010) TFM*INVPR 0.015
(0.011) CORR -0.014
(0.011) TFM*CORR -0.001
(0.008) IEF 0.079***
(0.013)
TFM*IEF -0.009
(0.006)
Observations 119 119 119 119
Number of country 24 24 24 24
Wald 13750.27 27710.8 20890 7891.85
Pvalue (Wald) 0.000 0.000 0.000 0.000
Instruments 17 15 17 17
AR(1) 0.005 0.01 0.005 0.007
AR(2) 0.767 0.974 0.832 0.629
Sargan 0.347 0.275 0.349 0.315
Standard errors in parentheses *** p<0.01, ** p<0.05, * p<0.1
Tableau 7. Correlation matrix between the variables
IQC TFM CORR PRINV IEF EDU IDE APD OUV INV
IQC 1
TFM -0.19* 1
CORR -0,18* -0,08 1
INVPR 0,26* 0,14* 0,28* 1
IEF 0,39* 0,32* 0,05 0,46* 1
EDU 0,69* -0,32* -0,17* 0,13 0,03 1
FDI 0,31* 0,17* -0,09 0,28* 0,25* 0,07 1
ODA -0,59* 0,25* 0,14* -0,13 -0,19* -0,55* -0,01 1
OPEN 0,37* -0,10 -0,05 0,19* 0,22* 0,29* 0,37* -0,10 1
INV 0,21* -0,15* 0,17* 0,36* 0,18* 0,09 0,28* 0,02 0,27* 1
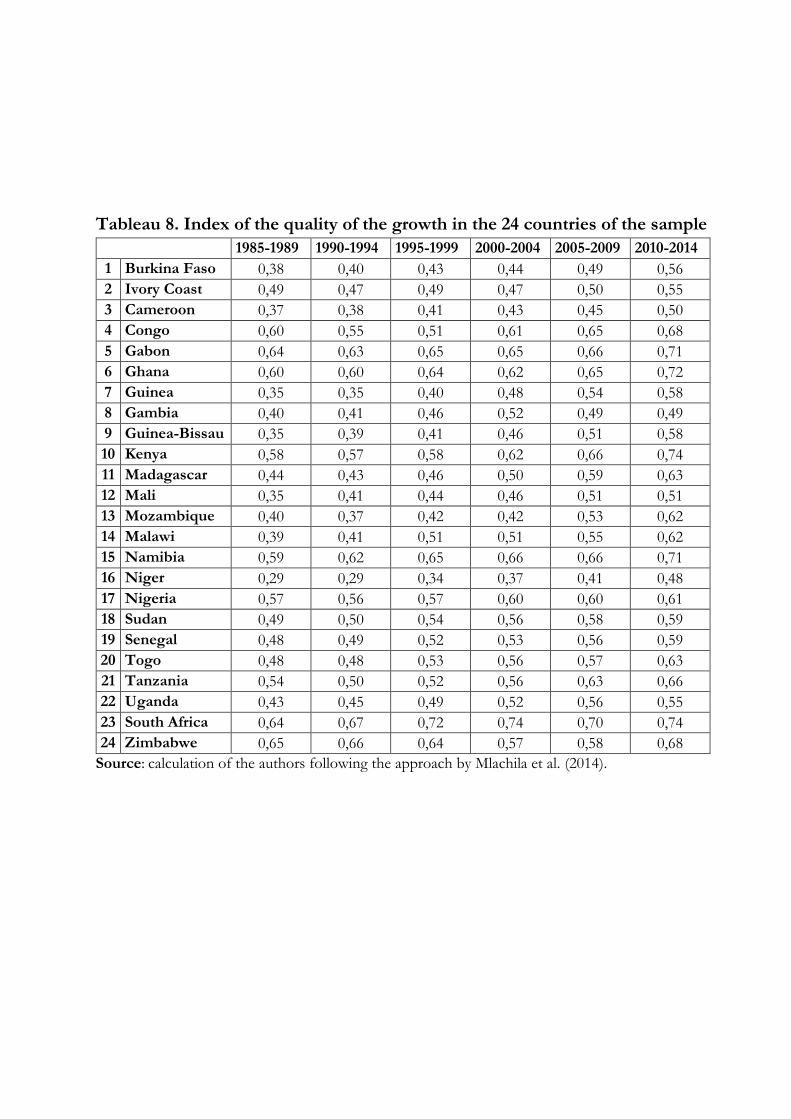
Tableau 8. Index of the quality of the growth in the 24 countries of the sample
1985-1989 1990-1994 1995-1999 2000-2004 2005-2009 2010-2014
1 Burkina Faso 0,38 0,40 0,43 0,44 0,49 0,56
2 Ivory Coast 0,49 0,47 0,49 0,47 0,50 0,55
3 Cameroon 0,37 0,38 0,41 0,43 0,45 0,50
4 Congo 0,60 0,55 0,51 0,61 0,65 0,68
5 Gabon 0,64 0,63 0,65 0,65 0,66 0,71
6 Ghana 0,60 0,60 0,64 0,62 0,65 0,72
7 Guinea 0,35 0,35 0,40 0,48 0,54 0,58
8 Gambia 0,40 0,41 0,46 0,52 0,49 0,49
9 Guinea-Bissau 0,35 0,39 0,41 0,46 0,51 0,58
10 Kenya 0,58 0,57 0,58 0,62 0,66 0,74
11 Madagascar 0,44 0,43 0,46 0,50 0,59 0,63
12 Mali 0,35 0,41 0,44 0,46 0,51 0,51
13 Mozambique 0,40 0,37 0,42 0,42 0,53 0,62
14 Malawi 0,39 0,41 0,51 0,51 0,55 0,62
15 Namibia 0,59 0,62 0,65 0,66 0,66 0,71
16 Niger 0,29 0,29 0,34 0,37 0,41 0,48
17 Nigeria 0,57 0,56 0,57 0,60 0,60 0,61
18 Sudan 0,49 0,50 0,54 0,56 0,58 0,59
19 Senegal 0,48 0,49 0,52 0,53 0,56 0,59
20 Togo 0,48 0,48 0,53 0,56 0,57 0,63
21 Tanzania 0,54 0,50 0,52 0,56 0,63 0,66
22 Uganda 0,43 0,45 0,49 0,52 0,56 0,55
23 South Africa 0,64 0,67 0,72 0,74 0,70 0,74
24 Zimbabwe 0,65 0,66 0,64 0,57 0,58 0,68
Source: calculation of the authors following the approach by Mlachila et al. (2014).
-5
0
5
10
15
-10 -5 0 5 10
Rem
iitt
an
ces/
GD
P
Growth rate (in percentage)
0
0,1
0,2
0,3
0,4
0,5
0,6
0,7
0,8
-10 -5 0 5 10
Qu
ali
ty g
row
th i
nd
ex
Growth rate (in percentage)
0
0,5
1
0 5 10 15
Qu
ali
ty o
f g
row
th i
nd
ex
Remittances/GDP
0
0,5
1
0 2 4 6
Qu
ali
ty o
f G
row
th I
nd
ex
Corruption
0,00
0,20
0,40
0,60
0,80
1985 -1989
1990 -1994
1995 -1999
2000 -2004
2005 -2009
2010 -2014
Qu
ali
ty g
row
th i
nd
ex
0
0,5
1
0 5 10 15
Qu
ali
ty o
f g
row
th i
nd
ex
Investment profile
f. Remittances/GDP by level of growth
performance
e. Quality of growth by level of growth
performance
d. Quality of growth by level of investment
profile c. Quality of growth by level of remittances
receive
b. Quality of growth index in SSA over time a. Quality of growth index in SSA over time
Figure 3: Quality growth index and some macroeconomic
variable in SSA