Embed Size (px)
Citation preview
Migrant Roma in the United Kingdom

3Migrant Roma in the United Kingdom: population size and experiences of local authorities and partners
Contents
Acknowledgements 4
Executive Summary 6
Introduction 10
Context 16
Awareness of Migrant Roma living in local authority areas 22
Source of awareness of Roma populations 23
Characteristics of the UK migrant Roma population 27
Engaging with migrant Roma in local areas 35
Perceptions of challenges and issues 39
Conclusion 45
References 48
Appendix 1: Survey methodology 51
Appendix 2: Local authority survey covering letter 55
Appendix 3: Local authority survey questionnaire 57
Appendix 4: Question guide for key informant interviews 68
Appendix 5: A methodology for making a UK migrant Roma population estimate 72
Acknowledgements
Without the time, expertise and contributions of a number of individuals and organisations, this study could not have been completed. The University of Salford acknowledges the financial support of the Joseph Rowntree Charitable Trust. Particular thanks must go to Juliet Prager and Michael Pitchford who offered a great deal of support and advice throughout the production of this research. Thanks are also due to project partners Migration Yorkshire and to members of the advisory group who provided input into the design of the study and assisted in the delivery of the methodology specifically David Brown, Julie Davis, Natalie Stables and Emily Georghiou. Images were kindly provided by Ciara Leeming. All images ©Ciara Leeming and all rights reserved. For further information see www.ciaraleeming.co.uk.
A number of individuals also provided input and advice and their contribution is noted in particular Richard Armitage, Nissa Finney and everyone at the Roma Support Group.
Particular thanks must, of course, go to the people who found the time to respond to our survey and talk to us and answer our questions in a full, honest and patient manner. It is hoped that this report is able to accurately reflect their experiences.
This report is based on research undertaken by the study team and the analysis and comment thereafter do not necessarily reflect the views and opinions of the research commissioners, or any participating stakeholders and agencies. The authors take responsibility for any inaccuracies or omissions in the report.
About the authors
Philip Brown is a Senior Research Fellow and Director of the Sustainable Housing & Urban Studies Unit (SHUSU) at the University of Salford. Lisa Scullion is a Research Fellow and Philip Martin is a Research Assistant within SHUSU.
4

Executive Summary
Background
There currently exists an inadequate understanding of the size of the migrant Roma population resident in the United Kingdom (UK) and, despite some notable examples, a parallel lack of awareness of the significant issues and experiences faced by members of this community across the country. In 2012 the Sustainable Housing & Urban Studies Unit (SHUSU) at the University of Salford undertook research, funded by the Joseph Rowntree Charitable Trust, across the UK in order to address this knowledge gap. The overall objective of this study was to provide an evidence-base with the aim of informing a more comprehensive and accurate development of measures to support the inclusion of migrant Roma in the UK. There were two specific objectives:
1. To obtain hard data about the number of migrant Roma at a national, regional and local authority level.
2. To identify particular service areas where local authorities, partners and Roma communities may need additional support to enable positive outcomes.
Policy background
The term ‘Roma’ covers a wide range of communities at the European level. In order to provide a level of specificity about who is included in such a definition, the Council of Europe adopted the following inclusive description:
“The term “Roma” used at the Council of Europe refers to Roma, Sinti, Kale and related groups in Europe, including Travellers and the Eastern groups (Dom and Lom), and covers the wide diversity of the groups concerned, including persons who identify themselves as Gypsies.”1
On 5th April 2011 the European Commission published a communication entitled ‘An EU Framework for National Roma Integration Strategies up to 2020’2, which called on all Member States to prepare, or adapt strategic documents to meet four key EU Roma Integration goals: access to education, employment, healthcare and housing. The communication admitted that progress on Roma integration had not been satisfactory and explicitly requested that states develop National Roma Integration Strategies which included “targeted actions and sufficient funding (national, EU and other) to deliver” on the goals.
The UK’s submission to the call comprised a document outlining both the legal framework in the UK in respect of Roma and the approaches adopted by the UK government as well as those of the devolved administrations of Scotland, Wales and Northern Ireland. The content of this document focused overwhelmingly on inequalities and other issues impacting on indigenous UK Gypsies and Travellers; the attention placed upon migrant Roma arriving, typically, from Central and Eastern Europe (CEE) was minimal3.
6
1The definition is included in a number of Council documents, e.g. Committee of Experts on Roma and Travellers (MG-S-ROM), New terms of reference adopted by the Ministers’ Deputies at their 1032nd meeting in Strasbourg on 9 July 2008. The specific ‘EU and Roma’ section on the European Commission’s website echoes this, stating “As it is most commonly used in EU policy documents and discussions, the term “Roma” here refers to a variety of groups of people who describe themselves as Roma, Gypsies, Travellers, Manouches, Ashkali, Sinti and other titles. The use of the term Roma is in no way intended to downplay the great diversity within the many different Romani groups and related communities, nor is it intended to promote stereotypes.” http://ec.europa.eu/justice/discrimination/roma/index_en.htm
2Communication from the Commission to the European Parliament, The Council, the European Economic and Social Committee and the Committee of the Regions, An EU Framework for National Roma Integration Strategies up to 2020, European Commission, Brussels, 5.4.2011 COM(2011) 173 final. Available at: http://eur-lex.europa.eu/LexUriServ/LexUriServ.do?uri=COM:2011:0173:FIN:EN:PDF For a summary see Working together for Roma inclusion - The EU Framework explained, European Union, (2011), available at: http://ec.europa.eu/justice/discrimination/files/working_together_for_roma_inclusion_en.pdf
3Council conclusions on an EU Framework strategy for Roma integration up to 2020: Great Britain and Northern Ireland (2012). Available at: http://ec.europa.eu/justice/discrimination/files/roma_uk_strategy_en.pdf
Executive Summary
Migrant Roma in the United Kingdom: population size and experiences of local authorities and partners
7
Although there remains only a partial comprehension of the total size of the indigenous UK Gypsy and Traveller population (and the various issues faced by these groups), knowledge is improving. However, this is not matched with regard to migrant Roma in the UK and an overall strategic grasp of the core issues, if any, arising from their on-going settlement.
Approach to the research
The approach to this study involved bringing together existing data as well as undertaking new empirical research.
A survey was undertaken with all local authorities across the UK to establish their locally informed estimations as to the size of the migrant Roma population. A total of 151 questionnaires were returned out of 406 issued (a response rate of 37 per cent). Questionnaires received by nation were as follows:
• England 37 per cent response rate
• Scotland 25 per cent response rate
• Wales 50 per cent response rate
• Northern Ireland 50 per cent response rate
In addition, a total of 29 key informants were consulted with via semi-structured interviews in order to look at issues arising in greater depth.
Findings
Estimated size of the migrant Roma population in the UK
• We estimate that as of 2012 there are at least 197,705 migrant Roma living in the UK. Based on the responses from key informants this is considered a conservative estimate of the population. It is likely that this population will continue to increase.
• The population estimate for England is 193,297 individuals. It is suggested that Scotland has at least 3,030 migrant Roma individuals with 878 in Wales and 500 in Northern Ireland.
• The data indicates that the population of migrant Roma is predominantly urban and located in existing multi-ethnic areas. This study suggests that in England populations are concentrated in the North West and London with significant populations in Yorkshire and the Humber, East Midlands and West Midlands. There is a significant degree of uncertainty from key informants about the implications the end of transitional rights for Roma from Romania and Bulgaria will have for migration flows.
• The estimate of approximately 200,000 migrant Roma individuals is similar in number to projections for the population of indigenous Gypsies and Travellers in England and Wales which is estimated to be between 200,000 – 300,000 individuals. When combined together the population of migrant Roma and indigenous Gypsies and Travellers would equate to around 400,000 – 500,000 ‘Roma’, as defined by the Council of Europe, living in the UK.
8
Settlement in the UK
• The pattern of why migrant Roma settled in particular areas was seen as complex. Key informants reported many reasons which may explain settlement decisions by migrant Roma. Having direct or secondary experience of an area and having members of a wider family network present in the area was seen as important, as was having access to affordable accommodation.
• Within local authority areas it was common for authorities to report that Roma tended to live as part of a diaspora along national lines. Such a situation of living in particularly high densities was a common feature/observation across a number of areas of the UK. This was largely attributed to having access to properties in the private rented sector coupled with strong familial bonds. It was often reported that Roma tended to move from a single location in their country of origin to a single location in the UK in significant numbers either at the same time or over a period of time.
The engagement of migrant Roma with service areas
• A number of authorities reported that they were aware of migrant Roma living in their areas that rarely came into contact with the authority in any way. This was largely attributed to migrant Roma tending to be accommodated in private rented housing and not engaging, in any perceptible way, with local authority services or with key statutory partners.
• Authorities reported that the main way they came into contact with Roma was through educational issues/children’s services. This was often as a result of some sort of crisis within the household or when issues were reported by the general public or referrals made by other agencies (e.g. housing services, environmental health, police etc.).
Mobility of migrant Roma
• Where authorities were aware of Roma living in their areas, levels of mobility within migrant Roma populations were commonly reported as high.
• The settlement of migrant Roma was consistently reported as precarious. The nature of mobility operated at a number of levels. Movement was reported as occuring within areas; from one dwelling to another but also family members moving from and re-joining dwellings. This was thought to be largely as a result of particularly large family sizes within Roma populations and the lack of available accommodation suitable in size to facilitate single dwelling living. Movement between areas was observed; such movement was reported on a spectrum of people leaving for short periods of time to those who made more semi-permanent moves. International movement was reported, although this was far less common.
Addressing migrant Roma settlement
• Migrant Roma were often seen as arriving with varied and complex needs. Particular issues discussed related to the presence of poverty, experience of entrenched discrimination resulting in an absence of trust and lack of literacy abilities (in any language).
• Local authorities reported that they found catering for the diversity and complexity of needs challenging. Occasionally this was linked to the heterogeneity of the Roma population, meaning that ensuring appropriate and meaningful service provision could be demanding.
• Reductions in funding available for local authorities and partners were often cited as contributing to the challenges faced. Posts were being lost within many organisations (statutory and non-statutory) including in those services which usually led and undertook engagement with Traveller and/or diverse communities. This had the impact of reducing the capacity available to deal with Roma (including Gypsy and Traveller) issues at a time of rising demand, as well as eradicating institutional memory about how to address such issues when they were presented.

1 Introduction
Migrant Roma in the United Kingdom: population size and experiences of local authorities and partners
9

One Introduction
1 Introduction
Migrant Roma in the United Kingdom: population size and experiences of local authorities and partners
11
Background to this study
In 2012, the UK government submitted a twenty four page response to the European Commission’s call the previous year for Member States to provide National Roma Integration Strategies (NRIS).4 It is apparent within this strategy that significant lacunae exist around both the demographics of Central and Eastern Roma in the UK and what issues, if any, have arisen from their on-going arrival and settlement. The supporting text goes on to state, “There are no reliable data on the number of Roma in the UK – entrants to the UK are not monitored by ethnic origin.”5 Alongside the register of strategies submitted by Member States, the Commission’s website also includes factsheets for all countries, each of which provides national estimates of ‘Roma’ populations. This is recorded as 225,000 for the UK. However, this figure does not distinguish between central/eastern European Roma and indigenous Gypsies and Travellers and is based on an earlier assessment produced in 2006.6
The European context
The social exclusion faced by members of Roma communities living in European Union Member States, and beyond, is widely recognised and acknowledged (Amnesty International, 2011; Bartlett, Benini and Gordon, 2011; Brown, Dwyer and Scullion, 2013). In 2008 a Commission Staff Working Document (CSWD) presented an analysis of the legal and financial instruments and European Union (EU) level policies on Roma inclusion. While the analysis suggested that existing instruments and policies are in principle appropriate and suitable for the inclusion of Roma, it was reported that there was often an implementation gap at the national, regional and local levels. The main reasons for their limited effectiveness on the ground are a lack of political will, a lack of strong partnerships and coordination mechanisms, but also an unwillingness to acknowledge Roma as an issue.7
On 5th April 2011 the European Commission published a communication entitled ‘An EU Framework for National Roma Integration Strategies up to 2020’ which called on all Member States to prepare, or adapt strategic documents to meet four key EU Roma Integration goals: access to education, employment, healthcare and housing3. The communication admitted that progress on Roma integration had not been satisfactory and explicitly requested that states develop comprehensive strategies for Roma inclusion (referred to as National Roma Integration Strategies) which included “targeted actions and sufficient funding (national, EU and other) to deliver” on the goals4. As well as reflecting a ‘comprehensive approach to Roma integration’, it was advocated that strategies be strongly monitored and identify disadvantaged micro-regions or segregated neighbourhoods to target measures connecting with all policy areas. They should also be “designed, implemented and monitored in close cooperation and continuous dialogue with Roma civic society, regional and local authorities”8 (European Commission, Working Together for Roma Inclusion: 8).
4Council conclusions on an EU Framework strategy for Roma integration (2012)
5 Ibid pg.2
6 The factsheets list the population figures as ‘Council of Europe estimates’. They are available to download at: http://ec.europa.eu/justice/newsroom/discrimination/news/120523_en.htm
7Commission staff working document accompanying the communication from the Commission to the European Parliament, the Council, the European Economic and Social Committee and the committee of the Regions. Non-discrimination and equal opportunities: A renewed commitment. Community Instruments and Policies for Roma Inclusion, Commission of the European Communities, COM (2008) 420). Available at: http://ec.europa.eu/social/BlobServlet?docId=546&langId=en
8 Communication from the Commission (2011) pg.4
12
On 19th May 2011, all 27 member states at the Employment, Social Policy, Health and Consumer Affairs Council (EPSCO) agreed to a set of Conclusions that endorsed the EU Framework for coordinating national Roma strategies9. EPSCO endorsed the concept of national Roma strategies while allowing some flexibility for countries to develop their own set of policy measures around the four integration goals.
As detailed by Open Society Foundations (2011):
The Conclusions commit member-states to “improve the implementation and strengthen the effectiveness of EU funds”, and make better use of technical assistance. They are much bolder on inclusion of Roma in decision-making processes than the Framework and have a strong focus on Roma empowerment through participation in policy debate and implementation. EPSCO invited the Commission “to pursue rigorous monitoring of the implementation of Council Directive 2000/43/EC”, arguably the EU’s most powerful instrument for combating discrimination based on ethnic origin. EPSCO also highlighted the need to intensify the fight against trafficking of Roma and to guarantee the legal rights of Roma victims of trafficking.10
It should be noted there is also a focus on ensuring women are not subject to multiple discrimination and emphasises the need to apply a gender perspective to all policies and actions.
The United Kingdom context
Responsibility for preparing the UK Government’s National Roma Integration Strategy was assumed by the Department for Communities and Local Government (DCLG). In an explanatory Memorandum to the Parliamentary European Scrutiny Commission (prepared prior to the meeting of EPSCO in May 2011), Grant Shapps, then Minister of State for Housing in the Department, outlined the UK’s position. This took the view that the EU Framework contained no new proposals for legislation and is intended to “complement and reinforce the EU’s equality legislation by creating a political commitment to address the specific needs of Roma in the four integration goal areas.”11 Furthermore, the Minister is quoted as asserting that:
The Government’s priorities therefore are to ensure that the Conclusions, which will be adopted by 19th May EPSCO encourage those Member States with large, and often seriously disadvantaged Roma populations to take effective action; whilst at the same time not ceding any new powers or competence to the Commission and without accepting additional requirements above what the UK is in any case already doing, such as by ensuring sufficient flexibility around what constitutes national strategy, not imposing unhelpful targets, nor accepting burdensome reporting obligations on those, like the UK, with relatively few Roma citizens.
The Scrutiny Committee conclusions largely concur with the Ministerial position, inferring from the Framework that the apparent size of the Roma population in each member state determines both the extent of the challenge Member States face and the nature of their response:
9Council conclusions on an EU Framework for National Roma Integration Strategies up to 2020, 3089th Employment, Social Policy, Health and Consumer Affairs Council meeting Brussels, 19 May 2011. The Employment, Social Policy, Health and Consumer Affairs Council (EPSCO) is composed of employment, social protection, consumer protection, health and equal opportunities ministers. The Conclusions are available at: http://www.consilium.europa.eu/uedocs/cms_Data/docs/pressdata/en/lsa/122100.pdf
10EU Policies for Roma Inclusion, Open Society Institute Brussels, Open Society Foundations (2011), pg.2 Available at: http://www.opensocietyfoundations.org/sites/default/files/2011-07%2520EU%2520Roma%2520Inclusion%2520Policies%2520final.pdf
11p. 2 of the Minister’s Explanatory Memorandum, quoted in ‘Documents considered by the Committee on 11 May 2011 - European Scrutiny Committee – no.7’ Available at http://www.publications.parliament.uk/pa/cm201012/cmselect/cmeuleg/428-xxvi/42809.htm A critique of the handling of the response to the European Commission by the UK government has been provided by Willers, M and Greenhall, O (undated) The UK Government’s Response to the EU Framework on National Roma Integration Strategies. Available at http://www.gypsy-traveller.org/wp-content/uploads/2012/01/TAT-News-Roma-Strategies-18.3.2012.pdf
1 Introduction
Migrant Roma in the United Kingdom: population size and experiences of local authorities and partners
13
It [EU Framework] also recognises that, whilst Roma constitute Europe’s largest minority, the size of the Roma community as a percentage of the total population in each Member State varies significantly, and that the scale of the challenges which Member States face, as well as their starting points for tackling Roma exclusion, are likely to differ in magnitude.12
Prior to this in November 2010, a cross departmental Ministerial Working Group had been established with the task of reviewing the evidence on inequalities experienced by Gypsies and Travellers and proposing actions to address them. Chaired by the Secretary of State at DCLG, Eric Pickles, the group produced a progress report with 28 recommendations in April 2012, after the submission of UK’s response to the Framework.13
However, the content mainly focuses on issues impacting on the indigenous UK Roma population, more generally referred to as Gypsies and Travellers and the attention placed upon Central and Eastern Europe (CEE) Roma, was relatively small. 14
The document outlined the separate approaches adopted by the UK government and devolved administrations of Scotland, Wales and Northern Ireland. However, the content mainly focuses on issues impacting on the indigenous UK Roma population, more generally referred to as Gypsies and Travellers and the attention placed upon Central and Eastern Europe (CEE), is relatively small. Significantly, the relevant section for Roma in England begins by stating “there is a lack of comprehensive data on (CEE) Roma in England” and the data from Scotland, Wales and Northern Ireland is relatively strong by comparison.15
The subsequent Progress Report (annex 2) also framed the development of the UK response to the inclusion of Roma as being led by issues faced by indigenous Gypsy and Traveller populations (e.g. shortages of sites, planning matters, etc.).With the exception of issues around education there is no other mention relating to migrant Roma who have settled in the UK. 16
Aim and objectives
The overall objective of this study was to provide an evidence-base which would help inform a more comprehensive and accurate development of measures to support the inclusion of migrant Roma in the UK. There were two specific objectives:
1. To obtain hard data about the number of migrant Roma at a national, regional and local authority level.
2. To identify particular service areas where local authorities, partners and Roma may need additional support to enable positive outcomes;
This study was undertaken in parallel to the development and organisation of a National Roma Network co-ordinated by Migration Yorkshire. This network brings together a number of organisations mainly, but not exclusively, local authorities who meet to share practice and develop co-ordinated initiatives.
It should be noted that it is not the aim of this study to review the UK response to the call for a national Roma integration strategy as that role is taken by the European Commission, Peer Reviewers and other key agencies such as the Fundamental Rights Agency (FRA).
12Documents considered by the Committee on 11 May 2011 - European Scrutiny Committee – no.7
13Progress report by the ministerial working group on tackling inequalities experienced by Gypsies and Travellers, Department for Communities and Local Government (2012) Available: https://www.gov.uk/government/publications/reducing-inequalities-for-gypsies-and-travellers-progress-report As noted in the COMMUNICATION FROM THE COMMISSION TO THE EUROPEAN PARLIAMENT, THE COUNCIL, THE EUROPEAN ECONOMIC AND SOCIAL COMMITTEE AND THE COMMITTEE OF THE REGIONS, National Roma Integration Strategies: a first step in the implementation of the EU Framework, (Brussels, 21.5.2012), pg.4 “By March 2012, all Member States had presented a National Roma Integration Strategy or a corresponding set of policy measures within their broader social inclusion policies”.
14Council conclusions on an EU Framework strategy for Roma integration up to 2020: Great Britain and Northern Ireland (2012), pg. 3
15 Ibid pg.6
16Progress report by the ministerial working group on tackling inequalities experienced by Gypsies and Travellers, DCLG, (2012)
14
Research approach
The approach to this study involved bringing together existing data as well as undertaking new empirical research. There were three key phases in the methodology which are expanded upon in Appendix 1.
1. Scoping study and secondary analysis
This phase involved the collation and review of available published secondary data and literature relating to the Roma population across the UK. This phase also involved exploring existing numerical assessments as to the size of the population and methodologies underpinning these.
2. Survey of local authorities
We carried out a survey of all local authorities across the UK to establish their locally informed estimations as to the size of the migrant Roma population. Local authorities were also asked to comment on their level of engagement with Roma populations across their area and to comment on wider relevant issues. Across the UK a total of 151 questionnaires were returned out of 406 issued (a response rate of 37 per cent). Questionnaires received by nation were as follows:
• England (326 sent/119 returned) 37 per cent response rate
• Scotland (32 sent/8 returned) 25 per cent response rate
• Wales (22 sent/11 returned) 50 per cent response rate
• Northern Ireland (26 sent/13returned) 50 per cent response rate
Details of the survey methodology are presented in Appendix 1. The covering letter and questionnaire used in the survey are in Appendices 2 and 3 respectively.
3. Interviews with key informants
Following the completion of Phase 2 of the survey, we carried out telephone interviews with key informants based within specific case study areas. These areas were selected to represent a range of local authorities across three categories:
1. Areas which reported relatively high numbers of Roma present in their areas
2. Areas which reported relatively low numbers of Roma present in their areas
3. Areas where the responding local authority had reported that they were not aware if Roma was present in their area.
We selected 15 case study areas for this phase of the study and we secured engagement from 12 of these. In order to obtain a flavour of the issues within each locality, we sought to contact three key informants who could provide informed perspectives on:
• Local authority strategy
• Grassroots issues within local authorities
• Non-governmental organizations (NGOs)
A total of 29 key informants took part in this phase of the research. More detail on the methodology is presented in Appendix 1. The question guide used with these individuals is available in Appendix 4.
Responses are reported on a non-attributable basis to ensure anonymity. Survey data is analysed, where appropriate, according to nation, region and type of local authority (metropolitan districts, London Boroughs, unitary and district councils) in England. In a number of instances, separate analyses are presented for the different nations.
1 Introduction
Migrant Roma in the United Kingdom: population size and experiences of local authorities and partners
15
Structure of the report
This report is intended to provide an overview of the estimated population of migrant Roma living across the UK and help identify how local areas are responding. The report has the following structure:
• Chapter 2: sets the policy context for the study and explores the practical issues associated with enumerating Roma populations.
• Chapter 3: analyses the responses in the survey and comments from the interview stage around how aware local authorities and key agencies are about Roma populations in their areas.
• Chapter 4: provides an overview as to the method used to enumerate the population and presents an estimation as to the size of the migrant Roma population in 2012.
• Chapter 5: looks at issues around how local authorities and key agencies have been engaging with Roma populations.
• Chapter 6: details some of the perceived barriers and challenges faced by local authorities and key partners and how they are being approached.
• Chapter 7: provides some concluding comments.
It is worth noting at this juncture that the use of the term Roma throughout this report may be disputed and appears homogenising but we have taken a pragmatic view in order to describe a range of peoples with a shared heritage, culture and norms.
In the context of this report, while fully cognisant of the inclusive definition of Roma adopted by many European institutions we have used the terms ‘Roma’ and ‘migrant Roma’ to describe people of Roma origin who have overwhelmingly migrated from Central and Eastern Europe to the UK since the 1990s, and not indigenous Gypsies and Travellers. Whereas ‘migrant Roma’ is used in the title, chapter and page headings to reinforce this, for ease of reading ‘Roma’ is utilised in the main text, except where the former appellation is specifically relevant. Further reference is made in Chapter Four.

Two Context
2 Context
Migrant Roma in the United Kingdom: population size and experiences of local authorities and partners
17
Context
Roma migration to the UK has been a small but continuing feature since 1945 (Horton and Grayson, 2008). However, since 1989, the number of Roma migrating from Central and Eastern Europe (CEE) has steadily increased (Poole, 2010). During the 1990s and early 2000s, a number of Roma came to the UK seeking asylum. This was an era when the issue of asylum had been placed high on the political, public and media agenda, and a threat had been identified in the shape of the ‘undeserving’ or ‘bogus’ asylum seekers. There was a common view that an increase in asylum applications – including applications from Roma – was due to perceptions of a generous benefit system in the UK (Tanner, 2005). Consequently, there was a succession of legislation aimed at restricting entry to the UK (but also reducing the rights of those who had managed to enter). This included the introduction of the ‘White List’ as part of the 1996 Asylum and Immigration Act. This was a list of seven countries, which were considered ‘safe’; therefore, any applicants from these countries could be automatically excluded, and their claims deemed unfounded. This list included most of the countries from which Roma were arriving and consequently very few were allowed to stay in the UK (Horton and Grayson, 2008).
In May 2004, ten new countries joined the European Union (EU): Cyprus, Czech Republic, Estonia, Hungary, Latvia, Lithuania, Malta, Poland, Slovakia and Slovenia. From that date, Cyprus and Malta had full free movement and right to work throughout the EU, while the remaining eight countries (the Central and Eastern European countries often referred to as the A8) were subject to certain restrictions. In the UK, for example, the government regulated access to the labour market through the Worker Registration Scheme (WRS), and restricted access to the welfare system.
In January 2007, the EU was also joined by Bulgaria and Romania (referred to as the A2). Nationals of these two countries were allowed gradual access to the UK labour market. Those with recognised trades, experience and qualifications were allowed access as ‘highly skilled workers’, while for the lower skilled, quotas were set and restricted to specific schemes, such as the Seasonal Agricultural Workers Scheme (SAWS) or the Sector Based Scheme (SBS), which covers the Food Manufacturing Industry. In 2013, when Croatia joined, their citizens became subject to the same EU rules as the A2, which allowed national governments to place their own restrictions on migrants arriving from there, although they could not restrict freedom of movement17.
While there were certain restrictions in place, entry into the EU led to freedom of movement within EU borders to citizens of Central and Eastern European (CEE) states, including Roma (Poole, 2010). Consequently, those who were once ‘forced’ migrants (i.e. seeking entry through the asylum process) were now deemed ‘voluntary’ migrants. Some commentators suggest, however, that Roma fall into a ‘grey area’ between ‘forced’ and voluntary’ migration:
‘…given the ongoing infringements of Roma rights in CEE, it is not unreasonable to view the Roma as a group that continue to be ‘pushed’ abroad as much as being ‘pulled’’ (Poole, 2010: 251).
A survey carried out by European Dialogue (2009) in a variety of English communities highlighted that Roma were moving (and settling) in the respective locations because they experienced relatively low levels of discrimination when compared to their countries of origin. This survey (involving 104 Roma participants across ten different locations) found that work was a key motivation for migration, with 58.7 per cent indicating they had moved to England for this reason. Following employment, the main reasons were ‘a better life for children’ (22.1 per cent) and ‘discrimination in country of origin’ (15.4 per cent). The majority of those surveyed (97.1 per cent) said that their life had improved since coming to England; however, the report raises the question as to whether or not Roma in general possess low expectations due to their experiences in their country of origin (see European Dialogue, 2009: 7-8).
17Further information is available at http://ec.europa.eu/social/main.jsp?catId=466&langId=en National governments are entitled to retain such restrictions for up to 7 years, which may affect Croatian citizens until 2020.
18
It was suggested that such settlement patterns often reflected where members of the community had previously been asylum seekers during the late 90s and early 00s, or where they had existing contacts, and in many cases Roma from a specific town or region in their country of origin settled in together in the same neighbourhoods, towns and cities in the UK (Horton and Grayson, 2008).
Some commentators argue that there has been a failure of local authorities to recognise the existence of many thousands of Roma in specific localities, with suggestions that there are as many undetected Roma as there are those that are ‘counted’ (European Dialogue, 2009). However, it is argued that exact numbers are unknown as people do not always declare their ethnic identity (Anstead, 2010) or do not have contact with local services (European Dialogue, 2009). Limited contact with services was more likely amongst A2 Roma, while Roma from countries such as the Czech Republic and Poland were reported as potentially better able at navigating through UK services (ibid).
A study carried out in Sheffield, for example, estimated the Slovak Roma population at 1,320, although this was perceived to be an underestimate, as the movement of some families between Slovakia and the city, and to other areas of South Yorkshire, made it difficult to gauge the population accurately.
Despite the absence of data on the overall size of the Roma community, however, there is recognition that key agencies in the UK, in contrast to those within some other EU Member States, recognise the importance of data collection in improving the targeting and delivery of public policy (Bartlett et al., 2011).
The challenge of enumerating the Roma population in the UK
It is widely accepted that statistics on population and migration meet a diverse range of requirements including policy making, local service provision and resource allocation, commerce and research (Office for National Statistics, 2012). The use and interpretation of such data is often politically contested and changes according to the context. The broad programme of production and compilation of data on ethnic minority populations is a complex and multi-factorial project, crossing thematic and categorical boundaries, involving a number of unresolved conceptual tensions. However, the main difficulty in estimating the UK resident population of migrant Roma is the deficiency of adequate statistics of any kind whether quantitative or qualitative data. As Craig (2011, p.ii) has remarked “There is an almost total lack of robust national and local level quantitative data regarding this group.”
The data relating to the indigenous UK Gypsy/Traveller population is arguably little better but via a combination of bi-annual caravan count data, school roll information and their recent incorporation into the decennial Census data sources do exist from which population projections and estimations can be made. However, while the 2011 UK Census included Gypsy / Traveller as a top level ethnic category for the first time, it did not incorporate Roma as a specific choice. Even so, there are questions about the ability of the UK Census to accurately enumerate the indigenous Gypsy and Traveller population as the official population count of 57,680 is widely seen as an under-estimation (see also Craig, 2011).
Difficulties distinguishing Central and Eastern European Roma from other Travellers exists within other large scale datasets with national coverage. One example is the wide range of recording systems which collectively utilise the Department for Education’s Common Basic Dataset (CBDS); the annual School Census, Early Years Census, Alternative Provision Census, Pupil Referral Unit Census and Children in Need Census. The Department’s website states the CBDS “provides a standard for data used in software systems for management information in schools, LAs, other children’s institutions, the Department and other government bodies.” All of these agencies are advised to enter data collected from their respective sources using a central master list of codes produced by the Department. Within the list of numbered codes is D00007 which is officially defined as “code to identify type of Traveller/Gypsy (italics inserted). Within this lie several subsidiary options, which include ‘Gypsy/Roma (Housed)’, ‘Gypsy/Roma (Travelling)’ and ‘Traveller Other’. It is perhaps significant that the later Codeset Register of all codes refers to D00007 as ‘Traveller Gypsy Code’ without any distinct reference to Roma, indicating a measure of categorical inconsistency and elision18. Reports produced by the Department do include information on ‘Roma with EAL’ suggesting that a measure of distinction can be obtained. Nevertheless, the report states:
2 Context
Migrant Roma in the United Kingdom: population size and experiences of local authorities and partners
19
There are also issues regarding the monitoring of Gypsy, Roma and Traveller attainment, given families’ and pupils’ reluctance (due to fears of discrimination) to ascribe to these ethnic categories on the school census”(Wilkin et al. 2010, pg.1).
The report also includes ‘Roma’ within two separate definitions; first ‘Gypsy, Roma and Traveller’ is inclusive of “Roma from Eastern and Central Europe”, while a subsequent footnote contains a designation of ‘Gypsy/Roma pupils’ that does not. (ibid. pgs. i and iii). Such systemic shortcomings must be added to the fact that the datasets are overwhelmingly restricted to children and young people, and therefore do not monitor across the whole community.
Low levels of ascription by Roma children and young people (and their families as completers) has been highlighted by researchers and organisations for a number of years (e.g. Scullion and Brown, 2013, NATT+):
It was evident that there was a large amount of missing data for our cohorts of interest…... One issue that was raised during the course of the project has been the accuracy of the ethnicity information contained within the NPD” (National Pupil Database) (Wilkin et al. 2010, pg.2).
As a relatively recently established migrant community, the lack of inclusion in many major surveys/datasets is partly understandable in terms of the extended periods of consultation and testing required when changes to data collection and analysis are proposed. Although many Roma are not UK citizens by birth and have previously resided outside the UK, (and remain citizens of other nations), long-term international migration datasets do not include ‘Roma’ as a specific category. Those holding EU citizenship are automatically entitled to enter and reside here and, unlike other ‘hard to measure’ groups such as overstaying foreign visa holders or failed asylum seekers, there is no restriction on multiple entry and exit. In addition, because of regular movement of Roma between particular areas there are risks of double counting even in ‘internal’ datasets. Such complications to assessing populations, both local and national caused by such ‘dynamism’ and ‘fluctuation’ are not unique to UK Roma, but do pose extra problems in calculating robust estimates19.
Despite legitimate residency, those datasets specifically targeting EU migrants into the UK do not differentiate Roma from other citizens of the relevant countries. For example, the Worker Registration Scheme, introduced in 2004 to monitor citizens of those A8 states arriving to work in the UK, but did not include ‘Roma’ as a separate or subsidiary category, monitoring the particular nation of origin only, and not trans-national ethnicities such as Roma.
Similarly, every year all local authorities undertake a mandatory refresh of their respective electoral roll, requiring all households to confirm a range of personal information which includes details of members’ nationality, but not their ethnicity. Even had they done so, it is likely self identification by Roma would have been very limited.
As a consequence, it is very difficult, if not impossible, to use the majority of sources to identify Roma or the proportions of A8/A2 migrants which are of Roma heritage. Effectively, therefore a significant percentage of Roma individuals may be counted, but remain hidden within other categories of major records (e.g. Czech, Slovak, White Other). Aside from such considerations of the limitations of current monitoring systems, it is quite valid for nationality to be an individual’s choice of primary identity – that is a Slovak Roma may consider themselves Slovak first and then Roma, and presented with one option only, choose the former. However, there remain inherent problems with these sources. The definitions of migrants, geographical coverage and even collecting categories are not identical.
18For general issues see: “Long-Term International Migration - methodology document: 1991 onwards”, (ONS 2011); “A conceptual framework for UK population and migration statistics, (ONS 2012); Local Area Migration Indicators Suite, information paper (ONS 2012)
19 The CBDS is available online at: http://www.education.gov.uk/schools/adminandfinance/schooladmin/ims/datamanagement/cbds/a0058744/cbds
20
Attempts across the EU to enumerate the population of Roma
Given such difficulties with primary and secondary sources, making a national estimate of Roma in the UK is extremely challenging. A number of recent EU level studies have attempted to estimate national Roma populations in constituent countries. The majority have used direct sampling of populations (see EU-MIDIS Technical report: Methodology, sampling and fieldwork, European Union Agency for Fundamental Rights, 2009). In both the EU-MIDIS and the Roma Pilot survey the same sampling methodology was used - random route and focused enumeration. Within this, once the researchers had identified areas where Roma:
...were living in higher than national average density, PSU’s were randomly selected reflecting the geographical and urban/rural distribution of the Roma population in the country20.
However, in order to identify such areas, country specific solutions were adopted. In practice this meant for those countries where ethnicity was collected in the national population census this information was used to identify areas with higher than average national concentration of Roma populations. In other countries, where the Census did not allow for the identification of citizens of Roma ethnicity, proxies such as first language were used. In a number of cases, more recent information was available through other surveys, registers or expert opinions. In France, for example, a nationwide list of halting sites was used as a baseline. In Portugal, Spain and Italy, experts and/or NGOs identified areas where Roma lived in high concentration. Consequently, the construction of sampling frames depended on the information available on the national level, taking into consideration only areas where Roma live in such concentration that the sampling method (random walk or focused enumeration) would work reasonably well. Whenever possible, the density of Roma in the area compared to the national average was the preferred criterion21.
In 2013, the Fundamental Rights Agency (FRA) published the results of its mapping of secondary official and unofficial data sources across all EU nations, to complement the data from the pilot. Importantly, a key reason for this exercise was to help analyse the situation of Roma in those nations which did not have large enough Roma populations to enable random sampling in the pilot. The authors noted:
Existing official and non-official data complement and contextualise the statistical results of surveys. In 2012, the Agency asked its FRANET network of national focal points to collect all existing data throughout the Member States related to the socio-economic and human rights situation of Roma. Data availability and up-to-date information on the current situation of the Roma is a key starting point for identifying goals and targets with which progress can be measured in the future. In 2013, FRA will map existing data sources at national, regional and selected local levels. (Quoted on the multi-annual Roma programme section of the website of the European Union Agency for Fundamental Rights section entitled “Collecting secondary data and mapping official data sources.”)
The majority of the National Roma Integration Strategies (NRIS) submitted by member states contained estimates of the number of Roma for the respective country. Some states, especially those with enduring Roma populations such as the Czech Republic and Romania, have lengthy experience in data collection. However, even in a nation such as the Czech Republic, where a history of monitoring exists and the national Census includes the specific category of Roma, the strategy indicated that overall estimates of the number of Roma in the country tend to be the product of “expert estimates”, rather than comprehensive statistical returns.22
Previous attempts at estimating the population of Roma in the UK
In 2009, European Dialogue published “The movement of Roma from new EU Member States: a mapping
20Personal correspondence with statistician at the Fundamental Rights Agency, June 2013.
21For more information see the Technical Report for EU-Midis. Available at http://fra.europa.eu/sites/default/files/eu-midis_technical_report.pdf.
2 Context
Migrant Roma in the United Kingdom: population size and experiences of local authorities and partners
21
survey of A2 and A8 Roma in England”. As well as a review of existing literature, the main approach within this study involved sending a survey to the director of Children’s Services in every local authority, with a request to forward it to the best placed officer. In parallel with this, face-to-face interviews and focus groups took place with both Roma and statutory and non-statutory practitioners working with Roma in areas “with significant Roma populations”.23
Out of a total of 151 local authorities, 103 provided a return (a 68 percent response rate). Almost half of responding authorities stated there was no or almost no Roma in their area. Statistical data from the 53 local authorities who indicated they did record Roma suggested a population in England of 24,104, mainly derived from School Census figures (which exclude adults). Fieldwork by the study team indicated much higher numbers in many locations, leading the report to conclude that the mismatch between local authority data and that emerging from other sources “raised serious concerns about accuracy of the data provided” by the former. The authors proposed an overall minimum population of 49,204 in England. This suggested that communities were concentrated in the north of England, the East Midlands with other substantial groupings in Kent, Southend-On-Sea, London, and Slough. This was tempered by significant caveats about the underlying information:
“Inaccurate data kept by local authorities, compounded by low levels of ethnicity self-ascription are some of the main reasons for the insufficiency of information currently available about the real size of the A2 and A8 Roma populations across the country.” (European Dialogue (2009) pg.37)
Craig (2011), in producing his Peer Review of the UK’s submission to the national Roma integration strategy process reported that, “National estimates of the size of the UK Roma vary widely from about 100,000 to one million.” Craig added an extended review of the data in an appendix, which explores the various problems in making a reliable assessment of the Roma population, including the serious limitations of current collection systems and the confusion generated by differences in nomenclature. He noted the disparity of estimates, but attempted a calculation based on migration trends and an average of the existing estimates.
“Taking the mean of a number of estimates of Roma in the EU as 11 million, and the mean number who have arrived in the UK since 1993 as 300,000, the proportion of those moving to the UK is around 2.6%, a significantly higher proportion. If there are 300,000 Roma in the UK, they would constitute about 0.5% of the total UK population, having grown to that point much more rapidly than other minorities (for example, taking an ethnic minority of comparable size, the 400,000 or so Bangladeshis in the UK, this size has been reached largely over a period of 50 years).” (pg.29)
22Roma Integration Concept for 2010–2013, Minister for Human Rights, Czech Republic (2009) – pgs.9-10, especially footnotes.
23The movement of Roma from new EU Member States: a mapping survey of A2 and A8 Roma in England – Patterns of settlement and current situation ”, European Dialogue

22
Three Awareness of Roma living in local authority areas
24
Awareness of Roma living in local authority areas
This chapter draws on the findings of our survey of local authorities in order to understand the levels of awareness that exist across the UK with regard to the presence, magnitude and dimensions of Roma populations in their local areas. These findings provide a foundation from which a numerical assessment of the population can be made. This chapter also provides some additional contextual information from the consultations undertaken with key informants with respect to how such awareness of populations had developed.
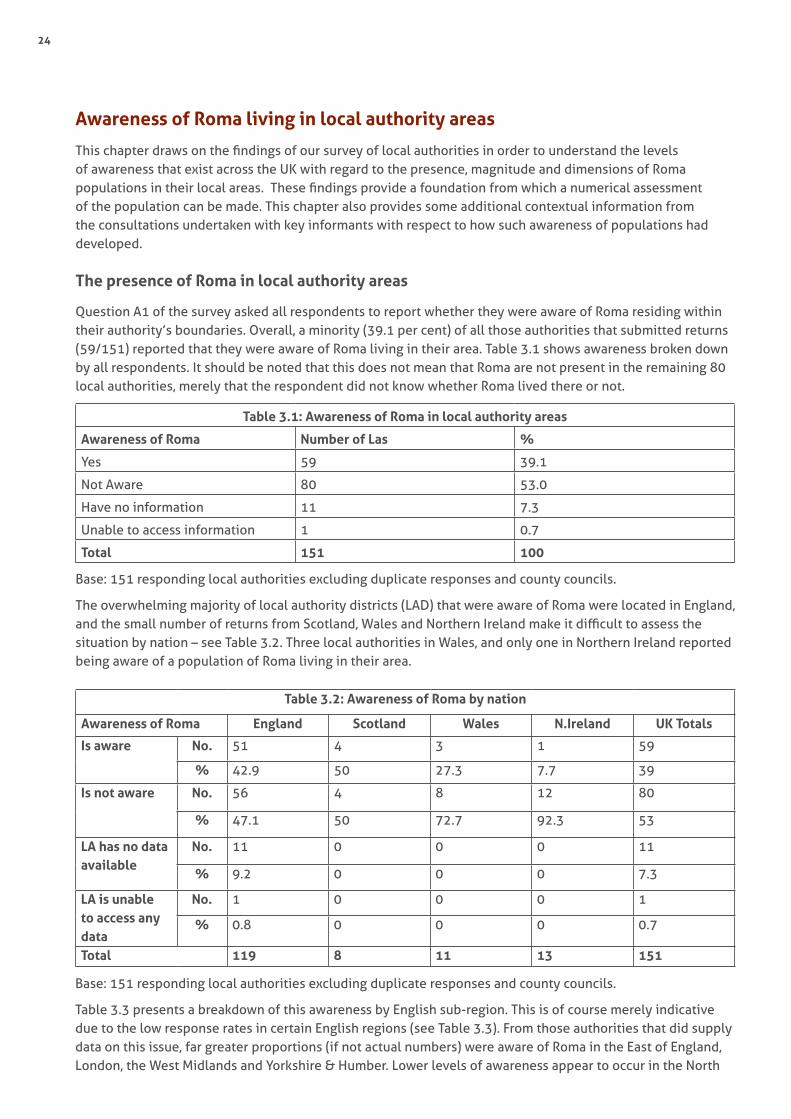
The presence of Roma in local authority areas
Question A1 of the survey asked all respondents to report whether they were aware of Roma residing within their authority’s boundaries. Overall, a minority (39.1 per cent) of all those authorities that submitted returns (59/151) reported that they were aware of Roma living in their area. Table 3.1 shows awareness broken down by all respondents. It should be noted that this does not mean that Roma are not present in the remaining 80 local authorities, merely that the respondent did not know whether Roma lived there or not.
Table 3.1: Awareness of Roma in local authority areas
Awareness of Roma Number of Las %
Yes 59 39.1
Not Aware 80 53.0
Have no information 11 7.3
Unable to access information 1 0.7
Total 151 100
Base: 151 responding local authorities excluding duplicate responses and county councils.
The overwhelming majority of local authority districts (LAD) that were aware of Roma were located in England, and the small number of returns from Scotland, Wales and Northern Ireland make it difficult to assess the situation by nation – see Table 3.2. Three local authorities in Wales, and only one in Northern Ireland reported being aware of a population of Roma living in their area.
Table 3.2: Awareness of Roma by nation
Awareness of Roma England Scotland Wales N.Ireland UK Totals
Is aware No. 51 4 3 1 59
% 42.9 50 27.3 7.7 39
Is not aware No. 56 4 8 12 80
% 47.1 50 72.7 92.3 53
LA has no data available
No. 11 0 0 0 11
% 9.2 0 0 0 7.3
LA is unable to access any data
No. 1 0 0 0 1
% 0.8 0 0 0 0.7
Total 119 8 11 13 151
Base: 151 responding local authorities excluding duplicate responses and county councils.
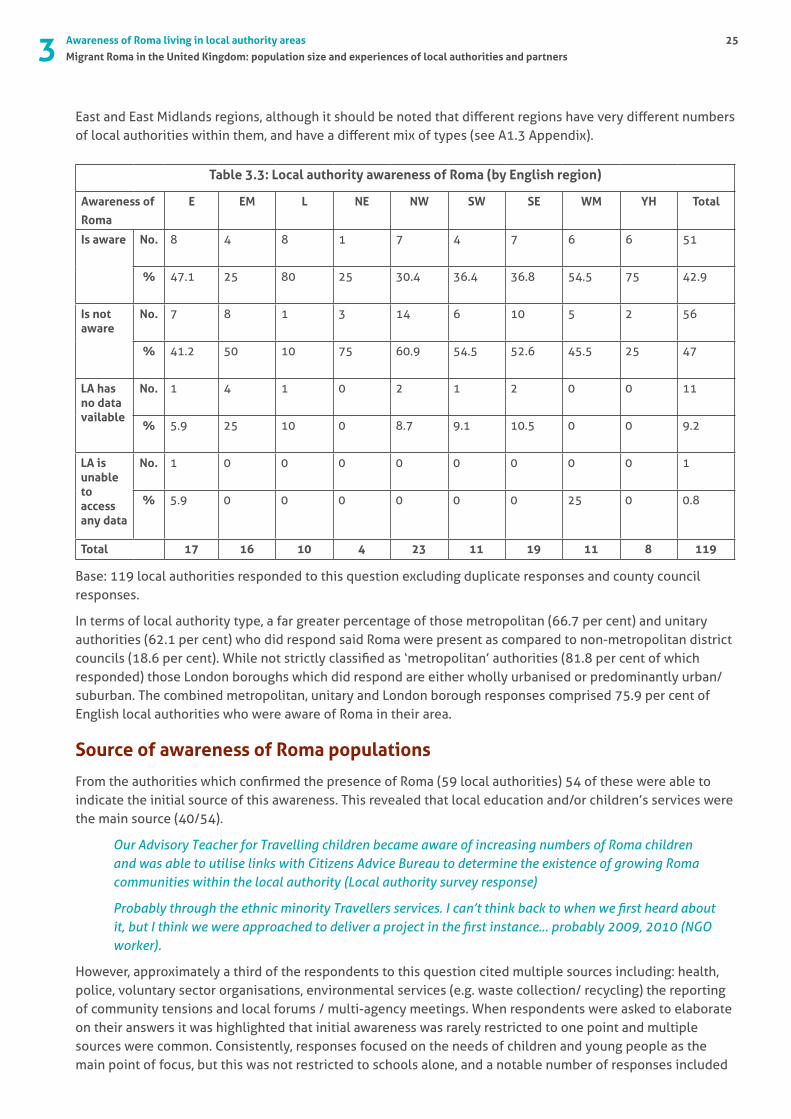
Table 3.3 presents a breakdown of this awareness by English sub-region. This is of course merely indicative due to the low response rates in certain English regions (see Table 3.3). From those authorities that did supply data on this issue, far greater proportions (if not actual numbers) were aware of Roma in the East of England, London, the West Midlands and Yorkshire & Humber. Lower levels of awareness appear to occur in the North
3 Awareness of Roma living in local authority areas
Migrant Roma in the United Kingdom: population size and experiences of local authorities and partners
East and East Midlands regions, although it should be noted that different regions have very different numbers of local authorities within them, and have a different mix of types (see A1.3 Appendix).
Table 3.3: Local authority awareness of Roma (by English region)
Awareness of
Roma
E EM L NE NW SW SE WM YH Total
Is aware No. 8 4 8 1 7 4 7 6 6 51
% 47.1 25 80 25 30.4 36.4 36.8 54.5 75 42.9
Is not aware
No. 7 8 1 3 14 6 10 5 2 56
% 41.2 50 10 75 60.9 54.5 52.6 45.5 25 47
LA has no data vailable
No. 1 4 1 0 2 1 2 0 0 11
% 5.9 25 10 0 8.7 9.1 10.5 0 0 9.2
LA is unable to access any data
No. 1 0 0 0 0 0 0 0 0 1
% 5.9 0 0 0 0 0 0 25 0 0.8
Total 17 16 10 4 23 11 19 11 8 119
Base: 119 local authorities responded to this question excluding duplicate responses and county council responses.
In terms of local authority type, a far greater percentage of those metropolitan (66.7 per cent) and unitary authorities (62.1 per cent) who did respond said Roma were present as compared to non-metropolitan district councils (18.6 per cent). While not strictly classified as ‘metropolitan’ authorities (81.8 per cent of which responded) those London boroughs which did respond are either wholly urbanised or predominantly urban/suburban. The combined metropolitan, unitary and London borough responses comprised 75.9 per cent of English local authorities who were aware of Roma in their area.
Source of awareness of Roma populations
From the authorities which confirmed the presence of Roma (59 local authorities) 54 of these were able to indicate the initial source of this awareness. This revealed that local education and/or children’s services were the main source (40/54).
Our Advisory Teacher for Travelling children became aware of increasing numbers of Roma children and was able to utilise links with Citizens Advice Bureau to determine the existence of growing Roma communities within the local authority (Local authority survey response)
Probably through the ethnic minority Travellers services. I can’t think back to when we first heard about it, but I think we were approached to deliver a project in the first instance… probably 2009, 2010 (NGO worker).
However, approximately a third of the respondents to this question cited multiple sources including: health, police, voluntary sector organisations, environmental services (e.g. waste collection/ recycling) the reporting of community tensions and local forums / multi-agency meetings. When respondents were asked to elaborate on their answers it was highlighted that initial awareness was rarely restricted to one point and multiple sources were common. Consistently, responses focused on the needs of children and young people as the main point of focus, but this was not restricted to schools alone, and a notable number of responses included
25
26
services working with very young children or expectant mothers, such as Sure Start, midwives, health visitors and education welfare teams. The common thread in explanations was the presence of families in a particular area and the impact of the often complex needs that they presented. For example:
In 2006-07, the initial reporting of arriving Roma families was from the local health visiting team, school admin staff (receiving school applications) and private sector housing staff. Shortly afterwards, environmental and waste management services began reporting problems and the local safer neighbourhood teams reported relatively minor concerns of anti-social behaviour and use of public space etc. (Local authority survey response).
Basically, what seems to happen is that I started to get a lot of enquiries, because there were issues and needs that needed to be addressed. We had issues of overcrowding in houses. We had issues of children not in school. Education welfare needed to be proactive in that as well…the police were reporting crime and petty theft and that sort of thing...We also had a period of reporting anti -social behaviour. Not a lot of that was substantiated. But of course when those agencies have to investigate they always come to somebody who may or may not know the community or have something to do with them. I had a lot of schools contacting me because they had young people who hadn’t been to school before or had had very short periods of time in school or had been very highly mobile. (Local authority front line officer)
The above quote, from an authority which reported a relatively large number of Roma living in their area, exemplified the picture painted by many respondents that where they had become engaged with such households, the issues were complex and many agencies were getting involved simultaneously on a variety of issues. Like several of the additional consultations with key informants, this response supported the educational route as a key source of initial awareness but also highlighted that it was the presence of large numbers of people often over-occupying single dwellings which meant a movement from mere awareness to closer engagement with those individuals concerned.
Another authority reported:
We had one case back in September - it was when we were alerted to a number of people, Eastern European. At that time the information came in that it would possibly be a multi occupation. At that time we just thought adults were in there. It came into the authority. The neighbours complained about the amount of rubbish that was being produced from the property and that was what the complaint was that alerted her to the numbers of people. (Local authority strategic officer)
Clearly there is often a significant overlap between the sectors discussed above, and at least six of the available options wholly or partly involved local authority services. In addition, among those who cited ‘other’ sources, the majority referred to local authority teams (e.g. private sector housing teams, libraries, etc.).
As the following informant recognised, the vast majority of responses and comments highlighted that people often became aware of Roma living in areas as a result of issues which serve to problematise the population:
I think, primarily, what raises the profile and the issue and the sort of prompting an investigation behind it, regrettably tends to be negative issues. That might be that there are reports of truancy from school or demand of school places or reports of crime and victim of crime. A sort of harassment and anti-social behaviour as well as being associated with that perpetrator or perpetrators. Housing demands, but not through a local authority housing department, because mostly it’s through the private rented sector, but where it comes to the attention of the local authority might be in environmental health terms. Houses in multiple occupation and complaints from residents around sort of the kind of environmental issues. (Local authority strategic officer)
3 Awareness of Roma living in local authority areas
Migrant Roma in the United Kingdom: population size and experiences of local authorities and partners
27
In a minority of cases, members of Roma populations were often stumbled upon by agencies as a result of other activities being undertaken within an area. For example, in one location, in which a block of flats was due to be demolished, agencies became aware of a significant number of women living there who had apparently been trafficked to the UK. The example below illustrates how populations can be hidden, on occasion in connection with potential exploitation and safeguarding issues:
We had a block of flats that were due to be demolished. And it was because of this it was found there was tenants in there and there was a load of homeless in there, pregnant young women, no men. Children who didn’t belong to them. Older women. We got interpreters. We tried to ascertain where they got their money from. They said they all went cleaning, but couldn’t tell us where they went cleaning. Then people would see them with men driving off in cars. Then we’d find a load of men and then they wouldn’t be there next and there was people arriving overnight and go in a room and there would be like from two people to ten… The men were from England. (Local authority front line officer).
Four Characteristics of the UK migrant Roma population
4 Appendix 4: Question guide for key informant interviews
Migrant Roma in the United Kingdom: population size and experiences of local authorities and partners
29
Characteristics of the UK migrant Roma population
This chapter presents an overview of the data provided by those local authorities which felt able to estimate the size of their Roma population. It also discusses the process by which this data was collated, analysed and then used to form the basis of a total UK population estimate of migrant Roma in 2012.
An estimate of the UK Roma population
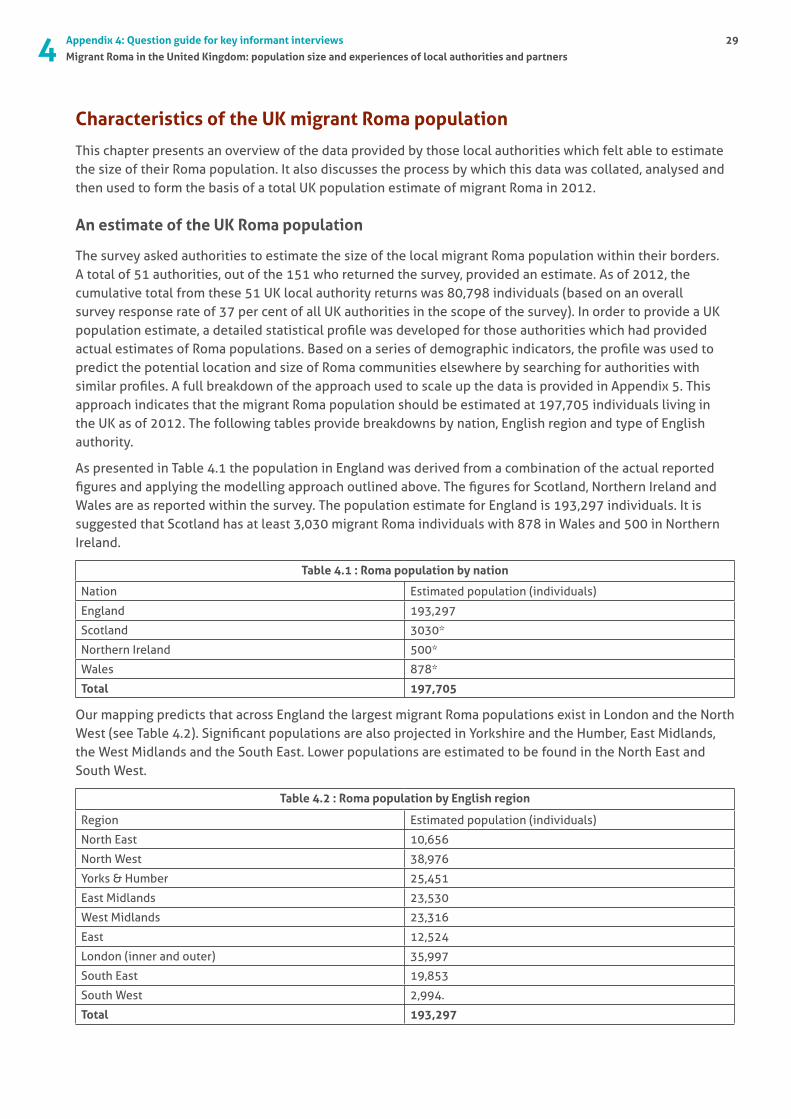
The survey asked authorities to estimate the size of the local migrant Roma population within their borders. A total of 51 authorities, out of the 151 who returned the survey, provided an estimate. As of 2012, the cumulative total from these 51 UK local authority returns was 80,798 individuals (based on an overall survey response rate of 37 per cent of all UK authorities in the scope of the survey). In order to provide a UK population estimate, a detailed statistical profile was developed for those authorities which had provided actual estimates of Roma populations. Based on a series of demographic indicators, the profile was used to predict the potential location and size of Roma communities elsewhere by searching for authorities with similar profiles. A full breakdown of the approach used to scale up the data is provided in Appendix 5. This approach indicates that the migrant Roma population should be estimated at 197,705 individuals living in the UK as of 2012. The following tables provide breakdowns by nation, English region and type of English authority.
As presented in Table 4.1 the population in England was derived from a combination of the actual reported figures and applying the modelling approach outlined above. The figures for Scotland, Northern Ireland and Wales are as reported within the survey. The population estimate for England is 193,297 individuals. It is suggested that Scotland has at least 3,030 migrant Roma individuals with 878 in Wales and 500 in Northern Ireland.
Table 4.1 : Roma population by nation
Nation Estimated population (individuals)
England 193,297
Scotland 3030*
Northern Ireland 500*
Wales 878*
Total 197,705
Our mapping predicts that across England the largest migrant Roma populations exist in London and the North West (see Table 4.2). Significant populations are also projected in Yorkshire and the Humber, East Midlands, the West Midlands and the South East. Lower populations are estimated to be found in the North East and South West.
Table 4.2 : Roma population by English region
Region Estimated population (individuals)
North East 10,656
North West 38,976
Yorks & Humber 25,451
East Midlands 23,530
West Midlands 23,316
East 12,524
London (inner and outer) 35,997
South East 19,853
South West 2,994.
Total 193,297
30
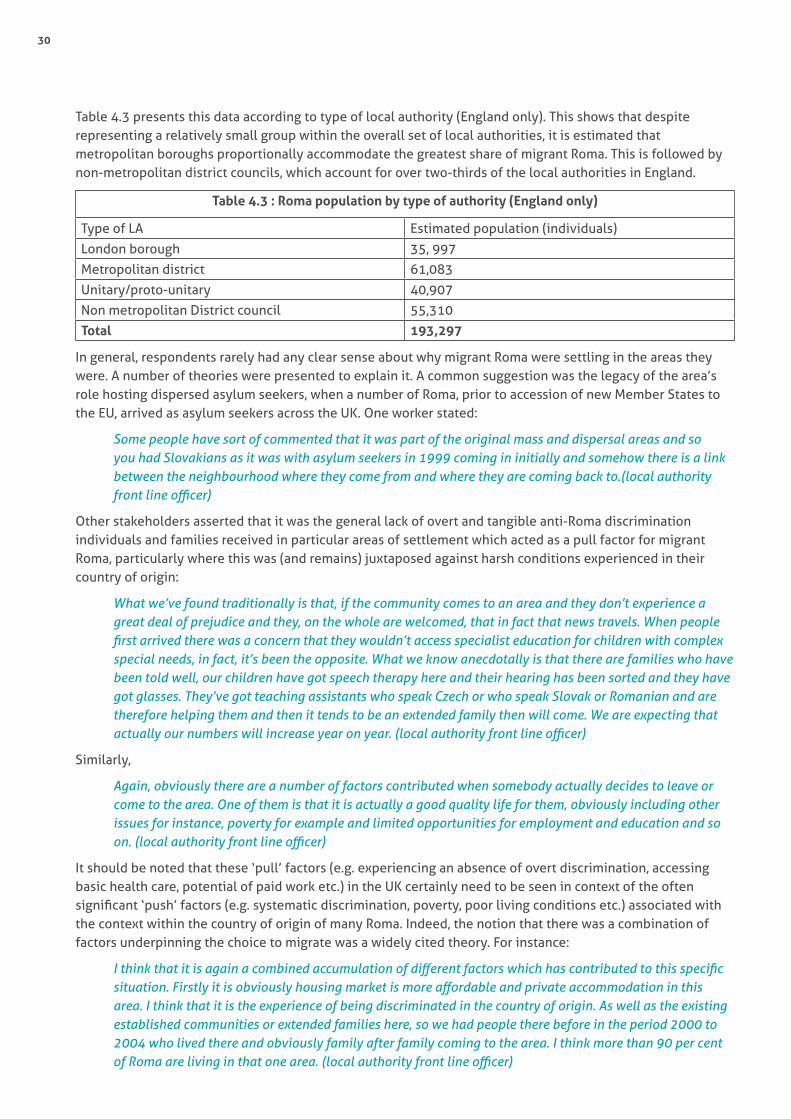
Table 4.3 presents this data according to type of local authority (England only). This shows that despite representing a relatively small group within the overall set of local authorities, it is estimated that metropolitan boroughs proportionally accommodate the greatest share of migrant Roma. This is followed by non-metropolitan district councils, which account for over two-thirds of the local authorities in England.
Table 4.3 : Roma population by type of authority (England only)
Type of LA Estimated population (individuals)
London borough 35, 997
Metropolitan district 61,083
Unitary/proto-unitary 40,907
Non metropolitan District council 55,310
Total 193,297
In general, respondents rarely had any clear sense about why migrant Roma were settling in the areas they were. A number of theories were presented to explain it. A common suggestion was the legacy of the area’s role hosting dispersed asylum seekers, when a number of Roma, prior to accession of new Member States to the EU, arrived as asylum seekers across the UK. One worker stated:
Some people have sort of commented that it was part of the original mass and dispersal areas and so you had Slovakians as it was with asylum seekers in 1999 coming in initially and somehow there is a link between the neighbourhood where they come from and where they are coming back to.(local authority front line officer)
Other stakeholders asserted that it was the general lack of overt and tangible anti-Roma discrimination individuals and families received in particular areas of settlement which acted as a pull factor for migrant Roma, particularly where this was (and remains) juxtaposed against harsh conditions experienced in their country of origin:
What we’ve found traditionally is that, if the community comes to an area and they don’t experience a great deal of prejudice and they, on the whole are welcomed, that in fact that news travels. When people first arrived there was a concern that they wouldn’t access specialist education for children with complex special needs, in fact, it’s been the opposite. What we know anecdotally is that there are families who have been told well, our children have got speech therapy here and their hearing has been sorted and they have got glasses. They’ve got teaching assistants who speak Czech or who speak Slovak or Romanian and are therefore helping them and then it tends to be an extended family then will come. We are expecting that actually our numbers will increase year on year. (local authority front line officer)
Similarly,
Again, obviously there are a number of factors contributed when somebody actually decides to leave or come to the area. One of them is that it is actually a good quality life for them, obviously including other issues for instance, poverty for example and limited opportunities for employment and education and so on. (local authority front line officer)
It should be noted that these ‘pull’ factors (e.g. experiencing an absence of overt discrimination, accessing basic health care, potential of paid work etc.) in the UK certainly need to be seen in context of the often significant ‘push’ factors (e.g. systematic discrimination, poverty, poor living conditions etc.) associated with the context within the country of origin of many Roma. Indeed, the notion that there was a combination of factors underpinning the choice to migrate was a widely cited theory. For instance:
I think that it is again a combined accumulation of different factors which has contributed to this specific situation. Firstly it is obviously housing market is more affordable and private accommodation in this area. I think that it is the experience of being discriminated in the country of origin. As well as the existing established communities or extended families here, so we had people there before in the period 2000 to 2004 who lived there and obviously family after family coming to the area. I think more than 90 per cent of Roma are living in that one area. (local authority front line officer)
4 Characteristics of the UK migrant Roma population
Migrant Roma in the United Kingdom: population size and experiences of local authorities and partners
31
Such theories are not unique to Roma having been explored in relation to various migrant groups including asylum seekers (Koser and Pinkerton, 2002) and migrant workers (Pemberton and Scullion, 2013).
Other respondents had very little idea about why their area had seen significant numbers of Roma settle there. For instance the following respondent did not comprehend why Roma had settled in their area but considered that perhaps Roma were not selecting particular areas over others but instead settling in greater or lesser numbers in most places across the UK:
I have no idea. [Name of town] it’s not got a lot going for it really, as you can see on the news on a constant basis. There are a lot of deprived areas. There is a lot of unemployment. Whether it’s just become like a safe haven then I don’t know. Saying that, I don’t think it is just [the area], because [nearby city] has got it [migrant Roma populations],[nearby town]have got it. I’ve got people from other authorities who ring me up for advice. I know in [city 20 miles away] it’s a huge issue. Like I say, they have a whole community and not just hot spots. When you say, why [this area], I don’t really think there is a specific thing. Perhaps it’s happening everywhere and perhaps other local authorities just aren’t aware of it. It could just be that. (Local authority front line officer’)
Origin of information about Roma populations
As discussed earlier, we know that data is not systematically collected about migrant Roma. The survey asked respondents to indicate what evidence had contributed to their estimate of the local migrant Roma population, (as distinct from the sources of their initial awareness). Responses cited four main derivations:
• Local authority’s own data
• School data
• Informal sources
• Voluntary sector organisations
• ‘Other’ sources
Very few authorities reported deriving their estimate from police, housing providers or health information. However as school, health, housing and police data are often shared with local authorities and appear in collaborative reports (e.g. Joint Strategic Needs Assessment) there is significant scope for crossover of source data.
When citing ‘informal sources’, respondents were asked to elaborate on their responses and analysis of the comments received provided interesting glimpses into some of the dynamics and practicalities of sizing a particular ‘hidden’ community. Such responses centred around the presence of ‘known’ Roma families who had migrated to the area but whom had refused to ascribe as Roma and data which indicated that first language spoken at home was Romani.
The interviews with local authority officers were able to offer further amplification on such issues. It appears the enumeration often entailed using one of four strategies. The first involved the use of available ‘hard’ data, for instance that collected by ‘grassroots’ organisations, usually an NGO of some description:
I wrote that figure of families because [a local NGO] work with families in this area and that’s the kind of numbers that they got. I used their data for that they provided. (Local authority front line officers)
The second route was to utilise data they collected as a result of their direct engagement with individuals and families:
We deal with 4, 5, probably 5 or 6 children and they are from 2/3 families. (Local authority front line officers)
Thirdly, what seemed to be a reasonable estimate based on experience, for instance:
We work with around 300 families. Times by ten, we knew that a lot of families wouldn’t have ten but some would have more than ten and some would have less. I did a kind of rough estimate at 3,000 (Local authority front line officers)
32
The final option was to use ‘hard’ data coupled with informal information used to moderate the numbers, for instance:
It’s a bit finger in the air and it could be wrong. I’m relatively confident of it. That’s because we’ve taken the national insurance numbers. There are caveats with those if people don’t deregister. I looked at the GP registrations, built in a factor of four to the Nino (National Insurance number) registration which is probably conservative given the sort of size of families. The average family size is probably larger than that... We’ve estimated that 80 per cent of the Slovakian population come from a Roma background and that was a figure which came to me, as I say, anecdotally and no-one has got this empirically, but that came from my contact in health, in the police and in the voluntary sector. It seemed reasonable, but it could be wrong. It did seem reasonable. (Local authority strategic officer)
The effort of accurately enumerating the migrant Roma population was reported as particularly difficult due to the general lack of ethnic ascription by Roma, reliance on imperfect school data and recording mechanisms, and the invisibility of Roma in other potential sources.
I am sure that many other A8 migrants are Roma but do not disclose their ethnicity (Local authority survey response)
A significant number of Roma have informed us that they are reluctant to fill-in ethnic monitoring forms as they feel that they will face discrimination. The community is pretty invisible as many Roma live in private housing and have only previously come to our attention when a family has experienced some kind of housing crisis….(Local authority survey response)
Only issue is lack of accurate data collection – most Roma ascribe to White European for ethnicity so are hard to track. (Local authority survey response)
With another respondent offering quite an extreme example of non-ascription based on their direct experience:
Because we have had over 25 years of dealing with Gypsy-Traveller population, what we know is that this Roma population is not going to self- subscribe. In fact, we know that there are people who, when they were asked what their nationality has said, I’m going to put down Pakistani, because I think my children will have less prejudice in a school if they say that they are from Pakistan, even though very obviously they weren’t. (Local authority front line officers)
Other data sources accessed by local authority survey responses ranged from Citizens Advice Bureau, National insurance number data, and direct contact with families. There was significant equivocation, however, with many of the comments highlighting the shortcomings of their datasets, or even the complete absence of figures.
Accuracy of estimates
In order to ascertain the soundness of the estimate for the overall population it was important to get a sense as to the level of accuracy respondents had when estimating the size of the local Roma population. What was particularly striking, from our discussions with a wide range of key informants during the interview stage, was that the numbers officially provided to us via the survey were largely considered to be conservative estimates. Within the survey most authorities had directly reported on the data they had collected or simply made an informed numerical assessment based on their first-hand experience. When we started to pursue the accuracy of the data during the interviews the potential for understating the population was evident. For example:
That figure I’ve given you is actually what is recorded in our ethnic data. I know that there are schools which haven’t got young people on as described by their ethnicity. I would say at least half as much again if not double. That’s not including obviously young people who are not in school that I’ve known about. Certainly, I think you can go half again with names of young people who are not ascribed. (Local authority front line officers)
4 Characteristics of the UK migrant Roma population
Migrant Roma in the United Kingdom: population size and experiences of local authorities and partners
33
Some respondents, in particular some well-informed NGOs, thought that as a result of their day-to-day practice and their networks across the area, the figure provided by local authorities was a significant understatement of the population, for example:
I would say that we, as an organisation are working with the tip of an iceberg. We are only getting like a very small percentage of Roma from [name of local authority]. By no stretch of the imagination this figure is conclusive. We know for example that most of our service users from [name of local area] are Polish Roma. Very few Romanian Roma from [name of local area] are accessing our services....I am very sure that the numbers in [local authority] are much higher than you’ve got. (NGO worker)
The workers from within this group went on to highlight the significant numbers of Roma clients from their records who they were, or had been, working with. Much of this data illustrated a greater population than was reported by local authorities and on occasion illustrated gaps where a survey return had not been supplied by a local authority. The general findings here suggest that organisations tended not to exaggerate the size of the migrant Roma population resident in their areas and were cautious in making their estimates.
Country of origin of resident Roma
Roma are far from a homogenous group. Even when Roma arrive from a single EU Member State not all Roma share the same identity. There is significant diversity in the Roma population in terms of socio-economic status, culture, education, skills, etc. As much of the information about the population of migrant Roma remains unknown it is impossible to understand these differences with any certainty. However, in order to learn more about the Roma population migrating to the UK, we asked the authorities who were aware of Roma living in their areas to comment on which countries the Roma they had encountered had originated from. Respondents were allowed multiple responses in order to reflect the diversity of the Roma population living in the various areas.
Roma from Romania, Slovakia, the Czech Republic and Poland were the most common countries of origin followed by Hungary, Latvia and Lithuania. Roma from Bulgaria only featured in a handful of authorities. It should be noted that the responses illustrate where local authorities identified the spread of different nationalities rather than giving an indication of which are the highest populations numerically. It also does not take account of the fact that a significant proportion of Roma may reside in several EU states after leaving the country of origin before settling on a long term domicile.
1. Romania 36 authorities reporting presence
2. Slovakia 32 authorities reporting presence
3. Czech Republic 31 authorities reporting presence
4. Poland 28 authorities reporting presence
5. Hungary 16 authorities reporting presence
6. Latvia 12 authorities reporting presence
7. Lithuania 11 authorities reporting presence
8. Bulgaria 9 authorities reporting presence
There was some apparent regional variation to the spread of Roma from different countries. For instance of the eight London boroughs aware of Roma none reported the presence of Slovakian nationals, whereas three out of the four Scottish authorities reported the presence of Slovakian Roma.
The changing population of migrant Roma in local areas
Those authorities who were aware of Roma living in their areas were asked to comment on whether they felt the numbers of Roma living in their areas were increasing, decreasing or staying the same – see Table 4.4.
34
Table 4.4: Change in numbers of Roma in the area?
No. (%)
Increasing 36 64.3
Decreasing 1 1.8
Staying the same 10 17.9
Don’t know 9 16.1
Total 56 100.0
Base: 56 responding local authorities
Of those who answered this question, nearly two-thirds felt the number was increasing. Because of the limited number of returns, meaningful analysis of national and regional differences is not possible, however it should be noted that only one authority in England felt the number was decreasing. Notably, however, more authorities in the East of England and South East felt the number was likely to stay the same as opposed to increasing/decreasing.
A number of respondents in the interviewing phase commented on the way in which they expected the population of migrant Roma to change over time. One worker from an NGO commented that they were observing some rapid changes in the migrant Roma population:
I wouldn’t be able to estimate [the size of the population] myself. The only thing that I would be able to say and know about the population is that it’s growing quickly. (NGO worker)
This view was shared with a number of key informants who often commented on the rapidity of the change in families living in their areas. Another respondent commented on the pressure that the gradual increase of Roma into one area was having on the schools:
If we go back two or three or four years ago we had between ten and fifteen students attending the language centre. The maximum capacity of the language centre is forty students. Now, last half term we are operating the full capacity, forty places, so full capacity. We do have forty students at the language centre. And also, another thirty five on the waiting list who normally would qualify to start the learning programme at the language centre this half term. But due to the capacity issue, they won’t be able to actually go there before January. Forty plus thirty five, that’s seventy five students of secondary school age who actually came to [name of area] in the last few weeks in comparison to four years ago when we had between ten and fifteen. That is actually just one single piece of information actually clearly demonstrating that numbers are increasing. (Local authority front line officers)
The changing nature of the migrant Roma population was not always attributed to new migrants in an area, although that was seen as a major driver. There was some sense from the interviews with key informants that the numbers of Roma in their areas were fluctuating on a continual basis, largely due to the mobility of families. This mobility was reported as occurring at a number of levels; movement within a local authority area; movement between local authority areas; and trans-national movement between Member States. Stakeholders often theorised about where and why people were moving. Occasionally this revolved around Roma seeking work opportunities, as two respondents reflected:
I think the families that I’ve met are part of sort of an extended family which are in [name of place]. They tend to sort of flip backwards and forwards. I think if there is more seasonal work in [name of local city] then they will disappear to [the city] for a couple of months and then come back again to [local area]. Although they are in [local area] there is that sort of transient flexibility where they do sort of disappear for a couple of months and then come back again. (Local authority front line officers)
Tesco has got like a big distribution centre there — there is quite a lot of work in [name of area], if people want it. That’s what attracts the migrants. They have horticultural glass houses and stuff. There is quite a lot of work and that will continue to attract migrants (Local authority strategic officer)
Other reasons for moving revolved around rumours of actions or restrictions by authorities (e.g. removing children into local authority care) or better chances to receive welfare in other areas.
4 Characteristics of the UK migrant Roma population
Migrant Roma in the United Kingdom: population size and experiences of local authorities and partners
35
Yes. I think that happens when people get too close. When the agencies get too close. They up and leave. And then, of course, that whole process starts again. Say they left and went to London, they could be gone 12 months. When they come back there is nothing to notify us that they have come back, because they are not claiming housing benefit. (Local authority front line officers)
Interestingly, one stakeholder also commented that it was unusual, but not without precedent, for some migrant Roma families to return to their country of origin for health care, citing experience of poor quality care in the UK and facing significant language difficulties as reasons:
I think speaking to them they do access the health service, but they are quite disillusioned with how long it takes for referrals and things like that to happen. I know in one instance they did actually save up and send their daughter back to Latvia for treatment and blood tests, because they said, in Latvia they have to pay for everything, every test and every x-ray and every appointment. They thought that was important, because they felt that English doctors weren’t getting to the bottom of what was wrong with her. English doctors were saying it was all psychological. And then when she went back to Latvia they did actually find a physical, medical problem for what was causing her pain. I think in terms of accessing medical help, they will access it. If it’s anything too complex or if they feel they are not getting the results quick enough then they are sort of sending relatives back home to Latvia for treatment. (Local authority front line officers)
There was also a gathering sense from a range of workers in a number of areas that the lifting of certain restrictions on entitlements, which will cease to apply to Bulgarian and Romanian nationals in January 201424, would see an increase in people migrating to the UK. However, it was also commented that the restrictions might offer adverse implications for those Bulgarians and Romanians who were currently working illegally as well as the public purse. A number of grassroots workers repeatedly suggested that the relationship between the labour market and the lives of migrant Roma was nuanced, impacting on where and how people lived each month, as well as the work they undertook. Such respondents thought that employers would cease to employ Bulgarian and Romanian nationals when they receive full labour market rights, opting to employ other (low paid) undocumented migrants instead. For example:
A lot of people think it will get better, because that means that the Romanians then can take legal work, etc. But if you are predominantly employed in illegal working, when you suddenly become legal and we saw this with the Czech community, you suddenly become unemployable, because there are other illegals who will work illegally for a much lower wage. Whereas if you are there and you attempt to get anything legal, they must pay you a minimum wage and therefore, you become unviable economically. I can’t see it getting any worse. Now, come the 1st January 2014, if everybody suddenly becomes able to claim legally things like public funding from the local authority, you are suddenly going to get a massive hit on the services that previously nobody could go to, because everyone knew they would be less used. I don’t think there is any planning gone into that. (Local authority front line officers)
With another respondent commenting:
Any increase in number is obviously going to impact on all services, education, health, social services, housing. It’s going to create additional demand across all those domains. (Local authority front line officers)
Some workers within NGOs providing targeted services for migrant Roma communities acknowledged the range of potential issues that may arise by the end of transitional arrangements in 2014. A notable number of respondents were actively working with members of migrant Roma communities to try and understand potential flows of people and provide guidance to community members already resident in the UK in order that they could feed this information back to and within their networks in Bulgaria and Romania.
24 For more information see: http://ec.europa.eu/social/main.jsp?catId=466&langId=en. Similar restrictions apply to nationals from Croatia, but because its accession only occurred in 2013, member states can continue to apply them until 2020 at the latest.
Five Engaging with migrant Roma in local areas
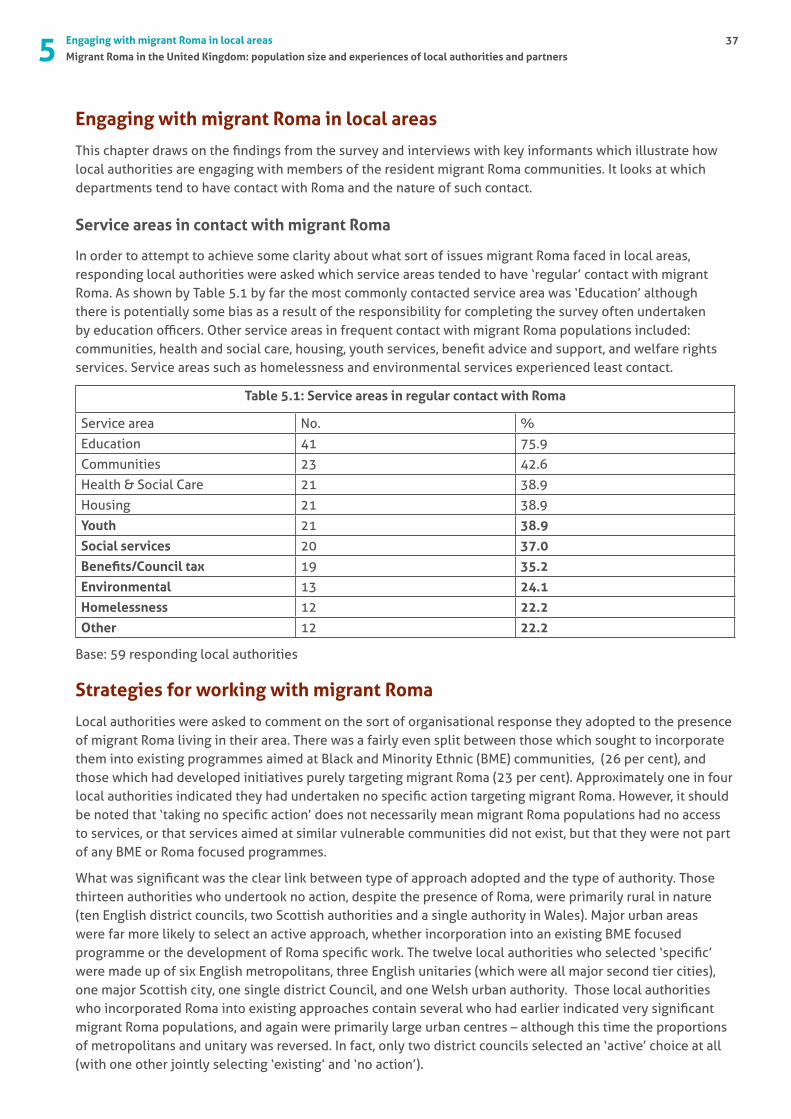
5 Engaging with migrant Roma in local areas
Migrant Roma in the United Kingdom: population size and experiences of local authorities and partners
37
Engaging with migrant Roma in local areas
This chapter draws on the findings from the survey and interviews with key informants which illustrate how local authorities are engaging with members of the resident migrant Roma communities. It looks at which departments tend to have contact with Roma and the nature of such contact.
Service areas in contact with migrant Roma
In order to attempt to achieve some clarity about what sort of issues migrant Roma faced in local areas, responding local authorities were asked which service areas tended to have ‘regular’ contact with migrant Roma. As shown by Table 5.1 by far the most commonly contacted service area was ‘Education’ although there is potentially some bias as a result of the responsibility for completing the survey often undertaken by education officers. Other service areas in frequent contact with migrant Roma populations included: communities, health and social care, housing, youth services, benefit advice and support, and welfare rights services. Service areas such as homelessness and environmental services experienced least contact.
Table 5.1: Service areas in regular contact with Roma
Service area No. %
Education 41 75.9
Communities 23 42.6
Health & Social Care 21 38.9
Housing 21 38.9
Youth 21 38.9
Social services 20 37.0
Benefits/Council tax 19 35.2
Environmental 13 24.1
Homelessness 12 22.2
Other 12 22.2
Base: 59 responding local authorities
Strategies for working with migrant Roma
Local authorities were asked to comment on the sort of organisational response they adopted to the presence of migrant Roma living in their area. There was a fairly even split between those which sought to incorporate them into existing programmes aimed at Black and Minority Ethnic (BME) communities, (26 per cent), and those which had developed initiatives purely targeting migrant Roma (23 per cent). Approximately one in four local authorities indicated they had undertaken no specific action targeting migrant Roma. However, it should be noted that ‘taking no specific action’ does not necessarily mean migrant Roma populations had no access to services, or that services aimed at similar vulnerable communities did not exist, but that they were not part of any BME or Roma focused programmes.
What was significant was the clear link between type of approach adopted and the type of authority. Those thirteen authorities who undertook no action, despite the presence of Roma, were primarily rural in nature (ten English district councils, two Scottish authorities and a single authority in Wales). Major urban areas were far more likely to select an active approach, whether incorporation into an existing BME focused programme or the development of Roma specific work. The twelve local authorities who selected ‘specific’ were made up of six English metropolitans, three English unitaries (which were all major second tier cities), one major Scottish city, one single district Council, and one Welsh urban authority. Those local authorities who incorporated Roma into existing approaches contain several who had earlier indicated very significant migrant Roma populations, and again were primarily large urban centres – although this time the proportions of metropolitans and unitary was reversed. In fact, only two district councils selected an ‘active’ choice at all (with one other jointly selecting ‘existing’ and ‘no action’).
38
When asked to elaborate on their choices, comments from those opting for the ‘existing’ approach pointed to three main areas of:
• Traveller education
• Services aimed at migrants/new arrival (including ESOL)
• Housing
It is perhaps unsurprising that major urban centres would have existing projects connected to migrants, given their historical links with migration. As noted earlier, authorities based in such locations were far more likely to have submitted a survey return and indicate the presence of Roma communities.
Authorities were also asked to comment on whether their local authority had any policies or strategies that specifically referred to Roma. A total of 52 local authorities responded to this question with only 21 authorities citing policies with specific mention of Roma within them. In many instances, however, it was clear that a number of references to ‘Roma’ more accurately related to indigenous UK Gypsies and Travellers. For example:
Our policies cover all Gypsies and Travellers under the BME umbrella. These are NOT specific to Roma (Local authority in the East of England)
The strategy was an old one written in 2000 relating to the Gypsy Traveller community and the authority’s policy to move them on from public spaces. It was written very much in the spirit of community safety rather than inclusion. (Local authority in London)
Furthermore, a number of local authorities did not allude to which document included relevant content. Of those authorities which provided specific details the majority either related to education (10) and equalities in general (7).
• 10 local authorities - education related services and strategies
• 7 local authorities - equalities in general.
NGO projects and schemes targeting migrant Roma
Responding authorities were also asked whether there were any projects or initiatives co-ordinated by NGOs which focused on migrant Roma in their local area. Just under half of the authorities which answered this question were aware of such initiatives, and all were all located in major urban centres. A similar number did have regular dialogue with such groups, and when asked which thematic areas such organisations covered, the themes which most frequently occurred were:
• Children’s education 18 local authorities
• Welfare rights/advice 17 local authorities
• Health 16 local authorities
• Employment 15 local authorities
• Anti-racism 15 local authorities
It should be noted that it is likely many projects covered multiple issues and requirements.
Within the interviews with stakeholders, it was often commented that the ‘invisibility’ and heterogeneity of migrant Roma, their relatively small population when compared to other ethnic groups, as well as their occasional dispersal around large areas all combined to make it difficult for NGOs to work with people from the migrant Roma communities specifically.
5 Engaging with migrant Roma in local areas
Migrant Roma in the United Kingdom: population size and experiences of local authorities and partners
39
In only five instances were such initiatives thought to be led by Roma populations themselves. Nevertheless, comments added for other questions suggested that the level of partnership with such NGOs was occasionally greater than simple awareness. It was clear that effective partnership working was taking place in a number of local authority areas. It should be noted that it is likely many projects covered multiple issues and requirements.
For example in response to an earlier question about how the presence of Roma first emerged, one authority stated that contact was made via:
Drop in sessions for Czech, Slovakian and Romanian Roma on weekly basis organised by [name of area] City Council and [name of area] Citizens Advice Bureau (Local authority survey response)
While another authority stated:
Through the work of the [name of project] in rural areas of [name of area] small pockets of Roma have been identified at different times over the course of the past year. The project initially became aware of this via an increase in that community visiting local Polish owned shops (Local authority survey response)
One NGO spoke about their frustration in dealing with local authorities and other statutory agencies when they were unable to communicate effectively between one another. In this instance the organisation took the role of ‘go-between’ co-ordinating information exchanges between agencies and the migrant Roma families involved:
We really want to capacitate agencies to work with their Roma clients within their own remit...in certain cases and certain complex cases…the London boroughs and different agencies would support a family or group of people but don’t cooperate with each other. We found ourselves on numerous occasions being sort of go between different agencies in one borough. We had to almost coordinate the communication and support provided to that family with complex needs by different agencies and communication between people from different agencies. I think that’s most obvious in my experience in relations you find of social services, particularly safeguarding and child protection. Not only that, because that was apparent when you were working in mental health projects, because our services were to help very complex needs and needed support in different areas of lives and sometimes to help coordinate professionals in the borough, so they don’t repeat things. (NGO worker)
It was clear from the discussions with stakeholders that authorities and key agencies (particularly large metropolitan or unitary councils) often had multiple departments/service areas involved with the same small community, or even household. For example, one worker within an NGO commented:
I think sometimes it’s very very difficult, because it’s such a small number of people. So actually getting in touch with other agencies who might be giving support is sometimes difficult or finding out who is the case worker for particular people at other agencies and what they have done and what they have dealt with, because we find that a lot of all our clients, they sometimes have a tendency to agency hop … going to all the agencies and getting all the workers to try to do the same work for them without telling anybody else that they have been to another place. (NGO worker)
It should be noted that the ability to ‘agency hop’ tended to be a situation which arose once individuals had been present in the UK and an area for some time. A number of respondents talked about how it was more likely for more recent migrant Roma not to engage with services and agencies of any sort.
Six Perceptions of challenges and issues
6 Perceptions of challenges and issues
Migrant Roma in the United Kingdom: population size and experiences of local authorities and partners
41
Perceptions of challenges and issues
The final section of the survey asked all respondents, regardless of whether they had any awareness of Roma living in their area, for their views on the various issues faced by local authorities when working with migrant Roma communities. Responding local authorities were also asked to posit recommendations which could help local authorities and partners in their work with migrant Roma populations. All these issues were pursued in greater depth in the interviews with key informants.
Views on challenges
At the time of the research local authorities were subject to reductions in funding as a result of wider public sector funding cuts. Those authorities who were aware of migrant Roma in their area, and who had been actively working with members of the migrant Roma communities, were asked to comment on whether the reduction in public sector spending had changed the way they approach work with Roma communities. Only 18 local authorities (12 per cent of all respondents) felt that the reduction in public spending had definitely affected services to Roma communities. Given the historic focus of work within Traveller education teams it was unsurprising that comments focused on cuts to such specialist provision. However, other recurrent themes from respondents included the mainstreaming of what had previously been Roma (or Gypsy, Roma, Traveller) specific posts, the reduction in funding to NGO partners, but also the threat to family support services. For instance, one responding local authority commented on the lack of staff capacity within existing structures to deal with the complex needs often presented by Roma communities:
We recognise to actually understand Roma and related issues we need some dedicated Council staff time...this is proving difficult. We recognise that some good sustained community development support is necessary to help Roma ‘catch up’ and to prevent future issues but our VCS commissioning funds have been reduced. Education Service has to help deal with school placements but is constantly finding whole families who need support. They cannot meet the need. Advice workers are struggling to cope with the general population and the Roma present with some very specific issues and language and complete lack of awareness can be a barrier. As a District we seem to be reacting to emerging need, rather than planning well in time. (Local authority in the Yorkshire and Humber region)
Similarly, it was not unusual to identify that cuts to services had meant a reduction in the size of staff teams and their subsequent ability to respond to emerging needs from migrant Roma populations. This was particularly the case within an education context:
The cut in funding to central education support teams meant that all the peripatetic teaching assistants for pupils new to the UK and new to English lost their jobs in March and May 2011. These teaching assistants offered pupils new to the UK, including many Roma pupils, extra support in schools and assist interpretation, progress in English, home-schooled liaison. Only two posts remain, Coordinator for pupils new to UK and Access to Education Officer for GRT pupils. (Local authority in the East of England)
Another simply commented:
Educational Welfare Officer specific Roma work been withdrawn. (Local authority in the East Midlands)
However, it should be noted that the issues associated with migrant Roma within local areas were very often particularly pressing, leading to a variety of services and partners searching for ways to address them and maintain current service levels, against the backdrop of significant financial cuts. One respondent from an authority in Yorkshire and the Humber talked about how partners have been working together to do as much as was feasible for migrant Roma communities but how this was under threat:
…the role, flexibility and commitment of local community and voluntary organisations has been essential in responding to local solutions. All the major, relevant voluntary organisations have considerable pressures; Family Development project in [name of area] is using reserves at present, facing closure in the spring; [name of service] are looking at large shortfalls for 2012; [name of Council] is facing more job losses; [name of advice service] receive minimal (and face less) financial assistance as the major agencies for advice, information and advocacy for Roma users. (Local authority in Yorkshire and Humber)
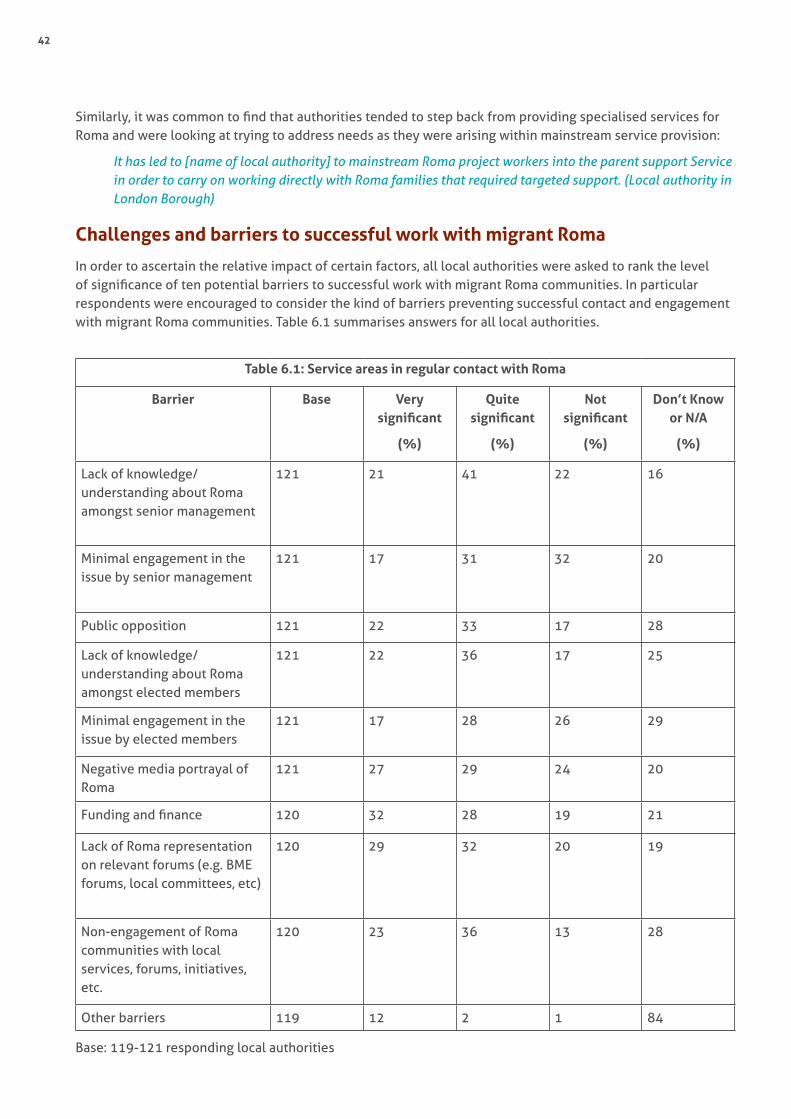
42
Similarly, it was common to find that authorities tended to step back from providing specialised services for Roma and were looking at trying to address needs as they were arising within mainstream service provision:
It has led to [name of local authority] to mainstream Roma project workers into the parent support Service in order to carry on working directly with Roma families that required targeted support. (Local authority in London Borough)
Challenges and barriers to successful work with migrant Roma
In order to ascertain the relative impact of certain factors, all local authorities were asked to rank the level of significance of ten potential barriers to successful work with migrant Roma communities. In particular respondents were encouraged to consider the kind of barriers preventing successful contact and engagement with migrant Roma communities. Table 6.1 summarises answers for all local authorities.
Table 6.1: Service areas in regular contact with Roma
Barrier Base Very significant
(%)
Quite significant
(%)
Not significant
(%)
Don’t Know or N/A
(%)
Lack of knowledge/understanding about Roma amongst senior management
121 21 41 22 16
Minimal engagement in the issue by senior management
121 17 31 32 20
Public opposition 121 22 33 17 28
Lack of knowledge/understanding about Roma amongst elected members
121 22 36 17 25
Minimal engagement in the issue by elected members
121 17 28 26 29
Negative media portrayal of Roma
121 27 29 24 20
Funding and finance 120 32 28 19 21
Lack of Roma representation on relevant forums (e.g. BME forums, local committees, etc)
120 29 32 20 19
Non-engagement of Roma communities with local services, forums, initiatives, etc.
120 23 36 13 28
Other barriers 119 12 2 1 84
Base: 119-121 responding local authorities
6 Perceptions of challenges and issues
Migrant Roma in the United Kingdom: population size and experiences of local authorities and partners
43
No one issue was seen as a defining barrier to successful work with migrant Roma – most responses were evenly spread. The most significant barrier surrounded the issue of funding and finance followed by a lack of representation by Roma on relevant local fora. These were followed by the impact of negative media portrayal of Roma. The least significant issue appeared to revolve around barriers posed by [dis]engagement of senior management or elected members in the issue.
In the interviews with key informants many of these issues, as well as others, were repeated and expanded on. By far the most common factors restricting the work of the local authority (and its partners) were the lack of funding and finance available, coupled with a shrinking workforce. For example:
We won’t be able to deliver on the services that we provide for new arrivals ... and of course, Roma are just one of the large groups within that. It will have impact on the delivery of services. However, at the same time, obviously we just have to be more creative. (Local authority front line officers)
The key to success with that route is consistency. I think, at the moment, budget cuts and all of that, that really there isn’t a lot of consistency anywhere within local authority, because people are moving or jobs are changing and that sort of thing is happening all the time. You need to have the time for that trust to be built up and then keep that person there, so that they are in a strong position to actually encourage families and the community to engage with stuff. (NGO worker)
Current economic climate means that everything has been cut. I don’t think we could recreate what we’ve had in the past. I think we are losing that kind of partnership approach. We’re trying desperately to kind of keep hold of it. I know lots of the staff on this team are consistent, so that means you kind of know who to get in touch with. But because there has been a lot of movement and staff being made redundant or new teams being set up, sometimes it’s quite hard to know where to turn. What I’m frightened of and what I see is it’s like going back to the beginning. It seems like people lose what they knew or you get new people in post. You just think, we’ve had these conversations five years ago. Let’s not go back. We are beyond that now. We are beyond doing this and that and the other, because we tried that and it doesn’t work. (Local authority front line officers)
The notion that many of the key services for migrant Roma were already in place, or at least could be with minimal development, was noted in other accounts. However, ensuring services were joined-up within authorities and that organisations did not lose their ‘institutional memory’ in a time of flux was also important. As one respondent, from a large metropolitan authority, described:
Well, in actual fact, I don’t think there is a major gap. What I think the problem is there is no way of coordinating amongst the different departments. I think that’s the biggest issue that ideally what you would go down the route is that each department would have specific workers like, for instance, we do education. I think social care and the health service are the biggest problems. It’s not necessarily their fault. It is the way that the city is cut up into districts under the previous regime. That may improve, but it may get worse because if it all goes back to surgeries and local area teams, it’s not going to really help the problem, because in effect what you are doing is you are deconstructing a holistic view into little area views. I think the other way I would say is, everything is there in place, but not everybody is aware of their rights or responsibilities and that’s from all sides. (Local authority front line officers)
Similarly, the issue was not always about the lack of such services that were available but the low level of access by migrant Roma even when it was known by providers that there were particular needs in the community:
There is a massive gap with them [migrant Roma] actually accessing. There is a growing community, but the resources put into it don’t seem to be growing much. I think that most of the work probably is done through the schools, which tends to be a good system in terms of, you know, if, if you are working with children and working with the parents in the community. Obviously in this community there is quite a high level of low attendance rates. If the work that’s being done to engage with the Roma community is solely going through schools and you are going to be missing out on whole chunks of that community that’s got no contact with schools at all. I think there is a lot more that can be done. (NGO worker)
44
I don’t think we are maybe reaching as many people as we could be reaching. I think one big gap we’ve got is that although we try to do events where we can get consultation from the families, they don’t attend these events. A lot of the work that we are doing, we are having to guess and assume that this is the right thing to do, because we don’t seem to be getting much feedback back as to what the community wants. (Local authority front line officers)
There was a common perception that a lack of places in schools and training courses were particular challenges which were holding back efforts to work more successfully with migrant Roma. However, for the most part it was clear that many respondents were overwhelmed by the particular complexity of issues seen in migrant Roma households. As respondents recounted:
I know that there are concerns about the younger girls being involved in prostitution. There are issues with overcrowding in houses and issues of general literacy and language skills and also with non - attendance at schools or irregular attendance at schools. (NGO worker)
Because it is such a sensitive issue lots of people don’t want to delve into it too much ... what we should research is teenage pregnancy and looking at the impact that kind of the customs and norms that the Roma community have. (NGO worker)
The places in which Roma were settling also meant that their spatial location often contributed to challenges. In certain cases, high densities of migrant Roma families were reported as settling in discrete geographic pockets within an area. It was common to find that such families had moved from one circumscribed area in their country of origin to a similar setup in the UK, as one respondent describes:
For instance, more than 90 per cent of Roma population in [name of area] are settled in one area. Obviously, all these people with children of compulsory school age, for instance primary school age, we have to find a few places (at) local primary schools. And very often due to a significantly increased numbers of new arrivals and Roma to come into [name of area], very often we are not in a position to provide school places at local schools for all of them. We have to support those families to send their children to schools outside the area, so that is one of the sort of gaps. (Local authority front line officers)
Although services, however minimal, were being provided and access was being facilitated for Roma, if only to a limited extent, one respondent felt that the causes of the variety and complexity of the needs being seen were not really being tackled at source:
I don’t think there are gaps in as much as there aren’t things that are not being addressed. I think most considerations are being given to the ways in which everybody’s best efforts are going into supporting Roma migrants in the city. But there are clearly areas where much more needs to be done and in that regard, the housing issue is massive and a problem. The question of expectations around people becoming job ready or not or indeed things for me that need significant review, because they are, for most people arriving here, it’s just untenable to expect that they would be in the time frames being set by Job Centre Plus and others that they would be job ready in any way shape or form. And so, in that sense, I think there needs to be a bit of a rethink about the whole response to ESOL and what that means. (NGO worker).
Similarly, another respondent commented that the perverse nature of some service areas hindered the ability for migrant Roma to gain self-sufficiency. For example, one issue revolved around the need to ensure schools could respond to the settlement of migrant Roma in a given area and that they were facilitators of economic mobility and not hindering access to the labour market. As one respondent commented access to limited (and suitable) school places was putting particular strain on migrant Roma families resulting in opting out of school and inability to maintain regular employment.
6 Perceptions of challenges and issues
Migrant Roma in the United Kingdom: population size and experiences of local authorities and partners
45
We’ve also got a problem in that school places in particular are worked out using census returns. Now because of school planning is done like that, all the areas that roma are moving to, there are no school places. The next thing is you’ve got to place them in the school and that could be up to 12 miles away across the city. How do they get there? They can’t negotiate buses, public transport, finding their way around and things like this. When they get there, because the schools are from the more outlying districts that have got places, they are suddenly confronted with a population, you don’t speak English and are not ethnically British. Whereas in the centre of the city, all the schools are used to dealing with, the ones on the outside, it’s not possible. (Local authority front line officers)
Recommendations from local authorities and partners for future work with Roma
Question C3 asked responding local authorities for their top three recommendations for actions which could better assist them and their partners. It was unsurprising that many focused on the need to develop a better understanding of migrant Roma communities, their culture and needs. Variations on this theme were the most frequent recommendation by a considerable margin. A desire for improved statistics, intelligence and information was expressed on 47 separate occasions. Closely linked to this was the need for cultural awareness or similar training (26), while better engagement and consultation (including by elected members) featured 17 times. More funding and resources in general, both targeted and an expansion of existing services, appeared on 30 separate occasions ranging from:
Need for more colleagues to be employed for hands on multi-agency support with Roma families to gain their trust and help them access what is open to them i.e. accompany them to meetings, etc.(Metropolitan council in the North West of England)
Roma people frequently approach us with several different queries and issues, yet often the person they speak to can only deal with one of these issues, and has to signpost them to someone else for help. We need to find a way of being able to offer an integrated support service. (Metropolitan council in the North West of England)
Support for schools to assist set up Roma community focus complementary schools. (Metropolitan council in the North West of England)
In addition, there were a handful of recommendations citing the need for greater support in relation to language and interpretation.
Multiple recommendations also occurred on the development of migrant Roma communities themselves (nine occasions), myth busting and improving community relations (seven occasions) and the importance of partnership working (thirteen occasions). A wealth of detail was supplied in the recommendations, more than in any other open question, but the majority of comments were characterised more by pleas for support than examples of good practice, suggesting a strong demand from local authorities for help in working with migrant Roma communities.

Seven Conclusion
7 Concluding comments
Migrant Roma in the United Kingdom: population size and experiences of local authorities and partners
47
Conclusion
The main conclusion from the research is that the migrant Roma population in the UK is significant and indications are that it is increasing. The data gathered in this study relies on estimates by stakeholders who have brought together hard data coupled with their grassroots experience to provide local estimates which can be scaled up to provide an indicative population of migrant Roma in the UK. Although a minority of UK local authorities provided local estimates of the migrant Roma population many of the responding authorities include large metropolitan cities and a spread of authority types across the country. We are confident that the sample obtained in this work forms as a sound and robust base as is possible at this current time to understand the size and nature of migrant Roma settlement in the UK. It should be noted that the response rate is not necessarily a failure of local authorities to respond to the survey; rather this points to the complexities associated with identification and engagement of migrant Roma populations, coupled with the reductions in the capacity of staff in many local authorities in the UK at the current time.
The conservative estimate of approximately 200,000 migrant Roma individuals is already similar in number to estimates provided about the population of indigenous Gypsies and Travellers in England and Wales which is estimated to be between 200,000 – 300,000 individuals (Commission for Racial Equality, 2006). In following the Council of Europe (2011) definition of Roma, when combined together the population of migrant Roma and indigenous Gypsies and Travellers would equate to around 400,000 – 500,000 people. This equates to 0.8% of the total UK population. According to recent Census 2011 data covering England and Wales this is broadly comparable with the Bangladeshi population (447,201), on a conservative reading of the estimate, or the Caribbean population (594,825) on a more generous reading. In a European context this is broadly comparable with the Roma population in France (400,000) and Slovakia (500,000) (Council of Europe, 2010).
• From the data provided by local authorities it can also be concluded that the population of migrant Roma is predominantly urban and located in existing multi-ethnic areas. This study suggests that populations are concentrated in the North West and London with significant populations in Yorkshire and the Humber, East Midlands and West Midlands. There is a significant degree of uncertainty from key informants about the implications the end of transitional rights for Roma from Romania and Bulgaria will have for migration flows.
• The pattern of why migrant Roma settled in particular areas was seen as complex. Key informants reported many reasons which could be used to explain settlement decisions by migrant Roma. Having direct or secondary experience of an area and having members of a wider family network present in the area was seen as important, as was having access to affordable accommodation Within local authority areas it was common for authorities to report that Roma tended to live as part of a Roma diaspora. Such a situation of living in particular high densities was a common feature/observation across a number of areas of the UK. This was largely attributed to having access to properties in the private rented sector coupled with strong familial bonds. It was often reported that Roma tended to move from a single location in their country of origin to a single location in the UK in significant numbers either at the same time or over a period of time.
• A number of authorities reported that they were aware of migrant Roma living in their areas that rarely came into contact with the authority in any way. This was largely attributed to migrant Roma tending to be accommodated in private rented housing and not engaging, in any perceptible way, with local authority services or with key statutory partners. Authorities reported that the main way they came into contact with Roma was through educational issues/children’s services, as a result of some sort of crisis within the household or when issues were reported by the general public or referrals made by other agencies (e.g. housing services, environmental health, police etc.).
48
• Where authorities were aware of Roma living in their areas the levels of mobility within migrant Roma populations were commonly reported as high. The nature of mobility operated at a number of levels. Movement was reported within areas; from one dwelling to another and with family members moving from and re-joining dwellings. This was thought to be largely as a result of particularly large, extended family groups within Roma populations and the lack of available accommodation suitable in size to facilitate single dwelling living. Movement between areas was observed; such movement was reported on a spectrum of people leaving for short periods of time – presumably for visits to family elsewhere – to those who made more semi-permanent moves. Interestingly, it was also observed by key informants that deeper engagement with families from agencies often instigated movement away as agencies saw themselves as ‘getting too close’. Furthermore, international movement was reported, although this was far less common. The common message from discussions with many key informants was that the settlement of migrant Roma appears precarious.
• Migrant Roma were often seen as arriving with varied and complex needs. Particular issues discussed related to the presence of poverty, experience of entrenched discrimination resulting in an absence of trust and lack of literacy abilities (in any language). Local authorities reported that they found catering for the diversity and complexity of needs challenging. Occasionally this was linked to the heterogeneity of the Roma population meaning that ensuring appropriate and meaningful service provision was challenging. Similarly, NGO partners often found the volume of needs challenging to address within current levels of funding available. Reductions in funding available for local authorities and partners were often cited as contributing to the challenges faced. Posts were being lost within many organisations (statutory and non-statutory) which had the impact on reducing the capacity available to deal with Roma (including Gypsy and Traveller) issues as well eradicating institutional memory about how to address such issues when they were presented.
• This research provides a provisional insight into the settlement of Roma in the UK but more research is needed to appreciate the nature of this settlement. More precisely what are the reasons Roma themselves provide for their migration decisions? Why do they settle in certain areas? What are their expectations? What are their self-assessed needs? How do the services and opportunities provided in local areas map onto these needs? How are such issues affected by different sections of the migrant Roma population?
• In the absence of other methods of collecting systematic and comprehensive data and information about the migrant Roma population in the UK, it is recommended that this exercise is repeated regularly in order to document the population of migrant Roma and focus in on specific issues pertinent to areas such as age, gender and employment.

Eight References
50
References
Amnesty International (2011) Briefing: human rights on the margins, Roma in Europe. London: Amnesty International.
Anstead, A (2010) What do we think of Romani people? Available online at http://equality.uk.com/Resources_files/what_do_we_think_of_romani_people.pdf Accessed 05/08/2013
Bartlett, W., Benini, R. and Gordon, C. (2011) Measures to promote the situation of Roma citizens in the European Union, Report for the European Parliament, Brussels: Directorate-General for Internal Policies, Policy Department C Citizens’ Rights and Constitutional Affairs.
Brown, P., Dwyer, P and Scullion, L (2013) The Limits of Inclusion? Exploring the views of Roma and non Roma in six European Union Member States. Salford: University of Salford
Commission for Racial Equality (CRE) (2006) Common Ground: Equality, Good Race Relations and Sites for Gypsies and Irish Travellers, London: CRE.
Council of Europe (2010) Statistics document prepared by the Council of Europe Roma and Travellers Division Brussels: Council of Europe. Available online at: http://www.coe.int/t/dg3/romatravellers/Source/documents/stats.xls Accessed 05/08/2013
Council of Europe (2011) Council of Europe Descriptive Glossary of terms relating to Roma issues. Brussels: Council of Europe. Available at http://a.cs.coe.int/team20/cahrom/documents/Glossary%20Roma%20EN%20version%2018%20May%202012.pdf Accessed 06/08/13
Craig, G. (2011) The Roma: A Study of National Policies. Brussels: European Commission. Available online at: http://www.york.ac.uk/inst/spru/research/pdf/EURoma.pdf Accessed 05/08/2013
European Dialogue (2009) The movement of Roma from new EU Member States: A mapping survey of A2 and A8 Roma in England, report for the Department for Children, Schools and Families (DCSF). Available online at http://equality.uk.com/Resources_files/movement_of_roma.pdf Accessed 05/08/2013
European Union Agency for Fundamental Rights (Undated) Multi annual Roma programme. Available online at: http://fra.europa.eu/en/project/2013/multi-annual-roma-programme?tab=secondary-data Accessed 14/08/2013
European Commission (2011) Working Together for Roma Inclusion – the EU framework explained,
Equality (2011) From Segregation to inclusion. Roma pupils in the United Kingdom, a pilot research project. Available online at: http://equality.uk.com/Education_files/From%20segregation%20to%20integration_1.pdf Accessed 05/08/2013
Horton, M. and Grayson, J. (2008) ‘Roma Research – the context’, in M. Horton and J. Grayson (eds) (2008) Roma New Migrants: Local Research in the UK and European Contexts. Available online at http://www.redtoothcreativesolutions.com/aded/docs/Roma_Conference_Report.pdf Accessed 05/08/2013.
Koser, K. and Pinkerton, C. (2002) The Social Networks of Asylum Seekers and the Dissemination of Information About Countries of Asylum. Migration Research Unit, University College London.
Office for National Statistics (2012) A conceptual framework for UK population and migration statistics. Office for National Statistics. Available online at: http://www.ons.gov.uk/ons/guide-method/method-quality/imps/latest-news/conceptual-framework/a-conceptual-framework-for-population-and-migration-statistics---executive-summary.pdf Access 05/08/2013
8 References
Migrant Roma in the United Kingdom: population size and experiences of local authorities and partners
51
Open Society Foundations (2011) EU Policies for Roma Inclusion. Policy Assessment. Available online at http://www.opensocietyfoundations.org/sites/default/files/2011-07%2520EU%2520Roma%2520Inclusion%2520Policies%2520final.pdf Accessed 05/08/2013
Pemberton, S. and Scullion, L. (2013) ‘The Policies and Politics of Managed Migration: Exploring Mature Labour Migration from Central and Eastern Europe into the UK’, Journal of Ethnic and Migration Studies, 39, 3, 443-461.
Poole, L. (2010) ‘National Action Plans for Social Inclusion and A8 migrants: The case of the Roma in Scotland’, Critical Social Policy, 30: 245-66
Ratcliffe, G. (2011) The needs of the Slovak Roma community in Sheffield: A summary report. Sheffield: NHS Sheffield
Scullion, L and Brown, P. (2013) ‘What’s working?’: Promoting the inclusion of Roma in and through education. Report to the Black Health Agency. Salford: University of Salford.
Stewart, M. and Rovid, M. (2010) Multi-disciplinary approaches to Romany Studies. Budapest: Central European University Press.
Tanner, A (2005) ‘The Roma of Eastern Europe: Still Searching for Inclusion’, Migration Policy Institute. Available online at http://www.migrationinformation.org/Feature/display.cfm?ID=308 Accessed 05/08/2013
Tremlett, A and McGarry, A. (2013) Challenges facing Researchers on Roma Minorities in contemporary Europe: Notes towards a Research Program. ECMI Working Paper 62. Available online at http://www.ecmi.de/uploads/tx_lfpubdb/Working_Paper_62_Final.pdf Accessed 05/08/2013
Wilkin, A., Derrington, C., White, R., Martin, M., Foster, B., Kinder, K and Rutt, S. (2010) Improving the outcomes for Gypsy, Roma and Traveller pupils: final report. London: Department for Education.
Appendix 1:
Survey Methodology
1 Appendix 1: Survey Methodology
Migrant Roma in the United Kingdom: population size and experiences of local authorities and partners
5353
Appendix 1: Survey methodology
The local authority survey was the main source of primary information which was supported by a number of interviews with key informants from selected local authority areas. The findings from this research are reported in Chapters 3 to 6 of this report.
The survey
The questionnaire was developed with the support of a small advisory group, which sought to explore a number of factors in order to better understand the settlement of migrant Roma across the UK. The following issues were focussed upon:
• Ascertaining an informed estimation as to the size of the migrant Roma population across the UK
• Understanding the basic profile of the migrant Roma community in the UK
• Within what contexts local authorities engage with Roma
• What their strategic approach has been to Roma migration
• What, if any, projects and initiatives developed by NGOs target migrant Roma
• Reported challenges and barriers to successful work with migrant Roma communities
The questionnaire and covering letter used are in Appendices 2 and 3.
Survey distribution
The survey was sent to Local Authority Districts in England (these include: non-metropolitan districts, unitary authorities, London Boroughs and metropolitan councils), and their equivalents in Scotland, Wales and Northern Ireland. Surveys were not sent to County Councils, as it was recognised this would create actual geographical duplication, and the risk of numerical duplication, aside from the methodological issue of widening the scope of assessment and possibly unbalancing the resultant analysis.
A survey and covering letter were sent via email to the Chief Executive of every local authority in the UK to notify them of the study. In addition, the survey and a covering letter were also sent via email to officers within local authorities who had been assessed (via an online search) as being the most likely to have insight into any migrant Roma population in their area. Often such officers were working in areas such as equality, cohesion or Traveller education or liaison officers. This was an intensive process and it was common to find that such posts had ceased to exist in many local authorities reportedly as a result of reductions in local authority workforce. In light of this in order to encourage as many responses as possible, a pragmatic approach was then adopted which entailed contacting every local authority by telephone in order to locate the most appropriate contact for the survey to be passed to. In addition, local authorities who had been sent the survey but which had not responded were also contacted by phone and email on a number of occasions to encourage completion. The deadline for completion of the survey was extended a number of times to enable more responses to be collected. Responses from particular authorities were pursued more intensively than others. These were authorities where the research team had received information from members of the advisory group, voluntary and community groups or key partners as to the presence of migrant Roma in those areas.
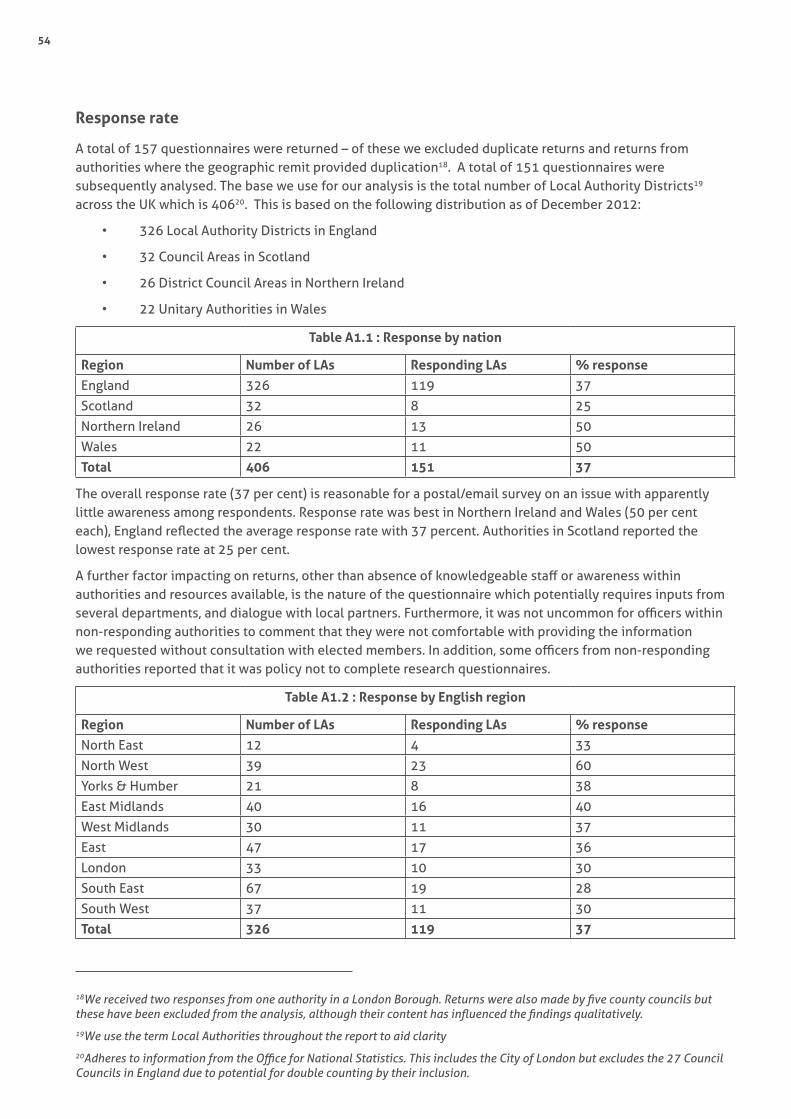
54
Response rate
A total of 157 questionnaires were returned – of these we excluded duplicate returns and returns from authorities where the geographic remit provided duplication18. A total of 151 questionnaires were subsequently analysed. The base we use for our analysis is the total number of Local Authority Districts19 across the UK which is 40620. This is based on the following distribution as of December 2012:
• 326 Local Authority Districts in England
• 32 Council Areas in Scotland
• 26 District Council Areas in Northern Ireland
• 22 Unitary Authorities in Wales
Table A1.1 : Response by nation
Region Number of LAs Responding LAs % response
England 326 119 37
Scotland 32 8 25
Northern Ireland 26 13 50
Wales 22 11 50
Total 406 151 37
The overall response rate (37 per cent) is reasonable for a postal/email survey on an issue with apparently little awareness among respondents. Response rate was best in Northern Ireland and Wales (50 per cent each), England reflected the average response rate with 37 percent. Authorities in Scotland reported the lowest response rate at 25 per cent.
A further factor impacting on returns, other than absence of knowledgeable staff or awareness within authorities and resources available, is the nature of the questionnaire which potentially requires inputs from several departments, and dialogue with local partners. Furthermore, it was not uncommon for officers within non-responding authorities to comment that they were not comfortable with providing the information we requested without consultation with elected members. In addition, some officers from non-responding authorities reported that it was policy not to complete research questionnaires.
Table A1.2 : Response by English region
Region Number of LAs Responding LAs % response
North East 12 4 33
North West 39 23 60
Yorks & Humber 21 8 38
East Midlands 40 16 40
West Midlands 30 11 37
East 47 17 36
London 33 10 30
South East 67 19 28
South West 37 11 30
Total 326 119 37
18We received two responses from one authority in a London Borough. Returns were also made by five county councils but these have been excluded from the analysis, although their content has influenced the findings qualitatively.
19We use the term Local Authorities throughout the report to aid clarity
20Adheres to information from the Office for National Statistics. This includes the City of London but excludes the 27 Council Councils in England due to potential for double counting by their inclusion.
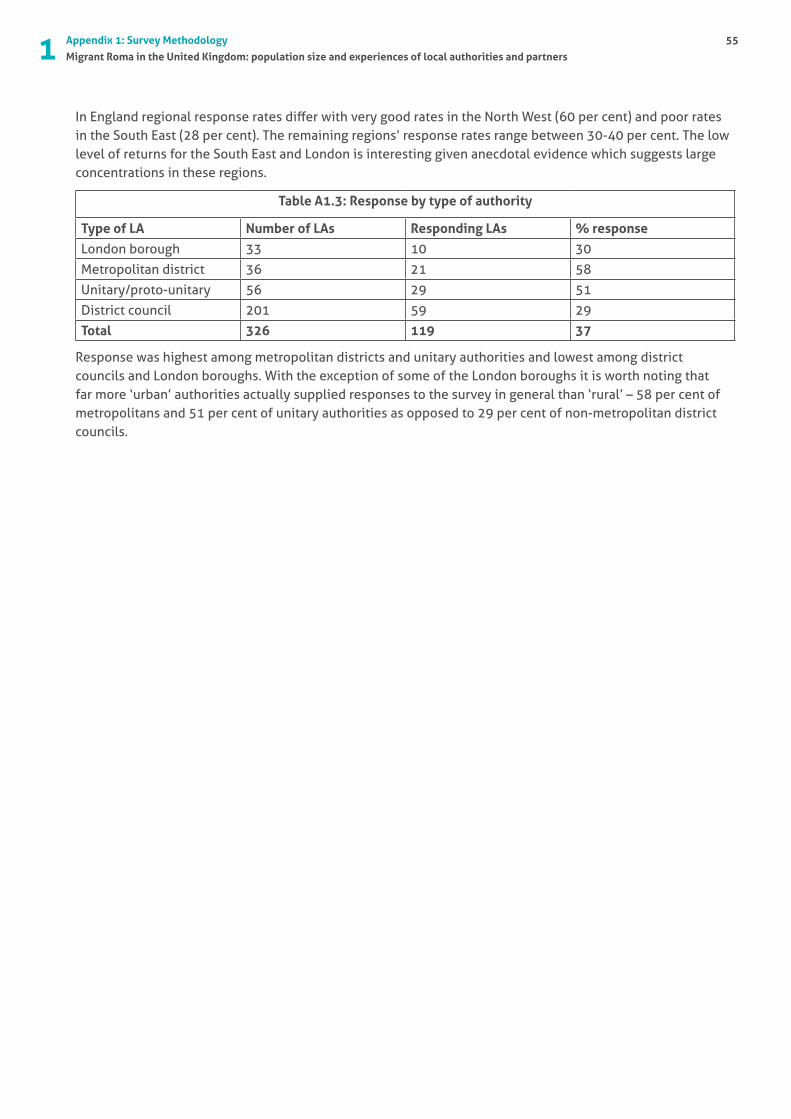
1 Appendix 1: Survey Methodology
Migrant Roma in the United Kingdom: population size and experiences of local authorities and partners
55
In England regional response rates differ with very good rates in the North West (60 per cent) and poor rates in the South East (28 per cent). The remaining regions’ response rates range between 30-40 per cent. The low level of returns for the South East and London is interesting given anecdotal evidence which suggests large concentrations in these regions.
Table A1.3: Response by type of authority
Type of LA Number of LAs Responding LAs % response
London borough 33 10 30
Metropolitan district 36 21 58
Unitary/proto-unitary 56 29 51
District council 201 59 29
Total 326 119 37
Response was highest among metropolitan districts and unitary authorities and lowest among district councils and London boroughs. With the exception of some of the London boroughs it is worth noting that far more ‘urban’ authorities actually supplied responses to the survey in general than ‘rural’ – 58 per cent of metropolitans and 51 per cent of unitary authorities as opposed to 29 per cent of non-metropolitan district councils.

Appendix 2:
Survey Covering Letter
2 Appendix 2: Survey covering letter
Migrant Roma in the United Kingdom: population size and experiences of local authorities and partners
57
Roma in the UK
Dear colleague
The Salford Housing & Urban Studies Unit (SHUSU) at the University of Salford is leading a major project focusing on the experience of local authorities across the UK in relation to the presence of Central and Eastern European (CEE) Roma in their local area. In recent years Roma have increasingly migrated to the UK, particularly since the Accession States joined the EU from 2004 onwards. The project involves carrying out research with local authorities across the UK and exploring the development of a national network focusing on Roma inclusion.
As part of this project, we are asking local authorities to complete the attached survey. This survey has two main aims:
• Obtain estimates on the size of the Roma population across the UK; and
• Identify areas where local authorities, partners and Roma may need additional support to enable positive outcomes.
The information collected through the survey will provide a greater understanding of the experiences of local authorities and could support applications for European Structural Funds made by local authorities working towards the integration of Roma communities.
We do hope that you can spare the time to complete the questionnaire attached to this email. The questionnaire should take around 15-20 minutes to complete. Please read the attached information sheet about the research before you decide whether to participate or not. The responses we receive to questions will be reported on a non-attributed basis and the anonymity of responding authorities will be maintained.
If you feel this questionnaire is more relevant to another officer within your authority, we would be grateful if you could let us know so that we can contact them instead.
A copy of this email, and the questionnaire, has also been sent to the Chief Executive of your local authority for information purposes.
Please complete and return it by Friday 8th June 2012. Questionnaires can be returned by email to [email protected] or in hard copy by post to:
Victoria Morris Salford Housing & Urban Studies Unit University of Salford Joule House, The Crescent SALFORD, M5 4WT
We greatly appreciate your co-operation
Yours sincerely Dr Philip Brown and Dr Lisa Scullion Research Directors
University of Salford, 43 The Crescent, Manchester M5 4WT – 0161-295-5000 – http://www.salford.ac.uk
Appendix 3: Local authority survey questionnaire
3 Appendix 3: Local authority survey questionnaire
Migrant Roma in the United Kingdom: population size and experiences of local authorities and partners
59
ROMA IN THE UK
In recent years Roma have increasingly migrated to the UK, particularly since the Accession States joined the EU from 2004 onwards. The Salford Housing & Urban Studies Unit (SHUSU) at the University of Salford is leading a major project focusing on the experience of local authorities across the UK in relation to the presence of Central and Eastern European (CEE) Roma in their local area. The project involves carrying out research with local authorities across the UK and exploring the development of a national network focusing on Roma inclusion.
As part of this project, we are asking local authorities to complete the attached survey. This survey has two main aims:
• Obtain estimates on the size of the Roma population across the UK; and
• Identify areas where local authorities, partners and Roma may need additional support to enable positive outcomes.
The information collected through the survey will provide a greater understanding of the experiences of local authorities and could support applications for European Structural Funds made by local authorities working towards the integration of Roma communities.
Please note that the survey specifically excludes information pertaining to Gypsies, Travellers and Travelling Showpeople as separate research has already been completed with these communities.
Further information about the project and details on how to complete the questionnaire are provided on the next page. It should take no longer than 20 minutes to complete. Please complete and return it by Monday 2nd July 2012. Questionnaires can be returned by e-mail to [email protected] or in hard copy by post to:
If you have any queries about completing the questionnaire, please contact Philip Brown ([email protected] and 0161 295 3647) or Lisa Scullion ([email protected] and 0161 295 5078)
This study is funded by the Joseph Rowntree Charitable Trust (JRCT).
Victoria Morris
Salford Housing & Urban Studies Unit
University of Salford
Joule House, The Crescent
SALFORD
M5 4WT
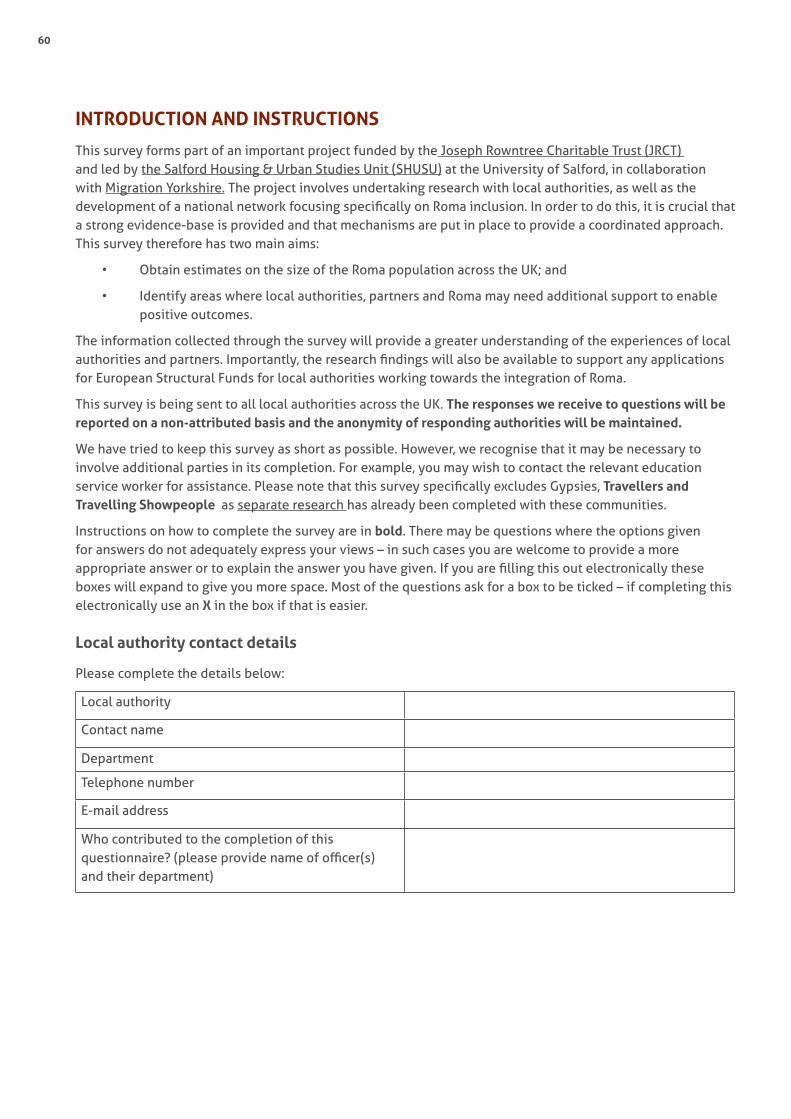
60
INTRODUCTION AND INSTRUCTIONS
This survey forms part of an important project funded by the Joseph Rowntree Charitable Trust (JRCT) and led by the Salford Housing & Urban Studies Unit (SHUSU) at the University of Salford, in collaboration with Migration Yorkshire. The project involves undertaking research with local authorities, as well as the development of a national network focusing specifically on Roma inclusion. In order to do this, it is crucial that a strong evidence-base is provided and that mechanisms are put in place to provide a coordinated approach. This survey therefore has two main aims:
• Obtain estimates on the size of the Roma population across the UK; and
• Identify areas where local authorities, partners and Roma may need additional support to enable positive outcomes.
The information collected through the survey will provide a greater understanding of the experiences of local authorities and partners. Importantly, the research findings will also be available to support any applications for European Structural Funds for local authorities working towards the integration of Roma.
This survey is being sent to all local authorities across the UK. The responses we receive to questions will be reported on a non-attributed basis and the anonymity of responding authorities will be maintained.
We have tried to keep this survey as short as possible. However, we recognise that it may be necessary to involve additional parties in its completion. For example, you may wish to contact the relevant education service worker for assistance. Please note that this survey specifically excludes Gypsies, Travellers and Travelling Showpeople as separate research has already been completed with these communities.
Instructions on how to complete the survey are in bold. There may be questions where the options given for answers do not adequately express your views – in such cases you are welcome to provide a more appropriate answer or to explain the answer you have given. If you are filling this out electronically these boxes will expand to give you more space. Most of the questions ask for a box to be ticked – if completing this electronically use an X in the box if that is easier.
Local authority contact details
Please complete the details below:
Local authority
Contact name
Department
Telephone number
E-mail address
Who contributed to the completion of this questionnaire? (please provide name of officer(s) and their department)
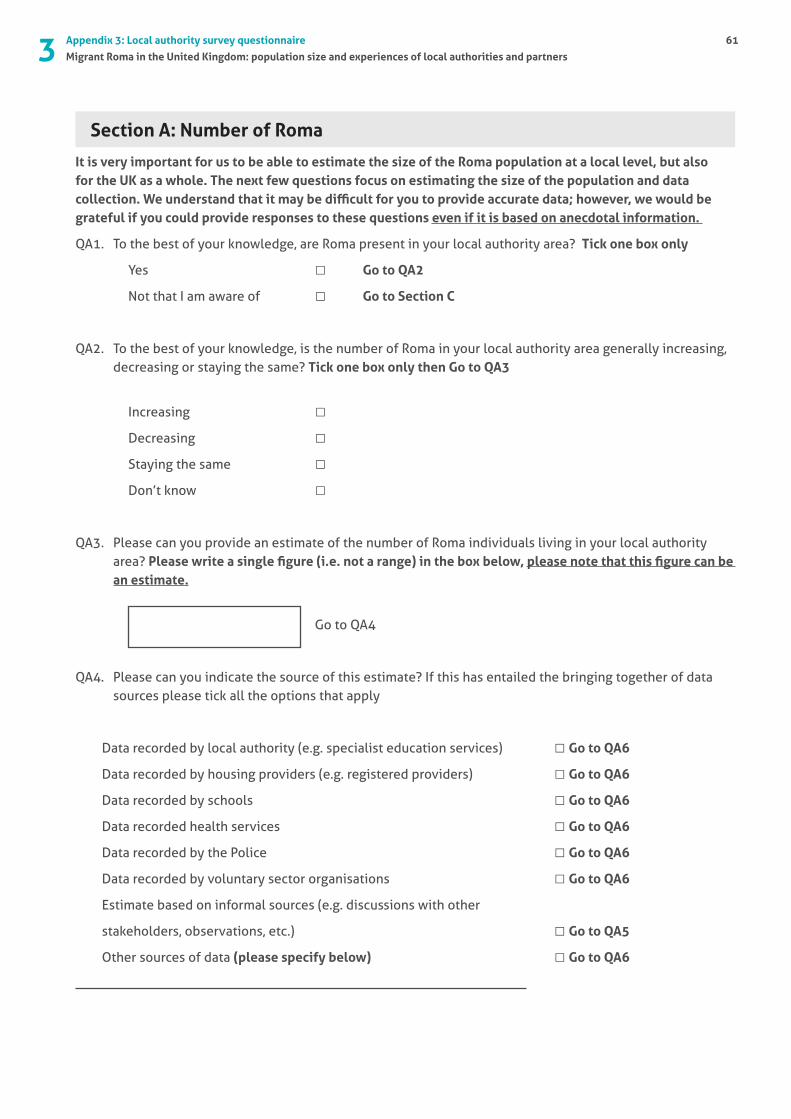
3 Appendix 3: Local authority survey questionnaire
Migrant Roma in the United Kingdom: population size and experiences of local authorities and partners
61
Section A: Number of Roma
It is very important for us to be able to estimate the size of the Roma population at a local level, but also for the UK as a whole. The next few questions focus on estimating the size of the population and data collection. We understand that it may be difficult for you to provide accurate data; however, we would be grateful if you could provide responses to these questions even if it is based on anecdotal information.
QA1. To the best of your knowledge, are Roma present in your local authority area? Tick one box only
Yes □ Go to QA2
Not that I am aware of □ Go to Section C
QA2. To the best of your knowledge, is the number of Roma in your local authority area generally increasing, decreasing or staying the same? Tick one box only then Go to QA3
Increasing □
Decreasing □
Staying the same □
Don’t know □
QA3. Please can you provide an estimate of the number of Roma individuals living in your local authority area? Please write a single figure (i.e. not a range) in the box below, please note that this figure can be an estimate.
Go to QA4
QA4. Please can you indicate the source of this estimate? If this has entailed the bringing together of data sources please tick all the options that apply
Data recorded by local authority (e.g. specialist education services) □ Go to QA6
Data recorded by housing providers (e.g. registered providers) □ Go to QA6
Data recorded by schools □ Go to QA6
Data recorded health services □ Go to QA6
Data recorded by the Police □ Go to QA6
Data recorded by voluntary sector organisations □ Go to QA6
Estimate based on informal sources (e.g. discussions with other
stakeholders, observations, etc.) □ Go to QA5
Other sources of data (please specify below) □ Go to QA6
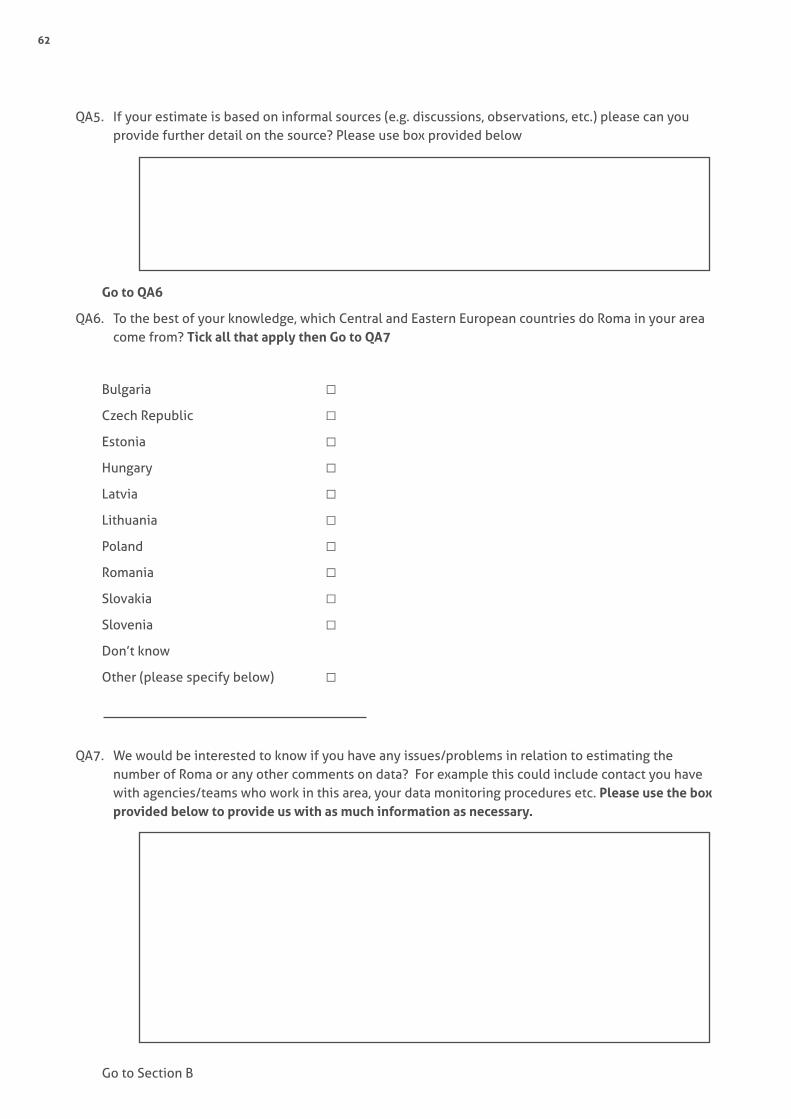
62
QA5. If your estimate is based on informal sources (e.g. discussions, observations, etc.) please can you provide further detail on the source? Please use box provided below
Go to QA6
QA6. To the best of your knowledge, which Central and Eastern European countries do Roma in your area come from? Tick all that apply then Go to QA7
Bulgaria □Czech Republic □Estonia □Hungary □Latvia □Lithuania □Poland □Romania □Slovakia □Slovenia □Don’t know
Other (please specify below) □
QA7. We would be interested to know if you have any issues/problems in relation to estimating the number of Roma or any other comments on data? For example this could include contact you have with agencies/teams who work in this area, your data monitoring procedures etc. Please use the box provided below to provide us with as much information as necessary.
Go to Section B
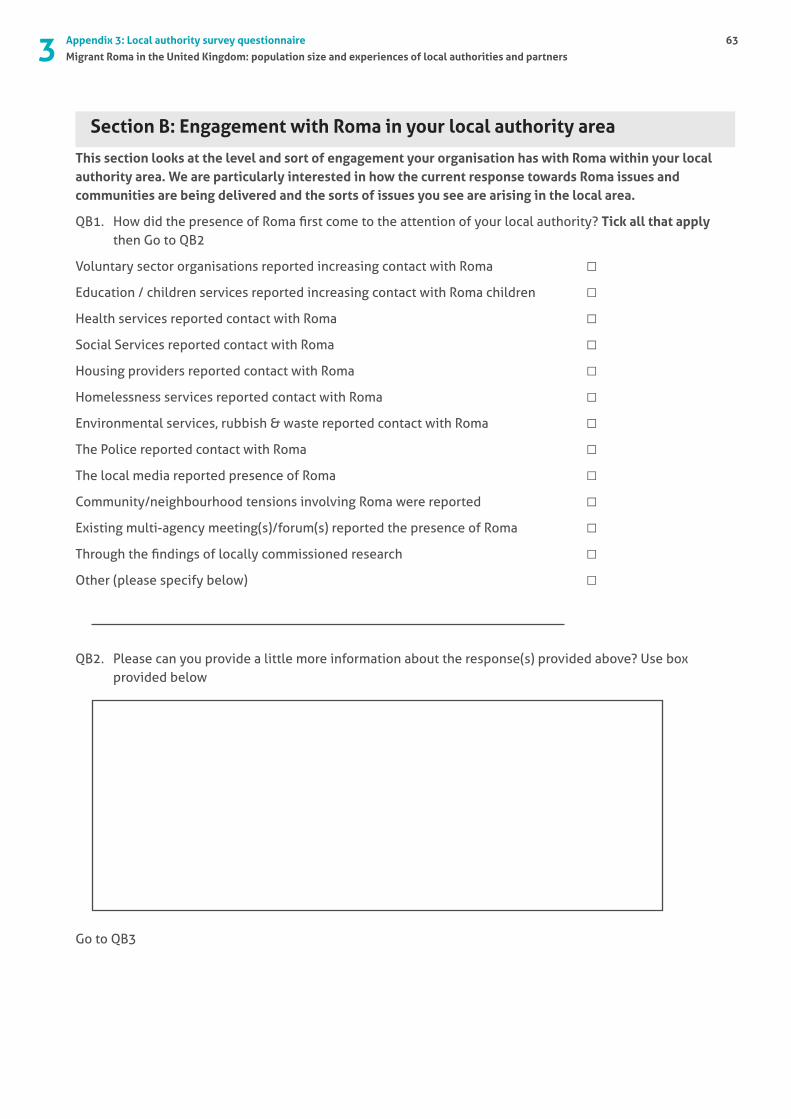
3 Appendix 3: Local authority survey questionnaire
Migrant Roma in the United Kingdom: population size and experiences of local authorities and partners
63
Section B: Engagement with Roma in your local authority area
This section looks at the level and sort of engagement your organisation has with Roma within your local authority area. We are particularly interested in how the current response towards Roma issues and communities are being delivered and the sorts of issues you see are arising in the local area.
QB1. How did the presence of Roma first come to the attention of your local authority? Tick all that apply then Go to QB2
Voluntary sector organisations reported increasing contact with Roma □Education / children services reported increasing contact with Roma children □Health services reported contact with Roma □Social Services reported contact with Roma □Housing providers reported contact with Roma □Homelessness services reported contact with Roma □Environmental services, rubbish & waste reported contact with Roma □The Police reported contact with Roma □The local media reported presence of Roma □Community/neighbourhood tensions involving Roma were reported □Existing multi-agency meeting(s)/forum(s) reported the presence of Roma □Through the findings of locally commissioned research □Other (please specify below) □
QB2. Please can you provide a little more information about the response(s) provided above? Use box provided below
Go to QB3
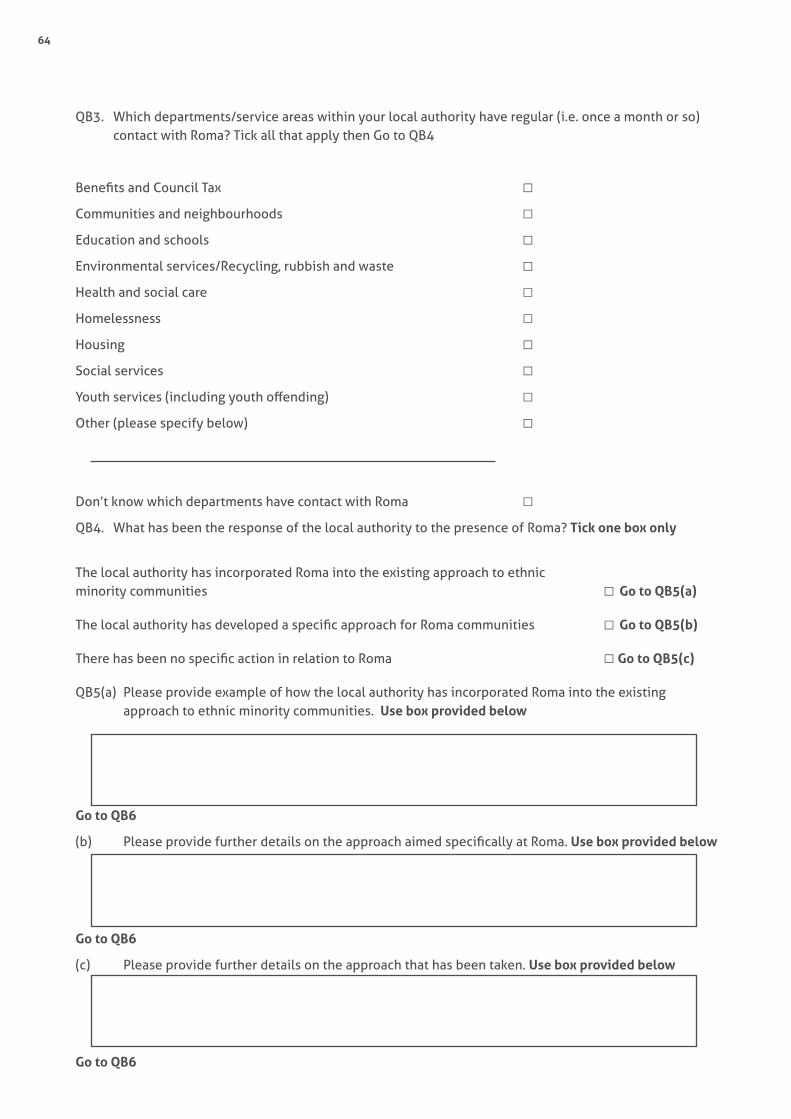
64
QB3. Which departments/service areas within your local authority have regular (i.e. once a month or so) contact with Roma? Tick all that apply then Go to QB4
Benefits and Council Tax □Communities and neighbourhoods □Education and schools □Environmental services/Recycling, rubbish and waste □
Health and social care □Homelessness □Housing □Social services □Youth services (including youth offending) □Other (please specify below) □
Don’t know which departments have contact with Roma □
QB4. What has been the response of the local authority to the presence of Roma? Tick one box only
The local authority has incorporated Roma into the existing approach to ethnic minority communities □Go to QB5(a)
The local authority has developed a specific approach for Roma communities □Go to QB5(b)
There has been no specific action in relation to Roma □ Go to QB5(c)
QB5(a) Please provide example of how the local authority has incorporated Roma into the existing approach to ethnic minority communities. Use box provided below
Go to QB6
(b) Please provide further details on the approach aimed specifically at Roma. Use box provided below
Go to QB6
(c) Please provide further details on the approach that has been taken. Use box provided below
Go to QB6
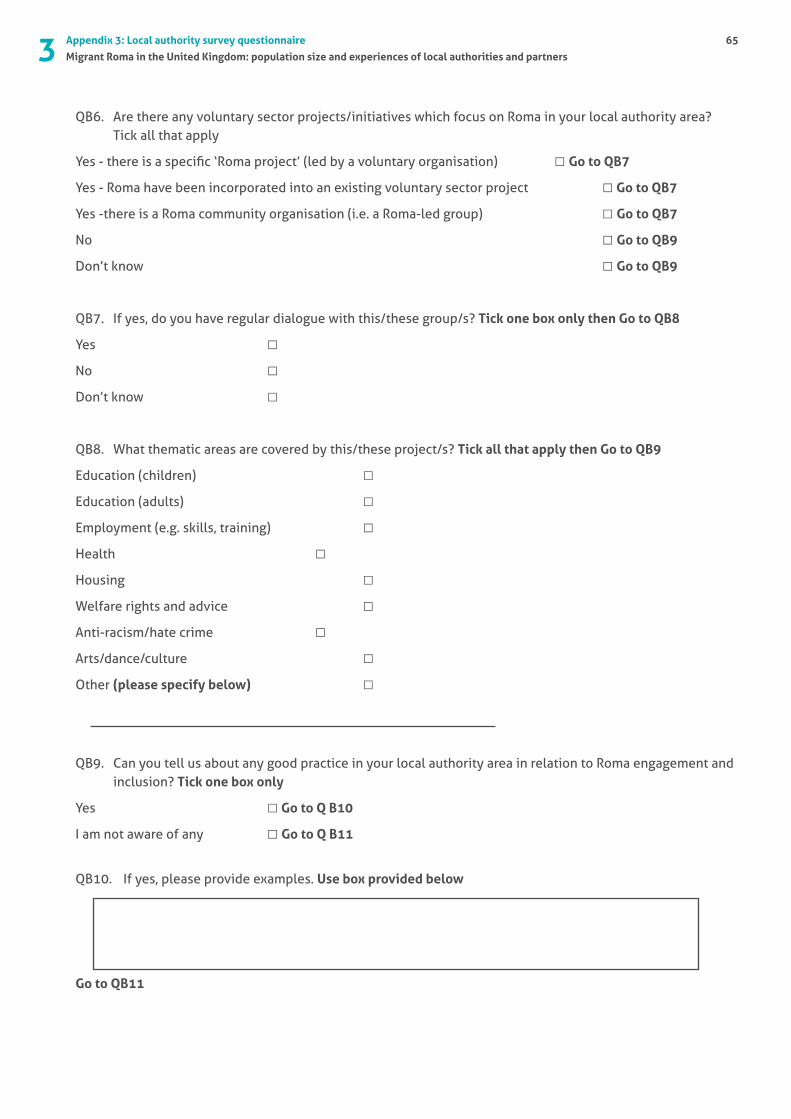
3 Appendix 3: Local authority survey questionnaire
Migrant Roma in the United Kingdom: population size and experiences of local authorities and partners
65
QB6. Are there any voluntary sector projects/initiatives which focus on Roma in your local authority area? Tick all that apply
Yes - there is a specific ‘Roma project’ (led by a voluntary organisation) □ Go to QB7
Yes - Roma have been incorporated into an existing voluntary sector project □ Go to QB7
Yes -there is a Roma community organisation (i.e. a Roma-led group) □ Go to QB7
No □ Go to QB9
Don’t know □ Go to QB9
QB7. If yes, do you have regular dialogue with this/these group/s? Tick one box only then Go to QB8
Yes □
No □Don’t know □
QB8. What thematic areas are covered by this/these project/s? Tick all that apply then Go to QB9
Education (children) □Education (adults) □Employment (e.g. skills, training) □Health □Housing □Welfare rights and advice □
Anti-racism/hate crime □Arts/dance/culture □Other (please specify below) □
QB9. Can you tell us about any good practice in your local authority area in relation to Roma engagement and inclusion? Tick one box only
Yes □ Go to Q B10
I am not aware of any □ Go to Q B11
QB10. If yes, please provide examples. Use box provided below
Go to QB11
66
QB11. Does your local authority have any policies or strategies that refer specifically to Roma? (e.g. BME or Gypsy, Roma and Traveller strategies, etc.) Tick one box only
Yes – we have strategies/policies that refer specifically to Roma □ Go to Q B12
Not that I am aware of □ Go to Q B13
QB12. If yes, please provide details. Use box provided below
Go to QB13
QB13. Has the reduction in public spending changed the approach to Roma communities in your local authority area? Tick one box only
Yes □ Go to Q B14
Not that I am aware of □ Go to Section C
QB14. If yes, in what way? Use box provided below
Go to Section C
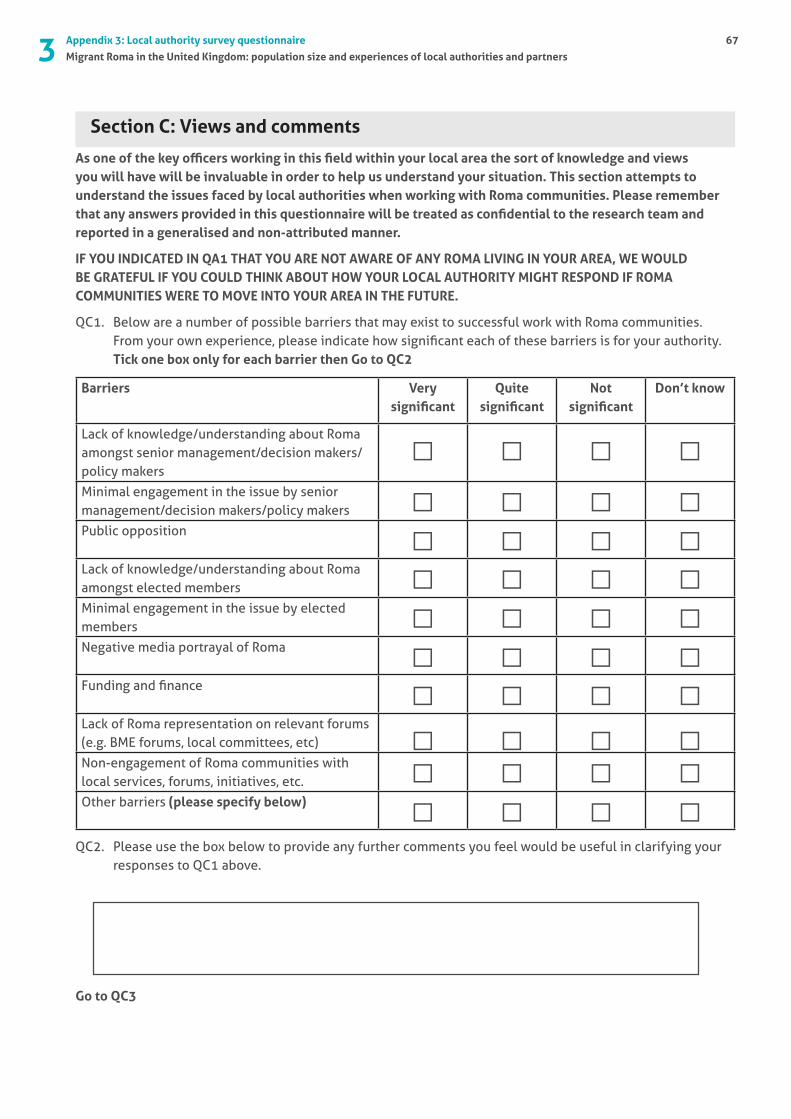
3 Appendix 3: Local authority survey questionnaire
Migrant Roma in the United Kingdom: population size and experiences of local authorities and partners
67
Section C: Views and comments
As one of the key officers working in this field within your local area the sort of knowledge and views you will have will be invaluable in order to help us understand your situation. This section attempts to understand the issues faced by local authorities when working with Roma communities. Please remember that any answers provided in this questionnaire will be treated as confidential to the research team and reported in a generalised and non-attributed manner.
IF YOU INDICATED IN QA1 THAT YOU ARE NOT AWARE OF ANY ROMA LIVING IN YOUR AREA, WE WOULD BE GRATEFUL IF YOU COULD THINK ABOUT HOW YOUR LOCAL AUTHORITY MIGHT RESPOND IF ROMA COMMUNITIES WERE TO MOVE INTO YOUR AREA IN THE FUTURE.
QC1. Below are a number of possible barriers that may exist to successful work with Roma communities. From your own experience, please indicate how significant each of these barriers is for your authority. Tick one box only for each barrier then Go to QC2
Barriers Very significant
Quite significant
Not significant
Don’t know
Lack of knowledge/understanding about Roma amongst senior management/decision makers/policy makers
□ □ □ □Minimal engagement in the issue by senior management/decision makers/policy makers □ □ □ □Public opposition □ □ □ □Lack of knowledge/understanding about Roma amongst elected members □ □ □ □Minimal engagement in the issue by elected members □ □ □ □Negative media portrayal of Roma □ □ □ □Funding and finance □ □ □ □Lack of Roma representation on relevant forums (e.g. BME forums, local committees, etc) □ □ □ □Non-engagement of Roma communities with local services, forums, initiatives, etc. □ □ □ □Other barriers (please specify below) □ □ □ □
QC2. Please use the box below to provide any further comments you feel would be useful in clarifying your responses to QC1 above.
Go to QC3
68
QC3. If you could make three recommendations to the study team about the needs of local authorities and partners working with Roma in your area, what would they be? Please use the spaces provided below and the Go to QC4
1.
2.
3.
QC4. Are there any other comments you would like to make about the presence of Roma communities in your local authority area? Please use box provided below
Further contact
1. In addition to carrying out a nationwide survey, we are also contacting a number of local authorities to arrange further discussions in order to gain a more in depth understanding of Roma inclusion at the local level. If the University of Salford wanted to contact you again to take part in additional consultation, would you be happy for us to do so?
Yes □
No □
2. The University of Salford, along with our partner, Migration Yorkshire, are setting up a national network of local authorities and key organisations to help ensure a joined up approach to Roma inclusion in the UK.
Would you be happy for the University of Salford and/or Migration Yorkshire to contact you in relation to setting up a national network?
Please note that your contact details will remain separate from the responses in this questionnaire.
Yes - please include me in the National Network □No - please do not include me in the National Network □
THANK YOU VERY MUCH

Appendix 4:
Question guide

70
Appendix 4: Question guide for key informant interviews
Interviews with local authorities with Roma in the area
1. The survey completed by a representative of your local authority indicated that there were an estimated [insert number] Roma living in this area. What do you think of this number? Is it an accurate reflection in your experience? If not, why not? If yes, why do you think this? If speaking to person who completed the survey – Can you provide more information on how you determined this response? (refer to original questionnaire and say that they indicated x, y and z – but would ask for further detail about the process if not clear from the survey)
2. The survey suggested that the presence of Roma first came to attention of authority due to x, y and z. Can you take me through how the local authority responded when first made aware of Roma in the area?
3. Has the way in which you work with Roma changed over time?
4. From your experience/understanding, what are the key issues that have arisen due to the presence of Roma (if any)?
a. Prompts:
• Community relations
• Health
• Education
• Work
• Language
5. Are these issues being responded to? If not, why not?
6. From your experience/understanding, what are the issues/barriers that Roma face (if any)?
a. Prompts:
• Community relations
• Health
• Education
• Work
• Language
7. Are these issues being responded to? If not, why not?
8. Are there any gaps in relation to work with Roma communities in your area? Is there anything you need you don’t have in order to address issues arising? If yes, what? Who should address these gaps?
9. The survey indicated that the number of Roma is likely to [increase, decrease or stay the same]. What are your views on this? Is it an accurate reflection in your experience? If not, why not? If yes, why do you think this? What impact (if any) will this have in your area?
a. If person who completed survey, why did they provide that response. What impact (if any) will this have in your area?
10. What’s the relationship like with key partners in the area?
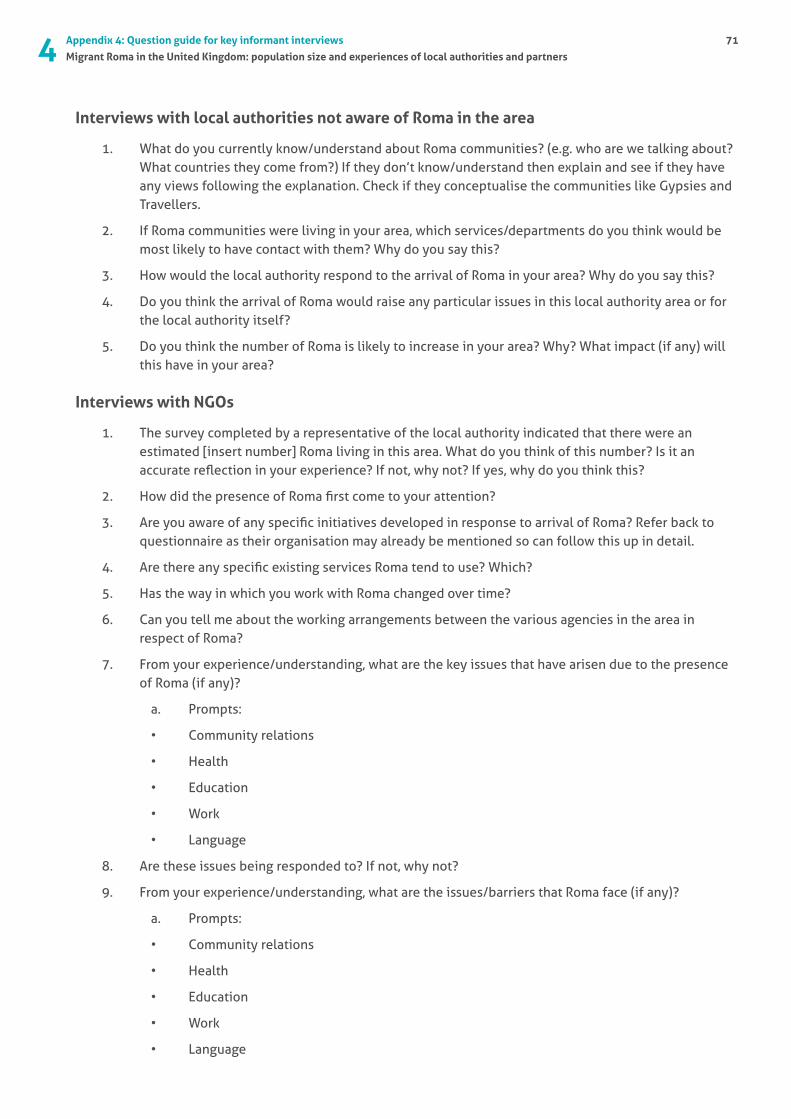
4 Appendix 4: Question guide for key informant interviews
Migrant Roma in the United Kingdom: population size and experiences of local authorities and partners
71
Interviews with local authorities not aware of Roma in the area
1. What do you currently know/understand about Roma communities? (e.g. who are we talking about? What countries they come from?) If they don’t know/understand then explain and see if they have any views following the explanation. Check if they conceptualise the communities like Gypsies and Travellers.
2. If Roma communities were living in your area, which services/departments do you think would be most likely to have contact with them? Why do you say this?
3. How would the local authority respond to the arrival of Roma in your area? Why do you say this?
4. Do you think the arrival of Roma would raise any particular issues in this local authority area or for the local authority itself?
5. Do you think the number of Roma is likely to increase in your area? Why? What impact (if any) will this have in your area?
Interviews with NGOs
1. The survey completed by a representative of the local authority indicated that there were an estimated [insert number] Roma living in this area. What do you think of this number? Is it an accurate reflection in your experience? If not, why not? If yes, why do you think this?
2. How did the presence of Roma first come to your attention?
3. Are you aware of any specific initiatives developed in response to arrival of Roma? Refer back to questionnaire as their organisation may already be mentioned so can follow this up in detail.
4. Are there any specific existing services Roma tend to use? Which?
5. Has the way in which you work with Roma changed over time?
6. Can you tell me about the working arrangements between the various agencies in the area in respect of Roma?
7. From your experience/understanding, what are the key issues that have arisen due to the presence of Roma (if any)?
a. Prompts:
• Community relations
• Health
• Education
• Work
• Language
8. Are these issues being responded to? If not, why not?
9. From your experience/understanding, what are the issues/barriers that Roma face (if any)?
a. Prompts:
• Community relations
• Health
• Education
• Work
• Language

72
10. Are these issues being responded to? If not, why not?
11. Are there any gaps in relation to work with Roma communities in your area? If yes, what? Who should address these gaps?
12. Do you think the number of Roma is likely to increase, decrease or stay the same? Why? What impact (if any) will this have in your area?
Appendix 5: Methodology
74
Appendix 5: A methodology for making an UK Roma population estimate
What is the challenge of making a population estimate from the survey sample?
To obtain a reasonably reliable estimate of the size of the Roma community nationwide, simple extrapolation from the figures that were supplied is inadequate. Given what we know about the settlement patterns of migrant communities (and Roma in particular), missing a return from a large metropolitan borough is likely to have a ‘drag factor’ on the overall total as compared to the absence of a small rural district. This is complicated by the existence of extant communities, current work opportunities, present-day and historical government policies, etc. As this study has not included direct statistical sampling of Roma, it is not possible to utilise or adapt the methodologies associated with projects which have adopted this approach such as EU Midis (European Union Agency for Fundamental Rights, 2009 - ongoing) or other similar projects.
What adaptations are required to make a population estimate?
As the analysis showed, the surveys received together covered areas home to over half of all the UK’s population, but greater proportions were obtained from certain types of authority as well as particular geographical regions. Similar patterns were observed when it came to those authorities that confirmed awareness of Roma in their area and provided numerical estimates.
This provided an opportunity to investigate whether the characteristics of those authorities which did provide estimates could be used as a simple proxy for the probable location and size of Roma among those which did not. In effect, we were looking to develop a series of ‘place typologies’ for the locations the survey had revealed Roma to be present in, and search for local authorities with matching or comparable typologies. Sophisticated versions of this kind of ‘geo-demographic classification’ have had an extensive usage in marketing but its application has expanded markedly in areas such as social science over the past decade21.
Given the nature of the exercise, any profiles needed to be robust and based on a reasonably broad assemblage of socio-demographic data. One resource that does enable users to generate detailed profiles of individual local authorities and calculate those with similar status is the CIPFA ‘Nearest Neighbours’ benchmarking tool. This was historically used by the Audit Commission to judge the performance of an individual local authority by assessing the status (and progress) of statistically comparable authorities. It is, therefore, an accepted and tested process for matching areas based on the similarities of their socioeconomic and demographic profile. Comparators are defined by their statistical ‘closeness’ to the principal authority, something that is calculated by looking at the quantifiable difference between key datasets on aspects such as income, employment rates, number of children gaining a set number of GCSEs etc., and producing an overall figure on a spectrum between 0-1. The tool allows users to select an individual authority and then generate the fifteen closest comparator authorities.
By using the ‘Nearest Neighbours’ resource we were able to select authorities for which we did not receive an estimate and search for the closest match on a detailed set of 27 indicators, which included population size, number of households, per cent belonging to ethnic minorities, the indices of multiple deprivation, etc. For English local authorities this included:
• metropolitan authorities
• inner and outer London boroughs
• unitary authorities
• Non-metropolitan Districts
• county councils
21See Harris, R., Sleight, P. & Webber, R. (2005). Geodemographics, GIS and Neighbourhood Targeting. Chichester: Wiley.
5 Appendix 5: A methodology for making an UK Roma population estimate
Migrant Roma in the United Kingdom: population size and experiences of local authorities and partners
75
NB ‘Nearest Neighbours’ only allows Scottish and Welsh authorities to be compared to others within their national boundary.
In summary, Roma population estimates for all individual local authorities were obtained using one of two methods:
a) Numerical figures of Roma population supplied in survey returns. These were taken at face value, and consequently did not require the use of the CIPFA tool. They are termed ‘primary’ estimates.
b) Estimates generated by comparison exercise using the CIPFA tool (secondary estimates). This was undertaken for all remaining local authorities, generating the 15 ‘statistically closest’ for each authority. Where that included local authorities which had supplied primary estimates these were used as population comparators to generate a ‘secondary’ estimate.
Where the above options did not exist an estimate was not generated. A potential defect in this technique arises where no comparators (or only one) with existing estimates are generated, making any assessment practically impossible. However even this non-appearance can be built into a future model as it provides an opportunity to classify or band authorities into types even where direct counts are unavailable as:
1. very likely to have a Roma population exceeding 1000 individuals
2. likely to have a population over 500 but under 1000
3. likely to have a small Roma population
4. unlikely to have a Roma population
5. very unlikely to have a Roma population
- and then subcategorise each as ‘population likely to increase’ ‘population likely to remain static’ or ‘population likely to decrease’. This is significant because many of the comparisons undertaken for the 51 who had provided estimates generated repeat appearances of a number of authorities who had not provided an estimate themselves. Conversely when those authorities were individually assessed they were often strongly associated with areas which had provided notable estimates. Circumstantially this suggested such areas would be likely or very likely to have a Roma population.
Using the technique described above, we can apply a provisional population estimate of Roma in areas which lack comparable data. This process can be repeated building up an overall aggregate figure across the UK.
What are the shortcomings of this approach?
Utilising this approach for assessing the size of Roma populations does, however, rely on the assumption that the baseline characteristics of one area where Roma are present are markers for their presence in similar areas. This poses further questions such as: If such characteristics are not adequate markers for this type of exercise how can more suitable indicators be developed? How can settlement choices made by members of an atypical immigrant community be mapped over an extended time period? Can the multitude of socio-economic measures used in national modelling applications (often used to track deprivation) work effectively around ethnicity and migration?
It does not take into account the range of human factors which influence settlement choice or possible aspirations among new migrants to join an existing community. Nor does this model acknowledge that before 2004, Roma seeking asylum had no choice about where they were initially settled, a factor which may well have determined later patterns of residence, even when freedom of movement became available. Lastly, it does not (and indeed almost certainly cannot) allow for the well-known patterns of multiple residence among Roma in the UK, as individuals and families move between a number of different locations for reasons of work, housing choice etc., without exclusively adopting a single home. In short is this mechanism one that can produce reliable measure of settlement patterns among CEE Roma?
76
Necessarily then, confidence in the final estimate is affected by a number of issues, several of which are discussed above. The procedural approach of targeting chief executives / equality leads of the survey meant that in many cases the response was not supplied by a research / data officer with experience of data management, nor was estimate scientifically validated. Furthermore, the estimates that were made were based on differing sources, or purely anecdotal assessments. Therefore, the figure proposed in this report must be preliminary and in attempting a UK estimate of central and Eastern European Roma we argue that for the future any similar survey must be accompanied by direct statistical sampling in the absence of other sources. All of these concerns have the potential to be explored in future research.
How can this be improved in the future?
Despite potential shortcomings the model appears to work when we test it by calculating an estimate for local authorities which are known to have large Roma populations, but did not supply returns for this study. Necessarily this must be treated with some caution but does give the ability to narrow down locations for future focus. This method also potentially provides a valuable tool for future forecasting. Specifically, it could allow us to gain an insight in what types of areas are Roma likely to appear or increase. It presents an opportunity to create an index of overall probability from a suite of indicators. Constructing such an index would require several technical questions to be answered: What are meaningful indicators for this exercise or measuring similar BME/migrant populations? What is a meaningful statistical distance? Should weighting be applied, and if so, on what criteria? It also has the advantage of being able to be ‘back-read’: that is, researchers have the option to return to a particular local authority and look in more depth at other data which may or may not support the provisional estimate, or alternatively to exclude unsafe previous counts.