Embed Size (px)
Citation preview
MIDWIFERY IN NEW ZEALAND: GOVERNMENT POLICIES, PROVIDER CHOICE, AND HEALTH OUTCOMES
Andrea Kutinova* Department of Economics University of Canterbury
New Zealand
May 2008
Preliminary draft
* E-mail contact: [email protected]
I would like to thank Andrew Cullen from the Medical Council of New Zealand, Robert Hipkiss and Rebecca Hislop from the New Zealand Health Information Service, Don Simmers from the New Zealand Medical Association, and Frances Townsend from the Royal New Zealand College of General Practitioners for their help in obtaining data for this paper. I am also grateful to Karen Conway, Lynda Exton, William Ferguson, Vladimir Mencl and Bob Reed for their comments and support.
1
Abstract In New Zealand, about 80% of deliveries are fully taken care of by a midwife. This is at least partly due to government policies of the 1990’s financially favouring midwives. Following a series of reforms, a lead maternity carer (LMC) system was introduced in 1996. Under this system, each pregnant woman receives a fixed-dollar voucher from the government and chooses an LMC for her pregnancy and delivery: a midwife, a general practitioner (GP), or a specialist. This paper investigates the health care labour market changes following the introduction of LMCs (using data from 1998-2004) and evaluates the impact on birth outcomes (in 2003-2006). Importantly, the data identifies the LMC at first registration, i.e., the carer selected at the beginning of pregnancy. This is analogous to the intent-to-treat approach and removes much of the non-random selection in provider choice. Any remaining endogeneity is addressed in instrumental variable analyses. The findings indicate that the reforms of the 1990s lead to an increase in the number of direct-entry midwives and a reduction in the number of GPs providing maternity care. Controlling for observable individual and regional characteristics, GPs have a significantly greater percentage of very low birth weight babies but a lower neonatal mortality rate. When selection of LMCs along unobservable characteristics is controlled for, the GPs’ detrimental effects disappear but the beneficial effects in terms of reduced neonatal deaths persist. Given New Zealand’s social, economic, and demographic characteristics, lessons learned from the local natural experiment are applicable far beyond the region. JEL code: I18
2
1. Background
In New Zealand, about 80% of deliveries are currently fully taken care of by a
midwife. This outcome is at least partly due to government policies of the 1990’s
which started financially favouring midwives. In particular, in 1990, the government
passed the Nurses Amendment Act which permitted independent midwifery practice
(previously, supervision by a doctor had been required) and set reimbursement for
midwifery services at the same level as for general practice (GP) services1. The
rhetoric was mostly feministic. For example, Guilliland (1999) writes: “[…] giving
midwives, general practitioners and obstetricians equal status in the provision of
services around childbirth was a major triumph for women in general and the women
dominant profession of midwifery. […] New Zealand has seen the triumphant, if often
difficult, re-emergence of a women's profession on its own merits and provides a role
model for other countries in their fight against gender inequities.”
In 1995, direct-entry midwifery courses not requiring a nursing background were
introduced and started offering a ‘Bachelor of Midwifery’ degree. Finally, in 1996, a
lead maternity carer (LMC) system was established. Under this system, each
pregnant woman essentially receives a fixed-dollar voucher from the government and
chooses a lead maternity carer for her pregnancy and delivery: a midwife, a general
practitioner, or a specialist obstetrician. Midwives and general practitioners are not
allowed to charge an extra fee while an obstetrician can charge between NZ$300 and
NZ$2,000 to women who do not have a referral for complications (Guilliland 1999).
An LMC is supposed to be selected at the beginning of pregnancy (but can later be
changed) and plays an important role in the prenatal period as well as at delivery and
1 At NZ$120/hour initially which was later reduced to NZ$90/hour.

3
in the postpartum period of up to four weeks: “A Lead Maternity Carer or LMC is
chosen by the woman and is responsible for assessing her needs, planning her care
with her and for ensuring the provision of services she might need during her
pregnancy and birth. The LMC is also expected to be fully involved in her care
throughout this time.” (Cole 2007) While a woman can select ‘shared care’ and use
multiple providers, she has to nominate one of them as her LMC and this person is
expected to provide the majority of care as well as to coordinate care provided by the
others. (Cole 2007) Also, the primary LMC holds the voucher/fixed budget for each
pregnancy and has to decide how to subcontract individual tasks if shared care is
selected. (RNZCGP 2005)
The above changes to the maternity services provision have caused a heated debate in
New Zealand. Proponents view the new policies as a welcomed move away from
‘medicalization’ of childbirth towards its ‘humanization’ and often contrast the new
system in New Zealand with systems in other developed countries, particularly the
United States. (Guilliland 1999; Page 2001; Carr 2004) Others acknowledge a lack of
solid evidence on the health effects of the new policies but point to generally
improving pregnancy outcomes. (English in Smith 1998; HFA 2000) Opponents of
the reforms argue that government financing is unjustifiably skewed in favour of
midwives and point to the exodus of general practitioners from maternity care.
(NZGPA 1997; Perry 1998; The National Health Committee 1999; RNZCGP 1999;
Hill 2002; RNZCGP 2002; Bassett 2005; Roy 2005; Fitchett 2006; Simmers 2006;
Douglas 2006, 2007) They also caution that there is no evidence on the effects of the
new policies on pregnancy outcomes and fear these may be adversely affected.
(Ferguson 1998; The National Health Committee 1999; RNZCGP 1999; Ferguson in
4
Hill 1998 and Coursey 2007) Some have explicit reservations to the direct-entry
midwifery courses. (O’Connor 2006)
Despite this passionate debate, there is almost no solid theoretical and empirical
analysis of the consequences of the new maternity care policies. Recently, in reaction
to a couple of perinatal deaths, a Perinatal and Maternal Mortality Review Committee
has been set up and its main goal is to evaluate birth outcomes in New Zealand. The
committee has so far been unable to find reliable evidence and called for
improvements in data collection in the near future. (PMMRC 2005)
International studies using qualitative (Gabay and Wolfe 1997), descriptive/cross-
sectional (Oakley et al. 1996; Mehl-Madrona and Mehl-Madrona 1997; Rosenblatt at
al. 1997; MacDorman and Singh 1998; Murphy and Fullerton 1998; Guilliland 1999;
Davidson 2002; Janssen at al. 2002; Johnson and Daviss 2005; Janssen et al. 2007),
panel data (Miller 2006), and randomized control trial (Waldenstrom and Turnbull
1998; Waldenstrom et al. 2001) techniques tend to find less expensive care and fewer
medical interventions among midwives as compared to doctors and there is little
evidence of compromised health outcomes.
Unfortunately, most of the previous studies treat the choice of prenatal care provider
as exogenous rather than explicitly recognizing that women select providers based on
their own observable and unobservable characteristics.2 The paper by Miller (2006)
represents a notable exception. In particular, the author uses a reduced form
methodology in which midwifery reimbursement laws (varying across U.S. states and
2 Even clinical trials do not achieve full randomization as long as providers self-select into a study team.

5
over time) serve as a determinant of provider choice (midwifery market share), the
use of medical interventions, and infant and maternal health. Using this method, she
removes the selection bias in provider choice due to unobserved differences in
women’s health or tastes and finds that more generous midwifery reimbursement laws
increase midwifery market share, do not affect the rate of C-sections, maternal
mortality, infant birth weight and Apgar scores but significantly reduce neonatal and
infant mortality. Unfortunately, Miller (2006) has no information on prenatal care
provider during pregnancy and so relies on ‘attendant at birth’ as a measure of
midwifery market share. As the author herself acknowledges, this is a limitation of
the study and an ‘intent-to-treat’ approach would be preferable.
All in all, previous literature suggests that midwives may be successful in providing a
more cost-effective care for normal pregnancies. However, this result is based on
data from countries in which less than 10% of women (mostly affluent and with the
least risky pregnancies) exclusively utilize midwifery services. Is this finding robust
to adding marginal pregnancies (e.g., older mothers, women with medical risk factors
and/or lower socio-economic status) and potentially marginal caregivers (such as
direct-entry midwives) into the analysis?
The contribution of the current paper is to rigorously evaluate the ‘midwifery
advantage’ in the New Zealand context in which midwifery is the dominant form of
care for pregnant women. The paper investigates the health care labour market
changes following the enactment of the new policies in the 1990s and evaluates the
long-term impact of these changes on birth outcomes. Importantly, the data available
enables me to focus on the lead maternity carer at first registration, i.e., the carer

6
selected at the beginning of pregnancy. This is a significant advantage over major
international datasets (such as the U.S. Natality Detail Files used in Miller (2006))
where only information on the attendant at birth is available. Focusing on first
registration is analogous to the intent-to-treat approach used in health economics and
public health literatures and removes much of the non-random selection in provider
choice. Any remaining endogeneity is discussed and addressed in instrumental
variable analyses.
2. Medical Workforce
Using data from the New Zealand Health Information Service Workforce Statistics
(NZHIS 2007a) for years 1998-2004 (the earliest period available), this section
documents some of the health care labour market changes following the enactment of
the new policies in the 1990s.
The NZHIS collects data on the number of active3 nurses and midwives (nurse
midwives and direct-entry midwives can be separately identified) and general
practitioners and specialists.4 Unfortunately, data on general practitioners is grossly
aggregated and, to my knowledge, it is impossible to identify general practitioners
offering maternity services. Since GP obstetricians represent a small fraction of the
general practitioner workforce, the NZHIS statistics for general practitioners cannot
be used in an analysis of maternity workforce trends.
3 An ‘active’ medical practitioner has to hold a current practising certificate and report working in his/her profession on an annual workforce survey. 4 Pre-2005 data on nurses and midwives had been supplied by the Nursing Council of New Zealand and data on general practitioners and specialists comes from the New Zealand Medical Council.

7
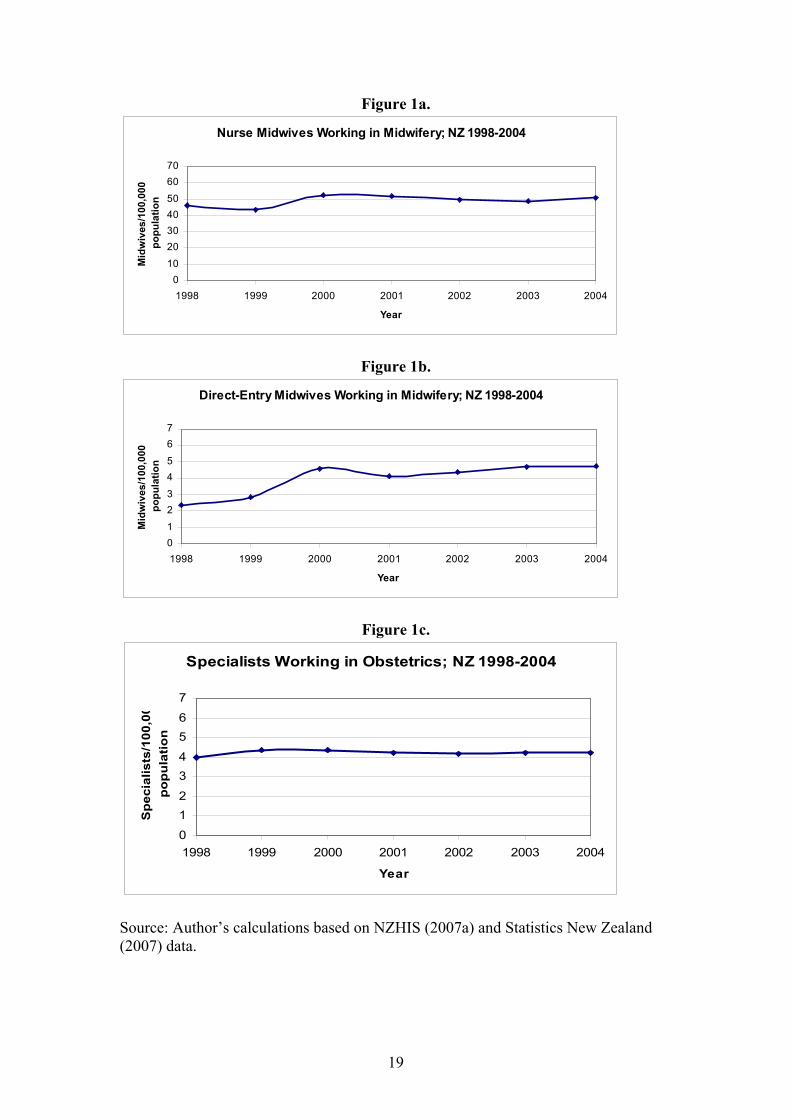
Figures 1a-1c show the practitioner/population ratios for years 1998-2004 for nurse
midwives, direct-entry midwives, and specialist obstetricians, respectively.5 While
the number of nurse midwives was relatively stable at around 50 per 100,000
population, the number of direct-entry midwives doubled during the study period and
reached 5 per 100,000 population in the year 2004. The number of specialist
obstetricians remained slightly above 4 per 100,000 population and since 2002 has
been exceeded by the number of direct-entry midwives. While national data on GP
obstetricians is not available, the general consensus is that their number decreased
substantially. (NZGPA 1997; Perry 1998; The National Health Committee 1999;
RNZCGP 1999; Hill 2002; RNZCGP 2002; Bassett 2005; Roy 2005; Simmers 2006)
Overall, the limited evidence available suggests that the reforms were followed by an
increase in the number of direct-entry midwives and a decline in the number of GP
obstetricians. The number of nurse midwives and specialists remained relatively
stable.
3. Birth Outcomes
What impact did the policy and medical labour market changes have on birth
outcomes? This section uses data from the Maternity and Newborn Information
System (MNIS; provided by NZHIS 2007b) for years 2003-2006 to investigate this
issue.
3.1. Data
5 Population estimates have been obtained from Statistics New Zealand (2007).
8
The MNIS is an annual data series which started in 1998 but until 2002 only recorded
information on about 70% (nonrandomly selected) of pregnancies. An attempt has
been made to collect data on all births since 2003. Therefore, this study only uses
post-2002 data. The study period ends in 2006 – the last year of data available.
The dataset contains information on maternity and newborn services from up to 9
months before and 3 months after a birth collected from two sources: the National
Minimum Dataset (NMDS) with information on inpatient events and HealthPAC with
information on non-hospital events (including home births) reported by LMCs. Under
their terms of payment, LMCs are required to submit to HealthPAC information on
the recipients of their services as well as the nature of care provided. (NZHIS 2006)
The MNIS contains records on 221,007 infants born in years 2003-2006. Because
multiple births face different risks than singleton births and it is usually recommended
that an obstetrician attends a multiple birth, the sample in this study has been limited
to 216,719 singleton babies. Of those, 203,074 had uniquely identifiable pregnancy
records and could be linked to their mothers and 199,901 had a reported LMC at first
registration. Further, I have limited the study sample to 198,837 live births (including
neonatal deaths but not stillbirths). Finally, I only focus on midwives and general
practitioners as LMC providers. Unfortunately, direct-entry midwives and nurse
midwives cannot be separately identified. Specialist obstetricians have been excluded
from the analysis of birth outcomes because it is widely recognized that they serve a
different population of pregnant women than the other LMCs – either complicated
pregnancies referred to them by other providers or very health cautious and relatively
affluent women who choose an obstetrician and are willing to pay the NZ$300-
9
NZ$2,000 fee. These restrictions leave me with 185,464 births in the final sample:
175,550 with a midwife and 9,914 with a general practitioner as their LMC at first
registration.
3.2. Descriptive Statistics
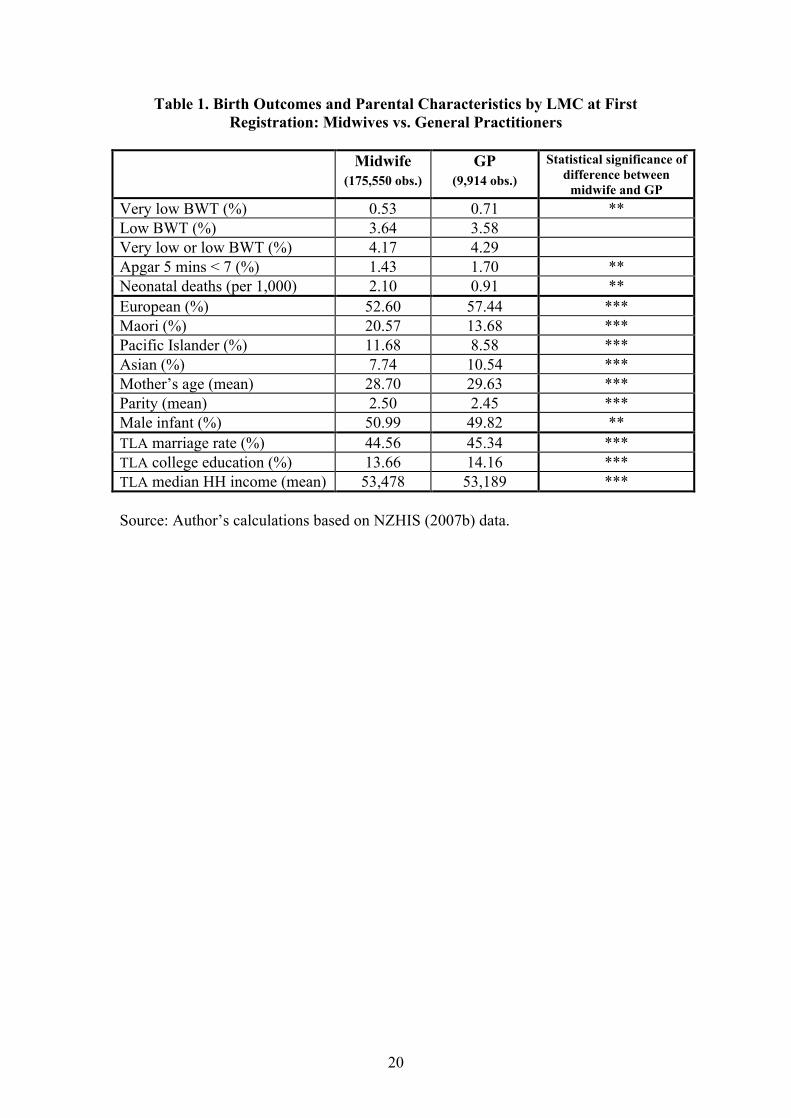
Table 1 compares the average birth outcomes and individual and Territorial Local
Authority (TLA) characteristics of women choosing a midwife or a general
practitioner as the LMC at their first registration. Five measures of birth outcomes are
reported: the incidence of very low birth weight (less than 1,500g), low birth weight
(between 1,500 and 2,500g), a sum of the above two (to be used in multivariate
estimations), the incidence of a 5-minute Apgar score of less than 7 (on a 0-10 scale),
and neonatal death6 rate (per 1,000 live births). Maternal characteristics include
ethnicity (European, Maori, Pacific Islander, and Asian), age, and parity (i.e., the
number of births including the current one). Infant gender is also reported. Finally,
while the MNIS data does not contain any socio-economic information, a few socio-
economic characteristics of the mother’s TLA of residence have been merged in from
the 2001 Census. These include: the marriage rate, the percentage of population with
a college degree, and median household income.
The descriptive statistics in Table 1 suggest that women registering with a GP have a
significantly higher percentage of very low birth weight babies than women
registering with a midwife (0.71 vs. 0.53) and also a significantly higher percentage of
babies with an Apgar score of less than 7 (1.70 vs. 1.43). On the other hand, women
6 Neonatal deaths are deaths of live-born babies within 27 days after birth.
10
registering with a midwife face a greater risk of neonatal death than women
registering with a GP (death rates of 2.10 vs. 0.91). The difference in the incidence of
low birth weight is statistically insignificant.
While the above patterns provide interesting initial insights, they need to be
interpreted with caution. In particular, much of the difference between midwives and
GPs observed in Table 1 is likely due to differences in the types of women (both
observable and unobservable) selecting each type of provider. For example, general
practitioners get a higher percentage of European and Asian women than midwives
who disproportionally serve Maori and Pacific Islanders. Also, women registering
with a general practitioner are slightly older and have a lower parity, on average.
Interestingly, women registering with a general practitioner also live in areas (TLAs)
with significantly higher marriage and college education rates but a slightly lower
median household income. Controlling for all of these differences before attributing a
causal effect to LMC choice is crucial.
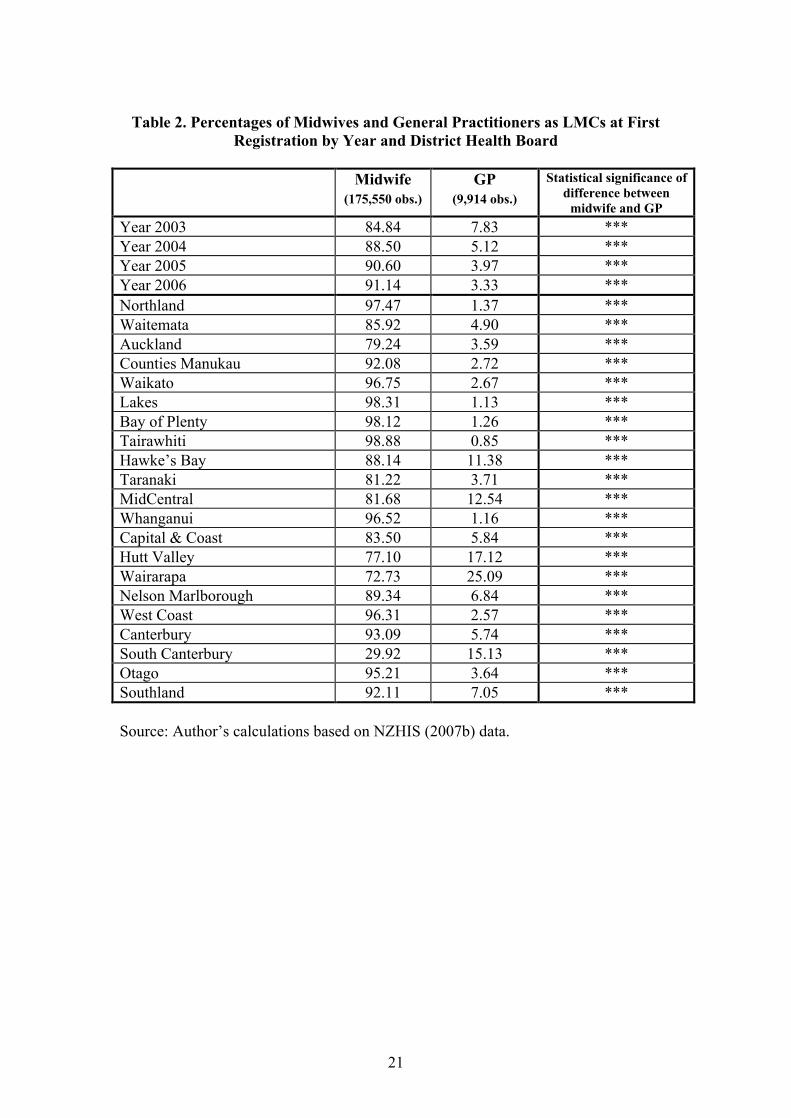
Table 2 shows the distribution of LMC types over time (for years 2003-2006) and
across District Health Boards (DHBs). While midwives have always been the
dominant provider of maternity services in New Zealand, their market share has
recently increased even further. In particular, in the year 2003, 84.84% of mothers in
my sample (before the exclusion of specialists) had a midwife as their LMC at first
registration. By 2006, this percentage has increased to 91.14%. At the same time, the
market share of general practitioner LMCs has been shrinking: from 7.83% in 2003
down to 3.33% in 2006. In addition to this time variation, the market share of
midwives varied greatly across DHB regions. For example, three regions (the Lakes,
11
Bay of Plenty, and Tairawhiti) had over 98% of pregnancies in years 2003-2006
initially registered with a midwife. In one region (South Canterbury) the market share
of midwives was less than 30%. The market share of general practitioners also varied
substantially: between over 25% of first registrations in Wairarapa and less than 1%
in Tairawhiti.
3.3. Main Results
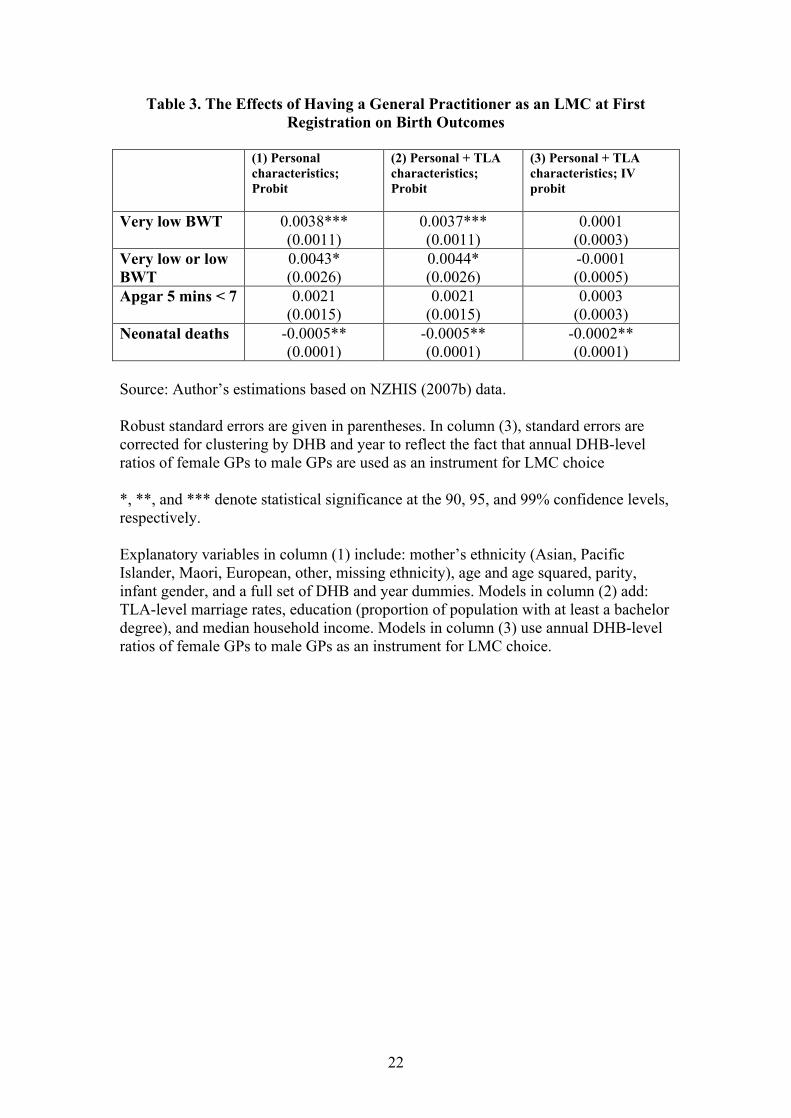
Table 3 reports the relative effects of having a general practitioner (rather than a
midwife) as the LMC at first registration. Column (1) of the table controls for all the
observable individual-level characteristics available in my data - mother’s ethnicity
(Asian, Pacific Islander, Maori, European, other, missing ethnicity), age and age
squared, parity, and infant gender – as well as a full set of DHB and year dummies to
control for time-invariant DHB-specific characteristics and a general time trend,
respectively. Column (2) adds to this list TLA-level marriage rates, education
(proportion of population with at least a bachelor degree), and median household
income. All models in Table 3 have been estimated with a probit and marginal effects
are reported.7 Robust standard are given in parentheses.
Columns (1) and (2) in Table 3 show that even after controlling for women’s
observable characteristics and for TLA-level socio-economic variables, having a
general practitioner as an LMC at first registration is associated with a significantly
higher probability of delivering a very low birth weight baby (when low birth weight
babies are added, the coefficient becomes only marginally significant). Similarly, the
7 Estimating the models with OLS yields very similar results.
12
midwife disadvantage in terms of increased neonatal death rate observed in the
descriptive statistics carries over to the multivariate results. However, caution needs
to be used when interpreting results from the first two columns. Namely, while these
models control for a number of observable individual and TLA characteristics, they
do not remove the potential bias from women’s self-selection into a particular
provider type based on their unobserved characteristics such as the history of medical
complications or their taste for treatment intensity.
The model in column (3) of Table 3 attempts to control for the endogeneity of LMC
choice by using an instrumental variable methodology. In particular, the model is
estimated as a bivariate probit in which LMC choice and health outcomes are both
treated as dependent variables. The predicted probability of choosing a general
practitioner estimated in one of the models is used as an explanatory variable in the
second model of birth outcomes. To do that, I have to use an instrumental variable
which is a strong predictor of LMC choice but does no have a direct impact (i.e., other
than through LMC choice) on the health outcomes of interest. The annual, DHB-level
female-to-male general practitioner ratio (provided by the Medical Council of New
Zealand) seems to fulfil these two conditions. Specifically, previous literature
suggests that women prefer a female obstetrician to a male obstetrician, ceteris
paribus. (Guile et al. 2007) Thus, if a DHB region has a greater relative availability
of female GPs, expecting mothers in that region might be more likely to select a
general practitioner rather than a midwife as their LMC, ceteris paribus. The results
from the LMC choice component of the bivariate probit model (available upon
request) support this hypothesis: the coefficient on a 1-year lag of the female-to-male

13
GP ratio is positive and highly statistically significant.8 At the same time, there is no
obvious reason why the GP gender ratio should have a direct effect on birth outcomes.
To reflect the fact that the instrument for LMC choice only varies by DHB region and
year, standard errors in the bivariate probit are corrected for clustering by DHB/year.
The results in column (3) of Table 3 are quite different from my findings above.
Specifically, after controlling for the endogeneity of LMC choice, having a general
practitioner as the LMC at first registration is no longer associated with inferior birth
weight outcomes. The size of the new coefficients on very low birth weight and low
birth weight is very close to zero and they are highly insignificant. On the other hand,
the greater neonatal death rate among LMC midwives persists even after selection
along unobservable characteristics is controlled for. Specifically, having a general
practitioner rather than a midwife as an LMC significantly reduces the neonatal death
rate by 0.2 per 1,000 live births – a reduction of 10% from the baseline! In the
population of 185,464 babies used in this study, such a reduction would correspond to
37 lives saved.
4. Conclusion
This study provides scientific input into the current New Zealand debate on the
reforms in maternity care as well as contributes to the health economics literature on
midwifery services - and government policies affecting those services - internationally.
The findings indicate that the reforms of the 1990s lead to an increase in the number
of direct-entry midwives and a reduction in the number of GP obstetricians providing
8 The coefficient loses statistical significance at the conventional levels when clustering by DHB region and year is adjusted for.
14
maternity care. Different types of women select midwives and general practitioners
as their LMCs at first registration. Controlling for observable individual and TLA-
level characteristics, GPs have a significantly greater percentage of very low birth
weight babies but a lower neonatal mortality rate. When selection of LMC providers
along unobservable characteristics is controlled for using an instrumental variable
methodology, the GPs’ detrimental effects on birth weight disappear but the beneficial
effects in terms of reduced neonatal deaths persist. In particular, the preferred model
indicates that having a general practitioner as an LMC reduces the neonatal death rate
by 10%. Given New Zealand’s social, economic, and demographic characteristics,
lessons learned from the local natural experiment are applicable far beyond the region.
15
References Bassett, Michael. 2005. “Time to Ditch Patch Warfare,” The Press, November 22. Carr, Anitra. 2004. “Midwifery Care and Women’s Health in New Zealand,” Birthplace Magazine, 42, Jan/Feb. Cole, Sharon. 2007. “Choosing Your Lead Maternity Carer.” [http://www.parentscentre.org.nz/pregnancy_care/lmc.asp; Accessed 9/8/2007] Coursey, Michelle. 2007. “Mums Dying for a Baby,” New Zealand Herald, 28/10. [http://www.nzherald.co.nz/section/story.cfm?c_id=204&objectid=10472501&pnum=0; Accessed 31/10/2007] Davidson, Michele. 2002. “Outcomes of High-Risk Women Cared for by Certified Nurse-Midwives,” Journal of Midwifery and Women’s Health, 47:1, pp. 46-49. Douglas, Bill. 2006. “Review of Maternity Services in New Zealand,” The New Zealand Medical Journal, 119:1229. Douglas, Bill. 2007. “GP Work: What Is It Worth?,” The New Zealand Medical Journal, 120:1249. Ferguson, William. 1998. “Ed. Letters: Fleeing in Droves from Maternity,” New Zealand Doctor, February 4. Fitchett, Tony. 2006. “GP Debates Midwifery Costs,” Kai Tiaki: Nursing New Zealand, 12:4, p.4. Gabay, Mary and Sidney M. Wolfe. 1997. “Nurse-Midwifery; The Beneficial Alternative,” Public Health Reports, 112:5, pp. 386-394. Guile, Matthew W.; Peter F. Schnatz, and David M. O’Sullivan. 2007. “Relative Importance of Gender in Patients’ Selection of an Obstetrics and Gynecology Provider,” Connecticut Medicine, 71:6, pp. 325-332. Guilliland, Karen. 1999. “Midwifery in New Zealand; The New Zealand Experience,” Birth International. [http://www.birthinternational.com/articles/guilliland01.html; Accessed 03/09/2007] Health Funding Authority (HFA). 2000. “Maternity Services: A Reference Document,” Health Funding Authority, November. Hill, Susannah. 1998. “Baby Docs Disappear,” New Zealand Doctor, October 28. Hill, Susannah. 2002. “Special Delivery: The Debate over Maternity Care Continues to Rage,” Metro, December. Janssen, Patricia A.; Ahoo K. Lee, Elizabeth M. Ryan, Duncan J. Etches, Duncan F. Farquharson, Donlim Peacock, and Michael C. Klein. 2002. “Outcomes of Planned
16
Home Births Versus Planned Hospital Births after Regulation of Midwifery in British Columbia,” Canadian Medical Association Journal, 166:3, pp. 315-323. Janssen, Patricia A.; Elizabeth M. Ryan, Duncan J. Etches, Michael C. Klein, and Birgit Reime. 2007. “Outcomes of Planned Hospital Birth Attended by Midwives Compared with Physicians in British Columbia,” Birth, 34:2, pp. 140-147. Johnson, Kenneth C. and Betty-Anne Daviss. 2005. “Outcomes of Planned Home Births with Certified Professional Midwives: Large Prospective Study in North America,” British Medical Journal, 330, pp. 1416-1422. MacDorman, Marian and Gopal K. Singh. 1998. “Midwifery Care, Social and Medical Risk Factors, and Birth Outcomes in the USA,” Journal of Epidemiology and Community Health, 52, pp. 310-317. Mehl-Madrona, Lewis and Morgaine Mehl-Madrona. 1997. “Physician- and Midwife-Attended Home Births; Effects of Breech, Twin, and Post-Dates Outcome Data on Mortality Rates,” Journal of Nurse-Midwifery, 42:2, pp. 91-98. Miller, Amalia R. 2006. “The Impact of Midwifery-Promoting Public Policies on Medical Interventions and Health Outcomes,” Advances in Economic Analysis and Policy, 6:1, Article 6. Murphy, P.A. and J. Fullerton. 1998. “Outcomes of Intended Home Births in Nurse-Midwifery Practice: A Prospective Descriptive Study,” Obstetrics and Gynecology, 92:3, pp. 461-71. New Zealand General Practitioners’ Association (NZGPA). 1997. “Maternity Survey Proof of Lost Services,” GP Focus: The Newsletter Of the New Zealand General Practitioners’ Association. New Zealand Health Information Service (NZHIS). 2006. “Report on Maternity; Maternal and Newborn Information 2003.” New Zealand Health Information Service (NZHIS). 2007a. “New Zealand Health Workforce Statistics; Nurses and Midwives; Specialists.” [http://www.nzhis.govt.nz/moh.nsf/pagesns/32?Open#13; Accessed 27/05/2008] New Zealand Health Information Service (NZHIS). 2007b. “Maternity and Newborn Information System.” [http://www.nzhis.govt.nz/moh.nsf/pagesns/232?Open; Accessed 27/05/2008] Oakley, D; ME Murray, T Murtland, R Hayashi, HF Andersen, F Mayes, and J Rooks. 1996. “Comparisons of Outcomes of Maternity Care by Obstetricians and Certified Nurse-Midwives,” Obstetrics and Gynecology, 88, pp. 823-829. O’Connor, Teresa. 2006. “Midwifery – A Workforce under Pressure,” Kai Tiaki: Nursing New Zealand, 12:3, p. 18-19.
17
Page, L. 2001. “Human Resources for Maternity Care: The Present System in Brazil, Japan, North America, Western Europe and New Zealand,” International Journal of Gynecology and Obstetrics, 75, pp. S81-S88. Perinatal and Maternal Mortality Review Committee (PMMRC). 2005. “Health Report: Report on Recommendation One by the Wellington Coroner Resulting from Two Cases of Perinatal Death,” File AD20-82-2-1. Perry, Keith. 1998. “Doctors Fleeing Maternity Care,” New Zealand Herald, November 1. Rosenblatt, Roger A.; Sharon A. Dobie, L. Gary Hart, Ronald Schneeweiss, Debra Gould, Tina R. Raine, Thomas J. Benedetti, Michael J. Pirani, and Edward B. Perrin. 1997. “Interspecialty Differences in the Obstetric Care of Low-Risk Women,” American Journal of Public Health, 87:3, pp. 344-351. Roy, Heather. 2005. “Heather Roy’s Diary: Armistice Day, Friday 11 November 2005,” November 12. [http://www.act.org.nz/node/27454; Accessed 9/8/2007] Simmers, Don. 2006. “The Few: New Zealand’s Diminishing Number of Rural GPs Providing Maternity Services,” The New Zealand Medical Journal, 119:1241, pp. 1-3. Smith, Nick. 1998. “Maternity Choice Lost,” New Zealand Herald, November 3. Statistics New Zealand. 2007. “Subnational Population Estimates Tables.” [http://www.stats.govt.nz/tables/subnat-pop-estimates-tables.htm; Accessed 10/09/2007] The National Health Committee. 1999. “Review of Maternity Services in New Zealand,” The National Health Committee, September. The Royal New Zealand College of General Practitioners (RNZCGP). 1999. “The General Practitioner Obstetrician: Safe but Endangered,” Submission to the National Health Committee on General Practitioner Obstetricians in New Zealand. The Royal New Zealand College of General Practitioners (RNZCGP). 2002. “GPs Continue to Walk away from Childbirth Care,” Scoop. [http://www.scoop.co.nz/stories/GE0206/S00036.htm; Accessed 04/08/2007] The Royal New Zealand College of General Practitioners (RNZCGP). 2005. “Your Guide to New Zealand General Practice.” [http://www.rnzcgp.org.nz/membership/docs/nz_guide_general_practice.pdf; Accessed 29/8/2007] Waldenstrom, U. and D. Turnbull. 1998. “A Systematic Review Comparing Continuity of Midwifery Care with Standard Maternity Services,” British Journal of Obstetrics and Gynaecology, 105:11, pp. 1160-70.

18
Waldenstrom, U; H. McLachlan, D. Forster, S. Brennecke, and S. Brown. 2001. “Team Midwife Care: Maternal and Infant Outcomes,“ The Australian and New Zealand Journal of Obstetrics and Gynaecology, 41:3, pp. 257-64.
19
Figure 1a.
Nurse Midwives Working in Midwifery; NZ 1998-2004
01020304050
6070
1998 1999 2000 2001 2002 2003 2004
Year
Mid
wiv
es/1
00,0
00
popu
latio
n
Figure 1b.
Direct-Entry Midwives Working in Midwifery; NZ 1998-2004
0123
45
67
1998 1999 2000 2001 2002 2003 2004
Year
Mid
wiv
es/1
00,0
00
popu
latio
n
Figure 1c.
Specialists Working in Obstetrics; NZ 1998-2004
0
12
34
56
7
1998 1999 2000 2001 2002 2003 2004
Year
Spe
cial
ists
/100
,000
po
pula
tion
Source: Author’s calculations based on NZHIS (2007a) and Statistics New Zealand (2007) data.
20
Table 1. Birth Outcomes and Parental Characteristics by LMC at First Registration: Midwives vs. General Practitioners
Midwife
(175,550 obs.)
GP
(9,914 obs.) Statistical significance of
difference between midwife and GP
Very low BWT (%) 0.53 0.71 ** Low BWT (%) 3.64 3.58 Very low or low BWT (%) 4.17 4.29 Apgar 5 mins < 7 (%) 1.43 1.70 ** Neonatal deaths (per 1,000) 2.10 0.91 ** European (%) 52.60 57.44 *** Maori (%) 20.57 13.68 *** Pacific Islander (%) 11.68 8.58 *** Asian (%) 7.74 10.54 *** Mother’s age (mean) 28.70 29.63 *** Parity (mean) 2.50 2.45 *** Male infant (%) 50.99 49.82 ** TLA marriage rate (%) 44.56 45.34 *** TLA college education (%) 13.66 14.16 *** TLA median HH income (mean) 53,478 53,189 *** Source: Author’s calculations based on NZHIS (2007b) data.
21
Table 2. Percentages of Midwives and General Practitioners as LMCs at First
Registration by Year and District Health Board
Midwife
(175,550 obs.)
GP
(9,914 obs.) Statistical significance of
difference between midwife and GP
Year 2003 84.84 7.83 *** Year 2004 88.50 5.12 *** Year 2005 90.60 3.97 *** Year 2006 91.14 3.33 *** Northland 97.47 1.37 *** Waitemata 85.92 4.90 *** Auckland 79.24 3.59 *** Counties Manukau 92.08 2.72 *** Waikato 96.75 2.67 *** Lakes 98.31 1.13 *** Bay of Plenty 98.12 1.26 *** Tairawhiti 98.88 0.85 *** Hawke’s Bay 88.14 11.38 *** Taranaki 81.22 3.71 *** MidCentral 81.68 12.54 *** Whanganui 96.52 1.16 *** Capital & Coast 83.50 5.84 *** Hutt Valley 77.10 17.12 *** Wairarapa 72.73 25.09 *** Nelson Marlborough 89.34 6.84 *** West Coast 96.31 2.57 *** Canterbury 93.09 5.74 *** South Canterbury 29.92 15.13 *** Otago 95.21 3.64 *** Southland 92.11 7.05 *** Source: Author’s calculations based on NZHIS (2007b) data.
22
Table 3. The Effects of Having a General Practitioner as an LMC at First Registration on Birth Outcomes
(1) Personal
characteristics; Probit
(2) Personal + TLA characteristics; Probit
(3) Personal + TLA characteristics; IV probit
Very low BWT 0.0038*** (0.0011)
0.0037*** (0.0011)
0.0001 (0.0003)
Very low or low BWT
0.0043* (0.0026)
0.0044* (0.0026)
-0.0001 (0.0005)
Apgar 5 mins < 7 0.0021 (0.0015)
0.0021 (0.0015)
0.0003 (0.0003)
Neonatal deaths -0.0005** (0.0001)
-0.0005** (0.0001)
-0.0002** (0.0001)
Source: Author’s estimations based on NZHIS (2007b) data. Robust standard errors are given in parentheses. In column (3), standard errors are corrected for clustering by DHB and year to reflect the fact that annual DHB-level ratios of female GPs to male GPs are used as an instrument for LMC choice *, **, and *** denote statistical significance at the 90, 95, and 99% confidence levels, respectively. Explanatory variables in column (1) include: mother’s ethnicity (Asian, Pacific Islander, Maori, European, other, missing ethnicity), age and age squared, parity, infant gender, and a full set of DHB and year dummies. Models in column (2) add: TLA-level marriage rates, education (proportion of population with at least a bachelor degree), and median household income. Models in column (3) use annual DHB-level ratios of female GPs to male GPs as an instrument for LMC choice.