Embed Size (px)
Citation preview
MIDSOUTH Region
Regional Composite
REGIONALDATA REPORT
JAN – JUN2014 vs. 2013
2
Methodology
• IRI gathers chain-wide sales across all RMAs (Retail Market Areas)– Starting in 2013, the IRI Regions reflect an expanded retail data set which
includes sales and volume from Walmart, Sam’s Club, Target and BJ’s, in addition to traditional grocery retailers
• Average Selling Price (ASP) is not Advertised Retail Price– Average selling price is the average of all prices including coupons, promotional
pricing, club/loyalty card deals that are given at the register at the time of purchase
• Categories: Total Avocados, Produce = Total Produce including Avocados
• Timeframe: YTD Q2 (January – June) 2014
• Retail data provided by IRI / FreshLook Marketing
• Important Note: IRI / FreshLook Marketing periodically restates retail data, therefore this review cannot be compared or used in conjunction with prior reviews
3
Midsouth: Region Highlights - YTD Q2
• Overview based on the following geography:– The Midsouth Region captures the Markets of Baltimore, Charlotte, Louisville,
Nashville, Raleigh, Richmond and Roanoke, plus additional cities not included in Markets
• Midsouth Overview– Avocado retail dollar average trends through Q2 outpaced Produce retail dollar
trends – Category dollars grew +19% in 2013 and +27% in 2014 for a net growth of +51%
over 2012– Category units grew +23% in 2013 and +13% in 2014 for a net growth +40% over
2012– Category average selling price (ASP) decreased -4% in 2013 and increased +12% in
2014 to $1.24/unit
• Midsouth Per Store Averages– 2014 Average dollars of $6,441 per store were +25% higher than 2013 and +46%
higher than 2012– 2014 Average units of 5,175 per store were +12% higher than 2013 and +35%
higher than 2012
• Midsouth versus Total U.S. trends– MS category unit growth of +13% was +10 points higher than the national average– MS category dollar trend of +27% was +10 points higher than the national average– MS 2014 category ASP of $1.24/unit was +12% higher than the national average of
$1.11/unit

4
Midsouth: YTD Q2 Retail Dollar Trend ComparisonsAvocados vs. Produce
• Avocado retail dollar trends through Q2 2014 outpaced Produce retail dollar trends – 2013 versus 2012, Avocados outpaced Produce by +12 points– 2014 versus 2013, Avocados outpaced Produce by +20 points– 2014 versus 2012, Avocados outpaced Produce by +37 points
5
Midsouth: YTD Q2 Avocado Retail Overview
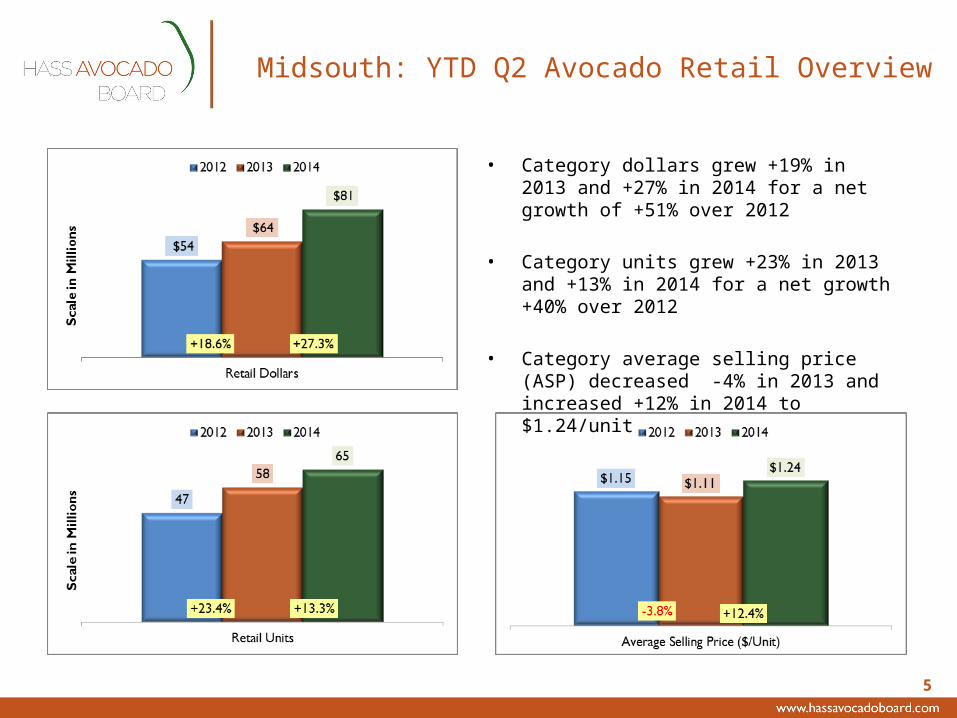
• Category dollars grew +19% in 2013 and +27% in 2014 for a net growth of +51% over 2012
• Category units grew +23% in 2013 and +13% in 2014 for a net growth +40% over 2012
• Category average selling price (ASP) decreased -4% in 2013 and increased +12% in 2014 to $1.24/unit
6
RETAIL UNITS
PLU Description 2013 2014 Variance 2013 2014 Variance
4046 Small Hass #60 sizes & smaller 12,446,280 13,811,583 +11.0% 264,694,895 303,132,864 +14.5%
4225 Large Hass #40 & #48 sizes 28,150,520 29,557,651 +5.0% 323,811,238 296,073,975 -8.6%
4770 X-Large Hass #36 sizes & larger 4,870,421 4,766,068 -2.1% 34,374,820 17,379,846 -49.4%
Other Greenskins, Pinkertons, non-Hass PLUs 727,431 763,017 +4.9% 12,084,056 12,182,463 +0.8%
Organic All Organic PLUs 507,169 810,761 +59.9% 8,438,646 11,987,570 +42.1%
Bags All bagged PLUs 11,026,945 15,670,745 +42.1% 97,225,194 123,820,515 +27.4%
57,728,766 65,379,824 +13.3% 740,628,849 764,577,232 +3.2%
RETAIL DOLLARS
PLU Description 2013 2014 Variance 2013 2014 Variance
4046 Small Hass #60 sizes & smaller 11,969,443$ 14,734,609$ +23.1% 189,531,524$ 259,310,608$ +36.8%
4225 Large Hass #40 & #48 sizes 32,987,281$ 40,193,574$ +21.8% 370,389,541$ 398,628,802$ +7.6%
4770 X-Large Hass #36 sizes & larger 7,566,785$ 9,326,546$ +23.3% 44,528,664$ 33,037,568$ -25.8%
Other Greenskins, Pinkertons, non-Hass PLUs 1,361,546$ 1,456,946$ +7.0% 20,407,504$ 22,099,893$ +8.3%
Organic All Organic PLUs 956,657$ 1,550,715$ +62.1% 13,237,876$ 19,904,947$ +50.4%
Bags All bagged PLUs 9,068,974$ 14,116,159$ +55.7% 82,446,073$ 115,149,905$ +39.7%
63,910,686$ 81,378,549$ +27.3% 720,541,181$ 848,131,724$ +17.7%
AVERAGE SELLING PRICE (ASP) / UNIT
PLU Description 2013 2014 Variance 2013 2014 Variance
4046 Small Hass #60 sizes & smaller $0.96 $1.07 +10.9% $0.72 $0.86 +19.5%
4225 Large Hass #40 & #48 sizes $1.17 $1.36 +16.0% $1.14 $1.35 +17.7%
4770 X-Large Hass #36 sizes & larger $1.55 $1.96 +26.0% $1.30 $1.90 +46.7%
Other Greenskins, Pinkertons, non-Hass PLUs $1.87 $1.91 +2.0% $1.69 $1.81 +7.4%
Organic All Organic PLUs $1.89 $1.91 +1.4% $1.57 $1.66 +5.8%
Bags All bagged PLUs $0.82 $0.90 +9.5% $0.85 $0.93 +9.7%
$1.11 $1.24 +12.4% $0.97 $1.11 +14.0%
JAN
UA
RY -
JUN
E: 2
013
vs 2
014
Midsouth Total U.S.
TOTAL CATEGORY UNITS
Midsouth Total U.S.
TOTAL CATEGORY DOLLARS
Midsouth Total U.S.
CATEGORY ASP ($/Unit)
Midsouth vs. Total U.S.YTD Q2 PLU Comparisons
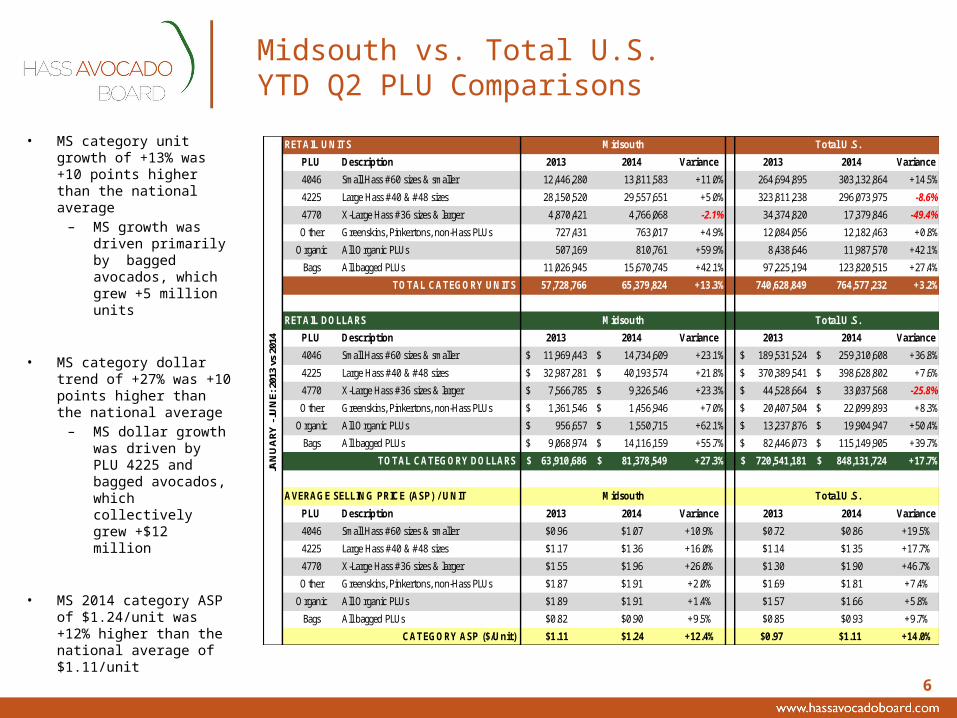
• MS category unit growth of +13% was +10 points higher than the national average– MS growth was
driven primarily by bagged avocados, which grew +5 million units
• MS category dollar trend of +27% was +10 points higher than the national average– MS dollar growth
was driven by PLU 4225 and bagged avocados, which collectively grew +$12 million
• MS 2014 category ASP of $1.24/unit was +12% higher than the national average of $1.11/unit
7
$4,399$5,135
$6,441
+16.7% +25.4%
Avg Retail Dollars Per Store
2012 2013 2014
3,821
4,638 5,175
+21.4% +11.6%
Avg Retail Units Per Store
2012 2013 2014
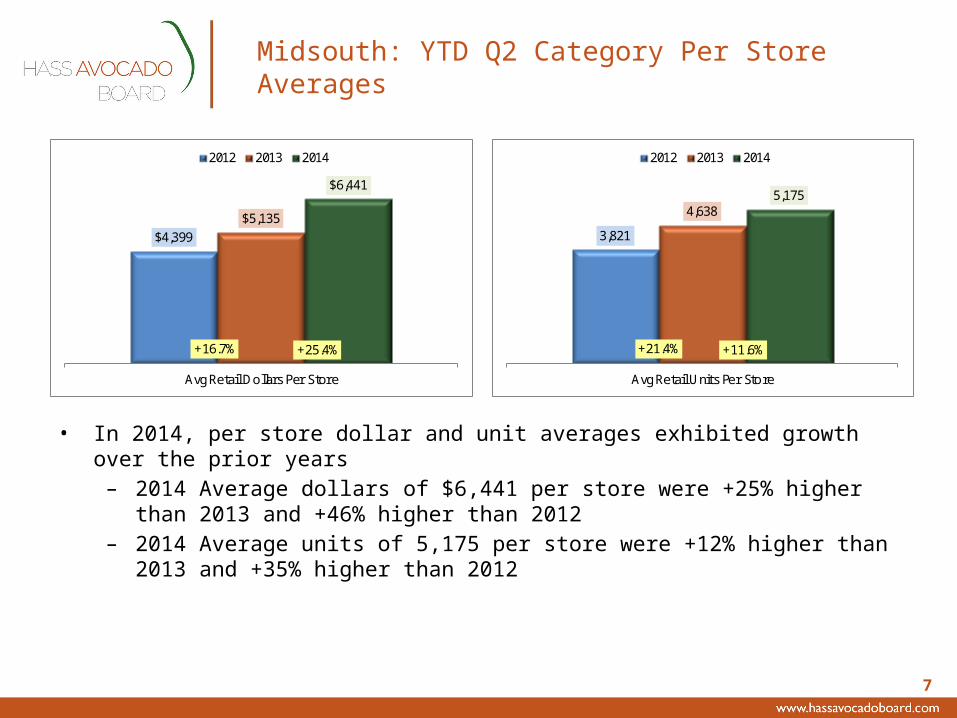
Midsouth: YTD Q2 Category Per Store Averages
• In 2014, per store dollar and unit averages exhibited growth over the prior years– 2014 Average dollars of $6,441 per store were +25% higher than 2013
and +46% higher than 2012– 2014 Average units of 5,175 per store were +12% higher than 2013
and +35% higher than 2012
8
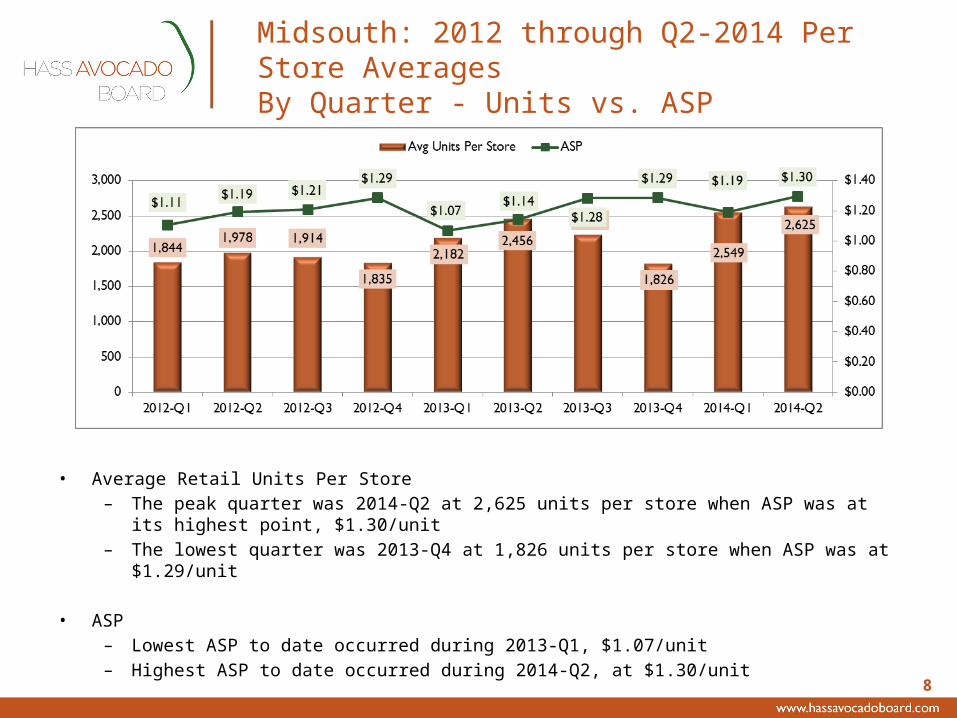
Midsouth: 2012 through Q2-2014 Per Store AveragesBy Quarter - Units vs. ASP
• Average Retail Units Per Store– The peak quarter was 2014-Q2 at 2,625 units per store when ASP was at its highest
point, $1.30/unit– The lowest quarter was 2013-Q4 at 1,826 units per store when ASP was at
$1.29/unit
• ASP– Lowest ASP to date occurred during 2013-Q1, $1.07/unit– Highest ASP to date occurred during 2014-Q2, at $1.30/unit

9
Midsouth: Region Highlights - YTD Q2
• Overview based on the following geography:– The Midsouth Region captures the Markets of Baltimore, Charlotte, Louisville,
Nashville, Raleigh, Richmond and Roanoke, plus additional cities not included in Markets
• Midsouth Overview– Avocado retail dollar average trends through Q2 outpaced Produce retail dollar
trends – Category dollars grew +19% in 2013 and +27% in 2014 for a net growth of +51%
over 2012– Category units grew +23% in 2013 and +13% in 2014 for a net growth +40% over
2012– Category average selling price (ASP) decreased -4% in 2013 and increased +12% in
2014 to $1.24/unit
• Midsouth Per Store Averages– 2014 Average dollars of $6,441 per store were +25% higher than 2013 and +46%
higher than 2012– 2014 Average units of 5,175 per store were +12% higher than 2013 and +35%
higher than 2012
• Midsouth versus Total U.S. trends– MS category unit growth of +13% was +10 points higher than the national average– MS category dollar trend of +27% was +10 points higher than the national average– MS 2014 category ASP of $1.24/unit was +12% higher than the national average of
$1.11/unit