Embed Size (px)
Citation preview
Middlesbrough Council Strategic Plan 2013/14 Contents Section Page
Introduction 1
Middlesbrough 2
2020 Vision for Middlesbrough 2
The Council 3-5
Plans for 2013/14 6-8
_ Neighbourhoods and Communities 6
_ Wellbeing, Care and Learning 7
_ Central Services 8
Spending plans 9
Corporate risks 10
Appendix 1: The Mayor and the Executive 11
Appendix 2: Overview and Scrutiny 12
Appendix 3: Departmental Management Structure 13
Introduction Middlesbrough Council is a unitary local authority serving the people of Middlesbrough, and was created following the abolition of Cleveland County Council in 1996 alongside the three adjacent unitaries of Hartlepool, Redcar and Cleveland and Stockton-on-Tees. It is the ninth smallest unitary authority in England by area. The Council acts as Middlesbrough’s community leader, working with local residents and businesses, public sector partners and the voluntary and community sector to improve local social, economic and environmental well-being for all and to secure the long-term sustainability of the town. It has an array of statutory responsibilities and powers, and commissions or delivers a wide range of public services, funded in the main by government grants, council tax and business rates. It is one of the largest employers in the Tees Valley area, providing work for more than 4,000 people. The Strategic Plan is the Council’s overarching business plan. The plan sets out key priorities and targets and provides a broad overview of high-level improvement activity within each department of the Council over the coming year. It forms the basis of the Council’s corporate performance management framework, with progress monitored on a quarterly basis. In line with the Council’s commitment to transparency, updates will be made available at www.middlesbrough.gov.uk/open-data one month after the end of each quarter. If you have any queries on this plan, or require any further information, please contact: [email protected].
1
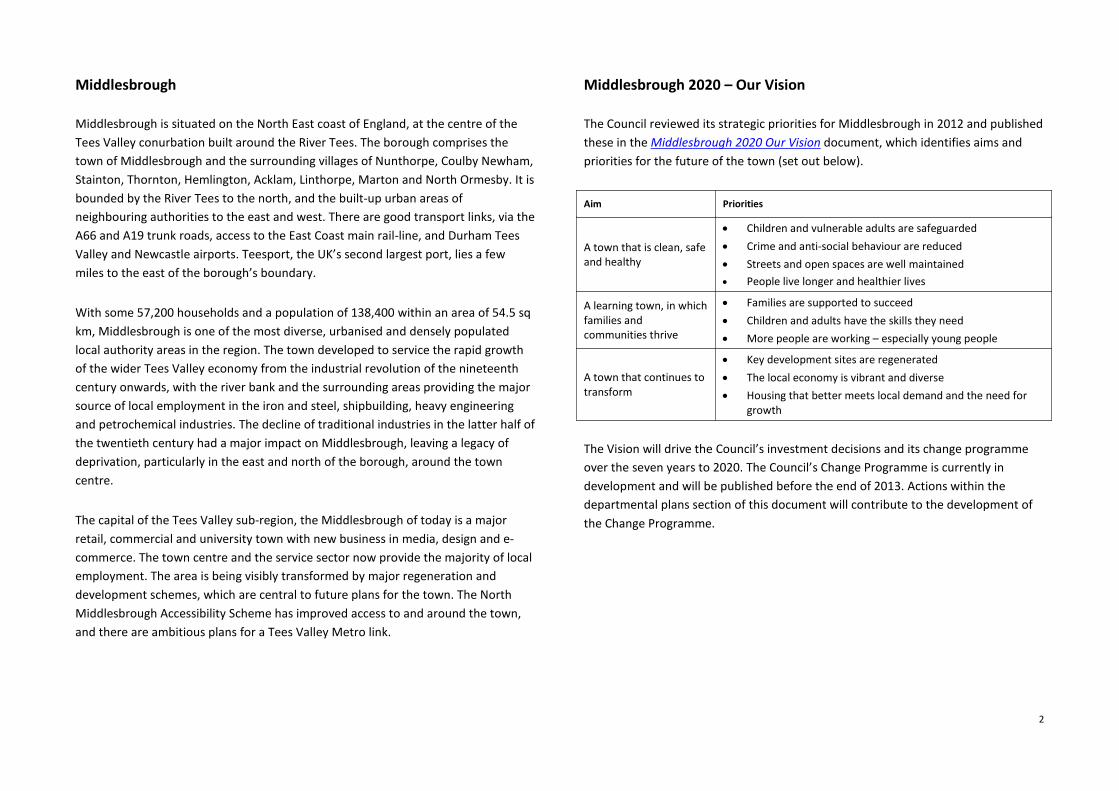
Middlesbrough Middlesbrough is situated on the North East coast of England, at the centre of the Tees Valley conurbation built around the River Tees. The borough comprises the town of Middlesbrough and the surrounding villages of Nunthorpe, Coulby Newham, Stainton, Thornton, Hemlington, Acklam, Linthorpe, Marton and North Ormesby. It is bounded by the River Tees to the north, and the built-up urban areas of neighbouring authorities to the east and west. There are good transport links, via the A66 and A19 trunk roads, access to the East Coast main rail-line, and Durham Tees Valley and Newcastle airports. Teesport, the UK’s second largest port, lies a few miles to the east of the borough’s boundary. With some 57,200 households and a population of 138,400 within an area of 54.5 sq km, Middlesbrough is one of the most diverse, urbanised and densely populated local authority areas in the region. The town developed to service the rapid growth of the wider Tees Valley economy from the industrial revolution of the nineteenth century onwards, with the river bank and the surrounding areas providing the major source of local employment in the iron and steel, shipbuilding, heavy engineering and petrochemical industries. The decline of traditional industries in the latter half of the twentieth century had a major impact on Middlesbrough, leaving a legacy of deprivation, particularly in the east and north of the borough, around the town centre. The capital of the Tees Valley sub-region, the Middlesbrough of today is a major retail, commercial and university town with new business in media, design and e-commerce. The town centre and the service sector now provide the majority of local employment. The area is being visibly transformed by major regeneration and development schemes, which are central to future plans for the town. The North Middlesbrough Accessibility Scheme has improved access to and around the town, and there are ambitious plans for a Tees Valley Metro link.
Middlesbrough 2020 – Our Vision The Council reviewed its strategic priorities for Middlesbrough in 2012 and published these in the Middlesbrough 2020 Our Vision document, which identifies aims and priorities for the future of the town (set out below).
Aim Priorities
A town that is clean, safe and healthy
• Children and vulnerable adults are safeguarded • Crime and anti-social behaviour are reduced • Streets and open spaces are well maintained • People live longer and healthier lives
A learning town, in which families and communities thrive
• Families are supported to succeed • Children and adults have the skills they need • More people are working – especially young people
A town that continues to transform
• Key development sites are regenerated • The local economy is vibrant and diverse • Housing that better meets local demand and the need for
growth
The Vision will drive the Council’s investment decisions and its change programme over the seven years to 2020. The Council’s Change Programme is currently in development and will be published before the end of 2013. Actions within the departmental plans section of this document will contribute to the development of the Change Programme.
2

The Council The Council is led by an independent, elected Mayor, Ray Mallon, now in his third term of office, and currently comprises 48 ward councillors:
Councillors are democratically accountable to local electors, operate to an agreed code of conduct and are entitled to certain allowances. All councillors meet together as the Council to decide the Council’s overall policies and set the budget each year. The Mayor leads a cabinet (the Executive) of the Deputy Mayor and six Executive members, which takes executive decisions (either as a body or individually) on behalf of the Council within the agreed policy and budget framework. The structure of the Executive and details of Executive Member portfolios is set out at Appendix 1. The Overview and Scrutiny Board, comprising a chair plus 12 members, scrutinises Executive decisions and oversees the work of the Council’s six thematic Scrutiny Panels, which hold inquiries into matters of local concern and issue recommendations for improvement. The South Tees Health Scrutiny Joint Committee and the Tees Valley Joint Health Scrutiny Committee also report to the
Board. Scrutiny can ‘call-in’ a decision which has been made by the Executive but not yet implemented, in order to consider whether the decision is appropriate. They may recommend that the Executive reconsider the decision. The Executive consults Scrutiny on forthcoming decisions and the development of policy where appropriate. The structure of Overview and Scrutiny is set out in Appendix 2. Council officers (employees) give advice, implement decisions and manage the day-to-day delivery of services. The Chief Executive (Head of the Paid Service) leads a Corporate Management Team (CMT) of two service Executive Directors – for Neighbourhoods and Communities and Wellbeing, Care and Learning – and the Director of Transformation, who manages the Council’s Change Programme and oversees all support services. CMT supports the Mayor and the Executive in their decision-making roles and provides managerial leadership for the Council. The Council’s departmental structure is set out at Appendix 3. The Council's constitution sets out how the Council operates, how decisions are made and the procedures that are followed to ensure that these are efficient, transparent and accountable to local people. Services currently commissioned, provided or enabled by the Council include: • safeguarding the welfare of children, young people and vulnerable adults; • social care services and supporting independence for vulnerable people; • educating local nursery, primary and secondary school pupils; • local leisure centres, libraries, museums and mima; • local parks, playgrounds and public spaces; • highway and footpath maintenance and cleansing; • domestic waste and recycling collections; and • planning, economic development and regeneration.
307
4
32 1 1
Labour
Independent
Conservative
Middlesbrough IndependentCouncillors Association
Marton Independent Group
Liberal Democrat
Green
3

A comprehensive A-Z of the Council’s services can be found at www.middlesbrough.gov.uk. Most support services, including benefits administration, council tax and business rates collection, human resources and customer services, are provided via the Council’s strategic partnership with Mouchel, which was established in 2001 and will run until 2016. The Council transferred its social housing stock to a registered social landlord, Erimus Housing, in 2004. The Council engages in a number of partnerships to promote the wellbeing of the town. The Middlesbrough Partnership is the Local Strategic Partnership (LSP) for Middlesbrough. The Partnership has developed the Sustainable Community Strategy 2008-2023, and brings together key organisations and communities to work together to improve life for people who live in, work in or visit Middlesbrough. Residents are involved in all areas of the Partnership. The Council is lead partner on the Partnership and supports its governance, development and work programme. Middlesbrough’s fortunes are inextricably linked to the economic prosperity of the sub-region. The five neighbouring boroughs of Middlesbrough, Darlington, Hartlepool, Redcar & Cleveland and Stockton-on-Tees form the Tees Valley sub-region and work together in a number of partnerships designed to improve quality of life in the area. Tees Valley Unlimited (TVU) is a partnership of public, private and voluntary bodies that coordinates activities, appropriate to a city region level, designed to reduce the output gap between the Tees Valley and the rest of the UK by developing its key economic assets and improving urban competitiveness. TVU secured Local Enterprise Partnership (LEP) status in 2011.
Over the past five years, the Council’s workforce has reduced by 13%, and it is clear that numbers will continue to reduce as a result of public sector spending cuts.
During 2012/13 the Council undertook further service reviews and continued to run corporate Early Retirement / Voluntary Redundancy Schemes, the effect of which can be seen in the figures below (note: the Chief Executive is excluded from these figures).
FTE ACEx L&D STR RES N&C WCL TOTAL
31/03/12 38.6 43.4 91.7 1,147.7 1,312.7 2,634.1
ER/VR -2.0 -1.0 -4.9 -37.5 -36.8 -82.2
CR 0 0 -0.9 -11.8 -17.0 -29.7
Leavers (Net) -1.8 +0.2 -14.7 +12.1 +26.0 +21.8
31/03/12 34.8 42.6 71.2 1,110.5 1,284.9 2,544.0
Change 12-13 -10% -2% -22% -3% -2% -3%
It should be noted that overall FTE reductions in some areas were affected by the internal transfer of some services, in particular from Strategic Resources to Neighbourhoods and Communities.
4
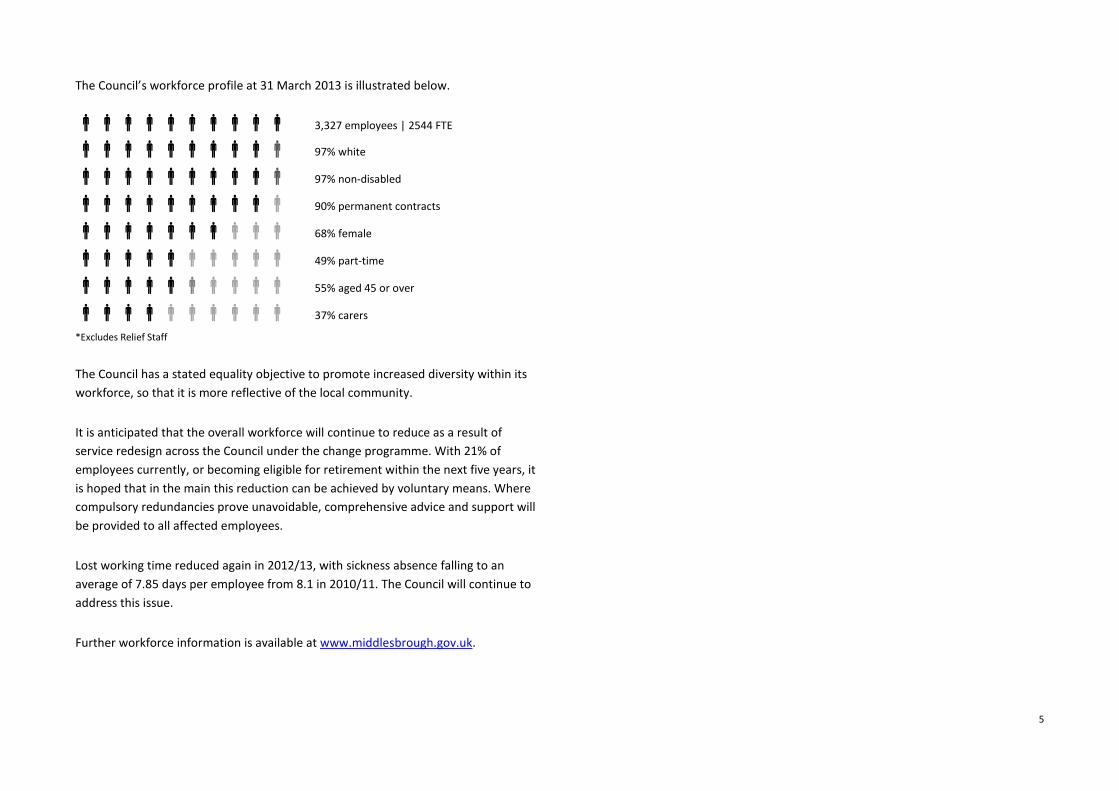
The Council’s workforce profile at 31 March 2013 is illustrated below.
3,327 employees | 2544 FTE
97% white
97% non-disabled
90% permanent contracts
68% female
49% part-time
55% aged 45 or over
37% carers
*Excludes Relief Staff
The Council has a stated equality objective to promote increased diversity within its workforce, so that it is more reflective of the local community. It is anticipated that the overall workforce will continue to reduce as a result of service redesign across the Council under the change programme. With 21% of employees currently, or becoming eligible for retirement within the next five years, it is hoped that in the main this reduction can be achieved by voluntary means. Where compulsory redundancies prove unavoidable, comprehensive advice and support will be provided to all affected employees. Lost working time reduced again in 2012/13, with sickness absence falling to an average of 7.85 days per employee from 8.1 in 2010/11. The Council will continue to address this issue. Further workforce information is available at www.middlesbrough.gov.uk.
5

Plans for 2013/14
Neighbourhoods and Communities Key Performance Indicators KPI 12/13 outturn Comparison 13/14 target
Domestic waste collected per household 741 Kg (e) Bottom quartile 770 kg
Domestic waste recycled 21.5% (e) Bottom quartile 28%
Domestic waste landfilled 6.2% (e) Top quartile 8%
Principal roads in good repair 98% Top quartile > 98%
Streets free from litter / detritus 95% N/A > 92%
Parks / green spaces with Green Flag status 6 N/A 7
Satisfaction with regulatory services 97.1% N/A > 90%
Local physical activity 3x week 20.4% Third quartile 20.5%
Major planning applications in 13 wks 90% Top quartile > 60%
Minor planning applications in 8 wks 77% Second quartile 81%
Increase in gross supply of housing 297 N/A 300
Minor adaptations within 7 days 98% N/A 98%
Libraries contacts 512,104 N/A 537,709
Culture / museums contacts 430,614 N/A 350,000
Mima contacts 104,354 N/A 115,000
Volunteers supporting MBC services 503 N/A 530
Major activity Action Deadline
Determine most appropriate future delivery model for Environment and Property Services. Sept. 2013
Determine most appropriate future delivery model for Regulatory Services. Sept. 2013
Determine most appropriate future delivery model for Infrastructure Services. Sept. 2013
Determine most appropriate future delivery model for Community Services. Sept. 2013
Determine most appropriate future delivery model for Culture and the Arts. Sept. 2013
Determine most appropriate future delivery model for Sports and Leisure Services. Sept. 2013
Design and implement new urban park for the Middlehaven area. Mar. 2014
Select preferred developer for Hemlington Grange. Mar. 2014
Progress Western Gateway (Cannon Park) development. Mar. 2014
Progress Prissick Sports Park development. Mar. 2014
Progress Grove Hill redevelopment. Mar. 2014
Bring 80 empty homes back into use in the Gresham area. Mar. 2014
Develop new floor space in Enterprise Zones. Mar. 2014
Progress development of BOHO 5. Mar. 2014
Continue rationalisation of non-strategic assets. Mar. 2014
For further detail, see Neighbourhoods and Communities delivery plan.
6
Wellbeing, Care and Learning Key Performance Indicators KPI 12/13 outturn Comparison 13/14 target
Eligible users with personal budgets 73.4% Bottom quartile 78%
Admissions to care per 100,000 population 221.1 Bottom quartile 216
Clients at home 91 days after discharge 83.3% Third quartile 87%
Carers consulted about those they care for 79.4% Second quartile >79.4%
Clients who feel safe due to services 88.1% Top quartile 90%
CAF referrals per 10,000 population 140.5 N/A 150
LAC per 10,000 population 117.8 Bottom quartile 110
CPPs per 10,000 population 85.7 Bottom quartile 80
CYP subject to CPP for subsequent time 6.8% Third quartile < 12%
1st time entrants to youth justice per 100,000 1,215 Bottom quartile 1,200
Reduction in u-18 conception rate 24.2% Bottom quartile > 14%
Pupils meeting Early Years Standards 51% Bottom quartile 53%
Primaries below KS2 floor target 5 Bottom quartile 3
Persistent absence in Secondaries 11% Bottom quartile 10%
Perm. exclusions in Secondaries 0.07% Second quartile 0.06%
Secondaries below GCSE floor target 1 Bottom quartile 1
16-18 years-old NEET 10.30% Bottom quartile 12%
Excess weight in 4-5 and 10-11 yrs. Olds 10 / 19% (11/12) N/A TBC
Adults 18+ 4 week quitters per 100,000 1248.0 (10/11) N/A TBC
Successful completion of drug treatment 7.5% (11/12) N/A >7.5%
Take up of NHS Health Check programme 18.3% (11/12) N/A >18.3%
Major activity Action Deadline
Develop revised demand management process for social care. Sept. 2013
Determine most appropriate future delivery model for Adult Social Care. Sept. 2013
Determine most appropriate future delivery model for Mental Health Services. Sept. 2013
Determine most appropriate future delivery model for Safeguarding Services. Sept. 2013
Determine most appropriate future delivery model for Family Services. Sept. 2013
Determine most appropriate future delivery model for Welfare Services. Sept. 2013
Determine most appropriate future delivery model for SEN Services. Sept. 2013
Determine most appropriate future delivery model for School Support Services. Sept. 2013
Determine most appropriate future delivery model for Community Learning. Sept. 2013
Implement new arrangements for social care assessments, support planning and reviews Mar-.2014
Introduce a single care package funding system that applies to all eligible people. Mar. 2014
Develop MSTA to secure a robust model of school to school improvement. Mar. 2014
Develop a model of partnership working to address the needs of long-term NEETS. Mar. 2014
Implement Early Years Nutritional guidance developed with theChildren’s Food Trust. Mar. 2014
For further detail, see Wellbeing, Care and Learning delivery plan.
7
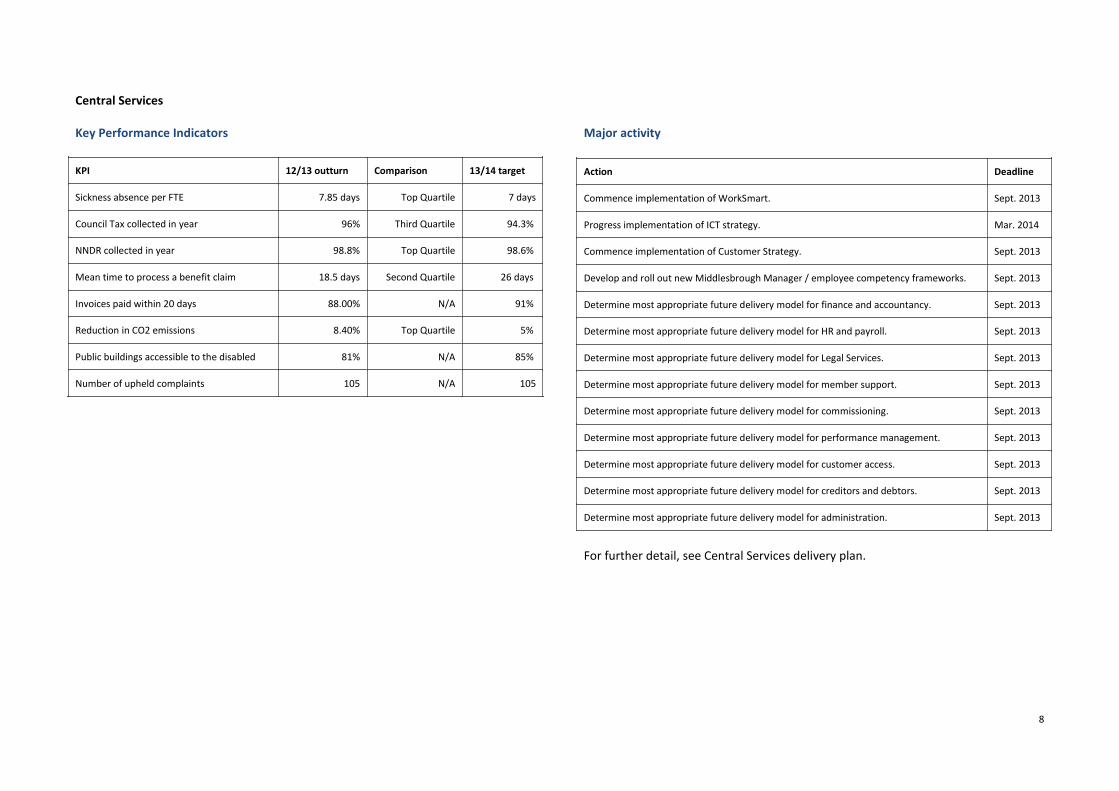
Central Services Key Performance Indicators KPI 12/13 outturn Comparison 13/14 target
Sickness absence per FTE 7.85 days Top Quartile 7 days
Council Tax collected in year 96% Third Quartile 94.3%
NNDR collected in year 98.8% Top Quartile 98.6%
Mean time to process a benefit claim 18.5 days Second Quartile 26 days
Invoices paid within 20 days 88.00% N/A 91%
Reduction in CO2 emissions 8.40% Top Quartile 5%
Public buildings accessible to the disabled 81% N/A 85%
Number of upheld complaints 105 N/A 105
Major activity
Action Deadline
Commence implementation of WorkSmart. Sept. 2013
Progress implementation of ICT strategy. Mar. 2014
Commence implementation of Customer Strategy. Sept. 2013
Develop and roll out new Middlesbrough Manager / employee competency frameworks. Sept. 2013
Determine most appropriate future delivery model for finance and accountancy. Sept. 2013
Determine most appropriate future delivery model for HR and payroll. Sept. 2013
Determine most appropriate future delivery model for Legal Services. Sept. 2013
Determine most appropriate future delivery model for member support. Sept. 2013
Determine most appropriate future delivery model for commissioning. Sept. 2013
Determine most appropriate future delivery model for performance management. Sept. 2013
Determine most appropriate future delivery model for customer access. Sept. 2013
Determine most appropriate future delivery model for creditors and debtors. Sept. 2013
Determine most appropriate future delivery model for administration. Sept. 2013
For further detail, see Central Services delivery plan.
8

Spending plans Changes in net spending plans from 2012/13
2012/2013
Service area
2013/2014
Gross
Exp
£m
Grant
Income
£m
Other
Income
£m
Net
Exp
£m
Net
Exp
£m
54.4 6.0 17.6 30.8 N&C 31.4
215.2 116.7 29.8 68.7 WCL 75.8
124.0 92.5 8.1 23.4 Central / Corporate 20.8
393.6 215.2 55.5 122.9 128.0
9.0 Capital financing less interest 9.3
1.9 Other central Items (net) 5.1
-0.2 Contribution from (-) reserves -2.0
133.6 Budget 140.4
0.0 Parish precepts 0.0
133.6 Budget Requirement 140.4
The change from last year’s net budget is comprised of pay and price inflation of +£3.5million, service and demand pressures of +£4.3 million, technical funding changes of +£11.7 million and budget savings of -£12.7 million.
.
9

Corporate risks The Council’s Corporate Risk Register identifies the following as current high and medium level risks to the achievement of the Council’s objectives, given the current and planned controls in place to reduce their probability and the impact of their occurrence. Risk levels and controls are reviewed on a quarterly basis. The greatest risks to strategic objectives continue to be reductions in resources resulting from Government austerity measures and other national policy changes that will also have a significant financial impact. In addition to localised risk, a number of corporate risks take account of the UK national risk register (e.g. threat of cyber attack, pandemic disease) and the high level of threat assumed at that level.
Rank Risk
= 1 Budget: inability to achieve a balanced budget due to reducing settlement.
= 1 Welfare Reform: withdrawal of funding to administrate Housing Benefit.
=2 Education Reform: loss of influence / funding as schools convert to academy status.
=2 Local economy: no or limited growth due to Government austerity measures.
=2 Housing Market Renewal: lack of progress due to reduced national funding.
=3 Local economy: poor local skills profile restricts employment opportunities.
=3 Welfare Reform: localisation of Council Tax Benefit / imposed 10% budget reduction.
=3 Data security: data breaches result in reputational damage and fines.
=3 Business continuity: major staff absence interrupts services.
=3 Compensation: unanticipated awards reduce resources.
=3 NNDR: repatriation of Business Rates significantly reduces funding.
=3 Health Reform: transfer of public health responsibilities from NHS affects services.
Rank Risk
=3 Welfare Reform: disability benefit changes result in reduced social care contributions.
=3 Transformation: failure to develop ICT Infrastructure.
=3 Customer focus: lack of customer insight results in poor commissioning / services.
=3 Educational standards: poor inspection outcomes for local schools.
4 Safeguarding: procedural failure results in death or injury of child / vulnerable adult.
5 Legislative compliance: inadvertent infringement due to loss of experienced staff.
=6 Regeneration: project failure due to stakeholder opposition.
=6 Business Continuity: ICT failure due to external/internal attack or system fault.
=6 Business Continuity: Emergency Planning incident interrupts services.
7 Welfare Reform: failure of local hardship scheme to adequately replace Social Fund.
10

Appendix 1: The Mayor and the Executive
11

Appendix 2: Overview and Scrutiny
12

Appendix 3: Departmental Management Structure
13