Embed Size (px)
Citation preview

Middle Market Update 2nd Quarter 2015

2
Q3 20145 Q4 20145 Q1 20155 Q2 20155
5-year Treasury Note 1.9% 1.7% 1.4% 1.7%
10-year Treasury Note 2.7% 2.3% 2.0% 2.4%
30-year Treasury Note 3.4% 2.9% 2.7% 3.4%
10-year Treasury Inflation Protected
Security (TIPS)
0.6% 0.5% 0.2% 0.5%
Employment
■ The unemployment rate slid from 5.5% in May 2015 to 5.3% in
June3
■ The decrease is partially explained by the drop in the labor force
participation rate, reaching 62.6% - its lowest level since October
1977, as discouraged workers and baby boomers are exiting the
labor force3
U.S. Treasury Securities
■ After several quarters of flattening, the treasury yield curve
steepened sharply in Q2 2015, as long-term maturities moved higher
by more than 50 bps4
Federal Reserve
■ Despite economic stagnation and reduced labor participation, the
FOMC views the disappointing economic performance to be largely
transitory, and believes household spending and solid consumer
sentiment will contribute to positive GDP growth6
Second Quarter Economic Performance and Future Outlook
Gross Domestic Product
■ Real GDP grew 2.3% in Q2 2015, up from the 0.6% increase in Q1
2015, yet short of the consensus estimate of 2.6%1
■ The growth in GDP reflected primarily an acceleration in consumer
spending and an upturn in exports, residential fixed investment, and
municipal government spending1
― Despite a strong dollar, real exports of goods and services
increased 5.3% in Q2 2015, in comparison with a decrease of
6.0% in Q1 2015
― Real residential fixed investment jumped 6.6% in Q2 2015, a
slowdown from the 10.8% growth in Q1 2015
― Real state and local government consumption expenditures
and gross investment expanded 2.0% in Q2 2015, in contrast
with a decrease of 0.8% in Q1 2015
Consumer Spending
■ Consumers were net spenders this quarter, as real disposable
personal income grew 3.7%, up from 1.8% in Q1 2015, while the
personal savings rate declined from 5.2% to 4.8% in Q2 20151
― Real personal consumption expenditures rose 2.9% in Q2
2015, an increase from the 1.8% growth recorded in Q1 2015
■ Personal income climbed $145.0B in Q2 2015, as compared with
$118.9B in Q1 2015, reflecting upturns in personal interest income
and in farm proprietors’ income, partly offset by decelerations in
government social benefits and personal dividend income
Outlook for H2 2015
■ U.S. CEOs have lowered their sales projections and plans for capital
investment and hiring in H2 2015, reflecting concerns about the
continued sub-par growth of the U.S. economy2
― Business Roundtable members expect GDP growth of 2.5%
in 2015, a decrease of 30 bps from their consensus in the
previous quarter
1. U.S. Bureau of Economic Analysis 2. CEO Economic Outlook Survey
published by Business Roundtable 3. Bureau of Labor Statistics
4. R.W. Baird 5. U.S. Department of the Treasury 6. U.S. Federal Reserve
Source: Bureau of Economic Analysis.
(0.3%)
(2.8%)
2.5%
1.6% 2.2%
1.5%
2.4%
0.6%
2.3%
(4.0%)
(3.0%)
(2.0%)
(1.0%)
(0.0%)
1.0%
2.0%
3.0%
Perc
en
tag
e C
han
ge
Real GDP Growth Since 2008

3
■ The aggregate global M&A transaction value rose 15.2% to $1.7T
in H1 2015, as compared to $1.5T in H1 20141
■ The U.S. accounted for 42.7% of the global deal value1
― U.S. M&A transactions in H1 2015 ended at $740.6B across
2,083 deals, an increase of 23.8% in value compared with
$598.2B in H1 2014
― Mega-deals, such as Charter Communications’ $77.8B
acquisition of Time Warner Cable, contributed 18.8% of
deal value in Q2 2015, and led the technology, media, and
telecom sector to jump 45.4% to $238.1B across 460 deals
in H1 2015 versus the same period in the prior year
■ Low interest rates, significant corporate cash balances, a hunger for
acquisitive growth into new segments and potential synergies, and
sustained high stock prices fueled the M&A shopping spree
through H1 20152
■ The global private equity market is projected to reach $6.5T to
$7.4T by 2020, as sovereign wealth funds and high-net worth
individuals are seeking alternative investments as a way of
diversifying holdings and decreasing correlation with the stock and
bond markets 3
Mergers and Acquisitions and Private Equity
1. Mergermarket 2. PitchBook 3. PWC
0
2
4
6
8
10
12
14
$0
$500
$1,000
$1,500
$2,000
2008 2009 2010 2011 2012 2013 2014 2015
No
. o
f T
ran
sacti
on
s (i
n t
ho
usa
nd
s)
Tra
nsa
cti
on
Valu
e (
in b
illi
on
s)
U.S. M&A Activity
Q1 Q2 Q3 Q4 No. of Transactions
Source: FactSet U.S. Flashwire January Report.
4. These multiples reflect prices paid for mainly public companies and do not account for smaller private company transactions (for which there typically are no publicly available data) that tend to change hands at much lower multiples
5. GF Data 6. Preqin
0
100
200
300
400
500
600
2011 2012 2013 2014 2015
Ag
gre
gate
Tra
nsa
cti
on
Valu
e (
in
bil
lio
ns)
Q4
Q3
Q2
Q1
$408
$467
$513 $548
$216
Source: PitchBook.
U.S. Private Equity Deal Flow
■ PE deal flow fell 21.5% from 1,753 deals in H1 2014 worth $275B to
1,509 deals worth $215.9B in H1 2015, as PE firms fear today’s high
multiples may lead to stunted returns in the next four years2
― The U.S. PE investment-to-exit ratio hit a decade-low 1.7x in
H1 2015, with the majority of exits made to strategic buyers
― The total value of all PE-backed exits reached $185B in H1
2015, already 70.0% of the total value exited in all of 2014
■ 48.0% of all H1 2015 PE deals were under $25M, indicating a shift
towards the lower-middle market2
■ Valuations of PE-acquired companies decreased overall from 2014,
but experienced improvements for middle-market transactions:
― The median total enterprise value (TEV) to EBITDA multiple
fell to 7.3x in H1 2015, down from 10.0x in 2013-20142,4
― Valuations for companies in the $10M to $250M TEV range
averaged 6.7x trailing adjusted EBITDA in H1 2015, up 4.7%
from the 2014 average of 6.4x5
■ PE firms had $1.32T of dry powder as of June 30th (roughly
equivalent to Mexico’s GDP)6

4
Software $7,314
Media and Entertainment
$2,729
Biotechnology $2,270
Consumer Products and Services $1,143
IT Services $902
Medical Devices and Equipment
$813
Industrial/Energy $437
Retailing/Distribution $74
Other $40
VC Deals Per Industry – Q2 2015 (in millions)
Venture Capital and PIPEs
Venture Capital Investing
■ In Q2 2015, the venture capital (VC) industry invested $17.5B across
1,189 deals, an increase of 30.0% in value and 13.0% in number, as
compared with $13.5B across 1,048 transactions in Q1 20151
■ First-time financings swelled 43.0% from $1.8B in Q1 2015 to $2.6B
in Q2 2015, while the number of deals rose 18.0% from the prior
quarter1
■ There were 27 VC-backed IPOs in Q2 2015 totaling $3.4B, a 59.0%
increase in the number of offerings and more than double the level
of dollars raised during the prior quarter2
■ U.S. VC firms raised $10.3B across 74 funds during Q2 2015, a spurt
of 10.0% in fund count and 39.0% in total dollar commitments in
contrast to Q1 20152
― VC dollar commitments during Q2 2015 climbed 27.0%
compared with Q2 2014, marking the strongest quarter for
VC fundraising since before the recession
― The top fundraiser during Q2 2015 was New Enterprise
Associates 15, L.P., which raised $2.8B
Source: MoneyTree Report.
PIPE Investing
■ $53B was taken in across 626 PIPE transactions that were announced or
completed in H1 2015, doubling in value from the $26.5B raised across
595 transactions in H1 20143
― The lack of attractive IPO prospects in Q2 2015 contributed to
the significant growth in the PIPE market, as new participants
sought to invest in large cap companies offering a comparable
degree of liquidity and stability
― Additional growth in the PIPE market was partly driven by
companies that went public in recent years in less successful
IPOs, making them unable to generate demand for follow-on
offerings
■ Sabby Management LLC was the most active institutional investor in Q2
2015, with 13 private placements amounting to $43.5M3,4
■ Calm financial markets played an additional role in driving deal flow, as
relatively low volatility allowed investors and PIPE-issuing companies to
come quickly to terms3
1. MoneyTree Report by PricewaterhouseCoopers LLC and the NVCA 2. Thomson Reuters LPC 3. Private Raise/Dealflow
$66.1
$118.5
$37.5 $31.0 $34.6
$45.7 $46.1
$15.0 $11.6 $12.9 $22.1
$59.7
$17.6
$35.4
0
200
400
600
800
1,000
1,200
1,400
1,600
1,800
$0
$20
$40
$60
$80
$100
$120
$140
No
. o
f D
eals
Cap
ital
Inve
sted
(in
bil
lio
ns)
U.S. PIPE Activity
Capital Invested # of Deals
Source: PrivateRaise/DealFlow.
4. Excludes transactions for which the investment amount has not yet been disclosed
5
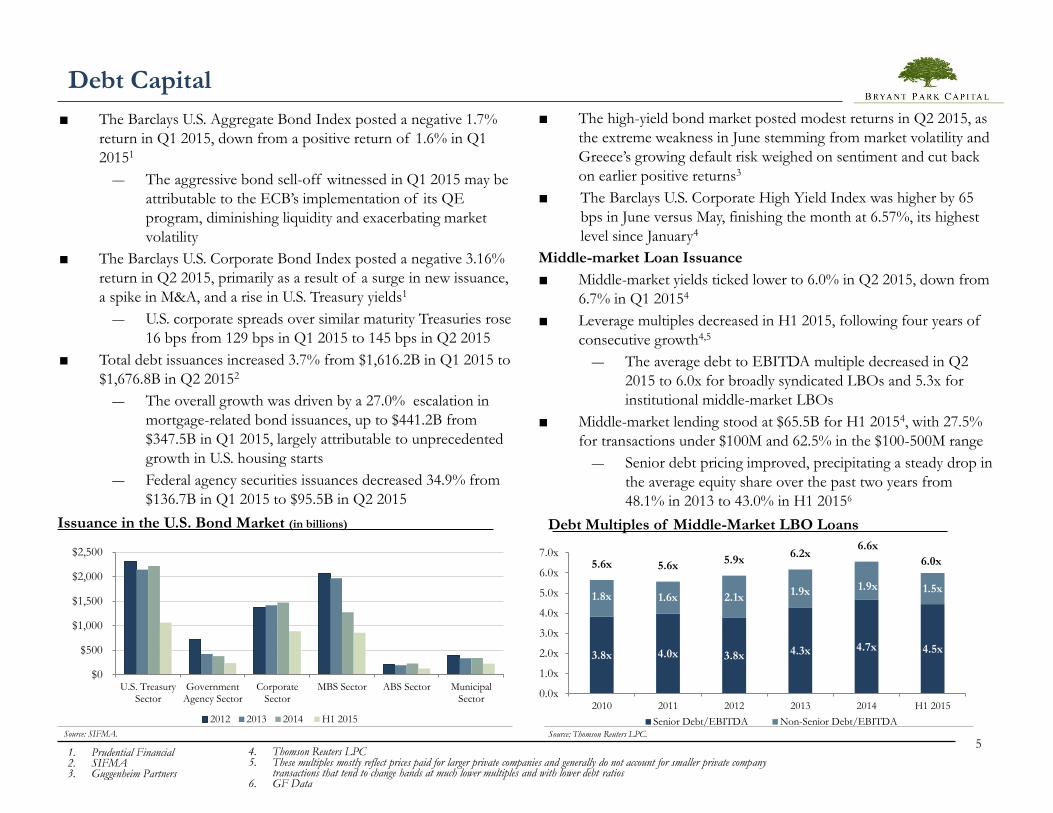
■ The Barclays U.S. Aggregate Bond Index posted a negative 1.7%
return in Q1 2015, down from a positive return of 1.6% in Q1
20151
― The aggressive bond sell-off witnessed in Q1 2015 may be
attributable to the ECB’s implementation of its QE
program, diminishing liquidity and exacerbating market
volatility
■ The Barclays U.S. Corporate Bond Index posted a negative 3.16%
return in Q2 2015, primarily as a result of a surge in new issuance,
a spike in M&A, and a rise in U.S. Treasury yields1
― U.S. corporate spreads over similar maturity Treasuries rose
16 bps from 129 bps in Q1 2015 to 145 bps in Q2 2015
■ Total debt issuances increased 3.7% from $1,616.2B in Q1 2015 to
$1,676.8B in Q2 20152
― The overall growth was driven by a 27.0% escalation in
mortgage-related bond issuances, up to $441.2B from
$347.5B in Q1 2015, largely attributable to unprecedented
growth in U.S. housing starts
― Federal agency securities issuances decreased 34.9% from
$136.7B in Q1 2015 to $95.5B in Q2 2015
3.8x 4.0x 3.8x 4.3x 4.7x 4.5x
1.8x 1.6x 2.1x 1.9x 1.9x 1.5x
5.6x 5.6x 5.9x
6.2x 6.6x
6.0x
0.0x
1.0x
2.0x
3.0x
4.0x
5.0x
6.0x
7.0x
2010 2011 2012 2013 2014 H1 2015
Debt Multiples of Middle-Market LBO Loans
Senior Debt/EBITDA Non-Senior Debt/EBITDA
Debt Capital
Source: Thomson Reuters LPC.
■ The high-yield bond market posted modest returns in Q2 2015, as
the extreme weakness in June stemming from market volatility and
Greece’s growing default risk weighed on sentiment and cut back
on earlier positive returns3
■ The Barclays U.S. Corporate High Yield Index was higher by 65
bps in June versus May, finishing the month at 6.57%, its highest
level since January4
Middle-market Loan Issuance
■ Middle-market yields ticked lower to 6.0% in Q2 2015, down from
6.7% in Q1 20154
■ Leverage multiples decreased in H1 2015, following four years of
consecutive growth4,5
― The average debt to EBITDA multiple decreased in Q2
2015 to 6.0x for broadly syndicated LBOs and 5.3x for
institutional middle-market LBOs
■ Middle-market lending stood at $65.5B for H1 20154, with 27.5%
for transactions under $100M and 62.5% in the $100-500M range
― Senior debt pricing improved, precipitating a steady drop in
the average equity share over the past two years from
48.1% in 2013 to 43.0% in H1 20156
1. Prudential Financial 2. SIFMA 3. Guggenheim Partners
4. Thomson Reuters LPC 5. These multiples mostly reflect prices paid for larger private companies and generally do not account for smaller private company
transactions that tend to change hands at much lower multiples and with lower debt ratios 6. GF Data
Source: SIFMA.
$0
$500
$1,000
$1,500
$2,000
$2,500
U.S. TreasurySector
GovernmentAgency Sector
CorporateSector
MBS Sector ABS Sector MunicipalSector
Issuance in the U.S. Bond Market (in billions)
2012 2013 2014 H1 2015

6
The Cash King Is Dead. All Hail the New King: Debt 2015 U.S. Working Capital Survey
By REL, a division of The Hackett Group
Corporate debt continues to skyrocket, as companies do little to generate
cash by optimizing collections, payables, and inventory. Debt rose by over
9% in 2014 to nearly $4.6 trillion, with companies leveraging low interest
rates to fund increased investment activities. At the same time, companies
once again made almost no improvement in their working capital
management, doing little to generate cash internally by optimizing how
they collect from customers, pay suppliers, and manage inventory.
Cash flow lessons not learned from the Great Recession
The cash conversion cycle (CCC) once again remained flat in 2014, only
improving one day since 2007. Cash on hand continued to increase,
improving 74% over the same period. Even though revenue has increased
39%, debt continues to be a source of investment, rising by a total of
62% over the same period. Companies that increased their debt 100% or
more since 2007 had a 1,516% increase in cash on hand but their CCC
worsened by 113%. The companies that decreased their debt since 2007
had a 336% uptick in cash on hand, but their CCC improved 31%. There
is a $1 trillion cash flow opportunity comparing top and bottom
performers, with the greatest potential gains available in improved
inventory and payables management.
It seems that companies have learned very little from the Great Recession
in terms of their cash management strategies, taking on large amounts of
debt to fund increased investment activities, while doing very little
operationally to improve their own internal cash generation. “Cash is
king” has been a traditional mantra, but ironically, given recent history,
debt has taken over the reins.
A few quotes from the great Warren Buffet come to mind. “I do not like
debt and do not like to invest in companies that have too much debt,
particularly long-term debt. With long-term debt, increases in interest
rates can drastically affect company profits and make future cash flows
less predictable.”1 And, “Cash ... is to a business as oxygen is to an
individual: never thought about when it is present, the only thing in mind
when it is absent.”2
Cash, debt, and the cash conversion cycle
The expansion of cash on hand looks like a great improvement and
might lead some to believe corporations are hoarding cash, which has
been a very common view over the past few years. However, cash on
hand should not be analyzed independently; the economy is doing better
with revenue increasing 39% over the same period, but cash on hand as a
percent of revenue has increased by only 2%. Companies have been
applying much of their excess cash to dividend payments, M&A activity,
and share buy-backs.
So there clearly is more cash available and it’s being spent. But where is it
coming from? We established above that debt is a large contributor,
rising 62% since 2007 to the tune of $4.6 trillion, while the federal funds
rate declined from 5% to 0.09%. Executive leadership has taken
advantage of these low borrowing costs, often rewarding shareholders
through dividends or directly in the share price through share buy-back
programs in the short term. Companies should be very concerned about
the long-term risks such as over-leveraging, liquidity, changes in interest
rates, cash apathy, and a general dependence on debt; and they should be
managing appropriately to mitigate those risks where possible.
1. http://www.minterest.org/best-warren-buffett-quotes-on-investing/ 2. http://www.fool.com/investing/general/2015/03/29/warren-buffett-3-ways-to-protect-your-savings-from.aspx

7
However, the consistently flat CCC since 2007 suggests companies are
doing very little to mitigate these risks through operational cash flow
improvements. Such improvements in the CCC reduce the amount of
time each dollar is tied up in the buying, production, and sales process
before it is converted into cash through sales to customers. The lower
the CCC, the better. Some companies even strive to achieve negative
CCC, where the product is made and customer cash is received before
suppliers are paid. Think end consumers paying for the Apple Watch™
before they receive it – Apple’s CCC is an incredibly great negative 56
days. The CCC has improved only one day since 2007 (-3%), and there
were recently only 30 companies whose executives mentioned the CCC
in their Q1 2015 earnings transcripts3, confirming Mr. Buffett’s
comments above.
Companies focused on cash management are in great cash health
Not all companies are completely ignoring cash flow management.
Ninety-six companies (10%) improved their CCC every year for the past
three years. Yet, as we expand that time frame, we find fewer and fewer
companies really able to consistently improve, suggesting after three
years the weeds begin to grow back. There are only five companies that
improved their CCC every year since 2007 (Amerisource Bergen,
Diebold, EQT, Goodyear, and Masco). These companies have seen a
substantial improvement in their cash metrics since 2007 vs. the entire
REL 1000, with over 200% greater cash on hand, 7% more cash on
hand as a percent of revenue, 20% higher capital expenditures, 21% less
debt, and a 171% improvement in the CCC. We believe the debt gap
would have been even larger, but two companies doubled and tripled
their assets, suggesting an aggressive expansion/acquisition strategy.
Companies with large amounts of debt apathetically ignore cash
management
Further expanding this analysis to a larger sample size, and analyzing
based on the amount of debt incurred, also yielded some interesting
results. There were 219 companies with any reduction in debt, no matter
how large or how small; from 2007 to 2014, these companies had a 31%
average reduction in the CCC and 336% increase in cash on hand. The
328 companies that increased their debt 100% or more from 2007 to
2014 had an average 113% rise in the CCC and a decrease of 1,500% in
their debt coverage ratio, but a 1,516% jump in cash on hand. So the
companies with the largest increases in debt also had the largest uptick in
cash on hand, but apathetically ignored their own ability to generate cash
independently.
These figures bring some interesting questions to the forefront for
corporate leadership and investors to consider. Is there really an
abundance of cash? Has the Great Recession taught U.S. companies
anything about the importance of cash reserves? How much longer can
cheap debt be the source of investment activity? Have corporations
borrowed too much? When is the Federal Reserve going to raise interest
rates? What is the long-term impact of all this debt? How are companies
proactively managing, if at all?
Not all industries are equal
The latest REL 1000 study has identified an opportunity gap between
top performers and bottom performers by industry totaling $1 trillion.
While all three areas of working capital offer improvement potential, the
largest performance gaps in 2014 lie in inventory and payables.
The Cash King Is Dead. All Hail the New King: Debt
3. http://seekingalpha.com/search/transcripts?term=%22cash%20conversion%20cycle%22&all=true
8
Some select industries have improved their performance over the past
year. Technology hardware, having first moved into negative CCC in
2010, has continued to improve with stellar DPO performance in 2014.
Biotechnology has seen improved DIO, as inventory management
initiatives take effect, while the paper and forest products industry has
witnessed an improvement in both inventory and receivables
performance. Additional industries have seen working capital
performance decline over the past year, including some short term, such
as the DSO increase in construction and engineering. Other impacts are
symptoms of permanent changes in the marketplace, such as retailer
consolidation driving down DSO in the personal products industry,
while in the Internet and catalog retailing industry payables performance
has continued the downward drift first seen in 2011.
The road ahead
The U.S. economy definitely is enjoying all of the benefits of
acceleration. However, the source and apathetic management of cash
flow are concerning. In 2015, we expect the trend to continue and debt
to grow significantly, as companies take advantage of cheap borrowing
costs for what is expected to be the last opportunity for a long while. If
and when interest rates are raised, companies focused on optimizing
their CCC will be best positioned to mitigate their risk, continue using
cash for investment activities, and outperform their peers not only in
areas directly related to cash, but also in the downstream elements
impacting cost and internal/external service.
Companies wishing to improve their CCC should start by understanding
their gaps in each component: receivables (DSO), payables (DPO), and
inventory (DIO). Utilizing peer comparisons for similar organizations
within the industry is a good place to start when evaluating potential
cash flow benefits.
The Cash King Is Dead. All Hail the New King: Debt
About REL
REL, a division of The Hackett Group, Inc. (NASDAQ:HCKT), is a world-leading
consulting firm dedicated to delivering sustainable cash flow improvement from working
capital and across business operations. REL’s tailored working capital management
solutions balance client trade-offs among working capital, operating costs, service performance,
and risk. The company’s expertise has helped clients free up billions of dollars in cash,
creating the financial freedom to fund acquisitions, product development, debt reduction, and
share buy-back programs. REL has delivered work in over 60 countries for Fortune 500
and global Fortune 500 companies.
To learn more and download the full research, please visit
http://www.thehackettgroup.com/solutions/working-capital-management/

9
Mergers & Acquisitions Representative Transactions
Bryant Park Capital

10
Capital Raising Representative Transactions
Bryant Park Capital