Embed Size (px)
Citation preview
MIDDL E M ARKE T ON S T RONG PACE UPPER MIDDL E M ARKE T P OISED F OR BIG Y E AR
League TablesPAGE 14»
MIDDLEMARKETREPORT
3Q 2015
U.S.
S P O N S O R E D B Y
Fundraising ActivityPAGE 12-13»
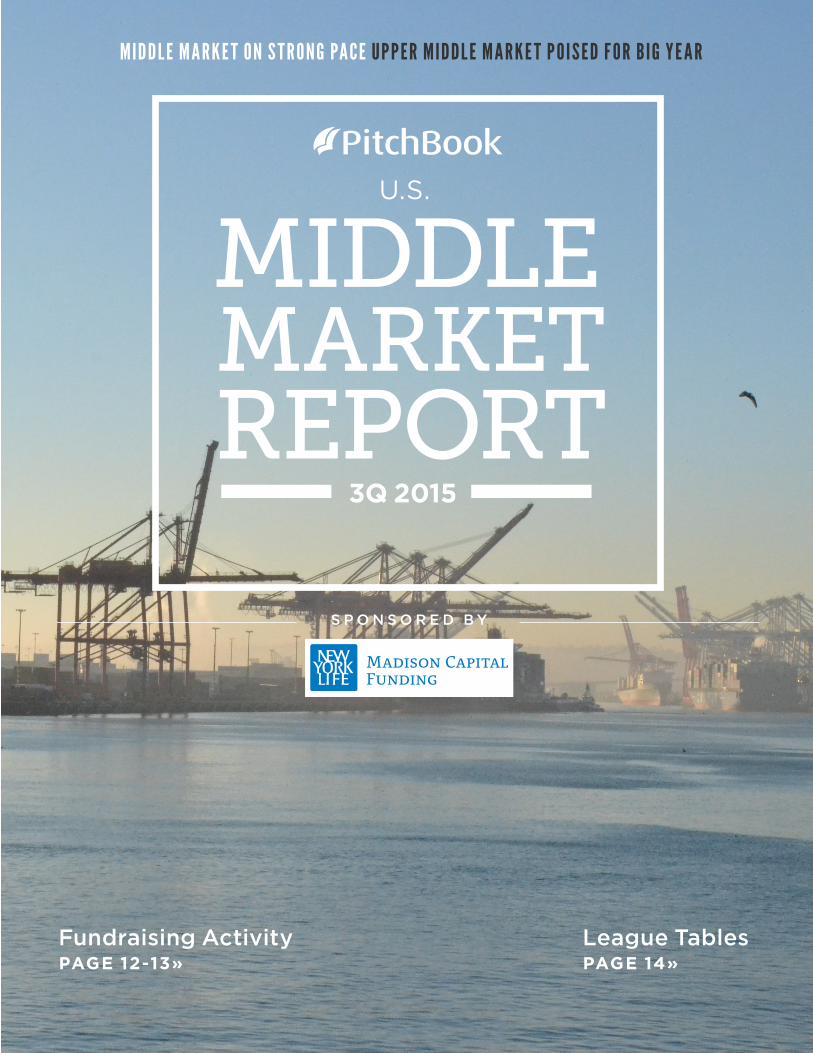
Built for growth.Communicate. Commit. Deliver.™
To learn more about our � nancial strength and disciplined approach, call 312-596-6900 or visit mc� lc.com.MANUFACTURING | DISTRIBUTION | SERVICES | CONSUMER PRODUCTS | HEALTHCARE | INSURANCE/FINANCIAL SERVICES | AEROSPACE & DEFENSE | TECHNOLOGY SERVICES
© 2015 NYL Investors LLC. All rights reserved. Madison Capital Funding is a division of NYL Investors LLC. MC007-15 34752 10/16
We have the longevity, products, and expertise to support your transactions from start to � nish.
Undisclosed
Sole Lead Arranger and Administrative AgentAdd-on Acquisition
May 2015
$67,500,000
Sole Lead Arranger and Administrative AgentAdd-on Acquisition
June 2015
$82,000,000
Co-Lead Arranger and Administrative AgentAdd-on Acquisition
June 2015
$108,400,000
Co-Lead Arranger and Co-Syndication Agent
Add-on Acquisition
June 2015
$179,000,000
Co-Lead Arranger and Administrative AgentAdd-on Acquisition
June 2015
Undisclosed
Syndication Agent
Add-on Acquisition
April 2015
$142,000,000
Sole Lead Arranger and Administrative AgentAdd-on Acquisition
March 2015
Undisclosed
Sole Lead Arranger and Administrative AgentAdd-on Acquisition
March 2015
Undisclosed
Sole Lead Arranger and Administrative AgentAdd-on Acquisition
June 2015
Sole Lead Arranger and
Consumer Products Company
$332,600,000
Administrative Agent
Add-on Acquisition
June 2015Private Equity
Company
Undisclosed
Sole Lead Arranger and Administrative AgentAdd-on Acquisition
April 2015
$57,900,000
Syndication Agent
Add-on Acquisition
July 2015

CONTENTSIntroduction
Middle Market Overview
Activity by Region
Middle Market Breakdown
Exit Activity
Fundraising Activity
League Tables
Methodology
4
5
7
8-10
11
12-13
14
15
CREDITS & CONTACT
PitchBook Data, Inc.
JOHN GABBERT Founder, CEO
ADLEY BOWDEN Senior Director, Analysis
Content, Design, Editing & Data
ALEX LYKKEN Editor
ANDY WHITE Lead Data Analyst
DANIEL COOK Senior Data Analyst
GARRETT BLACK Senior Financial Writer
NIZAR TARHUNI Financial Writer
BRIAN LEE Data Analyst
CHELSEA HARRIS Data Analyst
JENNIFER SAM Senior Graphic Designer
JESS CHAIDEZ Graphic Designer
Contact PitchBook
www.pitchbook.com
RESEARCH
EDITORIAL
SALES
COPYRIGHT © 2015 by PitchBook Data, Inc. All rights reserved. No part of this publication may be reproduced in any form or by any means—graphic, electronic, or mechanical, including photocopying, recording, taping, and information storage and retrieval systems—without the express written permission of PitchBook Data, Inc. Contents are based on information from sources believed to be reliable, but accuracy and completeness cannot be guaranteed. Nothing herein should be construed as any past, current or future recommendation to buy or sell any security or an offer to sell, or a solicitation of an offer to buy any security. This material does not purport to contain all of the information that a prospective investor may wish to consider and is not to be relied upon as such or used in substitution for the exercise of independent judgment.
3 PITCHBOOK 3Q 2015
U.S . PE MIDDLE MARKET REPORT
IntroductionMarkets worldwide are rife with uncertainty. The Eurozone struggles to contain ongoing
ramifications of the financial crisis, China contends with a market crash; the list goes on. Private equity investors, gearing up for investments that will last at least a couple business cycles, are hard-pressed to deploy their ample stores of dry powder, especially with persistently high multiples.
Yet there are some relatively bright spots, such as the U.S. middle market, to which investors are still turning in mass droves. The middle market’s percentage of buyout activity is holding steady at a record high through the first half of 2015, even as the decline in overall U.S. PE activity entailed a slight softening in middle-market numbers. That softening illustrates how the middle market isn’t immune from industry pressures, however. As it grows ever more popular as an investment destination, competition is mounting. We’ve heard of firms with a traditional middle-market investment focus shifting their attention to the lower and core reaches of the market as the upper end grows more heated. The numbers seen in the upper middle market (UMM) in particular are some of the strongest in the middle market as a whole, an outcome we anticipated by how
much limited partner (LP) interest in the UMM has been evidenced by commitments to funds in the $1 billion to $5 billion range.
It wasn’t just fundraising foreshadowing strong UMM numbers. The rise of alternative lending supplanting banks’ traditional role in financing buyouts has long been heralded as regulatory pressure increased. With GE Capital’s pending sale portending a gap in the market, top contenders in the space are jockeying for
position. Consequently, lenders are competing to win financings with ever-more favorable terms and structures, contributing to sustained PE activity in the UMM even as multiples inflate. Investors are employing larger debt components in capital structures in response. With a hike in interest rates anticipated as eventual
yet slight, that may shift things somewhat yet not substantially. The middle market—in particular its upper reaches—looks set for continued strong if not record-busting numbers.
We hope the data and commentary in this report prove helpful and informative in your decision-making process in the coming quarters. If you have any questions, comments or suggestions, please reach out to us at [email protected].
The middle market remains popular, even as investors
contend with growing competition.
Madison Capital’s focus is to provide superior financing solutions to a wide range of private equity sponsors. Our products and services support the acquisition, recapitalization and growth investment efforts of private equity firms focused on middle market companies.
Our reputation is built on key relationships and effective communication.
We build relationships by concentrating on the needs of our clients and delivering outstanding services.
4 PITCHBOOK 3Q 2015
U.S . PE MIDDLE MARKET REPORT

Middle Market Overview
Current middle-market numbers mask underlying
pressures. The figures are strong still, with an uptick in completed investments and capital invested pushing 1H 2015 numbers to a hefty 895 deals worth a total of $159 billion. Those sums are hardly lackluster, although overshadowed by the towering totals of 2014—however, declines tend to occur in the wake of record-setting activity. Growing investor participation in middle-market investing and consequent competition is bearing fruit in the form of elevated multiples. Even if the wheels of dealmaking are still heavily greased by deep liquidity within capital markets and amenable lenders, an easing of pace is to be expected as the field grows more crowded and costly.
MIDDLE MARKET DEAL FLOW BY QUARTER
Source: PitchBook
MIDDLE MARKET DEAL FLOW BY YEAR
Source: PitchBook
$50
$50
$50
$80
$64
$66
$60
$71
$60
$65
$66
$97
$70
$59
$85
$89
$105
$94
$101
$100
$75
$84
236
234
258
401
301
361
303
337
335
363362
542
317274
467
439
534
465
498
414
431464
0
100
200
300
400
500
600
$0
$20
$40
$60
$80
$100
$120
1Q 2Q 3Q 4Q 1Q 2Q 3Q 4Q 1Q 2Q 3Q 4Q 1Q 2Q 3Q 4Q 1Q 2Q 3Q 4Q 1Q 2Q
2010 2011 2012 2013 2014 2015Capital Invested ($B) # of Deals Closed
$274
$352
$204
$84
$229
$261
$288
$303
$399
$159
1,421
1,793
1,195
652
1,129 1,302
1,601
1,497
1,911
895
0
500
1,000
1,500
2,000
2,500
$0
$100
$200
$300
$400
$500
2006 2007 2008 2009 2010 2011 2012 2013 2014 1H 15
Capital Invested ($B) # of Deals Closed
1H 2015 DEALS BY SECTOR AND SEGMENT
Source: PitchBook
47%
22%
37%
18%
26%
21%
5%
13%
16%
13%
7%
11%
3%
9%
5%
11%
15%
3%
7%
11%
0% 20% 40% 60% 80% 100%
LMM
CMM
UMM
B2B B2C Energy Financial Services Healthcare IT Materials and Resources
5 PITCHBOOK 3Q 2015
U.S . PE MIDDLE MARKET REPORT
Search companies, firms, or people... Live Chat
DASHBOARD COMPANIES & DEALS INVESTORS & BUYERS FUNDS & IRR LIMITED PARTNERS ADVISORS PEOPLE PUBLIC FINANCIALS CRM MORE
CAPITAL INVESTED & DEAL COUNT DEALS BY REGIONS
SEARCH RESULTS
SAVED SEARCHES
Europe League Table 40,672
Funds w/ Dry Powder 12,948
Open Funds 89
Recent IT Deals 51,176
500 Startups 114,382
NEWS & LIBRARY
Katzen Eye Group Goes Varsity
Energy
VCs Doing Better Than Ever
PE Breakdown
European Activity Highlights
2010 Vintage Buyout Funds
Top Exits by Industry
Brightside Acquisition AnaCap’d
Super Uber Round
Meritech Closes $500M Fund
Limited Partners
2,716 LP’s
Limited Partners Name (2,716)# Limited Partner Type # Affiliated Funds
# Affiliated Investors
1
2
3
4
5
6
7
8
9
10
11
12
13
New York State Common Retirement Fund
Pennsylvania State Employee’s Retirement S...Pennsylvania Public School Employee Retire...
Bell Atlantic Master Trust
Teachers Insurance and Annuity Assocation...
Massachusetts Pendon Reserves Investment...
Metropolitan Life Insurance
New York State Teachers Retirement System
Metlife Insurance Company of ConnecticutMassachusetts Mutual Life Insurance Company
China Insurance Company
Public Pension Fund
Public Pension Fund
Public Pension Fund
Corporate Pension
Insurance Company
Public Pension Fund
Insurance CompanyPublic Pension Fund
Insurance Company
Insurance Company
Public Pension Fund
594502
348333
328313
312308
304
274373
Download SalesforceDeselect All
Select Top 25
Select Page
Select All
Invert Selected
Show Selected Only
Remove Selected
New York State Teachers Retirement System Public Pension Fund 308
Bell Atlantic Master Trust Corporate Pension 333
AUM Private Equity
Private Equity (%) HQ Location HQ Ph
312192
158157
169136
185126
212
163147
Add Column
176,200.00
25,900.00
50,500.00103.35
178.50
59,700.00
516,206.00104,300.00
405,900.00
24,700.00181,980.00
13,919.80
25,900.00
8,040.00103.35
178.50
5,916.00
516,206.007,800.00
405,900.00
24,700.0018,371.00
8%
12%22%17%
42%
12%
7%8%
4.5%
7.3%10%
Albany, NY
Harrisburg, PA
Harrisburg, PA
Basking Ridge, NJ
New York, NY
Boston, MA
New York, NYAlbany, NY
Bloomfield, Ct
Springfield, MA
Quebec, Canada
Layouts:
LP Summary Layout Save Save As
126 104,300.00 7,800.00 8% Albany, NY
157 103.35 103.35 17% Basking Ridge, NJ
COMPANY SIGNALS
LiquidPlanner Seattle, WashingtonBusiness/ Productivity Software... -
Series BLast Inv. Type
May-2014Last Inv. Date
4Investor
Growth RateSize Multiple
45People
$24.32MVal. May 2014
Company Name
The Stiller
Bonobos
Growth Rate
10.2%
19.65%
Size Multiple
1.32K
150K
Total Capital Invested (millions, USD) Deal Count
2003 2004 2005 2006 2007 2008 2009 2010 2011 2012 2013 2014
2.73xx avg.
76th %ile
115%98th %ile
weekly
DON’T LET INCOMPLETE DATA LEAVE YOU
IN THE DARKPitchBook offers more visibility of the middle market landscape than any other source
Contact us for a demo of the financial
information technology trusted by leading
investors, companies and advisors
pitchbook.com | US + 1 206.623.1986 | UK +44 (0) 207.190.9809
Bet ter Data. Bet ter Decisions.PitchBook
Companies & Deals
Service Providers
Valuations & Multiples
InvestorsFunds & Performance
FinancialsLimited Partners
People
W E S T C O A S T
M O U N T A I N
M I D W E S T
S O U T H S O U T H E A S T
G R E A T L A K E S M I D - A T L A N T I C
N E W E N G L A N D
Activity by Region
MIDDLE MARKET DEALS (#) BY REGION
Source: PitchBook
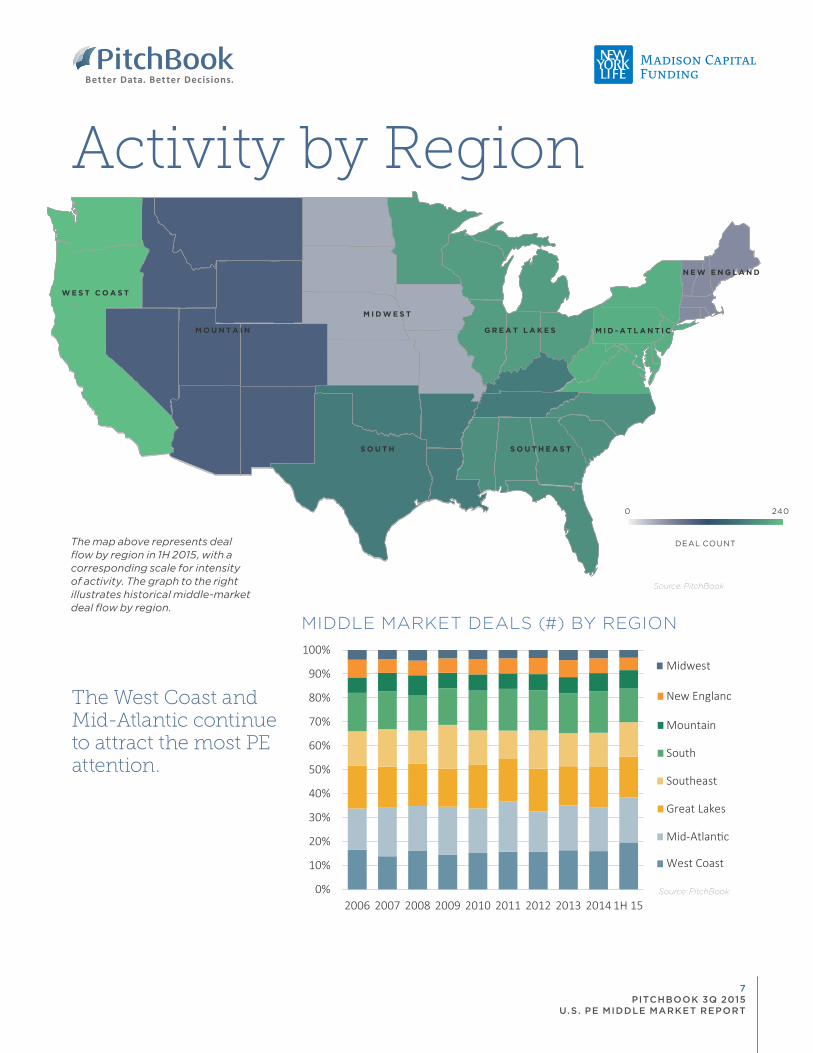
The map above represents deal flow by region in 1H 2015, with a corresponding scale for intensity of activity. The graph to the right illustrates historical middle-market deal flow by region.
LEGEND
Source: PitchBook
0 240
DEAL COUNT
0%
10%
20%
30%
40%
50%
60%
70%
80%
90%
100%
2006 2007 2008 2009 2010 2011 2012 2013 2014 1H 15
Midwest
New England
Mountain
South
Southeast
Great Lakes
Mid-Atlantic
West Coast
The West Coast and Mid-Atlantic continue to attract the most PE attention.
7 PITCHBOOK 3Q 2015
U.S . PE MIDDLE MARKET REPORT
Lower Middle MarketLMM DEAL FLOW BY QUARTER
SELECT LMM DEALS IN 2Q 2015
Source: PitchBook
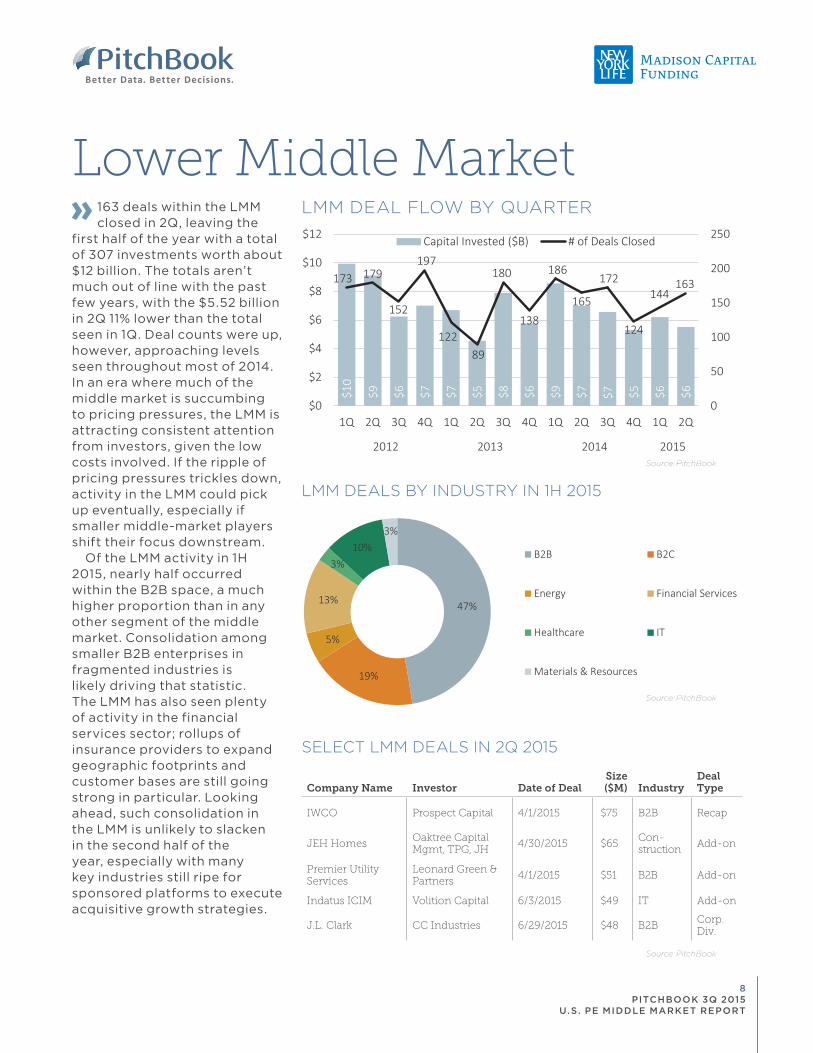
163 deals within the LMM closed in 2Q, leaving the
first half of the year with a total of 307 investments worth about $12 billion. The totals aren’t much out of line with the past few years, with the $5.52 billion in 2Q 11% lower than the total seen in 1Q. Deal counts were up, however, approaching levels seen throughout most of 2014. In an era where much of the middle market is succumbing to pricing pressures, the LMM is attracting consistent attention from investors, given the low costs involved. If the ripple of pricing pressures trickles down, activity in the LMM could pick up eventually, especially if smaller middle-market players shift their focus downstream.
Of the LMM activity in 1H 2015, nearly half occurred within the B2B space, a much higher proportion than in any other segment of the middle market. Consolidation among smaller B2B enterprises in fragmented industries is likely driving that statistic. The LMM has also seen plenty of activity in the financial services sector; rollups of insurance providers to expand geographic footprints and customer bases are still going strong in particular. Looking ahead, such consolidation in the LMM is unlikely to slacken in the second half of the year, especially with many key industries still ripe for sponsored platforms to execute acquisitive growth strategies.
LMM DEALS BY INDUSTRY IN 1H 2015
Company Name Investor Date of DealSize ($M) Industry
Deal Type
IWCO Prospect Capital 4/1/2015 $75 B2B Recap
JEH HomesOaktree Capital Mgmt, TPG, JH
4/30/2015 $65 Con-struction
Add-on
Premier Utility Services
Leonard Green & Partners
4/1/2015 $51 B2B Add-on
Indatus ICIM Volition Capital 6/3/2015 $49 IT Add-on
J.L. Clark CC Industries 6/29/2015 $48 B2BCorp. Div.
$10
$9 $6 $7 $7 $5 $8 $6 $9 $7 $7 $5 $6 $6
173 179
152
197
122 89
180
138
186
165
172
124
144 163
0
50
100
150
200
250
$0
$2
$4
$6
$8
$10
$12
1Q 2Q 3Q 4Q 1Q 2Q 3Q 4Q 1Q 2Q 3Q 4Q 1Q 2Q
2012 2013 2014 2015
Capital Invested ($B) # of Deals Closed
47%
19%
5%
13%
3%10%
3%
B2B B2C
Energy Financial Services
Healthcare IT
Materials & Resources
Source: PitchBook
Source: PitchBook
8 PITCHBOOK 3Q 2015
U.S . PE MIDDLE MARKET REPORT
Core Middle MarketCMM DEAL FLOW BY QUARTER
CMM DEALS BY INDUSTRY IN 1H 2015
Source: PitchBook
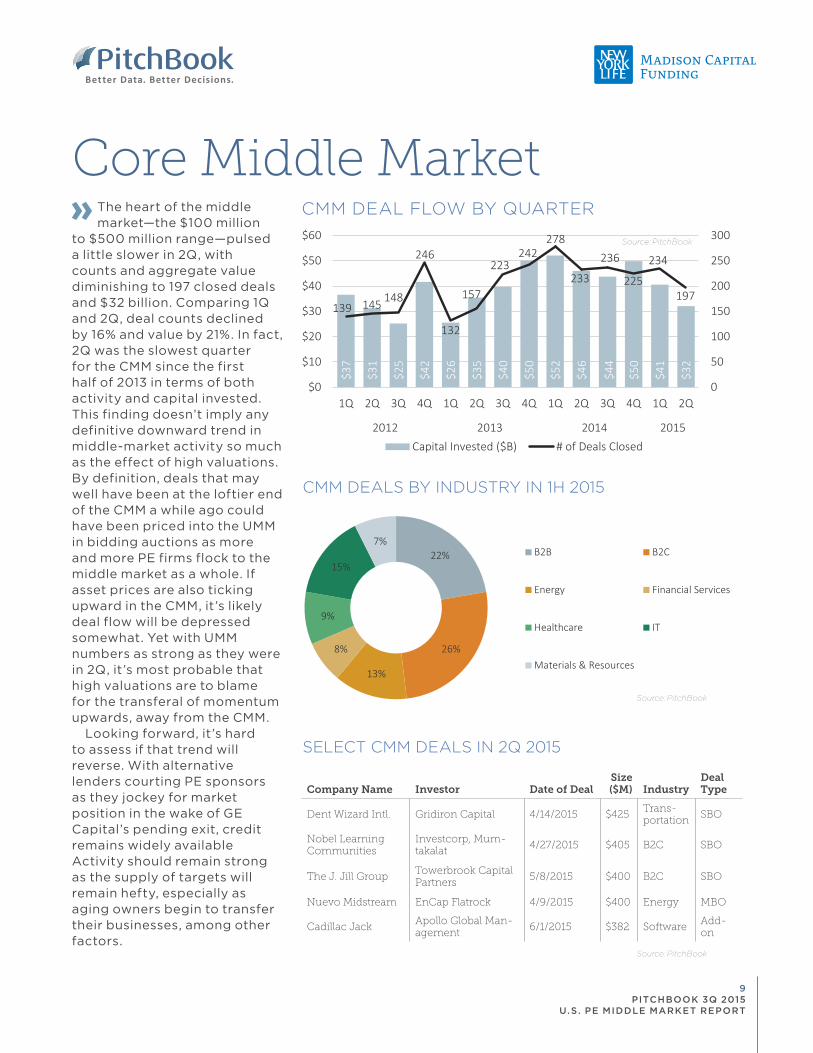
The heart of the middle market—the $100 million
to $500 million range—pulsed a little slower in 2Q, with counts and aggregate value diminishing to 197 closed deals and $32 billion. Comparing 1Q and 2Q, deal counts declined by 16% and value by 21%. In fact, 2Q was the slowest quarter for the CMM since the first half of 2013 in terms of both activity and capital invested. This finding doesn’t imply any definitive downward trend in middle-market activity so much as the effect of high valuations. By definition, deals that may well have been at the loftier end of the CMM a while ago could have been priced into the UMM in bidding auctions as more and more PE firms flock to the middle market as a whole. If asset prices are also ticking upward in the CMM, it’s likely deal flow will be depressed somewhat. Yet with UMM numbers as strong as they were in 2Q, it’s most probable that high valuations are to blame for the transferal of momentum upwards, away from the CMM.
Looking forward, it’s hard to assess if that trend will reverse. With alternative lenders courting PE sponsors as they jockey for market position in the wake of GE Capital’s pending exit, credit remains widely available Activity should remain strong as the supply of targets will remain hefty, especially as aging owners begin to transfer their businesses, among other factors.
SELECT CMM DEALS IN 2Q 2015
Company Name Investor Date of DealSize ($M) Industry
Deal Type
Dent Wizard Intl. Gridiron Capital 4/14/2015 $425Trans-portation
SBO
Nobel Learning Communities
Investcorp, Mum-takalat
4/27/2015 $405 B2C SBO
The J. Jill GroupTowerbrook Capital Partners
5/8/2015 $400 B2C SBO
Nuevo Midstream EnCap Flatrock 4/9/2015 $400 Energy MBO
Cadillac JackApollo Global Man-agement
6/1/2015 $382 SoftwareAdd-on
$37
$31
$25
$42
$26
$35
$40
$50
$52
$46
$44
$50
$41
$32
139 145 148
246
132
157
223242
278
233
236
225
234
197
0
50
100
150
200
250
300
$0
$10
$20
$30
$40
$50
$60
1Q 2Q 3Q 4Q 1Q 2Q 3Q 4Q 1Q 2Q 3Q 4Q 1Q 2Q
2012 2013 2014 2015Capital Invested ($B) # of Deals Closed
22%
26%
13%
8%
9%
15%
7%B2B B2C
Energy Financial Services
Healthcare IT
Materials & Resources
Source: PitchBook
Source: PitchBook
9 PITCHBOOK 3Q 2015
U.S . PE MIDDLE MARKET REPORT
Source: PitchBook
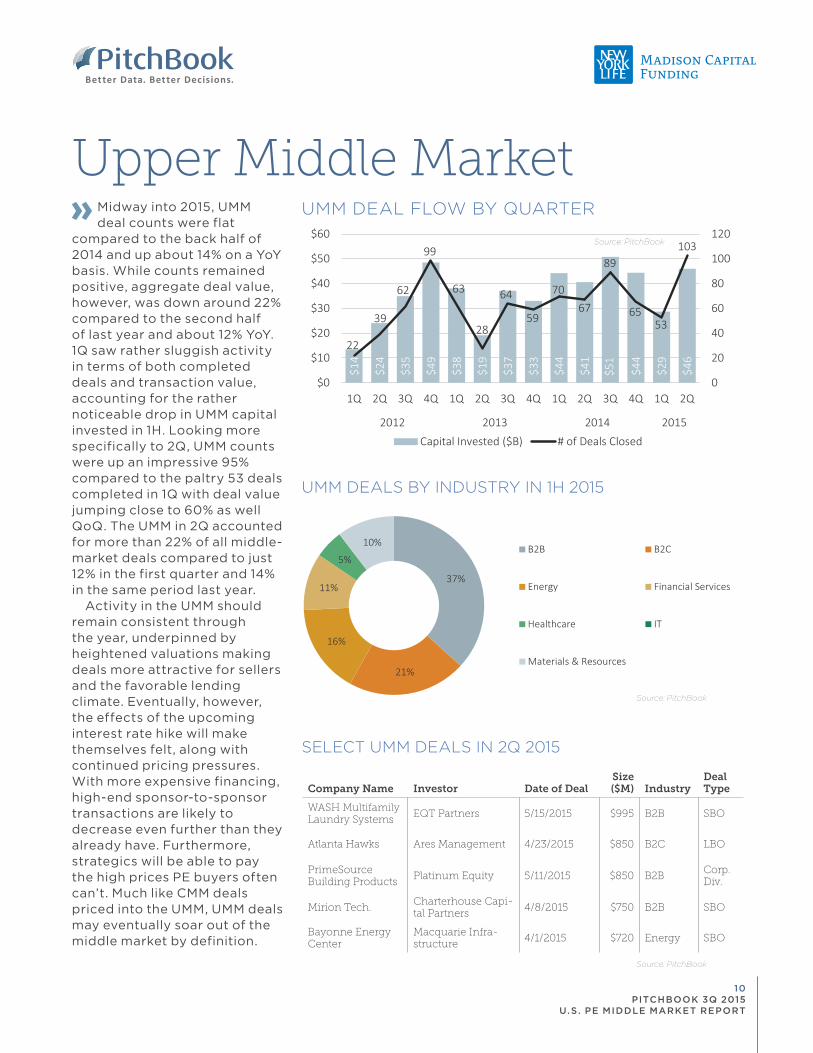
Upper Middle MarketUMM DEAL FLOW BY QUARTERMidway into 2015, UMM
deal counts were flat compared to the back half of 2014 and up about 14% on a YoY basis. While counts remained positive, aggregate deal value, however, was down around 22% compared to the second half of last year and about 12% YoY. 1Q saw rather sluggish activity in terms of both completed deals and transaction value, accounting for the rather noticeable drop in UMM capital invested in 1H. Looking more specifically to 2Q, UMM counts were up an impressive 95% compared to the paltry 53 deals completed in 1Q with deal value jumping close to 60% as well QoQ. The UMM in 2Q accounted for more than 22% of all middle-market deals compared to just 12% in the first quarter and 14% in the same period last year.
Activity in the UMM should remain consistent through the year, underpinned by heightened valuations making deals more attractive for sellers and the favorable lending climate. Eventually, however, the effects of the upcoming interest rate hike will make themselves felt, along with continued pricing pressures. With more expensive financing, high-end sponsor-to-sponsor transactions are likely to decrease even further than they already have. Furthermore, strategics will be able to pay the high prices PE buyers often can’t. Much like CMM deals priced into the UMM, UMM deals may eventually soar out of the middle market by definition.
SELECT UMM DEALS IN 2Q 2015
Company Name Investor Date of DealSize ($M) Industry
Deal Type
WASH Multifamily Laundry Systems
EQT Partners 5/15/2015 $995 B2B SBO
Atlanta Hawks Ares Management 4/23/2015 $850 B2C LBO
PrimeSource Building Products
Platinum Equity 5/11/2015 $850 B2B Corp. Div.
Mirion Tech.Charterhouse Capi-tal Partners
4/8/2015 $750 B2B SBO
Bayonne Energy Center
Macquarie Infra-structure
4/1/2015 $720 Energy SBO
$14
$24
$35
$49
$38
$19
$37
$33
$44
$41
$51
$44
$29
$46
22
39
62
99
63
28
64
59
7067
89
6553
103
0
20
40
60
80
100
120
$0
$10
$20
$30
$40
$50
$60
1Q 2Q 3Q 4Q 1Q 2Q 3Q 4Q 1Q 2Q 3Q 4Q 1Q 2Q
2012 2013 2014 2015
Capital Invested ($B) # of Deals Closed
UMM DEALS BY INDUSTRY IN 1H 2015
37%
21%
16%
11%
5%
10%B2B B2C
Energy Financial Services
Healthcare IT
Materials & Resources
Source: PitchBook
Source: PitchBook
10 PITCHBOOK 3Q 2015
U.S . PE MIDDLE MARKET REPORT

Exit ActivityMIDDLE MARKET EXITS BY YEAR
Source: PitchBook
We noted in our 2Q Middle Market report that between
1Q 2013 and the end of 2014, PE sellers enjoyed a nearly uninterrupted QoQ increase in exit counts; the first half of 2015 appears to have ended this trend. Midway through this year we’ve seen middle-market counts decline from the 266 high we saw in the fourth quarter of 2014 to just 190 exits in 2Q 2015, offset by both a YoY and QoQ increase in UMM exits. Capital exited was also down in 1H 2015 when looking at the UMM, yet the second quarter helped recapture some of the momentum lost since the end of last year, with 2Q exit values jumping just over 61% QoQ to $28.9 billion.
More than half of exits occurred in the CMM, however, UMM deals jumped noticeably looking at both 1H and 2Q 2015. UMM accounted for about 24% of exits in 1H compared to 18% in 2H 2014 and just 34% in 2Q compared to 16% in 1Q. Complementing this observation, strategic acquisitions remained the most popular exit ramp for middle-market transactions thus far into 2015, responsible for about 63% and 57% of deals in 1H and 2Q, respectively. As strategic acquirers continue looking for growth, acquisitions in the UMM segment make the most sense, giving the increased likelihood companies in that size bucket can be immediately accretive to acquirers’ bottom lines. Further, PE-backed IPOs continued to slip throughout the front half of this year overall; while 2Q did see an uptick, we expect PE-backed IPOs to remain sluggish due to
changing corporate focuses and better alternative exit routes for portfolio companies. Corporate balance sheets continue to hold healthy cash accounts along with various financing
resources to pay top dollar for UMM companies. Accordingly, it seems reasonable to expect such transactions to remain in the sights of strategic acquirers through year end.
$27
$37
$26
$11
$39
$46$48
$36
$62
$30
$13
$11
$4
$7
$8
$8$9
$16
$19
$5
$21
$28
$8
$3
$18
$17
$25
$20
$31
$12
0
100
200
300
400
500
600
700
$0
$20
$40
$60
$80
$100
$120
2006 2007 2008 2009 2010 2011 2012 2013 2014 1H 15
Corporate Acquisition ($B) IPO ($B)Secondary Buyout ($B) Corporate Acquisition # of ExitsSecondary Buyout # of Exits IPO # of Exits
11 PITCHBOOK 3Q 2015
U.S . PE MIDDLE MARKET REPORT
Fundraising Activity
Source: PitchBook
Source: PitchBook
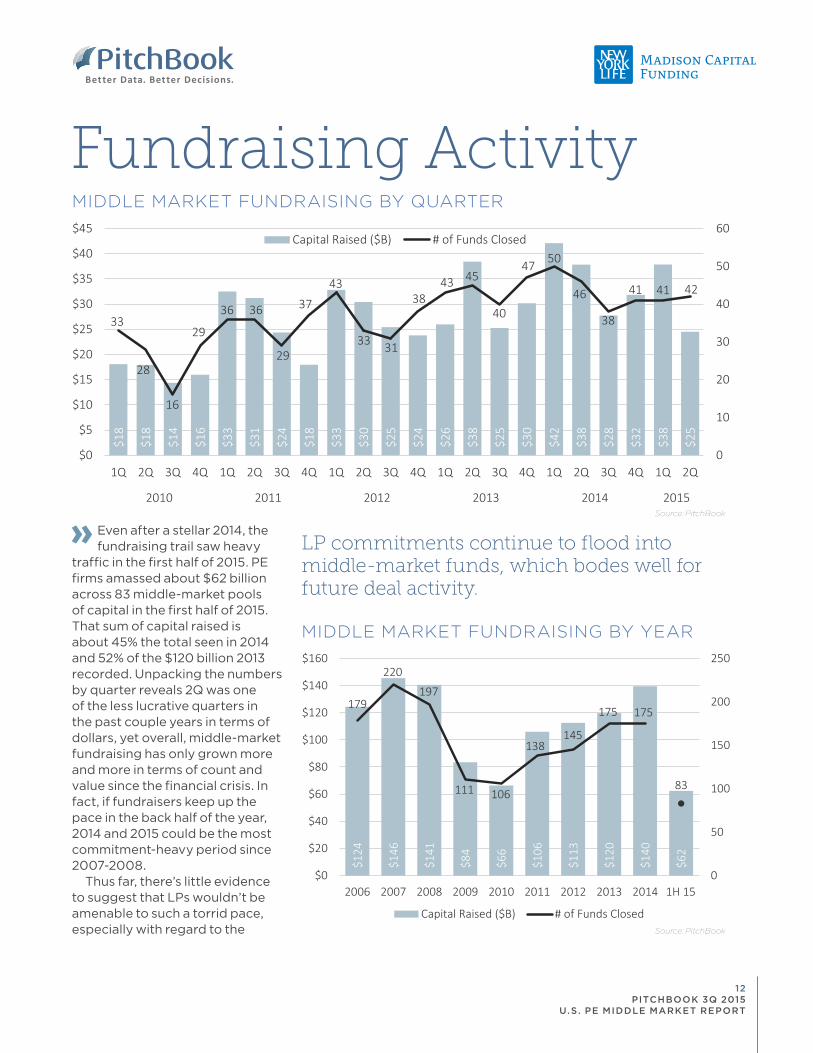
Even after a stellar 2014, the fundraising trail saw heavy
traffic in the first half of 2015. PE firms amassed about $62 billion across 83 middle-market pools of capital in the first half of 2015. That sum of capital raised is about 45% the total seen in 2014 and 52% of the $120 billion 2013 recorded. Unpacking the numbers by quarter reveals 2Q was one of the less lucrative quarters in the past couple years in terms of dollars, yet overall, middle-market fundraising has only grown more and more in terms of count and value since the financial crisis. In fact, if fundraisers keep up the pace in the back half of the year, 2014 and 2015 could be the most commitment-heavy period since 2007-2008.
Thus far, there’s little evidence to suggest that LPs wouldn’t be amenable to such a torrid pace, especially with regard to the
MIDDLE MARKET FUNDRAISING BY QUARTER
MIDDLE MARKET FUNDRAISING BY YEAR
LP commitments continue to flood into middle-market funds, which bodes well for future deal activity.
$18
$18
$14
$16
$33
$31
$24
$18
$33
$30
$25
$24
$26
$38
$25
$30
$42
$38
$28
$32
$38
$25
33
28
16
29
36 36
29
37
43
33 31
38 43 45
40
47 50
46
38
41 41 42
0
10
20
30
40
50
60
$0
$5
$10
$15
$20
$25
$30
$35
$40
$45
1Q 2Q 3Q 4Q 1Q 2Q 3Q 4Q 1Q 2Q 3Q 4Q 1Q 2Q 3Q 4Q 1Q 2Q 3Q 4Q 1Q 2Q
2010 2011 2012 2013 2014 2015
Capital Raised ($B) # of Funds Closed
$124
$146
$141
$84
$66
$106
$113
$120
$140
$62
179
220
197
111 106
138145
175 175
83
0
50
100
150
200
250
$0
$20
$40
$60
$80
$100
$120
$140
$160
2006 2007 2008 2009 2010 2011 2012 2013 2014 1H 15
Capital Raised ($B) # of Funds Closed
12 PITCHBOOK 3Q 2015
U.S . PE MIDDLE MARKET REPORT
MIDDLE MARKET FUNDS (#) BY FUND SIZE
MIDDLE MARKET BUYOUT FUNDS AVERAGE TIME TO CLOSE (IN MONTHS)
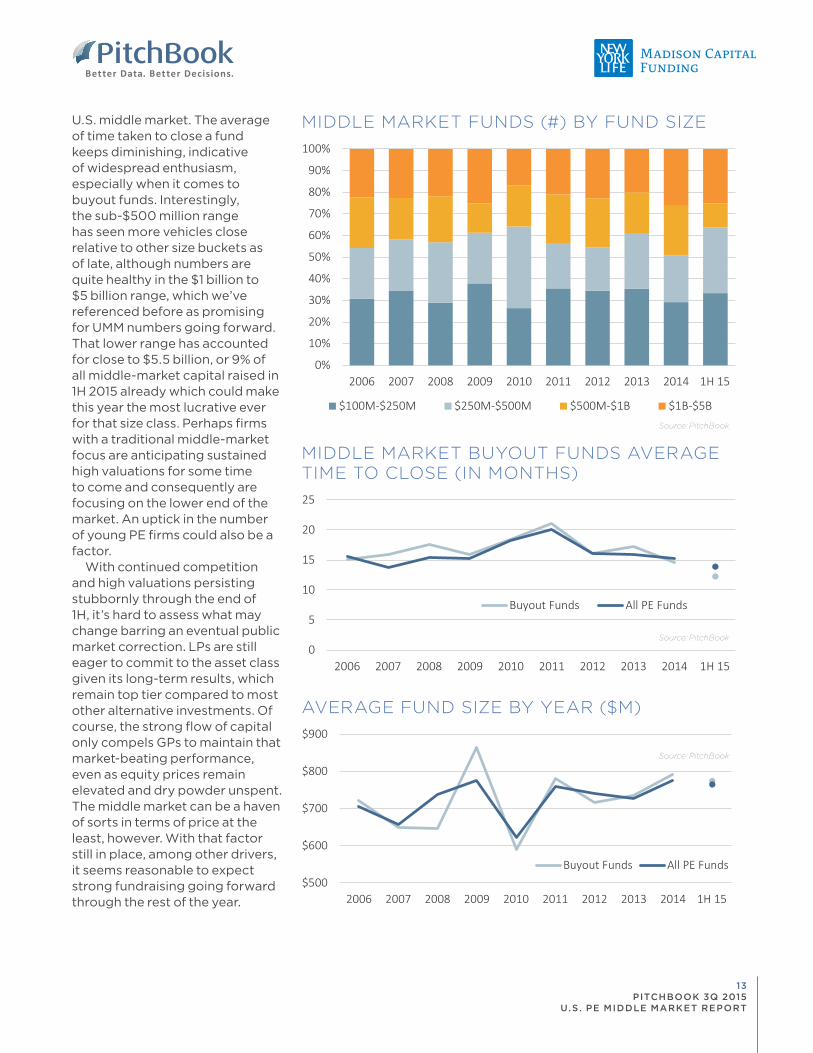
U.S. middle market. The average of time taken to close a fund keeps diminishing, indicative of widespread enthusiasm, especially when it comes to buyout funds. Interestingly, the sub-$500 million range has seen more vehicles close relative to other size buckets as of late, although numbers are quite healthy in the $1 billion to $5 billion range, which we’ve referenced before as promising for UMM numbers going forward. That lower range has accounted for close to $5.5 billion, or 9% of all middle-market capital raised in 1H 2015 already which could make this year the most lucrative ever for that size class. Perhaps firms with a traditional middle-market focus are anticipating sustained high valuations for some time to come and consequently are focusing on the lower end of the market. An uptick in the number of young PE firms could also be a factor.
With continued competition and high valuations persisting stubbornly through the end of 1H, it’s hard to assess what may change barring an eventual public market correction. LPs are still eager to commit to the asset class given its long-term results, which remain top tier compared to most other alternative investments. Of course, the strong flow of capital only compels GPs to maintain that market-beating performance, even as equity prices remain elevated and dry powder unspent. The middle market can be a haven of sorts in terms of price at the least, however. With that factor still in place, among other drivers, it seems reasonable to expect strong fundraising going forward through the rest of the year.
Source: PitchBook
Source: PitchBook
AVERAGE FUND SIZE BY YEAR ($M)
Source: PitchBook
0%
10%
20%
30%
40%
50%
60%
70%
80%
90%
100%
2006 2007 2008 2009 2010 2011 2012 2013 2014 1H 15
$100M-$250M $250M-$500M $500M-$1B $1B-$5B
0
5
10
15
20
25
2006 2007 2008 2009 2010 2011 2012 2013 2014 1H 15
Buyout Funds All PE Funds
$500
$600
$700
$800
$900
2006 2007 2008 2009 2010 2011 2012 2013 2014 1H 15
Buyout Funds All PE Funds
13 PITCHBOOK 3Q 2015
U.S . PE MIDDLE MARKET REPORT

MOST ACTIVE INVESTORS MOST ACTIVE LAW FIRMS
MOST ACTIVE ADVISORS
Source: PitchBook Source: PitchBook
Source: PitchBook
MOST ACTIVE LENDERS
Source: PitchBook
Madison Capital Funding
GE Capital
Ares Capital
CIT Group
BMO Harris Bank
Golub Capital
NewStar Financial
PNC Financial Services Group
Abacus Finance Group
Babson Capital Management
J.P. Morgan
MidCap Financial
Firm
2Q 2015 Middle Market League Tables
13
10
6
6
5
5
3
3
3
3
3
3
Deals
ABRY Partners
GTCR Golder Rauner
Hellman & Friedman
Ares Capital
The Carlyle Group
Audax Group
Kohlberg Kravis Roberts
The Jordan Company
The Riverside Company
TPG Capital
Vista Equity Partners
Huron Capital Partners
KRG Capital Partners
PNC Erieview Capital
Summit Partners
Warburg Pincus
Firm
21
11
11
9
8
7
7
7
7
7
7
6
6
6
6
6
Deals
Kirkland & Ellis
Jones Day
Latham & Watkins
Goodwin Procter
Morgan, Lewis & Bockius
DLA Piper
Paul, Weiss, Rifkind, Wharton
Paul Hastings
Ropes & Gray
Weil, Gotshal & Manges
Greenberg Traurig
Willkie Farr & Gallagher
McDermott Will & Emery
Sidley Austin
Debevoise & Plimpton
Dechert
Simpson Thacher & Bartlett
Firm
29
16
12
12
11
11
11
10
10
10
9
8
6
6
5
5
5
Deals
Houlihan Lokey
William Blair & Company
KPMG
Moelis & Company
Robert W. Baird & Co.
Raymond James Financial
Harris Williams & Co.
TM Capital
BB&T Capital Markets
Duff & Phelps
Lazard Middle Market
Goldman Sachs
Morgan Stanley
Firm
20
12
8
7
6
6
6
6
5
5
5
4
4
Deals
14 PITCHBOOK 3Q 2015
U.S . PE MIDDLE MARKET REPORT

MethodologyMIDDLE MARKET DEFINITION
For this report, the middle market (MM) is defined as U.S.-based companies acquired through buyout transactions between $25 million and $1 billion. Note that minority deals are not included. The middle market is further broken down into the lower middle market (LMM; $25 million to $100 million), the core middle market (CMM; $100 million to $500 million) and the upper middle market (UMM; $500 million to $1 billion). This report covers only U.S.-based middle-market companies that have received some type of private equity investment.
TOTAL CAPITAL INVESTED Total amount of equity and debt used in the private equity investment
Ex. $10 million of equity and $20 million of debt = $30 million of total capital investment
PitchBook’s total capital invested figures include deal amounts that were not collected by PitchBook but have been estimated using a multi-dimensional estimation matrix, which takes into account year of investment, deal type, platform v. add-on, industry and sector. Some data sets will include these extrapolated numbers while others will be compiled using only data collected directly by PitchBook; this explains any potential discrepancies that may be noticed.
FUNDRAISINGPitchBook defines middle-market funds as PE investment vehicles with between $100 million and $5 billion in capital commitments. The report only includes private equity funds that have held their final close. Funds-of-funds and LP secondary funds are not included.
EXITSThe report includes both full and partial exits of middle-market companies via corporate acquisition, secondary private equity buyout and initial public offering (IPO). PitchBook has utilized its multi-dimensional substitution and estimation matrix to estimate transaction sizes where the deal amount is unknown.
LEAGUE TABLESAll League Tables are compiled using deal counts for middle-market transactions. For example, the Most Active Advisors League Table shows the number of U.S.-based middle-market deals that a firm advised on during the second quarter of 2015. Deals on which a firm advised multiple parties will only be counted once for that firm.
15 PITCHBOOK 3Q 2015
U.S . PE MIDDLE MARKET REPORT