Embed Size (px)
Citation preview
MIDDLE LEVEL SCHOOLS IN AN ERA OF STANDARDS AND ACCOUNTABILITY:
ADAPTATIONS OF THE FEATURES OF THE MIDDLE SCHOOL CONCEPT
Kenneth Edward Nicely
Dissertation submitted to the faculty of the Virginia Polytechnic Institute and State
University in partial fulfillment of the requirements for the degree of
Doctor of Education
in
Educational Leadership and Policy Studies
James R. Craig, Chair
Cecil C. Snead
Min Sun
N. Wayne Tripp
March 16, 2012
Blacksburg, Virginia
Keywords: middle school, middles grades, young adolescents, student achievement, Innovation
Configuration map
MIDDLE LEVEL SCHOOLS IN AN ERA OF STANDARDS AND ACCOUNTABILITY:
ADAPTATIONS OF THE FEATURES OF THE MIDDLE SCHOOL CONCEPT
Kenneth Edward Nicely
ABSTRACT
The literature related to the development of education in the middle grades and to the features
associated with the implementation of the middle school concept provides a theoretical grounding for the
development and testing of an Innovation Configuration map for the middle school concept. The
description provided of the historical development of middle-grades education presents the context for
recent research studies and ongoing policy debate. In addition, features of the middle school concept as
described within the literature are identified and an overview of salient research findings related to these
features is given. A synthesis and critical review of previous research methodologies and findings reveal
the need for further research.
The purpose of the instrument development and testing process was to identify critical features of
the middle school concept implemented in the context of standards and accountability. The instrument
development and testing process investigated the nature of the implementation of middle school concept
features, recognizing that actual practices in schools may vary somewhat without the schools losing their
identity as middle level schools. The principle product of the process was the development of a diagnostic
tool that may be used in future research to identify acceptable forms of implementation of the middle
level philosophy of education. The instrument development and testing process employed research
methodology based on the Concerns-Based Adoption Model (CBAM) of Hall and Hord (2006).
Specifically, an Innovation Configuration map was developed identifying components of the middle level
philosophy of education and describing variations in implementation of the components.
iii
Dedication
I thank my God for the blessing of a loving and supportive family and the strength to persevere.
My wife, best friend, and partner Teresa Ann Nichols Nicely has been far more patient,
encouraging, and accommodating than I have had the right to ask her to be.
I dedicate this work to her; our children Samuel, Benjamin, and Emily; and to my parents
Ronald and Barbara Nicely in appreciation for helping to make this possible.
iv
Acknowledgements
Many people contributed to the journey I have experienced over the past four years. The
learning, study, and work required to prepare and complete the dissertation has been made
possible, and more pleasurable, with the support of professors, colleagues, fellow students,
friends, and family.
Dr. Jim Craig has patiently served as my advisor from the very beginning of the doctoral
experience and I sincerely appreciate his willingness to chair my dissertation committee and ably
guide me along the way. He has committed many hours to this project and I thank him for his
diligence, expertise, and spirit.
I appreciate the commitment of time and energy generously provided by the members of
my dissertation committee. Dr. Wayne Tripp has provided sage advice and meticulous editing.
Dr. Cecil Snead has been a mentor and encourager. Dr. Min Sun has provided timely and
welcome critique.
I acknowledge and thank the many participants in each phase of this project. This
includes the scholars, advocates, and practitioners who participated in the expert panel; the
colleagues who traveled and gave of their time to be a part of the IC mapping team; and
principals, superintendents, and school staff who allowed me to intrude in their schools to pilot
test the instrument.
I appreciate the support of my friends and colleagues in the Roanoke County school
division. Mike Riley and Beth Mast covered many athletic events for me to allow me to work on
this project. Thanks! The teachers and staff at Hidden Valley Middle School as well as
Superintendent Lorraine Lange have always been encouraging and I am proud to be associated
with them.
Finally, I thank my colleagues who were part of the Virginia Tech doctoral cohort. I have
learned from each one and have the highest respect for the work each person does on behalf of
the students of Virginia. My Panera Bread study and support group Linda and Janet have
especially contributed to my successfully completing my degree and this dissertation project.
They have sharpened my thinking, gently prodded me to keep working, and demonstrated
unselfish hospitality and generosity.
I am deeply grateful for the many ways each has helped me and made my life richer.
v
TABLE OF CONTENTS
CHAPTER I INTRODUCTION ................................................................................................. 1
BACKGROUND .............................................................................................................................. 1
STATEMENT OF THE PROBLEM ..................................................................................................... 2
PURPOSE OF THE INSTRUMENT DEVELOPMENT AND TESTING PROCESS ....................................... 3
SIGNIFICANCE OF THE INSTRUMENT DEVELOPMENT AND TESTING PROCESS ............................... 4
Scholarly Significance ............................................................................................................ 4
Practical Significance ............................................................................................................. 5
DEFINITIONS OF KEY TERMS ........................................................................................................ 5
Academic excellence. ......................................................................................................... 5
Advisory. ............................................................................................................................. 6
Collaboration....................................................................................................................... 6
Developmental responsiveness. .......................................................................................... 6
Interdisciplinary teaming. ................................................................................................... 6
Middle grades...................................................................................................................... 6
Professional learning communities. .................................................................................... 6
Socially equitable. ............................................................................................................... 7
Young adolescents. ............................................................................................................. 7
CHAPTER II REVIEW OF THE RELEVANT LITERATURE ............................................ 8
INTRODUCTION ............................................................................................................................ 8
SEARCH PROCESS ......................................................................................................................... 8
HISTORICAL PERSPECTIVE OF MIDDLE GRADES EDUCATION ..................................................... 10
Early Development of Elementary and Secondary Schools .................................................. 11
The Junior High School Movement ....................................................................................... 11
Middle School Concept ......................................................................................................... 12
Middle Grades in the Standards Movement Era ................................................................... 15
RESEARCH EXAMINING MIDDLE SCHOOL FEATURES AND STUDENT OUTCOMES ....................... 19
Evaluating the Features of the Standards-based Middle School Concept ........................... 19
Overview of Research on Features of Standards-based Middle School Concept ................ 21
vi
MacIver and Epstein (1991). ............................................................................................. 21
Lee and Smith (1993)........................................................................................................ 23
Stephens and Jenkins (1994). ............................................................................................ 25
Felner, Jackson, Kasak, Mulhall, Brand, and Flowers (1997). ......................................... 26
Offenberg (2001). ............................................................................................................. 27
Mertens and Flowers (2003). ............................................................................................ 29
Cook, Faulkner, and Kinne (2009). .................................................................................. 30
Jackson and Lunenburg (2010). ........................................................................................ 31
SYNTHESIS AND CONCLUSIONS .................................................................................................. 33
CHAPTER III METHODOLOGY ........................................................................................... 35
INTRODUCTION .......................................................................................................................... 35
PURPOSE OF THE INSTRUMENT DEVELOPMENT AND TESTING PROCESS ..................................... 35
CONCERNS-BASED ADOPTION MODEL ...................................................................................... 36
INNOVATION CONFIGURATION MAPPING ................................................................................... 38
METHODOLOGY FOR THE DEVELOPMENT OF A MIDDLE SCHOOL INNOVATION CONFIGURATION
MAP ........................................................................................................................................... 42
Phase One: Identification of the Components ...................................................................... 42
Phase Two: Developing the IC Map ..................................................................................... 47
Phase Three: Verifying the IC Map ...................................................................................... 49
SUMMARY .................................................................................................................................. 50
CHAPTER IV FINDINGS ......................................................................................................... 51
INTRODUCTION .......................................................................................................................... 51
RESTATEMENT OF THE PURPOSE ................................................................................................ 51
OVERVIEW OF THE INSTRUMENT DEVELOPMENT AND TESTING PROCESS .................................. 51
PHASE ONE FINDINGS: IDENTIFICATION OF KEY FEATURES OF MIDDLE GRADES EDUCATION .. 52
Description of the Participants ............................................................................................. 52
First Round of the Quasi-Delphi Exercise ............................................................................ 53
Synthesis of Middle Grades Features from Expert Panel and Major Frameworks ............. 54
Second Round of the Quasi-Delphi Exercise ........................................................................ 58
vii
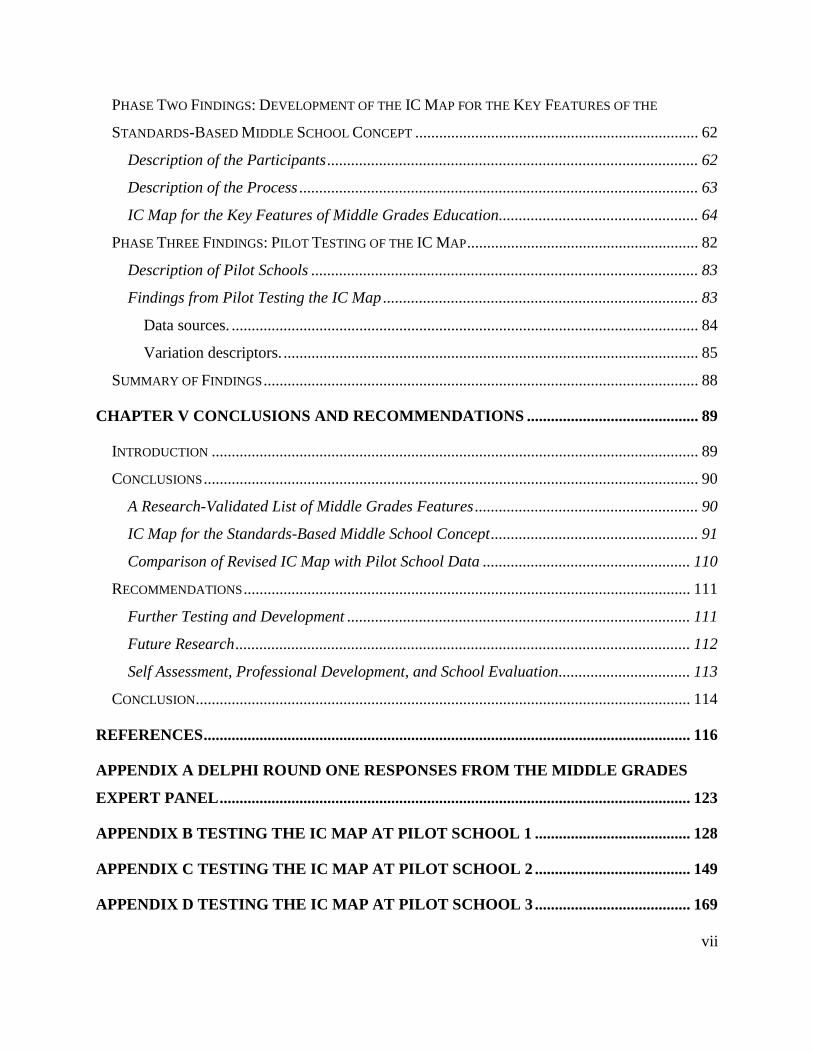
PHASE TWO FINDINGS: DEVELOPMENT OF THE IC MAP FOR THE KEY FEATURES OF THE
STANDARDS-BASED MIDDLE SCHOOL CONCEPT ....................................................................... 62
Description of the Participants ............................................................................................. 62
Description of the Process .................................................................................................... 63
IC Map for the Key Features of Middle Grades Education.................................................. 64
PHASE THREE FINDINGS: PILOT TESTING OF THE IC MAP .......................................................... 82
Description of Pilot Schools ................................................................................................. 83
Findings from Pilot Testing the IC Map ............................................................................... 83
Data sources. ..................................................................................................................... 84
Variation descriptors. ........................................................................................................ 85
SUMMARY OF FINDINGS ............................................................................................................. 88
CHAPTER V CONCLUSIONS AND RECOMMENDATIONS ........................................... 89
INTRODUCTION .......................................................................................................................... 89
CONCLUSIONS ............................................................................................................................ 90
A Research-Validated List of Middle Grades Features ........................................................ 90
IC Map for the Standards-Based Middle School Concept .................................................... 91
Comparison of Revised IC Map with Pilot School Data .................................................... 110
RECOMMENDATIONS ................................................................................................................ 111
Further Testing and Development ...................................................................................... 111
Future Research .................................................................................................................. 112
Self Assessment, Professional Development, and School Evaluation ................................. 113
CONCLUSION ............................................................................................................................ 114
REFERENCES .......................................................................................................................... 116
APPENDIX A DELPHI ROUND ONE RESPONSES FROM THE MIDDLE GRADES
EXPERT PANEL ...................................................................................................................... 123
APPENDIX B TESTING THE IC MAP AT PILOT SCHOOL 1 ....................................... 128
APPENDIX C TESTING THE IC MAP AT PILOT SCHOOL 2 ....................................... 149
APPENDIX D TESTING THE IC MAP AT PILOT SCHOOL 3 ....................................... 169

viii
APPENDIX E SUMMARY OF ANALYSIS OF FIT DATA FROM PILOT SCHOOLS. 191
APPENDIX F SUMMARY OF ANALYSIS OF FIT DATA FROM PILOT SCHOOLS
COMPARED TO REVISED IC MAP .................................................................................... 192
APPENDIX G TRAINING IN HUMAN SUBJECTS CERTIFICATE .............................. 193
ix
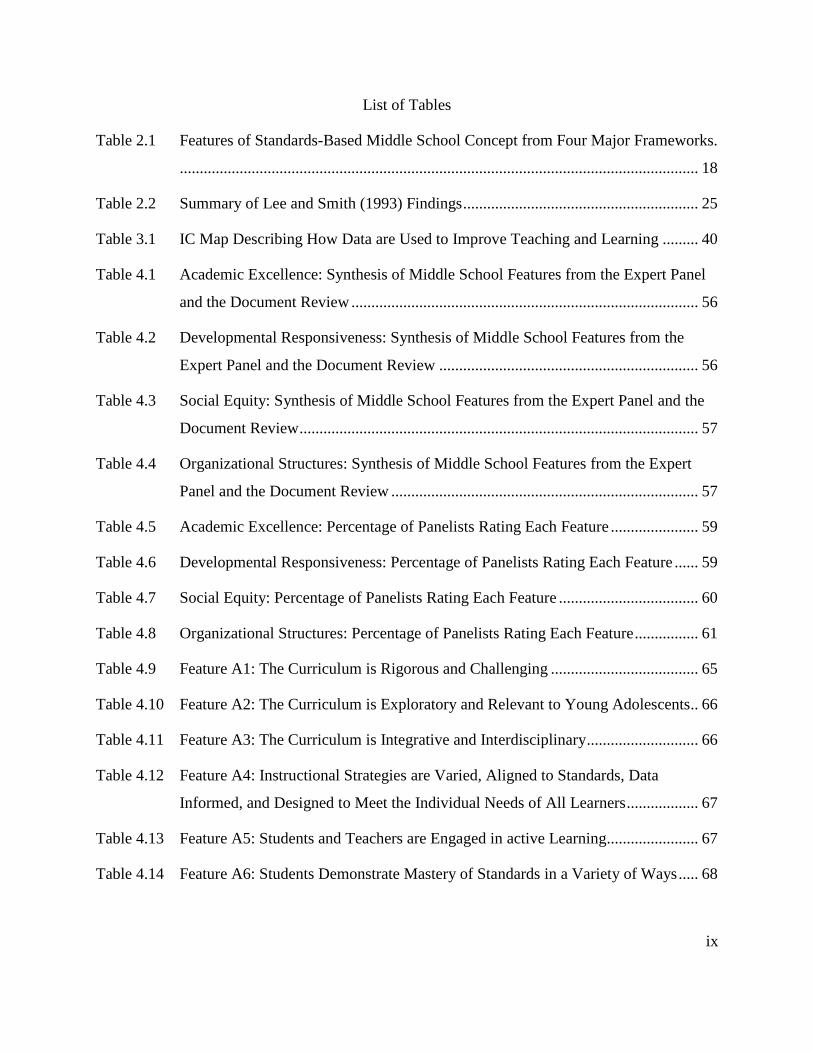
List of Tables
Table 2.1 Features of Standards-Based Middle School Concept from Four Major Frameworks.
.................................................................................................................................. 18
Table 2.2 Summary of Lee and Smith (1993) Findings ........................................................... 25
Table 3.1 IC Map Describing How Data are Used to Improve Teaching and Learning ......... 40
Table 4.1 Academic Excellence: Synthesis of Middle School Features from the Expert Panel
and the Document Review ....................................................................................... 56
Table 4.2 Developmental Responsiveness: Synthesis of Middle School Features from the
Expert Panel and the Document Review ................................................................. 56
Table 4.3 Social Equity: Synthesis of Middle School Features from the Expert Panel and the
Document Review .................................................................................................... 57
Table 4.4 Organizational Structures: Synthesis of Middle School Features from the Expert
Panel and the Document Review ............................................................................. 57
Table 4.5 Academic Excellence: Percentage of Panelists Rating Each Feature ...................... 59
Table 4.6 Developmental Responsiveness: Percentage of Panelists Rating Each Feature ...... 59
Table 4.7 Social Equity: Percentage of Panelists Rating Each Feature ................................... 60
Table 4.8 Organizational Structures: Percentage of Panelists Rating Each Feature ................ 61
Table 4.9 Feature A1: The Curriculum is Rigorous and Challenging ..................................... 65
Table 4.10 Feature A2: The Curriculum is Exploratory and Relevant to Young Adolescents .. 66
Table 4.11 Feature A3: The Curriculum is Integrative and Interdisciplinary ............................ 66
Table 4.12 Feature A4: Instructional Strategies are Varied, Aligned to Standards, Data
Informed, and Designed to Meet the Individual Needs of All Learners .................. 67
Table 4.13 Feature A5: Students and Teachers are Engaged in active Learning....................... 67
Table 4.14 Feature A6: Students Demonstrate Mastery of Standards in a Variety of Ways ..... 68
x
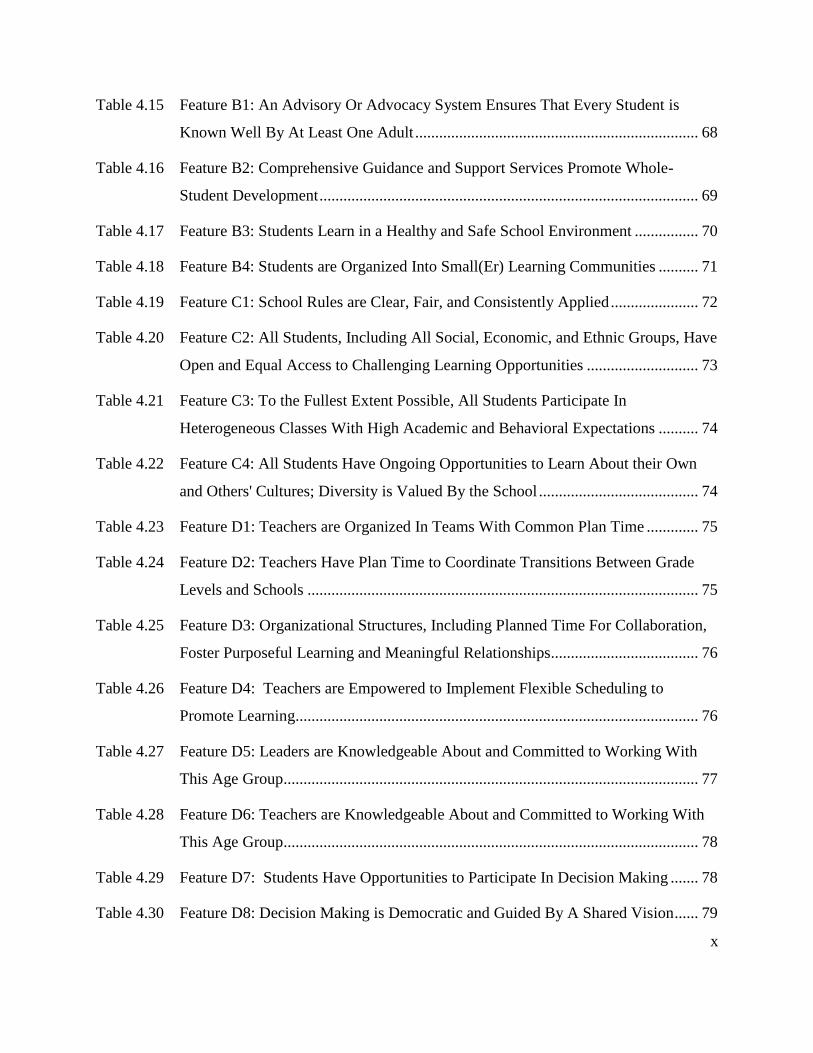
Table 4.15 Feature B1: An Advisory Or Advocacy System Ensures That Every Student is
Known Well By At Least One Adult ....................................................................... 68
Table 4.16 Feature B2: Comprehensive Guidance and Support Services Promote Whole-
Student Development ............................................................................................... 69
Table 4.17 Feature B3: Students Learn in a Healthy and Safe School Environment ................ 70
Table 4.18 Feature B4: Students are Organized Into Small(Er) Learning Communities .......... 71
Table 4.19 Feature C1: School Rules are Clear, Fair, and Consistently Applied ...................... 72
Table 4.20 Feature C2: All Students, Including All Social, Economic, and Ethnic Groups, Have
Open and Equal Access to Challenging Learning Opportunities ............................ 73
Table 4.21 Feature C3: To the Fullest Extent Possible, All Students Participate In
Heterogeneous Classes With High Academic and Behavioral Expectations .......... 74
Table 4.22 Feature C4: All Students Have Ongoing Opportunities to Learn About their Own
and Others' Cultures; Diversity is Valued By the School ........................................ 74
Table 4.23 Feature D1: Teachers are Organized In Teams With Common Plan Time ............. 75
Table 4.24 Feature D2: Teachers Have Plan Time to Coordinate Transitions Between Grade
Levels and Schools .................................................................................................. 75
Table 4.25 Feature D3: Organizational Structures, Including Planned Time For Collaboration,
Foster Purposeful Learning and Meaningful Relationships ..................................... 76
Table 4.26 Feature D4: Teachers are Empowered to Implement Flexible Scheduling to
Promote Learning..................................................................................................... 76
Table 4.27 Feature D5: Leaders are Knowledgeable About and Committed to Working With
This Age Group........................................................................................................ 77
Table 4.28 Feature D6: Teachers are Knowledgeable About and Committed to Working With
This Age Group........................................................................................................ 78
Table 4.29 Feature D7: Students Have Opportunities to Participate In Decision Making ....... 78
Table 4.30 Feature D8: Decision Making is Democratic and Guided By A Shared Vision ...... 79
xi
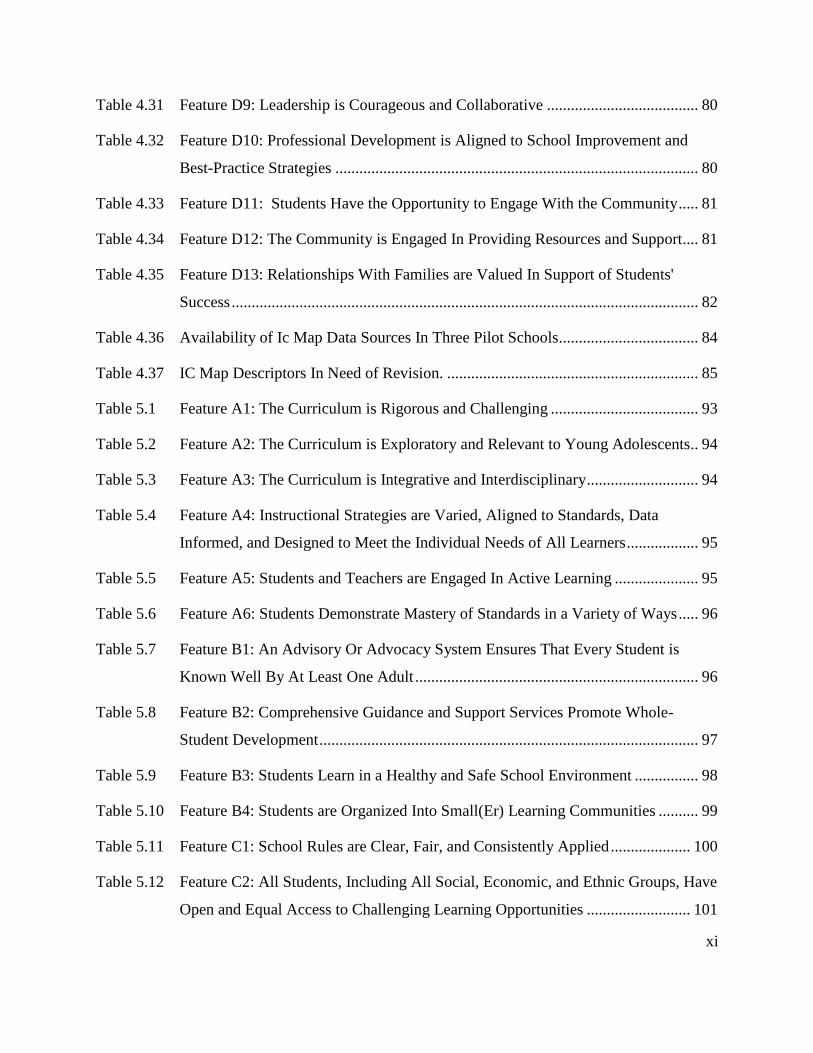
Table 4.31 Feature D9: Leadership is Courageous and Collaborative ...................................... 80
Table 4.32 Feature D10: Professional Development is Aligned to School Improvement and
Best-Practice Strategies ........................................................................................... 80
Table 4.33 Feature D11: Students Have the Opportunity to Engage With the Community ..... 81
Table 4.34 Feature D12: The Community is Engaged In Providing Resources and Support.... 81
Table 4.35 Feature D13: Relationships With Families are Valued In Support of Students'
Success ..................................................................................................................... 82
Table 4.36 Availability of Ic Map Data Sources In Three Pilot Schools................................... 84
Table 4.37 IC Map Descriptors In Need of Revision. ............................................................... 85
Table 5.1 Feature A1: The Curriculum is Rigorous and Challenging ..................................... 93
Table 5.2 Feature A2: The Curriculum is Exploratory and Relevant to Young Adolescents .. 94
Table 5.3 Feature A3: The Curriculum is Integrative and Interdisciplinary ............................ 94
Table 5.4 Feature A4: Instructional Strategies are Varied, Aligned to Standards, Data
Informed, and Designed to Meet the Individual Needs of All Learners .................. 95
Table 5.5 Feature A5: Students and Teachers are Engaged In Active Learning ..................... 95
Table 5.6 Feature A6: Students Demonstrate Mastery of Standards in a Variety of Ways ..... 96
Table 5.7 Feature B1: An Advisory Or Advocacy System Ensures That Every Student is
Known Well By At Least One Adult ....................................................................... 96
Table 5.8 Feature B2: Comprehensive Guidance and Support Services Promote Whole-
Student Development ............................................................................................... 97
Table 5.9 Feature B3: Students Learn in a Healthy and Safe School Environment ................ 98
Table 5.10 Feature B4: Students are Organized Into Small(Er) Learning Communities .......... 99
Table 5.11 Feature C1: School Rules are Clear, Fair, and Consistently Applied .................... 100
Table 5.12 Feature C2: All Students, Including All Social, Economic, and Ethnic Groups, Have
Open and Equal Access to Challenging Learning Opportunities .......................... 101
xii
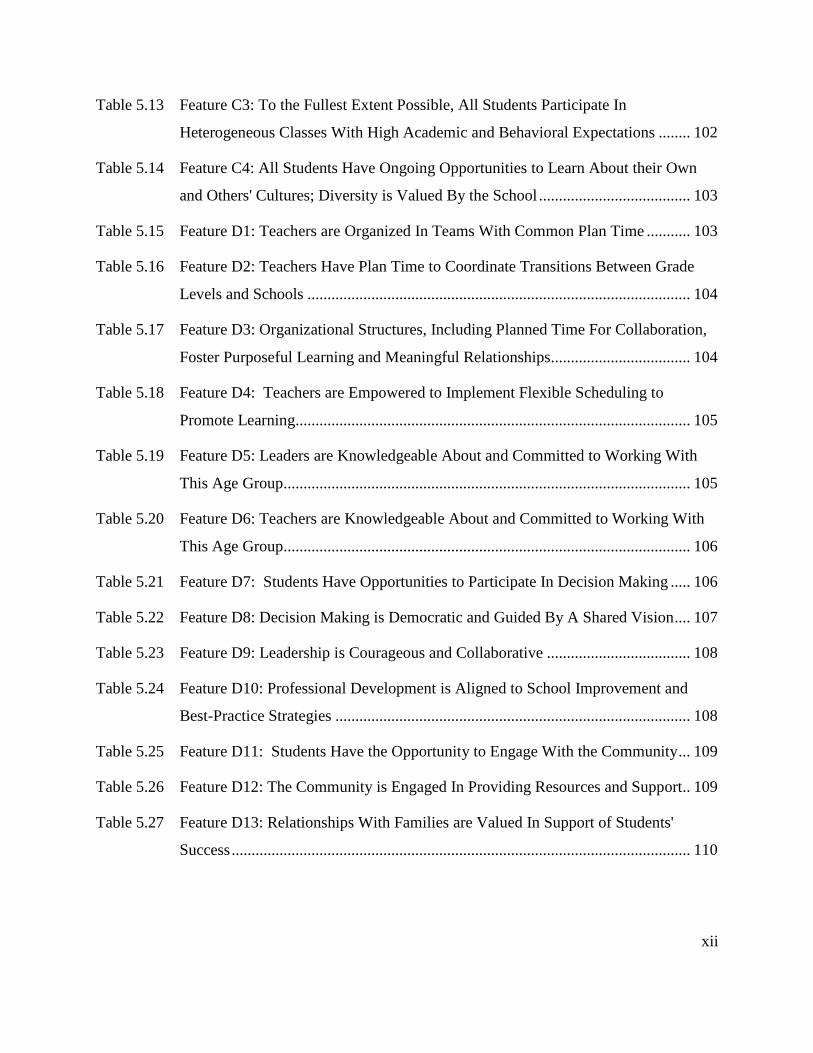
Table 5.13 Feature C3: To the Fullest Extent Possible, All Students Participate In
Heterogeneous Classes With High Academic and Behavioral Expectations ........ 102
Table 5.14 Feature C4: All Students Have Ongoing Opportunities to Learn About their Own
and Others' Cultures; Diversity is Valued By the School ...................................... 103
Table 5.15 Feature D1: Teachers are Organized In Teams With Common Plan Time ........... 103
Table 5.16 Feature D2: Teachers Have Plan Time to Coordinate Transitions Between Grade
Levels and Schools ................................................................................................ 104
Table 5.17 Feature D3: Organizational Structures, Including Planned Time For Collaboration,
Foster Purposeful Learning and Meaningful Relationships ................................... 104
Table 5.18 Feature D4: Teachers are Empowered to Implement Flexible Scheduling to
Promote Learning................................................................................................... 105
Table 5.19 Feature D5: Leaders are Knowledgeable About and Committed to Working With
This Age Group...................................................................................................... 105
Table 5.20 Feature D6: Teachers are Knowledgeable About and Committed to Working With
This Age Group...................................................................................................... 106
Table 5.21 Feature D7: Students Have Opportunities to Participate In Decision Making ..... 106
Table 5.22 Feature D8: Decision Making is Democratic and Guided By A Shared Vision .... 107
Table 5.23 Feature D9: Leadership is Courageous and Collaborative .................................... 108
Table 5.24 Feature D10: Professional Development is Aligned to School Improvement and
Best-Practice Strategies ......................................................................................... 108
Table 5.25 Feature D11: Students Have the Opportunity to Engage With the Community ... 109
Table 5.26 Feature D12: The Community is Engaged In Providing Resources and Support.. 109
Table 5.27 Feature D13: Relationships With Families are Valued In Support of Students'
Success ................................................................................................................... 110
xiii
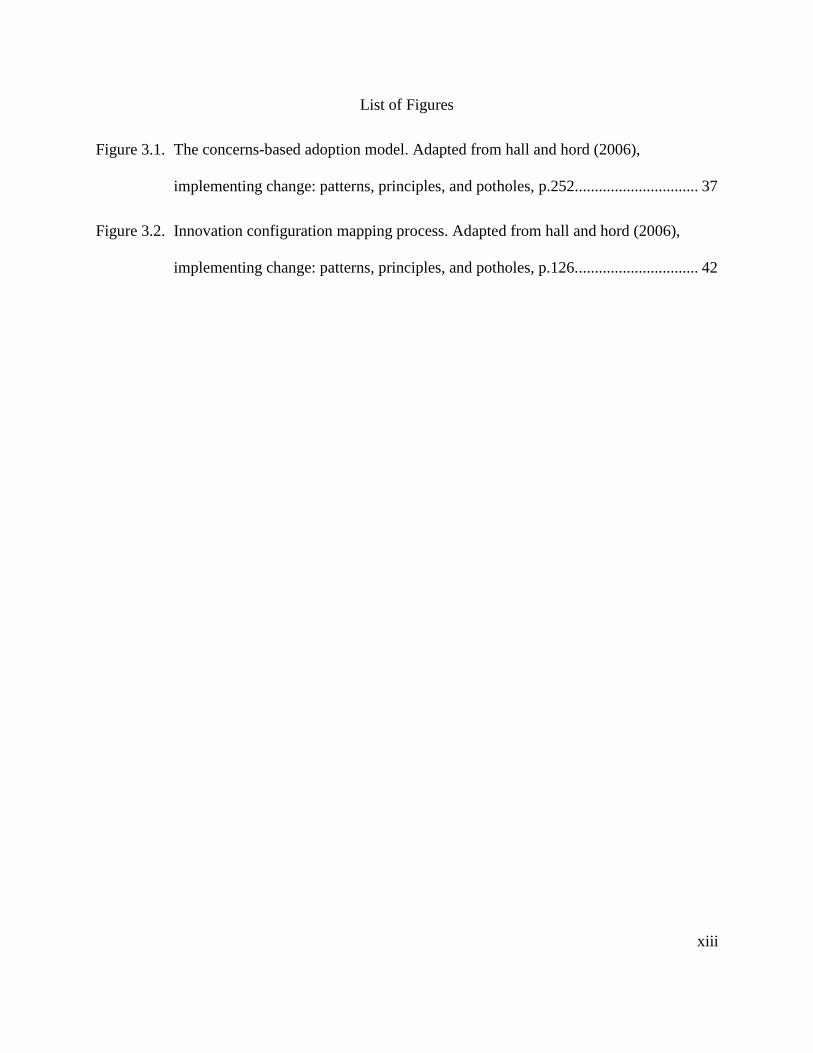
List of Figures
Figure 3.1. The concerns-based adoption model. Adapted from hall and hord (2006),
implementing change: patterns, principles, and potholes, p.252. .............................. 37
Figure 3.2. Innovation configuration mapping process. Adapted from hall and hord (2006),
implementing change: patterns, principles, and potholes, p.126. .............................. 42
1
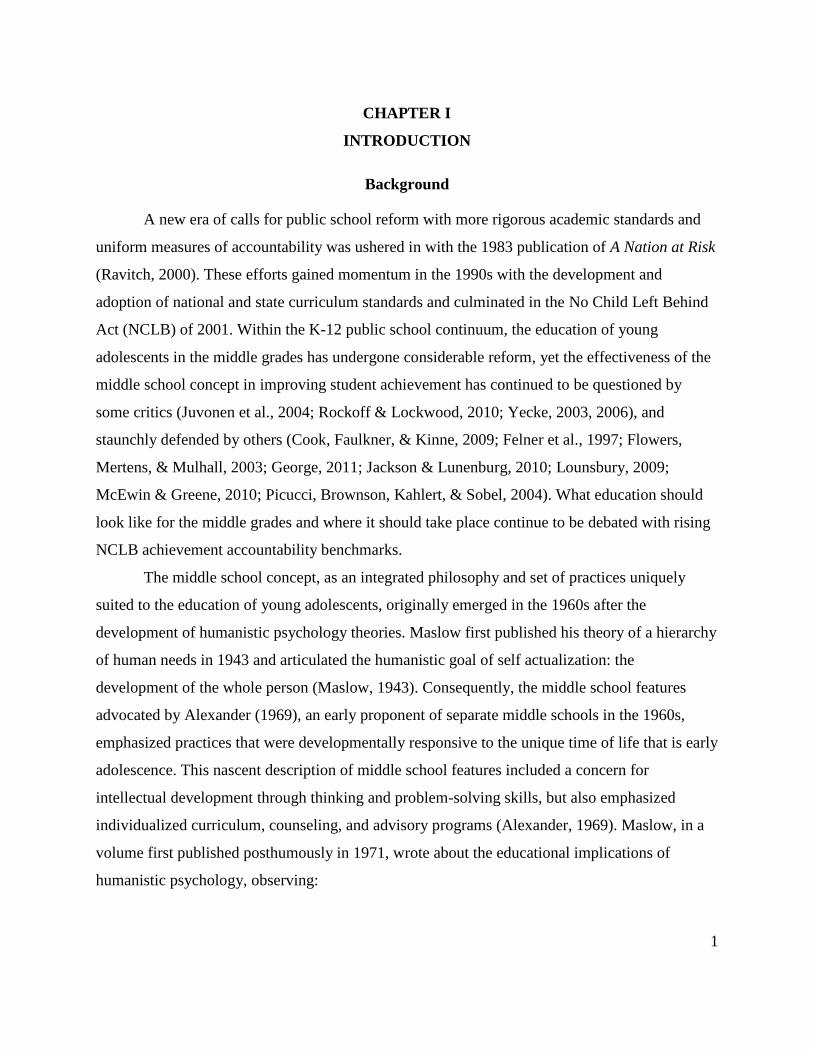
CHAPTER I
INTRODUCTION
Background
A new era of calls for public school reform with more rigorous academic standards and
uniform measures of accountability was ushered in with the 1983 publication of A Nation at Risk
(Ravitch, 2000). These efforts gained momentum in the 1990s with the development and
adoption of national and state curriculum standards and culminated in the No Child Left Behind
Act (NCLB) of 2001. Within the K-12 public school continuum, the education of young
adolescents in the middle grades has undergone considerable reform, yet the effectiveness of the
middle school concept in improving student achievement has continued to be questioned by
some critics (Juvonen et al., 2004; Rockoff & Lockwood, 2010; Yecke, 2003, 2006), and
staunchly defended by others (Cook, Faulkner, & Kinne, 2009; Felner et al., 1997; Flowers,
Mertens, & Mulhall, 2003; George, 2011; Jackson & Lunenburg, 2010; Lounsbury, 2009;
McEwin & Greene, 2010; Picucci, Brownson, Kahlert, & Sobel, 2004). What education should
look like for the middle grades and where it should take place continue to be debated with rising
NCLB achievement accountability benchmarks.
The middle school concept, as an integrated philosophy and set of practices uniquely
suited to the education of young adolescents, originally emerged in the 1960s after the
development of humanistic psychology theories. Maslow first published his theory of a hierarchy
of human needs in 1943 and articulated the humanistic goal of self actualization: the
development of the whole person (Maslow, 1943). Consequently, the middle school features
advocated by Alexander (1969), an early proponent of separate middle schools in the 1960s,
emphasized practices that were developmentally responsive to the unique time of life that is early
adolescence. This nascent description of middle school features included a concern for
intellectual development through thinking and problem-solving skills, but also emphasized
individualized curriculum, counseling, and advisory programs (Alexander, 1969). Maslow, in a
volume first published posthumously in 1971, wrote about the educational implications of
humanistic psychology, observing:
2
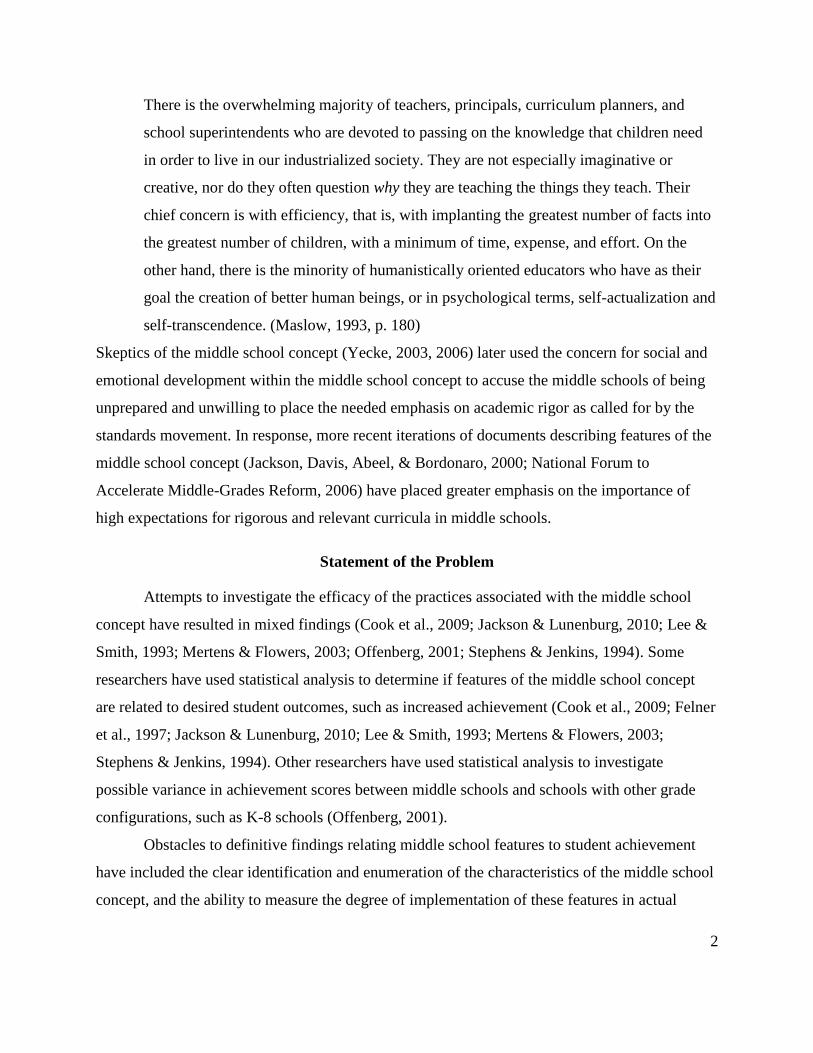
There is the overwhelming majority of teachers, principals, curriculum planners, and
school superintendents who are devoted to passing on the knowledge that children need
in order to live in our industrialized society. They are not especially imaginative or
creative, nor do they often question why they are teaching the things they teach. Their
chief concern is with efficiency, that is, with implanting the greatest number of facts into
the greatest number of children, with a minimum of time, expense, and effort. On the
other hand, there is the minority of humanistically oriented educators who have as their
goal the creation of better human beings, or in psychological terms, self-actualization and
self-transcendence. (Maslow, 1993, p. 180)
Skeptics of the middle school concept (Yecke, 2003, 2006) later used the concern for social and
emotional development within the middle school concept to accuse the middle schools of being
unprepared and unwilling to place the needed emphasis on academic rigor as called for by the
standards movement. In response, more recent iterations of documents describing features of the
middle school concept (Jackson, Davis, Abeel, & Bordonaro, 2000; National Forum to
Accelerate Middle-Grades Reform, 2006) have placed greater emphasis on the importance of
high expectations for rigorous and relevant curricula in middle schools.
Statement of the Problem
Attempts to investigate the efficacy of the practices associated with the middle school
concept have resulted in mixed findings (Cook et al., 2009; Jackson & Lunenburg, 2010; Lee &
Smith, 1993; Mertens & Flowers, 2003; Offenberg, 2001; Stephens & Jenkins, 1994). Some
researchers have used statistical analysis to determine if features of the middle school concept
are related to desired student outcomes, such as increased achievement (Cook et al., 2009; Felner
et al., 1997; Jackson & Lunenburg, 2010; Lee & Smith, 1993; Mertens & Flowers, 2003;
Stephens & Jenkins, 1994). Other researchers have used statistical analysis to investigate
possible variance in achievement scores between middle schools and schools with other grade
configurations, such as K-8 schools (Offenberg, 2001).
Obstacles to definitive findings relating middle school features to student achievement
have included the clear identification and enumeration of the characteristics of the middle school
concept, and the ability to measure the degree of implementation of these features in actual
3
practice (Lee & Smith, 1993; MacIver & Epstein, 1991; Stephens & Jenkins, 1994). Another
concern that has been raised regarding the middle school concept is whether the
recommendations for effective middle schools are truly distinctive from best practices in
elementary and high schools (Heller, Calderon, & Medrich, 2003). These problems have
impeded research efforts to understand and measure the efficacy of the middle school concept as
a clearly-defined set of practices that can be replicated in multiple settings with the expectation
of positively influencing student outcomes.
Purpose of the Instrument Development and Testing Process
The purpose of the instrument development and testing process that is the focus of this
document was to identify critical features of the middle school concept as implemented in the
context of standards and accountability. While there are many effective school and classroom
practices that overlap among school levels, the instrument development process reported here
focused on enumerating school characteristics that collectively define the middle school concept.
Once clearly defined, the middle school concept will more readily lend itself to empirical
investigation using rigorous research methodology.
The implementation of change is nonlinear, is characterized by varying stages of
adoption, and is subject to multiple adaptations (Fullan, 2001; Hall & Hord, 2006). The
instrument development and testing process that was used, therefore, investigated the nature of
the implementation of middle school concept features, recognizing that actual practices in
schools may vary somewhat without the schools losing their identity as middle schools. The
principle product of the instrument development and testing process was the development of a
diagnostic tool that may be used in future research to identify acceptable stages of
implementation of the middle school concept.
The instrument development and testing process implemented proceeded in three phases.
Phase One focused on the confirmation of the key features that define the middle school concept
as implemented in an era of standards and accountability. Phase Two involved developing a data
collection instrument that identifies which key features of the middle school concept are
operationalized in schools serving the middle grades and the nature of the implementation of
4
those features. In Phase Three, a field test of the data collection instrument developed in Phase
Two was conducted.
Significance of the Instrument Development and Testing Process
Scholarly Significance
The effectiveness of the middle school concept has been the subject of much debate
within the commentary literature (Clark & Clark, 2006; George, 2011; Lounsbury, 2009;
Rockoff & Lockwood, 2010; Yecke, 2003, 2006). Critics and advocates alike have attempted to
influence public policy regarding the priorities that schools should adopt and how schools should
be organized to best serve the needs of young adolescents. Should schools serving the middle
grades be exclusively concerned with academic achievement or should middle-grades schools be
more concerned with nurturing students through a developmentally difficult period of social and
physical adjustment? Are academic rigor and developmental responsiveness mutually exclusive?
Are schools with K-8 or 6-8 grade configurations inherently better prepared to influence student
achievement and meet the developmental needs of young adolescents? The instrument
development and testing process described in this document endeavored to contribute to the
debate by helping to define what is meant by the middle school concept within the context of
increased standards and accountability.
Empirical research examining the effectiveness of practices associated with the middle
school concept has produced mixed findings (Cook et al., 2009; Jackson & Lunenburg, 2010;
Lee & Smith, 1993; Mertens & Flowers, 2003; Offenberg, 2001; Stephens & Jenkins, 1994).
Since the 1990s, researchers have focused much attention on student achievement outcomes as
indicated by various measures including standards-based testing. Among the challenges of
conducting research with the middle school concept, however, have been clearly defining the
research variables and accounting for the variance in the implementation of middle school
features. The development of a diagnostic tool used to identify acceptable stages of
implementation of the middle school concept will enable researchers to more rigorously
investigate the relationship between the middle school concept and student outcomes.
5
Practical Significance
The No Child Left Behind Act (2001) requires that middle schools assess student
achievement each year in math and reading and make Adequate Yearly Progress (AYP) toward
the ultimate goal of having 100% of students demonstrate proficiency with adopted standards.
School leaders and policy makers have a clear incentive to know how to organize middle-grades
schools and implement research-based practices that best promote student achievement. If
features of the middle school concept are found to have no influence on student achievement,
school leaders should consider modifying or abandoning middle school features and replace
them with research-validated practices that do influence achievement.
For school leaders implementing any reform or change in schools, understanding the
nature of the change process is a key factor that influences whether the intended change succeeds
or fails. School leaders that successfully navigate the complexities of the change process
recognize that there are various stages of adoption of change that require steady leadership
toward long-term and short-term goals (Fullan, 2006; Hall & Hord, 2006). The instrument
development and testing process attempts to add to current understanding of what practices
constitute the middle school concept to aid school leaders in their decision making. The resulting
diagnostic tool, an Innovation Configuration (IC) map (Hall & Hord, 2006), should be useful to
school leaders assessing the status of middle school features within schools and making
decisions about needed professional development.
Definitions of Key Terms
Several key terms will be used throughout this document and are defined here to facilitate
understanding of their usage.
Academic excellence. The National Forum to Accelerate Middle-Grades Reform
(National Forum, 2006) reports that middle schools that are academically excellent challenge
students to grow intellectually by providing clear expectations and exemplars of high-quality
learning. Academically excellent schools support all students to meet rigorous standards, while
developing critical thinking and problem-solving skills. Rigorous teaching (Hart, Natale, & Starr,
2010) includes clear communication, student engagement, discussion facilitated by probing
questioning, constructive feedback, and a variety of grouping structures.
6
Advisory. Russell (1997) described middle school advisory programs as a component of
a comprehensive guidance program. A faculty advisor is an adult who meets daily with a small
group of students to provide at least one stable adult relationship for each student within the
school. Typically, the advisor remains with the same group of students throughout the middle
school years and focuses on specific social and developmental goals.
Collaboration. Though the word cooperation is a common synonym found as a thesaurus
entry, the idea of collaboration in the literature goes beyond mere cordial association or
coordination of organizational tasks (Clark & Clark, 2006; Hord & Sommers, 2008).
Collaboration includes the concept of teamwork and individuals whose work is interconnected in
meaningful ways and collectively focused on common goals. Where authentically and
purposefully implemented, collaboration within interdisciplinary teacher teams is a bedrock
principle of middle school philosophy (Cook et al., 2009). Collaboration is also closely
associated with the concept of professional learning communities (Hord & Sommers, 2008).
Developmental responsiveness. The National Forum (2006) has articulated the key
characteristics of schools that are developmentally responsive to the unique needs of young
adolescents. Such schools create small learning communities of adults and students in which the
whole child is nurtured to grow. Developmentally responsive schools provide comprehensive
counseling services and engage parents and the community as partners. Developmentally
responsive practices associated with the middle school concept include interdisciplinary teaming
and advisory (MacIver & Epstein, 1991).
Interdisciplinary teaming. MacIver and Epstein (1991) defined interdisciplinary
teaming as the practice of organizing teachers into clusters that share the same students and
collaborate to plan learning experiences across content areas for these students. Flowers et al.
(2003) reported that effective interdisciplinary teams should meet regularly during common
planning time, teach no more than 120 students, and collaborate to integrate and assess learning.
Middle grades. Regardless of the total number of grade levels housed within a school,
the middle grades are those that target young adolescents, ages 11-14. These grades generally
correspond to grades six through eight (Russell, 1997).
Professional learning communities. Hord and Sommers (2008) define a professional
learning community in a school as the “educators in a school coming together to learn in order to
7
become more effective so that students learn more successfully” (p. 2). Five common features of
this type of structure are: shared values, focus on student learning, collaboration, deprivatized
practice, and reflective dialogue (Louis & Marks, 1998).
Socially equitable. According to the National Forum (2006), schools that are socially
equitable have high expectations for all students, regardless of the student’s background. Each
student in a socially equitable school is taught by expert teachers who recognize the individual
needs and capacity to learn of each child.
Young adolescents. This term is used in the literature to describe students between the
ages of 10 and 15 (Lounsbury, 2009; Peterson & Epstein, 1991). Young adolescents experience
dramatic changes in physical, intellectual, emotional, and social development during these years
(Thompson, Homestead, & Pate, 2004; Weiss & Kipnes, 2006).
8
CHAPTER II
REVIEW OF THE RELEVANT LITERATURE
Introduction
A review of the literature related to the development of education in the middle grades
and to the features associated with the implementation of the middle school concept provides a
foundation and theoretical grounding for research regarding middle grades education. The review
begins by describing the historical development of educational models designed to serve young
adolescent students. These models vary somewhat in structure and implementation, but common
threads related to impetus, purpose and features may be traced throughout the evolution of
middle grades pedagogy. The review closes with a synthesis of the features of middle grades
education as described within the literature and an overview of research findings related to these
features.
Search Process
Varied means were employed to produce a comprehensive search of the literature.
Background reading specifically related to reform and innovation in education helped provide a
general context for the current review and justify its broader significance. Resources available
from national organizations dedicated to the study and promotion of best practices in middle
grades education were indispensable. Online research databases provided the primary vehicle for
conducting an exhaustive search of scholarly research articles using specified search terms.
Additional resources were identified using the online search of holdings at the libraries of
Virginia Tech. Finally, works cited by others were scrutinized for inclusion in this review.
The search process for the literature review began with background reading to develop a
broad base of understanding of current issues in education. Several sources served this purpose.
The first source was Friedman’s (2006), The World Is Flat: A Brief History of the 21st Century,
which described societal and economic concerns in the United States with implications for
educational reform. A second source of background information was the work of the Partnership
for 21st Century Skills (2004) including its skills framework articulating the types of skills that
American schools should be developing in students. The work of the U.S. Council on
9
Competitiveness (2004) served as an additional source of information regarding the context for
education reform. This background knowledge led to a focus on the specific skills of
collaboration and innovation as not only desirable learning outcomes for students in K-12
education, but as inherent features of current models for middle grades education in particular.
The change literature within education also shaped the development of the literature
review. The works of several writers were examined based on the regularity with which they
have been cited in educational journals and within each other’s work. Hall and Hord (2006),
Hargreaves and Fink (2003), Fullan (2001, 2006), Reeves (2009), and Schmoker (2006) have all
contributed to current paradigms describing the elements and processes associated with change
within schools. The current literature review rose out of an interest in understanding how one
particular change, the middle school concept, has developed over time and in various contexts.
With the middle school concept chosen as the innovation to be studied, the next step in
the search process was to identify the literature that defines the features of the middle school
concept. A search conducted using Education Research Complete from EBSCOHost, an
electronic database of scholarly research, revealed that much of the literature produced in the
past 20 years about middle grades education has been published by the National Middle School
Association (NMSA; now the Association for Middle Level Education), a national advocacy
organization for the middle level philosophy of education and ongoing reform in the middle
grades. Additional queries using online search engines and the search terms “middle school,”
“middle school reform,” and “middle-grades reform” led to a web of other national
organizations, initiatives, and reform models dedicated to middle level education. These include
prominent professional education organizations and change agents such as the National
Association of Secondary School Principals (NASSP), the National Forum to Accelerate Middle-
Grades Reform (National Forum), the Carnegie Council, and the Southern Regional Education
Board. Collectively, these sources offer descriptions of the key features associated with the
middle school concept and relevant adaptations for the current era of standards-based testing.
An online search for research articles published in scholarly journals was conducted
using Education Research Complete from EBSCOhost. The purpose of this stage of the search
process was to review research related to specific middle school features defined by the
developers of the middle school concept. Various search terms were explored with search
10
parameters set to include only peer-reviewed journals and articles published since 1996, in order
to yield the most current literature. These search terms were as follows: middle schools and
student achievement; adolescence, middle school, and developmental biology; young adolescents
and characteristics; scheduling and student achievement; block scheduling and middle schools;
middle school and teaming; middle school and guidance; middle school and advisory; middle
school and academic rigor; middle school and No Child Left Behind; middle school and
leadership; middle school and common planning; and middle school and parent involvement; and
middle school and reform.
Historical Perspective of Middle Grades Education
What education should look like for students in the 11-14 age range is the subject of
much debate (Flowers et al, 2003; George, 2011; Lounsbury, 2009; Rockoff & Lockwood, 2010;
Yecke 2006). Middle schools housing grades 6-8, a concept first articulated in the 1960s and
adopted with increasing popularity in the 1970s and 1980s, were, by far, the most common grade
configuration as recently as the 2005-2006 school year. That year, according to the National
Center for Education Statistics (2006), there were 9,199 schools in the United States housing
grades 6-8, as compared to 5,348 schools housing either grades PK-8 or grades K-8, 2,601
schools housing grades 7-8, and merely 530 schools housing grades 7-9. Proponents of middle
schools (Cook et al., 2009; Felner et al., 1997; Flowers et al., 2003; George, 2011; Lounsbury,
2009; McEwin & Greene, 2010; Picucci et al., 2004) continue to assert the efficacy of the middle
school concept, when fully implemented with fidelity. Nonetheless, critics of the middle school
concept (Juvonen et al., 2004; Morocco, Brigham, & Aguilar, 2006; Rockoff & Lockwood,
2010; Stephens & Jenkins, 1994; Tucker & Codding, 1998; Yecke, 2006) have declared it to be a
failed educational paradigm. Tucker and Codding write:
Middle schools are the wasteland of our primary and secondary landscape. Most teachers
would prefer to teach in elementary schools or high schools than to teach in middle
schools. Caught between the warmth of a good elementary school and the academic
seriousness of a good high school, middle school students often get the least of both and
the best of neither. (p. 153)
11
A brief history of education for young adolescents will help elucidate the development of the
middle school as a concept and the complexity of the current controversy.
Early Development of Elementary and Secondary Schools
Current uncertainty about effective educational models for the middle grades is
understandable given that elementary schools and secondary schools developed independently
from each other, without any sense of K-12 articulation in the early years. Gruhn and Douglass
(1956) report that the elementary schools of the early 19th
century were established following
Prussian school models typically consisting of seven or eight school grades. High schools
consisted of four grades; however, even as late as the early 1900s, retention studies indicated that
only 17-25% of students who started first grade in primary school actually continued on through
the second year of high school (Gruhn & Douglass, 1956).
By the late 1800s, the 8-4 grade split first came under scrutiny through the initiatives of
the National Education Association (NEA) (Eichhorn, 1991). The NEA appointed national
committees to study school structures in the Unites States and make recommendations regarding
needed reforms. Ironically, the impetus for change initially did not come from any concern for
more appropriate ways to educate young adolescents, but rather from university presidents who
wanted students to enter college sooner. Nevertheless, the work of these national committees
primarily resulted in a recommendation to establish a transitional program of education for
grades 7-9 (Gruhn & Douglass, 1956). The committees did not suggest the establishment of
separate middle level schools, but did seek to develop a transitional program that would better
prepare students for high school and beyond (Eichhorn, 1991).
The Junior High School Movement
The work of the NEA study committees resulted in a new interest in bridging the gap
between elementary schools and secondary schools. There was not universal agreement about
changes in grade configurations, but a 6-6 plan, with six years of elementary education followed
by six years of secondary education, was the most favored plan since it would group seventh and
eighth grade students with high school. Grouping young adolescents with the higher grades was
intended to introduce the more specialized academic rigor associated with high school rather
12
than continue the generalist approach of the elementary grades. Cited advantages included:
having teachers as content experts rather than generalists, exposing students to multiple teachers
rather than one or two, providing students access to more modern science labs and manual
training workshops, allowing for earlier study of modern languages, and allowing for a more
gradual transition for students to advance toward college (Gruhn & Douglass, 1956).
The 6-6 plan was generally adopted in rural areas, but in urban areas that were
experiencing dramatic increases in enrollment, separate schools housing grades seven through
nine began to develop. The first of these 7-9 schools, Indianola Junior High School, was
established in Columbus, Ohio, in 1909 (Lounsbury, 2009). Ten years later, there were 55 junior
high schools in the United States, and the number grew to 1,842 by 1930 (Gruhn & Douglass,
1956).
The structure, grade configurations, and organizational features of these newly
recognized middle grades varied somewhat by locality (Gruhn & Douglass, 1956). Some
considered junior high schools to be uniquely 7-9 schools. Others pointed to such features as
departmentalization and homogenous grouping to be representative of junior high schools. Gruhn
and Douglass opine, though, that “a school building, grade organization, and certain
administrative features are important only to the extent that they have a bearing on that
educational program” (1956, p. 4). Their observation at the height of the junior high school
movement in 1956, served as a foreshadowing of the debate that continues today regarding the
priorities for educating young adolescent students.
Middle School Concept
Even though the establishment of junior high schools was an important step in
recognizing the need for a transitional program between the elementary and secondary school
years, by the 1950s, educators and policy makers were again calling for changes to approaches to
young adolescent education. Bossing (1954) criticized the junior high school to be nothing more
than its name implied: a little high school (as cited in Eichhorn, 1991). Alexander (1964)
recognized that the junior high school had provided broader opportunities for students than
elementary schools with eight grades in terms of facilities and programs. Nonetheless, he argued
that junior high schools were solely designed to acclimate students to high schools rather than
13
serving as genuine bridges between elementary and secondary schools, focusing on the unique
needs of students of this age. Junior high school programs failed to reinvigorate the intellectual
curiosity that begins to wane during the upper elementary years (Alexander, 1964). Other
concerns articulated during this transitional era were that junior high schools began with good
intentions but had not been sustained through training teachers and administrators to specifically
work with this age group and few studies had been conducted to truly understand the needs of
young adolescents (Herriott, 1955).
Alexander (1964) began to articulate the need for a new school for the middle years, one
with features and personnel truly dedicated to meeting the needs of young adolescents. These
new schools would constitute a change away from junior highs as a preparation for high school
to “middle schools” that would be child centered and incorporate such features as team teaching,
integrated content, advisory programs, and flexible scheduling (Anfara & Buehler, 2005). The
characteristics suggested for the new middle schools also included a more individualized
instructional program, increased guidance counseling support, a flexible curriculum that
recognized that young adolescents are profoundly varied in their intellectual development, an
emphasis on thinking and problem solving skills rather than just discrete facts, and the
development of values (Alexander, 1964).
The name middle school was widely adopted along with a trend toward schools housing
grades 6-8. In the 1970s and 1980s, schools using a 6-8 grade configuration increased 120%
while the former junior high schools with a 7-9 grade configuration decreased by 53%
(Alexander & McEwin, 1989). According to U.S. Department of Education’s National Center
for Education Statistics, by the 2005-2006 school year, there were 9,199 middle schools with
grades 6-8 compared to only 530 schools with grades 7-9 (National Center for Education
Statistics, 2006). At least in name and in the traditional 6-8 grade configuration, the vast majority
of U.S. schools serving the middle grades identified with the middle school concept rather than
the former junior high schools.
In 1982, the National Middle School Association (NMSA; now called the Association for
Middle Level Education) issued the first of what would be a series of position papers published
by national organizations articulating a comprehensive definition of middle schools. This We
Believe: Successful Schools for Young Adolescents (1982) debuted only months before the
14
landmark A Nation at Risk (U.S. Department of Education, 1983) report that called for sweeping
educational reforms, especially at the secondary level. This We Believe described the
characteristics of young adolescents and provided 10 descriptors of “true” middle schools: (1)
educators knowledgeable about and committed to young adolescents, (2) a balanced curriculum
based on student needs, (3) a range of organizational arrangements, (4) varied instructional
strategies, (5) a full exploratory program, (6) comprehensive advising and counseling, (7)
continuous progress for students, (8) evaluation procedures compatible with the nature of young
adolescents, (9) cooperative planning, and (10) positive school climate (NMSA, 1982, 10-15).
These features became a foundational definition of what middle schools should be, with a
particular emphasis on schools that are, above all, equipped to meet the distinctive
developmental needs of young adolescents and provide a supportive, collaborative learning
environment.
Similarly concerned with reforms in public education and in the middle grades in
particular, the Carnegie Corporation through its Council on Adolescent Development issued
Turning Points: Preparing American Youth for the 21st Century (1989), another foundational
work for middle grades innovation. The 1989 version of Turning Points made eight
recommendations for improving middle grades education: (1) divide students into smaller units,
(2) teach a common core to all students, (3) organize to ensure success for all students, (4) share
leadership, (5) employ teachers who are experts at teaching young adolescents, (6) promote good
health, (7) promote alliance of families and school, and (8) partner with the community
(Carnegie Council, 1989). The original Turning Points description of middle school features
reflects the core ideas of This We Believe, focusing on social and emotional developmental
needs, shared leadership, and a nurturing school climate.
Other organizations have issued documents articulating various features of the middle
school concept. Capelluti and Stokes (1991), for example, edited a volume for the National
Association of Secondary School Principals (NASSP) that describes the development of the
middle school concept and expands upon the major middle school features recommended by This
We Believe and Turning Points. This We Believe and Turning Points, however, are considered to
be the seminal position papers most often cited as authoritative descriptions of the middle school
concept (Heller, Calderon, & Medrich, 2003).
15
Middle Grades in the Standards Movement Era
The Turning Points and This We Believe emphases on creating schools designed to meet
the developmental needs of middle school students came onto the national scene just as political
winds in the U.S. were taking a decided shift toward academic reform in the nation’s schools. In
the shadow of the publication of A Nation at Risk (1983) and its calls for improved academic
standards, President George Bush invited the nation’s governors to an education summit at the
University of Virginia in Charlottesville, Virginia in 1989. The governors, led by Governor Bill
Clinton of Arkansas, drafted a set of six national goals, two of which called for improved
academic achievement in U.S. schools (Ravitch, 2000). In the years that followed, national and
state curriculum standards were adopted in the various content areas, culminating in the 2001
federal No Child Left Behind act, requiring testing of standards along with new measures of
accountability for the nation’s schools.
Against this backdrop of calls for increased academic achievement, critics of the middle
school concept (Bradley, 1998; Cooney, 1998; Heller et al., 2003; Juvonen et al., 2004; Ruenzel,
1998; Yecke, 2003, 2006) claimed that the middle school concept emphasized students’ self
esteem and egalitarianism at the expense of academic rigor and competition. Critics wrote of
“the muddle in the middle” (Bradley), the “mayhem in the middle” (Yecke), “education’s weak
link” (Cooney), and “the rising tide of mediocrity in America’s middle schools” (Yecke). Yecke
(2003) wrote: “it appears that the American public can expect little change from the leading
advocates of the middle school concept—unless the standards and accountability movement
succeeds in returning middle schools to an academic mission,” (p. 227). Some research also
began to emerge (Byrnes & Ruby, 2007; Howley, 2002; Juvonen et al., 2004; Offenberg, 2001;
Rockoff & Lockwood, 2010) suggesting that, in certain settings, 6-8 middle schools may be less
effective in creating supportive environments or improving student achievement than other
models such as schools with a K-8 grade configuration.
Within the context of the standards-based movement, Jackson et al. (2000) issued an
updated version of Turning Points in which a middle school curriculum based on rigorous
standards was prominently listed as the first recommendation. Jackson et al. also talk of
preparing all students to achieve higher standards, reflective of the new era of accountability.
The NMSA followed in 2003 with a revision of This We Believe in which the characteristics of
16
successful middle schools were expanded to 14 features, up from the previous ten. Though not as
direct as Turning Points (2000) in emphasizing academic rigor, the new This We Believe
document included language more reflective of the concern for academic standards. Whereas the
1982 issuance of This We Believe called for a “balanced curriculum based on student needs” (pp.
10-15), the 2003 version described successful middle schools as having high expectations, active
engagement in learning, a relevant, challenging curriculum, and assessment that promoted
quality learning.
Another change reflective of the continuing evolution of middle level philosophy was the
2011 decision of the National Middle School Association (NMSA) to alter its name to become
the Association for Middle Level Education (AMLE). According to the AMLE (2011), the name
change was made for two primary reasons: to better reflect the international stature of the
organization and to be more inclusive of schools implementing middle level philosophy
regardless of the grade configuration of the school. “We’re about kids ages 10 to 15, not the
name on the school,” reported the AMLE on its website.
In 1997, the National Forum to Accelerate Middle-Grades Reform (National Forum) was
created by the Carnegie Corporation and other endowment groups in response to the standards
movement and the need to continue reforming education in the middle grades. Members of the
National Forum include representatives from the AMLE (formerly NMSA), the National
Association of Secondary School Principals (NASSP), the Association for Supervision and
Curriculum Development (ASCD), and the Center for Collaborative Education (CCE), a school
reform organization that continues the work of Turning Points. The core principles advocated by
the National Forum were academic excellence, developmental responsiveness, and social equity,
and, since 1999, the National Forum has recognized middle schools in the U.S. that demonstrate
these principles. These same core principles are endorsed by NASSP through its National Center
for Middle Level Leadership and incorporated in its recommendations published in Breaking
Ranks in the Middle: Strategies for Leading Middle-Level Reform (2006).
Many researchers support the finding that sustained and supported implementation with
fidelity of the middle school concept may lead to positive student achievement and behavioral
outcomes (Anfara & Lipka, 2003; Backes, Ralston, & Ingwalson, 1999; Cook et al., 2009; Davis
& Thompson, 2004; Erb & Stevenson, 1999; Felner et al., 1997; Flowers et al., 2003; Jackson &
17
Lunenburg, 2010; Lounsbury, 2009; Picucci et al., 2004). Comparing the recommendations of
Turning Points (2000), This We Believe (2003), the National Forum (2006) and Breaking Ranks
in the Middle (2006), common features begin to emerge that help define what is meant by the
middle school concept in a standards-based era: rigorous, relevant curriculum for all students;
instruction that promotes achievement and intellectual curiosity; organization for supportive
relationships within communities of learners; visionary, participatory leadership; professional
staff who are experts on middle grades education; support for social, physical, and emotional
wellbeing of young adolescents; and welcome involvement of parents and community.
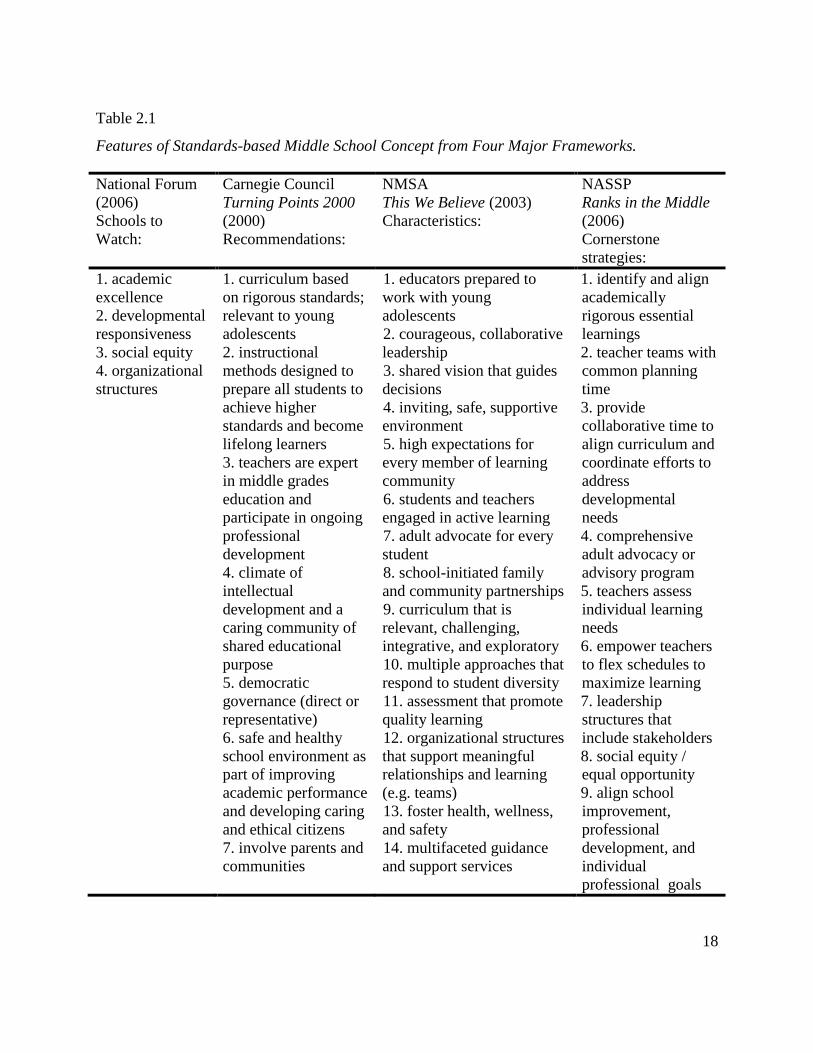
All of these features fit well within the four broad dimensions articulated by the National
Forum: academic excellence, developmental responsiveness, social equity, and organizational
structures. Table 2.1 provides a comprehensive listing of the common features of the standards-
based middle school concept as articulated by Turning Points, This We Believe, the National
Forum, and Breaking Ranks in the Middle.
18
Table 2.1
Features of Standards-based Middle School Concept from Four Major Frameworks.
National Forum
(2006)
Schools to
Watch:
Carnegie Council
Turning Points 2000
(2000)
Recommendations:
NMSA
This We Believe (2003)
Characteristics:
NASSP
Ranks in the Middle
(2006)
Cornerstone
strategies:
1. academic
excellence
2. developmental
responsiveness
3. social equity
4. organizational
structures
1. curriculum based
on rigorous standards;
relevant to young
adolescents
2. instructional
methods designed to
prepare all students to
achieve higher
standards and become
lifelong learners
3. teachers are expert
in middle grades
education and
participate in ongoing
professional
development
4. climate of
intellectual
development and a
caring community of
shared educational
purpose
5. democratic
governance (direct or
representative)
6. safe and healthy
school environment as
part of improving
academic performance
and developing caring
and ethical citizens
7. involve parents and
communities
1. educators prepared to
work with young
adolescents
2. courageous, collaborative
leadership
3. shared vision that guides
decisions
4. inviting, safe, supportive
environment
5. high expectations for
every member of learning
community
6. students and teachers
engaged in active learning
7. adult advocate for every
student
8. school-initiated family
and community partnerships
9. curriculum that is
relevant, challenging,
integrative, and exploratory
10. multiple approaches that
respond to student diversity
11. assessment that promote
quality learning
12. organizational structures
that support meaningful
relationships and learning
(e.g. teams)
13. foster health, wellness,
and safety
14. multifaceted guidance
and support services
1. identify and align
academically
rigorous essential
learnings
2. teacher teams with
common planning
time
3. provide
collaborative time to
align curriculum and
coordinate efforts to
address
developmental
needs
4. comprehensive
adult advocacy or
advisory program
5. teachers assess
individual learning
needs
6. empower teachers
to flex schedules to
maximize learning
7. leadership
structures that
include stakeholders
8. social equity /
equal opportunity
9. align school
improvement,
professional
development, and
individual
professional goals
19
Heller et al. (2003) reviewed the literature regarding several of these features of the
middle school concept. Interestingly, Heller et al. point out that there exists what they call a
“middle school paradox” (p. 3). This paradox, they state, is created by the insistence of middle
school proponents that the middle school concept consists of features that are distinctive of the
middle grades. Beginning with the junior high school movement and evolving into the middle
school movement, a central theme has been that effective education of young adolescents is
uniquely tailored to their needs. Heller et al. argue, however, that the very features of effective
middle schools are closely aligned with effective education reforms for the other grade levels as
well. Thus, the middle school distinctiveness may not be so distinctive after all (Heller et al.,
2003). Even if the features identified here as characteristics of successful middle schools prove
useful in other grade levels as well, this observation certainly would not diminish the importance
of their study and implementation in the middle grades.
Research Examining Middle School Features and Student Outcomes
Evaluating the Features of the Standards-based Middle School Concept
One of the challenges of articulating a definitive list of middle school features is trying to
distinguish between common practices associated with middle schools and the ideals they are
intended to operationalize. Indeed, many researchers and commentators critical of the middle
school concept point to such practices as interdisciplinary team teaching, advisory periods,
heterogeneous classes, separate schools with 6-8 grade configuration, and block scheduling as
the visible face of the middle school concept and argue that the widespread implementation of
such practices has failed to improve student achievement (Juvonen et al., 2004; Morocco et al.,
2006; Offenberg, 2001; Rockoff & Lockwood, 2010; Williamson & Johnston, 1999; Yecke,
2006). Some, like Yecke (2006) and Offenberg (2001), have decried such practices as
heterogeneous classes and advisory groups, done in the name of being developmentally
responsive but at the expense of intellectual rigor, to be part of a larger democratic, egalitarian
agenda.
Others (e.g., Clark & Clark, 1993; MacIver & Epstein, 1991, 1993; Morocco et al., 2006;
Russell, 1997; Williamson & Johnston, 1999) have recognized that many schools over the years
have adopted the structures and practices associated with the middle school concept, but only in
20
superficial ways. Many schools with “middle school” in their name boast, for example,
interdisciplinary teams but the teachers on the teams do not have common planning time. Even if
they have been provided common planning time, most teachers lack the support and training to
engage in meaningful collaborative work focused on student learning and assessment,
(Mergendoller, 1993). Thus, even though the middle school practice of dividing larger groups of
students and teachers into interdisciplinary teams should be intuitively closely linked to
innovative organizational patterns and practices such as professional learning communities, too
often such a natural link is not found in actual practice (Clark & Clark, 2006; DuFour, DuFour,
& Eaker, 2008; Erb, 2006; Juvonen et al., 2004). Similarly, many middle schools have advisory
or homeroom periods, but time is often taken up with organizational tasks such as attendance or
announcements rather than social and academic support activities (MacIver & Epstein, 1991).
In a standards-based era, a well-articulated definition of the middle school concept must
extend beyond the original organizational structures suggested by middle school proponents such
as Alexander (1964), since the existence of such structures may be no more than a façade
masking a lack of understanding of the intent of the early middle school concept and its more
recent revisions found in Turning Points (2000). Any attempt to identify middle school features
as a single innovative concept should examine the actual language of the salient middle school
frameworks.
Furthermore, a review of the literature linking various middle school features, whether
considered as an integrated whole or as separable individual components, to student performance
outcomes should carefully consider how the degree of implementation of middle school features
has been measured. Lounsbury (2009) argues that much of the literature critical of the middle
school concept has not duly acknowledged the difference between schools with fully and
authentically implemented middle school concept features in the middle grades and middle
schools as merely a 6-8 grade configuration with nominal structures such as teaming.
The true middle school concept, it should be recognized, has not been practiced and
found wanting; rather, it has been found difficult to implement fully, and is practiced,
then, only partially. Putting it all into operation requires making changes that run counter
to established school procedures; hence, the concept has not been practiced sufficiently or
widely enough to be fairly assessed on a large-scale basis. The obvious success of the
21
middle school as an organized pattern, however, led those who did not understand the
difference between the middle school concept and the middle school as a grade
configuration to the false conclusion that the middle school concept was being
implemented and was, therefore, the cause of the perceived failings. (Lounsbury, 2009, p.
32)
Clearly, any conclusions drawn from the available research on the middle concept can be
reasonable only to the extent that the fidelity, degree, and context of implementation are fully
understood.
Overview of Research on Features of Standards-based Middle School Concept
The research evaluating the effectiveness of features of the middle school concept has
varied in methodology, variables investigated, and findings. For studies involving the selection
of participant middle-grades schools, a formidable challenge has often been assigning participant
schools to quasi-experimental groups, using as criteria the mere existence of certain
organizational structures in the school rather than the quality of implementation. Anfara and
Lipka (2003) noted that the literature relating the middle concept, as articulated specifically by
Turning Points, to student achievement can be divided into overlapping categories, including
studies that consider the middle school concept as a whole versus those that examine individual
components, studies that examine specific restructuring programs, studies that recognize that the
Turning Points recommendations are “necessary but not sufficient,” and studies that utilize a
dichotomous implemented/non-implemented measure versus those that acknowledge stages of
implementation. For this overview of research examining the middle school concept and student
outcomes, those studies that investigate multiple features of the middle school concept or the
middle school concept as an integrated whole were included.
MacIver and Epstein (1991). During the infancy of standards-based reform in
American schools, MacIver and Epstein (1991) used a survey of middle school principals to
provide revealing evidence of the wide variance in implementation of middle school features.
The primary research question was whether recommended middle school features had a positive
effect on student outcomes and the strength of middle school programs. Independent variables
22
included advisory programs, interdisciplinary teaming, remediation programs, and transition
programs.
MacIver and Epstein (1991) used a probability sampling of 2,400 of the 25,000 schools in
the U.S. that house grade seven. Of these, surveys were returned by 1,753 principals. The grade
configuration of the participant schools included K-8 (32.1%), 6-8 (25.3%), and smaller
percentages of less common grade spans.
The survey results that MacIver and Epstein (1991) reported indicated that while many
middle grades schools in the U.S. described practices associated with the middle school concept,
the manner and depth of implementation varied. For example, while nearly two thirds of middle
grades schools reported having a homeroom advisory period, much time was spent on more
mechanical tasks such as attendance and record keeping rather than systematically using the time
to build relationships and counseling opportunities between students and their mentor.
Furthermore, MacIver and Epstein found no evidence of significant variance between schools
housing grades 6-8 and schools with other grade configurations with regard to their student
advisory programs.
Interdisciplinary teaming was found by MacIver and Epstein (1991) to be a practice in
42% of the sampled schools. The researchers also found that schools that maintained strong
departmentalization practices also practiced interdisciplinary teaming. Increased levels of
interdisciplinary teaming was associated with the negative outcome of higher dropout rates for
boys (r=.08, p<.01) and girls (r=.07, p<.01), though the correlations were small and accounted
for little variance in the dropout rates. The frequency of implementation of interdisciplinary
teaming may not be indicative of the quality of implementation. Only 36% of schools that used
interdisciplinary teaming provided two or more hours weekly of common planning time for
teachers and less than 60% of teams had formal leaders. MacIver and Epstein found that these
deficits seemed to influence the perception principals had regarding the effective functioning of
teams: principals perceived teams with more common planning time and formal leaders to be
stronger than teams with less common planning time and without formal leaders.
MacIver and Epstein (1991) indicated that there may be at least modest benefits to
implementing features of the middle school concept. They concluded that the results were
somewhat mixed, however, and more needed to be understood regarding the importance of
23
quality implementation of these features. One limitation of the MacIver and Epstein study was
that data were limited to survey data completed by principals. The perception of principals
regarding what is happening in schools may be somewhat biased toward more positive outcomes.
Actual achievement data such as standardized test scores were not reported and may have
provided a more objective overview of student outcomes had they been available.
Lee and Smith (1993). Lee and Smith (1993) conducted one of the earlier studies
examining multiple features associated with the middle concept and their relationship to student
outcomes such as achievement and at-risk behaviors. The researchers were interested, generally,
in the broad movements toward school restructuring that began to develop in the early stages of
the standards-based era, and especially in innovations occurring in the middle grades. Their
principal research question was whether students who attended restructured middle schools
would be positively affected in terms of their achievement and their engagement and whether
restructured middle schools would have a more socially equitable distribution of achievement
and engagement among their students.
Lee and Smith (1993) used existing data from the 1988 National Education Longitudinal
Study (NELS) of 25,000 eighth grade students from 1,035 U.S. middle-grades schools.
Specifically, the researchers used a subsample consisting of all of the Catholic and independent
schools in the NELS data as well as a random sample of 233 of the 761 public schools. In order
to be included in the study, schools had to have at least 10 sampled students and students had to
have data from all NELS data sources. This resulted in a total of 8,845 students in 377 schools.
The independent variable was whether the school was a restructured middle school as indicated
by the following four features: (1) reduced departmentalization, (2) heterogeneously grouped
instruction, (3) team teaching, and (4) a general index of restructuring composed of 16 available
24
measures.1 Dependent variables were student outcomes, including achievement as measured by
combined reading and math scores and engagement as measured by academic engagement (e.g.
completing homework and frequency of bringing required materials to class), and frequency of
at-risk behaviors. Hierarchical linear modeling was employed to analyze possible variance
among the variables under consideration.
Lee and Smith (1993) found that certain elements of restructuring in middle schools were
positively correlated with achievement at a statistically significant level: reduced
departmentalization (p<.05) and team teaching (p<.05). Similarly, middle schools with higher
levels of restructuring, as indicated by the composite restructuring measure, were positively
correlated with academic engagement (p<.01). Interestingly, the relationship between these
elements of restructuring (i.e., team teaching and reduced departmentalization) and at-risk
behaviors was also significant, but in a negative direction: reduced departmentalization (p<.001)
and team teaching (p<.01). Lee and Smith also found that the size of the eighth grade was
negatively related to academic engagement (p<.01) and that achievement gaps among students
with different socioeconomic backgrounds widened in schools with larger eighth grade classes
(p<.01).
Some elements of the middle school concept were found by Lee and Smith (1993) to be
associated with higher student achievement. For example, interdisciplinary team teaching and the
associated reduction in departmentalization were found to be related to higher achievement. The
1 The following 16 measures were used as a composite index of restructuring: the school had grouped classes, the
school had 40 percent sampled students in no grouped classes, the school had flexible time scheduling, the school
had schools within schools, the eighth grade used team teaching, the students had the same homeroom teacher for all
middle-grades years, the school had common planning time for departmental members, the school had a staff
development program, the school was non- or semi-departmentalized, the school had a policy not to retain eighth
graders, interdisciplinary teachers share the same students, eighth graders kept same classmates for all classes,
students from different grade levels were in the same classroom, eighth-grade classes were organized for
cooperative learning, eighth graders had exploratory classes, and eighth graders did special projects as a regular part
of their curriculum.
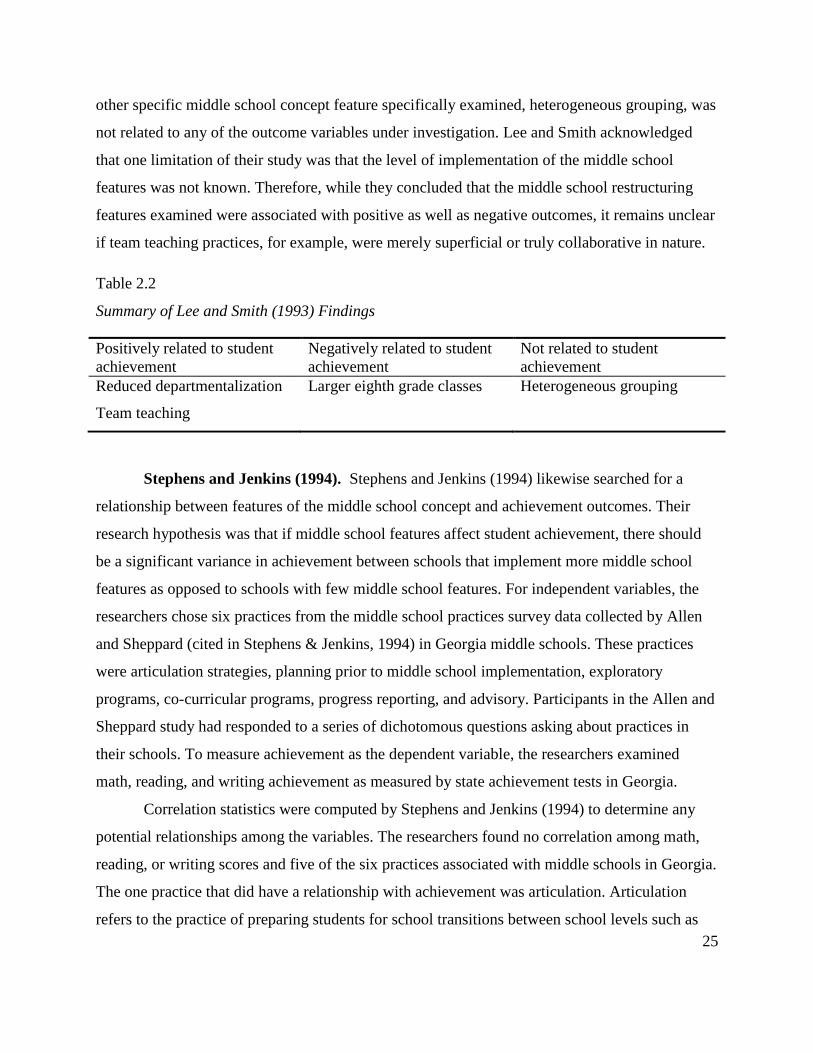
25
other specific middle school concept feature specifically examined, heterogeneous grouping, was
not related to any of the outcome variables under investigation. Lee and Smith acknowledged
that one limitation of their study was that the level of implementation of the middle school
features was not known. Therefore, while they concluded that the middle school restructuring
features examined were associated with positive as well as negative outcomes, it remains unclear
if team teaching practices, for example, were merely superficial or truly collaborative in nature.
Table 2.2
Summary of Lee and Smith (1993) Findings
Positively related to student
achievement
Negatively related to student
achievement
Not related to student
achievement
Reduced departmentalization Larger eighth grade classes Heterogeneous grouping
Team teaching
Stephens and Jenkins (1994). Stephens and Jenkins (1994) likewise searched for a
relationship between features of the middle school concept and achievement outcomes. Their
research hypothesis was that if middle school features affect student achievement, there should
be a significant variance in achievement between schools that implement more middle school
features as opposed to schools with few middle school features. For independent variables, the
researchers chose six practices from the middle school practices survey data collected by Allen
and Sheppard (cited in Stephens & Jenkins, 1994) in Georgia middle schools. These practices
were articulation strategies, planning prior to middle school implementation, exploratory
programs, co-curricular programs, progress reporting, and advisory. Participants in the Allen and
Sheppard study had responded to a series of dichotomous questions asking about practices in
their schools. To measure achievement as the dependent variable, the researchers examined
math, reading, and writing achievement as measured by state achievement tests in Georgia.
Correlation statistics were computed by Stephens and Jenkins (1994) to determine any
potential relationships among the variables. The researchers found no correlation among math,
reading, or writing scores and five of the six practices associated with middle schools in Georgia.
The one practice that did have a relationship with achievement was articulation. Articulation
refers to the practice of preparing students for school transitions between school levels such as
26
that between elementary and middle school or middle school and high school. Articulation was
found to be positively correlated with reading (r=.3542, p<.05), math (r=.3357, p<.05), and
writing (r=.2579, p<.05).
Based on the results of their study, Stephens and Jenkins (1994) concluded that there is
little evidence that middle school practices are associated with student achievement. They did
acknowledge, however, that if middle school practices can be shown to be associated with other
student outcomes such as higher self esteem, a link could be established between middle school
practices and achievement with the intermediate social outcomes as mediating influences. Like
the MacIver and Epstein (1991) study and the Lee and Smith (1993) study, conclusions about the
effectiveness of middle school practices are limited in that little is known about the level or
fidelity of implementation of these practices since the data were self reported.
Felner, Jackson, Kasak, Mulhall, Brand, and Flowers (1997). The 1997 Felner et al.
longitudinal study was an important contribution to the literature in terms of its depth and
comprehensive examination of Turning Points recommendations as implemented in Illinois
middle schools. The researchers followed over 97 middle schools during a span of six years as
these schools restructured to implement the Turning Points recommendations as an integrated
model of reform. The primary research question was whether implementing the Turning Points
recommendations with fidelity would be associated with gains in student socio-emotional
functioning, academic achievement, changes in school climate, levels of support, and
involvement from parents and community. Felner et al. drew upon the work of MacIver and
Epstein (1991) to develop their conceptual framework. This framework recognized that in order
to evaluate outcomes produced by middle school reform, the research must go beyond a
dichotomous implemented/not implemented measure of middle school features. The researchers,
therefore, included direct measurements of practices within the schools and within classrooms as
a means of accounting for varying degrees (i.e., fidelity) of implementation of middle school
concepts.
A compressed longitudinal design was the overall research design employed by Felner et
al. (1997). This design involved collecting data from schools at different stages of development
as a means of simulating stages of implementation in one school over time. The researchers
reported that participant schools were representative of the geographic and demographic
27
diversity of schools in Illinois. Various statistical analyses were performed with the available
data, including correlation, hierarchical regression, and structural modeling approaches. The
analysis also included grouping the schools as high implementation, partial implementation, or
low implementation schools corresponding to the stage of development of each school.
Based on analysis of the collected data, Felner et al. (1997) concluded that middle
schools with high levels of implementation with fidelity of the Turning Points recommendations
were associated with significantly higher levels of achievement than schools classified as partial
implementation or low implementation schools. The data also showed that progress toward fuller
implementation of middle school features as recommended by Turning Points was positively
related to increases in social-emotional health, positive school climate, as well as achievement.
The researchers argued that their findings confirmed that implementation of middle school
reform would not be effective if done on the basis of checking features off a predetermined list
of practices. Rather, these practices should be implemented with full understanding of the
purpose for each practice.
Failure to implement middle school features as an integrated model or superficial
implementation, in fact, led to negative outcomes in some of the participant schools under study
by Felner et al. (1997). The researchers reported, for example, that schools with teaming
practices that did not engage in collaboration and curriculum integration were associated with
more negative school climate, lower student achievement, and increased behavior problems.
These findings underscored the importance of implementation with fidelity of the Turning Points
recommendations. Furthermore, the Felner et al. study confirmed the critical need for research
that examines middle school features to gauge the level of implementation of the features before
making conclusions regarding their effectiveness.
Offenberg (2001). Among critics of middle schools in the era of standards have been
those that focus on the grade levels that ought to be included in schools that serve young
adolescents (Juvonen et al., 2004; Stephens & Jenkins, 1994; Yecke, 2006). These critics tend to
advocate for K-8 schools rather than placing grades 6-8 in separate middle schools. Offenberg
(2001) conducted a study of schools in Philadelphia that converted to a K-8 grade configuration
compared to schools that housed grades 6-8. The conceptual framework of this study was that
middle grades reform recommendations such as those offered by Turning Points are not
28
dependent on the grade configurations of the schools in which the recommendations are
implemented. Citing the findings of MacIver and Epstein (1991) as well as Felner et al. (1997),
Offenberg hypothesized that one of the primary concerns of Turning Points recommendations was
the creation of smaller learning environments for students. His research question was to
determine if there was any significant variance in student achievement associated with 6-8
schools versus K-8 schools in Philadelphia.
Offenberg (2001) analyzed available school-level data from 37 to 42 middle schools and
40 to 43 K-8 schools using multiple regression statistical procedures, controlling for
socioeconomic variance among the schools. School-level student achievement was the dependent
variable and was measured using available data from the school system database, such as grade
point average and Stanford Achievement Test scores. The independent variable was the grade
configuration of the school: 6-8 versus K-8. Thus, middle schools were defined by the grades
housed within the school rather than by any particular practice or feature of the middle school
concept.
Offenberg (2001) found that gains in mathematics achievement were greater in K-8
schools than in middle schools at a statistically significant level; though Offenberg did not report
the specific statistic. Higher gains in reading and science for K-8 schools were also indicated,
though not at a significant level. Another measure of achievement was the grade point average of
ninth graders who had attended either a middle school or K-8 school. Offenberg found that the
grade point average of students who had attended a K-8 school was significantly higher than
grade point averages of students who had attended a middle school (p<.02).
In an attempt to account for some of the variance in achievement between the school
types, Offenberg (2001) also ran statistical analyses comparing the overall size of schools and
the number of students in eighth grade that attended the different school types. He reported that
K-8 schools in Philadelphia ranged from total enrollments of 252 to 1,419 while middle schools
ranged from 389 to 1,489 students. Controlling for socioeconomic status of the schools,
Offenberg found no significant interaction among school type and overall school size related to
achievement measures. The number of eighth graders attending the different school types ranged
from 23 to 147 for K-8 schools and 116 to 421 in middle schools. Offenberg found that there was
a significant interaction among school type and the number of eighth graders in the school
29
related to science achievement (p<.05). Neither reading nor mathematics achievement produced
a significant interaction, though the schools with smaller numbers of eighth graders tended to
have higher scores.
Offenberg (2001) concluded that K-8 schools were more effective than middle schools in
producing the outcomes measured in his study. He observed that K-8 schools were actually
better at implementing middle school practices than 6-8 schools, an outcome likely linked to the
smaller number of students in each grade level typically found in K-8 schools. Offenberg
hypothesized that it may be easier to implement middle school practices in K-8 schools due to
the fewer students in each grade level. He suggested that middle schools may nominally have
structures that support smaller learning communities, such as teaming, but larger numbers of
students in each grade level may stymie the formation of closer relationships among students and
teachers. One limitation of the study was that the participant middle schools were assumed to
have implemented practices associated with the middle school concept just because they were
called middle schools and they housed grades 6-8.
Mertens and Flowers (2003). Mertens and Flowers (2003) focused on potential
relationships between middle school practices and student achievement in high poverty schools.
Specifically, their research question asked how interdisciplinary teaming practices and classroom
practices related to achievement in such schools. The study included a discussion of factors that
may influence the implementation of middle school features in schools. Of special concern was
how these practices along with poverty levels interact as combined effects.
Mertens and Flowers (2003) used data collected through the School Improvement Self
Study which consisted of surveys of parents, teachers, students, and administrators. Schools in
Arkansas, Louisiana, and Mississippi participated in the study as part of a reform initiative that
targeted student achievement in middle schools. Data were collected from 121 schools, 83% of
which had disadvantaged populations of 40% or more. In the 2000-2001 school year, over 3,500
teachers responded to the survey.
Mertens and Flowers (2003) examined two dimensions of the data they assembled:
teacher reports of interdisciplinary teaming and classroom practices. Teachers were asked to rate
the frequency of their practices, from never to daily, on a seven-point scale. Questions about
teaming practices centered on curriculum integration, assignment coordination, parent contact,
30
and collaboration with resource staff. Questions about classroom practices were grouped in
seven domains: small group instruction, interdisciplinary practices, authentic assessment, critical
thinking, math skills, reading skills, and writing skills. The dependent variable was student
achievement as measured by Normal Curve Equivalency scores for seventh grade math and
reading. Teaming and classroom practices were of concern to the researchers based on the
middle school reform recommendations from the National Forum. Mertens and Flowers
identified the following characteristics of effective teams and classrooms: academic rigor,
relevant curriculum, active learning, connection with larger community, and a positive climate.
Mertens and Flowers (2003) found that all four dimensions of teaming practices were
individually positively correlated at a statistically significant level with all seven classroom
practices, p<.01 for all correlations. The researchers also examined the level of implementation
of teaming practices as measured by the amount of common planning time provided to teams.
They found that teams with high levels of common planning time, defined as four times per
week with 30 minutes per meeting, implemented teaming practices at a higher level and
implemented the recommended classroom practices at a higher level. The researchers found,
however, that the mere existence of fuller implementation of teaming practices or common
planning time was not significantly related to student achievement as a single factor.
Mertens and Flowers (2003) were interested in the combined effects of teaming with
common planning time and socioeconomic status on teaming practices, classroom practices, and
student achievement. They reported that teaming with high common planning time influenced
reading scores in high poverty schools. The researchers claimed that the combined effects of
teaming and common planning time when the teams have worked together for longer period of
time can produce greater student achievement. One shortcoming of the research, however, was
that the claims of associations with achievement were not reported with descriptive statistics
which would have allowed consumers of the research to gauge the significance, if any, of the
claims.
Cook, Faulkner, and Kinne (2009). A more recent study identifying features of the
middle school concept and exploring its relationship to student achievement was the 2009
research study conducted by Cook, Faulkner, and Kinne. Cook et al. investigated levels of
implementation of middle school features as defined by This We Believe (2003) in Kentucky
31
middle schools designated as Schools to Watch (STW). STW is the primary program of the
National Forum recognizing middle grades schools that are on a trajectory of excellence toward
the three National Forum ideals of academic excellence, developmental responsiveness, and
social equity. The aim of the researchers was to also compare the level of student achievement in
schools designated as STW schools with non-STW middle schools.
Cook et al. (2009) surveyed teachers and administrators in ten STW middle schools in
Kentucky, using the middle schools concept framework articulated by This We Believe. The
survey features measured the perceptions of the teachers and administrators of the
implementation of these features in their schools. The researchers used state assessment data as
their measure of student achievement. For non-STW schools, the researchers chose all schools in
Kentucky that housed grade seven as the research population. Schools were included regardless
of grade configuration, and Cook et al. identified a stratified random sample of 40 schools to
represent the total population of 344 schools. The ten STW schools were also included in the
sample for a total of 50 schools. The survey instrument was developed by the researchers to
measure eight dimensions of the This We Believe recommendations. These eight dimensions
included middle school concept and professional preparation, advisory, school mission, teaming,
school environment, expectations, curriculum and instruction, and parental involvement.
Reliability of the survey instrument produced a Cronbach’s alpha of .98.
Using multivariate analysis of variance to analyze the eight middle school dimensions as
dependent variables and school designation as the independent variable, Cook et al. (2009) found
a significant main effect of STW versus non-STW designation, F(8, 103)=2.27, p<.05, 2=.15.
This statistic indicated that survey respondents perceived a significantly higher level of middle
school features in STW schools versus non-STW schools, though the relatively small effect size
indicated that the difference may not be particularly meaningful. The researcher also reported
that, on average, the STW schools produced student achievement equal to or better than 78% of
middle schools in Kentucky. No other statistical analysis of comparative achievement data was
reported. The researchers concluded that the selection criteria for the STW program may serve as
an effective means of measuring levels of implementation of middle school recommendations.
Jackson and Lunenburg (2010). Another recent study investigating the relationship
between student achievement and features of middle level philosophy was one published in 2010
32
by Jackson and Lunenburg. Jackson and Lunenburg explored middle level practices in Texas
middle schools using the criteria of the National Forum. One of the strengths of this study was
that the researchers probed beyond a dichotomous implemented versus not implemented measure
of middle level features by attempting to gauge levels of implementation. The degree of
implementation of middle level features was compared to levels of designation afforded the
schools based on Texas standardized test scores.
Jackson and Lunenburg (2010) developed a sample of middle schools derived from the
total population of 797 Texas middle schools housing grades six through eight. Middle schools
in Texas earn one of four designations based student performance on the Texas Assessment of
Academic Skills (TAKS): Exemplary, Recognized, Academically Acceptable, or Academically
Unacceptable. All ten of the Exemplary schools and all eight of the Academically Unacceptable
schools were invited to participate along with a random selection of Recognized and
Academically Acceptable schools, for a total of 36 middle schools. Usable data was received
from 24 of the schools, with a balanced representation from the four school designations.
Jackson and Lunenburg (2010) surveyed principals and teachers from the 24 participant
schools using the Middle School Performance Indicator Questionaire (MSPIQ) instrument from
the National Forum. Principals and teachers were asked to rate the frequency of implementation
of indicators grounded in the four STW criteria categories of the National Forum: academic
excellence, developmental responsiveness, social equity, and organizational structures.
Participants rated the frequency of implementation of the indicators using a four-point scale:
very fequently, frequently, occasionally, or never. The reliability of the survey instrument was
reported to have a Cronbach’s alpha coefficient of .97.
Jackson and Lunenburg (2010) analyzed differences among the student achievement
levels of the middle schools on each school’s indicator dimensions using an anylysis of variance
(ANOVA) statistical procedure. The ANOVA results indicated a significant level of variance
among Exemplary, Recognized, Academically Acceptable, and Academically Unacceptable
schools on all four performance indicators: academic excellence, F(3,20)=11.86, p<.05, 2=.64;
developmental responsiveness, F(3,20)=5.52, p<.05, 2=.45; social equity, F(3,20)=5.66, p<.05,
2=.46; and organizational structures, F(3,20)=9.12, p<.05, 2
=.58. These statistics indicated that
higher levels of implementation of the National Forum criteria in the higher performing schools
33
as compared to low performing schools were at a significant level. The strong and moderately
strong effect sizes indicated that the variance among the school designations was meaningful.
Jackson and Lunenburg (2010) concluded that high levels of implementation of middle
level practices recommended by the National Forum were positively associated with higher
student achievement on standardized tests. One limitation of the findings noted by the
researchers was that the levels of implementation were self reported. One way to more clearly
establish a link between middle level practices and student achievement may be to measure
levels of implementation through actual observation rather than using a survey.
Synthesis and Conclusions
In the recent era of standards and increased accountability, researchers have investigated
possible relationships between elements of the middle level philosophy of education and student
outcomes such as student achievement. Researchers have chosen varied features of the middle
school concept to examine, though frequently visible structures such as teaming and scheduled
time for advisory periods have been included as variables. Overall, the choice of specific
independent variables to be used as proxies for full implementation of the middle school concept
has been somewhat inconsistent.
In some cases, a dichotomous implemented versus not implemented scale has been used
to account for the existence of middle school practices. For these studies, researchers have relied
primarily on self-reported data from principals and teachers. Very few studies have probed
beyond the surface to report variations in implementation of middle school features as they relate
to influence on student outcomes. Reporting such variations, including the fidelity with which
middle school practices have been implemented at acceptable levels, is needed in order to
accurately draw conclusions about their efficacy.
The review of the literature presented above related to the development of education in
the middle grades and to the features associated with the implementation of the middle school
concept provides a foundation and theoretical grounding for future research. The description of
the historical development of middle-grades education presents the context for recent research
studies and ongoing policy debate. The review identifies features of the middle school concept as
described within the literature and presents an overview of research findings related to these

34
features. A synthesis and critical review of previous research methodologies and findings reveal
the need for further research.
35
CHAPTER III
METHODOLOGY
Introduction
Attempts to investigate the efficacy of the practices associated with the middle school
concept have resulted in mixed findings (Cook et al., 2009; Jackson & Lunenburg, 2010; Lee &
Smith, 1993; Mertens & Flowers, 2003; Offenberg, 2001; Stephens & Jenkins, 1994). Obstacles
to definitive findings relating middle school features to student achievement have included the
clear identification and enumeration of the characteristics of the middle school concept, and the
ability to measure the degree of implementation of these features in actual practice (Lee &
Smith, 1993; MacIver & Epstein, 1991; Stephens & Jenkins, 1994). These problems have
impeded research efforts to understand and measure the efficacy of the middle school concept as
a clearly-defined set of practices.
Purpose of the Instrument Development and Testing Process
The purpose of the instrument development and testing process was to identify critical
features of the middle school concept implemented in the context of standards and
accountability. While there are many effective school and classroom practices found in schools
at all levels, the instrument development and testing process reported narrowly focused on
enumerating school characteristics that collectively and uniquely define the middle school
concept. Once clearly defined, the middle school concept will more readily lend itself to
empirical investigation using rigorous research methodology.
The implementation of change is nonlinear, is characterized by varying stages of
adoption, and is subject to multiple adaptations (Fullan, 2001; Hall & Hord, 2006). The
instrument development and testing process, therefore, investigated the nature of the
implementation of middle school concept features, recognizing that actual practices in schools
may vary somewhat without the schools losing their identity as middle schools. The principal
product of the process was the development of a diagnostic tool that may be used in future
research to identify acceptable forms of implementation of the middle school concept.
36
The instrument development and testing process proceeded in three phases. Phase One
focused on the confirmation of the key features that define the middle school concept as
implemented in an era of standards and accountability. Phase Two involved developing a data
collection instrument that identified which key features of the middle school concept are
operationalized in schools serving the middle grades and the nature of the implementation of
those features. In Phase Three, a field test of the data collection instrument developed in Phase
Two was conducted.
Concerns-Based Adoption Model
The theoretical framework for the development of the data collection instrument was
provided by the Concerns-Based Adoption Model (CBAM) developed by Hall and Hord (2006).
Hall and Hord describe change as a complex process that occurs in stages over time and results
in variations that the original designers of the change may or may not have envisioned. The
designers of an innovation conceptualize exactly what form the innovation should take when
implemented with fidelity. The designers may offer detailed descriptions and examples of what
they intend. Nonetheless, if the innovation is widely implemented across various settings, other
people likely become involved in the process of implementation. The implementers receive and
interpret the intended innovation through the filter of their own experience, expertise,
motivation, and setting. This filtering process results in natural variations in the implementation
of the innovation.
In schools and other settings in which an innovation may be implemented, two principal
roles influence the manner in which the innovation is operationalized: change facilitators and
change implementers (Hall & Hord, 2006). The responsibility of the change facilitator is to
communicate with change implementers regarding the characteristics of the innovation and
expectations for its use. Furthermore, the change facilitator monitors and evaluates the
implementation of the innovation within a continuous cycle of feedback and adjustments to the
innovation. In a school setting, the change facilitator role may be filled by the principal or
perhaps by teacher leaders such as an instructional committee or an instructional coach. The
implementers of the change may be classroom teachers or other staff members. Environmental
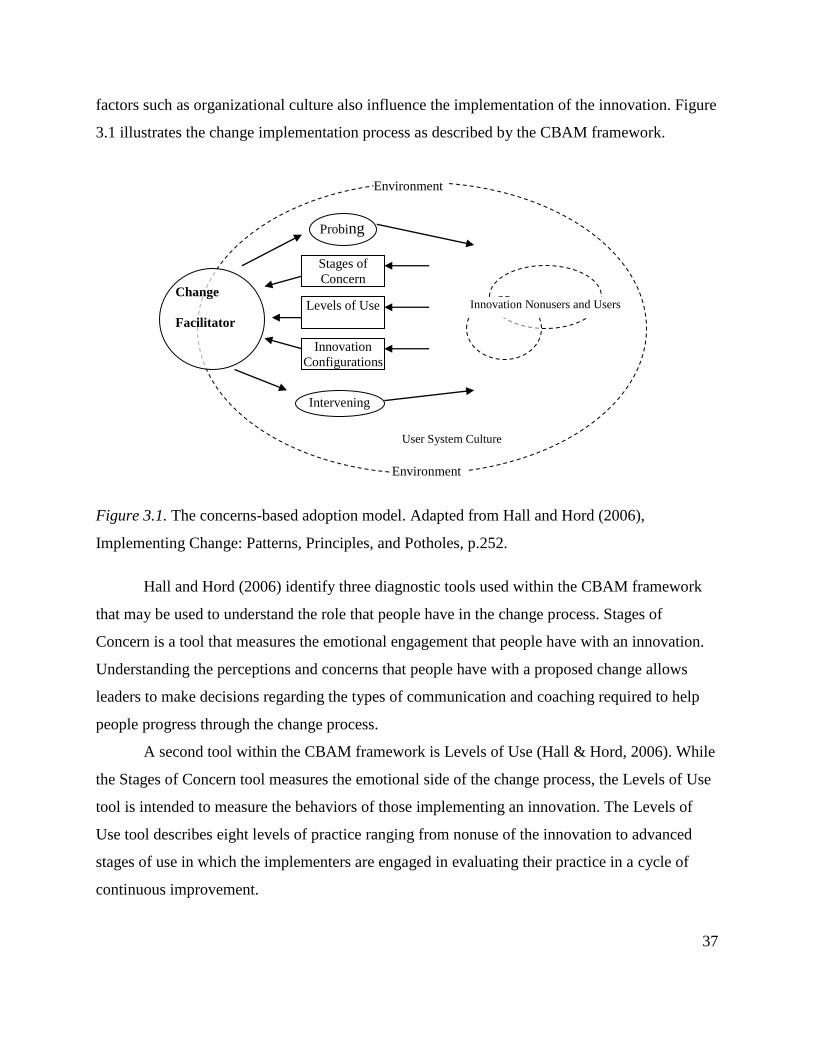
37
factors such as organizational culture also influence the implementation of the innovation. Figure
3.1 illustrates the change implementation process as described by the CBAM framework.
Figure 3.1. The concerns-based adoption model. Adapted from Hall and Hord (2006),
Implementing Change: Patterns, Principles, and Potholes, p.252.
Hall and Hord (2006) identify three diagnostic tools used within the CBAM framework
that may be used to understand the role that people have in the change process. Stages of
Concern is a tool that measures the emotional engagement that people have with an innovation.
Understanding the perceptions and concerns that people have with a proposed change allows
leaders to make decisions regarding the types of communication and coaching required to help
people progress through the change process.
A second tool within the CBAM framework is Levels of Use (Hall & Hord, 2006). While
the Stages of Concern tool measures the emotional side of the change process, the Levels of Use
tool is intended to measure the behaviors of those implementing an innovation. The Levels of
Use tool describes eight levels of practice ranging from nonuse of the innovation to advanced
stages of use in which the implementers are engaged in evaluating their practice in a cycle of
continuous improvement.
Change
Facilitator
Innovation Nonusers and Users
Environment
Environment
Stages of
Concern
Levels of Use
Innovation
Configurations
Probing
User System Culture
Intervening
38
The third CBAM tool, Innovation Configuration (IC) mapping, is used to identify the
essential components of the innovation and describe what these components look like when
operationalized (Hall & Hord, 2006). IC mapping accounts for variations along a continuum of
actual implementation. The IC map provides descriptors ranging from implementation of the
innovation components as envisioned by the innovation designers on one end of the continuum
to the other end of the continuum where the components are implemented in a form that is
something other than the original innovation. Together, these three diagnostic tools provide
useful information to leaders charged with facilitating the change process within an organization.
Figure 3.1 illustrates how Stages of Concern, Levels of Use, and IC mapping are used within the
CBAM framework to measure the implementation of an innovation.
Innovation Configuration Mapping
Since the purpose of the instrument development and testing process was to identify
components of the middle school concept in a standards-based era and to investigate variations in
its implementation, one CBAM tool in particular provided an appropriate methodology: IC
mapping. IC mapping is an interactive process that results in a description of the multiple
variations of components of an innovation as operationalized in actual practice across different
settings (Hall & Hord, 2006). The intent is not to judge whether a particular variation of a change
component is good or bad but to acknowledge the reality that different adopters of a change have
different interpretations of what the change should look like or may alter one or more
components of the change to fit a particular setting. For each component of a change, the IC map
describes a range of variations of the component based on documents, expert consensus, and
actual observation. After multiple iterations of the IC map, fidelity lines are drawn to indicate
which variations are associated with the innovation and which variations have manifested as
something different than the innovation.
The first phase of the IC mapping process is to identify the components of the innovation
that will be included in the IC map. Hall and Hord (2006) suggest that this initial step be
accomplished through interaction with developers of the innovation and other individuals who
might be considered experts on the innovation. In addition, a thorough review of key documents
39
associated with the innovation should be conducted. This CBAM sorting process results in a
cluster map made up of the key components of the innovation.
Once the key components of the innovation have been clearly identified and clustered,
the second phase of IC mapping begins (Hall & Hord, 2006). In this phase, the researchers
developing the IC map describe the manner in which each component of the innovation is
manifested in schools and classrooms. The goal of this part of the process is to descriptively
account for what the people involved with the innovation actually do when the innovation is in
use. What would an observer of the innovation see happening in classrooms and schools? What
would teachers and students be doing? Answering these questions and developing the IC map is
most effectively done through a collaborative, multiple-iterative process, preferably with three or
more people working together as an IC mapping team.
An IC map is the CBAM tool that recognizes that the various components of an
innovation will naturally evolve into a variety of forms as a function of the multiplicity of people
who adopt the innovation and the variety of settings in which the innovation is adopted (Hall &
Hord, 2006). Thus, the work done by the IC mapping team in this second phase constitutes the
essence of the process. Depending on the complexity of the innovation, the IC mapping team
provides as much detail as needed in order to achieve clarity. For each component, a range of
implementation is described, with variation a representing the component in its most developed
state, and variation d or e representing the absence of implementation of the component (Hall &
Hord, 2006). Table 3.1 provides an example of how an innovation component may be described,
accounting for a range of variations. The example in Table 3.1 is derived from an IC map
developed by Ceperley and Squires (2000) describing how data are used to improve teaching and
learning within a school district.
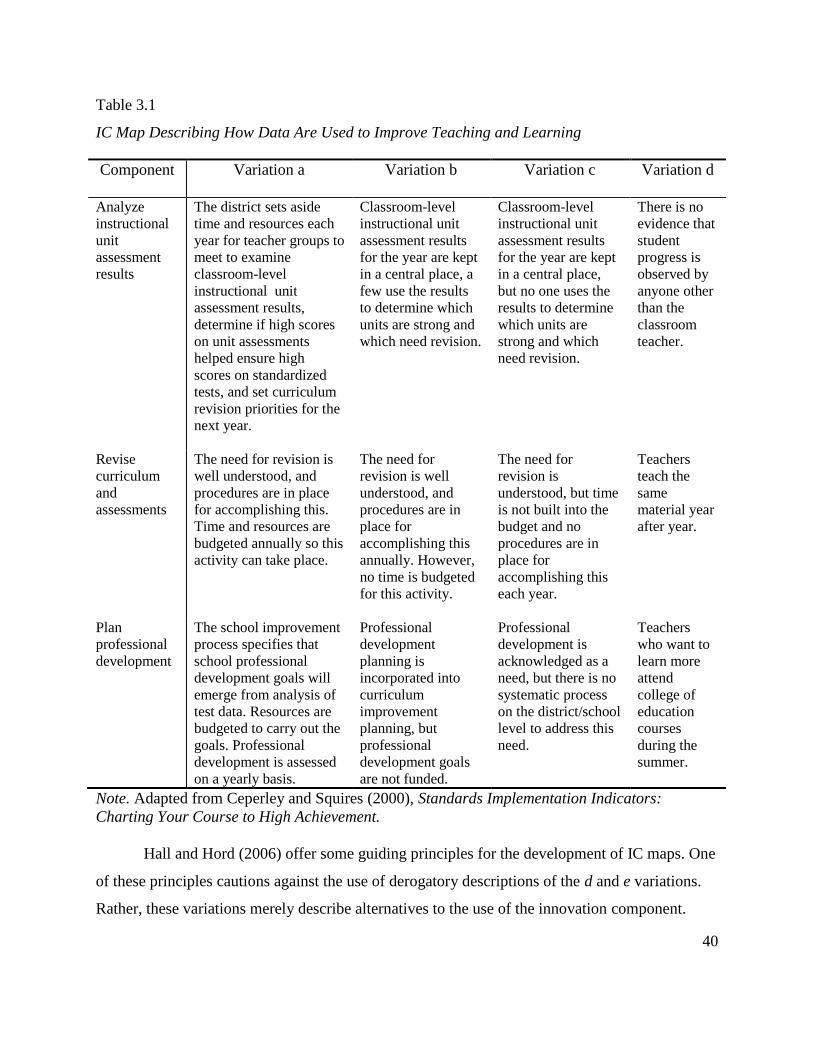
40
Table 3.1
IC Map Describing How Data Are Used to Improve Teaching and Learning
Component Variation a Variation b Variation c Variation d
Analyze
instructional
unit
assessment
results
The district sets aside
time and resources each
year for teacher groups to
meet to examine
classroom-level
instructional unit
assessment results,
determine if high scores
on unit assessments
helped ensure high
scores on standardized
tests, and set curriculum
revision priorities for the
next year.
Classroom-level
instructional unit
assessment results
for the year are kept
in a central place, a
few use the results
to determine which
units are strong and
which need revision.
Classroom-level
instructional unit
assessment results
for the year are kept
in a central place,
but no one uses the
results to determine
which units are
strong and which
need revision.
There is no
evidence that
student
progress is
observed by
anyone other
than the
classroom
teacher.
Revise
curriculum
and
assessments
The need for revision is
well understood, and
procedures are in place
for accomplishing this.
Time and resources are
budgeted annually so this
activity can take place.
The need for
revision is well
understood, and
procedures are in
place for
accomplishing this
annually. However,
no time is budgeted
for this activity.
The need for
revision is
understood, but time
is not built into the
budget and no
procedures are in
place for
accomplishing this
each year.
Teachers
teach the
same
material year
after year.
Plan
professional
development
The school improvement
process specifies that
school professional
development goals will
emerge from analysis of
test data. Resources are
budgeted to carry out the
goals. Professional
development is assessed
on a yearly basis.
Professional
development
planning is
incorporated into
curriculum
improvement
planning, but
professional
development goals
are not funded.
Professional
development is
acknowledged as a
need, but there is no
systematic process
on the district/school
level to address this
need.
Teachers
who want to
learn more
attend
college of
education
courses
during the
summer.
Note. Adapted from Ceperley and Squires (2000), Standards Implementation Indicators:
Charting Your Course to High Achievement.
Hall and Hord (2006) offer some guiding principles for the development of IC maps. One
of these principles cautions against the use of derogatory descriptions of the d and e variations.
Rather, these variations merely describe alternatives to the use of the innovation component.
41
Another principle reminds readers that the purpose of an IC map is to document the manner in
which an innovation is being implemented. Another principle of IC mapping is to endeavor to be
as descriptive as possible to achieve clarity for each component. Descriptions of the presence and
absence of the component should be included. Another principle recommends that each
component should have two to four dimensions. A final guiding principle suggests that IC
mapping is a process that involves the building of consensus among the mappers.
The third and final phase of IC mapping is a verification process to test the content
validity of the newly-created IC map. The verification process is accomplished by observing the
innovation components as implemented in schools and classrooms. Hall and Hord caution that
the first draft of an IC map almost always needs to be adjusted. Some descriptions may need
further clarification in order to render the IC map a more useful diagnostic tool for practitioners
facilitating change in the field and researchers studying measurable outcomes of the innovation.
Through observation in schools and classrooms, the researcher may also decide that additional
components should be added to the IC map to provide a more complete description of the
innovation. Figure 3.2 illustrates the key phases of the IC mapping process (Hall & Hord, 2006).
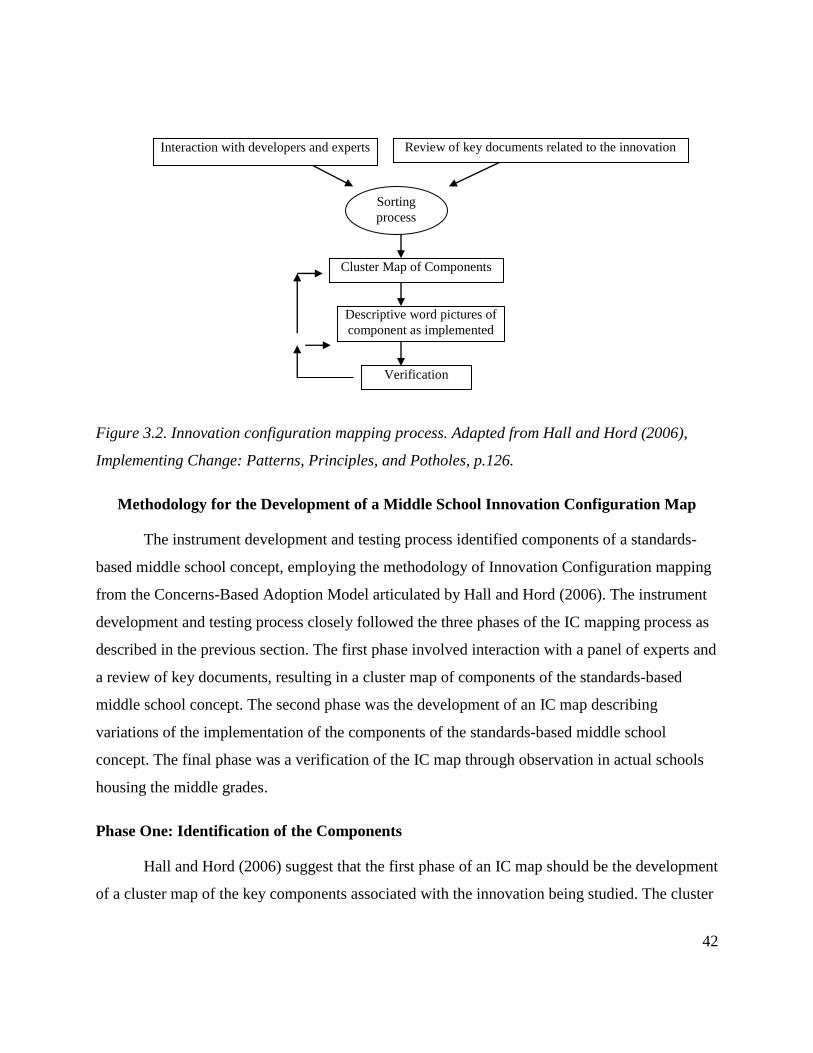
42
Figure 3.2. Innovation configuration mapping process. Adapted from Hall and Hord (2006),
Implementing Change: Patterns, Principles, and Potholes, p.126.
Methodology for the Development of a Middle School Innovation Configuration Map
The instrument development and testing process identified components of a standards-
based middle school concept, employing the methodology of Innovation Configuration mapping
from the Concerns-Based Adoption Model articulated by Hall and Hord (2006). The instrument
development and testing process closely followed the three phases of the IC mapping process as
described in the previous section. The first phase involved interaction with a panel of experts and
a review of key documents, resulting in a cluster map of components of the standards-based
middle school concept. The second phase was the development of an IC map describing
variations of the implementation of the components of the standards-based middle school
concept. The final phase was a verification of the IC map through observation in actual schools
housing the middle grades.
Phase One: Identification of the Components
Hall and Hord (2006) suggest that the first phase of an IC map should be the development
of a cluster map of the key components associated with the innovation being studied. The cluster
Interaction with developers and experts Review of key documents related to the innovation
Sorting
process
Descriptive word pictures of
component as implemented
Cluster Map of Components
Verification
43
map is created though interaction with people who are experts on the innovation and through a
review of key documents associated with the innovation (Hall & Hord, 2006).
For the instrument development and testing process, the key documents associated with
the middle school concept are the four major frameworks summarized in Table 2.1 above. The
common features that emerge from the four frameworks help define what is meant by the middle
school concept in a standards-based era: rigorous, relevant curriculum for all students;
instruction that promotes achievement and intellectual curiosity; organization for supportive
relationships within communities of learners; visionary, participatory leadership; professional
staff who are experts on middle grades education and the students they serve; support for social,
physical, and emotional wellbeing of young adolescents; and welcome involvement of parents
and community. The IC mapping process achieves verification of this list of middle school
components from the four frameworks through interaction with a panel of experts on the middle
school concept.
To attain the interaction with experts prescribed by Hall and Hord (2006), the instrument
development and testing process employed a Delphi-like process. A quasi-Delphi methodology
was appropriate since one of the guiding principles of IC mapping emphasizes the value of
building consensus (Hall & Hord, 2006). Pfeiffer (1968) explains that there are many acceptable
variations of the Delphi process, and it can be a successful way of “encouraging convergence of
opinion” (p. 153). The Delphi process is a way of collecting opinions from experts, usually via a
questionnaire, without forcing the experts to interact in a face-to-face forum. By avoiding face-
to-face communication, the pressure to yield to the opinions expressed by other experts at the
meeting is somewhat mitigated. The Delphi methodology is an iterative process involving
consecutive cycles of questioning of the individual members of the expert panel to arrive at
group consensus (Pfeiffer, 1968).
The first round of questioning usually asks open-ended questions to elicit the expertise of
the group without unduly influencing their responses. The second round of questions normally
asks the member of the expert panel to rate the responses garnered from the first round of
questioning. Subsequent rounds of questioning, if employed, serve to achieve further consensus
regarding the importance of the features under consideration (Pfeiffer, 1968). Since the primary
objective of the first phase of the process was to verify middle school features that arise from the
44
document review and since interaction with experts is one component of the larger IC mapping
methodology, a limited variation of a Delphi exercise was deemed sufficient.
The instrument development and testing process was initiated by inviting current experts
on the middle school concept to participate in a quasi-Delphi exercise to identify key
components of the middle school concept as operationalized in the standards-based era. These
experts were persons of prominence within the field and consisted of middle school reform
advocates, university-level researchers, and middle school practitioners. A potential pool of
middle school reform advocates from across the United States was identified by consulting
current publications and websites of organizations such as the Association for Middle Level
Education (AMLE; formerly the National Middle School Association), the National Forum, the
National Association of Secondary School Principals (NASSP), and affiliate state organizations.
A potential pool of university-level scholars was identified through a search of current research
and commentary literature. A potential pool of middle school practitioners was identified
through a review of programs recognizing exemplary middle school practices, such as the
National Forum’s School to Watch (STW) program and NASSP Middle School Principal of the
Year recognitions.
The completed list of potential expert panel candidates included 27 candidates in the
advocate group, 25 candidates in the practitioner group, and 35 candidates in the scholar group.
An effort was made to include candidates from diverse parts of the United States in the initial
pool. In the advocacy group, candidates resided in 23 different states. In the practitioner group,
candidates resided in 16 different states. In the university scholar group, candidates worked in 24
different states.
Candidates in each group were placed in alphabetical order and assigned a number.
Each candidate was also categorized according to one of 4 regions: South, Northeast, Midwest,
West/Pacific. For the advocate group, representation of organizations was the primary concern.
Therefore, the first three candidates invited to participate were from as many different
organizations as possible. For the practitioner group, candidates were deemed to be of relatively
equal stature within the field. Therefore, the candidates were chosen randomly, but with attention
paid to geographical representation. Using an online random number generator, three candidates
were chosen from each group. If the random number generator chose a candidate from a
45
geographic region already represented, another number was generated. For the university scholar
group, the process used for the practitioner group was repeated, minus the requirement for
geographic diversity.
Three members from each of the three representative groups of the pool were contacted
via email and follow-up telephone calls to invite participation on the expert panel. The expert
panel included at least two but no more than three members from each group, or six to nine total
experts. When fewer than two experts from any of the three representative groups agreed to
participate, additional members of the pool were contacted until the desired number of panelists
and group representation was achieved. Since the quasi-Delphi exercise was limited in scope and
duration, it was judged that any panelist who decided to end his or her participation in the
process could be replaced with an alternate without substantially jeopardizing the validity of the
process.
Linstone and Turoff (1975) advocate the use of blank questionnaires to begin a Delphi
exercise in recognition that Delphi statements to which participants are asked to respond
inherently reflect the bias and attitudes of the creators of the statements. For the instrument
development and testing process, consistent with the recommendation of Linstone and Turoff,
the initial questioning in Round One of the quasi-Delphi exercise did not include references to
elements of the middle school concept articulated in the literature. Rather, the first round of
questioning consisted of an open-ended question designed to elicit responses that arose from the
expert perspective of each individual panel member. Beginning with an open-ended question was
intended to reduce questioner bias that may otherwise have been introduced by asking panel
members to respond to statements posed by the researcher.
Additional rationale for commencing with open-ended questioning was based on the
purpose of the first phase of IC mapping. The IC mapping process prescribes a two-pronged
approach to the development of the component cluster map in Phase One: interaction with a
panel of experts and a document review of key frameworks (Hall & Hord, 2006). Triangulating
data from both experts and documents was intended to result in a more accurate and reliable list
of components of the middle school concept. The triangulation of data was made more robust by
initiating the quasi-Delphi exercise with open-ended questioning rather than only asking experts
to verify statements derived from middle school frameworks. Components from key middle
46
school frameworks were included in the second round of questioning, but starting with a blank
slate allowed for potential divergence of opinion that may not otherwise have surfaced.
In the first round of questioning of the instrument development and testing process,
panelists were asked to produce a list of essential features of the middle school concept within
the current context of standards and accountability. Participants were invited to participate in the
exercise via paper correspondence if they preferred, but otherwise the question was sent to the
expert panel members by electronic mail and they were asked to respond using an electronic
survey instrument. When responses were received from all participants, the combined list of
middle school concept features were evaluated to determine the number of responses that
duplicated responses from other panelists, and the number of responses that duplicated middle
school features derived from the document review.
The evaluation of first-round responses was used to create a new, condensed list of
middle school features. All middle school features derived from the document review were
included, along with a notation of the number of frameworks naming each feature. Next, any
non-duplicate component of the middle school concept named by a member of the expert panel
but not included in the list from the document review, was added to the new, condensed list,
along with a notation of the number of times the proposed feature was named in the first round of
questioning. The newly-created list was sent to the panel of experts for the second round of
questioning.
Panelists were asked to rate each component on the second-round list via an electronic
survey instrument. The panelists were asked to consider each of the elements listed and rate its
importance as a component of the middle school concept within the context of standards and
accountability. Participants based their responses on a five-point importance scale, a technique
for second-round questioning modeled by Jillson (1975). The following scale was employed: the
feature is (5) a crucial component of the middle school concept, (4) an important component of
the middle school concept, (3) a desirable but not crucial component of the middle school
concept, (2) somewhat related to the middle school concept, or (1) not related to the middle
school concept.
The second-round responses were compiled for statistical analysis, using Microsoft
Excel. For each component included in second-round questioning, the percentage of panelists
47
marking the component in one of the two most favorable categories, crucial or important, was
computed. All components scoring in one of the two most favorable categories by 80% of the
experts were retained for Phase Two of the IC mapping process.
Phase Two: Developing the IC Map
The subsequent phases of the IC mapping process involved working with a team of
practitioners to describe the possible variations of each middle school component, deciding how
each component could be best measured when operationalized, and then verifying the IC map
through observation, artifact gathering, and interviews in actual schools housing the middle
grades. The mapping of component variations was highly interactive since participants met
together in a live, face-to-face format.
In addition to the researcher and an expert facilitator, participants on the IC mapping
team were six practitioners who had broad experience in multiple settings with variations of
middle school components. The participant pool was middle school principals and teachers who
had experience making site visits to middle schools that have applied for recognition for the
Schools to Watch (STW) program sponsored by the National Forum. STW application reviewers
and site visitors represent high-performing schools that have already been recognized by the
STW program as having exemplary middle school practices. The STW program acknowledges
that each middle school operates in different geographic and socio-cultural settings, with distinct
student demographics, and varying levels of district support (National Forum, 2010). Hence,
STW site visitors are trained to accept and expect variation in implementation of middle school
features and were, therefore, appropriate participants of the IC mapping team. A more detailed
description of the IC mapping team participants is provided in the next chapter.
The researcher arranged the time and place for the IC mapping team to build the IC map
of middle school features. Since it was anticipated that not all participants may have been
available to physically meet in the same location, arrangements were made for participation
through teleconferencing if needed. On the designated day, the IC mapping team met to consider
each middle school component identified by the expert panel using the quasi-Delphi exercise in
Phase One of the instrument development and testing process. The building of the IC map was
48
led by a facilitator with experience in IC mapping who could guide the team through the IC
mapping process.
Given the number of components included in the IC map, a minimum of six hours was
set aside for creating the map. The team was prepared to continue the process on an additional
day if needed, though it was acknowledged that participant fatigue and availability could have
negatively affected the quality of the IC mapping process and product if precautions, such as
ensuring the efficient use of time, were not taken. The researcher consulted with the experienced
facilitator to determine the most effective means of maximizing the available time and safeguard
the integrity of the IC mapping process. These precautionary actions included: (1) introducing
the IC mapping procedures to the participants via electronic communication before the team met,
(2) sending the list of middle school features derived from Phase One to the participants ahead of
time, and (3) making sure that all materials and equipment needed for building the IC map were
in place and operational.
After the team operation was organized, the facilitator methodically proceeded through
the list of middle school features identified in Phase One, asking the IC mapping team to create
written descriptions of the variations in implementation of each feature that team members had
observed in actual practice. For each middle school feature, three to five variations were
described with as much detail as required to achieve a consensus of clarity among the team
members. The descriptions ranged from variation a, a description of the middle school feature in
its most developed state of implementation, to variation d or e, a description of the absence of
implementation of the middle school feature (see Table 3.1). The objective of this step was to
reach group consensus rather than unanimity regarding the validity and clarity of each
description. If the facilitator sensed that progress was not being made toward group consensus
for the description of a particular variation within a reasonable amount of time, he elected to
proceed to the next component and return to the disputed component at a later time in the
process.
Along with creating written statements describing how each component variation was
operationalized in middle schools, the IC mapping team developed criteria for assessing the
component implementation. Since the IC map was designed to be a diagnostic tool that could be
used to provide feedback to change facilitators within schools (see Figure 3.1) and to serve as an
49
instrument for scholarly research, the IC map described the evidence that an observer of a school
would seek in order to evaluate the implementation of each middle school feature. For example,
imagine that interdisciplinary teaming were identified as an organizational feature of middle
schools that promoted supportive relationships in communities of learners. An observer using the
IC map in a particular middle school would need to know what questions to ask of school staff
members and what documents and other artifacts to collect in order to evaluate teaming practices
in that school. Accordingly, the IC mapping team specified the data that would be useful to
evaluate each middle school component described on the IC map.
Phase Three: Verifying the IC Map
The third phase of the instrument development and testing process was a verification of
the newly-created IC map describing components of the middle school concept in an era of
standards and accountability. Verification of the IC map was conducted through field testing the
IC map on site in three schools that house the middle grades. One of the three schools chosen as
sites for pilot testing the IC map was a member school of the state middle school association and
all three schools were fully accredited by the state. Of the three pilot schools, the school that was
a member of the state middle school association was also the only school of the three that had
met federal requirements for Adequately Yearly Progress (AYP) for the previous school year
under the No Child Left Behind Act (NCLB) of 2001.
One of the problems that arises from the literature and current policy debate is whether
the implementation of the middle school concept is limited to schools exclusively housing grades
six to eight. In order to verify the validity of the IC map for middle grades housed in elementary
settings, a high-performing K-7 school was identified for inclusion in the field testing by
reviewing standardized test scores of elementary schools located within feasible proximity to the
researcher that also included the middle grades. The selected school was fully accredited by the
state for the previous school year, although it had not met requirements for AYP under NCLB.
Once the three schools were selected and arrangements made for field testing the IC map
through site visits, the researcher conducted two-day observations at the two 6-8 schools and a
one-day observation at the K-7 school. The purpose of the site visits was to attempt to use the IC
map to evaluate the implementation of middle school concept features at the pilot schools. The
50
researcher conducted informal interviews with school staff, observed classes and meetings, and
reviewed documents and other artifacts such as handbooks, schedules, and meeting agendas as
prescribed by the data collection portion of the IC map. Evidence was documented through field
notes and copies of available artifacts.
The researcher subsequently used the data collected from pilot testing the IC map at the
three schools to evaluate the validity of the IC map developed by the IC mapping team. Based on
data from field testing of the IC map, the researcher concluded that, for 18 of the 27 features
described by the IC mapping team, the IC map was a useful tool with minor revisions needed for
some components. Revisions included the need for additional descriptors for certain components,
further clarification of language, and changes to the descriptions of available evidence.
Summary
The instrument development and testing process described in this chapter identified
components of a standards-based middle school concept, employing the methodology of
Innovation Configuration (IC) mapping from the Concerns-Based Adoption Model (CBAM)
articulated by Hall and Hord (2006). The first phase involved interaction with a panel of experts
and a review of key documents, resulting in a cluster map of components of the standards-based
middle school concept. The second phase was the development of an IC map describing
variations of the implementation of the components of the standards-based middle school
concept. The final phase was a verification of the IC map through observation in actual schools
housing the middle grades. Findings from this three-phase process are reported in the next
chapter.
51
CHAPTER IV
FINDINGS
Introduction
The previous chapter delineated the three-phase instrument development and testing
process employed, grounded in the methodology of Innovation Configuration (IC) mapping (Hall
& Hord, 2006). The current chapter begins with a restatement of the purpose and an overview of
the methodology used to develop and test the resultant instrument. Findings from each of the
three phases of the instrument development and testing process are reported.
Restatement of the Purpose
The purpose of the instrument development and testing process was to identify critical
features of the middle school concept implemented in the context of standards and
accountability. While there are many effective school and classroom practices found in schools
at all levels, the instrument development and testing process narrowly focused on enumerating
school characteristics that collectively and uniquely define the middle school concept. Once
clearly defined, the features of the standards-based middle school concept will more readily lend
itself to empirical investigation using rigorous research methodology.
The implementation of change is nonlinear, is characterized by varying stages of
adoption, and is subject to multiple adaptations (Fullan, 2001; Hall & Hord, 2006). The
instrument development and testing process, therefore, also investigated the nature of the
implementation of middle school concept features, recognizing that actual practices in schools
may vary somewhat without the schools losing their identity as middle schools. The principal
product of the process was the development of a diagnostic tool that may be used in future
research to identify acceptable forms of implementation of the middle school concept and by
school leaders seeking to evaluate middle grades practices and facilitate change.
Overview of the Instrument Development and Testing Process
The instrument development and testing process identified components of a standards-
based middle school concept, employing the methodology of IC mapping from the Concerns-
52
Based Adoption Model (CBAM) articulated by Hall and Hord (2006). The first phase involved
interaction with a panel of experts and a review of key documents using a quasi-Delphi process.
The interaction with the panel of experts resulted in a cluster map of components of the
standards-based middle school concept. The second phase was the development of an IC map
describing variations of the implementation of the components of the standards-based middle
school concept. The IC map was created via face-to-face interaction with an expert facilitator
and a team of practitioners with broad experience in the middle grades. The final phase was a
verification of the IC map through observation and data collection in three schools housing the
middle grades. This third phase of the process was conducted by the researcher.
Phase One Findings: Identification of Key Features of Middle Grades Education
Description of the Participants
Participants with state and national prominence in the field of middle grades education
served on the expert panel for the quasi-Delphi exercise. The process used to identify, select, and
recruit the expert panel is described in the previous chapter. The expert panel included
representatives of state and national middle level advocacy organizations, university scholars
who focus on middle grades education, and nationally-recognized practitioners in the field. Each
participant on the expert panel was labeled as advocate, scholar, or practitioner for descriptive
purposes.
Scholar 1 is a professor at a nationally known university and has published articles in
scholarly publications such as Middle School Journal. Scholar 1 is coordinator of middle grades
education within a department that has achieved national prominence in this field.
Scholar 2 holds the rank of distinguished professor of elementary and middle grades
education. Scholar 2 has published in scholarly journals such as Middle School Journal and is
author of a book related to teaching young adolescents.
Scholar 3 is an award-winning professor and serves as executive director of a state
middle school association. Scholar 3 has published on the topic of young adolescents and is a
past recipient of the National Middle School Association (NMSA) Distinguished Educator
award.
53
Scholar 4 is an assistant professor at a nationally known university and has published
numerous articles in scholarly journals on topics related to literacy in the middle grades.
Scholar 5 is a professor of education at a nationally known university. Scholar 5 has
published several books on middle grades education and over 80 articles in scholarly journals.
Advocate 1 is the executive director of a state association of middle grades schools.
Advocate 1 is a past recipient of the NMSA Distinguished Educator award.
Advocate 2 is the director of the middle grades program of a national education
organization. Advocate 2 is a past president of NMSA.
Advocate 3 is the executive director of a state association of middle grades schools.
Advocate 3 is a former principal of an award-winning middle school.
Practitioner 1 is a middle school principal and is a past recipient of the National
Association of Secondary School Principals (NASSP) National Middle Level Principal of the
Year award. Practitioner 1 is author of articles published in journals such as Middle Ground.
Practitioner 2 is a school district director of instruction and past president of a state
association of middle level schools. Practitioner 2 has served on national committees related to
work done by NASSP in the middle grades.
Practitioner 3 is a retired award-winning middle school teacher. Practitioner 3 is a past
recipient of the NMSA Distinguished Educator award and has served on prominent national
committees related to middle grades education.
First Round of the Quasi-Delphi Exercise
For the first round of the quasi-Delphi exercise, participants were asked to respond to a
single open-ended question via an electronic survey instrument. Beginning with an open-ended
question was designed to reduce questioner bias that may otherwise have been introduced by
asking panel members to respond to statements posed by the researcher. Components from key
middle school frameworks were included in the second round of questioning, but starting with a
blank slate in the first round allowed for potential divergence of opinion that may not otherwise
have surfaced.
In the first round of questioning of the instrument development and testing process,
panelists were asked to produce a list of essential features of the middle school concept within
54
the current context of standards and accountability. The question posed to the panelists read as
follows:
Based on your experience and understanding of middle grades education, please list the
key features of the middle school concept, as implemented within the context of
standards and accountability.
Responses were received from each of the original expert panel participants. Ten of the 11
panelists responded with enumerated lists of middle school features as requested. The eleventh
panelist, Scholar 5, declined to provide a listing of middle school components since the major
professional middle grades organizations “are in agreement.” Scholar 5 directed the researcher to
the frameworks developed by three organizations: NMSA (now AMLE), NASSP, and the
National Forum to Accelerate Middle-Grades Reform (National Forum). Practitioner 3 and
Advocate 2 also referenced the key frameworks of the major professional organizations in
addition to providing a list of middle school features. The list provided by Advocate 2 made a
distinction “between the basic concepts of middle level education and the variety of structures
used to implement [them].” Appendix A lists the responses received from each panelist.
Synthesis of Middle Grades Features from Expert Panel and Major Frameworks
The IC mapping process prescribes a two-pronged approach to the development of the
component cluster map in Phase One: interaction with a panel of experts and a document review
of key frameworks. Triangulating data from both experts and documents was intended to result
in a more accurate and reliable list of components of the middle school concept. The
triangulation of data was made more robust by initiating the quasi-Delphi exercise with open-
ended questioning rather than only asking experts to verify statements derived from middle
school frameworks.
The document review was conducted by examining the four major frameworks that
describe the key features of the middle school concept. Comparing the recommendations of
Turning Points (2000), This We Believe (2003), the National Forum (2006) and Breaking Ranks
in the Middle (2006), common features emerged that define what is meant by the middle school
concept in a standards-based era. An informal coding process was employed to create a
synthesized list of middle school features, based on the middle level crosswalk published by
55
NASSP in the recent edition of Breaking Ranks developed for general school improvement
(NASSP, 2011, pp. 154-158). Whereas the NASSP (2011) middle school matrix compares the
other three frameworks to Breaking Ranks, the researcher organized the synthesized list using the
four broad categories of the National Forum: academic excellence, developmental
responsiveness, social equity, and organizational structures that support the other three concepts.
Using the four broad categories was intended to promote clarity, since all of the middle school
features listed on the four frameworks fit into these four broad categories.
The coding process was initiated by assigning a letter code to each of the four categories
on the National Forum framework. The academic excellence category was assigned a code of
“A”, the developmental responsiveness category was assigned a code of “B”, the social equity
category was assigned a code of “C”, and a code of “D” was assigned to the organizational
structures category. Each statement listed on the NASSP (2011) middle school matrix of the four
major frameworks was evaluated and assigned a code of A, B, C, or D to identify the category to
which the statement corresponded. Each statement was then evaluated a second time and
numbered sequentially (e.g. A1, A2, B1, B2, etc.). If a new statement described a feature that had
already been numbered in a previously read feature, the new statement was given the same code
as the previous statement. If a new statement described a feature that was substantively different
than previously read statements, the new statement was assigned a new code. This coding
process resulted in a synthesis of features and language of the four major middle school
frameworks.
The final step in the synthesis process was to compare the features resulting from the
document review with features resulting from the first round responses of the expert panel. The
coding process described above was applied to each feature suggested by the members of the
expert panel. The researcher found that all but three of the features listed by the expert panel
were substantively in agreement with the features resulting from the document review. The three
new features resulting from the expert panel were coded and added to the synthesized list of
middle school features. Tables 4.1, 4.2, 4.3, and 4.4 list the middle school features resulting from
the synthesis of the expert panel responses and the document review by category.
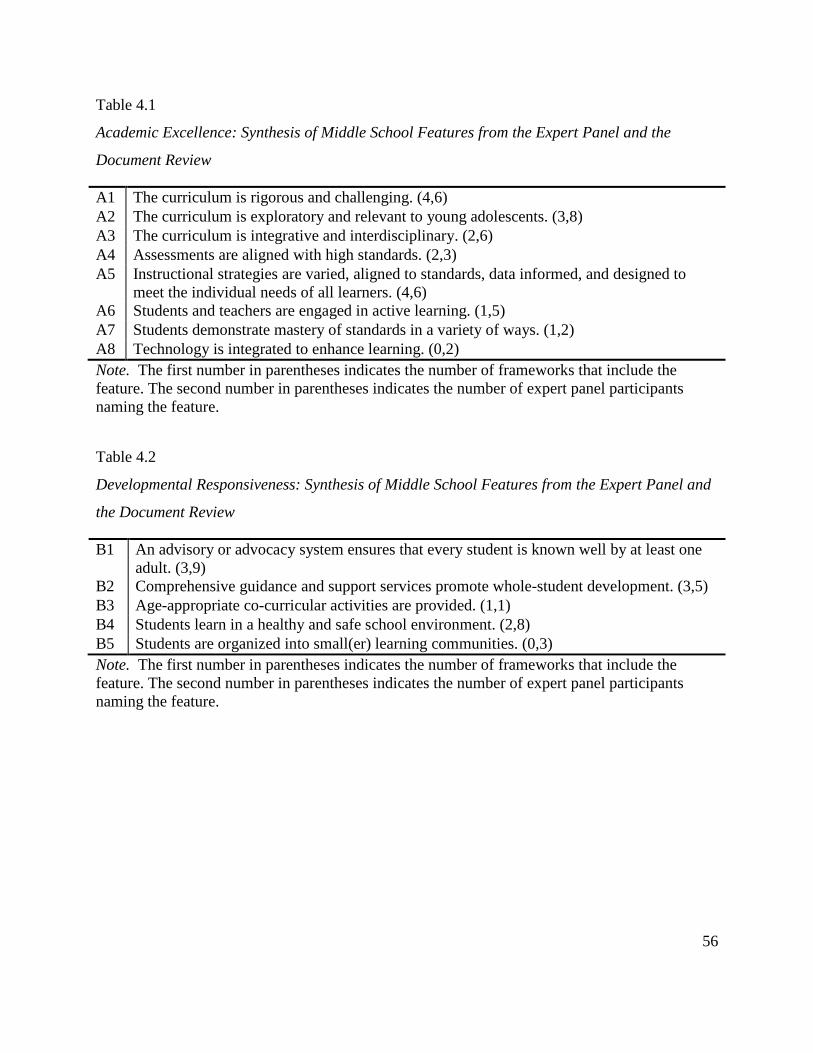
56
Table 4.1
Academic Excellence: Synthesis of Middle School Features from the Expert Panel and the
Document Review
A1 The curriculum is rigorous and challenging. (4,6)
A2 The curriculum is exploratory and relevant to young adolescents. (3,8)
A3 The curriculum is integrative and interdisciplinary. (2,6)
A4 Assessments are aligned with high standards. (2,3)
A5 Instructional strategies are varied, aligned to standards, data informed, and designed to
meet the individual needs of all learners. (4,6)
A6 Students and teachers are engaged in active learning. (1,5)
A7 Students demonstrate mastery of standards in a variety of ways. (1,2)
A8 Technology is integrated to enhance learning. (0,2)
Note. The first number in parentheses indicates the number of frameworks that include the
feature. The second number in parentheses indicates the number of expert panel participants
naming the feature.
Table 4.2
Developmental Responsiveness: Synthesis of Middle School Features from the Expert Panel and
the Document Review
B1 An advisory or advocacy system ensures that every student is known well by at least one
adult. (3,9)
B2 Comprehensive guidance and support services promote whole-student development. (3,5)
B3 Age-appropriate co-curricular activities are provided. (1,1)
B4 Students learn in a healthy and safe school environment. (2,8)
B5 Students are organized into small(er) learning communities. (0,3)
Note. The first number in parentheses indicates the number of frameworks that include the
feature. The second number in parentheses indicates the number of expert panel participants
naming the feature.
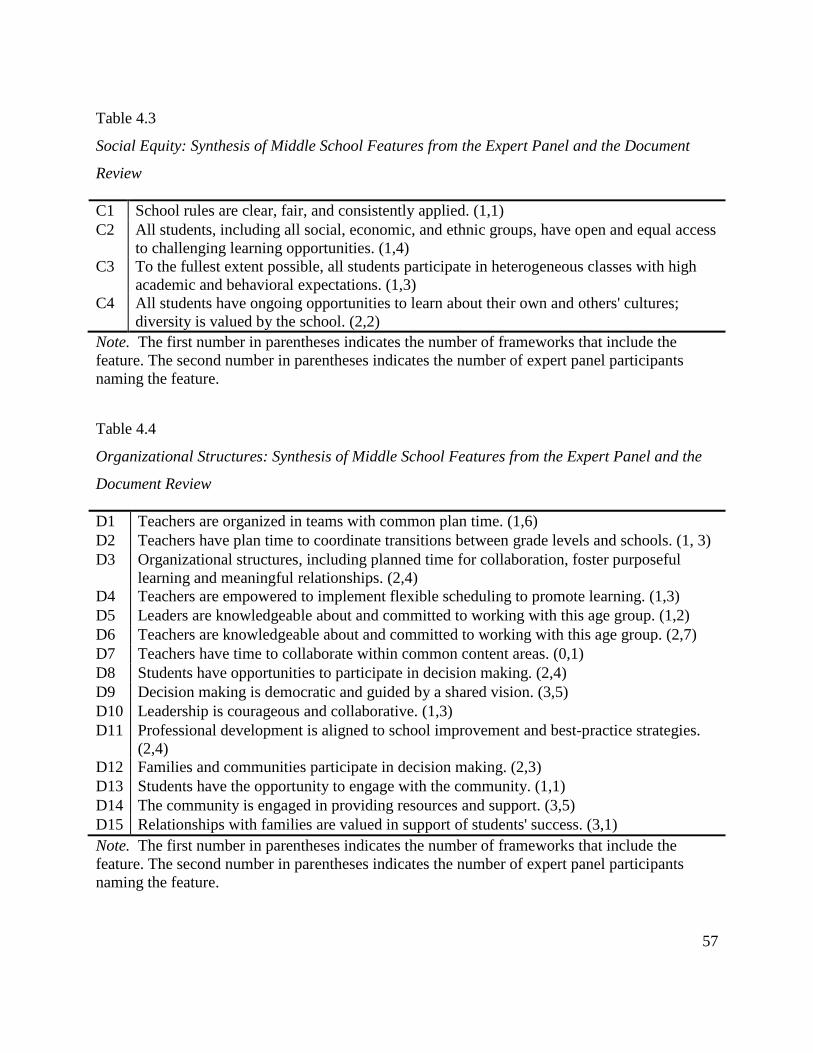
57
Table 4.3
Social Equity: Synthesis of Middle School Features from the Expert Panel and the Document
Review
C1 School rules are clear, fair, and consistently applied. (1,1)
C2 All students, including all social, economic, and ethnic groups, have open and equal access
to challenging learning opportunities. (1,4)
C3 To the fullest extent possible, all students participate in heterogeneous classes with high
academic and behavioral expectations. (1,3)
C4 All students have ongoing opportunities to learn about their own and others' cultures;
diversity is valued by the school. (2,2)
Note. The first number in parentheses indicates the number of frameworks that include the
feature. The second number in parentheses indicates the number of expert panel participants
naming the feature.
Table 4.4
Organizational Structures: Synthesis of Middle School Features from the Expert Panel and the
Document Review
D1 Teachers are organized in teams with common plan time. (1,6)
D2 Teachers have plan time to coordinate transitions between grade levels and schools. (1, 3)
D3 Organizational structures, including planned time for collaboration, foster purposeful
learning and meaningful relationships. (2,4)
D4 Teachers are empowered to implement flexible scheduling to promote learning. (1,3)
D5 Leaders are knowledgeable about and committed to working with this age group. (1,2)
D6 Teachers are knowledgeable about and committed to working with this age group. (2,7)
D7 Teachers have time to collaborate within common content areas. (0,1)
D8 Students have opportunities to participate in decision making. (2,4)
D9 Decision making is democratic and guided by a shared vision. (3,5)
D10 Leadership is courageous and collaborative. (1,3)
D11 Professional development is aligned to school improvement and best-practice strategies.
(2,4)
D12 Families and communities participate in decision making. (2,3)
D13 Students have the opportunity to engage with the community. (1,1)
D14 The community is engaged in providing resources and support. (3,5)
D15 Relationships with families are valued in support of students' success. (3,1)
Note. The first number in parentheses indicates the number of frameworks that include the
feature. The second number in parentheses indicates the number of expert panel participants
naming the feature.
58
Second Round of the Quasi-Delphi Exercise
For the second round of the quasi-Delphi exercise, the synthesized list of middle school
features was sent via an electronic survey instrument to the expert panel. For each feature on the
list, panelists were told how many of the four major frameworks endorsed the feature and how
many of the panelists included the feature in their round-one responses. The panelists were asked
to consider each of the elements listed and rate its importance as a component of the standards-
based middle school concept. Participants based their responses on a five-point importance scale,
a technique for second-round questioning modeled by Jillson (1975). The following scale was
employed: the feature is (5) a crucial component of the middle school concept, (4) an important
component of the middle school concept, (3) a desirable but not crucial component of the middle
school concept, (2) somewhat related to the middle school concept, or (1) not related to the
middle school concept.
Responses were received from nine of the original 11 expert panel participants. Neither
Scholar 4 nor Scholar 5 submitted responses for the second round. Since responses were received
from three scholars, three advocates, and three practitioners, however, an adequate balance of
representation was maintained. Using Microsoft Excel software, the percentage of panelists
marking the feature in one of the two most favorable categories, crucial or important, was
computed. Tables 4.5, 4.6, 4.7, and 4.8 report the ratings of each feature resulting from the
second round of the quasi-Delphi exercise.
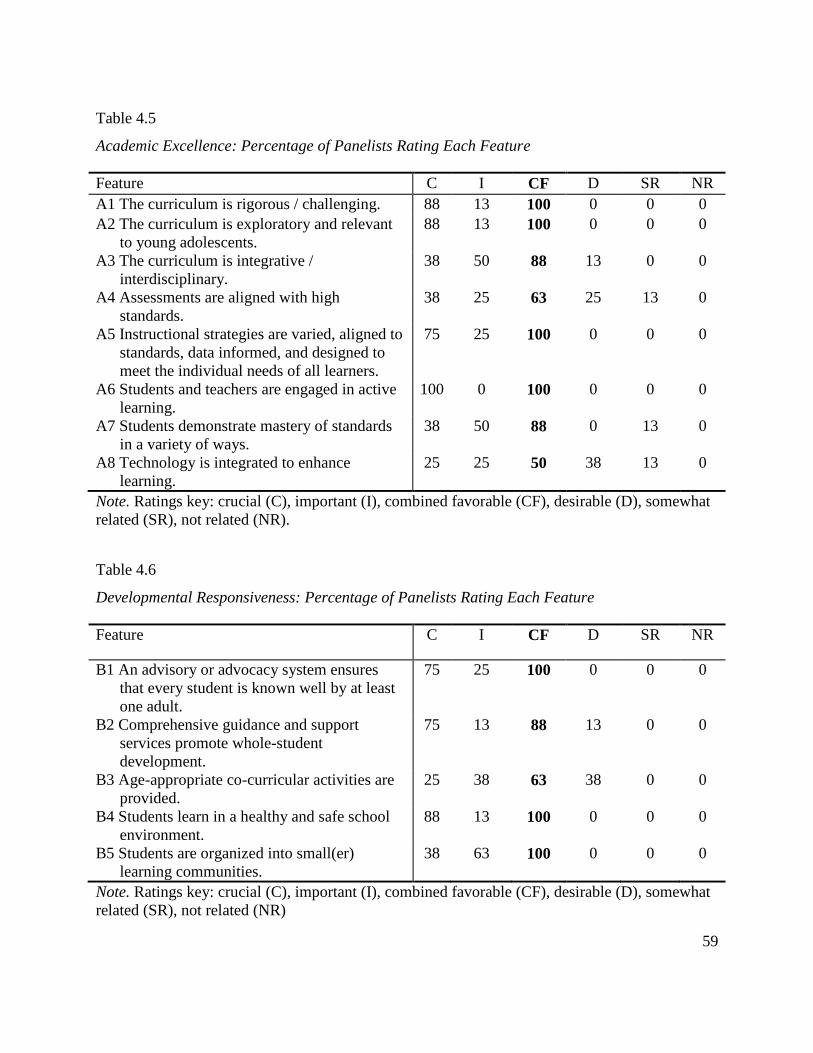
59
Table 4.5
Academic Excellence: Percentage of Panelists Rating Each Feature
Feature C I CF D SR NR
A1 The curriculum is rigorous / challenging. 88 13 100 0 0 0
A2 The curriculum is exploratory and relevant
to young adolescents.
88 13 100 0 0 0
A3 The curriculum is integrative /
interdisciplinary.
38 50 88 13 0 0
A4 Assessments are aligned with high
standards.
38 25 63 25 13 0
A5 Instructional strategies are varied, aligned to
standards, data informed, and designed to
meet the individual needs of all learners.
75 25 100 0 0 0
A6 Students and teachers are engaged in active
learning.
100 0 100 0 0 0
A7 Students demonstrate mastery of standards
in a variety of ways.
38 50 88 0 13 0
A8 Technology is integrated to enhance
learning.
25 25 50 38 13 0
Note. Ratings key: crucial (C), important (I), combined favorable (CF), desirable (D), somewhat
related (SR), not related (NR).
Table 4.6
Developmental Responsiveness: Percentage of Panelists Rating Each Feature
Feature C I CF D SR NR
B1 An advisory or advocacy system ensures
that every student is known well by at least
one adult.
75 25 100 0 0 0
B2 Comprehensive guidance and support
services promote whole-student
development.
75 13 88 13 0 0
B3 Age-appropriate co-curricular activities are
provided.
25 38 63 38 0 0
B4 Students learn in a healthy and safe school
environment.
88 13 100 0 0 0
B5 Students are organized into small(er)
learning communities.
38 63 100 0 0 0
Note. Ratings key: crucial (C), important (I), combined favorable (CF), desirable (D), somewhat
related (SR), not related (NR)
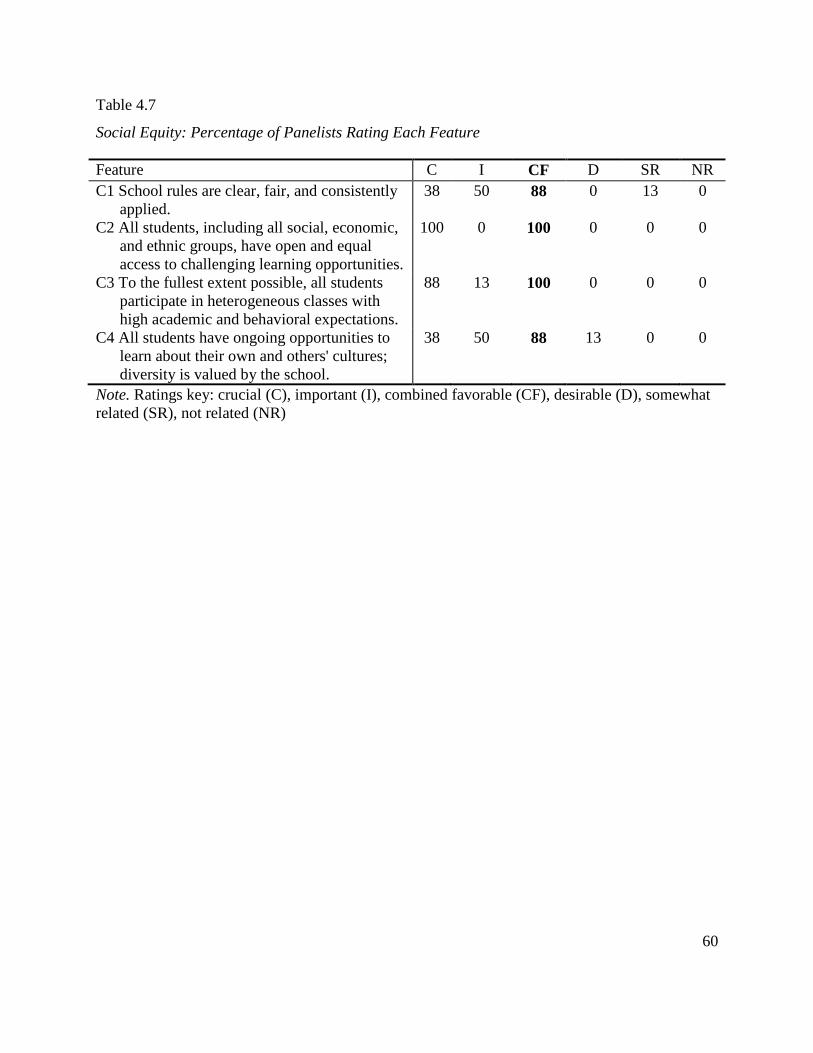
60
Table 4.7
Social Equity: Percentage of Panelists Rating Each Feature
Feature C I CF D SR NR
C1 School rules are clear, fair, and consistently
applied.
38 50 88 0 13 0
C2 All students, including all social, economic,
and ethnic groups, have open and equal
access to challenging learning opportunities.
100 0 100 0 0 0
C3 To the fullest extent possible, all students
participate in heterogeneous classes with
high academic and behavioral expectations.
88 13 100 0 0 0
C4 All students have ongoing opportunities to
learn about their own and others' cultures;
diversity is valued by the school.
38 50 88 13 0 0
Note. Ratings key: crucial (C), important (I), combined favorable (CF), desirable (D), somewhat
related (SR), not related (NR)
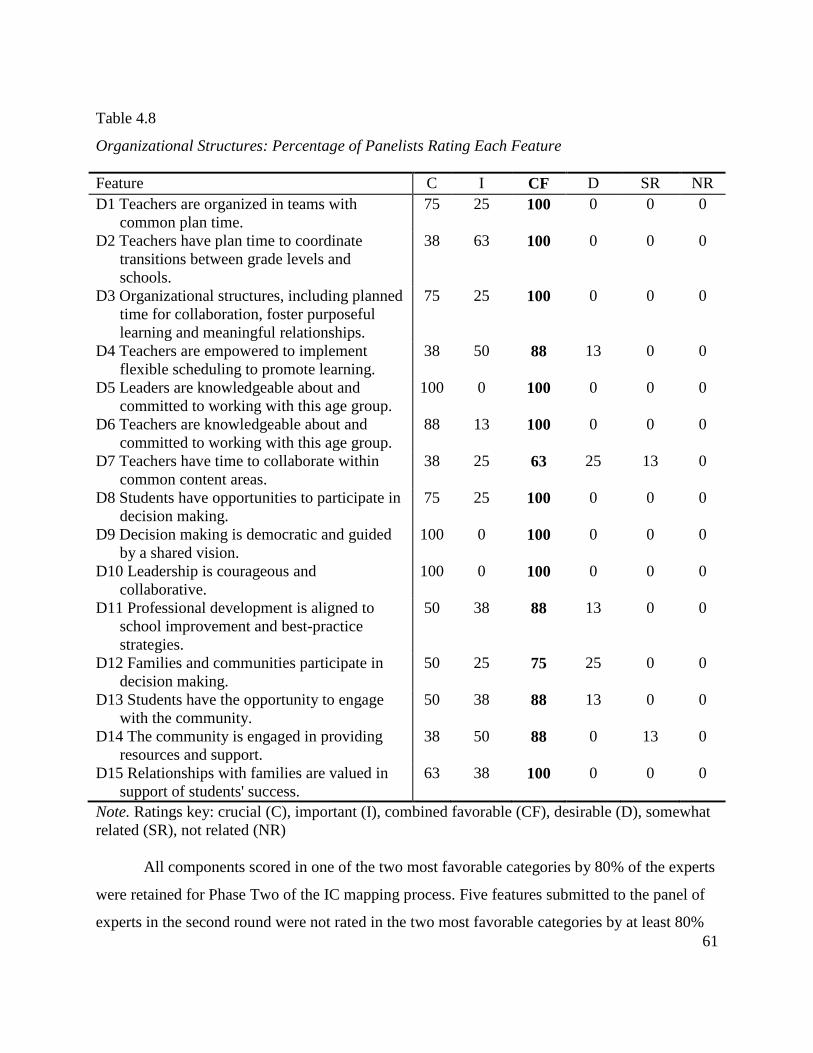
61
Table 4.8
Organizational Structures: Percentage of Panelists Rating Each Feature
Feature C I CF D SR NR
D1 Teachers are organized in teams with
common plan time.
75 25 100 0 0 0
D2 Teachers have plan time to coordinate
transitions between grade levels and
schools.
38 63 100 0 0 0
D3 Organizational structures, including planned
time for collaboration, foster purposeful
learning and meaningful relationships.
75 25 100 0 0 0
D4 Teachers are empowered to implement
flexible scheduling to promote learning.
38 50 88 13 0 0
D5 Leaders are knowledgeable about and
committed to working with this age group.
100 0 100 0 0 0
D6 Teachers are knowledgeable about and
committed to working with this age group.
88 13 100 0 0 0
D7 Teachers have time to collaborate within
common content areas.
38 25 63 25 13 0
D8 Students have opportunities to participate in
decision making.
75 25 100 0 0 0
D9 Decision making is democratic and guided
by a shared vision.
100 0 100 0 0 0
D10 Leadership is courageous and
collaborative.
100 0 100 0 0 0
D11 Professional development is aligned to
school improvement and best-practice
strategies.
50 38 88 13 0 0
D12 Families and communities participate in
decision making.
50 25 75 25 0 0
D13 Students have the opportunity to engage
with the community.
50 38 88 13 0 0
D14 The community is engaged in providing
resources and support.
38 50 88 0 13 0
D15 Relationships with families are valued in
support of students' success.
63 38 100 0 0 0
Note. Ratings key: crucial (C), important (I), combined favorable (CF), desirable (D), somewhat
related (SR), not related (NR)
All components scored in one of the two most favorable categories by 80% of the experts
were retained for Phase Two of the IC mapping process. Five features submitted to the panel of
experts in the second round were not rated in the two most favorable categories by at least 80%
62
of the panelists: assessments are aligned to high standards, technology is integrated to enhance
learning, age-appropriate co-curricular activities are provided, teachers have time to collaborate
within common content areas, and families and communities participate in decision making.
These five features were eliminated from inclusion in the final listing of 27 key features that
advanced to Phase Two of the instrument development and testing process.
Phase Two Findings: Development of the IC Map for the Key Features of the Standards-
Based Middle School Concept
Once the key features of the standards-based middle school concept were clearly
identified and clustered, the second phase of IC mapping began. In this phase, the researcher
developed an IC map describing the manner in which each component of the middle school
concept is manifested in schools and classrooms. The goal of this part of the process was to
descriptively account for what the people involved with the innovation, in this case middle
grades education, actually do when the innovation is in use. Answering these questions and
developing the IC map is ideally done through a collaborative, multiple-iterative process,
preferably with three or more people working together as an IC mapping team (Hall & Hord,
2006). For the current instrument development and testing process, a team of six practitioners
gathered along with the researcher and an expert facilitator to develop an IC map following the
methodology described in the previous chapter.
Description of the Participants
The IC mapping team was composed of middle level practitioners who had experience
and a demonstrated commitment to working with young adolescents in the middle grades.
Diversity of perspective was achieved through including participants on the IC mapping team
from a variety of roles within schools. The team composition was further strengthened by the
participation of veterans of the early years of implementation of the middle school concept as
well as educators whose experience aligns more closely with the era of standards and
accountability of the recent decade.
Participant 1 was a retired middle school teacher, a current state director of the Schools to
Watch (STW) program, and a current board member for a state middle school association.
63
Participant 2 was a retired middle school teacher, a past president and current board member of a
state middle school association, and frequent participant on site visit teams for the STW
program. Participant 3 was a principal of a middle school that had been recognized by the state
STW program, and was a frequent participant on site visit teams for the state STW program.
Participant 4 was a former special education teacher, a current middle school guidance
coordinator, and a past presenter at the national STW conference. Participant 5 was a former
middle school social studies teacher and team leader, a current schoolwide instructional coach at
a middle school, and a frequent participant on site visit teams for the state STW program.
Participant 6 was a current middle school English content leader and teacher, and was past
presenter at the state middle school association conference.
Description of the Process
After the team operation was organized, the expert facilitator methodically proceeded
through the list of middle school features identified in Phase One, asking the IC mapping team to
create written descriptions of the variations in implementation of each feature that team members
had observed in actual practice. For each middle school feature, three to five variations were
described with as much detail as required to achieve a consensus of clarity among the team
members. The descriptions ranged from variation a, a description of the middle school feature in
its most developed state of implementation, to variation d or e, a description of the absence of
implementation of the middle school feature (see Table 3.1). The objective of this step was to
reach group consensus rather than unanimity regarding the validity and clarity of each
description.
Along with creating written statements describing how each component variation is
operationalized in middle schools, the IC mapping team developed criteria for assessing the
component implementation. Since the IC map was designed to be a diagnostic tool that could be
used to provide feedback to change facilitators within schools (see Figure 3.1) and to serve as an
instrument for scholarly research, the IC mapping team described the evidence that an observer
of a school would seek in order to evaluate the implementation of each middle school feature.
The IC mapping team prescribed that data be collected primarily through informal interviews,
observation of the school and classes, and a review of documents and artifacts. The team
64
suggested that informal interviews with administrators, teachers, and guidance counselors would
produce valid data for certain features. If available, parents would also provide useful data and
were suggested as interview subjects for appropriate features. The IC mapping team concluded
that direct observation of classes and the school environment would be vital to the evidence
collection and evaluation process. Finally, the IC mapping team specified documents and
artifacts such as handbooks, websites, and schedules as suggested sources of data to evaluate the
implementation of certain features.
The IC mapping team, under the guidance of the expert facilitator, successfully
completed the first iteration of the IC map for middle grades education during the day-long, face-
to-face meeting. The IC mapping team agreed on a process to produce additional iterations until
the team was satisfied that the instrument was ready to be tested. The team agreed that the
researcher would edit the first iteration, further clarify the language of each descriptor, and
submit the new iteration to the IC mapping team via electronic communication for review.
IC Map for the Key Features of Middle Grades Education
After further editing, the researcher submitted a second iteration to the IC mapping team
participants via electronic communication. The IC mapping team participants responded,
approving the new iteration for pilot testing. Tables 4.9 through 4.35 report the iteration of the IC
map resulting from Phase Two of the instrument development and testing process. The IC map is
reported here by feature in a series of tables in order to aid readability.
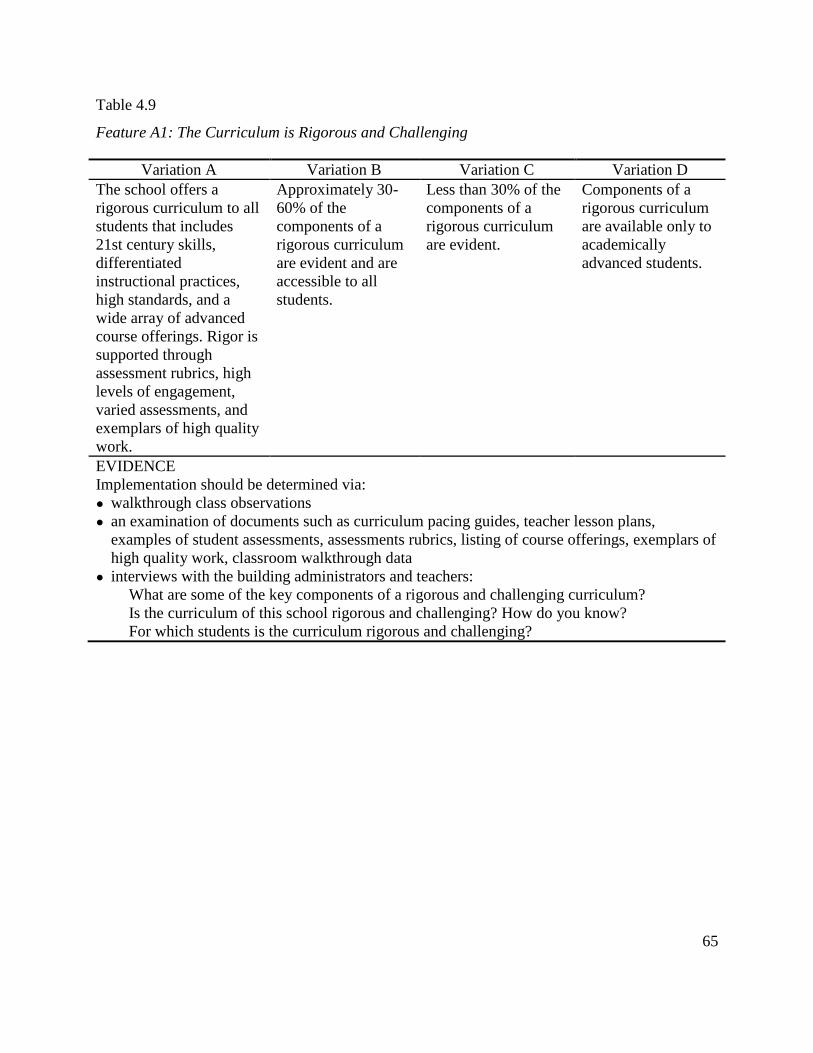
65
Table 4.9
Feature A1: The Curriculum is Rigorous and Challenging
Variation A Variation B Variation C Variation D
The school offers a
rigorous curriculum to all
students that includes
21st century skills,
differentiated
instructional practices,
high standards, and a
wide array of advanced
course offerings. Rigor is
supported through
assessment rubrics, high
levels of engagement,
varied assessments, and
exemplars of high quality
work.
Approximately 30-
60% of the
components of a
rigorous curriculum
are evident and are
accessible to all
students.
Less than 30% of the
components of a
rigorous curriculum
are evident.
Components of a
rigorous curriculum
are available only to
academically
advanced students.
EVIDENCE
Implementation should be determined via:
● walkthrough class observations
● an examination of documents such as curriculum pacing guides, teacher lesson plans,
examples of student assessments, assessments rubrics, listing of course offerings, exemplars of
high quality work, classroom walkthrough data
● interviews with the building administrators and teachers:
What are some of the key components of a rigorous and challenging curriculum?
Is the curriculum of this school rigorous and challenging? How do you know?
For which students is the curriculum rigorous and challenging?
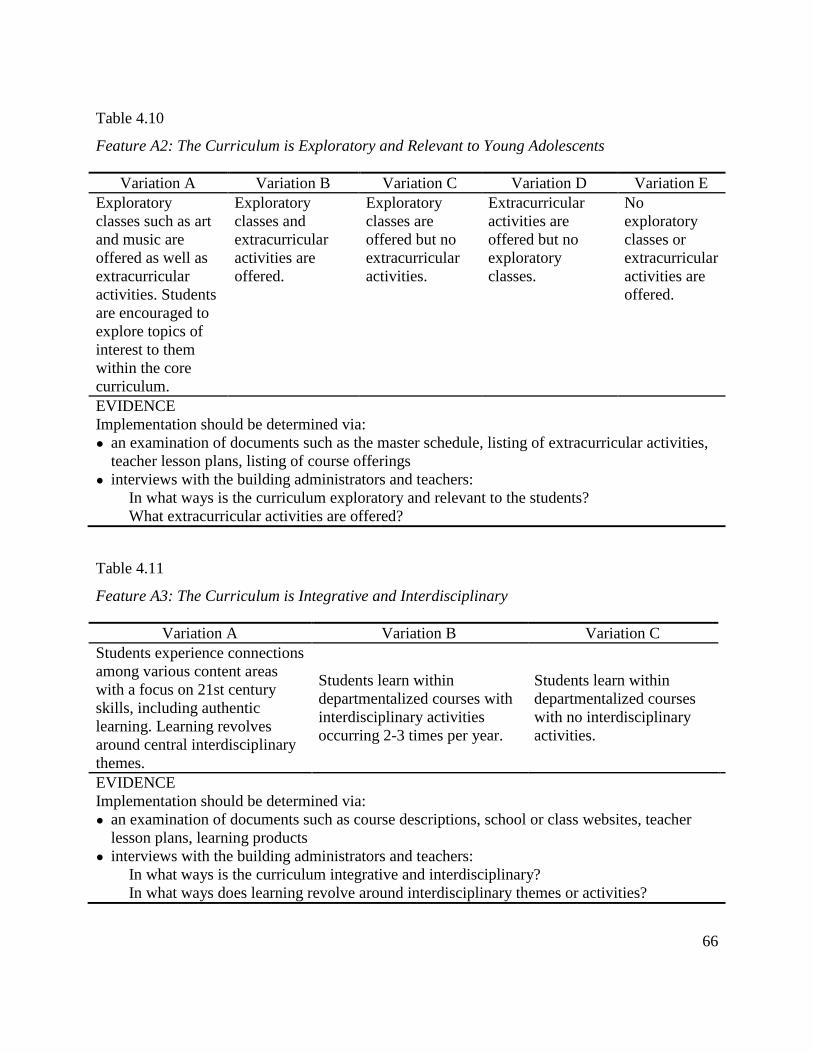
66
Table 4.10
Feature A2: The Curriculum is Exploratory and Relevant to Young Adolescents
Variation A Variation B Variation C Variation D Variation E
Exploratory
classes such as art
and music are
offered as well as
extracurricular
activities. Students
are encouraged to
explore topics of
interest to them
within the core
curriculum.
Exploratory
classes and
extracurricular
activities are
offered.
Exploratory
classes are
offered but no
extracurricular
activities.
Extracurricular
activities are
offered but no
exploratory
classes.
No
exploratory
classes or
extracurricular
activities are
offered.
EVIDENCE
Implementation should be determined via:
● an examination of documents such as the master schedule, listing of extracurricular activities,
teacher lesson plans, listing of course offerings
● interviews with the building administrators and teachers:
In what ways is the curriculum exploratory and relevant to the students?
What extracurricular activities are offered?
Table 4.11
Feature A3: The Curriculum is Integrative and Interdisciplinary
Variation A Variation B Variation C
Students experience connections
among various content areas
with a focus on 21st century
skills, including authentic
learning. Learning revolves
around central interdisciplinary
themes.
Students learn within
departmentalized courses with
interdisciplinary activities
occurring 2-3 times per year.
Students learn within
departmentalized courses
with no interdisciplinary
activities.
EVIDENCE
Implementation should be determined via:
● an examination of documents such as course descriptions, school or class websites, teacher
lesson plans, learning products
● interviews with the building administrators and teachers:
In what ways is the curriculum integrative and interdisciplinary?
In what ways does learning revolve around interdisciplinary themes or activities?
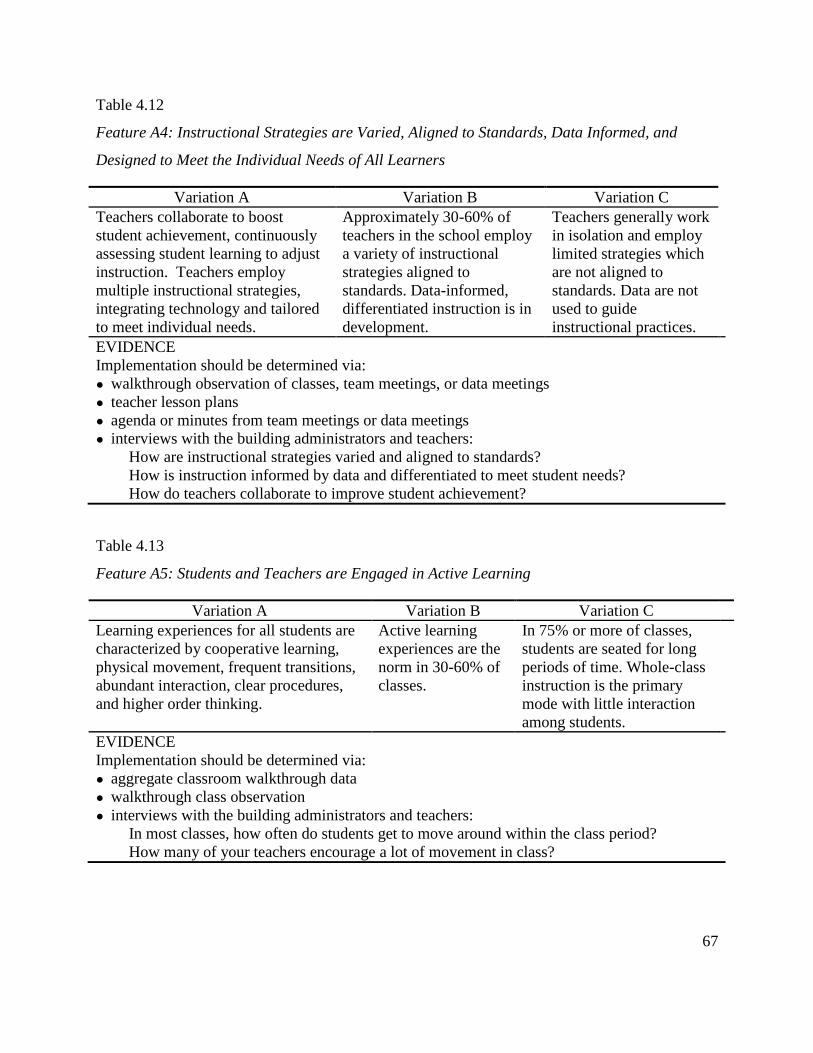
67
Table 4.12
Feature A4: Instructional Strategies are Varied, Aligned to Standards, Data Informed, and
Designed to Meet the Individual Needs of All Learners
Variation A Variation B Variation C
Teachers collaborate to boost
student achievement, continuously
assessing student learning to adjust
instruction. Teachers employ
multiple instructional strategies,
integrating technology and tailored
to meet individual needs.
Approximately 30-60% of
teachers in the school employ
a variety of instructional
strategies aligned to
standards. Data-informed,
differentiated instruction is in
development.
Teachers generally work
in isolation and employ
limited strategies which
are not aligned to
standards. Data are not
used to guide
instructional practices.
EVIDENCE
Implementation should be determined via:
● walkthrough observation of classes, team meetings, or data meetings
● teacher lesson plans
● agenda or minutes from team meetings or data meetings
● interviews with the building administrators and teachers:
How are instructional strategies varied and aligned to standards?
How is instruction informed by data and differentiated to meet student needs?
How do teachers collaborate to improve student achievement?
Table 4.13
Feature A5: Students and Teachers are Engaged in Active Learning
Variation A Variation B Variation C
Learning experiences for all students are
characterized by cooperative learning,
physical movement, frequent transitions,
abundant interaction, clear procedures,
and higher order thinking.
Active learning
experiences are the
norm in 30-60% of
classes.
In 75% or more of classes,
students are seated for long
periods of time. Whole-class
instruction is the primary
mode with little interaction
among students.
EVIDENCE
Implementation should be determined via:
● aggregate classroom walkthrough data
● walkthrough class observation
● interviews with the building administrators and teachers:
In most classes, how often do students get to move around within the class period?
How many of your teachers encourage a lot of movement in class?
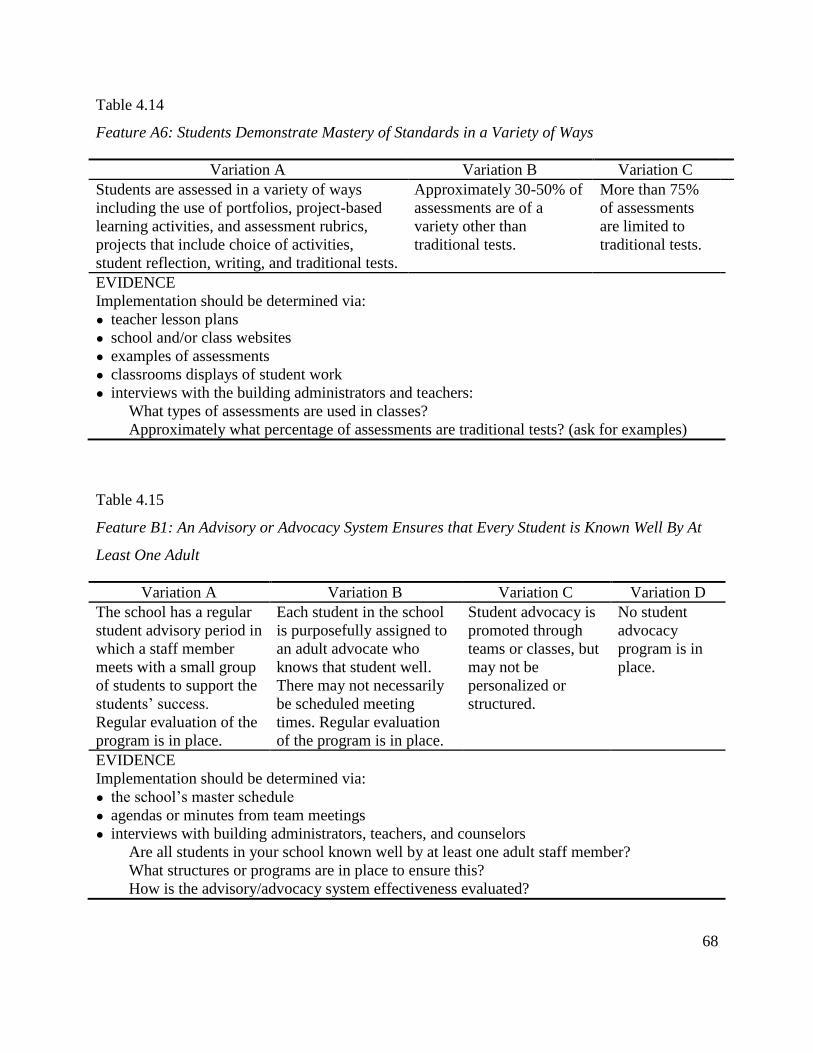
68
Table 4.14
Feature A6: Students Demonstrate Mastery of Standards in a Variety of Ways
Variation A Variation B Variation C
Students are assessed in a variety of ways
including the use of portfolios, project-based
learning activities, and assessment rubrics,
projects that include choice of activities,
student reflection, writing, and traditional tests.
Approximately 30-50% of
assessments are of a
variety other than
traditional tests.
More than 75%
of assessments
are limited to
traditional tests.
EVIDENCE
Implementation should be determined via:
● teacher lesson plans
● school and/or class websites
● examples of assessments
● classrooms displays of student work
● interviews with the building administrators and teachers:
What types of assessments are used in classes?
Approximately what percentage of assessments are traditional tests? (ask for examples)
Table 4.15
Feature B1: An Advisory or Advocacy System Ensures that Every Student is Known Well By At
Least One Adult
Variation A Variation B Variation C Variation D
The school has a regular
student advisory period in
which a staff member
meets with a small group
of students to support the
students’ success.
Regular evaluation of the
program is in place.
Each student in the school
is purposefully assigned to
an adult advocate who
knows that student well.
There may not necessarily
be scheduled meeting
times. Regular evaluation
of the program is in place.
Student advocacy is
promoted through
teams or classes, but
may not be
personalized or
structured.
No student
advocacy
program is in
place.
EVIDENCE
Implementation should be determined via:
● the school’s master schedule
● agendas or minutes from team meetings
● interviews with building administrators, teachers, and counselors
Are all students in your school known well by at least one adult staff member?
What structures or programs are in place to ensure this?
How is the advisory/advocacy system effectiveness evaluated?
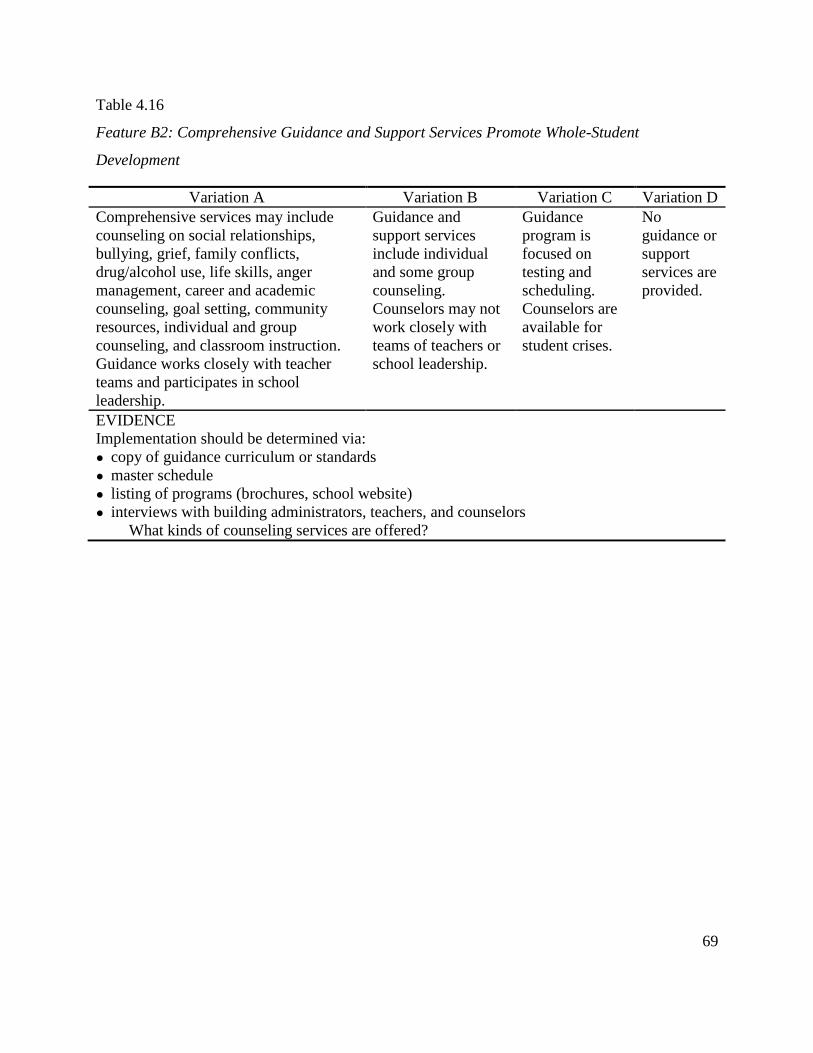
69
Table 4.16
Feature B2: Comprehensive Guidance and Support Services Promote Whole-Student
Development
Variation A Variation B Variation C Variation D
Comprehensive services may include
counseling on social relationships,
bullying, grief, family conflicts,
drug/alcohol use, life skills, anger
management, career and academic
counseling, goal setting, community
resources, individual and group
counseling, and classroom instruction.
Guidance works closely with teacher
teams and participates in school
leadership.
Guidance and
support services
include individual
and some group
counseling.
Counselors may not
work closely with
teams of teachers or
school leadership.
Guidance
program is
focused on
testing and
scheduling.
Counselors are
available for
student crises.
No
guidance or
support
services are
provided.
EVIDENCE
Implementation should be determined via:
● copy of guidance curriculum or standards
● master schedule
● listing of programs (brochures, school website)
● interviews with building administrators, teachers, and counselors
What kinds of counseling services are offered?
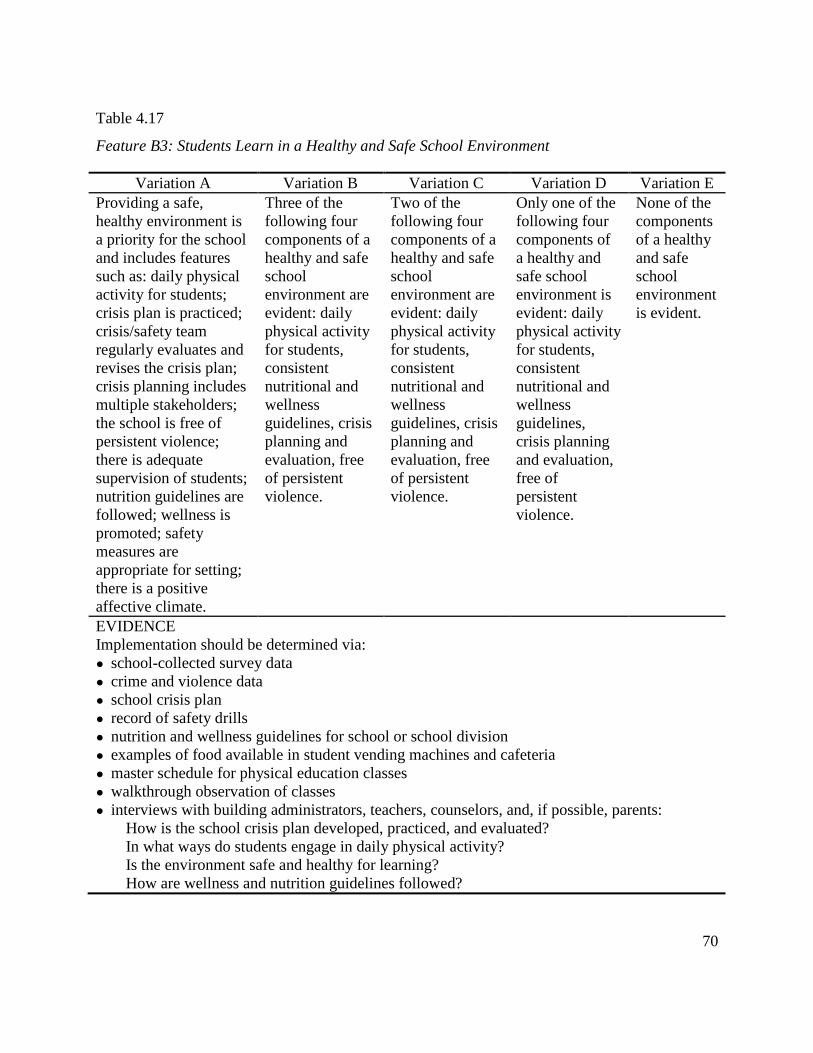
70
Table 4.17
Feature B3: Students Learn in a Healthy and Safe School Environment
Variation A Variation B Variation C Variation D Variation E
Providing a safe,
healthy environment is
a priority for the school
and includes features
such as: daily physical
activity for students;
crisis plan is practiced;
crisis/safety team
regularly evaluates and
revises the crisis plan;
crisis planning includes
multiple stakeholders;
the school is free of
persistent violence;
there is adequate
supervision of students;
nutrition guidelines are
followed; wellness is
promoted; safety
measures are
appropriate for setting;
there is a positive
affective climate.
Three of the
following four
components of a
healthy and safe
school
environment are
evident: daily
physical activity
for students,
consistent
nutritional and
wellness
guidelines, crisis
planning and
evaluation, free
of persistent
violence.
Two of the
following four
components of a
healthy and safe
school
environment are
evident: daily
physical activity
for students,
consistent
nutritional and
wellness
guidelines, crisis
planning and
evaluation, free
of persistent
violence.
Only one of the
following four
components of
a healthy and
safe school
environment is
evident: daily
physical activity
for students,
consistent
nutritional and
wellness
guidelines,
crisis planning
and evaluation,
free of
persistent
violence.
None of the
components
of a healthy
and safe
school
environment
is evident.
EVIDENCE
Implementation should be determined via:
● school-collected survey data
● crime and violence data
● school crisis plan
● record of safety drills
● nutrition and wellness guidelines for school or school division
● examples of food available in student vending machines and cafeteria
● master schedule for physical education classes
● walkthrough observation of classes
● interviews with building administrators, teachers, counselors, and, if possible, parents:
How is the school crisis plan developed, practiced, and evaluated?
In what ways do students engage in daily physical activity?
Is the environment safe and healthy for learning?
How are wellness and nutrition guidelines followed?
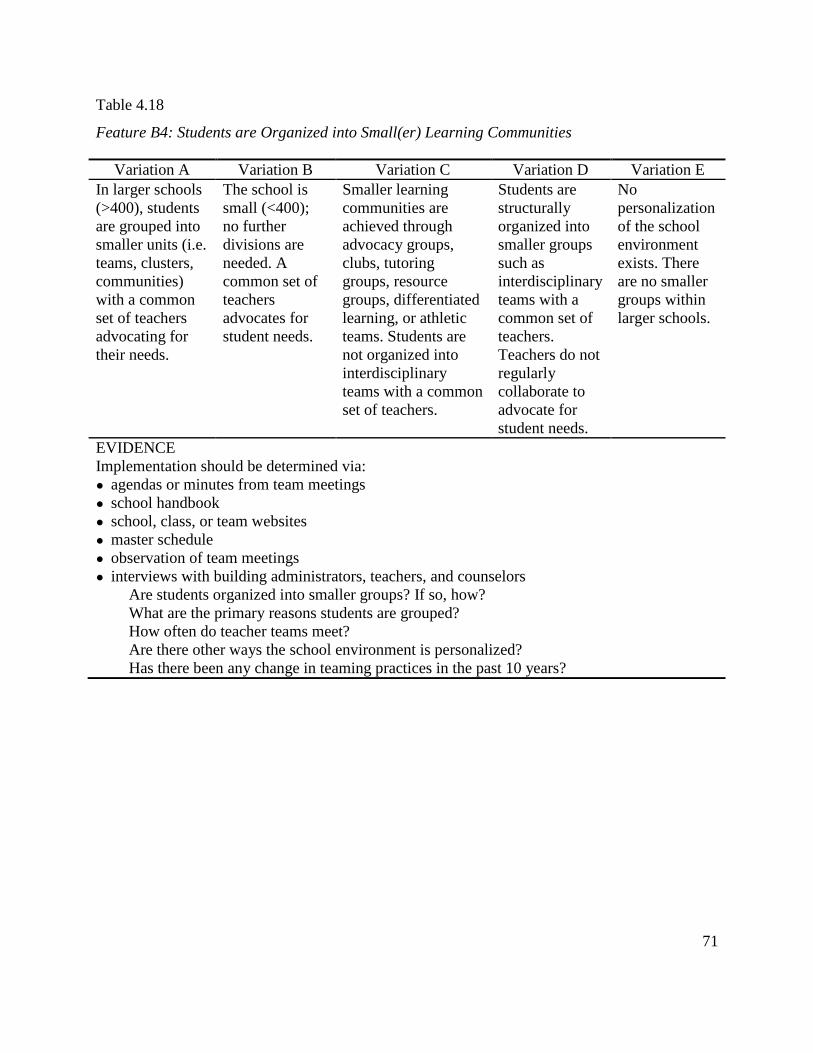
71
Table 4.18
Feature B4: Students are Organized into Small(er) Learning Communities
Variation A Variation B Variation C Variation D Variation E
In larger schools
(>400), students
are grouped into
smaller units (i.e.
teams, clusters,
communities)
with a common
set of teachers
advocating for
their needs.
The school is
small (<400);
no further
divisions are
needed. A
common set of
teachers
advocates for
student needs.
Smaller learning
communities are
achieved through
advocacy groups,
clubs, tutoring
groups, resource
groups, differentiated
learning, or athletic
teams. Students are
not organized into
interdisciplinary
teams with a common
set of teachers.
Students are
structurally
organized into
smaller groups
such as
interdisciplinary
teams with a
common set of
teachers.
Teachers do not
regularly
collaborate to
advocate for
student needs.
No
personalization
of the school
environment
exists. There
are no smaller
groups within
larger schools.
EVIDENCE
Implementation should be determined via:
● agendas or minutes from team meetings
● school handbook
● school, class, or team websites
● master schedule
● observation of team meetings
● interviews with building administrators, teachers, and counselors
Are students organized into smaller groups? If so, how?
What are the primary reasons students are grouped?
How often do teacher teams meet?
Are there other ways the school environment is personalized?
Has there been any change in teaming practices in the past 10 years?
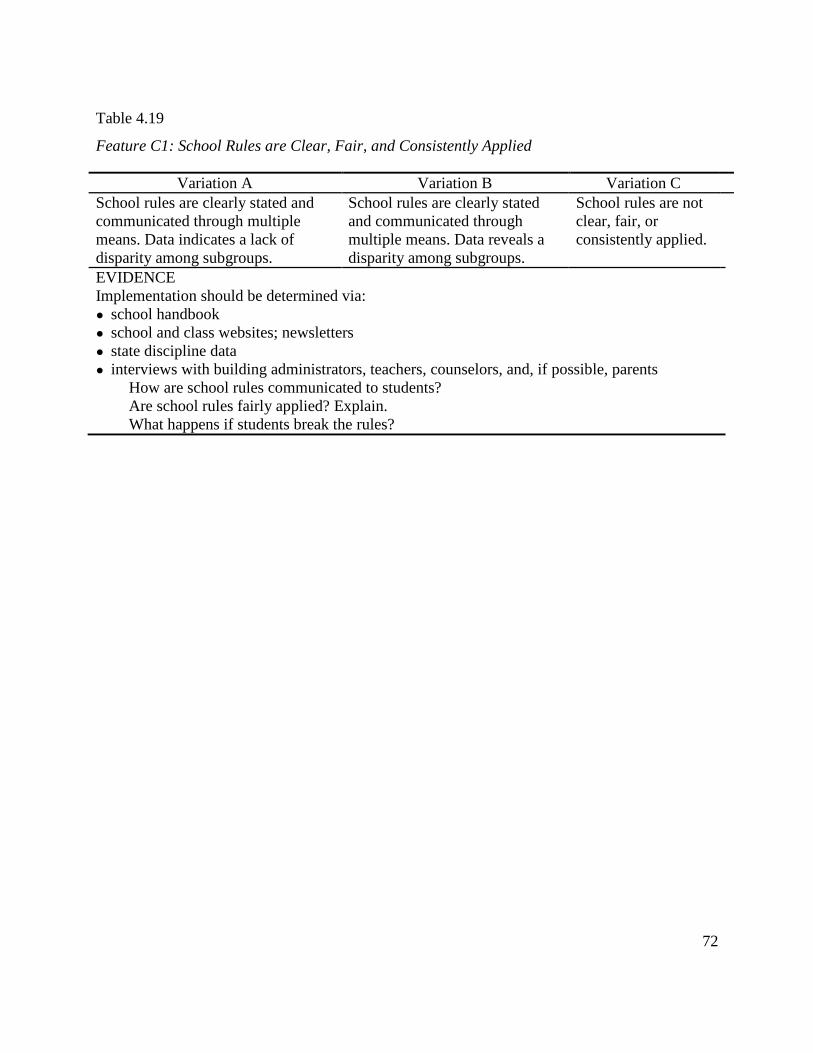
72
Table 4.19
Feature C1: School Rules are Clear, Fair, and Consistently Applied
Variation A Variation B Variation C
School rules are clearly stated and
communicated through multiple
means. Data indicates a lack of
disparity among subgroups.
School rules are clearly stated
and communicated through
multiple means. Data reveals a
disparity among subgroups.
School rules are not
clear, fair, or
consistently applied.
EVIDENCE
Implementation should be determined via:
● school handbook
● school and class websites; newsletters
● state discipline data
● interviews with building administrators, teachers, counselors, and, if possible, parents
How are school rules communicated to students?
Are school rules fairly applied? Explain.
What happens if students break the rules?
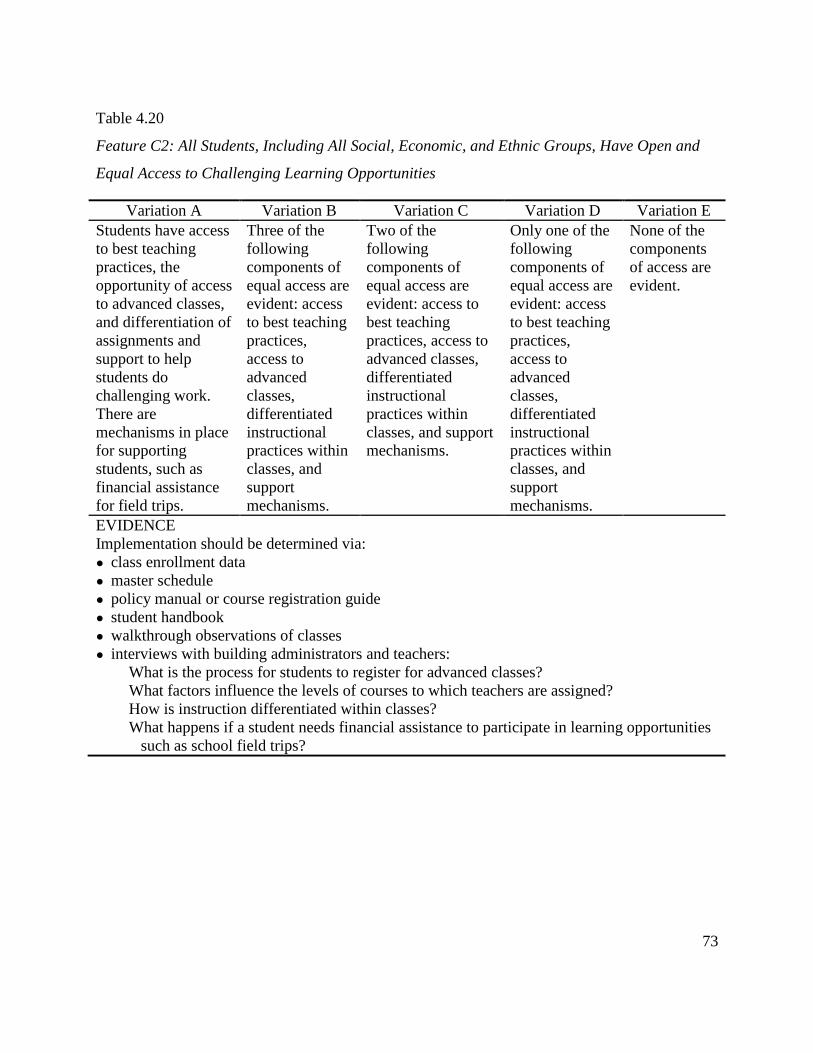
73
Table 4.20
Feature C2: All Students, Including All Social, Economic, and Ethnic Groups, Have Open and
Equal Access to Challenging Learning Opportunities
Variation A Variation B Variation C Variation D Variation E
Students have access
to best teaching
practices, the
opportunity of access
to advanced classes,
and differentiation of
assignments and
support to help
students do
challenging work.
There are
mechanisms in place
for supporting
students, such as
financial assistance
for field trips.
Three of the
following
components of
equal access are
evident: access
to best teaching
practices,
access to
advanced
classes,
differentiated
instructional
practices within
classes, and
support
mechanisms.
Two of the
following
components of
equal access are
evident: access to
best teaching
practices, access to
advanced classes,
differentiated
instructional
practices within
classes, and support
mechanisms.
Only one of the
following
components of
equal access are
evident: access
to best teaching
practices,
access to
advanced
classes,
differentiated
instructional
practices within
classes, and
support
mechanisms.
None of the
components
of access are
evident.
EVIDENCE
Implementation should be determined via:
● class enrollment data
● master schedule
● policy manual or course registration guide
● student handbook
● walkthrough observations of classes
● interviews with building administrators and teachers:
What is the process for students to register for advanced classes?
What factors influence the levels of courses to which teachers are assigned?
How is instruction differentiated within classes?
What happens if a student needs financial assistance to participate in learning opportunities
such as school field trips?
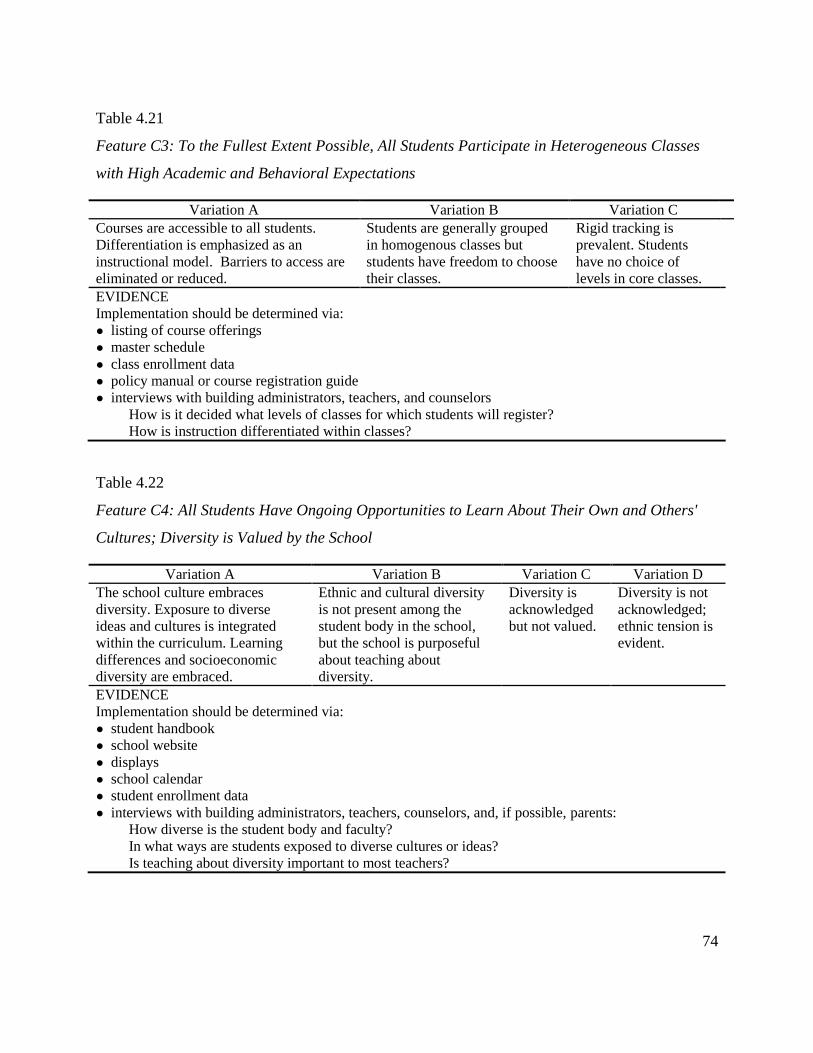
74
Table 4.21
Feature C3: To the Fullest Extent Possible, All Students Participate in Heterogeneous Classes
with High Academic and Behavioral Expectations
Variation A Variation B Variation C
Courses are accessible to all students.
Differentiation is emphasized as an
instructional model. Barriers to access are
eliminated or reduced.
Students are generally grouped
in homogenous classes but
students have freedom to choose
their classes.
Rigid tracking is
prevalent. Students
have no choice of
levels in core classes.
EVIDENCE
Implementation should be determined via:
● listing of course offerings
● master schedule
● class enrollment data
● policy manual or course registration guide
● interviews with building administrators, teachers, and counselors
How is it decided what levels of classes for which students will register?
How is instruction differentiated within classes?
Table 4.22
Feature C4: All Students Have Ongoing Opportunities to Learn About Their Own and Others'
Cultures; Diversity is Valued by the School
Variation A Variation B Variation C Variation D
The school culture embraces
diversity. Exposure to diverse
ideas and cultures is integrated
within the curriculum. Learning
differences and socioeconomic
diversity are embraced.
Ethnic and cultural diversity
is not present among the
student body in the school,
but the school is purposeful
about teaching about
diversity.
Diversity is
acknowledged
but not valued.
Diversity is not
acknowledged;
ethnic tension is
evident.
EVIDENCE
Implementation should be determined via:
● student handbook
● school website
● displays
● school calendar
● student enrollment data
● interviews with building administrators, teachers, counselors, and, if possible, parents:
How diverse is the student body and faculty?
In what ways are students exposed to diverse cultures or ideas?
Is teaching about diversity important to most teachers?
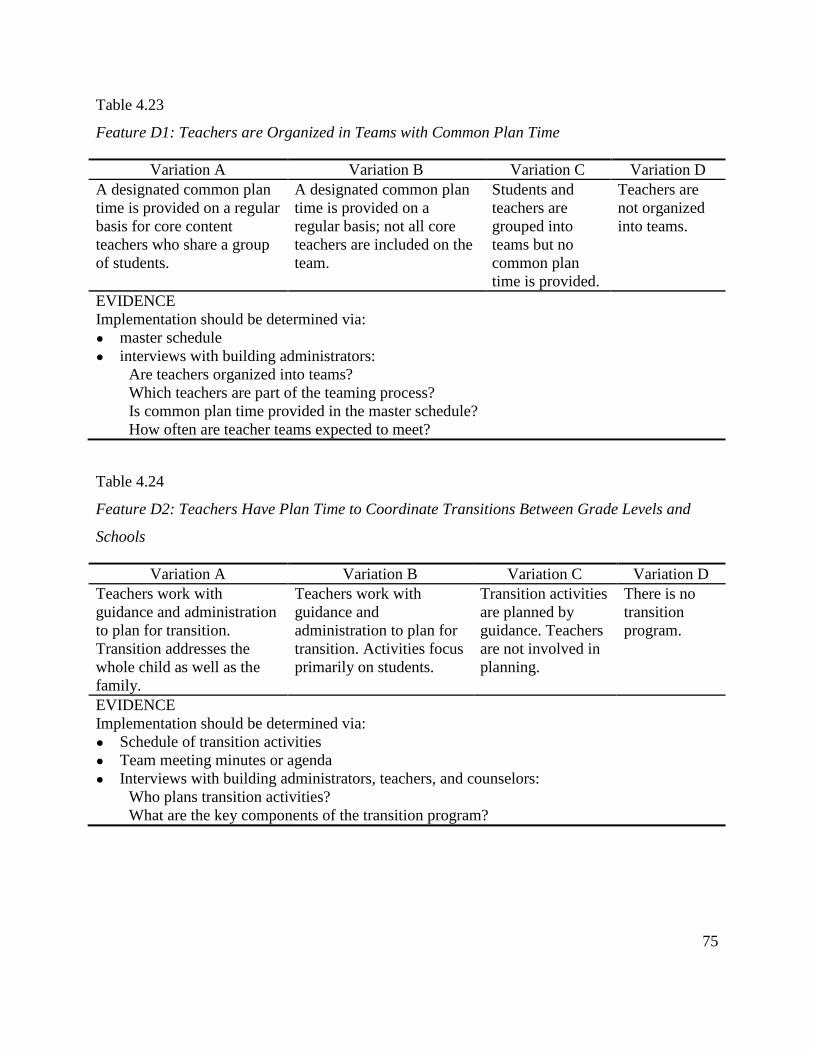
75
Table 4.23
Feature D1: Teachers are Organized in Teams with Common Plan Time
Variation A Variation B Variation C Variation D
A designated common plan
time is provided on a regular
basis for core content
teachers who share a group
of students.
A designated common plan
time is provided on a
regular basis; not all core
teachers are included on the
team.
Students and
teachers are
grouped into
teams but no
common plan
time is provided.
Teachers are
not organized
into teams.
EVIDENCE
Implementation should be determined via:
● master schedule
● interviews with building administrators:
Are teachers organized into teams?
Which teachers are part of the teaming process?
Is common plan time provided in the master schedule?
How often are teacher teams expected to meet?
Table 4.24
Feature D2: Teachers Have Plan Time to Coordinate Transitions Between Grade Levels and
Schools
Variation A Variation B Variation C Variation D
Teachers work with
guidance and administration
to plan for transition.
Transition addresses the
whole child as well as the
family.
Teachers work with
guidance and
administration to plan for
transition. Activities focus
primarily on students.
Transition activities
are planned by
guidance. Teachers
are not involved in
planning.
There is no
transition
program.
EVIDENCE
Implementation should be determined via:
● Schedule of transition activities
● Team meeting minutes or agenda
● Interviews with building administrators, teachers, and counselors:
Who plans transition activities?
What are the key components of the transition program?
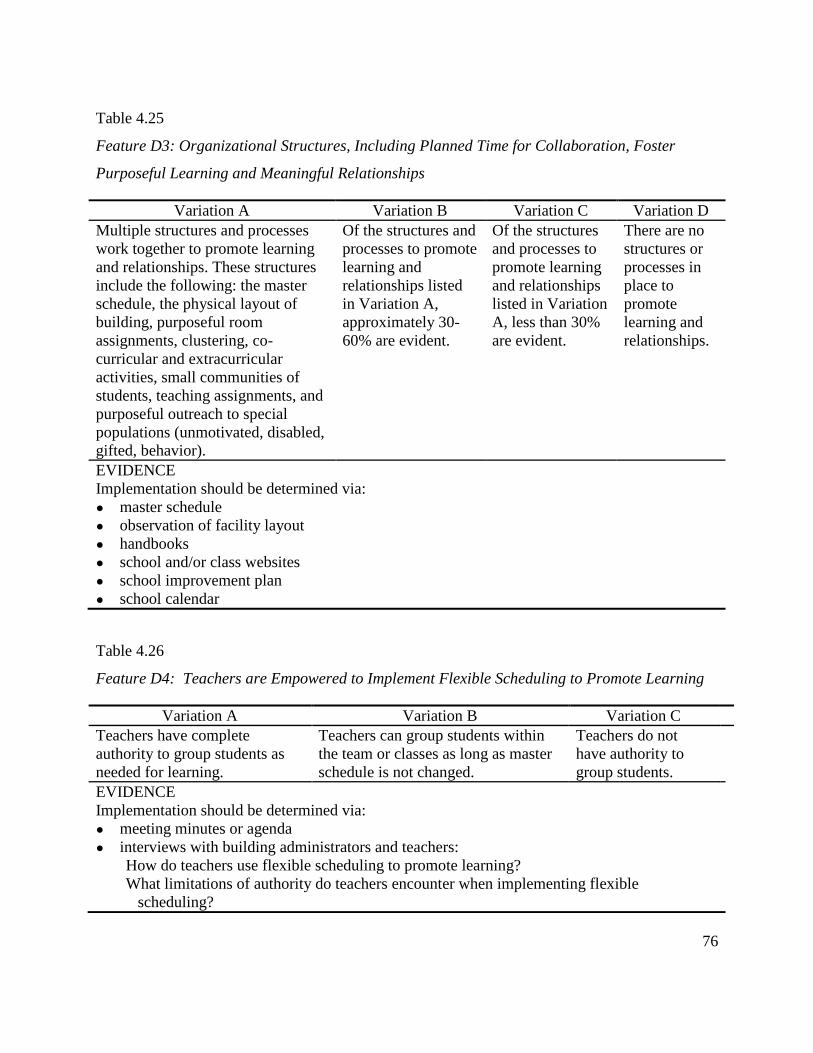
76
Table 4.25
Feature D3: Organizational Structures, Including Planned Time for Collaboration, Foster
Purposeful Learning and Meaningful Relationships
Variation A Variation B Variation C Variation D
Multiple structures and processes
work together to promote learning
and relationships. These structures
include the following: the master
schedule, the physical layout of
building, purposeful room
assignments, clustering, co-
curricular and extracurricular
activities, small communities of
students, teaching assignments, and
purposeful outreach to special
populations (unmotivated, disabled,
gifted, behavior).
Of the structures and
processes to promote
learning and
relationships listed
in Variation A,
approximately 30-
60% are evident.
Of the structures
and processes to
promote learning
and relationships
listed in Variation
A, less than 30%
are evident.
There are no
structures or
processes in
place to
promote
learning and
relationships.
EVIDENCE
Implementation should be determined via:
● master schedule
● observation of facility layout
● handbooks
● school and/or class websites
● school improvement plan
● school calendar
Table 4.26
Feature D4: Teachers are Empowered to Implement Flexible Scheduling to Promote Learning
Variation A Variation B Variation C
Teachers have complete
authority to group students as
needed for learning.
Teachers can group students within
the team or classes as long as master
schedule is not changed.
Teachers do not
have authority to
group students.
EVIDENCE
Implementation should be determined via:
● meeting minutes or agenda
● interviews with building administrators and teachers:
How do teachers use flexible scheduling to promote learning?
What limitations of authority do teachers encounter when implementing flexible
scheduling?
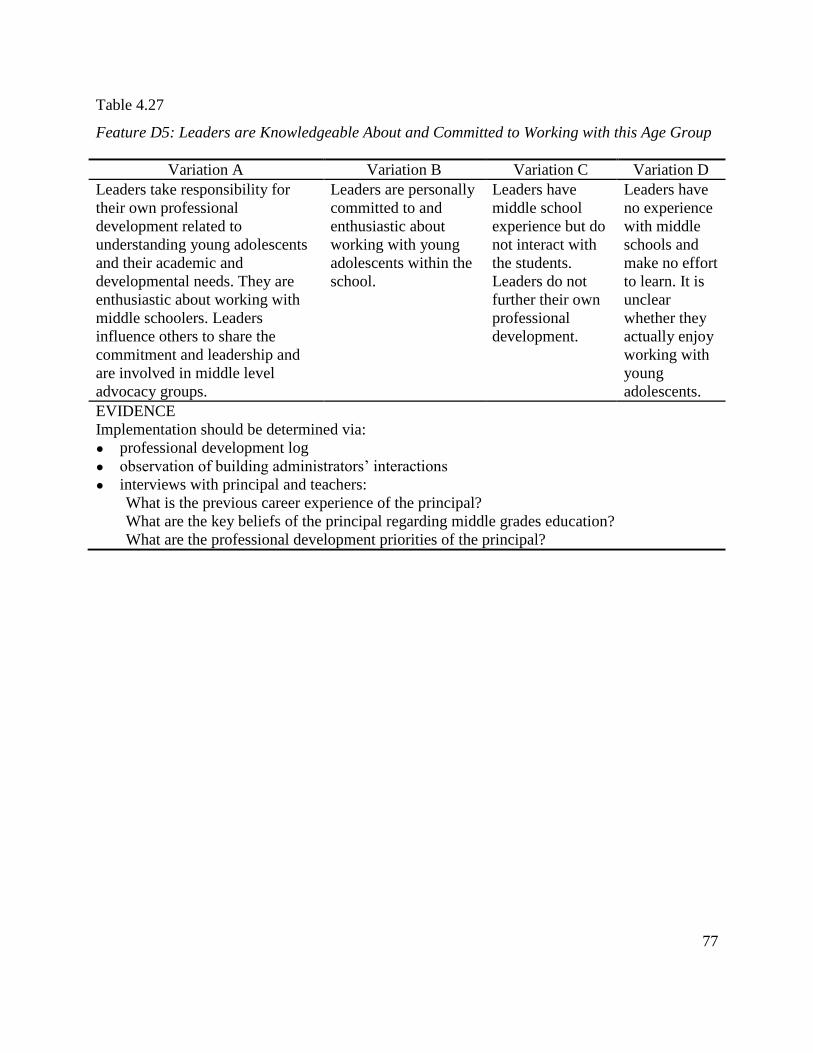
77
Table 4.27
Feature D5: Leaders are Knowledgeable About and Committed to Working with this Age Group
Variation A Variation B Variation C Variation D
Leaders take responsibility for
their own professional
development related to
understanding young adolescents
and their academic and
developmental needs. They are
enthusiastic about working with
middle schoolers. Leaders
influence others to share the
commitment and leadership and
are involved in middle level
advocacy groups.
Leaders are personally
committed to and
enthusiastic about
working with young
adolescents within the
school.
Leaders have
middle school
experience but do
not interact with
the students.
Leaders do not
further their own
professional
development.
Leaders have
no experience
with middle
schools and
make no effort
to learn. It is
unclear
whether they
actually enjoy
working with
young
adolescents.
EVIDENCE
Implementation should be determined via:
● professional development log
● observation of building administrators’ interactions
● interviews with principal and teachers:
What is the previous career experience of the principal?
What are the key beliefs of the principal regarding middle grades education?
What are the professional development priorities of the principal?
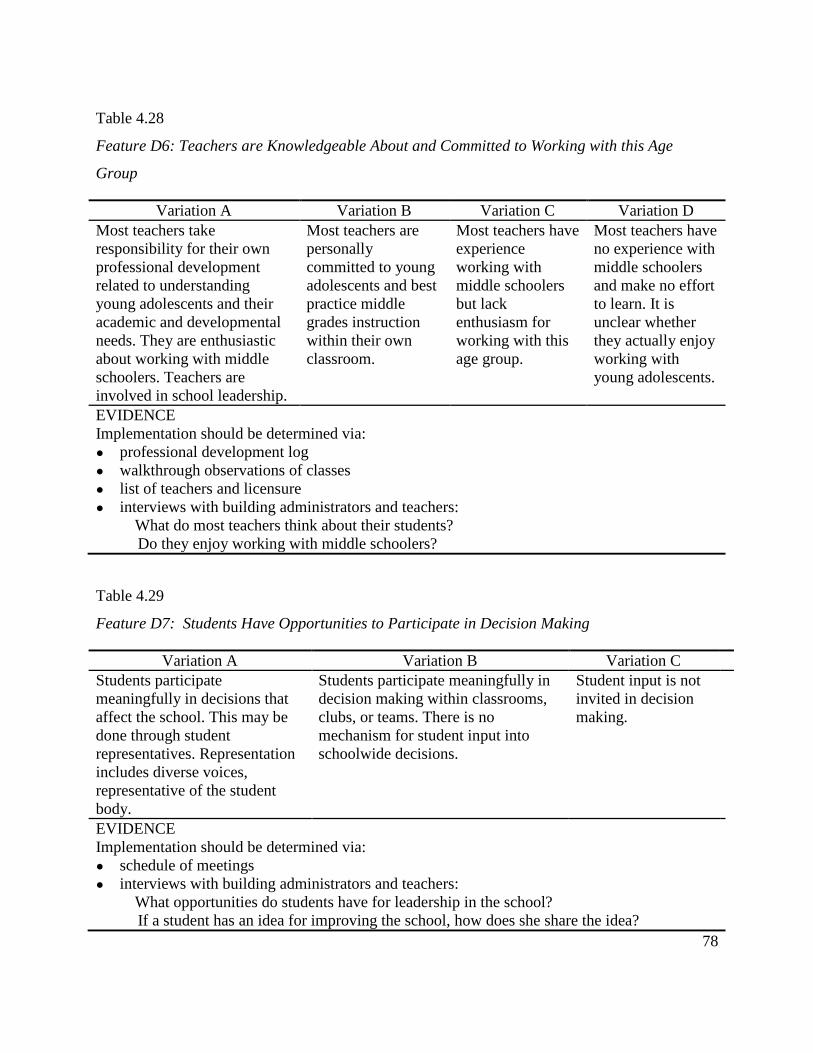
78
Table 4.28
Feature D6: Teachers are Knowledgeable About and Committed to Working with this Age
Group
Variation A Variation B Variation C Variation D
Most teachers take
responsibility for their own
professional development
related to understanding
young adolescents and their
academic and developmental
needs. They are enthusiastic
about working with middle
schoolers. Teachers are
involved in school leadership.
Most teachers are
personally
committed to young
adolescents and best
practice middle
grades instruction
within their own
classroom.
Most teachers have
experience
working with
middle schoolers
but lack
enthusiasm for
working with this
age group.
Most teachers have
no experience with
middle schoolers
and make no effort
to learn. It is
unclear whether
they actually enjoy
working with
young adolescents.
EVIDENCE
Implementation should be determined via:
● professional development log
● walkthrough observations of classes
● list of teachers and licensure
● interviews with building administrators and teachers:
What do most teachers think about their students?
Do they enjoy working with middle schoolers?
Table 4.29
Feature D7: Students Have Opportunities to Participate in Decision Making
Variation A Variation B Variation C
Students participate
meaningfully in decisions that
affect the school. This may be
done through student
representatives. Representation
includes diverse voices,
representative of the student
body.
Students participate meaningfully in
decision making within classrooms,
clubs, or teams. There is no
mechanism for student input into
schoolwide decisions.
Student input is not
invited in decision
making.
EVIDENCE
Implementation should be determined via:
● schedule of meetings
● interviews with building administrators and teachers:
What opportunities do students have for leadership in the school?
If a student has an idea for improving the school, how does she share the idea?
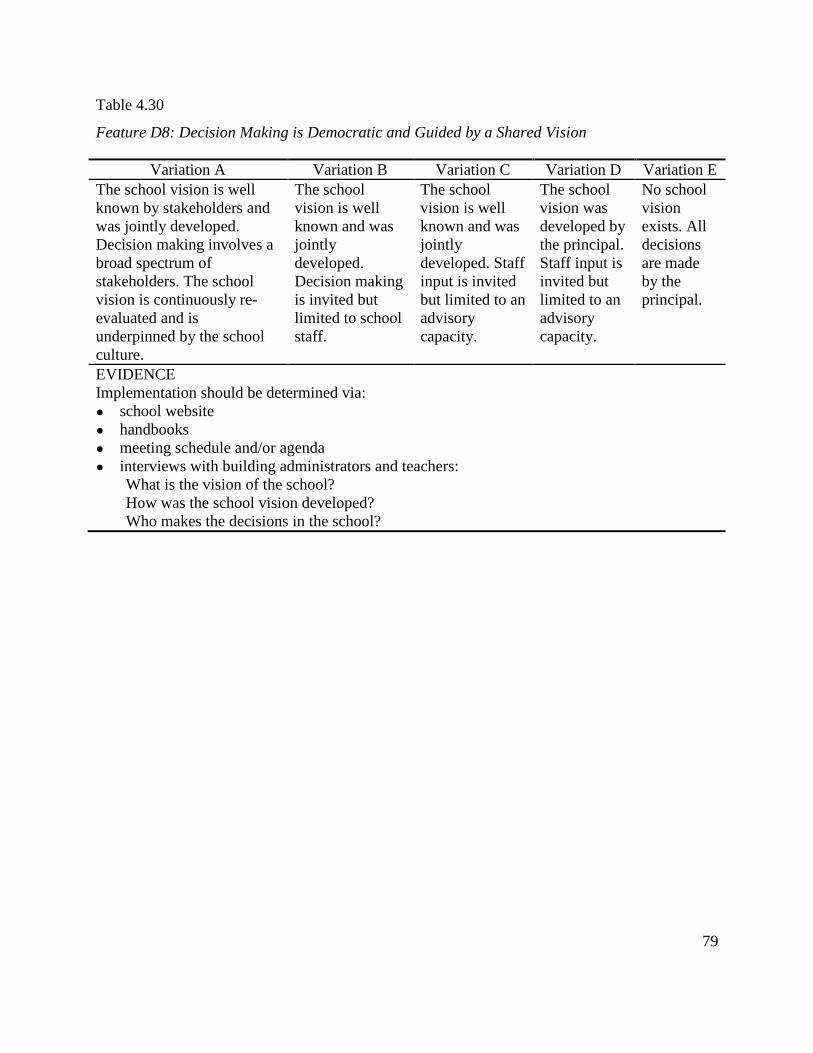
79
Table 4.30
Feature D8: Decision Making is Democratic and Guided by a Shared Vision
Variation A Variation B Variation C Variation D Variation E
The school vision is well
known by stakeholders and
was jointly developed.
Decision making involves a
broad spectrum of
stakeholders. The school
vision is continuously re-
evaluated and is
underpinned by the school
culture.
The school
vision is well
known and was
jointly
developed.
Decision making
is invited but
limited to school
staff.
The school
vision is well
known and was
jointly
developed. Staff
input is invited
but limited to an
advisory
capacity.
The school
vision was
developed by
the principal.
Staff input is
invited but
limited to an
advisory
capacity.
No school
vision
exists. All
decisions
are made
by the
principal.
EVIDENCE
Implementation should be determined via:
● school website
● handbooks
● meeting schedule and/or agenda
● interviews with building administrators and teachers:
What is the vision of the school?
How was the school vision developed?
Who makes the decisions in the school?
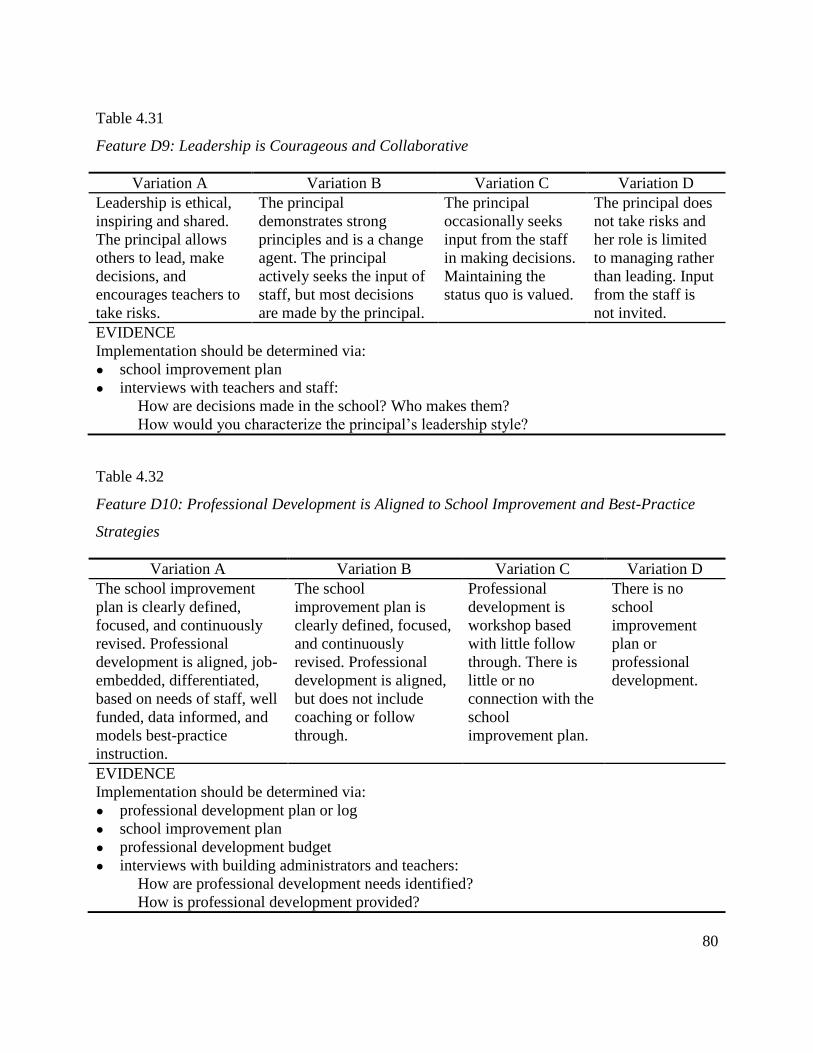
80
Table 4.31
Feature D9: Leadership is Courageous and Collaborative
Variation A Variation B Variation C Variation D
Leadership is ethical,
inspiring and shared.
The principal allows
others to lead, make
decisions, and
encourages teachers to
take risks.
The principal
demonstrates strong
principles and is a change
agent. The principal
actively seeks the input of
staff, but most decisions
are made by the principal.
The principal
occasionally seeks
input from the staff
in making decisions.
Maintaining the
status quo is valued.
The principal does
not take risks and
her role is limited
to managing rather
than leading. Input
from the staff is
not invited.
EVIDENCE
Implementation should be determined via:
● school improvement plan
● interviews with teachers and staff:
How are decisions made in the school? Who makes them?
How would you characterize the principal’s leadership style?
Table 4.32
Feature D10: Professional Development is Aligned to School Improvement and Best-Practice
Strategies
Variation A Variation B Variation C Variation D
The school improvement
plan is clearly defined,
focused, and continuously
revised. Professional
development is aligned, job-
embedded, differentiated,
based on needs of staff, well
funded, data informed, and
models best-practice
instruction.
The school
improvement plan is
clearly defined, focused,
and continuously
revised. Professional
development is aligned,
but does not include
coaching or follow
through.
Professional
development is
workshop based
with little follow
through. There is
little or no
connection with the
school
improvement plan.
There is no
school
improvement
plan or
professional
development.
EVIDENCE
Implementation should be determined via:
● professional development plan or log
● school improvement plan
● professional development budget
● interviews with building administrators and teachers:
How are professional development needs identified?
How is professional development provided?
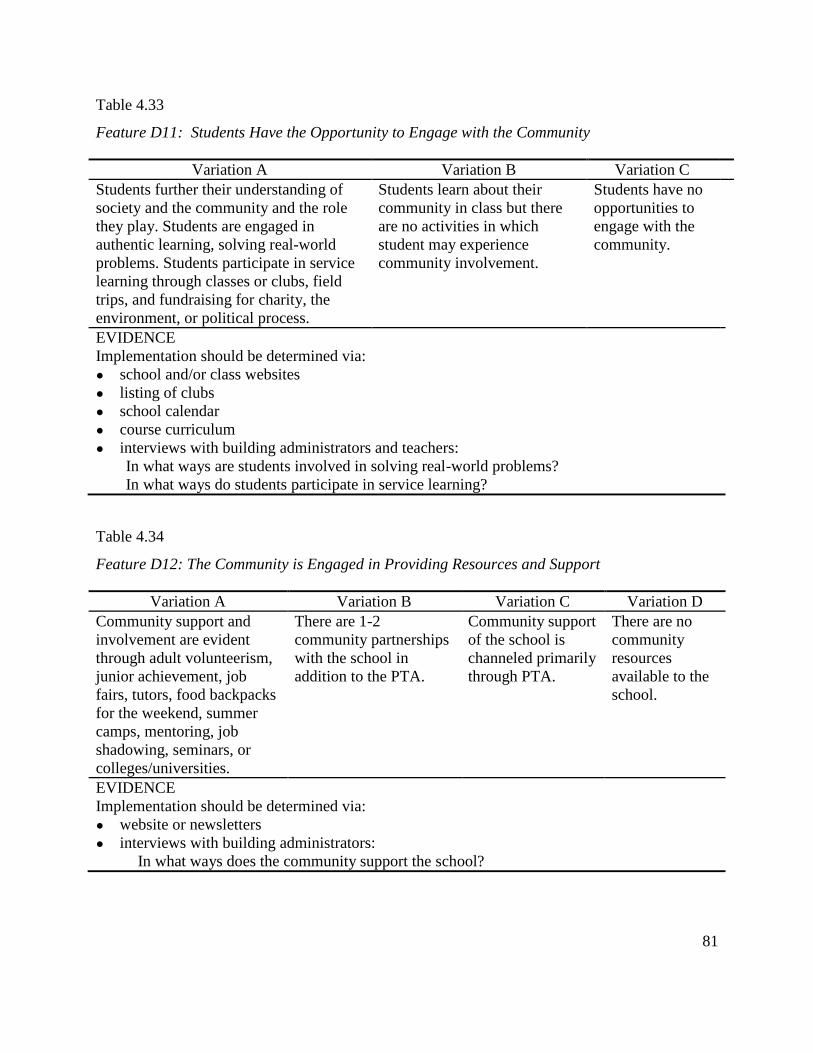
81
Table 4.33
Feature D11: Students Have the Opportunity to Engage with the Community
Variation A Variation B Variation C
Students further their understanding of
society and the community and the role
they play. Students are engaged in
authentic learning, solving real-world
problems. Students participate in service
learning through classes or clubs, field
trips, and fundraising for charity, the
environment, or political process.
Students learn about their
community in class but there
are no activities in which
student may experience
community involvement.
Students have no
opportunities to
engage with the
community.
EVIDENCE
Implementation should be determined via:
● school and/or class websites
● listing of clubs
● school calendar
● course curriculum
● interviews with building administrators and teachers:
In what ways are students involved in solving real-world problems?
In what ways do students participate in service learning?
Table 4.34
Feature D12: The Community is Engaged in Providing Resources and Support
Variation A Variation B Variation C Variation D
Community support and
involvement are evident
through adult volunteerism,
junior achievement, job
fairs, tutors, food backpacks
for the weekend, summer
camps, mentoring, job
shadowing, seminars, or
colleges/universities.
There are 1-2
community partnerships
with the school in
addition to the PTA.
Community support
of the school is
channeled primarily
through PTA.
There are no
community
resources
available to the
school.
EVIDENCE
Implementation should be determined via:
● website or newsletters
● interviews with building administrators:
In what ways does the community support the school?
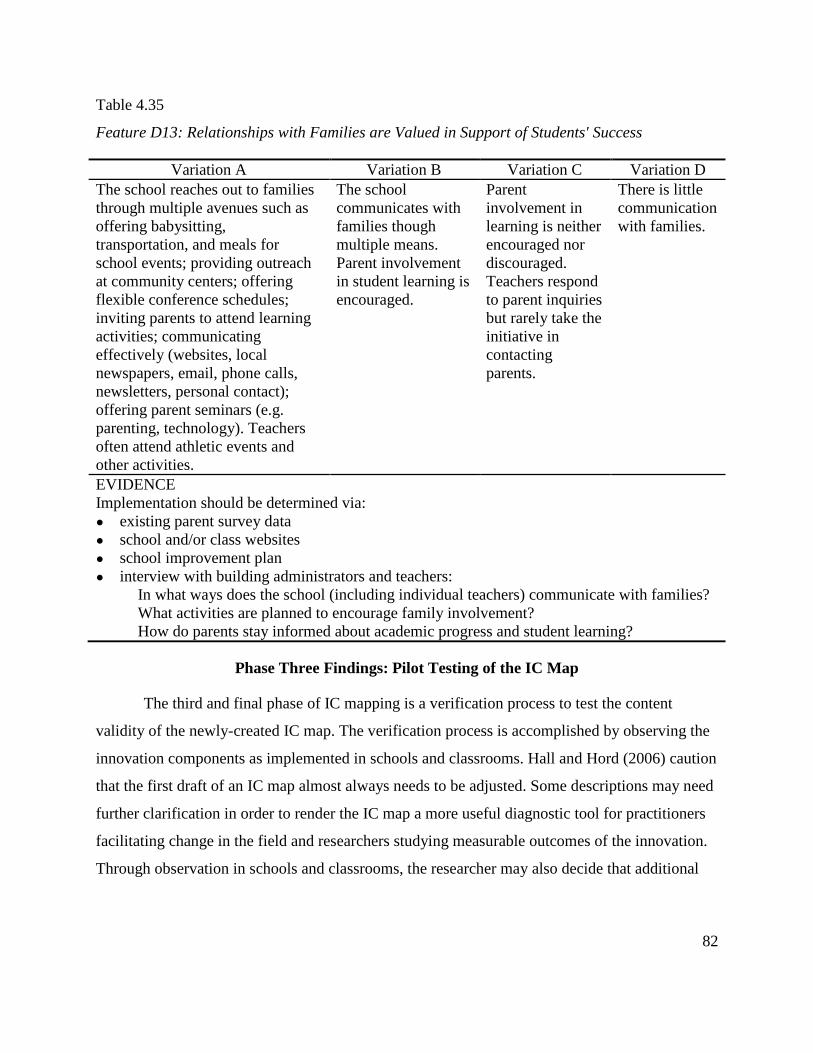
82
Table 4.35
Feature D13: Relationships with Families are Valued in Support of Students' Success
Variation A Variation B Variation C Variation D
The school reaches out to families
through multiple avenues such as
offering babysitting,
transportation, and meals for
school events; providing outreach
at community centers; offering
flexible conference schedules;
inviting parents to attend learning
activities; communicating
effectively (websites, local
newspapers, email, phone calls,
newsletters, personal contact);
offering parent seminars (e.g.
parenting, technology). Teachers
often attend athletic events and
other activities.
The school
communicates with
families though
multiple means.
Parent involvement
in student learning is
encouraged.
Parent
involvement in
learning is neither
encouraged nor
discouraged.
Teachers respond
to parent inquiries
but rarely take the
initiative in
contacting
parents.
There is little
communication
with families.
EVIDENCE
Implementation should be determined via:
● existing parent survey data
● school and/or class websites
● school improvement plan
● interview with building administrators and teachers:
In what ways does the school (including individual teachers) communicate with families?
What activities are planned to encourage family involvement?
How do parents stay informed about academic progress and student learning?
Phase Three Findings: Pilot Testing of the IC Map
The third and final phase of IC mapping is a verification process to test the content
validity of the newly-created IC map. The verification process is accomplished by observing the
innovation components as implemented in schools and classrooms. Hall and Hord (2006) caution
that the first draft of an IC map almost always needs to be adjusted. Some descriptions may need
further clarification in order to render the IC map a more useful diagnostic tool for practitioners
facilitating change in the field and researchers studying measurable outcomes of the innovation.
Through observation in schools and classrooms, the researcher may also decide that additional
83
variations of each feature should be added to the IC map to provide a more complete description
of the innovation.
Description of Pilot Schools
After undergoing the multiple-iterative process described in Phase Two, the IC map for a
standards-based middle school concept was ready to be tested. Arrangements were made for
field testing the IC map through site visits at three schools, and the researcher conducted
observations and interviews for two days at the two 6-8 schools and observations and one day at
the smaller K-7 school. The purpose of the site visits was to attempt to use the IC map to
evaluate the implementation of middle school concept features at the pilot schools. The
researcher conducted informal interviews with school staff, observed classes and meetings, and
reviewed documents and other artifacts such as handbooks, schedules, and meeting agendas as
prescribed by the data collection portion of the IC map. Evidence was documented through field
notes and copies of available artifacts.
Appendices B-E report the data collected from each site visit. For each middle grades
feature, the researcher was able to determine which variation on the IC map was most closely
supported by the evidence collected. For some features, the researcher found that the evidence
suggested by the IC map was not available, or the prescribed evidence was not a reliable source
of information. For some features, the data collected suggested that further revisions of the draft
descriptors would improve the descriptive accuracy of the instrument and additional variations
would more completely account for how the features may be implemented in schools. Findings
from the pilot testing of the IC map in three schools rendered the instrument a more useful
diagnostic tool for practitioners facilitating change in the field and researchers studying
measurable outcomes of the middle school concept in an era of standards and accountability.
Findings from Pilot Testing the IC Map
In order to become a useful tool for practitioners facilitating change with respect to
middle grades practices and researchers studying these practices, the IC map descriptors and the
prescribed sources of data should be valid. Pilot testing the instrument in three diverse schools
housing the middle grades yielded findings that supported the content validity of 18 of the 27
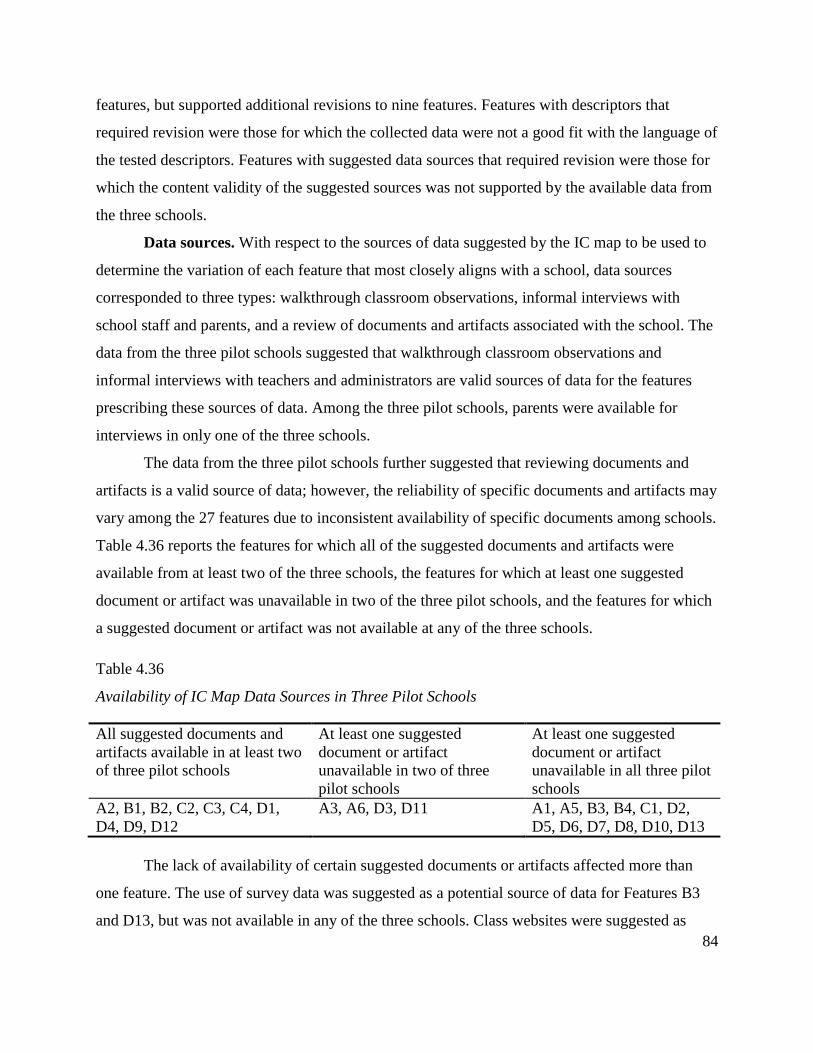
84
features, but supported additional revisions to nine features. Features with descriptors that
required revision were those for which the collected data were not a good fit with the language of
the tested descriptors. Features with suggested data sources that required revision were those for
which the content validity of the suggested sources was not supported by the available data from
the three schools.
Data sources. With respect to the sources of data suggested by the IC map to be used to
determine the variation of each feature that most closely aligns with a school, data sources
corresponded to three types: walkthrough classroom observations, informal interviews with
school staff and parents, and a review of documents and artifacts associated with the school. The
data from the three pilot schools suggested that walkthrough classroom observations and
informal interviews with teachers and administrators are valid sources of data for the features
prescribing these sources of data. Among the three pilot schools, parents were available for
interviews in only one of the three schools.
The data from the three pilot schools further suggested that reviewing documents and
artifacts is a valid source of data; however, the reliability of specific documents and artifacts may
vary among the 27 features due to inconsistent availability of specific documents among schools.
Table 4.36 reports the features for which all of the suggested documents and artifacts were
available from at least two of the three schools, the features for which at least one suggested
document or artifact was unavailable in two of the three pilot schools, and the features for which
a suggested document or artifact was not available at any of the three schools.
Table 4.36
Availability of IC Map Data Sources in Three Pilot Schools
All suggested documents and
artifacts available in at least two
of three pilot schools
At least one suggested
document or artifact
unavailable in two of three
pilot schools
At least one suggested
document or artifact
unavailable in all three pilot
schools
A2, B1, B2, C2, C3, C4, D1,
D4, D9, D12
A3, A6, D3, D11 A1, A5, B3, B4, C1, D2,
D5, D6, D7, D8, D10, D13
The lack of availability of certain suggested documents or artifacts affected more than
one feature. The use of survey data was suggested as a potential source of data for Features B3
and D13, but was not available in any of the three schools. Class websites were suggested as
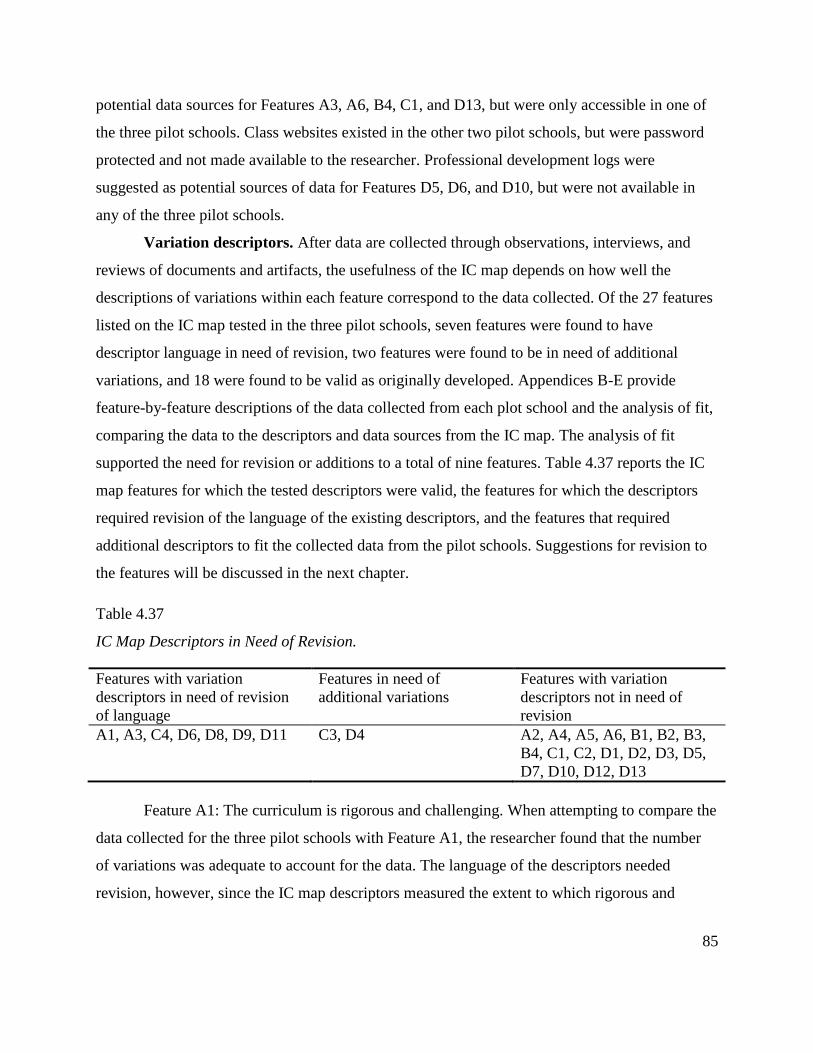
85
potential data sources for Features A3, A6, B4, C1, and D13, but were only accessible in one of
the three pilot schools. Class websites existed in the other two pilot schools, but were password
protected and not made available to the researcher. Professional development logs were
suggested as potential sources of data for Features D5, D6, and D10, but were not available in
any of the three pilot schools.
Variation descriptors. After data are collected through observations, interviews, and
reviews of documents and artifacts, the usefulness of the IC map depends on how well the
descriptions of variations within each feature correspond to the data collected. Of the 27 features
listed on the IC map tested in the three pilot schools, seven features were found to have
descriptor language in need of revision, two features were found to be in need of additional
variations, and 18 were found to be valid as originally developed. Appendices B-E provide
feature-by-feature descriptions of the data collected from each plot school and the analysis of fit,
comparing the data to the descriptors and data sources from the IC map. The analysis of fit
supported the need for revision or additions to a total of nine features. Table 4.37 reports the IC
map features for which the tested descriptors were valid, the features for which the descriptors
required revision of the language of the existing descriptors, and the features that required
additional descriptors to fit the collected data from the pilot schools. Suggestions for revision to
the features will be discussed in the next chapter.
Table 4.37
IC Map Descriptors in Need of Revision.
Features with variation
descriptors in need of revision
of language
Features in need of
additional variations
Features with variation
descriptors not in need of
revision
A1, A3, C4, D6, D8, D9, D11 C3, D4 A2, A4, A5, A6, B1, B2, B3,
B4, C1, C2, D1, D2, D3, D5,
D7, D10, D12, D13
Feature A1: The curriculum is rigorous and challenging. When attempting to compare the
data collected for the three pilot schools with Feature A1, the researcher found that the number
of variations was adequate to account for the data. The language of the descriptors needed
revision, however, since the IC map descriptors measured the extent to which rigorous and
86
challenging instructional practices were evident in individual classrooms, but did not adequately
account for aggregate data needed to measure rigor across classrooms schoolwide.
Feature A3: The curriculum is integrative and interdisciplinary. When attempting to
compare the data collected for the three pilot schools with Feature A3, the researcher found that
the number of variations was adequate to account for the data. The language of the descriptors
needed revising, however, since the IC map descriptor for Variation B most closely
corresponded to the type of interdisciplinary learning within departments found in all three pilot
schools, yet did not adequately describe the actual practice found in these schools. In all three
schools, learning was departmentalized as described in Variation B, but there was an effort to
make interdisciplinary connections within individual classrooms.
Feature C3: To the fullest extent possible, all students participate in heterogeneous
classes with high academic and behavioral expectations. When attempting to compare the data
collected for the three pilot schools with Feature C3, the researcher found that the number of
variations was inadequate to account for the data collected from Pilot School 1. Students at Pilot
School 1 were generally grouped heterogeneously as described in Variation A; however, some
academically advanced students were informally grouped by the school. Students not meeting
the criteria informally established by the school did not have access to the advanced classes, thus
creating barriers of access. Therefore, revisions to the IC map may need to include an additional
variation for Feature C3.
Feature C4: All students have ongoing opportunities to learn about their own and others'
cultures; diversity is valued by the school. When attempting to compare the data collected for the
three pilot schools with Feature C4, the researcher found that the number of variations was
adequate to account for the data. The language of the descriptors needed revising, however, since
the IC map descriptor for Variation C most closely corresponded to how teaching about diversity
is viewed in two of the three pilot schools, yet did not adequately describe the actual practice
found in these schools. In Pilot Schools 2 and 3, teaching about diversity was not a priority for
the schools because the schools did not perceive any problems stemming from ethnic tension.
The language of Variation C (specifically, the phrase “not valued”) may have conveyed a sense
of negativity that did not apply to Pilot Schools 2 and 3, given that a sense of ethnic harmony
existed in the schools.
87
Feature D4: Teachers are empowered to implement flexible scheduling to promote
learning. When attempting to compare the data collected for the three pilot schools with Feature
D4, the researcher found that the number of variations was inadequate to account for the data
collected from Pilot School 1. At Pilot School 1, teachers rarely implemented flexible grouping
practices even though barriers to implementing the practice were minimal. Therefore, revisions
to the IC map may need to include an additional variation for Feature D4 to account for a
relatively strong sense of empowerment, but the absence of the actual practice.
Feature D6: Teachers are knowledgeable about and committed to working with this age
group. When attempting to compare the data collected for the three pilot schools with Feature
D6, the researcher found that the number of variations was adequate to account for the data
collected from the three schools. The language of the descriptors needed revising, however, since
the IC map descriptor for Variation B most closely aligned with the data reporting that teachers
are personally committed to young adolescents, but may not be involved in leadership or fully
implement best practice instructional practices. Variation B would more accurately align with the
data if the reference to best practice instructional strategies were shifted to Variation A for
Feature D6.
Feature D8: Decision making is democratic and guided by a shared vision. When
attempting to compare the data collected for the three pilot schools with Feature D8, the
researcher found that the number of variations was adequate to account for the data collected
from the three schools. The language of the descriptors needed revising, however, since the IC
map descriptors for Feature D8 include two variables: shared decision making and the presence
of a shared vision. In all three pilot schools, a high level of shared decision making was present.
In none of the three schools, however, was there a formally articulated vision for the school.
Teachers in Pilot Schools 1 and 3 reported frequent discussions among the staff regarding school
change and improvement, but their attempts to articulate the school vision were vague during the
interviews and more closely associated with the idea of school culture than a specific vision.
Revisions to the IC map should account for data suggesting that a school vision may not always
exist in the form of a formally articulated statement.
Feature D11: Students have the opportunity to engage with the community. When
attempting to compare the data collected for the three pilot schools with Feature D11, the
88
researcher found that the number of variations was adequate to account for the data collected
from the three schools. The language of the descriptors needed revising, however, since the data
regarding student engagement with the community most closely aligned to Variation B on the IC
map, yet the descriptor was not completely accurate. The descriptor for Variation B states that
there are “no activities” for community involvement. For Pilot School 3, however, it would be
more accurate to state that there are “few activities.” Variation C is sufficient to account for the
complete absence of activities in a school.
Summary of Findings
The current chapter began with a restatement of the purpose of the research and an
overview of the methodology used to develop and test the resultant instrument. Findings from
each of the three phases of the instrument development and testing process were reported. The
first phase of the development of the IC map for middle grades education was a quasi-Delphi
process involving interaction with a panel of experts and a synthesis of the four key frameworks
describing the middle grades. The product of Phase One was a verified list of 27 features of the
standards-based middle school concept. The second phase of the instrument development and
testing process was the construction of an IC map based on the 27 features of the middle school
concept. Phase Two involved face-to-face interaction with an IC mapping team comprised of
practitioners with broad experience with middle schools. The product of Phase Two was an IC
map describing the variations associated with implementation of the 27 features in practice and
the delineating suggested sources of data for using the map to evaluate school practices. The
third phase of the instrument development and testing process was verification of the IC map
through pilot testing in three schools. Pilot testing of the IC map verified the content validity of
the variation descriptors for 18 of 27 features and indicated needed revisions for nine of the
features. Pilot testing of the IC map also verified appropriate sources of data needed to
implement the instrument to evaluate schools. The following chapter will present conclusions
from these findings and recommendations for future studies.
89
CHAPTER V
CONCLUSIONS AND RECOMMENDATIONS
Introduction
The purpose of the instrument development and testing process was to identify critical
features of the middle school concept implemented in the context of standards and
accountability. While there are many effective school and classroom practices that overlap
among school levels, the instrument development and testing process focused on enumerating
school characteristics that collectively define the middle school concept. Once clearly defined,
the features of the standards-based middle school concept will more readily lend itself to
empirical investigation using rigorous research methodology.
The implementation of change is nonlinear, is characterized by varying stages of
adoption, and is subject to multiple adaptations (Fullan, 2001; Hall & Hord, 2006). The
instrument development and testing process, therefore, also investigated the nature of the
implementation of middle school concept features, recognizing that actual practices in schools
may vary somewhat without the schools losing their identity as middle schools. The principal
product of the process was the development of a diagnostic tool that may be used in future
research to identify acceptable forms of implementation of the middle school concept and by
school leaders seeking to evaluate middle grades practices and facilitate change in the middle
grades.
Findings from each of the three phases of the instrument development and testing process
were reported in the previous chapter. The first phase of the development of the innovation
configuration (IC) map for middle grades education was a quasi-Delphi process involving
interaction with a panel of experts and a synthesis of the four key frameworks describing the
middle grades. The second phase of the instrument development and testing process was the
construction of an IC map based on the 27 features of the standards-based middle school
concept. The third phase of the instrument development and testing process was verification of
the IC map through pilot testing in three schools. In this chapter, conclusions will be offered
concerning the principal products of the instrument development and testing process and
summary recommendations made for future use and study of the instrument.
90
Conclusions
A Research-Validated List of Middle Grades Features
Obstacles to definitive findings relating middle school features to student achievement
have included the clear identification and enumeration of the characteristics of the middle school
concept and the ability to measure the degree of implementation of these features in actual
practice (Lee & Smith, 1993; MacIver & Epstein, 1991; Stephens & Jenkins, 1994). Another
concern that has been raised regarding the middle school concept is whether the
recommendations for effective middle schools are truly distinctive from best practices in
elementary and high schools (Heller, Calderon, & Medrich, 2003). These problems have
impeded research efforts to understand and measure the efficacy of the middle school concept as
a clearly-defined set of practices that can be replicated in multiple settings with the expectation
of positively influencing student outcomes.
The purpose of the first phase of the instrument development and testing process was to
produce a research-validated list of features that uniquely define the middle school concept
within the context of standards and accountability. The list of features was developed and
validated employing the IC mapping process recommended by Hall and Hord (2006) as part of
their Concerns-Based Adoption Model (CBAM) framework. Hall and Hord suggest that the first
phase of an IC map should be the development of a cluster map of the key components
associated with the innovation being studied. The cluster map is created though interaction with
people who are experts on the innovation and through a review of key documents associated with
the innovation (Hall & Hord, 2006).
Phase One of the instrument development and testing process presented here achieved the
interaction recommended by Hall and Hord (2006) through a triangulation of data derived from a
Delphi-like exercise and a synthesis of the four major frameworks describing the middle school
concept. Initiating the quasi-Delphi process with an open-ended question asking expert panelists
to list key features of the middle school concept within the context of standards and
accountability potentially allowed for considerable divergence of opinion. Nonetheless,
responses provided by the eleven original panelists were closely aligned with all but three
responses directly reflecting language from the four major frameworks. Of the three first-round
91
responses not directly reflected in the frameworks, two received among the lowest scores in the
second-round questioning in which panelists were asked to rate the list of features synthesized
from first-round responses and the four major frameworks. This high degree of convergence of
opinion among panelists and the major frameworks indicates substantial agreement among the
various constituent groups concerning the key components of the standards-based middle school
concept as a clearly-defined set of practices.
IC Map for the Standards-Based Middle School Concept
The purpose of the instrument development and testing process was to not only identify
components of the middle school concept in a standards-based era, but also investigate variations
in its implementation. The IC map developed and tested in Phases Two and Three is a
description of the multiple variations of the 27 middle grades features as operationalized in
actual practice across different settings. The intent is not to judge whether a particular variation
of a feature as implemented in a middle grades school is good or bad, but to acknowledge the
reality that different adopters of the middle school concept feature have different interpretations
of what the feature should look like or may alter one or more components of the feature to fit a
particular setting. For each feature of the standards-based middle school concept, the IC map
describes a range of variations of the feature based on documents, expert consensus, and actual
observation. After multiple iterations of the IC map, fidelity lines are drawn to indicate which
variations are associated with the middle school concept and which variations have manifested as
something different than the middle school concept (Hall & Hord, 2006).
Findings from the interaction with the IC mapping team and the pilot tests of the
instrument suggested additional improvements were needed to the language of the variation
descriptors, the number of variations for some features, and the sources of data prescribed in
order to use the map as an evaluative tool. These improvements are reflected in a new iteration of
the IC map presented in Tables 5.1 through 5.35. Revisions to the IC map are highlighted in bold
print. In addition to the revisions, lines of fidelity have been drawn to indicate which variations
of each feature are associated with the middle school concept and which variations refer to
practices not associated with the standards-based middle school concept. The placement of

92
fidelity lines for each feature was proposed by the researcher based on pilot test data, but need to
be verified through further testing and use of the instrument.
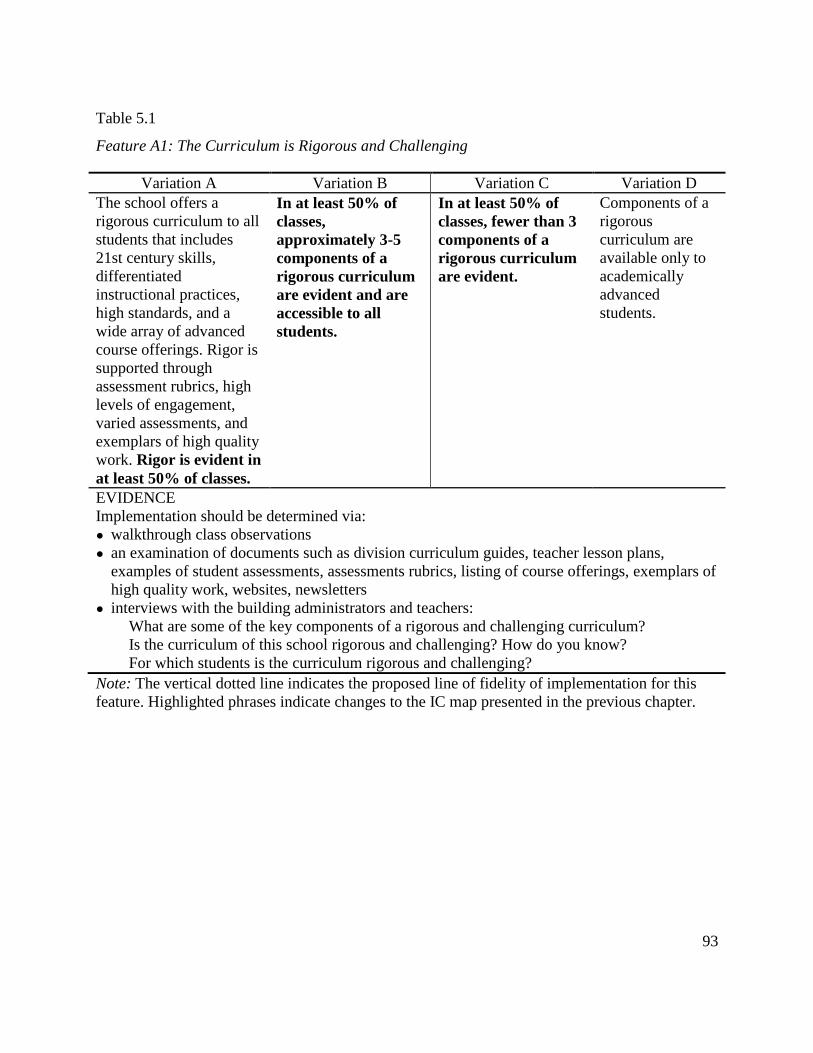
93
Table 5.1
Feature A1: The Curriculum is Rigorous and Challenging
Variation A Variation B Variation C Variation D
The school offers a
rigorous curriculum to all
students that includes
21st century skills,
differentiated
instructional practices,
high standards, and a
wide array of advanced
course offerings. Rigor is
supported through
assessment rubrics, high
levels of engagement,
varied assessments, and
exemplars of high quality
work. Rigor is evident in
at least 50% of classes.
In at least 50% of
classes,
approximately 3-5
components of a
rigorous curriculum
are evident and are
accessible to all
students.
In at least 50% of
classes, fewer than 3
components of a
rigorous curriculum
are evident.
Components of a
rigorous
curriculum are
available only to
academically
advanced
students.
EVIDENCE
Implementation should be determined via:
● walkthrough class observations
● an examination of documents such as division curriculum guides, teacher lesson plans,
examples of student assessments, assessments rubrics, listing of course offerings, exemplars of
high quality work, websites, newsletters
● interviews with the building administrators and teachers:
What are some of the key components of a rigorous and challenging curriculum?
Is the curriculum of this school rigorous and challenging? How do you know?
For which students is the curriculum rigorous and challenging?
Note: The vertical dotted line indicates the proposed line of fidelity of implementation for this
feature. Highlighted phrases indicate changes to the IC map presented in the previous chapter.
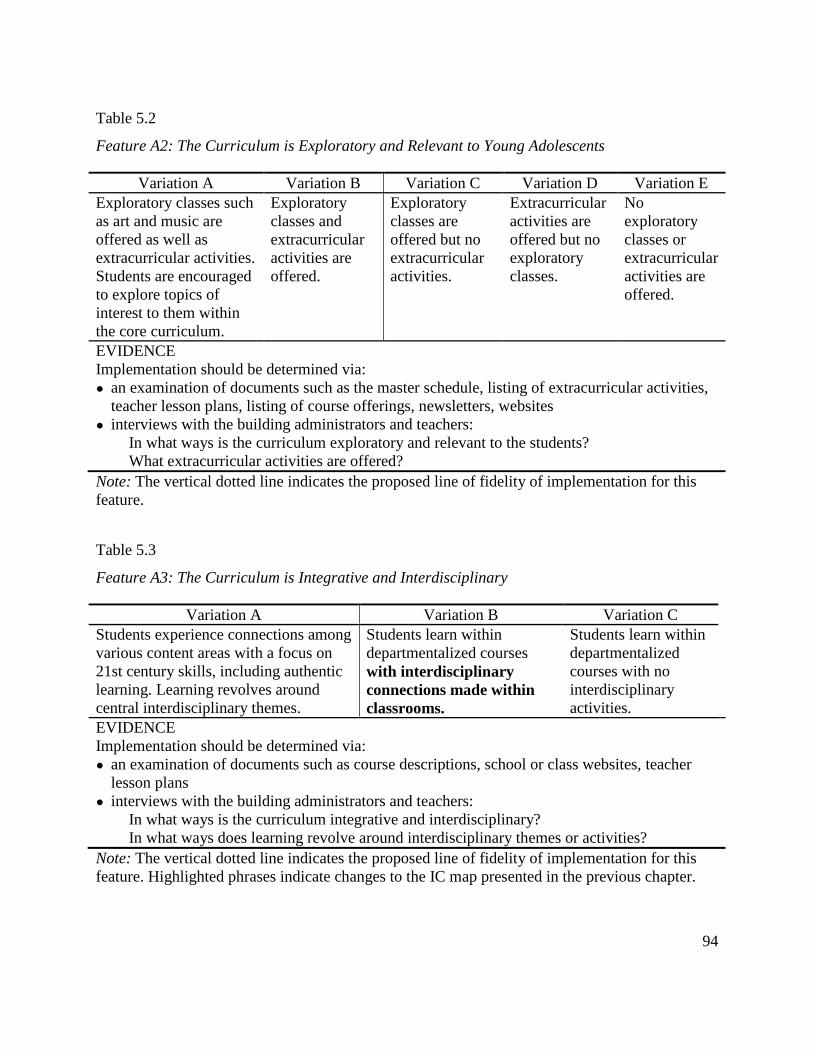
94
Table 5.2
Feature A2: The Curriculum is Exploratory and Relevant to Young Adolescents
Variation A Variation B Variation C Variation D Variation E
Exploratory classes such
as art and music are
offered as well as
extracurricular activities.
Students are encouraged
to explore topics of
interest to them within
the core curriculum.
Exploratory
classes and
extracurricular
activities are
offered.
Exploratory
classes are
offered but no
extracurricular
activities.
Extracurricular
activities are
offered but no
exploratory
classes.
No
exploratory
classes or
extracurricular
activities are
offered.
EVIDENCE
Implementation should be determined via:
● an examination of documents such as the master schedule, listing of extracurricular activities,
teacher lesson plans, listing of course offerings, newsletters, websites
● interviews with the building administrators and teachers:
In what ways is the curriculum exploratory and relevant to the students?
What extracurricular activities are offered?
Note: The vertical dotted line indicates the proposed line of fidelity of implementation for this
feature.
Table 5.3
Feature A3: The Curriculum is Integrative and Interdisciplinary
Variation A Variation B Variation C
Students experience connections among
various content areas with a focus on
21st century skills, including authentic
learning. Learning revolves around
central interdisciplinary themes.
Students learn within
departmentalized courses
with interdisciplinary
connections made within
classrooms.
Students learn within
departmentalized
courses with no
interdisciplinary
activities.
EVIDENCE
Implementation should be determined via:
● an examination of documents such as course descriptions, school or class websites, teacher
lesson plans
● interviews with the building administrators and teachers:
In what ways is the curriculum integrative and interdisciplinary?
In what ways does learning revolve around interdisciplinary themes or activities?
Note: The vertical dotted line indicates the proposed line of fidelity of implementation for this
feature. Highlighted phrases indicate changes to the IC map presented in the previous chapter.
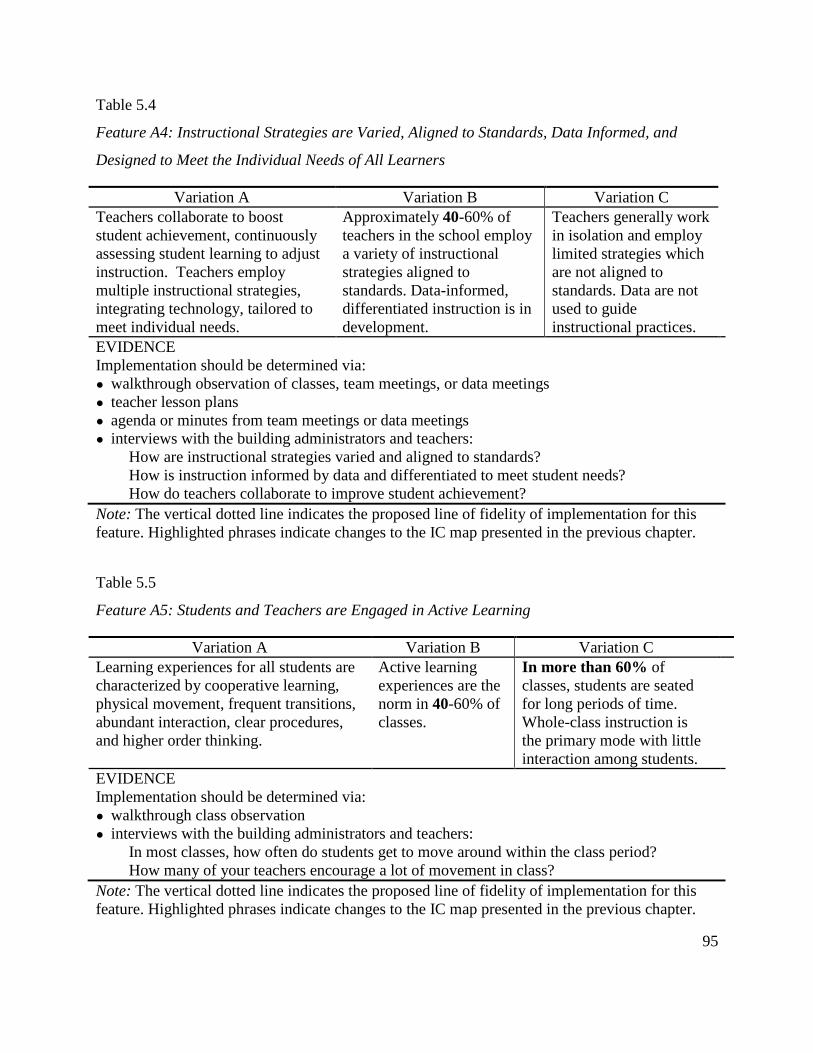
95
Table 5.4
Feature A4: Instructional Strategies are Varied, Aligned to Standards, Data Informed, and
Designed to Meet the Individual Needs of All Learners
Variation A Variation B Variation C
Teachers collaborate to boost
student achievement, continuously
assessing student learning to adjust
instruction. Teachers employ
multiple instructional strategies,
integrating technology, tailored to
meet individual needs.
Approximately 40-60% of
teachers in the school employ
a variety of instructional
strategies aligned to
standards. Data-informed,
differentiated instruction is in
development.
Teachers generally work
in isolation and employ
limited strategies which
are not aligned to
standards. Data are not
used to guide
instructional practices.
EVIDENCE
Implementation should be determined via:
● walkthrough observation of classes, team meetings, or data meetings
● teacher lesson plans
● agenda or minutes from team meetings or data meetings
● interviews with the building administrators and teachers:
How are instructional strategies varied and aligned to standards?
How is instruction informed by data and differentiated to meet student needs?
How do teachers collaborate to improve student achievement?
Note: The vertical dotted line indicates the proposed line of fidelity of implementation for this
feature. Highlighted phrases indicate changes to the IC map presented in the previous chapter.
Table 5.5
Feature A5: Students and Teachers are Engaged in Active Learning
Variation A Variation B Variation C
Learning experiences for all students are
characterized by cooperative learning,
physical movement, frequent transitions,
abundant interaction, clear procedures,
and higher order thinking.
Active learning
experiences are the
norm in 40-60% of
classes.
In more than 60% of
classes, students are seated
for long periods of time.
Whole-class instruction is
the primary mode with little
interaction among students.
EVIDENCE
Implementation should be determined via:
● walkthrough class observation
● interviews with the building administrators and teachers:
In most classes, how often do students get to move around within the class period?
How many of your teachers encourage a lot of movement in class?
Note: The vertical dotted line indicates the proposed line of fidelity of implementation for this
feature. Highlighted phrases indicate changes to the IC map presented in the previous chapter.
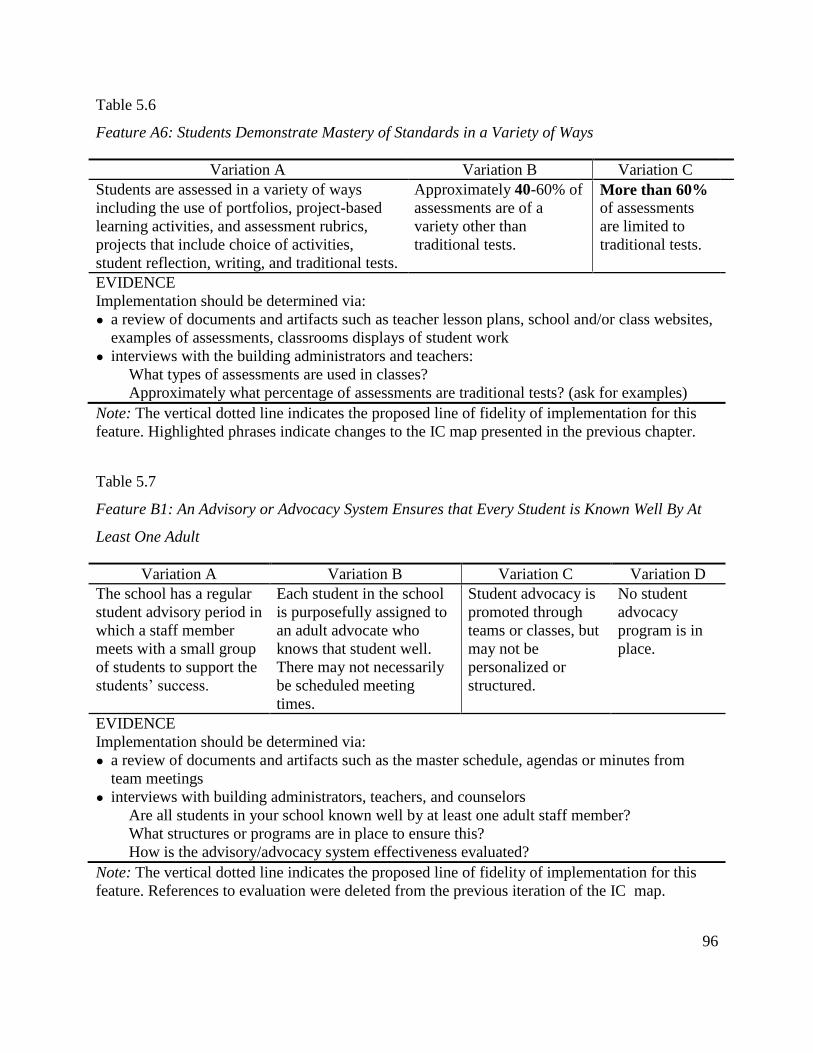
96
Table 5.6
Feature A6: Students Demonstrate Mastery of Standards in a Variety of Ways
Variation A Variation B Variation C
Students are assessed in a variety of ways
including the use of portfolios, project-based
learning activities, and assessment rubrics,
projects that include choice of activities,
student reflection, writing, and traditional tests.
Approximately 40-60% of
assessments are of a
variety other than
traditional tests.
More than 60% of assessments
are limited to
traditional tests.
EVIDENCE
Implementation should be determined via:
● a review of documents and artifacts such as teacher lesson plans, school and/or class websites,
examples of assessments, classrooms displays of student work
● interviews with the building administrators and teachers:
What types of assessments are used in classes?
Approximately what percentage of assessments are traditional tests? (ask for examples)
Note: The vertical dotted line indicates the proposed line of fidelity of implementation for this
feature. Highlighted phrases indicate changes to the IC map presented in the previous chapter.
Table 5.7
Feature B1: An Advisory or Advocacy System Ensures that Every Student is Known Well By At
Least One Adult
Variation A Variation B Variation C Variation D
The school has a regular
student advisory period in
which a staff member
meets with a small group
of students to support the
students’ success.
Each student in the school
is purposefully assigned to
an adult advocate who
knows that student well.
There may not necessarily
be scheduled meeting
times.
Student advocacy is
promoted through
teams or classes, but
may not be
personalized or
structured.
No student
advocacy
program is in
place.
EVIDENCE
Implementation should be determined via:
● a review of documents and artifacts such as the master schedule, agendas or minutes from
team meetings
● interviews with building administrators, teachers, and counselors
Are all students in your school known well by at least one adult staff member?
What structures or programs are in place to ensure this?
How is the advisory/advocacy system effectiveness evaluated?
Note: The vertical dotted line indicates the proposed line of fidelity of implementation for this
feature. References to evaluation were deleted from the previous iteration of the IC map.
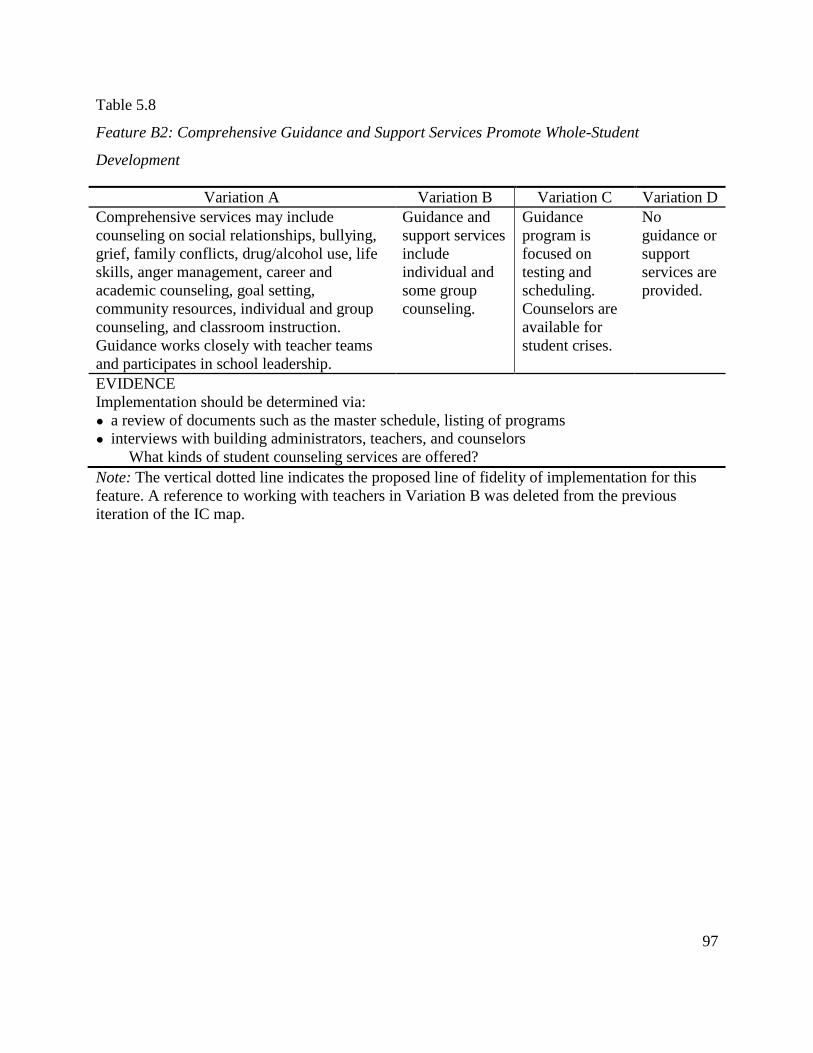
97
Table 5.8
Feature B2: Comprehensive Guidance and Support Services Promote Whole-Student
Development
Variation A Variation B Variation C Variation D
Comprehensive services may include
counseling on social relationships, bullying,
grief, family conflicts, drug/alcohol use, life
skills, anger management, career and
academic counseling, goal setting,
community resources, individual and group
counseling, and classroom instruction.
Guidance works closely with teacher teams
and participates in school leadership.
Guidance and
support services
include
individual and
some group
counseling.
Guidance
program is
focused on
testing and
scheduling.
Counselors are
available for
student crises.
No
guidance or
support
services are
provided.
EVIDENCE
Implementation should be determined via:
● a review of documents such as the master schedule, listing of programs
● interviews with building administrators, teachers, and counselors
What kinds of student counseling services are offered?
Note: The vertical dotted line indicates the proposed line of fidelity of implementation for this
feature. A reference to working with teachers in Variation B was deleted from the previous
iteration of the IC map.
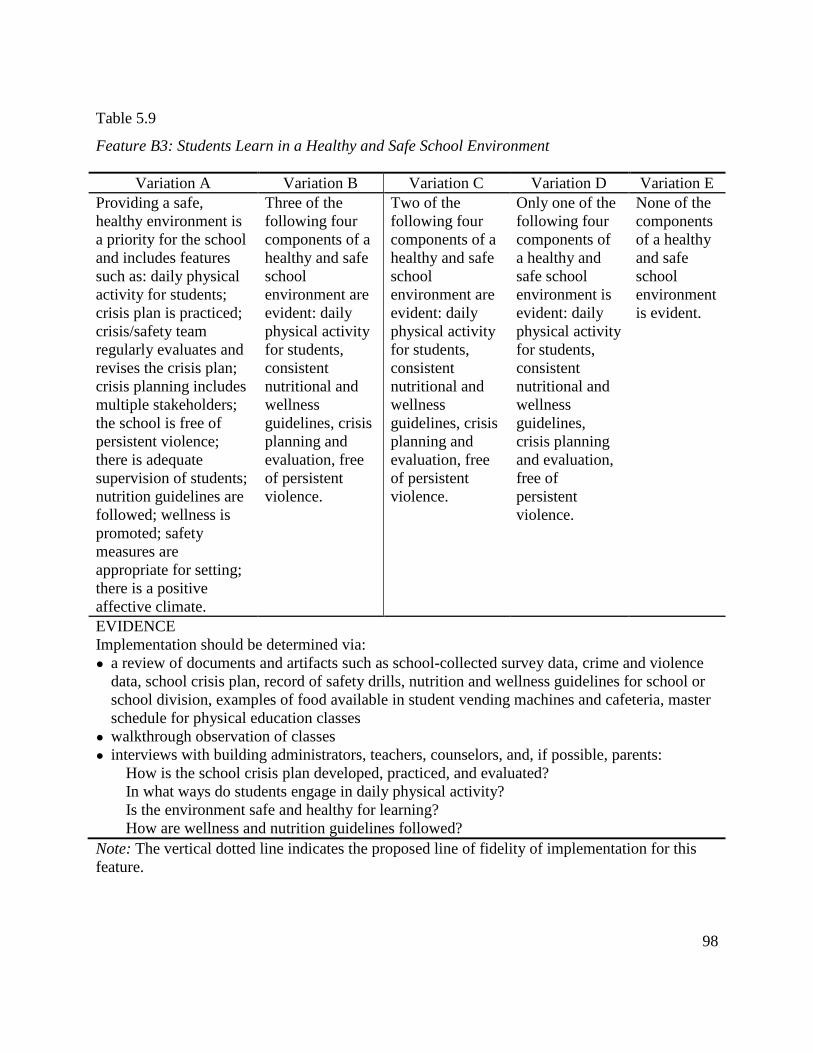
98
Table 5.9
Feature B3: Students Learn in a Healthy and Safe School Environment
Variation A Variation B Variation C Variation D Variation E
Providing a safe,
healthy environment is
a priority for the school
and includes features
such as: daily physical
activity for students;
crisis plan is practiced;
crisis/safety team
regularly evaluates and
revises the crisis plan;
crisis planning includes
multiple stakeholders;
the school is free of
persistent violence;
there is adequate
supervision of students;
nutrition guidelines are
followed; wellness is
promoted; safety
measures are
appropriate for setting;
there is a positive
affective climate.
Three of the
following four
components of a
healthy and safe
school
environment are
evident: daily
physical activity
for students,
consistent
nutritional and
wellness
guidelines, crisis
planning and
evaluation, free
of persistent
violence.
Two of the
following four
components of a
healthy and safe
school
environment are
evident: daily
physical activity
for students,
consistent
nutritional and
wellness
guidelines, crisis
planning and
evaluation, free
of persistent
violence.
Only one of the
following four
components of
a healthy and
safe school
environment is
evident: daily
physical activity
for students,
consistent
nutritional and
wellness
guidelines,
crisis planning
and evaluation,
free of
persistent
violence.
None of the
components
of a healthy
and safe
school
environment
is evident.
EVIDENCE
Implementation should be determined via:
● a review of documents and artifacts such as school-collected survey data, crime and violence
data, school crisis plan, record of safety drills, nutrition and wellness guidelines for school or
school division, examples of food available in student vending machines and cafeteria, master
schedule for physical education classes
● walkthrough observation of classes
● interviews with building administrators, teachers, counselors, and, if possible, parents:
How is the school crisis plan developed, practiced, and evaluated?
In what ways do students engage in daily physical activity?
Is the environment safe and healthy for learning?
How are wellness and nutrition guidelines followed?
Note: The vertical dotted line indicates the proposed line of fidelity of implementation for this
feature.
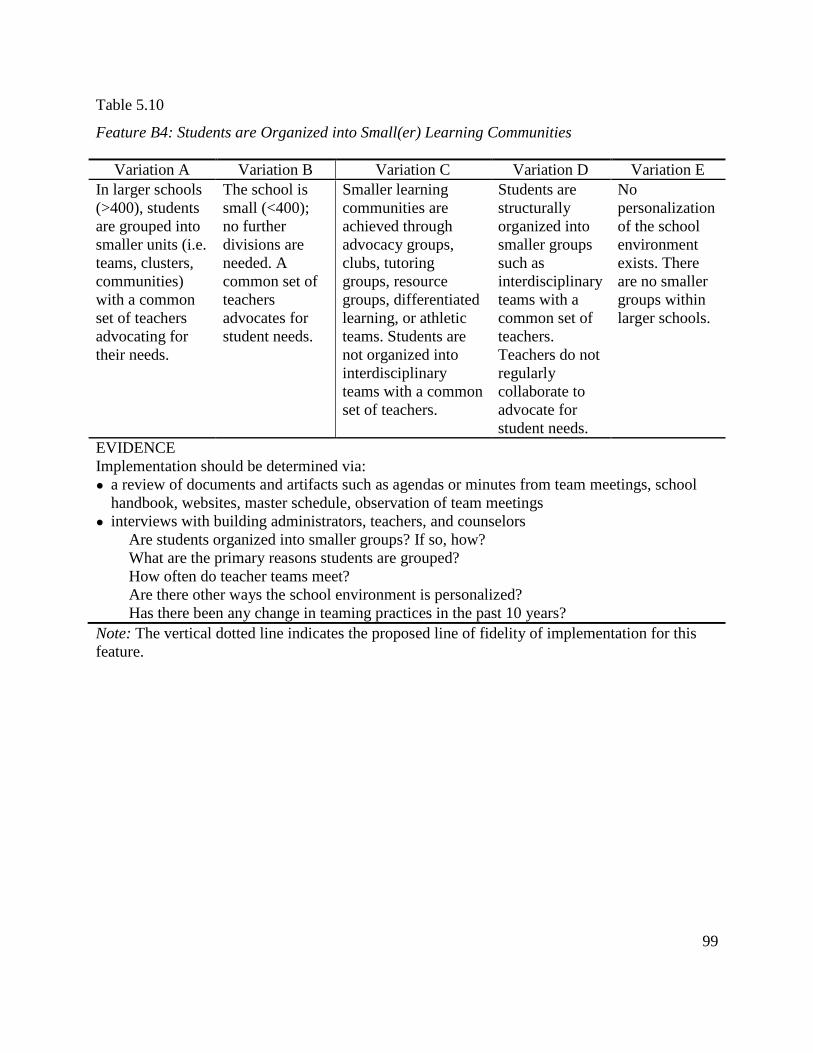
99
Table 5.10
Feature B4: Students are Organized into Small(er) Learning Communities
Variation A Variation B Variation C Variation D Variation E
In larger schools
(>400), students
are grouped into
smaller units (i.e.
teams, clusters,
communities)
with a common
set of teachers
advocating for
their needs.
The school is
small (<400);
no further
divisions are
needed. A
common set of
teachers
advocates for
student needs.
Smaller learning
communities are
achieved through
advocacy groups,
clubs, tutoring
groups, resource
groups, differentiated
learning, or athletic
teams. Students are
not organized into
interdisciplinary
teams with a common
set of teachers.
Students are
structurally
organized into
smaller groups
such as
interdisciplinary
teams with a
common set of
teachers.
Teachers do not
regularly
collaborate to
advocate for
student needs.
No
personalization
of the school
environment
exists. There
are no smaller
groups within
larger schools.
EVIDENCE
Implementation should be determined via:
● a review of documents and artifacts such as agendas or minutes from team meetings, school
handbook, websites, master schedule, observation of team meetings
● interviews with building administrators, teachers, and counselors
Are students organized into smaller groups? If so, how?
What are the primary reasons students are grouped?
How often do teacher teams meet?
Are there other ways the school environment is personalized?
Has there been any change in teaming practices in the past 10 years?
Note: The vertical dotted line indicates the proposed line of fidelity of implementation for this
feature.
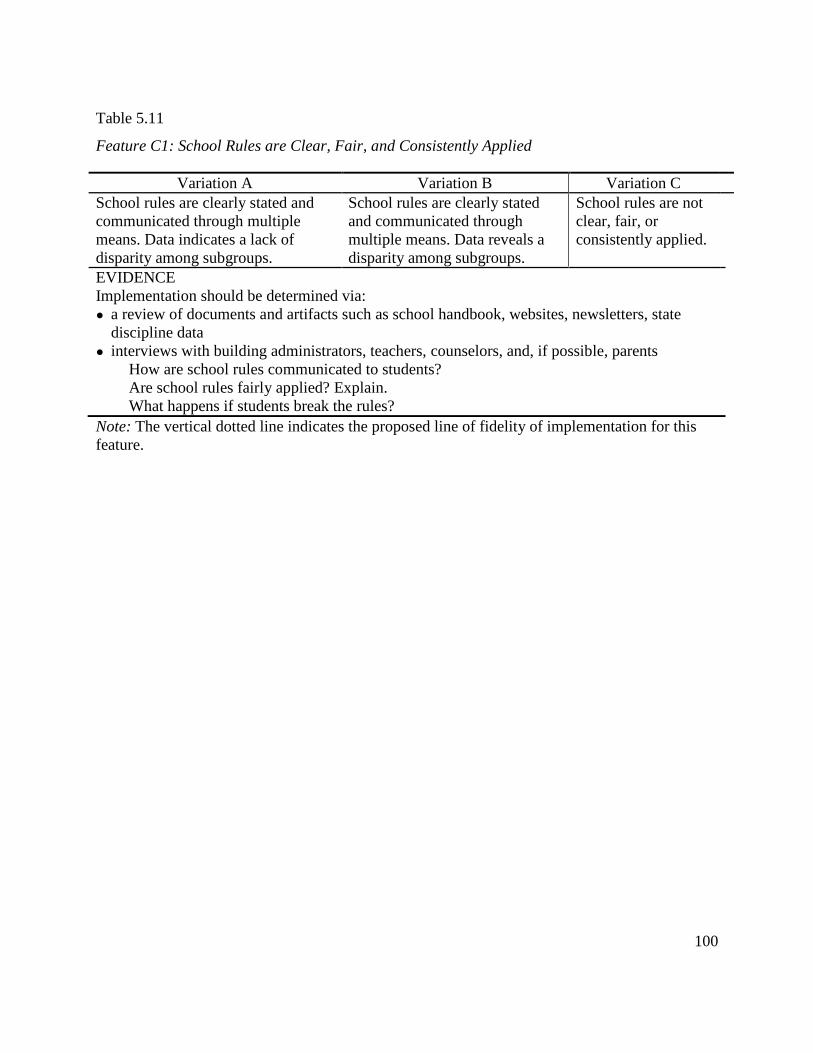
100
Table 5.11
Feature C1: School Rules are Clear, Fair, and Consistently Applied
Variation A Variation B Variation C
School rules are clearly stated and
communicated through multiple
means. Data indicates a lack of
disparity among subgroups.
School rules are clearly stated
and communicated through
multiple means. Data reveals a
disparity among subgroups.
School rules are not
clear, fair, or
consistently applied.
EVIDENCE
Implementation should be determined via:
● a review of documents and artifacts such as school handbook, websites, newsletters, state
discipline data
● interviews with building administrators, teachers, counselors, and, if possible, parents
How are school rules communicated to students?
Are school rules fairly applied? Explain.
What happens if students break the rules?
Note: The vertical dotted line indicates the proposed line of fidelity of implementation for this
feature.
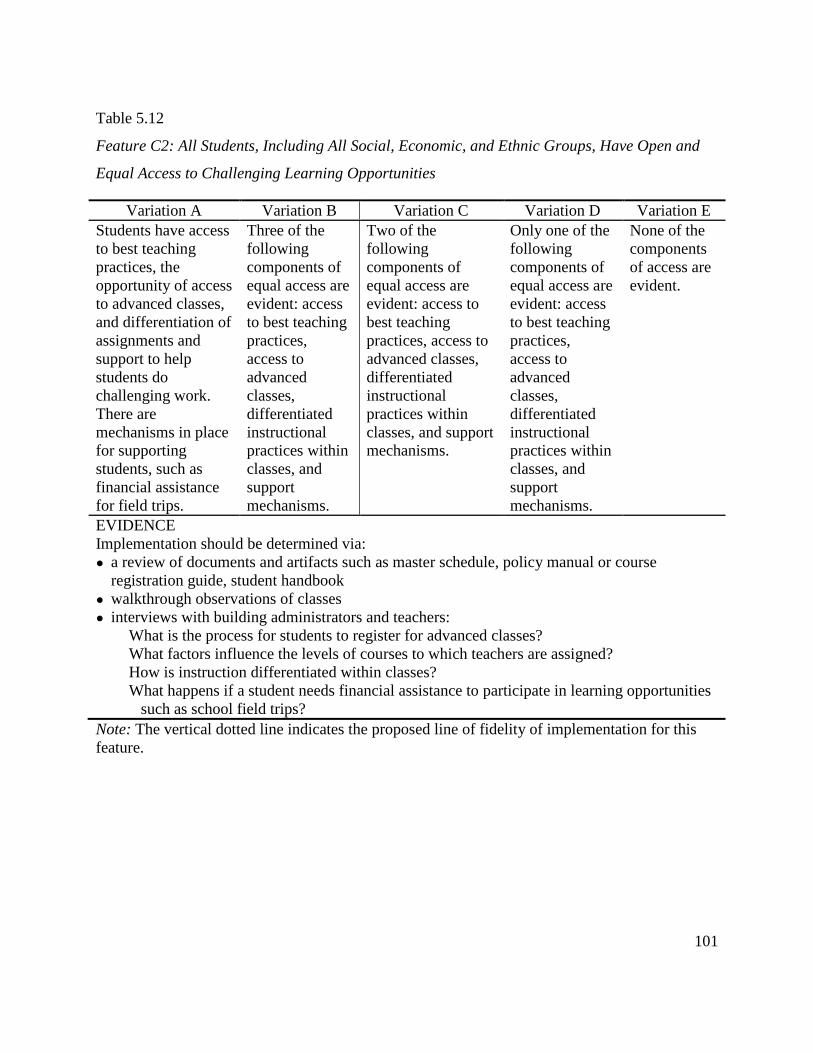
101
Table 5.12
Feature C2: All Students, Including All Social, Economic, and Ethnic Groups, Have Open and
Equal Access to Challenging Learning Opportunities
Variation A Variation B Variation C Variation D Variation E
Students have access
to best teaching
practices, the
opportunity of access
to advanced classes,
and differentiation of
assignments and
support to help
students do
challenging work.
There are
mechanisms in place
for supporting
students, such as
financial assistance
for field trips.
Three of the
following
components of
equal access are
evident: access
to best teaching
practices,
access to
advanced
classes,
differentiated
instructional
practices within
classes, and
support
mechanisms.
Two of the
following
components of
equal access are
evident: access to
best teaching
practices, access to
advanced classes,
differentiated
instructional
practices within
classes, and support
mechanisms.
Only one of the
following
components of
equal access are
evident: access
to best teaching
practices,
access to
advanced
classes,
differentiated
instructional
practices within
classes, and
support
mechanisms.
None of the
components
of access are
evident.
EVIDENCE
Implementation should be determined via:
● a review of documents and artifacts such as master schedule, policy manual or course
registration guide, student handbook
● walkthrough observations of classes
● interviews with building administrators and teachers:
What is the process for students to register for advanced classes?
What factors influence the levels of courses to which teachers are assigned?
How is instruction differentiated within classes?
What happens if a student needs financial assistance to participate in learning opportunities
such as school field trips?
Note: The vertical dotted line indicates the proposed line of fidelity of implementation for this
feature.
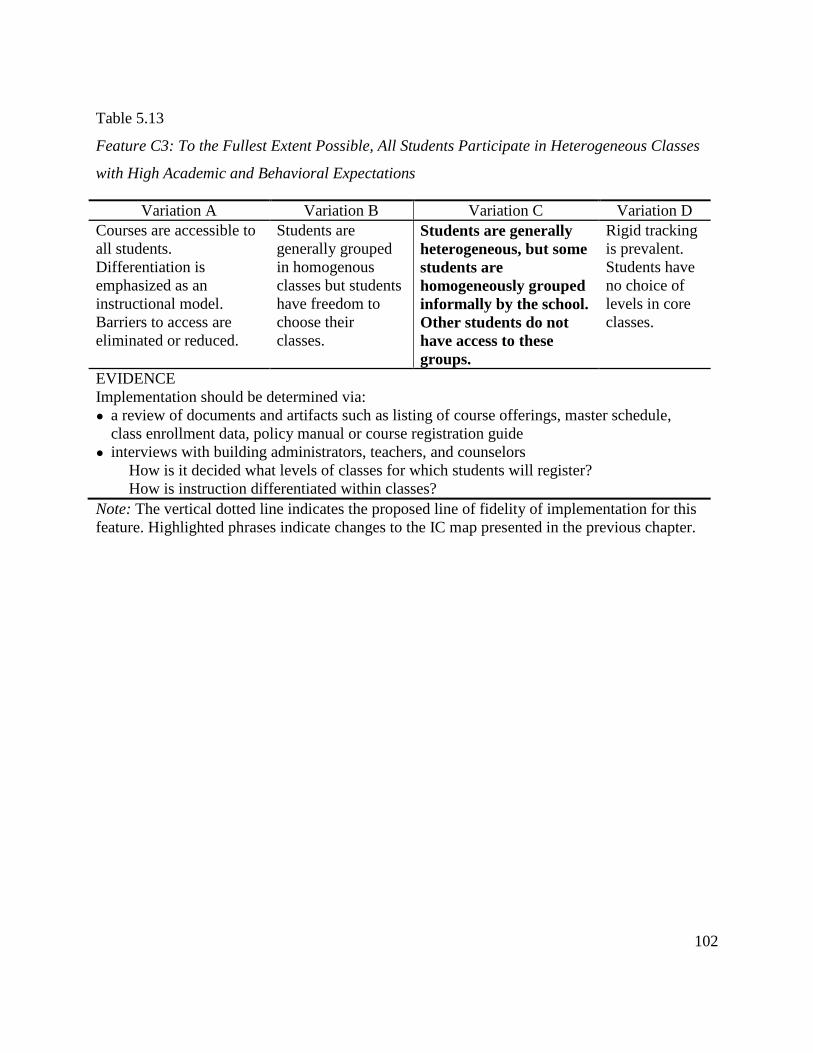
102
Table 5.13
Feature C3: To the Fullest Extent Possible, All Students Participate in Heterogeneous Classes
with High Academic and Behavioral Expectations
Variation A Variation B Variation C Variation D
Courses are accessible to
all students.
Differentiation is
emphasized as an
instructional model.
Barriers to access are
eliminated or reduced.
Students are
generally grouped
in homogenous
classes but students
have freedom to
choose their
classes.
Students are generally
heterogeneous, but some
students are
homogeneously grouped
informally by the school.
Other students do not
have access to these
groups.
Rigid tracking
is prevalent.
Students have
no choice of
levels in core
classes.
EVIDENCE
Implementation should be determined via:
● a review of documents and artifacts such as listing of course offerings, master schedule,
class enrollment data, policy manual or course registration guide
● interviews with building administrators, teachers, and counselors
How is it decided what levels of classes for which students will register?
How is instruction differentiated within classes?
Note: The vertical dotted line indicates the proposed line of fidelity of implementation for this
feature. Highlighted phrases indicate changes to the IC map presented in the previous chapter.
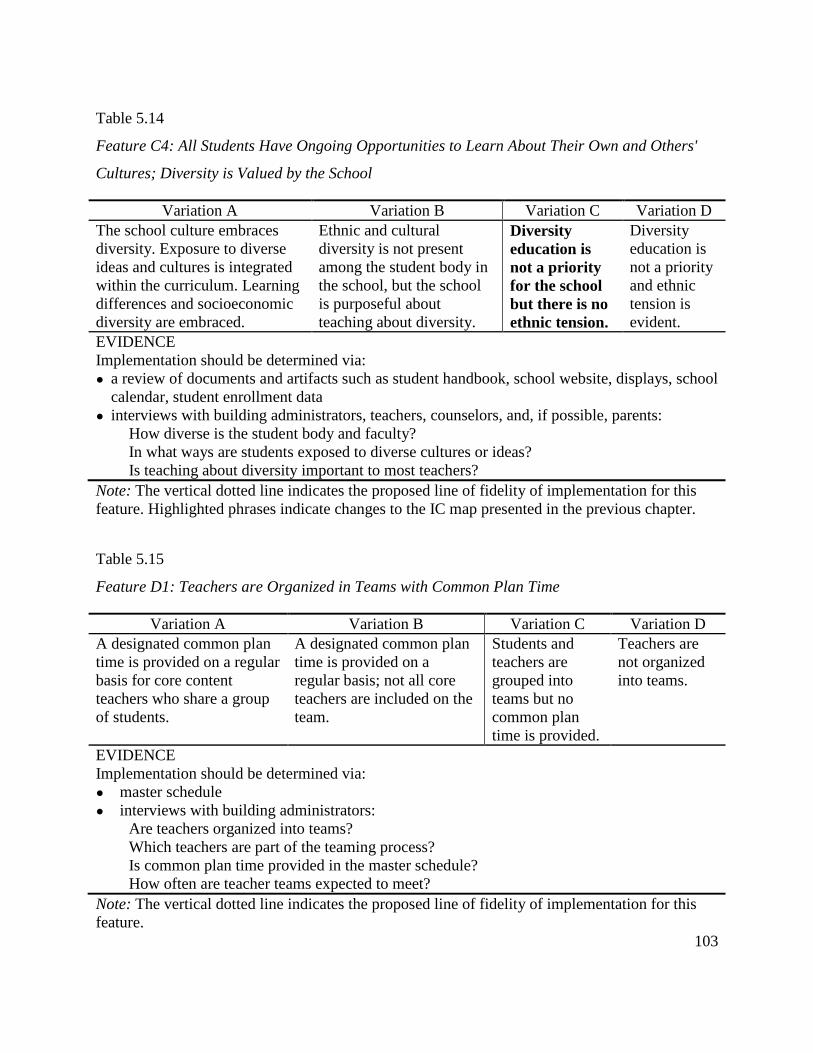
103
Table 5.14
Feature C4: All Students Have Ongoing Opportunities to Learn About Their Own and Others'
Cultures; Diversity is Valued by the School
Variation A Variation B Variation C Variation D
The school culture embraces
diversity. Exposure to diverse
ideas and cultures is integrated
within the curriculum. Learning
differences and socioeconomic
diversity are embraced.
Ethnic and cultural
diversity is not present
among the student body in
the school, but the school
is purposeful about
teaching about diversity.
Diversity
education is
not a priority
for the school
but there is no
ethnic tension.
Diversity
education is
not a priority
and ethnic
tension is
evident.
EVIDENCE
Implementation should be determined via:
● a review of documents and artifacts such as student handbook, school website, displays, school
calendar, student enrollment data
● interviews with building administrators, teachers, counselors, and, if possible, parents:
How diverse is the student body and faculty?
In what ways are students exposed to diverse cultures or ideas?
Is teaching about diversity important to most teachers?
Note: The vertical dotted line indicates the proposed line of fidelity of implementation for this
feature. Highlighted phrases indicate changes to the IC map presented in the previous chapter.
Table 5.15
Feature D1: Teachers are Organized in Teams with Common Plan Time
Variation A Variation B Variation C Variation D
A designated common plan
time is provided on a regular
basis for core content
teachers who share a group
of students.
A designated common plan
time is provided on a
regular basis; not all core
teachers are included on the
team.
Students and
teachers are
grouped into
teams but no
common plan
time is provided.
Teachers are
not organized
into teams.
EVIDENCE
Implementation should be determined via:
● master schedule
● interviews with building administrators:
Are teachers organized into teams?
Which teachers are part of the teaming process?
Is common plan time provided in the master schedule?
How often are teacher teams expected to meet?
Note: The vertical dotted line indicates the proposed line of fidelity of implementation for this
feature.
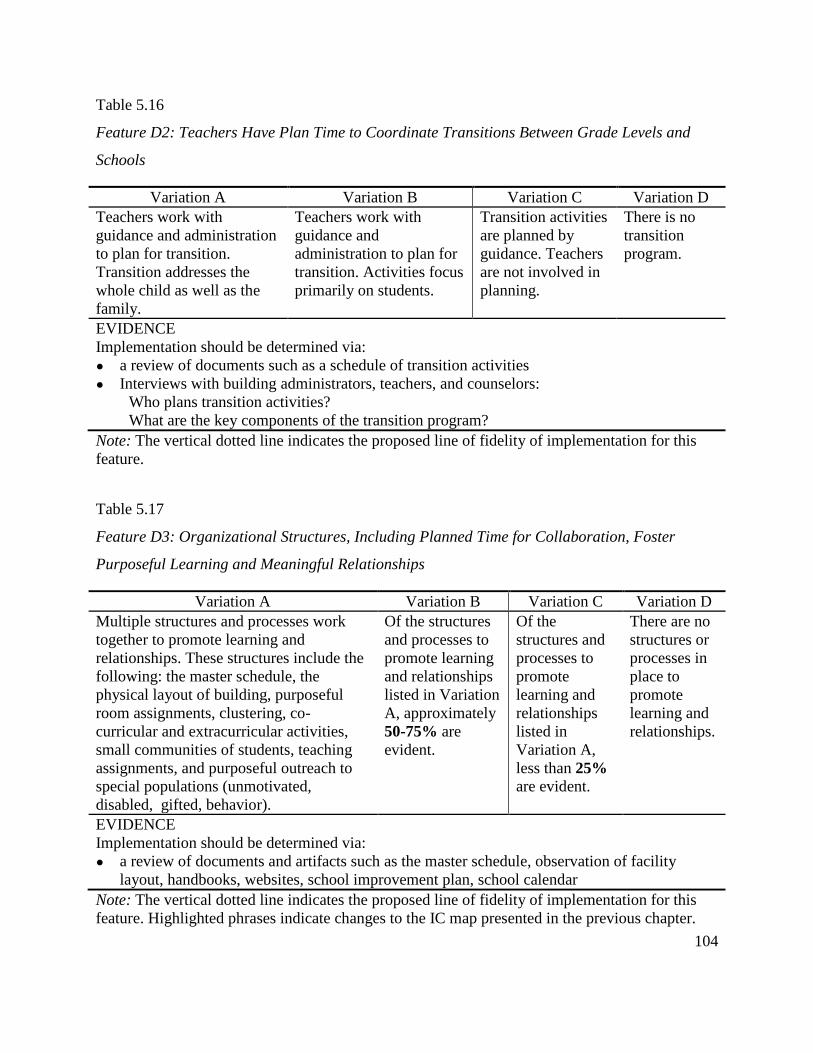
104
Table 5.16
Feature D2: Teachers Have Plan Time to Coordinate Transitions Between Grade Levels and
Schools
Variation A Variation B Variation C Variation D
Teachers work with
guidance and administration
to plan for transition.
Transition addresses the
whole child as well as the
family.
Teachers work with
guidance and
administration to plan for
transition. Activities focus
primarily on students.
Transition activities
are planned by
guidance. Teachers
are not involved in
planning.
There is no
transition
program.
EVIDENCE
Implementation should be determined via:
● a review of documents such as a schedule of transition activities
● Interviews with building administrators, teachers, and counselors:
Who plans transition activities?
What are the key components of the transition program?
Note: The vertical dotted line indicates the proposed line of fidelity of implementation for this
feature.
Table 5.17
Feature D3: Organizational Structures, Including Planned Time for Collaboration, Foster
Purposeful Learning and Meaningful Relationships
Variation A Variation B Variation C Variation D
Multiple structures and processes work
together to promote learning and
relationships. These structures include the
following: the master schedule, the
physical layout of building, purposeful
room assignments, clustering, co-
curricular and extracurricular activities,
small communities of students, teaching
assignments, and purposeful outreach to
special populations (unmotivated,
disabled, gifted, behavior).
Of the structures
and processes to
promote learning
and relationships
listed in Variation
A, approximately
50-75% are
evident.
Of the
structures and
processes to
promote
learning and
relationships
listed in
Variation A,
less than 25%
are evident.
There are no
structures or
processes in
place to
promote
learning and
relationships.
EVIDENCE
Implementation should be determined via:
● a review of documents and artifacts such as the master schedule, observation of facility
layout, handbooks, websites, school improvement plan, school calendar
Note: The vertical dotted line indicates the proposed line of fidelity of implementation for this
feature. Highlighted phrases indicate changes to the IC map presented in the previous chapter.
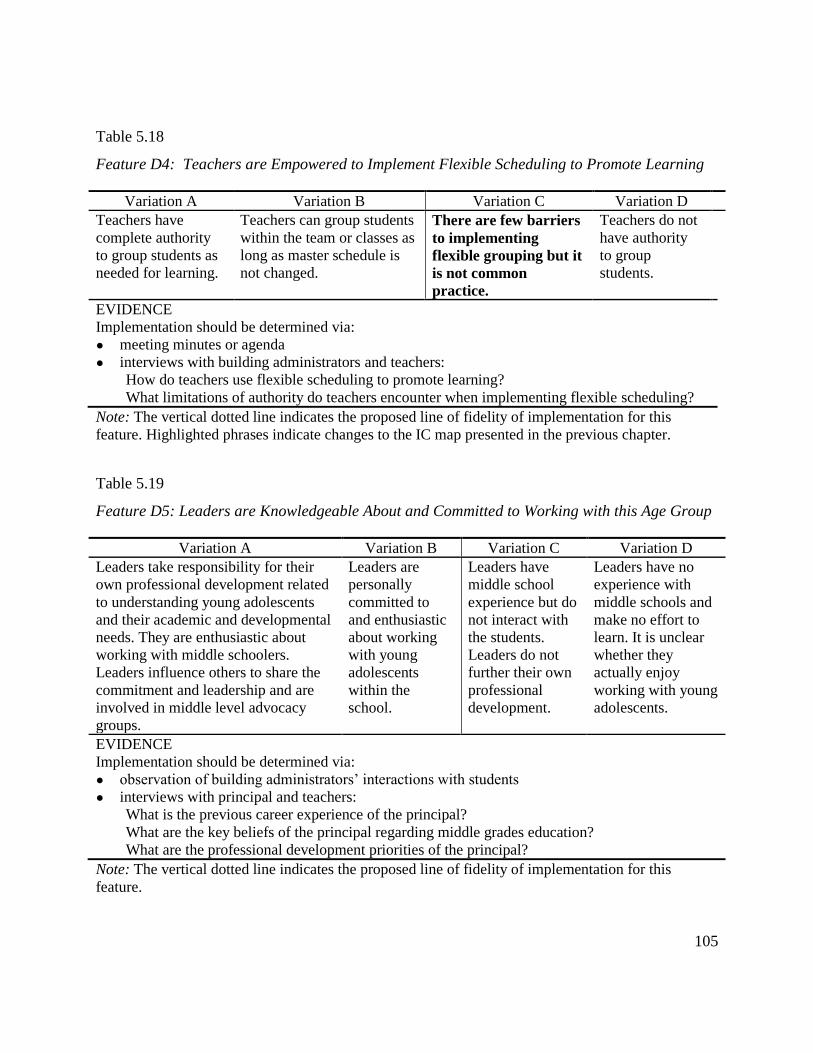
105
Table 5.18
Feature D4: Teachers are Empowered to Implement Flexible Scheduling to Promote Learning
Variation A Variation B Variation C Variation D
Teachers have
complete authority
to group students as
needed for learning.
Teachers can group students
within the team or classes as
long as master schedule is
not changed.
There are few barriers
to implementing
flexible grouping but it
is not common
practice.
Teachers do not
have authority
to group
students.
EVIDENCE
Implementation should be determined via:
● meeting minutes or agenda
● interviews with building administrators and teachers:
How do teachers use flexible scheduling to promote learning?
What limitations of authority do teachers encounter when implementing flexible scheduling?
Note: The vertical dotted line indicates the proposed line of fidelity of implementation for this
feature. Highlighted phrases indicate changes to the IC map presented in the previous chapter.
Table 5.19
Feature D5: Leaders are Knowledgeable About and Committed to Working with this Age Group
Variation A Variation B Variation C Variation D
Leaders take responsibility for their
own professional development related
to understanding young adolescents
and their academic and developmental
needs. They are enthusiastic about
working with middle schoolers.
Leaders influence others to share the
commitment and leadership and are
involved in middle level advocacy
groups.
Leaders are
personally
committed to
and enthusiastic
about working
with young
adolescents
within the
school.
Leaders have
middle school
experience but do
not interact with
the students.
Leaders do not
further their own
professional
development.
Leaders have no
experience with
middle schools and
make no effort to
learn. It is unclear
whether they
actually enjoy
working with young
adolescents.
EVIDENCE
Implementation should be determined via:
● observation of building administrators’ interactions with students
● interviews with principal and teachers:
What is the previous career experience of the principal?
What are the key beliefs of the principal regarding middle grades education?
What are the professional development priorities of the principal?
Note: The vertical dotted line indicates the proposed line of fidelity of implementation for this
feature.
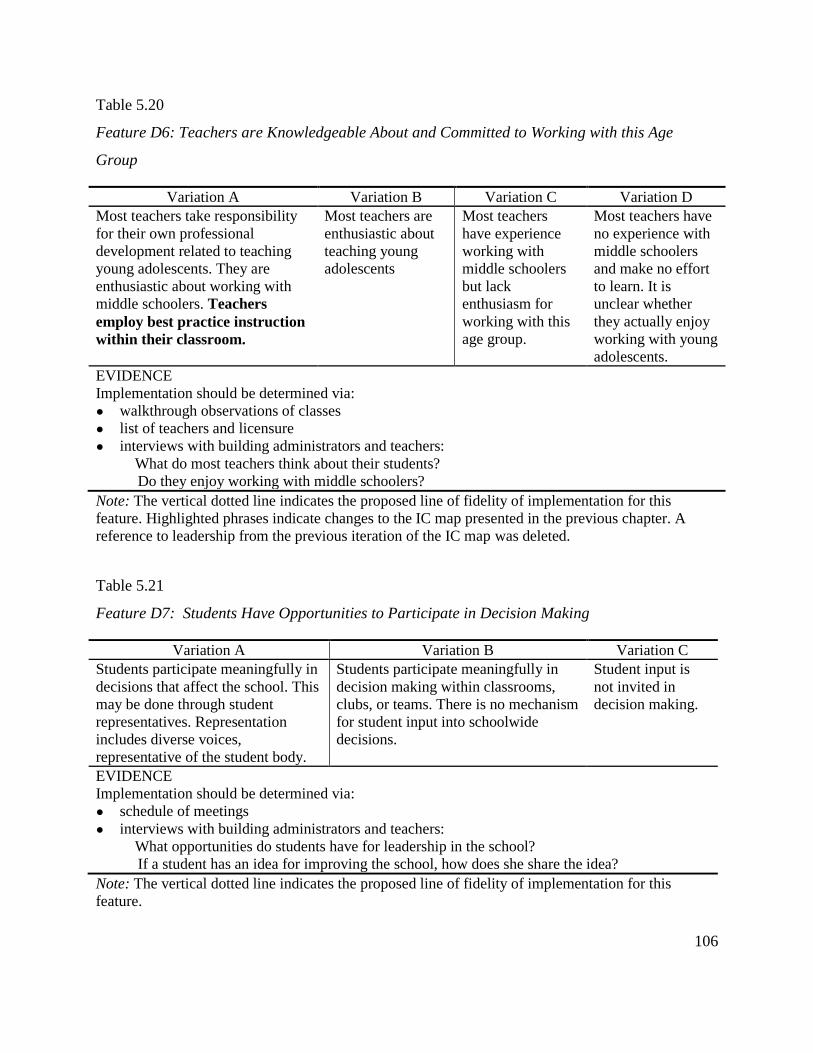
106
Table 5.20
Feature D6: Teachers are Knowledgeable About and Committed to Working with this Age
Group
Variation A Variation B Variation C Variation D
Most teachers take responsibility
for their own professional
development related to teaching
young adolescents. They are
enthusiastic about working with
middle schoolers. Teachers
employ best practice instruction
within their classroom.
Most teachers are
enthusiastic about
teaching young
adolescents
Most teachers
have experience
working with
middle schoolers
but lack
enthusiasm for
working with this
age group.
Most teachers have
no experience with
middle schoolers
and make no effort
to learn. It is
unclear whether
they actually enjoy
working with young
adolescents.
EVIDENCE
Implementation should be determined via:
● walkthrough observations of classes
● list of teachers and licensure
● interviews with building administrators and teachers:
What do most teachers think about their students?
Do they enjoy working with middle schoolers?
Note: The vertical dotted line indicates the proposed line of fidelity of implementation for this
feature. Highlighted phrases indicate changes to the IC map presented in the previous chapter. A
reference to leadership from the previous iteration of the IC map was deleted.
Table 5.21
Feature D7: Students Have Opportunities to Participate in Decision Making
Variation A Variation B Variation C
Students participate meaningfully in
decisions that affect the school. This
may be done through student
representatives. Representation
includes diverse voices,
representative of the student body.
Students participate meaningfully in
decision making within classrooms,
clubs, or teams. There is no mechanism
for student input into schoolwide
decisions.
Student input is
not invited in
decision making.
EVIDENCE
Implementation should be determined via:
● schedule of meetings
● interviews with building administrators and teachers:
What opportunities do students have for leadership in the school?
If a student has an idea for improving the school, how does she share the idea?
Note: The vertical dotted line indicates the proposed line of fidelity of implementation for this
feature.
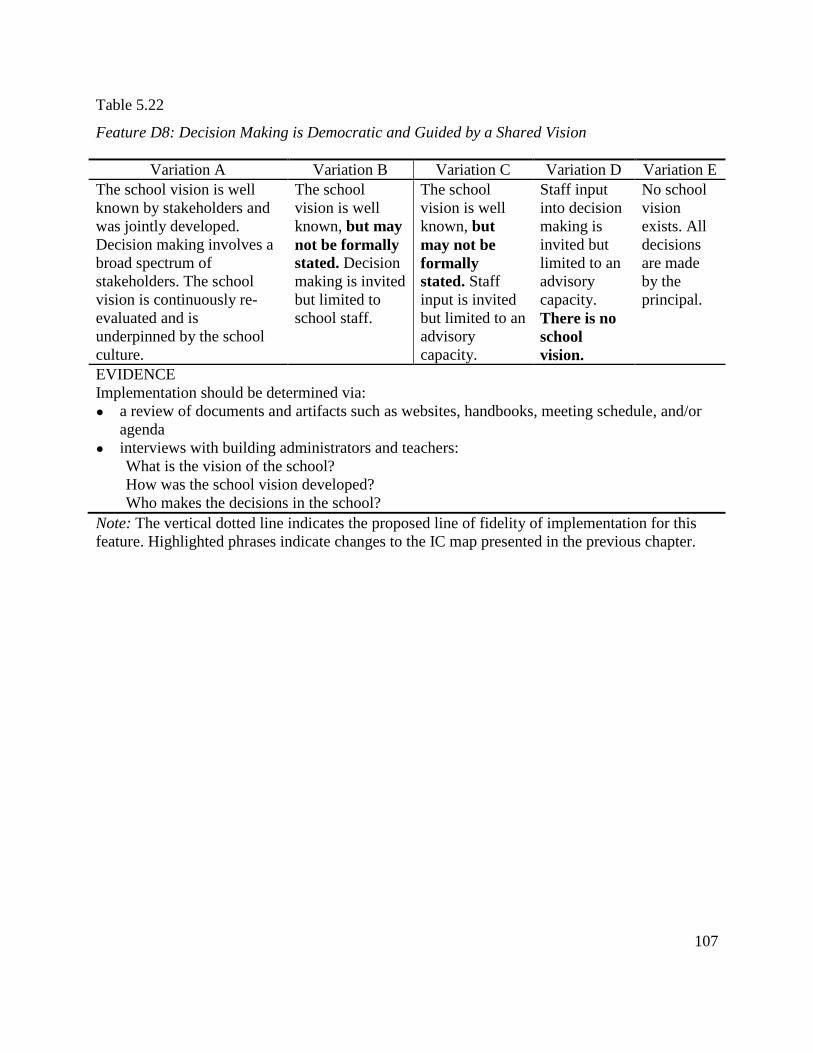
107
Table 5.22
Feature D8: Decision Making is Democratic and Guided by a Shared Vision
Variation A Variation B Variation C Variation D Variation E
The school vision is well
known by stakeholders and
was jointly developed.
Decision making involves a
broad spectrum of
stakeholders. The school
vision is continuously re-
evaluated and is
underpinned by the school
culture.
The school
vision is well
known, but may
not be formally
stated. Decision
making is invited
but limited to
school staff.
The school
vision is well
known, but
may not be
formally
stated. Staff
input is invited
but limited to an
advisory
capacity.
Staff input
into decision
making is
invited but
limited to an
advisory
capacity.
There is no
school
vision.
No school
vision
exists. All
decisions
are made
by the
principal.
EVIDENCE
Implementation should be determined via:
● a review of documents and artifacts such as websites, handbooks, meeting schedule, and/or
agenda
● interviews with building administrators and teachers:
What is the vision of the school?
How was the school vision developed?
Who makes the decisions in the school?
Note: The vertical dotted line indicates the proposed line of fidelity of implementation for this
feature. Highlighted phrases indicate changes to the IC map presented in the previous chapter.
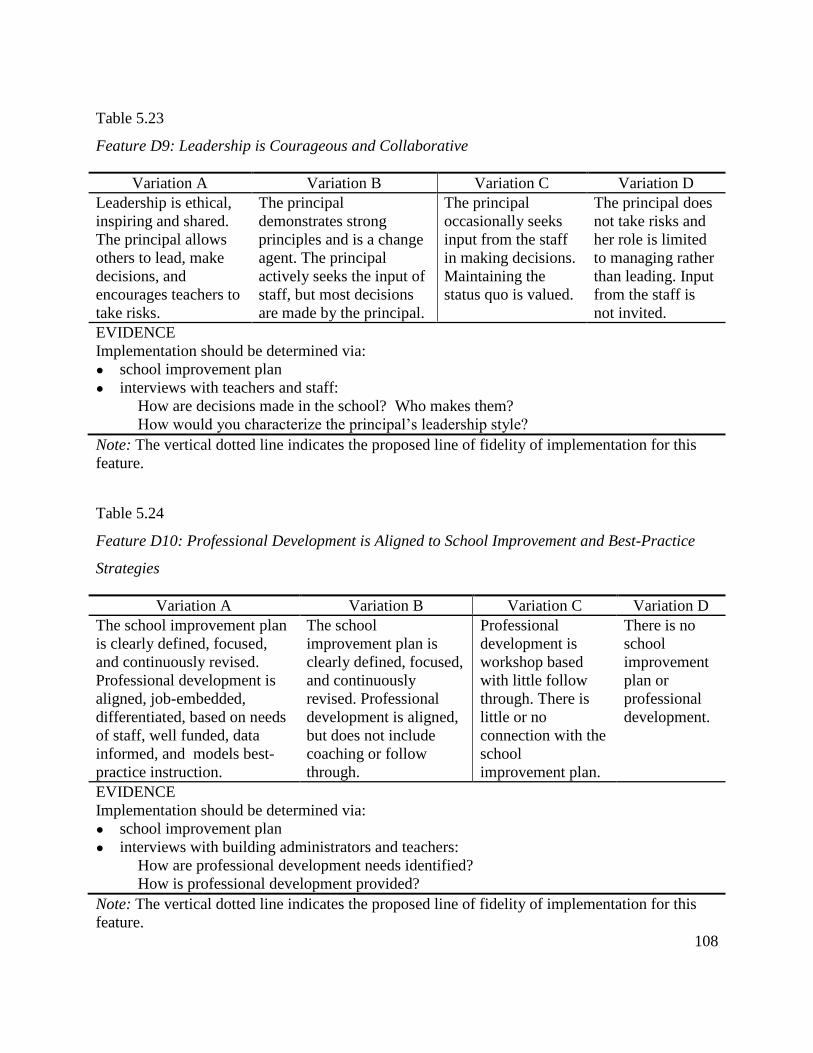
108
Table 5.23
Feature D9: Leadership is Courageous and Collaborative
Variation A Variation B Variation C Variation D
Leadership is ethical,
inspiring and shared.
The principal allows
others to lead, make
decisions, and
encourages teachers to
take risks.
The principal
demonstrates strong
principles and is a change
agent. The principal
actively seeks the input of
staff, but most decisions
are made by the principal.
The principal
occasionally seeks
input from the staff
in making decisions.
Maintaining the
status quo is valued.
The principal does
not take risks and
her role is limited
to managing rather
than leading. Input
from the staff is
not invited.
EVIDENCE
Implementation should be determined via:
● school improvement plan
● interviews with teachers and staff:
How are decisions made in the school? Who makes them?
How would you characterize the principal’s leadership style?
Note: The vertical dotted line indicates the proposed line of fidelity of implementation for this
feature.
Table 5.24
Feature D10: Professional Development is Aligned to School Improvement and Best-Practice
Strategies
Variation A Variation B Variation C Variation D
The school improvement plan
is clearly defined, focused,
and continuously revised.
Professional development is
aligned, job-embedded,
differentiated, based on needs
of staff, well funded, data
informed, and models best-
practice instruction.
The school
improvement plan is
clearly defined, focused,
and continuously
revised. Professional
development is aligned,
but does not include
coaching or follow
through.
Professional
development is
workshop based
with little follow
through. There is
little or no
connection with the
school
improvement plan.
There is no
school
improvement
plan or
professional
development.
EVIDENCE
Implementation should be determined via:
● school improvement plan
● interviews with building administrators and teachers:
How are professional development needs identified?
How is professional development provided?
Note: The vertical dotted line indicates the proposed line of fidelity of implementation for this
feature.
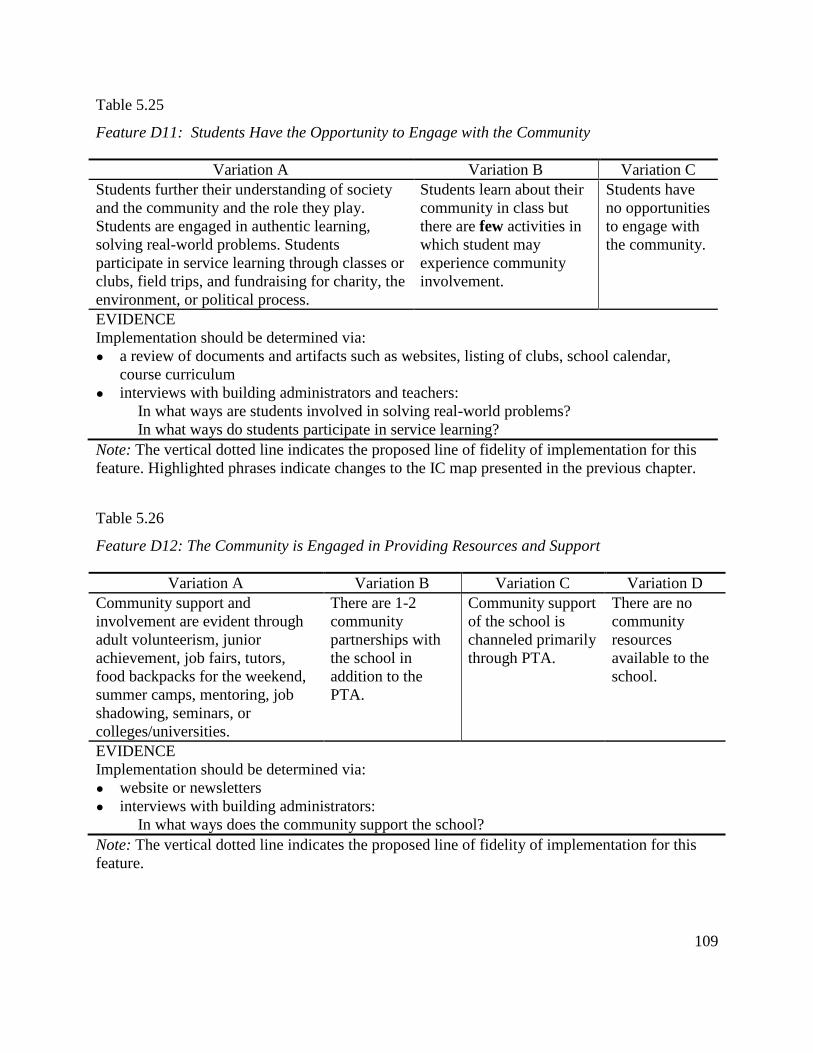
109
Table 5.25
Feature D11: Students Have the Opportunity to Engage with the Community
Variation A Variation B Variation C
Students further their understanding of society
and the community and the role they play.
Students are engaged in authentic learning,
solving real-world problems. Students
participate in service learning through classes or
clubs, field trips, and fundraising for charity, the
environment, or political process.
Students learn about their
community in class but
there are few activities in
which student may
experience community
involvement.
Students have
no opportunities
to engage with
the community.
EVIDENCE
Implementation should be determined via:
● a review of documents and artifacts such as websites, listing of clubs, school calendar,
course curriculum
● interviews with building administrators and teachers:
In what ways are students involved in solving real-world problems?
In what ways do students participate in service learning?
Note: The vertical dotted line indicates the proposed line of fidelity of implementation for this
feature. Highlighted phrases indicate changes to the IC map presented in the previous chapter.
Table 5.26
Feature D12: The Community is Engaged in Providing Resources and Support
Variation A Variation B Variation C Variation D
Community support and
involvement are evident through
adult volunteerism, junior
achievement, job fairs, tutors,
food backpacks for the weekend,
summer camps, mentoring, job
shadowing, seminars, or
colleges/universities.
There are 1-2
community
partnerships with
the school in
addition to the
PTA.
Community support
of the school is
channeled primarily
through PTA.
There are no
community
resources
available to the
school.
EVIDENCE
Implementation should be determined via:
● website or newsletters
● interviews with building administrators:
In what ways does the community support the school?
Note: The vertical dotted line indicates the proposed line of fidelity of implementation for this
feature.
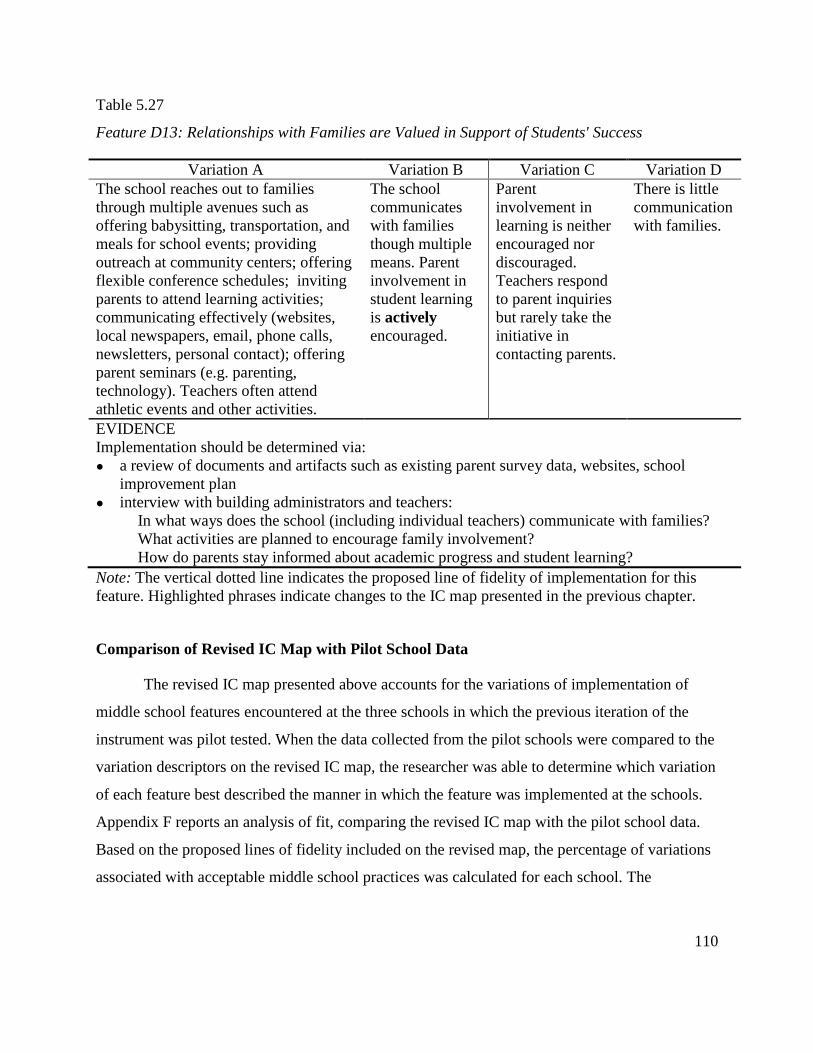
110
Table 5.27
Feature D13: Relationships with Families are Valued in Support of Students' Success
Variation A Variation B Variation C Variation D
The school reaches out to families
through multiple avenues such as
offering babysitting, transportation, and
meals for school events; providing
outreach at community centers; offering
flexible conference schedules; inviting
parents to attend learning activities;
communicating effectively (websites,
local newspapers, email, phone calls,
newsletters, personal contact); offering
parent seminars (e.g. parenting,
technology). Teachers often attend
athletic events and other activities.
The school
communicates
with families
though multiple
means. Parent
involvement in
student learning
is actively
encouraged.
Parent
involvement in
learning is neither
encouraged nor
discouraged.
Teachers respond
to parent inquiries
but rarely take the
initiative in
contacting parents.
There is little
communication
with families.
EVIDENCE
Implementation should be determined via:
● a review of documents and artifacts such as existing parent survey data, websites, school
improvement plan
● interview with building administrators and teachers:
In what ways does the school (including individual teachers) communicate with families?
What activities are planned to encourage family involvement?
How do parents stay informed about academic progress and student learning?
Note: The vertical dotted line indicates the proposed line of fidelity of implementation for this
feature. Highlighted phrases indicate changes to the IC map presented in the previous chapter.
Comparison of Revised IC Map with Pilot School Data
The revised IC map presented above accounts for the variations of implementation of
middle school features encountered at the three schools in which the previous iteration of the
instrument was pilot tested. When the data collected from the pilot schools were compared to the
variation descriptors on the revised IC map, the researcher was able to determine which variation
of each feature best described the manner in which the feature was implemented at the schools.
Appendix F reports an analysis of fit, comparing the revised IC map with the pilot school data.
Based on the proposed lines of fidelity included on the revised map, the percentage of variations
associated with acceptable middle school practices was calculated for each school. The
111
percentage of acceptable standards-based middle school practices was slightly higher at Pilot
School 3 than at the other two schools.
One of the problems that arises from the literature and current policy debate is whether
the implementation of the middle school concept is limited to schools exclusively housing grades
six to eight. In order to verify the content validity of the IC map for middle grades housed in
elementary settings, a high-performing K-7 school was identified for inclusion in the pilot
testing. The analysis of fit comparison made with the revised IC map indicated that the
percentage of acceptable implementation of middle school features at the K-7 school was very
similar to the percentages for the two 6-8 schools. Further testing of the revised IC map in
various school settings will need to be conducted to allow for definitive conclusions to be made
regarding how middle school practices may be implemented in schools with different grade
configurations. Nevertheless, the analysis does indicate that the revised IC map looks to be a
useful instrument for evaluating standards-based middle school features in K-7 or K-8 schools,
as well as 6-8 schools.
Recommendations
Further Testing and Development
Hall and Hord (2006) intend that IC mapping be a multi-iterative process. The IC map
describing implementation of the middle school concept in the context of standards and
accountability presented in this chapter is the third iteration of the instrument. It was developed
employing a rigorous three-phase methodology involving a review of major middle school
frameworks and interaction with experts and experienced practitioners. It was pilot tested in
three diverse schools housing the middle grades and revised based on the data collected there.
The IC map is presented in its current form as a first step toward a useful instrument to evaluate
middle school practices in schools. Additional testing of instrument will be required to establish
statistical norms such as internal consistency, predictive validity, and inter-rater reliability.
Use of the instrument for scholarly or practical applications, nonetheless, will likely yield
evidence that the instrument needs additional revision. One limitation of the pilot testing was that
the three schools were located within a relatively small geographic area in the same state. No
urban schools were included in the pilot testing. Further testing and use of the instrument in more
112
diverse settings may lead to the need for additional variations for certain features and more
extensive refinement of the language of the descriptors. Further testing and use of the instrument
will also be required to verify where lines of fidelity should be drawn for each feature. The
features of middle level education enumerated in the IC map should be revisited periodically
through monitoring of future revisions of the major middle school frameworks.
The interviews conducted in the pilot testing of the IC map were conducted utilizing
matrix sampling, rather than posing all of the interview questions to every participant. It should
be acknowledged that the use of matrix sampling was a limitation in this process since it allows
for bias to influence the collection of data. An additional limitation was the use of parent
interviews, since bias was inherent in relying on the principal to make parents available and
access to parents was limited.
Future Research
Empirical research examining the effectiveness of practices associated with the middle
school concept has produced mixed findings (Cook et al., 2009; Jackson & Lunenburg, 2010;
Lee & Smith, 1993; Mertens & Flowers, 2003; Offenberg, 2001; Stephens & Jenkins, 1994).
Since the 1990s, researchers have focused much attention on student achievement outcomes as
indicated by various measures including standards-based testing. Among the challenges of
conducting research with the middle school concept, however, have been clearly defining the
research variables and accounting for the variance in the implementation of middle school
features. Lounsbury (2009) argues that much of the literature critical of the middle school
concept has not duly acknowledged the difference between schools with fully and authentically
implemented middle school concept features in the middle grades and middle schools as merely
a 6-8 grade configuration with nominal structures such as teaming. Any conclusions drawn from
the available research on the middle concept can be reasonable only to the extent that the fidelity,
degree, and context of implementation are fully understood.
The IC map presented in this chapter clearly defines acceptable variations of
implementation of middle school features and is recommended to researchers investigating the
relationship between the middle school concept and student outcomes such as student
achievement. Future research could involve using the IC map as a primary instrument for
113
determining fidelity of implementation of middle level features in schools. Alternatively, since
use of the IC map is a relatively time and labor intensive process, the IC map may be used to
verify data collected through survey instruments. The IC map may be used in its entirety to
gauge fidelity of implementation of middle school features as a collective set of practices or
limited sections of the IC map may be used to determine fidelity of implementation of specific
middle level features. The level of fidelity of implementation of middle level features for a
school or sample population of schools could be compared to measures of student achievement
such as state standardized tests. Statistical analysis could then be employed to advance our
understanding of which middle level features, if any, are related to increased student
achievement.
Self Assessment, Professional Development, and School Evaluation
For school leaders implementing any reform or change in schools, understanding the
nature of the change process is a key factor that influences whether the intended change succeeds
or fails. School leaders that successfully navigate the complexities of the change process
recognize that there are various stages of adoption of change that require steady leadership
toward long-term and short-term goals (Fullan, 2006; Hall & Hord, 2006). The IC map presented
in this chapter attempts to add to the current understanding of what practices constitute the
middle school concept to aid school leaders in their decision making. This diagnostic tool should
be useful to school leaders in assessing the status of middle school features within schools and
making decisions about needed school improvement and related professional development.
For school leaders making decisions about improvement in the middle grades at the
school or district level, some possible applications of the IC map seem relevant. At the school
building level, the IC map may be used as a self-assessment tool by administrators, instructional
coaches, or teacher teams to determine the school’s level of implementation of middle level
features. School leaders may choose to use the IC map to decide if the school is implementing
middle level features as a collective set of practices or leaders may choose to use sections of the
IC map to focus on selected areas. For example, teacher teams may decide to use only the
features on the IC map related to academic excellence to determine areas of strength and
weakness in the instructional practices employed by the team. Administrators could use the
114
sections of the IC map related to organizational structures to determine if, for example, sufficient
common plan time is in place. For school districts in which fidelity to middle school practices is
valued, the IC map could be used to determine the level of implementation of middle school
practices in the schools housing the middle grades within the school district and identify areas of
needed improvement.
Professional development, whether guided by the district, determined by the school
administration, or self-directed via teacher teams operating as professional learning communities,
should align with the areas of improvement suggested by use of the IC map. Using the IC map to
evaluate the implementation of middle level features within a school or schools within a district
may reveal the need to change the manner in which the features are implemented. School leaders
or teacher teams may want to attend a conference or engage in a group study of the practices that
need to be improved. Peer observations and coaching could be employed to encourage a job-
embedded, collaborative approach. Such an approach to professional development could be
applied to many of the IC map features including the need for more rigorous instructional
practices, interdisciplinary learning, active learning strategies, student advocacy systems,
diversity education, and opportunities for students to engage with the community.
Another potential use of the IC map presented in this chapter is as an instrument to
evaluate schools for inclusion in such initiatives as state Schools to Watch (STW) programs
sponsored by the National Forum to Accelerate Middle-Grades Education (National Forum).
Since the IC map closely reflects the criteria established by the National Forum for state STW
programs (National Forum, 2011), IC map may be a useful tool for teams making site visits to
STW applicant schools. The descriptors of variations of middle level features offered by the IC
map provide a different perspective of possible levels of implementation than the self rating
guides currently published by the National Forum. The IC map also specifies sources of evidence
and suggested interview questions that may be useful in promoting consistency of data collection
across school site visits and across state programs.
Conclusion
The product of this instrument development and testing process is a research-validated
description of key features of the middle level philosophy of education in an era of standards and

115
accountability and a diagnostic instrument useful for further research and practical applications.
IC maps are intended to undergo multiple iterations in order to improve the instrument and
continue adapting the map to changes in the innovation itself. It is hoped that the product
resulting from the instrument development and testing process will be the first draft of an
instrument that will continue to evolve through subsequent use and refinement by future
researchers and practitioners.
116
REFERENCES
Alexander, W. (1964). The junior high school: A changing view. NASSP Bulletin, 48, 15-24.
Alexander, W. (1969). The new school in the middle. Phi Delta Kappan, 50(6), 35-357.
Alexander, W., & McEwin, C. (1989). Schools in the middle: Status and progress. Columbus,
OH: National Middle School Association.
Anfara, V., & Buehler, A. (2005). Grade configuration and the education of young adolescents.
Middle School Journal, 37(1), 53-59.
Anfara, V., & Lipka, R. (2003). Relating the middle school concept to student achievement.
Middle School Journal, 35(1), 24-32.
Association for Middle Level Education. (2011) A name change for NMSA - Association for
Middle Level Education. Retrieved February 3, 2012,
fromhttp://amle.org/AboutAMLE/AMLENameChange/tabid/2325/Default.aspx.
Backes, J., Ralston, A., & Ingwalson, G. (1999). Middle level reform: The impact on student
achievement. Research in Middle Level Education Quarterly, 22(3), 43-57.
Bradley, A. (1998). Muddle in the middle. Education Week, 17(31), 38. Retrieved September 6,
2010, from Education Research Complete database.
Byrnes, V., & Ruby, A. (2007). Comparing achievement between K-8 and middle schools: A
large-scale empirical study. American Journal of Education, 114(1), 101-135. Retrieved
September 6, 2010, from Education Research Complete database.
Capelluti, J., & Stokes, D. (1991). Middle level education: Policies, programs, and practices.
Reston, VA: National Association of Secondary School Principals.
Carnegie Council on Adolescent Development. (1989). Turning points: Preparing American
youth for the 21st century: The report of the Task Force on Education of Young
Adolescents. Washington, D.C.: Author.
Ceperley, P., & Squires, D. (2000) Standards implementation indicators: Charting your course
to high achievement. Charleston, WV: AEL.
Clark, S., & Clark, D. (1993). Middle level reform: The rhetoric and the reality. Elementary
School Journal, 93(5), 447-460. Retrieved September 6, 2010, from Education Research
Complete database.
117
Clark, S., & Clark, D. (2006). Achieving teaming's full potential: A leadership challenge. Middle
School Journal, 38(2), 52-58.
Cook, C., Faulkner, S., & Kinne, L. (2009). Indicators of middle school implementation: How do
Kentucky's schools to watch measure up? Research in Middle Level Education Online,
32(6), 1-10. Retrieved September 6, 2010, from Education Research Complete database.
Cooney, S. (1998). Education’s weak link: Student performance in the middle grades. Retrieved
February 15, 2010, from http://publications.sreb.org/1998/98E02_weaklink.pdf
Davis, D., & Thompson, S. (2004). Creating high-performing middle schools in segregated
settings: 50 years after Brown. Middle School Journal, 36(2), 4-12.
DuFour, R., DuFour, R., & Eaker, R. (2008). Revisiting professional learning communities at
work. Bloomington, IN: Solution Tree.
Eichhorn, D. (1991). Why middle schools? In J. Capelluti & D. Stokes (Eds.), Middle level
education: Policies, programs, and practices. Reston, VA: National Association of
Secondary School Principals.
Erb, T. (2006). Middle school models are working in many grade configurations to boost student
performance. American Secondary Education, 34(3), 4-13. Retrieved September 6, 2010,
from Education Research Complete database.
Erb, T., & Stevenson, C. (1999). Fostering growth-inducing environments for student success.
Middle School Journal, 30(4), 63-67.
Felner, R., Jackson, A., Kasak, D., Mulhall, P., Brand, S., & Flowers, N. (1997). The impact of
school reform for the middle years: A longitudinal study of a network engaged in Turning
Points-based comprehensive school transformation. Phi Delta Kappan, 78, 528–532,
541–550. Retrieved September 6, 2010, from Education Research Complete database.
Flowers, N., Mertens, S. B., & Mulhall, P. F. (2003). Lessons learned from more than a decade
of middle grades research. Middle School Journal, 35(2), 55-59.
Friedman, T. (2006). The world is flat: A brief history of the twenty-first century. New York:
Farrar, Straus, and Giroux.
Fullan, M. (2001). Leading in a culture of change. San Francisco: Jossey-Bass.
118
Fullan, M. (2006). The future of educational change: System thinkers in action. Journal of
Educational Change, 7, 113-122. Retrieved September 6, 2010, from Education Research
Complete database.
George, P. (2011). The American middle school movement: Taking the long view. Middle
School Journal, 43(2), 44-52. Retrieved February 3, 2012, from Education Research
Complete database.
Gruhn, W., & Douglass, H. (1956). The modern junior high school. New York: The Ronald
Press Company.
Hall, G., & Hord, S. (2006). Implementing change: Patterns, principles, and potholes. New
York: Pearson Education.
Hargreaves, A., & Fink, D. (2003). Sustaining leadership. Phi Delta Kappan, 84(9), 693-700.
Retrieved September 6, 2010, from Education Research Complete database.
Hart, P., Natale, L., & Starr, C. (2010, March). Recognizing rigorous and engaging teaching and
learning. Middle Level Leader. Retrieved July 5, 2010, from http://www.
principals.org/Content.aspx?topic=Recognizing_Rigorous_and_Engaging_Teaching_and
_Learning
Heller, R., Calderon, S., & Medrich, E. (2003). Academic achievement in the middle grades:
what does the research tell us? Retrieved March 29, 2010, from
http://publications.sreb.org/2002/02V47_AchievementReview.pdf
Herriott, M. (1955). Meeting the needs of junior high school youth. NASSP Bulletin, 39, 358-
362.
Hord, S., & Sommers, W. (2008) Leading professional learning communities: Voices from
research and practice. Thousand Oaks, CA: Corwin Press.
Howley, C. (2002). Grade-span configurations. School Administrator, 59(3), 24-29. Retrieved
September 6, 2010, from Education Research Complete database.
Jackson, A., Davis, G. A., Abeel, M., & Bordonaro, A. (2000). Turning points 2000: Educating
adolescents in the 21st century. New York: Teachers College Press.
Jackson, S., & Lunenburg, F. (2010). School performance indicators, accountability ratings, and
student achievement. American Secondary Education, 39(1), 27-44. Retrieved February
3, 2012, from Education Research Complete database.
119
Jillson, I. (1975). The national drug-abuse policy Delphi: Progress report and findings to date. In
H. Linstone & M. Turoff (Eds.), The Delphi method: Techniques and applications.
Reading, MA: Addison-Wesley. Retrieved October 22, 2010, from
http://is.njit.edu/pubs/delphibook/
Juvonen, J., Le, V., Kaganoff, T., Augustine, C., & Constant, L. (2004). Focus on the wonder
years: Challenges facing the American middle school. Santa Monica, CA: Rand.
Lee, V., & Smith, J. (1993). Effects of school restructuring on the achievement and engagement
of middle-grade Students. Sociology of Education, 66(3), 164-187. Retrieved September
6, 2010, from Education Research Complete database.
Linstone, H., & Turoff, M. (Eds.). (1975). The Delphi method: Techniques and applications.
Reading, MA: Addison-Wesley. Retrieved October 22, 2010, from
http://is.njit.edu/pubs/delphibook/
Louis, K., & Marks, H. (1998). Does professional community affect the classroom? Teachers’
work and student experiences in restructuring schools. American Journal of Education,
106, 532-574. Retrieved September 6, 2010, from Education Research Complete
database.
Lounsbury, J. (2009). Deferred but not deterred: A middle school manifesto. Middle School
Journal, 40(5), 31-36.
MacIver, D., & Epstein, J. (1991). Responsive practices in the middle grades: Teacher teams,
advisory groups, remedial instruction, and school transition programs. American Journal
of Education, 99(4), 587-622.
MacIver, D., & Epstein, J. (1993). Middle grades research: not yet mature, but no longer a child.
Elementary School Journal, 93(5), 519-533. Retrieved September 6, 2010, from
Education Research Complete database.
Maslow, A. (1943). A theory of human motivation. Psychological Review, 50(4), 370-396.
doi:10.1037/h0054346
Maslow, A. (1993). The farther reaches of human nature. New York: Arkana.
McEwin, C., & Greene, M. (2010) Results and recommendation from the 2009 National Surveys
of Randomly Selected and Highly Successful Middle Level Schools. Middle School
Journal, 42(1), 49-63.
120
Mertens, S., & Flowers, N. (2003). Middle school practices improve student achievement in high
poverty schools. Middle School Journal, 35(1), 33–43.
Mergendoller, J. (1993). Introduction: The role of research in the reform of middle grades
education. Elementary School Journal, 93(5), 443. Retrieved September 6, 2010, from
Education Research Complete database.
Morocco, C., Brigham, N., & Aguilar, C. (2006). Visionary middle schools: Signature practice
and the power of local invention. New York: Teachers College Press.
National Association of Secondary School Principals. (2006). Breaking ranks in the middle:
Strategies for leading middle level reform. Reston, VA: Author.
National Association of Secondary School Principals. (2011). Breaking ranks: The
comprehensive framework for school improvement. Reston, VA: Author.
National Center for Educational Statistics. (2006). US. Department of Education, Common core
of data, 2005-2006.
National Forum to Accelerate Middle-Grades Reform. (2006). About the forum: Background
history. Retrieved June 24, 2010, from
http://mgforum.org/AbouttheForum/tabid/55/Default.aspx
National Forum to Accelerate Middle-Grades Reform. (2010). What are Schools to Watch?.
Retrieved November 13, 2010, from http://www.schoolstowatch.org/
National Forum to Accelerate Middle-Grades Reform. (2011). Schools to Watch: A school self-
study and rating rubric. Retrieved February 20, 2012, from
http://www.schoolstowatch.org/
National Middle School Association. (1982). This we believe: Successful schools for young
adolescents. Westerville, OH: Author.
National Middle School Association. (2003). This we believe: Successful schools for young
adolescents. Westerville, OH: Author.
No Child Left Behind Act. (2001). Public Law 107-110, 2002.
Offenberg, R. (2001). The efficacy of Philadelphia’s K-to-8 schools compared to middle grades
schools. Middle School Journal, 32(4), 23-29.
Partnership for 21st Century Skills. (2004) P21 Skills Framework. Retrieved September 6, 2010,
from http://www.21stcenturyskills.org/
121
Peterson, A., & Epstein, J. (1991). Development and education across adolescence: An
introduction. American Journal of Education, 99(4), 373- 378.
Pfeiffer, J. (1968). New look at education: Systems analysis in our schools and colleges. New
York: The Odyssey Press.
Picucci, A., Brownson, A., Kahlert, R., & Sobel, A. (2004). Middle school concept helps high-
poverty schools become high-performing schools. Middle School Journal, 36(1), 4-11.
Ravitch, D. (2000). Left behind: a century of failed school reforms. New York: Simon &
Schuster.
Reeves, D. B. (2009). Leading change in your school: How to conquer myths, build commitment,
and get results. Alexandria, VA: Association for Supervision and Curriculum
Development.
Rockoff, J., & Lockwood, B. (2010) Stuck in the middle: How and why middle schools harm
student achievement. Education Next, 10(4), 68-75. Retrieved February 3, 2012, from
Education Research Complete database.
Ruenzel, D., & Smith, B. (1998). Coming of age. Teacher Magazine, 9(5), 32. Retrieved
September 6, 2010, from Education Research Complete database.
Russell, J. (1997). Relationships between the implementation of middle level program concepts
and student achievement. Journal of Curriculum & Supervision, 12(2), 169.
Schmoker, M. J. (2006). Results now: How we can achieve unprecedented improvements in
teaching and learning. Alexandria, VA: Association for Supervision and Curriculum
Development.
Stephens, J., & Jenkins, S. (1994). Affective middle grades program elements and criterion based
achievement in Georgia schools. Reading Improvement, 31(2), 66-71.
Thompson, K., Homestead, E., & Pate, P.E. (2004). Middle school students and parents through
the 1970s, 1980s, and 1990s. Middle School Journal, 35(4), 56-61.
Tucker, M. S., & Codding, J. B. (1998). Standards for our schools: How to set them, measure
them, and reach them. San Francisco, CA: Jossey-Bass.
U.S. Council on Competitiveness. (2004, December). Innovate America. Retrieved September 6,
2010, from http://www.compete.org/about-us/initiatives/nii
122
U. S. Department of Education. (1983). A nation at risk: The imperative for educational reform:
a report to the Nation and the Secretary of Education. Washington, D.C.: National
Commission on Excellence in Education.
Weiss, C., & Kipnes, L. (2006). Reexamining middle school effects: A comparison of middle
grades students in middle schools and K-8 schools. American Journal of Education,
112(2), 239-272. Retrieved September 6, 2010, from Education Research Complete
database.
Williamson, R., & Johnston, J. (1999). Challenging orthodoxy: An emerging agenda for middle
level reform. Middle School Journal, 30(4), 10-17.
Yecke, C. (2003). The war against excellence: The rising tide of mediocrity in America’s middle
schools. Westport, CT: Praeger Publishers.
Yecke, C. (2006). Mayhem in the middle: Why we should shift to K-8. Educational Leadership,
63(7), 20-25. Retrieved September 6, 2010, from Education Research Complete database.
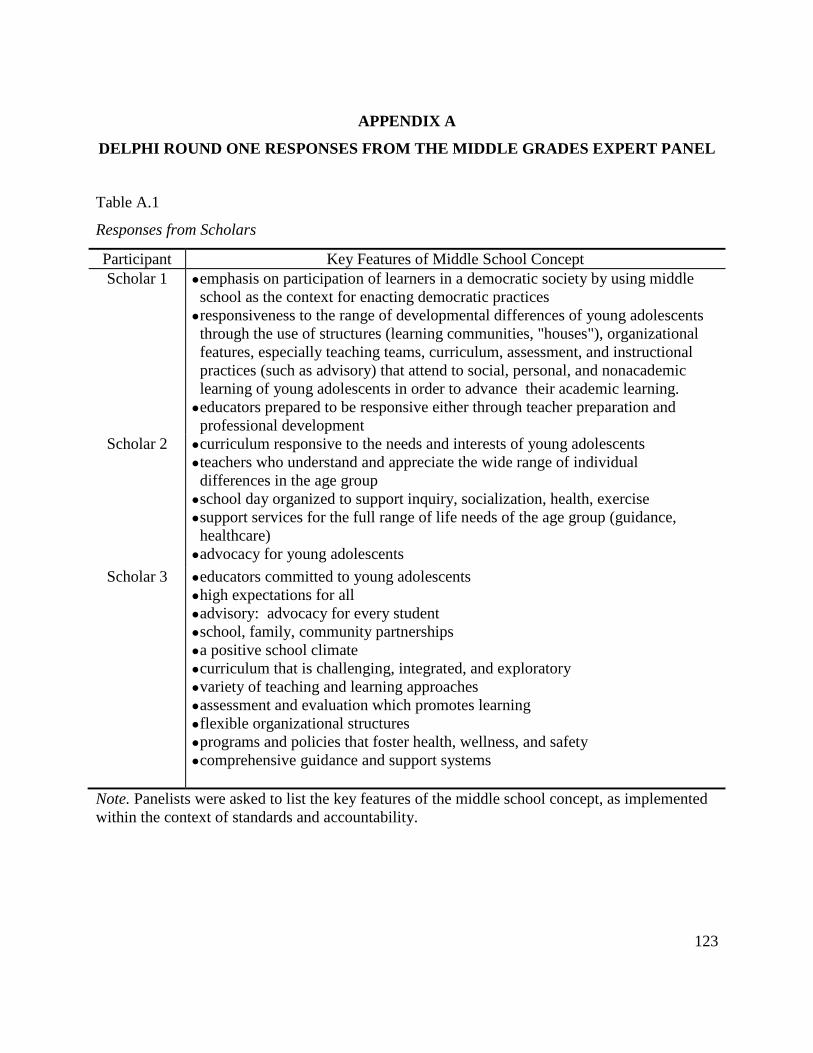
123
APPENDIX A
DELPHI ROUND ONE RESPONSES FROM THE MIDDLE GRADES EXPERT PANEL
Table A.1
Responses from Scholars
Participant Key Features of Middle School Concept
Scholar 1 ● emphasis on participation of learners in a democratic society by using middle
school as the context for enacting democratic practices
● responsiveness to the range of developmental differences of young adolescents
through the use of structures (learning communities, "houses"), organizational
features, especially teaching teams, curriculum, assessment, and instructional
practices (such as advisory) that attend to social, personal, and nonacademic
learning of young adolescents in order to advance their academic learning.
● educators prepared to be responsive either through teacher preparation and
professional development
Scholar 2 ● curriculum responsive to the needs and interests of young adolescents
● teachers who understand and appreciate the wide range of individual
differences in the age group
● school day organized to support inquiry, socialization, health, exercise
● support services for the full range of life needs of the age group (guidance,
healthcare)
● advocacy for young adolescents
Scholar 3 ● educators committed to young adolescents
● high expectations for all
● advisory: advocacy for every student
● school, family, community partnerships
● a positive school climate
● curriculum that is challenging, integrated, and exploratory
● variety of teaching and learning approaches
● assessment and evaluation which promotes learning
● flexible organizational structures
● programs and policies that foster health, wellness, and safety
● comprehensive guidance and support systems
Note. Panelists were asked to list the key features of the middle school concept, as implemented
within the context of standards and accountability.
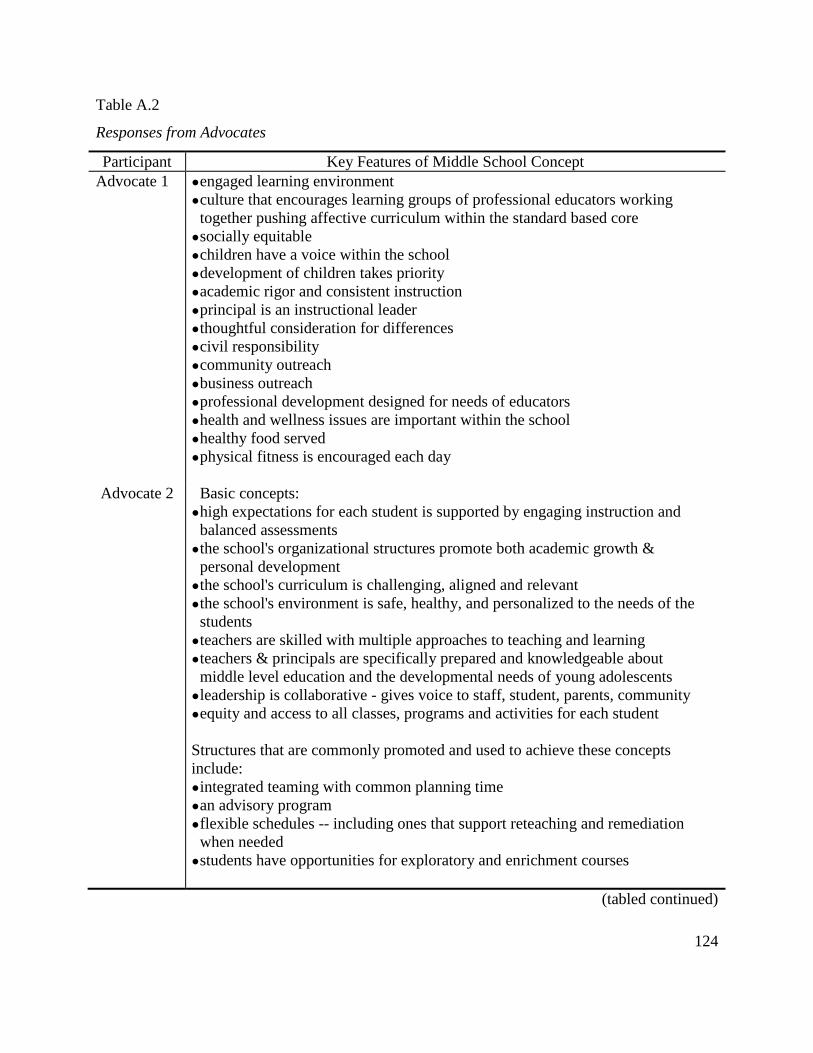
124
Table A.2
Responses from Advocates
Participant Key Features of Middle School Concept
Advocate 1 ● engaged learning environment
● culture that encourages learning groups of professional educators working
together pushing affective curriculum within the standard based core
● socially equitable
● children have a voice within the school
● development of children takes priority
● academic rigor and consistent instruction
● principal is an instructional leader
● thoughtful consideration for differences
● civil responsibility
● community outreach
● business outreach
● professional development designed for needs of educators
● health and wellness issues are important within the school
● healthy food served
● physical fitness is encouraged each day
Advocate 2 Basic concepts:
● high expectations for each student is supported by engaging instruction and
balanced assessments
● the school's organizational structures promote both academic growth &
personal development
● the school's curriculum is challenging, aligned and relevant
● the school's environment is safe, healthy, and personalized to the needs of the
students
● teachers are skilled with multiple approaches to teaching and learning
● teachers & principals are specifically prepared and knowledgeable about
middle level education and the developmental needs of young adolescents
● leadership is collaborative - gives voice to staff, student, parents, community
● equity and access to all classes, programs and activities for each student
Structures that are commonly promoted and used to achieve these concepts
include:
● integrated teaming with common planning time
● an advisory program
● flexible schedules -- including ones that support reteaching and remediation
when needed
● students have opportunities for exploratory and enrichment courses
(tabled continued)
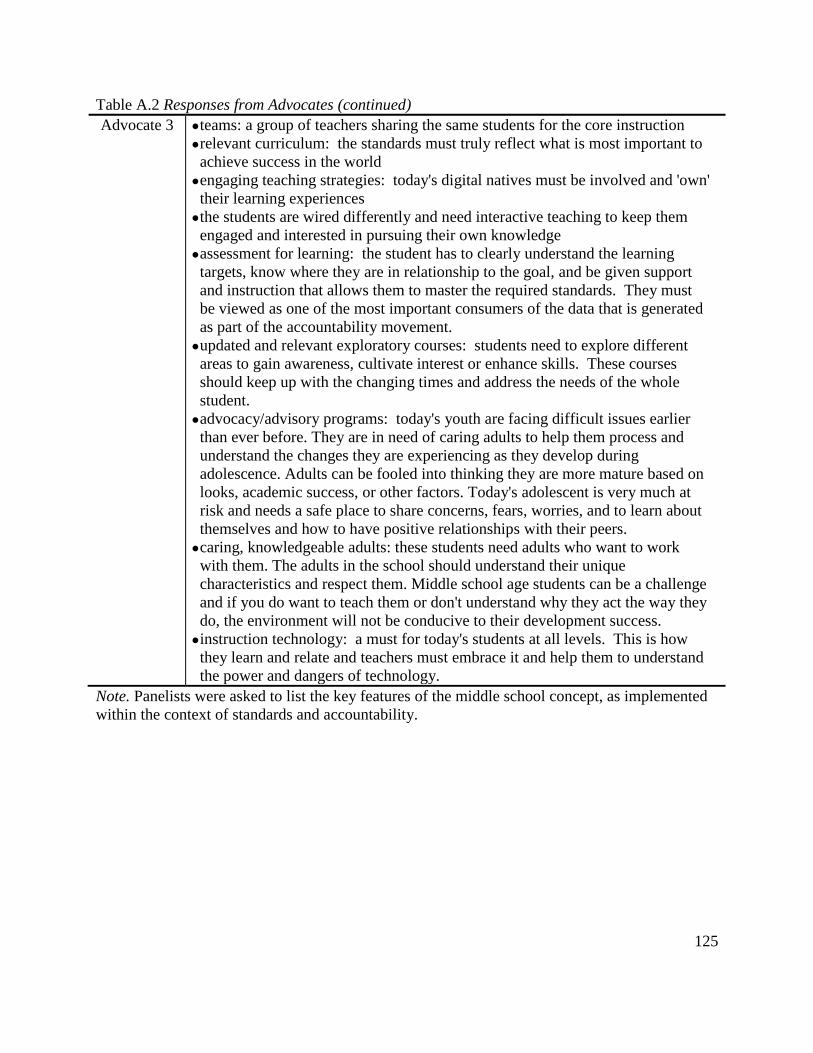
125
Table A.2 Responses from Advocates (continued)
Advocate 3 ● teams: a group of teachers sharing the same students for the core instruction
● relevant curriculum: the standards must truly reflect what is most important to
achieve success in the world
● engaging teaching strategies: today's digital natives must be involved and 'own'
their learning experiences
● the students are wired differently and need interactive teaching to keep them
engaged and interested in pursuing their own knowledge
● assessment for learning: the student has to clearly understand the learning
targets, know where they are in relationship to the goal, and be given support
and instruction that allows them to master the required standards. They must
be viewed as one of the most important consumers of the data that is generated
as part of the accountability movement.
● updated and relevant exploratory courses: students need to explore different
areas to gain awareness, cultivate interest or enhance skills. These courses
should keep up with the changing times and address the needs of the whole
student.
● advocacy/advisory programs: today's youth are facing difficult issues earlier
than ever before. They are in need of caring adults to help them process and
understand the changes they are experiencing as they develop during
adolescence. Adults can be fooled into thinking they are more mature based on
looks, academic success, or other factors. Today's adolescent is very much at
risk and needs a safe place to share concerns, fears, worries, and to learn about
themselves and how to have positive relationships with their peers.
● caring, knowledgeable adults: these students need adults who want to work
with them. The adults in the school should understand their unique
characteristics and respect them. Middle school age students can be a challenge
and if you do want to teach them or don't understand why they act the way they
do, the environment will not be conducive to their development success.
● instruction technology: a must for today's students at all levels. This is how
they learn and relate and teachers must embrace it and help them to understand
the power and dangers of technology.
Note. Panelists were asked to list the key features of the middle school concept, as implemented
within the context of standards and accountability.
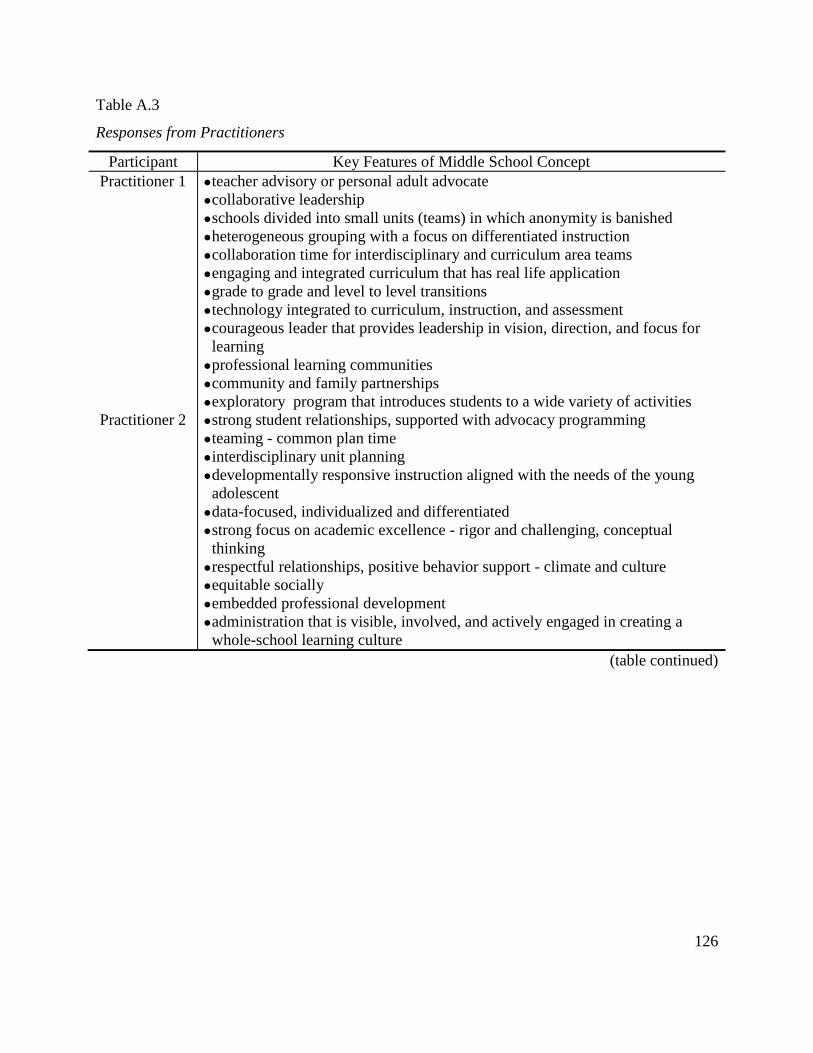
126
Table A.3
Responses from Practitioners
Participant Key Features of Middle School Concept
Practitioner 1 ● teacher advisory or personal adult advocate
● collaborative leadership
● schools divided into small units (teams) in which anonymity is banished
● heterogeneous grouping with a focus on differentiated instruction
● collaboration time for interdisciplinary and curriculum area teams
● engaging and integrated curriculum that has real life application
● grade to grade and level to level transitions
● technology integrated to curriculum, instruction, and assessment
● courageous leader that provides leadership in vision, direction, and focus for
learning
● professional learning communities
● community and family partnerships
● exploratory program that introduces students to a wide variety of activities
Practitioner 2 ● strong student relationships, supported with advocacy programming
● teaming - common plan time
● interdisciplinary unit planning
● developmentally responsive instruction aligned with the needs of the young
adolescent
● data-focused, individualized and differentiated
● strong focus on academic excellence - rigor and challenging, conceptual
thinking
● respectful relationships, positive behavior support - climate and culture
● equitable socially
● embedded professional development
● administration that is visible, involved, and actively engaged in creating a
whole-school learning culture
(table continued)
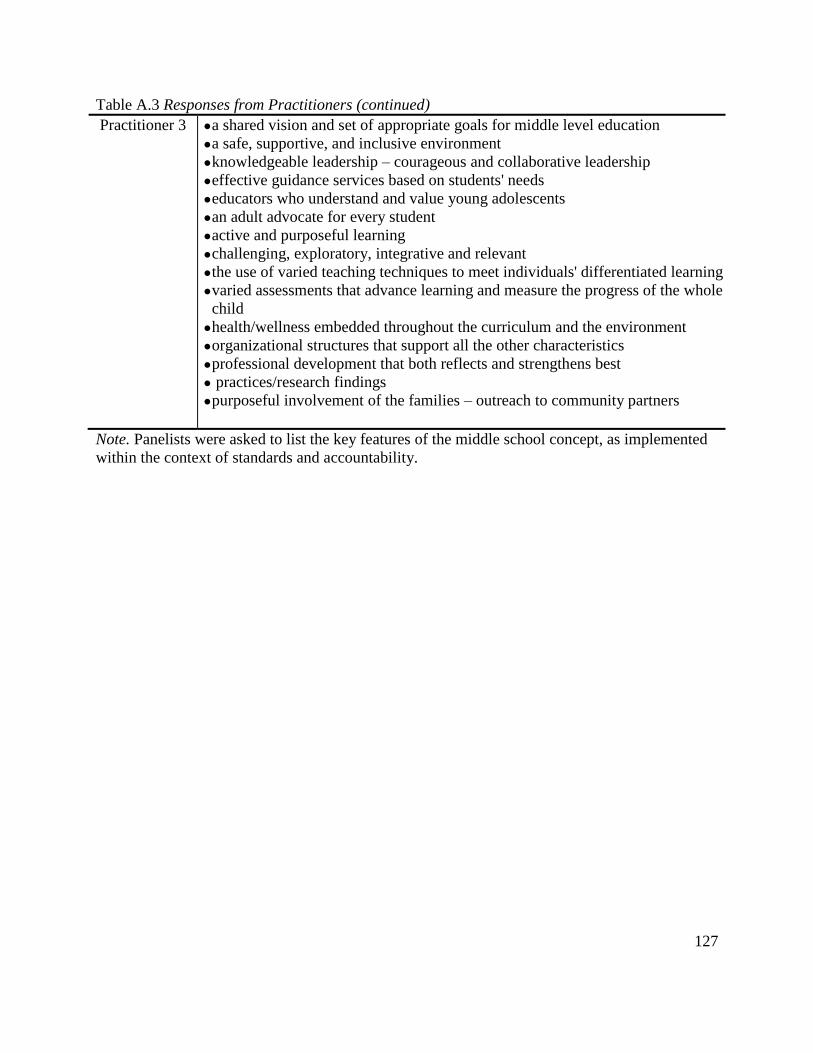
127
Table A.3 Responses from Practitioners (continued)
Practitioner 3 ● a shared vision and set of appropriate goals for middle level education
● a safe, supportive, and inclusive environment
● knowledgeable leadership – courageous and collaborative leadership
● effective guidance services based on students' needs
● educators who understand and value young adolescents
● an adult advocate for every student
● active and purposeful learning
● challenging, exploratory, integrative and relevant
● the use of varied teaching techniques to meet individuals' differentiated learning
● varied assessments that advance learning and measure the progress of the whole
child
● health/wellness embedded throughout the curriculum and the environment
● organizational structures that support all the other characteristics
● professional development that both reflects and strengthens best
● practices/research findings
● purposeful involvement of the families – outreach to community partners
Note. Panelists were asked to list the key features of the middle school concept, as implemented
within the context of standards and accountability.
128
APPENDIX B
TESTING THE IC MAP AT PILOT SCHOOL 1
Description of the School
Pilot School 1 was one of two schools serving the middle grades in a rural school
division. Both schools had a 6-8 grade configuration and fed one central high school. Pilot
School 1 was a relatively small school with a student enrollment of between 300 and 400
students. The current school building formerly housed a high school, and the building was slated
for renovation in the next few years. The school had a principal, an assistant principal, and two
guidance counselors.
Procedures
I visited Pilot School 1 on two regular school days: November 28 and December 1, 2011.
The primary means of collecting data to evaluate the features on the IC map were walkthrough
classroom observations, a review of documents and artifacts, and interviews with school staff.
The staff had been informed in advance of my visit, and I was permitted to visit classes and had
relatively free access to the building.
I conducted a total of 15 classroom walkthrough observations in classes representing all
three grade levels and various content areas. Classroom walkthrough observations lasted
approximately four to seven minutes each. During the observations, I took field notes relative to
the specifics on the IC map that require walkthrough observations for evidence.
I asked the principal for the documents indicated by the IC map, and he provided all the
documents that were available. Some documents were available online on the website for the
school division or on the school website. I accessed the documents that were available online
after the days of the visit to the school.
Individual interviews with staff members were conducted on both days of the school
visit. I interviewed 11 teachers, representing core subjects as well as electives. Participants were
selected by the principal. Each teacher was asked questions from one section of the IC map; in
some cases, questions from a second section were included. A guidance counselor and the
principal were also interviewed. Interviews were conducted in a private office to protect
confidentiality. After arriving to the designated meeting place, participants were fully informed
129
of the purpose, procedures, benefits, and risks associated with the research and were given the
opportunity to consent or not consent to participation. Interviews lasted approximately 30
minutes each.
Comparison of Evidence to the IC map
Evidence for Feature A1: The Curriculum is Rigorous and Challenging
Feature A1 evaluates the presence of identified components of a rigorous curriculum
within a school and the extent to which a rigorous curriculum is available to all students in the
school. Evidence of a rigorous and challenging curriculum at Pilot School 1 was collected
through walkthrough class observations, a review of the documents prescribed by the IC map,
and interviews with four teachers. These data indicated the presence of 30-60% of the
components of a rigorous curriculum at this school, which corresponded to Variation B for this
feature.
The components observed in classrooms included some 21st century skills, some
examples of high standards, some examples of high levels of student engagement, and some
displaying of exemplary student work. The Partnership for 21st Century Skills (2004) identifies
the aptitudes students need to develop for success in the 21st century economy. Among these
skills are global awareness, financial literacy, civic literacy, creativity, critical thinking and
problem solving, communication, collaboration, information and technology literacy,
responsibility, and initiative. Examples of 21st century skills observed in classes were critical
thinking activities in four of 15 classes, collaboration in two of 15 classes, and communication
skill building in two of 15 classes. High standards were evident in six of 15 classes and high
levels of student engagement were observable in five of 15 classes. Exemplary student work was
displayed in two classes. In summary, components of a rigorous curriculum were evident in
approximately eight of the fifteen classes. Of the eight components of a rigorous curriculum
indicated on the IC map, four, or approximately 50%, were evident in the walkthrough classroom
observations conducted.
A review of key documents associated with Pilot School 1 revealed that there were no
advanced courses available at this school, thus suggesting that all students had relatively equal
access to any rigor offered. The documents also provided evidence of one additional component
of a rigorous curriculum and further examples of 21st skill building. Teacher lesson plans were
130
required to include an explanation of how each lesson would be differentiated to meet various
student needs as well as how technology would be integrated. A small sample of student
assessments was provided for review, but these were all traditional tests. Registration forms
verified the absence of advanced course offerings. The division did not have pacing guides and
samples of student work were not available for close evaluation.
Interviews with members of the school staff suggested that their definition of a rigorous
curriculum was somewhat consistent with the components of a rigorous curriculum listed on the
IC map. Teachers cited critical thinking, good assessments, differentiation, reading and writing
skills, and relevant learning as examples of rigor. The teachers interviewed had a common
agreement that the curriculum at this school was challenging for low and average students, but
that advanced students were not challenged enough.
Evidence for Feature A2: The Curriculum is Exploratory and Relevant
Feature A2 evaluates the extent to which the curriculum of a school allows students to
explore their interests. Evidence of an exploratory curriculum at Pilot School 1 was collected
through a review of the documents prescribed by the IC map and interviews with four teachers.
These data indicated that both exploratory classes and extracurricular activities were offered at
this school, which corresponded to Variation B for this feature.
A review of key documents associated with Pilot School 1 revealed that a wide variety of
exploratory classes were available to students. Course registration forms indicated that elective
courses were available in art, music, technology, family and consumer sciences, and business.
The master schedule of the school showed that world languages and drama were also options for
students. The school website provided information about extracurricular activities at this school,
although the IC map did not include the school website as a suggested source of this information.
There was no indication on teacher lesson plans of activities relating the core curriculum to
student interests.
Interviews with members of the school staff confirmed that exploratory classes were
offered to students as well as extracurricular activities. Extracurricular activities included
athletics, media club, pep club, SCA, Destination Imagination, robotics, and a popular after-
school program called NEXT. The NEXT program was funded by a grant and provided the
opportunity for students to experience a variety of topics. When asked how learning in the core
131
classes was made relevant to students, teachers responded that there was not sufficient time for
learning beyond the Standards of Learning.
Evidence for Feature A3: The Curriculum is Integrative and Interdisciplinary
Feature A3 evaluates the extent to which the curriculum of the school is interdisciplinary.
Evidence of a rigorous and challenging curriculum at Pilot School 1 was collected through a
review of the documents prescribed by the IC map and interviews with four teachers. These data
indicated there were no interdisciplinary themes within grade level teams and the curriculum was
not integrated in any coordinated manner. Some interdisciplinary skills such as reading and
writing, however, were incorporated within the various content areas. None of the variations for
Feature A3 adequately corresponded to the manner in which interdisciplinary learning occurs at
Pilot School 1.
A review of key documents associated with Pilot School 1 indicated few opportunities for
interdisciplinary learning. No evidence of interdisciplinary learning was found in teacher lesson
plans. Displays of student work showed that reading and writing skills were emphasized in
classes other than English. The school website did not display any information indicating
integrated learning in classes. The website did, nonetheless, mention that the school had hosted
two assemblies that exposed students to cultures, music, history, and dance. Class websites were
not available for review.
Interviews with members of the school staff confirmed that there were no
interdisciplinary themes or activities around which learning revolved. Teachers cited several
examples in which skills were connected among content areas. Examples included cooperation
between English teachers and science teachers to help students write research papers for science
fair projects. Teachers reported that there were natural connections among content areas, but
interdisciplinary activities were not intentionally planned.
Evidence for Feature A4: Instructional Strategies are Varied and Aligned to Standards
Feature A4 evaluates the extent to which instructional strategies are varied and aligned to
standards. Evidence of instructional strategies at Pilot School 1 was collected through
walkthrough classroom observations, a review of the documents prescribed by the IC map, and
interviews with four teachers. These data indicated instructional strategies were aligned to
standards and teachers collaborated to employ a variety of data-informed instructional strategies.

132
The use of a variety of strategies was observed in approximately 30% of classes, corresponding
with Variation B for this feature.
Walkthrough classroom observations indicated that instruction was aligned to standards
and there was some variation in instructional strategies employed. Strategies included the use of
technology such as interactive whiteboards, cooperative learning, guided practice, modeling,
checking for understanding, and sorting. In most classes, though, there was little variation within
the time of the observation. In only 30% of classes visited did the teacher use multiple strategies.
A review of key documents associated with Pilot School 1 provided evidence of some
variety in the use of instructional strategies. Teacher lesson plans were the most informative and
listed strategies to be used. There was no evidence of a variety of instructional strategies in the
sample team meeting notes provided.
Interviews with members of the school staff confirmed that instructional strategies were
aligned to standards and teachers collaborated to include a variety of strategies. Teachers
reported using graphic organizers, research-based strategies, and technology. Teachers confirmed
that they were required to use the results of benchmark testing to adjust instruction and that
collaboration occurred by content area.
133
Evidence for Feature A5: Active Learning
Feature A5 evaluates the extent to which teachers and students engage in active learning
activities. The descriptors for this feature on the IC map also include the use of higher order
thinking activities. Evidence of active learning strategies at Pilot School 1 was collected through
walkthrough classroom observations and interviews with four teachers. These data indicated only
a minimal use of active learning strategies in classes at this school. The use of a variety of
strategies was observed in approximately 20% of classes, corresponding with Variation C for this
feature.
Walkthrough classroom observations indicated that, in the majority of classes, students
spent most of the instructional time seated and not challenged with higher order thinking
activities. Of 15 classroom observations, all students were seated; no activities that prompted
students to move physically were observed. Critical thinking was observed in three of the
classes. Thus in only 20% of classes visited were students engaged in active learning strategies.
Interviews with members of the school staff confirmed that active learning strategies
were not a priority for most teachers. The teachers interviewed reported that there was “too much
to be done” and structure was highly valued. When asked how many teachers in the school
encourage movement in class, the interviewed teachers responded with estimates of 15% to 30%.
Evidence for Feature A6: Students Demonstrate Mastery of Standards in a Variety of
Ways
Feature A6 evaluates the extent to which master of standards is measured using a variety
of assessments. Evidence of assessments at Pilot School 1 was collected through a review of the
documents prescribed by the IC map and interviews with four teachers. These data indicated that
there was some variety of assessments used at this school, but assessments other than traditional
tests may have been limited to certain teachers or certain content areas. Traditional tests
accounted for over 75% of assessments, corresponding with Variation C for this feature.
A review of key documents associated with Pilot School 1 provided evidence of the type
of assessments used in to measure learning. Teacher lesson plans indicated the use of traditional
tests and the use writing assignments. Of the assessments made available for review, all were
traditional tests. Several examples of displays of student work were observed in classrooms and
134
hallways. All of these displays were of student projects or writing assignments. There was no
evidence on the school website of assessments and class websites were not available.
Interviews with members of the school staff indicated that students at this school were assessed
primarily through traditional tests, either paper/pencil or online. A science teacher reported that
she assigned one project per nine weeks. Teachers reported that there had been a clear focus on
multiple choice tests in the past, but they were now encouraged to include more open-ended
questions on assessments. When asked what percentage of assessments at this school were
traditional tests, the most common response was around 75%.
Evidence for Feature B1: An Advisory or Advocacy System Ensures that Every Student Is
Known Well By At Least One Adult
Feature B1 evaluates the presence of a student advisory program or other advocacy
system via which every student in the school is well known by at least one adult. Evidence of an
advisory or advocacy program at Pilot School 1 was collected through a review of the documents
prescribed by the IC map and interviews with three teachers and a guidance counselor. These
data indicated that there was no student advisory or advocacy system in place at this school.
Nevertheless, the staff believed that every student was well known due to the prevailing culture
and small size of the school. The culture of caring about students in the absence of structured
personalization of the school environment most closely corresponded to Variation C for this
feature.
A review of key documents associated with Pilot School 1 provided no evidence of a
student advisory or advocacy program. There was no evidence of time designated for student
advisory on the master schedule. Sample meeting notes from a grade level team meeting
indicated that teachers did spend time discussing and responding to individual student needs. The
team process in a school with fewer than 400 students seemed to contribute to the ability of the
staff to know students well.
Interviews with members of the school staff confirmed the absence of a structured
student advisory or advocacy program. Teachers reported, nevertheless, that every student was
well known by at least one adult staff member. When asked how the school ensures that every
student was known, the teachers and counselor reported that small classes, teachers teaching
135
multiple grade levels, grade level teams, Response to Intervention, and the school culture were
key factors.
Evidence for Feature B2: Comprehensive Guidance and Support Services Promote Whole-
Student Development.
Feature B2 evaluates the provision of a comprehensive program of school counseling
services. Evidence of comprehensive school counseling services at Pilot School 1 was collected
through a review of the documents prescribed by the IC map and interviews with three teachers
and a guidance counselor. These data indicated that this school offered a comprehensive program
of school counseling services, corresponding to Variation A for this feature.
A review of key documents associated with Pilot School 1 provided evidence that the
school counseling program was multi faceted and adhered to state guidelines. The school website
was the most useful source of data for this feature. Among the services described were classroom
guidance activities, group counseling, individual counseling, career planning, testing, exploration
of interests, social and emotional support, and parent resources such as books and DVDs
available for checkout. The master schedule provided no evidence and may not be a relevant
source of information for this feature.
Interviews with members of the school staff confirmed the availability of comprehensive
school counseling services. Teachers reported that students were permitted to sign up for
individual counseling appointments, counselors collaborate with teachers to promote academic
success, and mental health day treatment services were available on site. One teacher reported
that she was “very impressed” with the counseling services offered at the school.
Evidence for Feature B3: Students Learn in a Healthy and Safe School Environment
Feature B3 evaluates the extent to which the school provides a healthy and safe school
environment for students. Evidence of a healthy and safe school environment at Pilot School 1
was collected through walkthrough classroom observations, a review of the documents
prescribed by the IC map and interviews with three teachers and a guidance counselor. These
data indicated that the school provided a healthy and safe environment for students, with at least
three of four components for this feature clearly in place. The evidence best corresponded to
Variation B for this feature.
136
Walkthrough classroom observations provided evidence of a healthy and safe
environment for students. Of 15 classrooms visited, physical safety was evident in all classes and
a healthy affective environment was evident in 13 of the classes. Classes were conducted in an
orderly manner and students were generally compliant with teacher directions. In two of the
classes, the students were physically safe, but the affective environment seemed poor. In one
class, for example, the teacher was outwardly pleasant with the students, but her tone seemed
somewhat condescending which contributed to a high level of tension in the class.
A review of key documents associated with Pilot School 1 provided evidence that the school
provided a healthy and safe environment for students. The master schedule listed physical
education classes for all three grade levels and classes met daily. Crime and violence data
available on the state Department of Education website indicated that the school was not
persistently dangerous. The school crisis plan was available for review and described detailed
procedures covering various scenarios. There was no indication of how the plan was evaluated.
A copy of the safety drill record was available and was current. The policy manual for the school
division indicated that there was no division policy related to wellness; however, there were no
vending machines available to students. A visual tour of the school building indicated that the
building was physically safe, but I noted that exterior doors were not locked during the school
day even though they were not visible from the office.
Interviews with members of the school staff confirmed that the school provided a healthy
and safe environment for students. Teachers reported that each teacher had a crisis bag in her
classroom and that drills were practiced regularly. One teacher reported that the crisis plan was
originally developed by a committee and had been updated annually. Teachers reported that
students engaged in daily physical activity, primarily through physical education classes.
Teachers believed that the school environment was warm and friendly. The building may not
have been secure due to its age, but the surrounding community was considered to be safe. The
guidance counselor further noted that student behavior had improved at the school in the past
few years which she attributed to the effective discipline administered by the principal.
137
Evidence for Feature B4: Students are Organized into Small(er) Learning Communities
Feature B4 evaluates the manner in which the school environment is personalized by
organizing students into smaller communities. Evidence of smaller learning communities at Pilot
School 1 was collected through a review of the documents prescribed by the IC map and
interviews with three teachers and a guidance counselor. These data indicated that the school had
a student enrollment of less than 400 and a common set of teachers advocated for student needs.
The size of the school and the presence of grade level teams corresponded to Variation B for this
feature.
A review of key documents associated with Pilot School 1 indicated that the school had a
small enrollment and grade level teachers met regularly to respond to student needs. The school
report card available on the state Department of Education website confirmed that the school had
a steady enrollment of fewer than 400 students. The master schedule indicated that teachers in
each grade level had a common plan time available for meetings. The master schedule also
included remediation groups that may have contributed to the personalization of the school
environment. Sample meeting notes from grade level team meetings indicated that the teams met
regularly and discussed individual student needs.
Interviews with members of the school staff confirmed that students were not organized
into smaller communities due to the small size of the school. Teachers reported that grade level
teams met once per week. Teams coordinated personalization activities such as the 100% Club in
sixth grade and the recognition of student birthdays on the morning announcements.
Evidence for Feature C1: School Rules are Clear, Fair, and Consistently Applied
Feature C1 evaluates the extent to which school rules are clear, fair, and consistently
applied among students. Evidence of clear and consistently applied school rules at Pilot School
1 was collected through a review of the documents prescribed by the IC map and interviews with
three teachers and a guidance counselor. These data indicated that school rules were clear, fair,
and consistently applied among students, corresponding to Variation A for this feature.
A review of key documents associated with Pilot School 1 provided evidence that school
rules were clearly communicated. The best source of information available was the student
handbook. The student handbook clearly stated rules for the school and included a listing of
possible consequences. A sample edition of the school newsletter made reference to the 100%
138
Club which rewarded students with good behavior and attendance. The school website provided
no evidence regarding school rules. Data that might have provided evidence of possible disparity
of application among subgroups were not available.
Interviews with members of the school staff indicated that school rules were clearly
communicated and fairly and consistently applied. Teachers reported that rules were reviewed at
orientation sessions and in classes. Rules were posted in classrooms. The teachers and counselor
reported that rules were fairly and consistently applied among students. Each grade level team
had a high degree of autonomy in setting team rules and enforcing them.
Evidence for Feature C2: All Students, Including All Social, Economic, and Ethnic Groups,
Have Open and Equal Access to Challenging Learning Opportunities
Feature C2 evaluates the extent to which all students, including various subgroups, have
open and equal access to challenging learning opportunities. Evidence of equal access to
challenging learning opportunities at Pilot School 1 was collected through walkthrough
classroom observations, a review of the documents prescribed by the IC map and interviews with
three teachers and a guidance counselor. These data indicated that students had open and equal
access to challenging learning opportunities, corresponding to Variation A for this feature.
Walkthrough classroom observations proved to not be a useful source of data for this
feature. Since no advanced classes were offered at this school, all students were grouped
heterogeneously in classes. Equitable access to advanced classes, therefore, was not a factor at
this school.
A review of key documents associated with Pilot School 1 provided evidence of equal
access to challenging opportunities. Course registration forms indicated that all students had
equal access to the same program since no advanced classes were available on the forms. The
master schedule confirmed that no advanced classes were on the schedule other than algebra.
Interviews with members of the school staff confirmed that all students had open and
equal access to challenging opportunities. The teachers and counselor reported that there were no
advanced classes other than algebra. The counselor reported that teachers make
recommendations regarding which students should enroll in algebra, but students and parents had
the opportunity to make their own decision. The teachers and counselor reported that students
often had choices among assignments to account for different needs and resources and there was
139
abundant support to help students with academic and financial needs. Each grade level team
hosted a dance to raise money for different needs, including field trip assistance for needy
students.
Evidence for Feature C3: To the Fullest Extent Possible, All Students Participate in
Heterogeneous Classes with High Academic and Behavioral Expectations
Feature C3 evaluates the extent to which students participate in heterogeneous classes
with high academic and behavior expectations. Evidence of heterogeneous grouping at Pilot
School 1 was collected through a review of the documents prescribed by the IC map and
interviews with three teachers and a guidance counselor. These data indicated that students were
grouped heterogeneously with some informal grouping of advanced students done by the school.
The grouping practices at this school do not correspond to any of the variations for Feature C3.
A review of key documents associated with Pilot School 1 provided evidence that
students were grouped heterogeneously. Course registration forms indicated that there were no
advanced classes offered other than algebra; therefore, all students were grouped
heterogeneously in almost all classes. The master schedule confirmed that no advanced classes
were scheduled. The policy manual for the school division included a statement that student
grouping should remain flexible.
Interviews with members of the school staff confirmed that students were generally
grouped heterogeneously, although there was some internal grouping of advanced students.
During the course of the interviews, teachers consistently lamented the lack of advanced classes
because they feared that advanced students were not being challenged enough in the
homogeneous classes. They viewed the possible addition of advanced classes as a step in the
right direction for their school.
Evidence for Feature C4: All Students Have Ongoing Opportunities to Learn About Their
Own and Others' Cultures; Diversity is Valued by the School
Feature C4 evaluates the extent to which diversity is valued by the school and students
have the opportunity to learn about various cultures. Evidence of diversity at Pilot School 1 was
collected through a review of the documents prescribed by the IC map and interviews with three
teachers and a guidance counselor. These data indicated that the student population and staff of
this school had very little diversity. Tolerance of different cultures was not believed to be a
140
problem for the school, but was addressed sporadically as a school and in individual classes. The
school most closely corresponded to Variation B for this feature.
A review of key documents associated with Pilot School 1 provided evidence teaching
about diversity was not a priority for this school, although diversity was addressed in some
manner. The school website included a note of appreciation for the local education foundation
for helping to fund two programs that fostered diversity. One was a magazine subscription called
Music Alive that featured various musical genres. The other was an assembly called World Beat
Workshop that exposed students to dance and music from all over the world. There was no
evidence of an emphasis on diversity included in the student handbook. There was a display of
student artwork in the hallway, depicting the PTA Reflections contest theme of “diversity
means.” Students in one class completed a project for which they identified points of diversity
within the community.
Interviews with members of the school staff confirmed that the student body had very
little ethnic, religious, or socioeconomic diversity. Emphasizing diversity was not a priority for
the school, although teachers were able to identify specific activities that helped students
appreciate diversity. Examples of such activities included the Women in Technology and
Science program, tutoring services offered by students at two nearby colleges, the afterschool
NEXT program, and world languages classes.
Evidence for Feature D1: Teachers are Organized in Teams with Common Plan Time
Feature D1 evaluates whether or not teachers are organized into interdisciplinary teams
with common plan time and common students. Evidence of teacher teams with common plan
time at Pilot School 1 was collected through a review of the documents prescribed by the IC map
and interviews with two teachers and the principal. These data indicated that teachers were
organized into one grade level team with common plan time, corresponding to Variation A for
this feature.
A review of key documents associated with Pilot School 1 provided evidence of teacher
teams with common plan time. The master schedule showed that core teachers in each grade
level had the same class periods available for common planning.
141
Interviews with members of the school staff confirmed that core teachers in each grade
had a common plan time. The teachers and the principal reported that teacher teams were
required to meet weekly.
Evidence for Feature D2: Teachers Have Plan Time to Coordinate Transitions Between
Grade Levels and Schools
Feature D2 evaluates teacher involvement in the planning of activities to help students
transition from elementary school to middle school. Evidence of teacher involvement in planning
transition activities at Pilot School 1 was collected through a review of the documents prescribed
by the IC map and interviews with two teachers, the principal, and a guidance counselor. These
data indicated that teacher teams were involved in planning transition activities for students,
corresponding to Variation B for this feature.
A review of key documents associated with Pilot School 1 provided no evidence of
teacher involvement in transition planning. The documents and artifacts prescribed by the IC
map were not useful sources of information. Sample team meeting notes indicated that teachers
did not discuss transition planning at the meetings included in the sample, though it is likely that
transition planning would only be discussed at particular times of the school year. A separate
listing of transition activities was not available.
Interviews with members of the school staff indicated that teacher teams were involved in
transition planning. Teachers reported that teacher teams worked with counselors to plan for a
sixth grade picnic, sign planners, and prepare for orientation. The principal and the counselor
reported that teachers were involved in articulating reading and writing portfolios, giving tours,
and visiting with students at the elementary schools.
Evidence for Feature D3: Organizational Structures, Including Planned Time for
Collaboration, Foster Purposeful Learning and Meaningful Relationships
Feature D3 evaluates the extent to which structures within the school foster purposeful
and meaningful relationships. Such structures may include the master schedule of classes, the use
of physical space, clustering, co-curricular and extracurricular activities, small communities of
students, and purposeful outreach to special populations of students. Evidence of these six
components at Pilot School 1 was collected through observation and a review of the documents
prescribed by the IC map. These data indicated that all six structural components were in place to
142
foster purposeful and meaningful relationships at this school, corresponding to Variation A for
this feature.
Observation and a review of key documents associated with Pilot School 1 provided
evidence of structures that fostered purposeful and meaningful relationships. Grade levels were
clustered together by hallways and floors of the building. The master schedule indicated that
graded level teachers had common plan time and remediation support programs were available to
intervene with special populations. The school website listed opportunities for students to
participate on athletic teams and afterschool programs. The guidance website included resources
to reach out to parents. The student handbook listed extracurricular activities available to
students. The school improvement plan was not available.
143
Evidence for Feature D4: Teachers are Empowered to Implement Flexible Scheduling to
Promote Learning
Feature D4 evaluates the autonomy teachers have to group students as needed to improve
learning. Evidence of teacher autonomy to implement flexible grouping at Pilot School 1 was
collected through a review of the documents prescribed by the IC map and interviews with two
teachers and the principal. These data indicated that there were no real barriers to implementing
flexible grouping but flexible grouping was practiced rarely, if at all. Flexible grouping would
have been supported by the principal if teachers wanted to implement this practice. The
descriptors of the variations for Feature D4 did not account for this scenario.
A review of key documents associated with Pilot School 1 provided no evidence of
flexible grouping. Sample meeting notes from grade level meetings did not indicate that flexible
grouping was part of current practice.
Interviews with members of the school staff indicated that teachers did not currently
employ flexible grouping strategies. The teachers and the principal reported that teachers would
have needed to seek approval from the principal to implement flexible grouping, but all agreed
that the principal would have been very open to the idea.
Evidence for Feature D5: Leaders are Knowledgeable About and Committed to Working
with this Age Group
Feature D5 evaluates preparation and commitment level of the principal to working with
students in the middle grades. Evidence of the principal’s preparation and commitment to
working with young adolescents at Pilot School 1 was collected through an interview with the
principal. These data indicated that the principal was experienced in working with young
adolescents and enjoyed working with students this age, but did not engage in professional
development activities specific to the middle grades. This level of preparation and commitment
most closely corresponded to Variation B for this feature.
An interview with the principal and observation of his interactions with students
indicated that he was experienced in working with students in the middle grades and enjoyed
working with them. The principal interacted freely and comfortably with individual students,
calling many of them by name. The principal previously taught at the middle school level for six
years, was a high school assistant principal for one year, a middle school assistant principal for

144
two years, and had been principal of Pilot School 1 for five years. The principal believed that it
was important to teach character development to students at this age and affirmed the value of
teaming practices. The principal was not active in middle grades organizations, but was pursuing
his doctorate in educational leadership with the goal of working in school division
administration. He reported that he was happy in his current position but was open to new
opportunities at other levels.
Evidence for Feature D6: Teachers are Knowledgeable About and Committed to Working
with this Age Group
Feature D6 evaluates the preparation and commitment of teachers in the school to
working with students in the middle grades. Evidence of the preparation and commitment of
teachers to working with young adolescents at Pilot School 1 was collected through walkthrough
observations of classes, a review of teacher licensure status for teachers at the school and
interviews with two teachers, the principal, and a guidance counselor. These data indicated that
most teachers were prepared and committed to working with students in the middle grades,
corresponding to Variation B for this feature.
Walkthrough classroom observations provided evidence that most teachers seemed to
enjoy working with young adolescents, though they may not have consistently employed best
practice strategies for this age group such as active learning, critical thinking, and collaboration.
Of 15 classes observed, 13 of the teachers were pleasant with the students and had a positive
rapport. Two of the teachers were negative and did not seem to have a good rapport with
students. Appropriate middle school practices such as articulating clear expectations and
allowing for choice were evident in five of the classes.
The status of teacher licensure for teachers at this school was available on the website of
the state Department of Education. Since the school was small, licensure information was
reviewed for all core teachers. For this school, 57% of teachers had a middle school
endorsement, 36% had a secondary subject area endorsement, and 7% had an elementary
endorsement.
Interviews with members of the school staff confirmed that most teachers enjoyed
working with students in the middle grades. Responses from teachers indicated that positive
attitudes toward students may have been a problem in the past. One teacher commented that the
145
teachers who did not want to be here had been “weeded out”. Another teacher commented that
“teachers are great instructionally but need more relationship building”. Both teachers affirmed,
however, that most teachers were positive toward their students. The counselor reported that
most teachers enjoyed their work but some did not relate well.
Evidence for Feature D7: Students Have Opportunities to Participate in Decision Making
Feature D7 evaluates the extent to which students have the opportunity to participate in
decision making at the school. Evidence of student participation in decision making at Pilot
School 1 was collected through interviews with two teachers and the principal. These data
indicated that students had the opportunity to exercise leadership in student organizations and
classes, but there was no formal mechanism in place to invite student participation. This level of
student involvement in decision making corresponded to Variation B for this feature.
Interviews with members of the school staff provided evidence that students exercised leadership
within school organizations, generally felt comfortable in making suggestions informally, but
there were no formal mechanisms in place for student input. Teachers reported that SCA and
other clubs offered opportunities for student leadership. In class, students were sometimes
assigned different leadership roles when doing group activities. One teacher reported that gifted
plans were developed with student input. The principal reported that most students felt
comfortable talking with administrators if they had ideas or suggestions.
Evidence for Feature D8: Decision Making is Democratic and Guided by a Shared Vision
Feature D8 evaluates the extent to which decision making at the school is shared and is
guided by a shared vision. Evidence of shared decision making at Pilot School 1 was collected
through a review of the documents prescribed by the IC map and interviews with two teachers,
the principal, and a guidance counselor. These data indicated that the staff generally shared a
common vision for the school and that staff input into decision making was invited. Teacher
teams had some autonomy in decision making. This level of shared decision making
corresponded to Variation B for this feature.
A review of key documents associated with Pilot School 1 provided little evidence of
shared decision making or an articulated school vision. No evidence was found on the school
website. Sample meeting notes of team meetings indicated some decision making exercised by
146
teachers on behalf of their students. The student handbook contained a mission statement,
philosophy, and objectives, but these seemed to be division objective rather than school specific.
Interviews with members of the school staff indicated that there was no articulated vision
for the school, although there seemed to be an informal vision common to many staff members
that included the idea of being recognized for the good quality programs offered to students at
the school. The teachers, counselor, and principal all agreed that major decisions were ultimately
made by the principal, but input from staff was welcomed. Many decisions about student
discipline were made by teachers at the team level and the principal was supportive.
Evidence for Feature D9: Leadership is Courageous and Collaborative
Feature D9 evaluates the extent to which school leadership is courageous and
collaborative. Evidence of courageous and collaborative leadership at Pilot School 1 was
collected through interviews with two teachers, the principal, and a guidance counselor. The
school improvement plan indicated for this feature by the IC map was not available. These data
indicated that leadership at this school was ethical, inspiring, and shared. Decision making was
shared and teachers were encouraged to take risks. This leadership style corresponded to
Variation A for this feature.
Interviews with members of the school staff indicated that the principal of this school was
a courageous leader who invited collaboration. Teachers characterized the principal’s leadership
style as supportive. One teacher commented that the principal gave direction but also “supports
our decision making”. The counselor reported that the principal was strong and clear, but
“teachers do not feel unempowered”.
Evidence for Feature D10: Professional Development is Aligned to School Improvement
and Best-Practice Strategies
Feature D10 evaluates the extent to which professional development is aligned to school
improvement goals. Evidence of the alignment of professional development at Pilot School 1
was collected through interviews with two teachers and the principal. Documents prescribed by
the IC map such as the school improvement plan and the professional development plan were not
available. Interview data indicate that professional development was aligned to school
improvement but there was no evidence that professional development was job embedded and
there was little information available describing the development of the school improvement
147
plan. Professional development practices seemed to most closely correspond to Variation B for
this feature.
Interviews with members of the school staff indicated that professional development
needs were identified primarily from SOL data. Professional development was provided through
speakers, presentations, and workshops and was largely district directed.
Evidence for Feature D11: Students Have the Opportunity to Engage with the Community
Feature D11 evaluates the extent to which students have the opportunity to engage with
the community. Such engagement may take the form of authentic learning experiences, service
learning, field trips, or fundraising for charity. Evidence of opportunities for students to engage
with the community at Pilot School 1 was collected through a review of the documents
prescribed by the IC map and interviews with two teachers and the principal. These data
indicated that students had multiple opportunities to engage with the community, corresponding
to Variation A for this feature.
A review of key documents associated with Pilot School 1 provided evidence of
opportunities for students to engage with the community. The school website referenced the
afterschool NEXT program for which students participate in projects on topics of varying
interests. The program facilitated by community grants and volunteers.
Interviews with members of the school staff indicated that students had multiple ways to
engage with the community. Teachers reported that students had the opportunity to participate in
the Model United Nations program through world history classes. Teachers also reported that
students participated in a service learning project through civics classes. The principal cited other
opportunities for authentic learning experiences including the Chesapeake Bay Foundation, a
watershed project at Lake Robertson, and the Trout in the Classroom program.
Evidence for Feature D12: The Community is Engaged in Providing Resources and
Support
Feature D12 evaluates the extent to which the community is engaged with the school by
providing resources and support. Evidence of community support at Pilot School 1 was collected
through a review of the documents prescribed by the IC map and interviews with the principal.
These data indicated that the community was highly engaged in providing resources and support
to the school, corresponding to Variation A for this feature.
148
A review of key documents associated with Pilot School 1 provided evidence of
community support of the school. The school website referenced the support of community grant
funds to help the school offer programs. The school newsletter described a project with
Chesapeake Bay Foundation, local education foundation support of a hydroponics project, and
fundraisers through Dominos and Papa Johns.
Interviews with the principal indicated multiple ways in which the community provided
support to the school. The principal cited grants awarded from the Boxerwood Foundation,
partnerships with local colleges, and YMCA parenting classes as examples.
Evidence for Feature D13: Relationships with Families are Valued in Support of Students'
Success
Feature D13 evaluates the extent to which relationships between the school and families
are valued. Evidence of the value placed on family relationships at Pilot School 1 was collected
through a review of the documents prescribed by the IC map and interviews with two teachers,
the principal, and a guidance counselor. These data indicated that relationships with families
were highly valued, corresponding to Variation B for this feature.
A review of key documents associated with Pilot School 1 provided some evidence that
family relationships were valued. The school website included a variety of resources available to
parents. Communication about school supplies, course descriptions, school calendar, daily
announcements, homework help, schedules, cafeteria menus, and library databases indicated that
keeping families informed was important to the school. The school had not done any recent
surveys and the school improvement plan was not available.
Interviews with members of the school staff indicated that relationships with families
were valued. Teachers cited the online Parent Portal and the instant alert systems as examples.
Teachers also reported that they communicated with families via email and phone calls. Grades
were available online to parents via the Parent Portal. The principal reported that communication
was facilitated through Facebook, the newsletter, and the website. An expectation was
established with staff that they were to return parent phone calls within 24 hours.
149
APPENDIX C
TESTING THE IC MAP AT PILOT SCHOOL 2
Description of the School
Pilot School 2 was one of two schools serving the middle grades in a rural school
division. Both schools had a K-7 grade configuration and fed separate high schools that housed
the eighth grade. The high school associated with Pilot School 2 was adjacent to the school on
the same property and both schools shared a cafeteria, gymnasium, and facilities for art and
music. Pilot School 2 was a very small school with a total student enrollment of between 200 and
300 students, and fewer than 75 in grades six and seven. The current school building was
originally constructed to serve the entire school-age population of this part of the county. The
school had a principal and an itinerant guidance counselor that also served the other K-7 school
in the school division.
Procedures
I visited Pilot School 2 on a regular school day on December 5, 2011. The primary means
of collecting data to evaluate the features on the IC map were walkthrough classroom
observations, a review of documents, and interviews with school staff and parents. The staff had
been informed in advance of my visit, and I was permitted to visit classes and roam the school
freely.
I conducted walkthrough classroom observations in one sixth grade class and one seventh
grade class. The school had an additional class in each of the middle grades, but both classes
were out of the building at the time of the observations. Classroom walkthrough observations
lasted approximately ten minutes each. During the observations, I took field notes relative to the
specific features on the IC map that require walkthrough observations for evidence.
I asked the principal for the documents indicated by the IC map, and he provided all the
documents that were available. Some documents were available online on the website for the
school division or on the school website. I accessed some of the documents that were available
online before the day of the visit to the school and some of the documents after the day of the
visit to the school. The number of documents and artifacts available from this school was quite
limited. Pacing guides, teacher lesson plans, assessment samples, student work samples, a master
150
schedule, teacher meeting notes, a guidance curriculum, survey data, a school newsletter, and a
professional development log were not available for review. In some cases, the lack of
documents and artifacts was a factor of being a very small school. Documents such as a master
schedule, teacher meeting notes, survey data, and a professional development log simply did not
exist. Other documents such as teacher lesson plans were not collected by the principal and were
not made accessible. Therefore, for Pilot School 2, interviews proved to be the richest source of
evidence, but was also a limitation since the possibility of triangulation of data was reduced.
Individual interviews with staff members and parents were scheduled in advance by the
principal. I interviewed the four teachers that taught the sixth and seventh grade students. In both
grades, one teacher taught English and social studies and the other teacher taught math and
science. The staff members who participated in the interviews were selected by the principal.
Each teacher was asked questions from one section of the IC map, and, as time permitted,
selected questions from other sections. The guidance counselor and the principal were also
interviewed. Interviews were conducted in a private room or office to protect confidentiality.
After arriving to the designated meeting place, participants were fully informed of the purpose,
procedures, benefits, and risks associated with the research and were given the opportunity to
consent or not consent to participation. Interviews lasted approximately 30 minutes each.
Comparison of Evidence to the IC Map
Evidence for Feature A1: The Curriculum is Rigorous and Challenging
Feature A1 evaluates the presence of identified components of a rigorous curriculum
within a school and the extent to which a rigorous curriculum is available to all students in the
school. Evidence of a rigorous and challenging curriculum at Pilot School 2 was collected
through walkthrough class observations, a review of the documents prescribed by the IC map,
and interviews with two teachers and the principal. These data indicated the presence of 30-60%
of the components of a rigorous curriculum at this school, which corresponded to Variation B for
this feature.
The components observed in classrooms included some 21st century skills, some
examples of high standards, and examples of high levels of student engagement. The Partnership
for 21st Century Skills (2004) identifies the aptitudes students need to develop for success in the
21st century economy. Among these skills are global awareness, financial literacy, civic literacy,
151
creativity, critical thinking and problem solving, communication, collaboration, information and
technology literacy, responsibility, and initiative. Examples of 21st century skills observed in
classes were civic literacy, critical thinking activities in one of two classes, collaboration in two
of two classes, differentiated instruction, creativity in two of two classes, and communication
skill building in two of two classes. High standards were evident in one of two classes and high
levels of student engagement were observable in two of two classes. Displays of exemplary
student work were not observed. The creative projects on which students in both classes were
working provided evidence of the use of varied assessments. In summary, components of a
rigorous curriculum were evident in both classes observed. Of the eight components of a
rigorous curriculum indicated on the IC map, five, or approximately 60%, were evident in the
walkthrough classroom observations conducted.
A review of key documents associated with Pilot School 2 revealed that there were no
advanced courses available at this school, thus suggesting that all students had relatively equal
access to any rigor offered. The suggested documents listed on the IC map for this map were
largely not available at this school. A program of studies for secondary grades was located on the
division website. Although the program of studies did not specifically address the middle grades,
the description of courses offered at the high school level provided helpful insight. There were
no advanced courses offered in grades nine and ten nor were any Advanced Placement (AP) or
International Baccalaureate (IB) courses offered at the high school level. Dual enrollment
courses were offered in the upper grades for core subjects. Foreign language instruction was
offered through level four in one language: Spanish. The secondary program of studies suggested
that the focus of the school division was to offer a basic program of studies. The small student
enrollment may have made offering advanced classes impractical and cost prohibitive.
Class websites are not listed as a source of information for this feature on the IC map; however,
some information found there provided further evidence of a rigorous curriculum. For example, a
seventh grade class participated in a probability activity in which they predicted possible
outcomes of toppings for ice cream sundaes. Making the sundaes in class required creativity and
likely led to a high level of engagement for students to understand the concept.
Interviews with members of the school staff suggested that their definition of a rigorous
curriculum was somewhat consistent with the components of a rigorous curriculum listed on the
152
IC map. Teachers cited high standards, higher order thinking, writing, and creating work
problems in math as examples of rigor. The teachers interviewed and the principal had a
common agreement that the curriculum at this school was challenging for low and average
students, but that advanced students were not challenged enough. The principal reported that the
Response to Intervention (RTI) program was in place to provide intensive support to struggling
students, but that advanced students needed to be challenged more.
Evidence for Feature A2: The Curriculum is Exploratory and Relevant
Feature A2 evaluates the extent to which the curriculum of a school allows students to
explore their interests. Evidence of an exploratory curriculum at Pilot School 2 was collected
through a review of the documents prescribed by the IC map and interviews with two teachers
and the principal. These data indicated that both exploratory classes and extracurricular activities
were offered at this school, which corresponded to Variation B for this feature.
A search for key documents associated with this feature for Pilot School 2 did not
provide any evidence of an exploratory curriculum. The lack of evidence was due primarily to
documents and artifacts not being available.
Interviews with members of the school staff confirmed that exploratory classes were
offered to students as well as extracurricular activities. Teachers reported that 4-H was the only
club available at the school, but that middle grades students were permitted to participate on high
school athletic teams and the high school marching band. Teachers also reported that the local
community college operated a Talent Search program that encouraged students to explore
opportunities for post-secondary education. The Talent Search program was open to all students.
The principal explained that physical education, art, music, and computers were offered to
students as exploratory options. When asked how learning in the core classes was made relevant
to students, teachers responded that there was not sufficient time for learning beyond the
Standards of Learning.
Evidence for Feature A3: The Curriculum is Integrative and Interdisciplinary
Feature A3 evaluates the extent to which the curriculum of the school is interdisciplinary.
Evidence of a rigorous and challenging curriculum at Pilot School 2 was collected through a
review of the documents prescribed by the IC map and interviews with two teachers and the
principal. These data indicated there were no interdisciplinary themes within the middle grades
153
and the curriculum was not integrated in any coordinated manner. Some interdisciplinary skills
such as reading and writing, however, were incorporated within the various content areas. None
of the variations for Feature A3 adequately accounted for the manner in which learning was
integrated at Pilot School 2.
A search for key documents associated with this feature for Pilot School 2 did not
provide any evidence of interdisciplinary activities. The lack of evidence was due primarily to
documents and artifacts not being available.
Interviews with members of the school staff confirmed that there were no
interdisciplinary themes or activities around which learning revolved. The teachers and the
principal cited examples of the use of interdisciplinary skills within individual core classes.
These examples included art, music, reading, and writing. Another example cited was the use of
math within science class.
Evidence for Feature A4: Instructional Strategies are Varied and Aligned to Standards
Feature A4 evaluates the extent to which instructional strategies are varied and aligned to
standards. Evidence of instructional strategies at Pilot School 2 was collected through
walkthrough classroom observations, a review of the documents prescribed by the IC map, and
interviews with two teachers. These data indicated instructional strategies were aligned to
standards and teachers collaborated informally to employ a variety of data-informed instructional
strategies. The use of a variety of strategies was observed in approximately 50% of classes (one
of two), corresponding with Variation B for this feature.
Walkthrough classroom observations indicated that instruction was aligned to standards
and there was some variation in instructional strategies employed. Strategies included
cooperative learning, storyboarding to demonstrate understanding of concepts, writing, higher
order questioning, and student presentations. Variation of strategies was observed in one class
but not the other during the time of observation.
A search for key documents associated with this feature for Pilot School 2 provided
limited evidence of a variety of strategies. Though not listed as a source of evidence on the IC
map for this feature, classroom websites provided some evidence. The seventh grade, for
example, did a probability activity for math class, and book reports were also done.
154
Interviews with members of the school staff confirmed that instructional strategies were
aligned to standards and teachers collaborated to include a variety. Teachers reported using
review games and technology. One teacher reported that students sometimes taught lessons to
promote engagement. Teachers confirmed that they were required to use the results of
benchmark testing to adjust instruction and that vertical collaboration occurred between sixth and
seventh grade teachers.
Evidence for Feature A5: Active Learning
Feature A5 evaluates the extent to which teachers and students engage in active learning
activities. The descriptors for this feature on the IC map also include the use of higher order
thinking activities. Evidence of active learning strategies at Pilot School 2 was collected through
walkthrough classroom observations and interviews with two teachers and the principal. These
data indicated that the use of active learning strategies in classes at this school was purposeful
and consistent for most teachers. The use of a variety of strategies was observed in both classes,
corresponding with Variation A for this feature.
Walkthrough classroom observations indicated that active learning strategies were
purposefully and consistently employed in classes. In both classes observed, students were
encouraged to physically move in order to complete learning activities. Cooperative learning was
employed in both classes: in one class to complete a creative writing activity and in the other
class to complete a storyboard which groups would use to present information. Critical thinking
was observed in one of the two classes.
Interviews with members of the school staff confirmed that active learning strategies
were purposefully and consistently employed. One teacher reported that students move
approximately every 20 minutes and the other teacher reported the frequent use of brain breaks
such as having the students stand up or use the interactive whiteboards. The principal reported
that teachers frequently used learning centers, which allowed students to move among various
learning activities.
Evidence for Feature A6: Students Demonstrate Mastery of Standards in a Variety of
Ways
Feature A6 evaluates the extent to which master of standards is measured using a variety
of assessments. Evidence of assessments at Pilot School 2 was collected through a review of the

155
documents prescribed by the IC map and interviews with two teachers and the principal. These
data indicated that there was some variety of assessments used at this school, but traditional tests
were the predominate mode of assessment. Traditional tests accounted for 50 to 80% of
assessments, corresponding most closely to Variation B for this feature.
A review of key documents associated with this feature for Pilot School 2 indicated that
traditional tests were the most frequently used type of assessment. Although teacher lesson plans
and assessment examples were not available, class websites indicated that assessments included
traditional tests and quizzes. An upcoming book report was also mentioned.
Interviews with members of the school staff indicated that students at this school were
assessed primarily through traditional tests, either paper/pencil or online, although other
assessments were also used. The teachers reported that assessments included traditional tests,
writing assignments, projects, experiments in science, and presentations. One teacher estimated
that the percentage of traditional tests used to assess was 50% and the other teacher estimated
that the percentage was 80%.
Evidence for Feature B1: An Advisory or Advocacy System Ensures that Every Student Is
Known Well By At Least One Adult
Feature B1 evaluates the presence of a student advisory program or other advocacy
system via which every student in the school is well known by at least one adult. Evidence of an
advisory or advocacy program at Pilot School 2 was collected through a review of the documents
prescribed by the IC map and interviews with a teacher and a guidance counselor. These data
indicated that there was no student advisory or advocacy system in place at this school.
Nevertheless, the staff believed that every student was well known due to the prevailing culture
and small size of the school. The culture of caring about students in the absence of structured
personalization of the school environment most closely corresponded to Variation C for this
feature.
A search for key documents associated with this feature for Pilot School 2 did not
provide any evidence of a student advisory or advocacy program. The lack of evidence was due
primarily to documents and artifacts not being available.
Interviews with members of the school staff confirmed the absence of a structured
student advisory or advocacy program. The teacher and counselor reported, nevertheless, that
156
every student was well known by at least one adult staff member. When asked how the school
ensures that every student is known, the teacher and counselor reported that the size of the
school, with fewer than 40 students per grade level, was the key factor.
Evidence for Feature B2: Comprehensive Guidance and Support Services Promote Whole-
Student Development
Feature B2 evaluates the provision of a comprehensive program of school counseling
services. Evidence of comprehensive school counseling services at Pilot School 2 was collected
through a review of the documents prescribed by the IC map and interviews with a teacher and a
guidance counselor. These data indicated that this school offered a somewhat comprehensive
program of school counseling services, corresponding to Variation B for this feature.
A review of key documents associated with Pilot School 2 provided evidence that the
school counseling program was multi faceted and adhered to state guidelines. The school website
was the most useful source of data for this feature. Among the services described were classroom
guidance activities, group counseling, individual counseling, character development, parent and
teacher consultation, and social and emotional support.
Interviews with members of the school staff confirmed the availability of comprehensive
school counseling services. The teacher reported that the counselor provided monthly classroom
guidance activities and teachers made referrals for individual counseling for students. The
counselor reported that she offered group services on topics as the need arises, such as
bereavement counseling.
Evidence for Feature B3: Students Learn in a Healthy and Safe School Environment
Feature B3 evaluates the extent to which the school provides a healthy and safe school
environment for students. Evidence of a healthy and safe school environment at Pilot School 2
was collected through walkthrough classroom observations, a review of the documents
prescribed by the IC map and interviews with two teachers, a guidance counselor, and two
parents. These data indicated that the school provided a healthy and safe environment for
students, with at least three of four components for this feature clearly in place. The evidence
best corresponded to Variation B for this feature.
Walkthrough classroom observations provided evidence of a healthy and safe
environment for students. In both classrooms visited, physical safety was evident and a healthy
157
affective environment was also evident. Classes were conducted in an orderly manner and
students were generally compliant with teacher directions. Abundant positive reinforcement of
behavior was observed.
A review of key documents associated with Pilot School 2 provided evidence that the
school provided a healthy and safe environment for students. Crime and violence data available
on the state Department of Education website indicated that the school was not persistently
dangerous. The school crisis plan was available for review and described detailed procedures
covering various scenarios and listed stakeholders involved. A copy of the safety drill record was
available and was current. The policy manual for the school division indicated that there was a
division policy related to wellness. The policy encouraged but did not require the cafeteria to
avoid serving certain foods. A visual tour of the school building indicated that the building was
physically safe.
Interviews with members of the school staff and parents confirmed that the school
provided a healthy and safe environment for students. Two teachers interviewed stated that the
school environment was safe and healthy for students. They reported that homeroom parents had
guidelines that they were supposed to follow for providing snacks. Teachers also reported that
safety drills were practiced regularly and there was a school safety committee to evaluate
procedures. Teachers reported that students had physical education class two days per week and
had recess daily after lunch. The parents and counselor agreed that the environment was safe and
healthy for learning. The parents were concerned that the cafeteria did not offer enough healthy
choices at lunch.
Evidence for Feature B4: Students are Organized into Small(er) Learning Communities
Feature B4 evaluates the manner in which the school environment is personalized by
organizing students into smaller communities. Evidence of smaller learning communities at Pilot
School 2 was collected through a review of the documents prescribed by the IC map and
interviews with a teacher and the counselor. These data indicated that the school had a student
enrollment of less than 400 and a common set of teachers advocated for student needs. The size
of the school corresponded to Variation B for this feature.
158
A review of key documents and artifacts associated with Pilot School 2 indicated that the
school had a steady enrollment of fewer than 300 students, with fewer than 75 in the middle
grades.
Interviews with members of the school staff confirmed that students were not organized
into smaller communities due to the small size of the school. There was not a perceived need to
organize students into smaller communities because they were already a very small community.
Evidence for Feature C1: School Rules are Clear, Fair, and Consistently Applied
Feature C1 evaluates the extent to which school rules are clear, fair, and consistently
applied among students. Evidence of clear and consistently applied school rules at Pilot School
2 was collected through a review of the documents prescribed by the IC map and interviews with
two teachers, the principal, and a guidance counselor. These data indicated that school rules were
clear, fair, and consistently applied among students, corresponding to Variation A for this
feature.
A review of key documents associated with Pilot School 1 provided evidence that school
rules were clearly communicated. The best source of information available was the student
handbook. The student handbook clearly stated rules for the school. The school division website
provided access to the division student code of conduct. Data that might provide evidence of
possible disparity or application among subgroups were not available.
Interviews with members of the school staff indicated that school rules were clearly
communicated and fairly and consistently applied. The teachers reported that teachers explained
and posted rules in the classrooms. The principal, one teacher, and the counselor reported that
rules were fairly and consistently applied among students. Another teacher reported that she did
not believe rules were consistently enforced and cited an example. Each teacher exercised
autonomy for enforcing rules within her classroom, with only students with major discipline
issues sent to the principal.
Evidence for Feature C2: All Students, Including All Social, Economic, and Ethnic Groups,
Have Open and Equal Access to Challenging Learning Opportunities
Feature C2 evaluates the extent to which all students, including various subgroups, have
open and equal access to challenging learning opportunities. Evidence of equal access to
challenging learning opportunities at Pilot School 2 was collected through walkthrough
159
classroom observations, a review of the documents prescribed by the IC map and an interview
with a teacher. These data indicated that students had open and equal access to challenging
learning opportunities, corresponding to Variation A for this feature.
Walkthrough classroom observations proved to not be a useful source of data for this
feature. Since no advanced classes were offered at this school, all students were grouped
heterogeneously in classes. Equitable access to advanced classes, therefore, was not a factor at
this school.
A search for key documents associated with this feature for Pilot School 2 did not
provide any evidence of equitable access to classes. The lack of evidence was due primarily to
documents and artifacts not being available.
An interview with a teacher confirmed that all students had open and equal access to
challenging opportunities. The teacher reported that there were no advanced classes, and all
students followed the same course of studies, including for electives.
Evidence for Feature C3: To the Fullest Extent Possible, All Students Participate in
Heterogeneous Classes with High Academic and Behavioral Expectations
Feature C3 evaluates the extent to which students participate in heterogeneous classes
with high academic and behavior expectations. Evidence of heterogeneous grouping at Pilot
School 2 was collected through a review of the documents prescribed by the IC map and
interviews with a teacher, the principal, and a guidance counselor. These data indicated that
students were grouped heterogeneously. The grouping practices at this school most closely
corresponded to Variation A for this feature.
A search for key documents associated with this feature for Pilot School 2 did not
provide any evidence of heterogeneous classes. The lack of evidence was due primarily to
documents and artifacts not being available.
Interviews with members of the school staff confirmed that students were grouped
heterogeneously. The teacher reported that there were no advanced classes, but students were
permitted to take algebra when they went to the high school for eighth grade. Admission to
algebra was based on the student’s grades. The principal and counselor confirmed that all
students followed the same program of studies with no choice of classes.
160
Evidence for Feature C4: All Students Have Ongoing Opportunities to Learn About Their
Own and Others' Cultures; Diversity is Valued by the School
Feature C4 evaluates the extent to which diversity is valued by the school and students
have the opportunity to learn about various cultures. Evidence of diversity at Pilot School 2 was
collected through a review of the documents prescribed by the IC map and interviews with a
teacher and the principal. These data indicated that the student population and staff of this school
had very little diversity. Tolerance of different cultures was not believed to be a problem for the
school and was not addressed purposefully. The data indicated that diversity at the school was
acknowledged, but teaching about diversity was not a priority for the school because there were
no perceived problems at the school related to diversity. Therefore, none of the variations of
Feature C4 adequately described Pilot School 2.
A review of key documents associated with Pilot School 2 provided no evidence with
respect to how teaching about diversity was valued at this school.
Interviews with members of the school staff confirmed that the student body had very
little ethnic, religious, or socioeconomic diversity. Emphasizing diversity was not a priority for
the school, and teacher was only able to cite 1920’s Day as an example of teaching about other
cultures. The principal confirmed that there was no racial tension in the school and that teaching
about diversity was viewed as a need for the school.
Evidence for Feature D1: Teachers are Organized in Teams with Common Plan Time
Feature D1 evaluates whether or not teachers are organized into interdisciplinary teams
with common plan time and common students. Evidence of teacher teams with common plan
time at Pilot School 2 was collected through a review of the documents prescribed by the IC map
and an interview with a teacher. These data indicated that teachers were not organized into
teams, corresponding to Variation D for this feature.
A review of key documents associated with Pilot School 2 provided no evidence of the
school using the middle grades idea of teacher teams as an organizational structure.
An interview with a teacher confirmed that core teachers in each grade were not provided
a common plan time other than before or after school. There were no requirements in place for
teachers in each grade level to meet regularly.
161
Evidence for Feature D2: Teachers Have Plan Time to Coordinate Transitions Between
Grade Levels and Schools
Feature D2 evaluates teacher involvement in the planning of activities to help students
transition from elementary school to middle school. Evidence of teacher involvement in planning
transition activities at Pilot School 2 was collected through a review of the documents prescribed
by the IC map and interviews with a teacher, the principal, and a guidance counselor. These data
indicated that there were no transition activities at this school since students moved from
elementary grades to middle grades within the same building and students in the middle grades
were already accustomed to taking classes and using the facilities in the adjacent high school
building. The absence of transition activities corresponded to Variation D for this feature.
A search for key documents associated with this feature for Pilot School 2 did not provide any
evidence of transition activities. The lack of evidence was due primarily to documents and
artifacts not being available.
Interviews with members of the school staff indicated that teacher teams were not
involved in transition planning because none is done. The teacher reported that there were no
transition activities since students do not change buildings between fifth and sixth grades and the
seventh graders were already accustomed to using the facilities in the adjacent high school. The
principal reported that prior to the current year, seventh graders were housed in the high school.
For the counselor, the idea of transition planning seemed to truly be a topic she had not
considered before. When asked who plans transition activities, she stated that she did not know.
She did mention that she does a career unit with students.
Evidence for Feature D3: Organizational Structures, Including Planned Time for
Collaboration, Foster Purposeful Learning and Meaningful Relationships
Feature D3 evaluates the extent to which structures within the school foster purposeful
and meaningful relationships. Such structures may include the master schedule of classes, the use
of physical space, clustering, co-curricular and extracurricular activities, small communities of
students, and purposeful outreach to special populations of students. Evidence of these six
components at Pilot School 2 was collected through observation and a review of the documents
prescribed by the IC map. Though not indicated by the IC map, additional evidence was
provided through interviews with teachers and the principal, based on questions asked to collect
162
evidence for other features. These data indicated that four of six structural components were in
place to foster purposeful and meaningful relationships at this school, corresponding to Variation
B for this feature.
Observation, a review of key documents associated with Pilot School 2, and interview
questions associated with other features on the IC map provided evidence of structures that foster
purposeful and meaningful relationships. Grade levels were clustered together in close proximity
to one another. Interviews with teachers and the principal indicated that extracurricular and co-
curricular activities were available. The school was inherently a small community of students.
The school website and interviews indicated that there was purposeful outreach to special
populations of students through gifted programs, RTI interventions, special education programs,
and needy families. Missing components were the master schedule and the physical layout of the
building.
Evidence for Feature D4: Teachers are Empowered to Implement Flexible Scheduling to
Promote Learning
Feature D4 evaluates the autonomy teachers have to group students as needed to improve
learning. Evidence of teacher autonomy to implement flexible grouping at Pilot School 2 was
collected through a review of the documents prescribed by the IC map and interviews with a
teacher and the principal. These data indicated that teachers had complete autonomy to
implement flexible grouping as needed, corresponding to Variation A for this feature.
A review of key documents associated with Pilot School 2 provided no evidence of flexible
grouping.
Interviews with members of the school staff indicated that teachers had complete
autonomy to implement flexible grouping practices as needed. The teacher reported that she
would only need to collaborate with the other teacher in her grade level, but there was no need to
seek permission from the principal. The principal confirmed that teachers would not need to seek
permission to alter their schedule or implement flexible grouping.
Evidence for Feature D5: Leaders are Knowledgeable About and Committed to Working
with this Age Group
Feature D5 evaluates preparation and commitment level of the principal to working with
students in the middle grades. Evidence of the principal’s preparation and commitment to
163
working with young adolescents at Pilot School 2 was collected through an interview with the
principal. These data indicated that the principal was not experienced in working with students in
the middle grades and was not currently engaged with professional development activities
specific to the middle grades. The principal did complete doctoral studies related to the middle
school concept but did not believe that there were educational practices distinctive to the middle
grades. This level of preparation and commitment most closely corresponds to Variation D for
this feature, although there was no evidence to suggest that the principal did not enjoy working
with young adolescents.
An interview with the principal and observation of his interactions with students
indicated that he was an experienced administrator but had no previous experience working with
students in the middle or elementary grades. He reported that he was previously a high school
teacher, a high school assistant principal, and a central office administrator before retiring. The
principal came out of retirement a few years previous to the interview to accept the position at
Pilot School 2, calling it an “ideal job”. When asked about his beliefs about middle grades
education, he reported that each grade had its own challenges and did not think there was a
middle grades distinctive. The principal was observed to be friendly and approachable. He
seemed to enjoy his current position working with elementary and middle grades students and
seemed to enjoy the community.
Evidence for Feature D6: Teachers are Knowledgeable About and Committed to Working
with this Age Group
Feature D6 evaluates the preparation and commitment of teachers in the school to
working with students in the middle grades. Evidence of the preparation and commitment of
teachers to working with young adolescents at Pilot School 2 was collected through walkthrough
observations of classes, a review of teacher licensure status for teachers at the school and
interviews with a teacher and a guidance counselor. These data indicated that most teachers were
prepared and committed to working with students in the middle grades, corresponding to
Variation A for this feature.
Walkthrough classroom observations provided evidence that the teachers seemed to enjoy
working with young adolescents and employed best practice strategies for this age group such as
active learning, critical thinking, and collaboration. Of two classes observed, both teachers were
164
pleasant with the students and had a positive rapport. Appropriate middle school practices such
as articulating clear expectations, allowing for choice, collaboration, and active learning were
evident.
The status of teacher licensure for teachers at this school was available on the website of
the state Department of Education. Since the school was small, licensure information was
reviewed for all four teachers. For this school, 50% of teachers had a middle school endorsement
and 50% had an elementary endorsement.
Interviews with members of the school staff confirmed that most teachers enjoy working
with students in the middle grades. The teacher reported that the teachers at this school enjoyed
working with young adolescents. The counselor confirmed that the teachers in sixth and seventh
grades seemed “well suited” to teaching those grades.
Evidence for Feature D7: Students Have Opportunities to Participate in Decision Making
Feature D7 evaluates the extent to which students have the opportunity to participate in
decision making at the school. Evidence of student participation in decision making at Pilot
School 2 was collected through an interview with a teacher. These data indicated that students
had the opportunity to exercise leadership in student organizations and classes, but there was no
formal mechanism in place to invite student participation. This level of student involvement in
decision making corresponded to Variation B for this feature.
An interview with a teacher provided evidence that students exercised leadership within
school organizations, generally felt comfortable in making suggestions informally, but there
were no formal mechanisms in place for student input. Teachers reported that 4-H provided some
opportunities for student leadership. In class, students had the opportunity to exercise leadership
through reading groups. The cafeteria also encouraged suggestions for menus.
Evidence for Feature D8: Decision Making is Democratic and Guided by a Shared Vision
Feature D8 evaluates the extent to which decision making at the school is shared and is guided by
a shared vision. Evidence of shared decision making at Pilot School 2 was collected through a review of
the documents prescribed by the IC map and interviews with a teacher, the principal, and a guidance
counselor. These data indicated that the staff generally shared a common, yet informal, vision for the
school and that the staff enjoyed substantial autonomy to make decisions. This level of shared decision
making corresponded to Variation B for this feature.

165
A review of key documents associated with Pilot School 2 provided little evidence of
shared decision making or an articulated school vision. No evidence was found on the school
website or in the student handbook.
Interviews with members of the school staff indicated that there was no articulated vision
for the school, although there seemed to be an informal vision common to many staff members
that this was a community-based school focused on helping students succeed. The teacher,
counselor, and principal all agreed that the principal ultimately reserved the right to make final
decisions, most routine decisions were made by the teachers.
Evidence for Feature D9: Leadership is Courageous and Collaborative
Feature D9 evaluates the extent to which school leadership is courageous and
collaborative. Evidence of courageous and collaborative leadership at Pilot School 2 was
collected through a review of the school improvement plan and interviews with a teacher, the
principal, and a guidance counselor. These data indicated that leadership at this school was
ethical and shared, but the role of the principal seemed focused on managing rather than leading.
This leadership style corresponded to Variation D for this feature, with the shared leadership
characteristics of Variation A.
Interviews with members of the school staff indicated that the principal of this school was
moderate, open, and not given to extremes. The teacher reported that teachers made most
decisions in the school, although the principal reserved “the final say.” The counselor reported
that the principal was a good communicator, positive, fair, and well liked by students. There was
no evidence that the principal was a change agent or risk taker.
Evidence for Feature D10: Professional Development is Aligned to School Improvement
and Best-Practice Strategies
Feature D10 evaluates the extent to which professional development is aligned to school
improvement goals. Evidence of the alignment of professional development at Pilot School 2
was collected through a review of the school improvement plan and interviews with a teacher
and the principal. A professional development plan was not available. Interview data indicate
that professional development was aligned to school improvement, and there was evidence that
professional development was job embedded. Professional development practices seemed to
most closely correspond to Variation A for this feature.
166
The school improvement plan followed a specific format directed by the school division
and was focused exclusively on student achievement as measured by SOL tests.
Interviews with members of the school staff indicated that professional development
needs were driven primarily by SOL data and directed by the school division. Professional
development was provided through conferences, presentations, and workshops and was largely
district directed. The district required and funded the participation of each teacher in one
conference per year, according to the principal. The teacher and the principal confirmed that job
embedded professional development is provided for the implementation of RTI strategies.
Evidence for Feature D11: Students Have the Opportunity to Engage with the Community
Feature D11 evaluates the extent to which students have the opportunity to engage with
the community. Such engagement may take the form of authentic learning experiences, service
learning, field trips, or fundraising for charity. Evidence of opportunities for students to engage
with the community at Pilot School 2 was collected through a review of the documents
prescribed by the IC map and an interview with a teacher. These data indicated that students
have opportunities to engage with the community, corresponding to Variation A for this feature.
A review of key documents associated with Pilot School 2 provided no evidence of
opportunities for students to engage with the community.
Interviews with members of the school staff indicated that students had opportunities to
engage with the community. The teacher reported that students were involved with solving real-
world problems through 4-H and learning about elections. She also cited student participation in
toy drives, recycling projects, and collecting supplies for the military.
Evidence for Feature D12: The Community is Engaged in Providing Resources and
Support
Feature D12 evaluates the extent to which the community is engaged with the school by
providing resources and support. Evidence of community support at Pilot School 2 was collected
through a review of the documents prescribed by the IC map and interviews with a teacher, the
principal, and a counselor. These data indicated that the community was highly engaged in
providing resources and support to the school, corresponding to Variation A for this feature.
167
A review of key documents associated with Pilot School 2 provided little evidence of community
support of the school. The school website referenced the work of the Homeroom Parent
Association, but provided few details.
Interviews with a teacher, the principal, and the counselor, however, indicated multiple
ways in which the community provided support to the school. The teacher described the
Christmas shopping project which was occurring the day of the site visit. For this project, the
homeroom parents solicited donations from parents and businesses and students had the
opportunity to shop for gifts. The teacher also mentioned that for field trips, she had a list of
donors she contacted to provide assistance for students who could not otherwise afford to
participate. The principal cited the involvement of the local community college in supporting the
Talent Search program, the 4-H program, and the DARE program sponsored by the local sheriffs
office. The counselor reported that the school was often used by community groups and the
community often rallied around needs that arose.
Evidence for Feature D13: Relationships with Families are Valued in Support of Students'
Success
Feature D13 evaluates the extent to which relationships between the school and families
are valued. Evidence of the value placed on family relationships at Pilot School 2 was collected
through a review of the documents prescribed by the IC map and interviews with a teacher and
two parents. These data indicated that relationships with families were highly valued,
corresponding to Variation B for this feature.
A review of key documents associated with Pilot School 2 provided some evidence that
family relationships were valued. The school and class websites included messages to parents to
encourage their involvement at the school and with their child’s academic work. Parent
involvement was not addressed in the school improvement plan and no surveys had been
conducted.
Interviews with parents and members of the school staff indicated that relationships with
families were valued. The teachers cited the homeroom parent structure as a key factor in
welcoming families into the school. She reported that conference were held during later hours to
provide greater access to parents and that teachers tried to communicate positive news. The
parents reported that the school communicated through letters, emails, text messages,

168
conferences, and the homeroom organization. Parents reported that they felt welcomed at the
school and there were multiple events such as movie nights and reading nights to encourage
parents to be at the school.
169
APPENDIX D
TESTING THE IC MAP AT PILOT SCHOOL 3
Description of the School
Pilot School 3 was one of five schools serving the middle grades in a suburban school
division. All middle grades schools had a 6-8 grade configuration and each fed separate high
schools. Pilot School 3 was a relatively larger school with a student enrollment of between 700
and 800 students. The school building was built in the 1960’s and the school shared a larger
campus with the high school. The school had a principal, two assistant principals, and two
guidance counselors.
Procedures
I visited Pilot School 3 on two regular school days: December 13 and 15, 2011. The
primary means of collecting data to evaluate the features on the IC map were walkthrough
classroom observations, a review of documents and artifacts, and interviews with school staff.
The staff had been informed in advance of my visit, and I was permitted to visit classes and roam
the school freely.
I conducted a total of ten classroom walkthrough observations in classes representing all
three grade levels and various content areas. Classroom walkthrough observations lasted
approximately four to seven minutes each. During the observations, I took field notes relative to
the specific features on the IC map that require walkthrough observations for evidence.
I asked the principal for the documents indicated by the IC map, and she provided all the
documents that were available. Some documents were available online on the website for the
school division or on the school website. I accessed the documents that were available online
after the days of the visit to the school.
Individual interviews with staff members were conducted on both days of the school
visit. I interviewed 8 teachers, representing core subjects as well as electives. Participants were
selected by the principal. Each teacher was asked questions from one section of the IC map; in
some cases, questions from a second section were included. A guidance counselor, an assistant
principal, and the principal were also interviewed. Interviews were conducted in a private room
to protect confidentiality. After arriving to the designated meeting place, participants were fully
170
informed of the purpose, procedures, benefits, and risks associated with the research and were
given the opportunity to consent or not consent to participation. Interviews lasted approximately
30 minutes each.
Comparison of Evidence to the IC Map
Evidence for Feature A1: The Curriculum is Rigorous and Challenging
Feature A1 evaluates the presence of identified components of a rigorous curriculum
within a school and the extent to which a rigorous curriculum is available to all students in the
school. Evidence of a rigorous and challenging curriculum at Pilot School 3 was collected
through walkthrough class observations, a review of the documents prescribed by the IC map,
and interviews with two teachers and an assistant principal. These data indicated the presence of
over 60% of the components of a rigorous curriculum at this school, which corresponded to
Variation A for this feature.
The components observed in classrooms included some 21st century skills, differentiated
instructional practices, some examples of high standards, some examples of high levels of
student engagement, and some displaying of exemplary student work. The Partnership for 21st
Century Skills (2004) identifies the aptitudes students need to develop for success in the 21st
century economy. Among these skills are global awareness, financial literacy, civic literacy,
creativity, critical thinking and problem solving, communication, collaboration, information and
technology literacy, responsibility, and initiative. Examples of 21st century skills observed in
classes were critical thinking activities in five of ten classes, creativity in three of ten classes,
collaboration in one of ten classes, and communication skill building in two of ten classes. High
standards were evident in six of ten classes and high levels of student engagement were
observable in eight of ten classes. Exemplary student work was displayed in three classes. In
summary, components of a rigorous curriculum were evident in approximately seven of the ten
classes. Of the eight components of a rigorous curriculum indicated on the IC map, six, or
approximately 75%, were evident in the walkthrough classroom observations conducted.
A review of key documents associated with Pilot School 3 provided evidence of rigor in
the curriculum. Sample teacher lesson plans were required to include an explanation of how each
lesson would be differentiated to meet various student needs as well as how technology would be
integrated. Sample plans included ample opportunities for students to practice reading and
171
writing skills. A small sample of student assessments was provided for review, but these were all
traditional tests. The registration guide for the division indicated a broad offering of advanced
courses, including advanced courses in each core area and an accelerated math program allowing
students to take geometry in eighth grade. Pacing guides for the school division closely mirrored
state standards. Samples of student work included writing assignments and projects.
Interviews with members of the school staff suggested that their definition of a rigorous
curriculum was somewhat consistent with the components of a rigorous curriculum listed on the
IC map. Teachers cited critical thinking, high standards, differentiation, and technology skills as
examples of rigor. The assistant principal indicated that rigor included the idea of making
students inquisitive and developing curiosity. The teachers interviewed had a common agreement
that the curriculum at this school was challenging. One teacher commented that there was less
rigor in inclusion classes because the focus was on learning the standards which he considered to
be basic. The assistant principal stated that the curriculum was challenging for different students
for different reasons. Advanced students were challenged to think, whereas learning the basic
content of the standards was challenging for average students and struggling students.
Evidence for Feature A2: The Curriculum is Exploratory and Relevant
Feature A2 evaluates the extent to which the curriculum of a school allows students to
explore their interests. Evidence of an exploratory curriculum at Pilot School 3 was collected
through a review of the documents prescribed by the IC map and interviews with two teachers
and an assistant principal. These data indicated that both exploratory classes and extracurricular
activities were offered at this school and teachers made learning in the core classes relevant to
student interests. The curriculum corresponded to Variation A for this feature.
A review of key documents associated with Pilot School 3 revealed that a wide variety of
exploratory classes were available to students. The course registration guide indicated that
elective courses were available in art, music, technology, family and consumer sciences,
photography, world languages, and business. The master schedule of the school confirmed that
these courses were scheduled at this school. The school website provided information about
extracurricular activities at this school, although the IC map did not include the school website as
a suggested source of this information. There was no indication on teacher lesson plans of
activities relating the core curriculum to student interests.

172
Interviews with members of the school staff confirmed that exploratory classes were
offered to students as well as extracurricular activities. Extracurricular activities included
athletics, SCA, Fellowship of Christian Athletes, YADAPP, Impact, Yearbook, Friends of
Rachel, and Walking Club. When asked how learning in the core classes was made relevant to
students, teachers cited examples such as using technology, measurement lessons, force and
motion lessons, examples involving sports, and making civil war booklets based on students’
own experiences.
Evidence for Feature A3: The Curriculum is Integrative and Interdisciplinary
Feature A3 evaluates the extent to which the curriculum of the school is interdisciplinary.
Evidence of a rigorous and challenging curriculum at Pilot School 3 was collected through a
review of the documents prescribed by the IC map and interviews with two teachers and an
assistant principal. These data indicated there were no interdisciplinary themes within grade level
teams and the curriculum was not integrated in any coordinated manner. Some interdisciplinary
skills such as reading and writing, however, were incorporated within the various content areas
and through collaboration among individual teachers. None of the variations for Feature A3
adequately accounted for the manner in which learning was integrated at Pilot School 3.
A review of key documents associated with Pilot School 3 indicated few opportunities for
interdisciplinary learning. No evidence of interdisciplinary learning was found in teacher lesson
plans. Displays of student work showed that reading and writing skills were emphasized in
classes other than English. The school website did not display any information indicating
integrated learning in classes.
Interviews with members of the school staff confirmed that there were no
interdisciplinary themes or activities around which learning revolved. Teachers, however, cited
several examples in which skills were connected among content areas. Examples included plans
to coordinate reading assignments between English and science to help reinforce concepts in
science and coordination of vocabulary building between English and history. The assistant
principal reported that teachers work together among content areas, but interdisciplinary
activities were not intentionally planned.
173
Evidence for Feature A4: Instructional Strategies are Varied and Aligned to Standards
Feature A4 evaluates the extent to which instructional strategies were varied and aligned
to standards. Evidence of instructional strategies at Pilot School 3 was collected through
walkthrough classroom observations, a review of the documents prescribed by the IC map, and
interviews with two teachers and an assistant principal. These data indicated instructional
strategies were aligned to standards and teachers collaborated to employ a variety of data-
informed instructional strategies. The use of a variety of strategies was observed in
approximately 40% of classes, corresponding with Variation B for this feature.
Walkthrough classroom observations indicated that instruction was aligned to standards
and there was some variation in instructional strategies employed. Strategies included the use of
technology such as interactive whiteboards, writing activities, checking for understanding,
presentations, interviewing, assessment, editing, and reading. In most classes, though, there was
little variation within the time of the observation. In only 40% of classes visited did the teacher
use multiple strategies.
A review of key documents associated with Pilot School 3 provided evidence of some
variety in the use of instructional strategies. Sample teacher lesson plans all followed the same
format listing a focus activity, instructional delivery plan, and evaluation. Instructional strategies
listed included guided reading, journaling, using the interactive whiteboard, writing projects,
practice with worksheets, and summarizing. There was no evidence of a variety of instructional
strategies in the sample team meeting notes provided.
Interviews with members of the school staff confirmed that instructional strategies were
aligned to standards and teachers collaborated to include a variety of strategies. Teachers
reported that the school was in the first year following a block schedule with 90-minute classes;
thus, employing a variety of instructional strategies, was an imperative. Teachers reported using
cooperative learning, learning stations, flexible grouping, and interactive whiteboards. Teachers
confirmed that they were required to use the results of benchmark testing to adjust instruction
and that collaboration occurs by content area. The assistant principal reported that she was not
satisfied with the frequency of flexible grouping and differentiation in the classes. She reported
that some teachers differentiated every day and other much less frequently.
174
Evidence for Feature A5: Active Learning
Feature A5 evaluates the extent to which teachers and students engage in active learning
activities. The descriptors for this feature on the IC map also include the use of higher order
thinking activities. Evidence of active learning strategies at Pilot School 3 was collected through
walkthrough classroom observations and interviews with two teachers and an assistant principal.
These data indicated that active learning activities were frequently employed in the school. Use
of active learning activities was observed in approximately 60% of classes, corresponding with
Variation B for this feature.
Walkthrough classroom observations indicated that, in the majority of classes, students
had some opportunity for movement and critical thinking questioning was also evident. In six of
the ten classes visited students had the opportunity to physically move. This was accomplished in
a variety of ways including allowing groups of students to visit the library, having students get
out of their seats to put away books, having students sing, and allowing students to move about
as needed when working on a project. Critical thinking was observed in two of the classes. Thus
in 60% of classes visited, students were engaged in active learning strategies.
Interviews with members of the school staff produced mixed results regarding the
perceived frequency of use of active learning strategies across the school. The teachers
interviewed reported a much higher frequency than the assistant principal. When asked how
many teachers in the school encourage movement in class, the interviewed teachers responded
with estimates of 50-90%, perhaps reflecting their own frequency of use. The assistant principal,
however, estimated that the frequency was closer to 20% of teachers. This vast difference could
be attributed to differing interpretations of the question or to different opportunities to observe
actual practice across classrooms. The difference also indicates the need to collect additional
evidence to triangulate the perceptions of teachers and the assistant principal.
Evidence for Feature A6: Students Demonstrate Mastery of Standards in a Variety of
Ways
Feature A6 evaluates the extent to which master of standards is measured using a variety
of assessments. Evidence of assessments at Pilot School 3 was collected through a review of the
documents prescribed by the IC map and interviews with two teachers and an assistant principal.
These data indicated that staff members perceived traditional tests to be the predominate mode of
175
assessment; however, sample lesson plans and observation suggested that other types of
assessments were used more frequently than staff members perceived. Aggregate data suggested
that traditional tests account for approximately 50% of assessments, corresponding with
Variation B for this feature.
A review of key documents associated with Pilot School 3 provided evidence of the type
of assessments used in to measure learning. Teacher lesson plans included a variety of
assessment types. Of 12 assessments listed in the sample lesson plans, five were traditional tests,
four were writing assignments, and three were other types of projects. Samples of student work
suggested that writing and projects were used frequently to assess learning. There was no
evidence of assessments on the school website and class websites were password protected and
not available for review.
Interviews with members of the school staff indicated that students at this school were
assessed primarily through traditional tests, either paper/pencil or online, although other types of
assessments were also employed. When asked to estimate the percentage of assessments across
the school that was traditional tests, one teacher reported that the percentage was 30 % and the
other teacher reported it to be 80%. The assistant principal perceived the percentage to be
approximately 70%, primarily due to the emphasis on achievement on standardized tests. Other
types of assessments cited were projects, presentations, science experiments, writing
assignments, and oral assessments.
Evidence for Feature B1: An Advisory or Advocacy System Ensures that Every Student Is
Known Well By At Least One Adult
Feature B1 evaluates the presence of a student advisory program or other advocacy
system via which every student in the school is well known by at least one adult. Evidence of an
advisory or advocacy program at Pilot School 3 was collected through a review of the documents
prescribed by the IC map and interviews with a teacher, the principal and a guidance counselor.
These data indicated that there was not a separate advisory period in place, but the schoolwide
discipline plan promoted student advocacy for many students. Since there were no programs in
place to ensure that every student is well known, the school most closely corresponded to
Variation C for this feature.
176
A review of key documents associated with Pilot School 3 provided no evidence of a
student advisory or advocacy program. There was no evidence of time designated for student
advisory on the master schedule. Sample meeting notes from a department meeting indicated that
teachers did spend time discussing and responding to individual student academic needs. The
school website and the student handbook were not indicated as sources of evidence on the IC
map for this feature; however, both described the schoolwide discipline program that included a
process whereby first block teachers served as behavior advisors for students who earned tickets
for negative behaviors. These advisors communicated with parents when students reached certain
steps in the discipline plan.
Interviews with members of the school staff confirmed the absence of a structured
student advisory or advocacy program for all students. The teacher, principal, and counselor
reported, nevertheless, that every student was well known by at least one adult staff member.
When asked how the school ensures that every student was known, the teachers and counselor
reported that elective and physical education teachers interacted with students during all three
years of students’ time in middle school, and, therefore, formed relationships with all students.
The teacher and the principal also cited the schoolwide discipline program as a vehicle for
ensuring the students were well known. The schoolwide discipline program was evaluated by a
committee. The principal and the counselor also reported that activities such as guidance
programs and clubs provided outlets for students to interact with adults.
Evidence for Feature B2: Comprehensive Guidance and Support Services Promote Whole-
Student Development
Feature B2 evaluates the provision of a comprehensive program of school counseling
services. Evidence of comprehensive school counseling services at Pilot School 3 was collected
through a review of the documents prescribed by the IC map and interviews with a teacher, the
principal, and a guidance counselor. These data indicated that this school offered a
comprehensive program of school counseling services, corresponding to Variation A for this
feature.
A review of key documents associated with Pilot School 3 provided evidence that the
school counseling program was multi faceted and adheres to state guidelines. The school website
was a useful source of data for this feature. Among the services described were individual
177
counseling, group counseling, life skills groups, career planning, testing, and a club called
Rachel’s Challenge. The website for the school division listed state standards and provided a
complete description of the guidance program for the school division. The master schedule
provided no evidence and may not be a relevant source of information for this feature.
Interviews with members of the school staff confirmed the availability of comprehensive
school counseling services. The teacher described the Student Assistance Program which
provided an additional counselor onsite to provide group and individual counseling on topics
such as anger management, life skills, and substance abuse. The counselor reported that parent
workshops had been offered on conference day and were well attended. The principal confirmed
that the guidance program was an important part of the school.
Evidence for Feature B3: Students Learn in a Healthy and Safe School Environment
Feature B3 evaluates the extent to which the school provides a healthy and safe school
environment for students. Evidence of a healthy and safe school environment at Pilot School 3
was collected through walkthrough classroom observations, a review of the documents
prescribed by the IC map and interviews with a teacher, the principal, and a guidance counselor.
These data indicated that the school provided a healthy and safe environment for students, with
at least three of four components for this feature clearly in place. The evidence best corresponded
to Variation B for this feature.
Walkthrough classroom observations provided evidence of a healthy and safe
environment for students. Of ten classrooms visited, physical safety was evident in all classes
and a healthy affective environment was evident in all of the classes. Classes were conducted in
an orderly manner and students were generally compliant with teacher directions.
A review of key documents associated with Pilot School 3 provided evidence that the
school provided a healthy and safe environment for students. The master schedule listed physical
education classes for all three grade levels; however, classes did not meet daily and physical
education was not a requirement for eighth graders. Physical education classes met on alternating
days in the block scheduling model adopted by the school division. Crime and violence data
available on the state Department of Education website indicated that the school was not
persistently dangerous. The school crisis plan was available for review and described detailed
procedures covering various scenarios. A copy of the safety drill record was available and was

178
current. The policy manual for the school division indicated that each school was required to
have a wellness committee that submitted reports twice per year. The wellness committee was
composed of staff members from a variety of roles, including the school nurse, the cafeteria
manager, and teachers. The school did not have vending machines accessible to students other
than for water. A visual tour of the school building indicated that the building was physically
safe. A fire drill was conducted on one of the days I visited the school. I observed that students
exited the building quickly and orderly, but classes returned to the building too quickly to allow
for teachers to account for each of their students. I did not observe teachers taking roll and
students were not silent, despite indication of this practice from teacher interviews.
Interviews with members of the school staff confirmed that the school provided a healthy
and safe environment for students. The teacher and the principal reported that safety drills were
conducted on a regular basis. The teacher reported that physical education teachers had provided
information for the other teachers regarding active learning strategies in classrooms. The teacher
reported that students were physically safe and the school had intentionally worked on the
affective environment. The principal reported that the school environment was healthy and safe
for learning. She credited the schoolwide discipline plan with bringing a “sense of calmness” to
the school.
Evidence for Feature B4: Students are Organized into Small(er) Learning Communities
Feature B4 evaluates the manner in which the school environment is personalized by
organizing students into smaller communities. Evidence of smaller learning communities at Pilot
School 3 was collected through a review of the documents prescribed by the IC map and
interviews with a teacher and the principal. The attempts to personalize the school environment
in the absence of interdisciplinary teams corresponded to Variation C for this feature.
A review of key documents associated with Pilot School 3 indicated that the school did
not engage in interdisciplinary teaming practices, but did have other structures in place to
personalize the school environment. The school report card available on the state Department of
Education website confirmed that the school had a steady enrollment of over 700 students. The
master schedule did not provide evidence of smaller learning communities. The school website
listed athletic teams, clubs, and resource groups available to students. Class websites were
password protected and not accessible for review. Sample meeting notes from a content area
179
meeting suggested that data analysis completed by departments helped focus attention on
individual student needs. There was no evidence of smaller communities in the student handbook
other than a reference to the schoolwide discipline plan which provided support for students with
behavior issues and rewards for students with good behavior.
Interviews with members of the school staff confirmed that students were not organized
into smaller communities such as interdisciplinary teams. The teacher reported that the
schoolwide discipline plan had helped personalize the environment for many students. She
reported that the school had interdisciplinary teams in previous years before the economic
downturn forced and increasing pressures to meet testing benchmarks forced the school to
abandon the practice. The counselor commented that she missed having the interdisciplinary
teams in place. She report that one way sixth grade students currently had a more personalized
environment was by dividing the students into two smaller groups for lunch.
Evidence for Feature C1: School Rules are Clear, Fair, and Consistently Applied
Feature C1 evaluates the extent to which school rules are clear, fair, and consistently
applied among students. Evidence of clear and consistently applied school rules at Pilot School
3 was collected through a review of the documents prescribed by the IC map and interviews with
a teacher and a guidance counselor. These data indicated that school rules were clear, fair, and
consistently applied among students, corresponding to Variation A for this feature.
A review of key documents associated with Pilot School 3 provided evidence that school
rules were clearly communicated. The best source of information available was the student
handbook. The student handbook clearly stated rules for the school and explained the schoolwide
discipline plan. The teacher handbook also listed possible dispositions for infractions. A sample
edition of the school newsletter provided no evidence of communication of rules. The school
website described the schoolwide discipline plan by posting the student handbook. Data from the
school database indicated that there was no disparity with respect to the enforcement of rules
among ethnic groups: 70% of incidents involved White students and 25% of incidents involved
Black students. These data correspond proportionately to the ethnic composition of the school.
Interviews with members of the school staff indicated that school rules were clearly
communicated and fairly and consistently applied. The teacher reported that rules were
communicated to students via the student handbook which was reviewed by all homeroom
180
teachers during the first week of school. Extra time was spent this year explaining the
schoolwide discipline program since it was a new feature. The teacher reported that she
perceived that rules were consistently applied nearly all of the time. The counselor confirmed the
perception that rules were communicated clearly and fairly applied.
Evidence for Feature C2: All Students, Including All Social, Economic, and Ethnic Groups,
Have Open and Equal Access to Challenging Learning Opportunities
Feature C2 evaluates the extent to which all students, including various subgroups, have
open and equal access to challenging learning opportunities. Evidence of equal access to
challenging learning opportunities at Pilot School 3 was collected through walkthrough
classroom observations, a review of the documents prescribed by the IC map and interviews with
a teacher and a guidance counselor. These data indicated that students had open and equal access
to challenging learning opportunities, corresponding to Variation A for this feature.
Walkthrough classroom observations provided evidence that students had open access to
challenging learning experiences. Of ten classes observed, four were considered to be advanced
and six regular classes, including collaboratively taught classes for students with disabilities. Out
of the six regular classes, quality teaching practices were observed in all six classes. In the
advanced classes, quality teaching practices were observed in three. There were proportionately
fewer ethnic minority students represented in the four advanced classes: one of 24, one of 26, ten
of 25, and one of 27. In the regular classes, ethnic minority representation was as follows: six of
14, five of 18, two of 20, three of 16, and five of 15. The proportion of ethnic minority students
in one class was not calculated. These data indicated that ethnic minority students had equal
access to quality learning experiences, but may be underrepresented in advanced classes,
possibly leading to disparity in future school years.
A review of key documents associated with Pilot School 3 provided evidence of equal
access to challenging opportunities. Course registration guides and the master schedule indicated
that advanced classes were available to students. The master schedule was evaluated for flow of
course and was found to allow for students to take any combination of regular and advanced
classes. The course registration guide indicated that there are no prerequisites for student
participation in advanced courses in science, social studies, or English. Prerequisites and teacher
recommendation were listed for advanced math courses and a selection process was in place for
181
the accelerated math program leading the students taking geometry in eighth grade. Ethnic
minority breakdown by class was not available in an accessible format from the school database
and the student handbook did not provide any evidence with respect to this feature.
Interviews with members of the school staff confirmed that all students have open and
equal access to challenging opportunities. The teacher and counselor reported that students
registered for classes using a registration form reporting the teacher recommendations for each
core class. Students and parents had the opportunity to abide by the teacher recommendation or
make their own choice. All students and their parents, whether recommended or not, were
required to sign a contract to participate in Pre-AP courses. This requirement was in place in an
effort to clearly communicate the expectations of rigor for these courses. The teacher and
counselor both reported that barriers to participation in activities such as field trips were reduced
by the school providing funding for participation.
Evidence for Feature C3: To the Fullest Extent Possible, All Students Participate in
Heterogeneous Classes with High Academic and Behavioral Expectations
Feature C3 evaluates the extent to which students participate in heterogeneous classes
with high academic and behavior expectations. Evidence of heterogeneous grouping at Pilot
School 3 was collected through a review of the documents prescribed by the IC map and
interviews with a teacher and a guidance counselor. These data indicated that students were
grouped homogeneously through the course registration process with students having the
freedom to choose their classes. The grouping practices at this school most closely corresponded
to Variation B for this feature.
A review of key documents associated with Pilot School 3 provided evidence that
students are grouped homogeneously. The course registration guide and master schedule
indicated that advanced courses were offered in core areas. The registration guide indicated that
students had the freedom to choose their classes via the absence of prerequisites in English,
science, and social studies. The master schedule was evaluated for flow of course and was found
to allow for students to take any combination of regular and advanced classes. The division
policy manual did not provide evidence with respect to this feature.
Interviews with members of the school staff confirmed that students were generally
grouped homogeneously through the course registration process. The teacher and the counselor
182
reported that students generally registered for advanced classes by teacher recommendations but
there was open enrollment.
Evidence for Feature C4: All Students Have Ongoing Opportunities to Learn About Their
Own and Others' Cultures; Diversity is Valued by the School
Feature C4 evaluates the extent to which diversity was valued by the school and students
had the opportunity to learn about various cultures. Evidence of diversity at Pilot School 3 was
collected through a review of the documents prescribed by the IC map and interviews with a
teacher and a guidance counselor. These data indicated that diversity at the school was
acknowledged, but teaching about diversity was not a priority for the school because there were
no perceived problems at the school related to diversity. Therefore, none of the variations of
Feature C4 adequately described Pilot School 3.
A review of key documents associated with Pilot School 3 provided little evidence that
valuing diversity was a priority for this school. Nor was there any evidence of tension among
ethnic groups or intolerance of others. There were some hallway displays encouraging respect
and tolerance. A display in one class listed the number of days to various holidays including,
Christmas, Hanukkah, and Kwanza.
Interviews with members of the school staff confirmed that the student body was
somewhat diverse but the staff less so. The principal of the school is African-American and one
of the assistant principals is Hispanic. A teacher confirmed that there was no racial tension
present and not “an issue.” The teacher cited world languages classes as an opportunity for
students to be exposed to other cultures. The counselor reported that students were accepting of
each other.
Evidence for Feature D1: Teachers are Organized in Teams with Common Plan Time
Feature D1 evaluates whether or not teachers are organized into interdisciplinary teams
with common plan time and common students. Evidence of teacher teams with common plan
time at Pilot School 3 was collected through a review of the documents prescribed by the IC map
and an interview with the principal. These data indicated that teachers were not organized into
teams, corresponding to Variation D for this feature.
183
A review of key documents associated with Pilot School 1 provided no evidence of
organizational structures with teachers organized into interdisciplinary teams with common
students.
An interview with the principal confirmed that teachers were not organized into teams.
Evidence for Feature D2: Teachers Have Plan Time to Coordinate Transitions Between
Grade Levels and Schools
Feature D2 evaluates teacher involvement in the planning of activities to help students
transition from elementary school to middle school. Evidence of teacher involvement in planning
transition activities at Pilot School 3 was collected through a review of the documents prescribed
by the IC map and interviews with a teacher, the principal, and a guidance counselor. These data
indicated that teacher teams were not involved in planning transition activities for students,
corresponding to Variation C for this feature.
A review of key documents associated with Pilot School 3 provided no evidence of
teacher involvement in transition planning.
Interviews with members of the school staff indicated that teachers were not involved in
transition activities. The teacher interviewed reported that guidance counselors plan transition
activities. The teacher was a special education teacher and mentioned that IEP’s had a transition
component requiring IEP teams to discuss post-secondary plans. The principal reported that
transition activities were planned by guidance and administration and included student tours and
visits to classes. The counselor reported that fifth graders toured the building and stayed for
lunch in the middle school cafeteria. She reported that tours were hosted by sixth graders and
guidance also planned a parent orientation.
Evidence for Feature D3: Organizational Structures, Including Planned Time for
Collaboration, Foster Purposeful Learning and Meaningful Relationships
Feature D3 evaluates the extent to which structures within the school foster purposeful
and meaningful relationships. Such structures may include the master schedule of classes, the use
of physical space, clustering, co-curricular and extracurricular activities, small communities of
students, and purposeful outreach to special populations of students. Evidence of these six
components at Pilot School 3 was collected through observation and a review of the documents
prescribed by the IC map. These data indicated that three structural components were in place to
184
foster purposeful and meaningful relationships at this school, corresponding to Variation B for
this feature.
Observation and a review of key documents associated with Pilot School 3 provided
evidence of structures that foster purposeful and meaningful relationships. Grade levels were
clustered together by hallways and floors of the building. The school website and student
handbook listed opportunities for students to participate on athletic teams and afterschool
programs. The schoolwide discipline plan fostered positive student behavior. Sample meeting
notes from department meetings indicated that teachers were working to provide extra support to
students in need of academic support. The school improvement plan was not available. The
master schedule indicated that students were not organized into smaller communities.
Evidence for Feature D4: Teachers are Empowered to Implement Flexible Scheduling to
Promote Learning
Feature D4 evaluates the autonomy teachers have to group students as needed to improve
learning. Evidence of teacher autonomy to implement flexible grouping at Pilot School 3 was
collected through a review of the documents prescribed by the IC map and interviews with two
teachers and the principal. These data indicated that teachers had autonomy to implement
flexible grouping, especially through providing remediation during elective classes,
corresponding to Variation B.
A review of key documents associated with Pilot School 3 provided no evidence of
flexible grouping.
Interviews with members of the school staff indicated that teachers had autonomy to
provide remediation during elective classes. Both teachers reported that remediation during
electives was a common practice. The principal reported that teachers may regroup students
within certain parameters.
Evidence for Feature D5: Leaders are Knowledgeable About and Committed to Working
with this Age Group
Feature D5 evaluates preparation and commitment level of the principal to working with
students in the middle grades. Evidence of the principal’s preparation and commitment to
working with young adolescents at Pilot School 3 was collected through an interview with the
principal. These data indicated that the principal was experienced in working with young
185
adolescents, enjoys working with students this age, and engages in some professional
development activities specific to this age group. This level of preparation and commitment most
closely corresponds to Variation A for this feature.
An interview with the principal and observation of her interactions with students
indicated that she was experienced in working with students in the middle grades and enjoyed
working with them. The principal interacted freely and comfortably with individual students,
calling many of them by name. The principal previously taught at the high school level, was a
middle school assistant principal for two years, and had been principal of Pilot School 3 for six
years. The principal believed that it was important to “mold and influence students.” The
principal had attended state middle school conferences and expressed interest in pursuing
recognition from the Schools to Watch program. She enjoyed visiting other schools to observe
other practices.
Evidence for Feature D6: Teachers are Knowledgeable About and Committed to Working
with this Age Group
Feature D6 evaluates the preparation and commitment of teachers in the school to
working with students in the middle grades. Evidence of the preparation and commitment of
teachers to working with young adolescents at Pilot School 3 was collected through walkthrough
observations of classes, a review of teacher licensure status for teachers at the school and
interviews with two teachers, the principal, and a guidance counselor. These data indicated that
most teachers were prepared and committed to working with students in the middle grades,
corresponding to Variation A for this feature.
Walkthrough classroom observations provided evidence that most teachers seemed to
enjoy working with young adolescents and many employed best practice instructional strategies
such as providing clear expectations, allowing students to express their creativity, and
incorporating active learning. Of ten classes observed, the teacher was enthusiastic and pleasant
with the students in all ten classes.
The status of teacher licensure for teachers at this school was available on the website of
the state Department of Education. Since the school was large, licensure information was
reviewed for the first ten core teachers listed alphabetically on the school website. For this
186
school, 70% of teachers in the sample had a middle school endorsement and 30% had a
secondary subject area endorsement.
Interviews with members of the school staff confirmed that most teachers enjoyed
working with students in the middle grades. One teacher commented that she knew she “made a
difference.” Another teacher reported that she “chose this age group.” Teachers agreed that there
was “a lot of compassion” for the students. The principal reported that she had worked hard to
“get the right people who loved these kids.”
Evidence for Feature D7: Students Have Opportunities to Participate in Decision Making
Feature D7 evaluates the extent to which students have the opportunity to participate in
decision making at the school. Evidence of student participation in decision making at Pilot
School 3 was collected through interviews with two teachers. These data indicated that students
had the opportunity to exercise leadership in student organizations and classes, but there was no
formal mechanism in place to invite student participation. This level of student involvement in
decision making corresponded to Variation B for this feature.
Interviews with members of the school staff provided evidence that students exercised
leadership within school organizations, generally felt comfortable in making suggestions
informally, but there were no formal mechanisms in place for student input. Teachers reported
that SCA and other clubs offered opportunities for student leadership. Teachers also reported that
students were able to volunteer in the library. The band teacher mentioned opportunities students
had to take initiative with programs like district band.
Evidence for Feature D8: Decision Making is Democratic and Guided by a Shared Vision
Feature D8 evaluates the extent to which decision making at the school is shared and is
guided by a shared vision. Evidence of shared decision making at Pilot School 3 was collected
through a review of the documents prescribed by the IC map and interviews with two teachers.
These data indicated that the staff generally shared a common vision for the school and that staff
input into decision making was invited. This level of shared decision making corresponded to
Variation B for this feature.
A review of key documents associated with Pilot School 3 provided some insight into the
culture of the school and decision making process. The school website had a link to the PTA,
indicating parental input was welcomed. There was no vision articulated directly on the website,
187
but the principal’s message was welcoming and enthusiastic. Sample meeting notes from a
teacher departmental meeting indicated that teachers were focused on student needs and success.
The student handbook encouraged support from parents. The handbook referenced having
student input into developing behavior plans if they reached that step on the schoolwide
discipline plan. The handbook also referenced a principal’s council that invited input into
decision making.
Interviews with members of the school staff indicated that there was no articulated vision
for the school, although there seemed to be common goals that were shared by staff members.
One teacher reported that the vision was to give every child the tools needed for success.
Another teacher reported that the teachers had worked very hard to come together as a faculty.
They reported that the new schoolwide discipline plan had helped. Both teachers reported that
the goals for the school were discussed regularly as a faculty and that the principal has exercised
more leadership in the past couple of years. Teachers also reported that the schoolwide discipline
plan was an initiative that came from teachers. They were supported by the principal in their
desire to implement a major change at this school.
Evidence for Feature D9: Leadership is Courageous and Collaborative
Feature D9 evaluates the extent to which school leadership is courageous and
collaborative. Evidence of courageous and collaborative leadership at Pilot School 3 was
collected through interviews with two teachers and a review of the school improvement plan.
These data indicated that leadership at this school was ethical, inspiring, and shared. Decision
making was shared and teachers were encouraged to take risks. This leadership style
corresponded to Variation A for this feature.
A review of the school improvement plan indicated that the focus was exclusively on
improving results on standardized tests. The plan indicated that the instructional team met
weekly and departments met weekly to discuss and implement strategies.
Interviews with members of the school staff indicated that the principal of this school was
a courageous leader who invited collaboration. Teachers characterized the principal’s leadership
style as supportive. One teacher commented that ideas came from the bottom up, with teachers
taking their ideas to the administration. An example of this was the schoolwide discipline plan
188
which was instituted with administrative support after a group of teachers visited another school
and observed the benefits.
Evidence for Feature D10: Professional Development is Aligned to School Improvement
and Best-Practice Strategies
Feature D10 evaluates the extent to which professional development was aligned to
school improvement goals. Evidence of the alignment of professional development at Pilot
School 3 was collected through interviews with a teacher and a review of documents prescribed
by the IC map. A professional development log was not available. Professional development
practices seemed to most closely correspond to Variation A for this feature.
A review of the school improvement plan indicated that professional development was
job embedded through a collaborative process. Teachers were supposed to meet to weekly to
discuss student progress with academic goals and instructional strategies. Sample meeting notes
from a department meeting confirmed that teachers collaborated to support the goals of the
school improvement plan.
Interviews with a teacher provided evidence that the administration took an active role in
recommending professional development options for teachers. The teacher cited classroom
coaching, conferences, and workshops as examples of professional development activities in
which teachers engaged.
Evidence for Feature D11: Students Have the Opportunity to Engage with the Community
Feature D11 evaluates the extent to which students have the opportunity to engage with
the community. Such engagement may take the form of authentic learning experiences, service
learning, field trips, or fundraising for charity. Evidence of opportunities for students to engage
with the community at Pilot School 3 was collected through a review of the documents
prescribed by the IC map and interviews with two teachers, an assistant principal, and a
counselor. These data indicated that students had some opportunities to engage with the
community, corresponding most closely to Variation B for this feature.
A review of key documents associated with Pilot School 3 provided evidence of some
opportunities for students to engage with the community. The school website listed YADAPP
and HOPE as student clubs that were involved with service projects. There was no evidence of
student engagement with the community on other school documents.
189
Interviews with members of the school staff indicated that students had some
opportunities such as volunteering in the library and various clubs. Service learning did not seem
to be an important part of school life at this school.
Evidence for Feature D12: The Community is Engaged in Providing Resources and
Support
Feature D12 evaluates the extent to which the community is engaged with the school by
providing resources and support. Evidence of community support at Pilot School 3 was collected
through a review of the documents prescribed by the IC map. Interviews were not conducted for
this feature. These data indicated that the community was highly engaged in providing resources
and support to the school, corresponding to Variation A for this feature.
A review of key documents associated with Pilot School 1 provided evidence of
community support of the school. The school website listed a grant provided to the school by the
Exxon Corporation. A sample newsletter listed a PTA craft show and class participation in a
“This We Believe” project sponsored by National Public Radio.
Evidence for Feature D13: Relationships with Families are Valued in Support of Students'
Success
Feature D13 evaluates the extent to which relationships between the school and families
are valued. Evidence of the value placed on family relationships at Pilot School 3 was collected
through a review of the documents prescribed by the IC map and interviews with a teacher and a
counselor. These data indicated that relationships with families are highly valued, corresponding
to Variation B for this feature.
A review of key documents associated with Pilot School 3 provided some evidence that
family relationships were valued. The school website invited parents to attend an orientation
night to prepare for the registration process for the next school year. The website also had the
school newsletter posted and staff email addresses. The staff used Blackboard, a password-
protected, web-based tool that allowed students and parents to access assignments and class
documents from home.
Interviews with members of the school staff indicated that relationships with families
were valued. The teacher reported that Blackboard was an important communication tool for the
school. The teacher reported that parents were encouraged to attend concerts, PTA meetings, and

190
activities such as the annual craft show. The counselor reported that parent workshops had been
offered at the school and parents were kept informed about academic progress through midterm
reports, conferences, phones calls, and email.
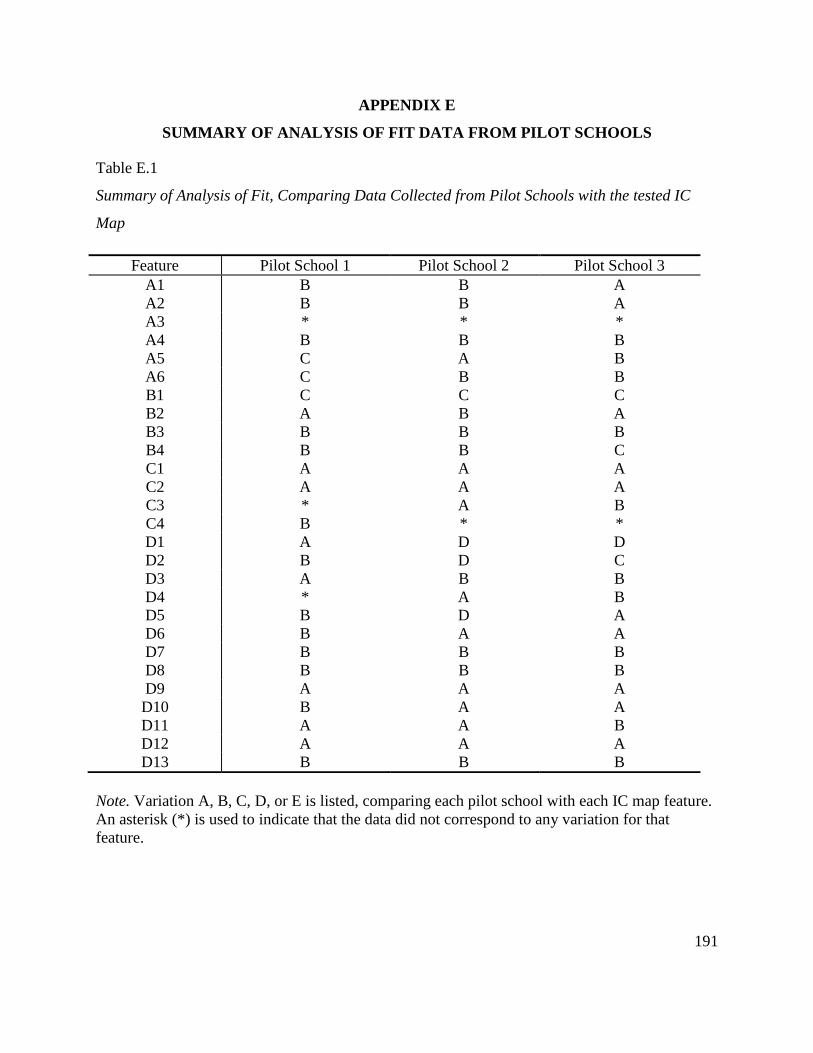
191
APPENDIX E
SUMMARY OF ANALYSIS OF FIT DATA FROM PILOT SCHOOLS
Table E.1
Summary of Analysis of Fit, Comparing Data Collected from Pilot Schools with the tested IC
Map
Note. Variation A, B, C, D, or E is listed, comparing each pilot school with each IC map feature.
An asterisk (*) is used to indicate that the data did not correspond to any variation for that
feature.
Feature Pilot School 1 Pilot School 2 Pilot School 3
A1 B B A
A2 B B A
A3 * * *
A4 B B B
A5 C A B
A6 C B B
B1 C C C
B2 A B A
B3 B B B
B4 B B C
C1 A A A
C2 A A A
C3 * A B
C4 B * *
D1 A D D
D2 B D C
D3 A B B
D4 * A B
D5 B D A
D6 B A A
D7 B B B
D8 B B B
D9 A A A
D10 B A A
D11 A A B
D12 A A A
D13 B B B
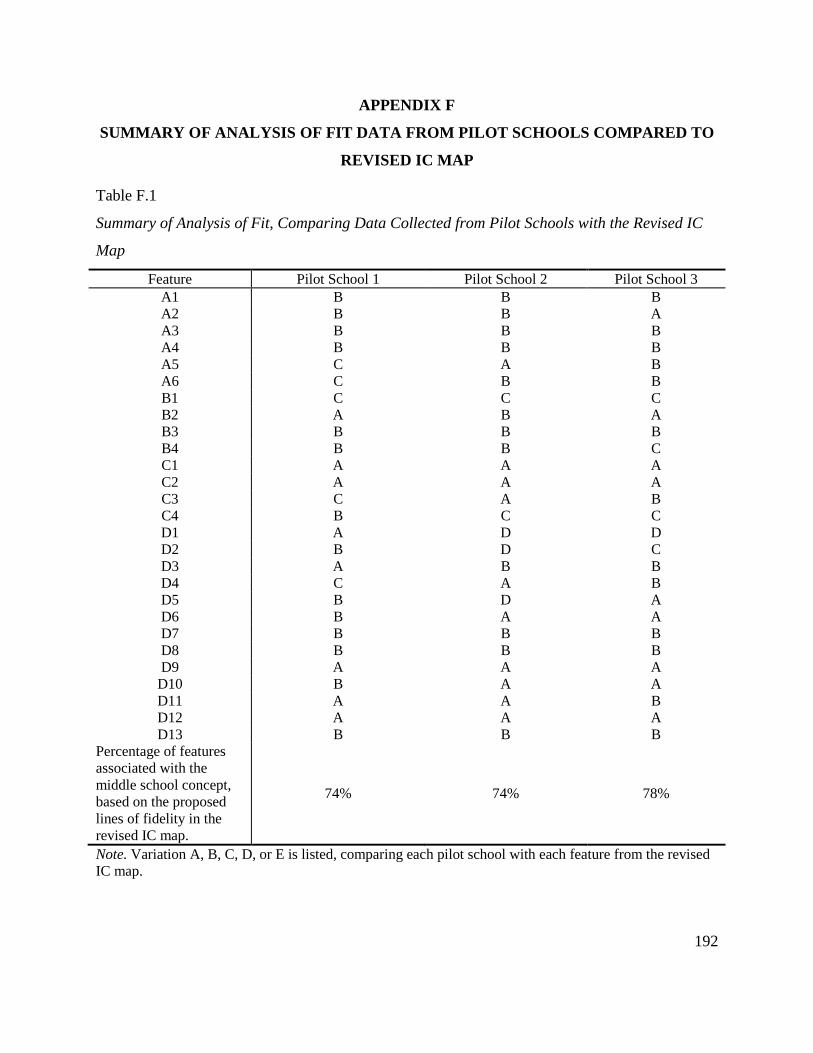
192
APPENDIX F
SUMMARY OF ANALYSIS OF FIT DATA FROM PILOT SCHOOLS COMPARED TO
REVISED IC MAP
Table F.1
Summary of Analysis of Fit, Comparing Data Collected from Pilot Schools with the Revised IC
Map
Feature Pilot School 1 Pilot School 2 Pilot School 3
A1 B B B
A2 B B A
A3 B B B
A4 B B B
A5 C A B
A6 C B B
B1 C C C
B2 A B A
B3 B B B
B4 B B C
C1 A A A
C2 A A A
C3 C A B
C4 B C C
D1 A D D
D2 B D C
D3 A B B
D4 C A B
D5 B D A
D6 B A A
D7 B B B
D8 B B B
D9 A A A
D10 B A A
D11 A A B
D12 A A A
D13 B B B
Percentage of features
associated with the
middle school concept,
based on the proposed
lines of fidelity in the
revised IC map.
74% 74% 78%
Note. Variation A, B, C, D, or E is listed, comparing each pilot school with each feature from the revised
IC map.

193
APPENDIX G
TRAINING IN HUMAN SUBJECTS CERTIFICATE


![Using the Concerns Based Adoption Model (CBAM) to ... · [The] Concerns Based Adoption Model was based on several important assumptions about the nature of change. These assumptions](https://img.pdfslide.us/doc/110x75/5f033f347e708231d40843c0/using-the-concerns-based-adoption-model-cbam-to-the-concerns-based-adoption.jpg)