Embed Size (px)
Citation preview

Lincoln University
School of Natural Sciences and Mathematics
Biology Program Assessment Report for 2010-2011
Submitted by the Faculty of the Biology Department
5/6/11
David Royer, PhD, Co-Chair
Susan Safford, PhD, Co-Chair
Anna Hull, PhD, Co-Chair
Karen Baskerville, PhD
James Gallagher, PhD
Dianne York, MS
Nancy Smith, MS

2
Table of Contents
I. Mission…………………………………….…………………..page 3
II. Program Goals…………………………………………………page 3
III. Student Learning Outcomes (SLOs) and Matrix
of Program Major Courses .…………………………..............page 4
IV. Assessment Methods and Sources of Data ……………………page 4
V. Summary Analysis of Assessment Results…………………….page 6
a. Executive Summary……………………………………page 6
b. Program Level Assessment…………………………….page 10
c. Assessment of SLO 2…………………………………..page 10
d. Assessment of SLO 4…………………………………..page 11
e. Assessment of SLO 5…………………………………..page 12
f. Assessment of SLO 6…………………………………..page 13
VI. Using Assessment Results for Program Improvement
a. Improving Teaching and Learning………......................page 14
b. Improving the Assessment Process.……………….…...page 14
VII. Planned Actions for the Next Assessment Cycle……...……….page 15
VIII. Showcasing Best Practices………………………..………..…..page 16
IX. Appendices.……………………………………………..….…..page 17

3
I. Mission
The mission of the Department of Biology is to provide a challenging and supportive
educational experience for our students so that each student can achieve his or her
educational goals. Our Biology curriculum is sufficiently diverse to prepare our students
for the broad variety of postgraduate opportunities that exist in biology; it is unified so
that each student experiences all the relevant areas of biology, and it is current and
reflective of the new information and methodology in the field. The Biology major
provides a strong grounding in biology, chemistry, physics and mathematics, and then
allows flexibility in the selection of electives. Recommendations for electives are offered
for students interested in pursuing interests in medicine, specialized graduate study, the
many careers in the allied health professions, and the teaching of biology in secondary
schools.
II. Program Goals
1. To prepare students to conduct and communicate original scientific investigations
2. To provide a curriculum that cultivates the students’ knowledge base of the foundational
areas of biology at the molecular, cellular, organismal and ecosystem levels of
organization
3. To prepare and graduate students who enter graduate school or professional school or
who obtain employment in biology-related fields
III. Program Student Learning Outcomes (SLOs)
Upon completion of the program, students will be able to:
1. Apply the scientific method and complete an independent research project.
2. Communicate effectively biological concepts through written, spoken and visual means.
3. Explain the processes that lead to evolutionary change and recognize biological structures
and functions as products of evolutionary change.
4. Relate energy flow to nutrient cycling at multiple levels of biological organization.
5. Correlate structure and function at multiple levels of biological organization.
6. Describe how genetic information is stored, expressed and transmitted from one
generation to the next.
Table 1 summarizes the courses in which each Program SLO is assessed. Each Program
SLO is assessed in at least nine courses of the twenty-one courses offered as part of the
major, and at least two of the program SLOs are measured in each course. The links
between course and program SLOs are in Appendix 1, Table 1 and the course SLOs are
listed in Appendix 1, pg 19.

4
Table 1: Program SLO Assessment by Course for the Biology Curriculum Program SLO assessed
Course Name Course ID 1 2 3 4 5 6
Introductory courses:
General Biology I 103 x x x x x
General Biology II 104 x x x x x
Core courses:
Plant and Animal Systems 209 x x x x x
Genetics 208 x x x x
Electives:
Vertebrate Physiology 302 x x x
Biological Techniques 305 x x
Histology 308 x x
Botany 309 x x x x x x
Invertebrate Zoology 310 x x x x x
Conservation Biology 311 x x x
General Ecology 312 x x x
Microbial Ecology 316 x x x x
Cancer Biology 319 x x
Microbiology 401 x x x x x
Immunology 402 x x
Developmental Biology 404 x x x x
Comparative Vertebrate
Anatomy
405 x x x x
Cell Biology 407 x x x x
Molecular Biology 408 x x x
Neuroscience 412 x x x
Senior Seminar 420 x x
IV. Assessment Methods and Sources of Data
Standards for Student Learning
The Biology Program has set 75% as the minimal acceptable score (MAS) for student
learning. Seventy-five percent was chosen because it equals a grade of C, and students
must have a C average to graduate. The score is calculated by the direct measures listed
below and determined by (1) the value earned based on a rubric, or (2) the score of the
specific questions being used for assessment from a particular direct measure (e.g. if
eight multiple choice questions from a final examination are being used for assessment,
then the student would need to get six correct (75%) to reach the MAS).
The standard for each direct measure, which is the desired percentage of students who
should reach the MAS of 75%, is listed below after each measure. The standards are
generally set higher for assignments that allow students to collaborate and use outside
resources because more students generally meet the MAS of 75% on these types of

5
measures, while the standard is set lower for more difficult direct measures. Standards are
determined based on previous years’ assessment results and will be reviewed on an
annual basis as more assessment data are collected.
Direct Measures:
1. Laboratory reports
Measured by rubrics that calculate the students’ competency in effectively communicating the hypothesis, purpose, methods, results and analysis of an
experiment.
Standard: 75% of the students should reach the MAS of 75%.
2. Laboratory notebooks
Assessed by rubrics to measure effective communication of primary research methods, results and conclusions.
Standard: 50% of the students should reach the MAS of 75%.
3. Essays
Assessed by rubrics to measure effective communication of biological concepts.
Standard: 50% of the students should reach the MAS of 75%.
4. Oral presentations
Assessed by rubrics to measure effective communication of biological concepts.
Standard: 100% of the students should reach the MAS of 75%.
5. Research papers
Assessed by rubrics to measure the students’ ability to use the scientific literature to
research a topic and to use that research to write a grammatically-correct, coherent
and well supported paper.
Standard: 75% of the students should reach the MAS of 75%.
6. Pre- and post-tests
Using select, course and program SLO-specific questions that are usually multiple choice, to assess learning.
Standard: 100% of the students should demonstrate learning gains on the post-test and
50% of students should reach the MAS of 75%.
7. In-class assignments
Designed to measure a specific SLO and assessed by rubrics.
Standard: 75% of the students should reach the MAS of 75%.
8. Homework questions
Designed to measure a specific SLO and assessed using rubrics.
Standard: 80% of the students should reach the MAS of 75%.
9. Quizzes
Entire quizzes or select quiz questions that measure a specific SLO.
Standard: 75% of the students should reach the MAS of 75%.
10. Multiple-choice (MC) questions on hour and final exams
Select MC questions designed to measure a specific SLO on exams.
Standard: 75% of the students should reach the MAS of 75%.
11. Short answer questions on hour and final exams
Select short answer and problem solving questions designed to measure a specific SLO on exams.

6
Standard: 75% of the students should reach the MAS of 75%.
12. Essay questions on hour and final exams
Select essay questions designed to measure a specific SLO on exams.
Standard: 50% of the students should reach the MAS of 75%.
V. Summary Analysis of Assessment Results
a. Executive Summary Program SLOs 2, 4, 5, and 6 were assessed in the current cycle. The report is organized
by SLO; for each SLO there is a summary analysis. The tables that show the percentage
of students achieving the MAS and the analysis and planned actions for each SLO are in
the Appendix. Tables 2 and 3 summarize the assessment methods that were used in each
course for each SLO assessed in the fall and spring respectively. The italicized
assessment methods are the ones that are discussed in this report and are summarized in
individual tables in appendix I.
Table 2: Assessment of Program SLOs in Biology, Fall 2010
The italicized direct measures are the ones that are discussed in this report and are summarized in individual tables
in the appendix.
Program SLO and assessment methods
Course Name Course ID 1 2 3 4 5 6
Introductory
Courses:
General Biology I BIO 103 Pre-post-
test
Pre-post-
test
General Biology II BIO 104 Homework
Essay on
exam
Core Courses:
Plant and Animal
Systems
BIO 209 Homework
Quiz
Elective Courses
Vertebrate
Physiology
BIO 302 Essays In-class
assignment
Botany BIO 309 Oral
Presentation
Essay on
exam
Homework
Essay on
exam
Homework
Invertebrate
Zoology
BIO 310 Research
paper
Oral
Presentation
Essay on
exams
Cell Biology BIO 406 Pre-post-
test
Pre-post-
test
Pre-post-
test

7
Table 3: Assessment of Program SLOs in Biology, Spring 2011
The italicized direct measures are the ones that are discussed in this report and are summarized in individual tables
in the appendix.
In total, 75 assessment measures were administered and the standard was met on 40 (or
53%) of these measures. For the purpose of analysis, the communication SLO (2) was
separated from the content SLOs (4, 5, and 6). The communication SLO (2) had 17
measures and the standard was met on 11. Significantly, students met the
communications SLO on oral presentations every time it was assessed, but they did not
Program SLO and direct measure
Course Name Course ID 1 2 3 4 5 6
Introductory
Courses:
General Biology I BIO 103 Pre-
post-test
Essay on
exam
Pre-post-
test
Essay on
exam
General Biology II BIO 104 Lab report Pre-post-test
Homework
Quiz
Short
answer on
exam
Pre-post-
test
Homework
Quiz
Short
answer on
exam
Core Courses:
Genetics BIO 208 Lab report Pre-post-
test
Homework
MC and
short
answer on
exam
Elective Courses
Biological
Techniques
BIO 305 Lab notebook
Conservation
Biology
BIO 311 Presentation
Research
paper
Cancer Biology BIO 319 Essays MC and
essay on
exams
Comparative
Anatomy
BIO 405 Essays Pre-post-test Pre-post-
test
Neuroscience BIO 412 In-class
assignment
Homework
Lab report
Pre-post-
test
MC on
exam
Senior Seminar BIO 420 Research
paper
Presentation
Research
paper

8
meet the standard for the same SLO as measured by writing assessment tools, especially
essays and lab reports (figure 1).
Figure 1. SLO 2: Standards met by assessment measure. The table below the
graph summarizes the number of assessments that were met and not met for each
measure.
For the content SLOs, there were a total of 58 individual measures; the standards were
met on 29 of these measures, or 50% of the time (figure 2). The standard was met more
than 50% of the time for three direct measures – homework, short answers on exams and
essays on exams, and less than 50% of the time for the remaining measures. The
standard was not met at all for in class assignments and quizzes, but there were only three
reports of these two direct measures. Although most students display learning gains
within a class as measured by pre and post-tests, the standard of everybody improving or
50% of the class meeting the MAS of 75% on the post-test was only met in two out of 11
classes.
Figure 2. Content SLOs: Standards met by Assessment Measure. The table
below the graph summarizes the number of assessments that were met and not
met for each measure.

9
When the data is analyzed by course level (figure 3), we find improvement in meeting the
standard from 100 level to 300/400 level courses. In this analysis, the 300 and 400 level
courses are combined because they are taken by a mix of juniors and seniors; the 100
level courses are taken exclusively by freshmen, and the 200 level courses are taken
almost exclusively by sophomores. More assessment measures are administered in the
300 and 400 level courses because we offer more courses at that level.
Figure 3. Standards met by course level. The table below the graph summarizes the
number of assessments that were met and not met for each course level.
In examining reasons why students are not meeting the various standards, several
common issues appear repeatedly in faculty reports. These include:
Students are underprepared coming into the introductory level courses.
Students do not retain information.
Students cannot integrate information from several sources when they are writing essays, research papers and other assignments that require this skill.
Students cannot solve problems that require a multi-step process and/or quantitative skills.
We plan to address these issues through the following actions:
Begin courses with a brief review of concepts and content that students are expected to have retained from previous classes at the beginning of each course.
Provide more learning opportunities to help retention of knowledge.
Provide more in class assignments that require writing and analysis of concepts.
Spend more time in class on how to access multiple sources and collate the material into a coherent document.
Remind students of the writing support services that exist on campus and encourage
peer proof-reading of papers.
Divide challenging concepts into step-wise problems that guide problem solving.
10
Require students to analyze why each possible answer to a multiple choice question is or is not correct.
Spend more instructional time on approaches to solving complex problems.
Incorporate more assessment measure that allow students to work collaboratively, have access to unlimited resources with relaxed time constraints.
b. Program Level Assessment Assessment at the program level was conducted under program SLO 1 in senior seminar
(BIO 420) this assessment cycle; students were assessed on a capstone research paper
using the department research paper rubric (Appendix I, Table 2 and Appendix II, pg 44).
Of the sixteen students assessed, 56% met the MAS of 75%. Our standard of 75% of the
students meeting the MAS was not met. This year, students who conducted other types of
capstone research (summer internship, study abroad, and/or research in the department)
are not included in the analysis. These students will be included in future cycles as
program SLO 2 is assessed.
c. Assessment of SLO 2
Program Student Learning Outcome 2, students’ ability to communicate biological
concepts effectively through written, spoken and visual means, was assessed in eleven
courses during the 2010-2011 academic year. The direct assessment tools included
essays, lab notebooks, lab reports, presentations and research papers. The data are
reported in Appendix I, Table 2 as the percentage of students reaching the MAS (75%)
for each direct measure; Appendix I, Table 3 shows the data analysis and proposed
actions for this SLO. The data in Table 3 can be divided into two categories, oral
presentations and written assignments; because of the disparity in students achieving the
MAS of 75% on these two types of assignments, they are considered separately.
Oral Presentations – In all five assessments using this measure, 100% of the students
achieved the MAS. In the fall (two assessments), each faculty member used a different
rubric for scoring the presentations; in the spring, a common department rubric was
developed and used to score the presentations. In interpreting the achievement rate, the
following points were viewed as significant:
Students had a full semester to develop familiarity with the subject matter for the report.
Since students chose their topic, it can be assumed that they chose a topic for which they already had an interest or some knowledge.
Students enjoy preparing PowerPoint presentations.
Students are motivated to do well in front of their peers.
Peer evaluations, which were used in one course, may produce generous scores.
Because of the high achievement rate, we will continue to have students choose topics
early in the semester and establish transition steps e.g. a required outline of the
presentation at the midpoint of the semester. If time permits within the structure of the
course, students could be required to do a shorter presentation earlier in the semester.

11
Written Assignments – Because of the diversity of written assignments, the range of the
percent of students achieving the MAS was wide (27% to 100%). Two of the direct
measures, lab reports and research papers, were scored using a common department
rubric. The students exhibited the most difficulty in achieving the MAS when writing
essays, either as part of an exam or as an assignment. In interpreting student
performance, we have identified the following issues:
It is difficult for students to gather data from multiple sources and collate it into a single document.
Students lack confidence in their ability to perform well on written assignments even
when they can choose the topic, have opportunities for revision, etc.
Students have deficiencies in grammar and spelling.
Students do not take advantage of the opportunity to submit rough drafts for review and feedback.
The lab report is a new type of assignment for many students in the freshman and sophomore years.
Actions that may improve performance in written assignments include:
more time spent in class on how to access multiple sources and collate the material
into a coherent document
instruction on how to write a lab report with emphasis on discussion of results
encourage students to meet deadlines
remind students of the writing support services that exist on campus
encourage students to ask their peers to proof read their papers
d. Assessment of SLO 4 Program Student Learning Outcome 4, students are able to connect nutrient cycling and
energy flow at multiple levels of biological organization, was assessed four times in three
different courses (two semesters of BIO 103) spanning entry level freshman to senior
students during the 2010-2011 academic year. The direct assessment tools included pre-
and post-tests, homework assignments and essay questions on exams. The data are
reported in Appendix I, Table 4 as the percentage of students reaching the MAS (75%)
for each direct measure; Appendix I, Table 5 shows the data analysis and proposed
actions for this SLO.
The few data points make strong generalizations difficult, but generally, over half the
students reached the 75% MAS. In interpreting the achievement rate, the following points
were viewed as significant:
Post-test scores were higher than pre-test scores, but the 50% standard for post-tests was not met in any class; the largest increase was 20%.
Students perform best under conditions of no time constraints and availability of multiple resources, as evidenced by the score (84%; exceeded the MAS of 75%) on
the one homework assignment assessed.
Students have difficulty writing about biological concepts, especially under time
constraints and when they have to rely upon retained knowledge.

12
A significant portion of our students struggle to answer questions or solve problems when they are required to work independently and to rely only on retained knowledge
under time restriction.
Actions that may improve performance in all assessment measures include:
more in class assignments that require writing and analysis of concepts and that
closely resemble the questions asked on exams
more homework assignments that rely on analysis and not rote memorization and that closely resemble the questions asked on exams
a brief review of concepts and content that students are expected to have retained from previous classes at the beginning of each course
Actions that may improve our ability to assess student performance include:
assessing this SLO in more classes
assessing this SLO using a wider range of assessment measures
using the same type of assessment measure in a range of courses
designing select questions to embed in various assignments across different levels of
the curriculum to better measure changes in student’s performance with repeated
exposure
e. Assessment of SLO 5
Program Student Learning Outcome 5, students’ ability to correlate structure and function
at multiple levels of biological organization, was assessed in nine courses spanning entry
level freshman to senior students during the 2010-2011 academic year. The assessment
measures included pre- and post-tests, homework assignments, in class assignments, quiz
questions, and multiple choice questions, short answer and essay questions on exams.
The data are reported in Appendix I, Table 6 as the percentage of students reaching the
MAS (75%) for each direct measure; Appendix I, Table 7 shows the data analysis and
proposed actions for this SLO. This SLO has been measured at all levels of the
curriculum.
The range of students achieving the MAS of 75% was large (0-100%) at all course levels
and with all assessment measures, although homework assignments and essays exhibited
more narrow ranges. Generally, about half the students reached the 75% MAS. In
interpreting the achievement rate, the following points were viewed as significant:
Post-test scores were higher than pre-test scores, but the 50% standard for post-tests was met in only two classes.
Students perform best under conditions of no time constraints and availability of multiple resources, as evidenced by scores on homework assignments.
Students have difficulty writing about biological concepts, especially under time
constraints and when they have to rely upon retained knowledge.
A significant portion of our students struggle to answer questions or solve problems when they are required to work independently and to rely only on retained knowledge
under time restriction.
Actions that may improve performance in all assessment measures include:

13
more in-class assignments that work through difficult problems on a step-by-step basis and that closely resemble the questions asked on exams
more homework assignments that rely on analysis and not rote memorization and that
closely resemble the questions asked on exams
a brief review of concepts and content that students are expected to have retained from previous classes at the beginning of each course
require students to analyze why each possible answer to a multiple choice question is or is not correct
Actions that may improve our ability to assess student performance include:
using the same type of assessment measures for the same SLO in a range of courses
designing select questions to embed in various assignments across different levels of the curriculum to better measure changes in student’s performance with repeated
exposure
f. Assessment of SLO 6 Program Student Learning Outcome 6, students’ ability to describe how genetic
information is stored, expressed and transmitted from one generation to the next, was
assessed in six courses during the 2010-2011 academic year. The direct assessment tools
included pre- and post-tests, homework assignments, multiple choice questions on exams,
short answers on exams, and essays on exams. The data are reported in Appendix I, Table
8 as the percentage of students reaching the MAS (75%) for each direct measure;
Appendix I, Table 9 shows the data analysis and proposed actions for this SLO.
In total, there were 13 assessment instruments, four in the fall and nine in the spring. For
the spring semester, the nine assessment instruments can be broken down into 15 separate
scores since some measures include two or more elements (e.g. the BIO 104 and 208
homework instruments measured performance on two separate genetics problems). The
standard was achieved on 10 of the 15 separate measures.
An innovation for the spring was using two different courses (BIO 140 and 208) for the
assessment of student performance on the same two genetics problems, and within the
courses, the problems were assigned as homework and appeared on at least one exam.
The first problem was based on a fundamental concept (monohybrid cross) and requires
relatively simple analysis; the MAS was achieved on all six instances for this assessment
measure. The second problem required more sophisticated analysis (dihybrid cross); the
MAS was not met in any of the five assessments by this measure. The conclusion is that
more class time needs to be devoted to more complex genetic analysis in future semesters
and that more assignments with complex analysis requirements should be developed.
For the academic year, students achieving the MAS for this SLO ranged from 0% to
96%. The lowest percentages were on pre-tests, and the higher percentages occurred in
courses that included significant genetics content – BIO 104 and 208. This suggests that
students can do well with genetics concepts when they are actively studying genetics, but
they have difficulty applying the principles in courses where genetics is not the primary
focus.

14
The collective interpretation of the assessment for this SLO includes the following
observations:
Tests do not always reflect the classroom instruction.
Students do not retain course information.
Students are not given enough learning opportunities to master course content.
Learning gains in genetics are evident from freshman year to sophomore year.
Both freshman and sophomore students master simple genetic analysis, but not complex genetic analysis.
Learning gains are observed within the BIO 208 class for the dihybrid cross.
Actions that can improve performance with respect to SLO 6 include:
improve tests to better reflect what is being taught in the classroom
provide more learning opportunities to help retention
divide challenging concepts into step-wise problems that guide problem solving
assign additional and more challenging homework assignments for this SLO
spend more instructional time on complex genetic analysis
continue to assess the dihybrid cross, as a type of complex analysis in the future for
both BIO 104 and 208 so that cohort data will be available
VI. Using Assessment Results for Program Improvement
a. Improving Teaching and Learning
We need to find ways to get students, particularly underprepared students, to take advantage of the tutoring opportunities that are available to them.
The types of questions asked on exams should better mimic those given to students in class through in-class assignments and homework assignments. This process was
begun in the spring semester and will be expanded in the future.
Class time should be used to train students in using multiple sources and in integrating the information from those sources to produce a coherent and well
structured document. It is also important to show students that the skills they so
successfully exhibit in preparing oral presentations can be adapted for written
assignments.
Provide more opportunities for students to learn collaboratively.
To stimulate retention of material, an effort should be made to structure some questions on exams so that they require incorporation of material from previous parts
of the course (or even previous courses).
b. Improving the Assessment Process
SLO 5 was the only SLO measured using the same type of direct measure in several classes during the fall semester (Table 2). A slight trend towards more students
reaching the MAS as they move through the curriculum was observed on homework
and different types of test questions. In the spring, the same types of direct measures
were used for SLOs 2, 3, 5 and 6 which gave us a better assessment of how our
students are doing as they move through the curriculum. As in the fall, there was a

15
slight trend towards more students achieving the MAS as they moved through the
curriculum.
In the fall we recognized that using different direct measures for the same SLO gives widely varying numbers for percentage of student that meet the MAS. For the spring,
we set standards for each direct measure. These standards will be improved to
enhance assessment of student learning in the Biology Program based on the data that
is collected in this and future assessment cycles.
We have begun to collect assessment data to follow cohorts.
In the fall, we decided that it would be useful to have standardized assessment tools that can be administered at different times in the curriculum to measure student
improvement over time. In the spring, we used selected genetics problems as
assessment tools in two courses – General Biology and Genetics. The data collected
will be used to make changes in how genetics problems are taught in these courses in
future assessment cycles.
Common department rubrics were developed for research papers, lab reports and oral presentations; this was done after assessing the fall results in which we discovered
that it was difficult to assess student improvement if we all used different rubrics.
Department rubrics (Appendix II, pp 41-44) were developed and used in the spring
semester.
VII. Planned Actions for the next Assessment Cycle
Assessment of Specific SLOs
In the next cycle we plan to report on the assessment of SLOs 1, 2, 4, and 6 for the
following reasons:
SLO 1, because it was not assessed in the current cycle. This SLO will be assessed through lab reports graded using the department rubric (Appendix II, pg 41).
SLO 2, because student writing as measured by essays is weak and in most cases, has
not met our standard in the current cycle. A department essay rubric will be
developed for this purpose.
SLO 4, because it is the least assessed content SLO in the current cycle.
SLO 6, because we would like to continue to collect assessment data on student solving complex problems and to continue to collect cohort data.
Improving Assessment and Instruction
Based on previous and current assessment analyses, we are planning the following
actions to improve student learning and assessment:
We have begun to and will continue to collect assessment data to follow cohorts.
The standards set for each assessment measure will be reviewed and possibly modified to enhance assessment of student learning based on the data that is collected
in future assessment cycles.
The types of questions asked on exams should better mimic those given to students in class through in-class assignments and homework assignments. This process was
begun in the spring semester and will be expanded in the future.
Class time should be used to train students in using multiple sources and in integrating the information from those sources to produce a coherent and well
structured document.

16
We will provide more opportunities for students to learn collaboratively.
To stimulate retention of knowledge by our students, we will structure some
questions on exams so that the answers will require incorporation of knowledge from
previous parts of the course (or even previous courses).
VIII. Showcasing Best Practices
Standardization of Rubrics – We used common rubrics in the spring of 2011 for grading oral presentations, research papers and lab reports. This allows us to
compare the performances of our students longitudinally from freshman to senior
years. In future years, the common rubrics will also allow us to review the
performance of cohorts as they progress through the curriculum.
MAS and Standards – A minimal acceptable score (MAS) of 75%, corresponding to a C grade, was established, and standards were identified for each type of direct
measure based on the level of difficulty of the measure. This has given us a tool to
measure student performance within courses and to compare performance between
courses and between assessment methods.
Pair-wise Comparisons – Two identical genetics problems were used multiple times in two courses, General Biology and Genetics, to allow for a pair-wise comparison; in
every case, the same rubric was used to score the problems. This provided the
opportunity to measure student retention of information within these two courses and
between the courses. While this type of pair-wise comparison may not be feasible for
many of our courses, it provides a unique perspective when it can be used.

17
Appendices
Content
Appendix I
2010-2011 Results and Analysis
Table 1: Course and program SLO links 18
List of course SLOs 19 Table 2: Program SLO 2: Percentage of students reaching the minimally
acceptable score (75%) for each direct measure 24
Table 3: Program SLO 2 Analysis and Proposed Actions 24
Table 4: Program SLO 4: Percentage of students reaching the minimally
acceptable score (75%) for each direct measure 27
Table 5: Program SLO 4 Analysis and Proposed Actions 27
Table 6: Program SLO 5: Percentage of students reaching the minimally
acceptable score (75%) for each direct measure 29
Table 7: Program SLO 5 Analysis and Proposed Actions 29
Table 8: Program SLO 6: Percentage of students reaching the minimally
acceptable score (75%) for each direct measure 33
Table 9: Program SLO 6 Analysis and Proposed Actions 33
Appendix II
Sample Assignments, Direct Measures and Rubrics
Direct Measure for BIO 103 with Rubrics 37
Direct Measure for BIO 104 and 208 with Rubrics 38
Research Assignment for BIO 311 40
Biology Program Common Rubric for Laboratory Reports 41
Biology Program Common Rubric for Research Papers 43
Biology Program Common Rubric for Oral Presentations 44

18
Table 1: Course and program SLO links
Course SLO linked to program SLO
Course Name Course ID pSLO 1 pSLO 2 pSLO 3 pSLO 4 pSLO 5 pSLO 6
Introductory
Courses:
General Biology I BIO 103 cSLO 4 cSLO1, 28-31 cSLO 3 cSLO19-27 cSLO2, 5-
18
General Biology II BIO 104 cSLO
8,9
cSLO 10 cSLO 7,8,9 cSLO 1-6
Core Courses:
Genetics BIO 208 cSLOlab cSLO 1-8
Plant and Animal
Systems
BIO 209 cSLO 1 cSLO 2, 10-12 cSLO
3,4,6-9, 13-
17
cSLO 5
Elective Courses
Vertebrate
Physiology
BIO 302 Skill
cSLO 1,
2, 4
Skill SLO 3, 5 cSLO 1, 2
Biological
Techniques
BIO 305 cSLO 1,
5-8
cSLO 2 cSLO 4
Botany
BIO 309 cSLO 2, 9 cSLO 1 cSLO 3, 4, 7, 8 cSLO 5, 6
Invertebrate
Zoology
BIO 310 cSLO 4 cSLO
1,2
cSLO 3
Conservation
Biology
BIO 311 cSLO 1,
2
cSLO 3 5 cSLO 2, 4
Cancer Biology
BIO 319 cSLO 1, 11-13 cSLO 6-10 cSLO 2-5
Comparative
Anatomy
BIO 405 Skill SLO 1-3 cSLO 3 cSLO 1, 2
Cell Biology BIO 406 cSLO
13
cSLO14,15 cSLO 6 cSLO 1, 2,
7-11
cSLO 3-6,
12
Neuroscience BIO 412 cSLO 4, 7 cSLO 1-3,
5
Senior Seminar
BIO 420 cSLO 2 cSLO 1, 3

19
List of course SLOs BIO 103, General Biology I, course SLOs:
Content Outcomes:
1. Learn new vocabulary necessary to read and write well about biology
2. Be able to distinguish between prokaryotic and eukaryotic cells
3. Understand the basic classification system used for living organisms
4. Use and describe hypothesis-based science
5. Distinguish between elements and compounds
6. Name and define subatomic particles
7. Draw atoms based on atomic number and weight
8. Name and describe the different types of chemical bonds
9. Discuss the importance of hydrogen bonding to the properties of water
10. Describe the emergent properties of water and how they contribute to life on earth
11. Understand the relationship between pH and the structure of a water molecule
12. Draw and identify the structures of the basic organic molecules
13. Draw and identify the variations in the carbon skeleton that contribute to molecular diversity
14. Draw and identify the six basic functional groups associated with organic molecules
15. Distinguish between monomers and polymers
16. Learn the names and identify the structures of the different types of basic organic molecules
17. Learn the names and functions of the main cellular organelles, and identify them in drawings of cells
18. Learn the main components of cell membranes
19. Name and describe the three main types of transport across and through cell membranes
20. Describe the structure and function of ATP
21. Describe how enzymes work and discuss factors that influence enzyme function
22. Describe in detail the biochemical processes of glycolysis, citric acid cycle, and electron transport
23. Describe the light and dark cycles of photosynthesis
24. Describe the main steps in cell signaling
25. Describe in detail two different cell signaling systems – G-coupled protein receptors and tyrosine kinase receptors
26. Name and describe the two main phases of the cell cycle
27. Name and describe the phases of each the two main phases of the cell cycle
Skill Outcomes:
28. Learn to use a science textbook effectively
29. Navigate through course specific courseware and use it to help you learn on your own
30. Apply time management principles to complete assignments on time
31. Write well-constructed paragraphs on scientific subjects
BIO 104, General Biology II, course SLOs:
1. describe the process by which cells divide to produce gametes
2. explain how meiosis and sexual reproduction lead to genetic diversity
3. explain the Mendelian rules of inheritance and non-Mendelian patterns of inheritance
4. be able to solve genetics problems involving monohybrid and dihybrid crosses involving incomplete dominance, codominance,
epistasis and sex linked inheritance
5. describe the structure of DNA and the chromosomal basis of inheritance
6. explain, in a stepwise fashion, the processes of transcription and translation
7. describe how viruses infect cells
8. explain evolution and natural selection
9. evaluate the evidence for evolution
10. describe the structure and functions of ecosystems
BIO 208, Genetics, course SLOs:
1. Describe in words and illustrations the progression of two pairs of chromosomes through all the stages of mitosis and meiosis.
2. Perform monohybrid, dihybrid and testcrosses and identify the genotypes and phenotypes of all possible first and second generation
offspring in mononybrid and dihybrid crosses, including crosses containing epistatic interactions.
3. Perform chi-square analysis on genetic data and be able to determine the statistical significance of genetic outcomes.
4. Compare and contrast sex-linked and sex-influenced inheritance
5. Perform pedigree analysis of genetic traits; you will be required to analyze a family of your choice for a particular genetic trait.
6. Describe the structure and function of DNA and RNA
7. Draw and describe a replication fork and replicate a short DNA sequence.
8. With the aid of the genetic code, transcribe a gene and translate the transcript into a protein.
BIO 209, Plant and Animal Systems, course SLOs:
By the end of the Plant Systems section, you will be able to:
1. Reflect on and discuss the role of plants on earth and in your life
2. Describe the role of photosynthetic organisms in evolution.
3. Describe the function of the three basic plant tissue types and identify them in each organ.
4. Describe how water and nutrients are transported in plants
5. Define alternation of generations and correctly identify meiotic and mitotic divisions in the life cycle of the plant.
By the end of the Animal Systems section, you will be able to:
6. Discuss how physical laws and the environment affect animal form.

20
7. Correlate animal form and function with the hierarchical levels of organization from molecules to the organism, with emphasis on the
tissue, organ, and organ system levels.
8. Describe the structures in and functions of the digestive, circulatory, respiratory, immune, urinary, endocrine, nervous, skeletal,
muscular, and reproductive systems.
9. Understand metabolism and discuss how animals use chemical energy to maintain form and function.
10. Describe the regulation of the internal environment of an animal by homeostasis and diagram homeostatic mechanisms.
11. Reflect on how carbon and essential nutrients are extracted from an animal’s diet.
12. Describe the processes of ingestion, digestion, absorption, and elimination.
13. Discuss and illustrate gas exchange across a respiratory membrane.
14. Describe the excretory functions of the kidney.
15. Discuss neural and hormonal control.
16. Describe how an animal senses and carries out motor functions.
17. Distinguish between asexual and sexual reproduction.
BIO 302, Vertebrate Physiology, course SLOs: 1. be able to describe mechanisms of action of various physiological actions
2. be able to discuss special physiology cases
Skill SLOs:
1. be able to read and critique scientific articles on physiology
2. be able to use search engines and databases to find articles on specific physiological topics
3. be able to write grammatically and scientifically accurate essays on various topics in physiology
4. be able to interpret graphs and tables
5. be able to orally present a topic in physiology to a group of peers
BIO 305, Biological Techniques, course SLOs:
1. Enhance your experience in laboratory techniques in biology.
2. Keep an appropriate research notebook
3. Do basic laboratory techniques, such as preparing solutions and pipetting correctly.
4. Understand recombinant DNA concepts.
5. Isolate genomic DNA.
6. Analyze DNA by agarose gel electrophoresis, restriction digests, and PCR.
7. Do southern blotting and hybridization of PCR products.
8. Become familiar with western blotting techniques.
BIO 309, Botany, course SLOs:
1. Describe in writing how the evolution of photosynthesis enabled to the move of life from the oceans to land.
2. Discuss in writing how the modern world depends on plants.
3. Detail how energy is harvested from sunlight during photosynthesis.
4. Describe the different adaptations that plants have made to reduce photorespiration.
5. Identify ground, vascular and dermal tissues in all organs of both moncots and eudicots.
6. Identify and describe in words and illustrations the organs of the plant body.
7. Know the essential elements required for plant growth.
8. Describe in writing the transport of water and nutrients in plants during changing environmental conditions.
9. Communicate, in writing and through a presentation about a plant of your choice.
BIO 310, Invertebrate Zoology, courseSLOs:
1. Students will be able to describe the evolutionary relationships of the major invertebrate phyla.
2. Students will be able explain the taxonomy of the invertebrates.
3. Students will be able to compare and contrast the characteristics of the major invertebrate phyla including anatomy, physiology of
principal systems, distribution and ecology.
4. Students will be able to illustrate the relationships of selected invertebrates to humans.
BIO 311, Conservation Biology, course SLOs:
1. Students can chart the history of extinctions on Earth.
2. Students can explain the processes that lead to speciation and increases in biodiversity.
3. Students can analyze the balance between human needs and the needs of other species.
4. Students can describe common methods used to prevent extinction and assess the effectiveness of these methods.
5. Students can identify the geographic areas that are most likely to be used for human needs and the species that are at risk if these areas
are utilized for humans.
BIO 319, Cancer Biology, course SLOs:
1. Describe the hallmarks of cancer.
2. Learn the types of gene mutation possible and how these mutations can contribute to cancer formation
3. Describe an oncogene and why it is important in cancer development
4. Describe the cell cycle, its regulation, and how cell cycle dysfunction can lead to cancer
5. Describe the function of tumor suppressor genes.
6. Describe how external or internal stimuli can lead to apoptosis.
7. Describe how cancer cells escape cell death.
8. List and describe the steps that lead to metastasis
9. Describe how chronic inflammation and infectious agents can lead to cancer

21
10. Explain the role of diet in cancer development and cancer prevention
Skill Outcomes
11. Expand scientific comprehension
a. Learn major components of scientific journal articles
b. Learn to interpret data published in scientific journal articles
c. Analyze and critique, in written and oral form, published cancer biology articles.
12. Learn to Organize data and information for presentation
13. Develop public speaking skills
BIO 405, Comparative Anatomy, course SLOs: 1. Analyze the concept of the complementarity of structure and function as exemplified by the effect of body size and shape on function
2. Compare and contrast systems (skeletal, muscular, digestive, respiratory, urinary, circulatory, and reproductive) among vertebrate classes.
3. Analyze the relationship between evolutionary concepts and our current understanding of modern morphology
Skill SLOs:
1. Draw accurately various structures in a wide variety of animals
2. Construct well written essays on the relationship between different structures and their functions
3. Orally present concepts of anatomy through reporting out in class on group problems
BIO 406, Cell Biology, course SLOs:
1. Cellular polymer biosynthesis
2. Protein Structure and function
3. How chromosomal DNA code is converted into protein
4. Gene Expression Control
5. Genetic Manipulation
6. DNA replication
7. Cellular energy generation
8. Membrane structure and transport
9. How cells communicate with each other
10. Apoptosis/necrosis
11. Cellular structure proteins
12. Eukaryotic Cell Meiosis and mitosis
13. Expand scientific comprehension
a. Learn major components of scientific journal articles
b. Learn to interpret data published in scientific journal articles
c. Analyze and critique, in written and oral form, published cancer biology articles.
14. Learn to Organize data and information for presentation
15. Develop public speaking skills
BIO 412, Neuroscience, course SLOs:
1. To differentiate the structure and function of neurons (nerve cells) and glia.
2. To discuss how and where sensory, motor, and integrative functions are processed in the brain and spinal cord, thus gaining a deeper
understanding of the correlation of the anatomy and physiology of the brain and spinal cord.
3. To calculate an equilibrium potential, using the Nernst equation, and describe the events in an action potential.
4. To outline in written and visual form how neurotransmitters are released at a synapse.
5. To demonstrate familiarity with the anatomical, physiological, neurochemical, and genetic bases of brain diseases, behavior, and
learning and memory.
6. To describe how the brain is wired, i.e. developed, how plastic changes can occur in the brain, and how aging affects the brain.
7. To read, evaluate, analyze, and discuss journal articles in the neuroscience literature.
Lab:
1. To identify the anatomical parts of the brain.
2. To correlate structure and function of the neuron and the brain as a whole.
3. To discuss how genes influence brain function.
4. To design an experiment, write a research paper based on the experiment, and present data like a neuroscientist.
BIO 420, Senior Seminar, course SLOs: 1. Prepare a 40 minute class lecture with a group on a textbook topic (SLO 2)
2. Construct a well written research paper following guidelines and a grading rubric on a
biology issue, presenting multiple viewpoints in its ethical considerations, backed up by biological evidence (SLO 1)
3. Orally present the research paper and lead a classroom discussion on the issue (SLO 2)

22
Appendix I, Table 2: Program SLO 2: Percentage of students reaching the minimal
acceptable score (75%) for each direct measure
Percentage of students meeting the minimal acceptable score of 75%
per direct measure
Course Course
ID
Semester Essays Lab
notebook
Lab report Presentation Research
paper
Gen Bio II BIO 104 Spring 70%
Genetics BIO 208 Spring 70%
Vertebrate
Physiology
BIO 302 Fall 47%-71%
Bio
techniques
BIO 305 Spring 82%
Botany BIO 309 Fall 100%
Invertebrate
Zoology
BIO 310 Fall 100%
Conservation
bio
BIO 311 Spring 100%
100%
Cancer Bio BIO 319 Spring 73%
Comp.
Anatomy
BIO 405 Spring 27% - 54%
Neuroscience BIO 412 Spring 80%
Senior
Seminar
BIO 420 Spring 100%
56%
Appendix I, Table 3: Program SLO 2 Analysis and Proposed Actions Direct Measure Results Interpretation Proposed Actions
Three essays in
BIO 302
One essay in BIO
319
Two essays in BIO
405
In BIO 302, 7 students were
assessed
47%, 71% and 52% achieved the
MAS on the three exams
The standard of 50% was achieved
on 2 out of 3 assignments.
In BIO 319, 23 students were
assessed.
The average score was 86%, with a
range of 67-100%
73% met the MAS
The standard was met
In BIO 405, the first essay was
answered by 13 students and the
second essay by 11 students.
The average score on the first essay
was 76% and 62% on the second
essay.
54% met the MAS on the first essay
and 7% met the MAS on the
Students struggle when
they have to collate data
from several sources but
do much better when the
information can be found
in one source
Expose students to
more in-class examples
on how to gather,
analyze and collate data
from several sources
In the fall, the program
considered raising the
standard for essays as
most measures show
that we meet the low
standard of 50%
Based on the fall and
spring data, it is prudent
to keep the standard at
50%

23
second essay.
The standard was met on the first
assessment, but not on the second
assessment measure.
Lab notebook in
BIO 305 11 students were assessed in BIO
305
The average score was 90%, with a
range of 75-100%
82% of the students met the MAS
The standard of 75% was met
By the end of the
semester, when the
assessment measure was
administered, the students
had mastered the skill of
lab-notebook keeping
through access to ample
examples and one mid-
semester submission with
feedback.
Access to example
notebooks and early
feedback will be
continued; this
approach is a result of
assessment data from
previous year and the
approach has
effectively lead to
mastery of the SLO.
Lab report in BIO
104, measured
using a rubric
Lab report in BIO
208, measured
using a rubric
Lab report in BIO
412, measured
using a rubric
33 students were assessed in BIO
104
The average score was 81%, with a
range of 51%-99%
70% if the students met the MAS
The standard of 75% was not met
27 students were assessed on BIO
208
The average score was 80%, with a
range of 70%-93%
70% if the students met the MAS
The standard of 75% was not met
14 students were assessed in Bio
412
The average score was 81%, with a
range of 68%-98%.
80% of the students met the MAS
The standard of 75% was met
In the freshman and
sophomore years students
do not meet the standard
because they are
inexperienced in writing
lab reports, however, the
average and range for
both years indicate that
the standard will be
achieved in the junior or
senior year.
In the upper-level class
the standard is met
Continue to require lab-
reports throughout the
curriculum so that
students have plenty of
learning opportunities
to gain mastery of this
skill.
One oral
presentation in BIO
309 measured by a
rubric and graded
by the professor
and the students.
One oral
presentation in BIO
310 measured by a
rubric and graded
by the professor.
21 students were assessed
The average score was 92%, with a
range of 78%-99%
100% achieved the MAS
The standard of 100% was met.
12 student were assessed in BIO
310
The average was 83% with a range
of 75% to 91%
100% achieved the MAS.
The standard of 100% was met.
The high percentage
achieving the MASs is
likely due to student’s
familiarity and/or interest
in the topic because they
were required to research
the same topic all
semester
Students are motivated to
do a good job in front of
their peers
Students find the
preparation of PowerPoint
presentations an enjoyable
task
Continue with oral
presentations for
semester-long topic at
the end of the semester
Introduce a presentation
early in the semester to
measure progress
within the class
Use new rubric
designed by the
Biology program to
measure improvement
across classes and
follow cohorts
Have the students

24
One oral
presentation in BIO
311
Two oral
presentations in
BIO 420. The first
was a group
presentation.
The second was an
individual
presentation
20 students were assessed in BIO
311
The average score was 86% with a
range of 80-90%
100% achieved the MAS
The standard of 100% was met.
17 students were assessed in BIO
420 on the first presentation
The average score was 90% with a
range of 80-95%
100% achieved the MAS
The standard of 100% was met.
15 students were assessed in BIO
420 on the second presentation
The average score was 85% with a
range of 78-91%
100% achieved the MAS
The standard of 100% was met.
Peer-evaluation may have
lead to relaxed
evaluations
Subjective rubric allowed
students to give each
other inflated scores
In Bio 310 , some
students had to change
their topics late in the
semester as they learned
there was insufficient
research material to
support the topic.
choose their topics
earlier in the semester.
Develop assignments
and a calendar that
force the students to
complete certain steps
in the preparation of
their presentation
according to the
calendar.
Research Paper in
BIO 311 graded on
the department
research paper
rubric
Research Paper in
BIO 420 graded on
the department
research paper
rubric
20 students were assessed in BIO
311
The average score was 93%, with a
range of 85%-96%
100% achieved the MAS
The standard of 75% was met.
16 students were assessed in BIO
420
The average score was 77%, with a
range of 50%-90%
56% achieved the MAS
The standard of 75% was not met.
Students who did well
were engaged with the
topic.
The assignment was
clearly defined with
submission dates for
topic, outline, references
and rough drafts.
Students had the
opportunity to submit
drafts and do multiple
revisions.
Students who took the
opportunity to submit
rough drafts did well.
Students who did poorly
had not turned in drafts
and did therefore not have
time for revisions.
Grammar and spelling is a
common weakness.
BIO 420 is only required
for students who have not
completed summer
internships, research
internships at LU or study
abroad programs. Such
opportunities are usually
only available for the top
half of the class.
Therefore, the students
attending BIO 420 mostly
Research papers with
specific guidelines and
several deadlines for
different components
will continue to be used
in upper-level classes.
The importance of
handing in all
components of the
research paper on time
will be emphasized.

25
belong to the bottom half
of the class
Appendix I Table 4: Program SLO 4: Percentage of students reaching the minimal acceptable
score (75%) for each direct measure Percentage of students meeting the MAS of 75% per direct
measure
Course Course ID Fall, Spring Pre-post-test Homework Essay on exam
Gen Bio I BIO 103 Fall Increased from 3% to
21%
Gen Bio I BIO 103 Spring Increased from 4% to
24%
34%
Botany BIO 309 Fall 84%
60%-75% (3
questions)
Cell Biology BIO 406 Fall Increased from 0% to
10%
Appendix I Table 5: Program SLO 4 Analysis and Proposed Actions Direct Measure Results Interpretation Proposed Actions
Pre and post-tests
in BIO 103 (fall)
and BIO 406
Pre and Post Test in
BIO 103 (spring),
10 MC questions
29 students were assessed in BIO
103 and 21 in BIO 406
The percentage achieving the
MAS increased from 3% to 21%
in BIO 103 and from 0% to 10%
in BIO 406.
The standard of reaching overall
improvement was met, but the
standard of 50% reaching the
MAS was not met.
25 students assessed were
assessed in BIO 103 (spring)
The average was 27% with the
range of 0-80%
4% met the MAS of 75% on the
pre-test
29 students were assessed with a
post test containing the same 10
questions.
The average was 63% with a
range of 20-100%
24% met expectations by
reaching the MAS.
The standard of 50% was not met
for this class, neither was the
standard of 100% of the students
improving.
No improvement was seen
from fall to spring in the
same class (BIO 103).
Tests do not reflect course
contents, or the questions
are too difficult
Students are having
difficulty answering
multiple choice questions
Students do not retain
course information
Students are not given
enough learning
opportunities to master
course content
Professor was not clear
enough of their expectations
for student knowledge in
this subject matter
Students did not put
necessary time into studying
the material
Students were not prepared
sufficiently prior to entering
the class
Improve test to better
reflect course content
Provide more learning
opportunities to allow
the students to master
and retain the SLO
Questions will be
reviewed to make sure
they are clear for
students
More challenging
homework will be
assigned to ensure
students are rigorously
keeping up with their
studies.
Allow more time to
review material in the
classes before exams
are given
Homework about
photosynthesis in
the form of
multiple choice
20 students were assessed
84% of the students achieved the
MAS on the homework
assignment.
The high percentage of
students achieving the MAS
on homework is likely due
to students’ ability to
Assign more
challenging homework
assignments
Design more in-class

26
questions on
WebCT in BIO 309 The standard of 80% was met. collaborate with peers,
consult outside references
and take time to finish the
work
and homework
assignments to measure
the SLO
Design rubrics to grade
consistently the newly
designed assignments
Essay on exam in
BIO 103 (spring)
Essays on exams in
BIO 309
29 students assessed on a
multipart essay question
The average for the class was
55% with a range of 14%-100%
10 out of 29 (34%) of the students
achieved the MAS on the essay.
The standard of 50% was not met.
16 students were assessed in BIO
309
60-75% of the students achieved
the MAS on three separate test
questions.
The standard of 50% was met.
Improvement was observed
from freshmen to juniors
In BIO 309, the high
percentage of students
achieving the MAS on essay
test questions indicates that
students master the SLO
In BIO 103, the low
percentage of students
achieving the MAS could be
due to:
Students have difficulty
answering essay questions
Essay question was too
difficult for the students to
achieve
Continue to use test
questions to measure
the SLO because
proficiency should
include the ability to
retrieve knowledge
without collaboration
with peers or external
sources under time-
constraints
More challenging
homework will be
assigned to ensure
students are rigorously
keeping up with their
studies.
More time will be spent
in recitation practicing
essay writing and how
to formulate proper
outlines of information
for essays

27
Appendix I Table 6: Program SLO 5: Percentage of students reaching the minimal acceptable
score (75%) for each direct measure Percentage of students meeting the MAS of 75% per direct measure
Course Course
ID
Semes
ter
Pre-post-
test
HW In class
assignment
Quiz MC on
exam
Short
answer
on
exam
Essay
on
exam
Gen Bio I BIO 103 Fall Increased
from 6%
to 40%
43%
Gen Bio I BIO 103 Spring Increased
from 0%
to 26%
43%
Plant Animal
Systems
BIO 209 Fall 78%-
94%
56%
Vertebrate
Physiology
BIO 302
Fall 14% 17%-
83%
17%-
50%
33%
Botany BIO 309 Fall 84%-
100%
67%-
90%
25%-
50%
Invertebrate
Zoology
BIO 310 Fall 30%-
58%
Comp.
Anatomy
BIO 405 Spring Increased
from 0%
to 14%
Cell Biology BIO 406 Fall Increased
from 5%
to 23%
Neuroscience BIO 412 Spring Increased
from 0-
50%
64% 16-
100%
Appendix I Table 7: Program SLO 5 Analysis and Proposed Actions Direct Measure Results Interpretation Proposed Actions
Pre and post-tests
in BIO 103 (fall)
and BIO 406
Pre and post-test in
BIO 103 (spring)
29 students were assessed in BIO
103 and 21 students in BIO 406
The percentage of students
achieving the MAS increased from
6% to 40% in BIO 103 and from
5% to 23% in BIO 406
The standard of reaching overall
improvement was met, but the
standard of 50% reaching the MAS
was not met.
25 students were assessed in BIO
103 (spring)
The average score on the pretest
was 28%, with a range of 0-60%.
The average score on the post-test
was 45%, with a range of 0-100%
None of the students met the MAS
of 50% on the pre-test, while 26%
Student learning gains are
achieved, but they are
not sufficient to meet the
standard
Tests do not reflect course
contents
Students do not retain
course information
Students are not given
enough learning
opportunities to master
course content
Students do best on
knowledge-based
questions, but have
difficulties with questions
requiring analysis,
synthesis and evaluation.
Students exposed to the
Improve test to better
reflect course content
Provide more learning
opportunities to allow
the students to master
and retain the SLO

28
Pre and post-test in
BIO 405 (spring)
Pre and post-test in
BIO 412 (spring)
of the students met the MAS on the
post test
The standard of 50% for the post-
test was not achieved.
The standard of every student
improving was not met
12 students were assessed in BIO
405
The average on the pretest was
20%, with a range of 0-40%
The average on the post-test was
44%, with a range of 0-100%
The standard of 50% meeting the
MAS on the post-test was not
achieved, neither was the standard
of all students improving from the
pre-test to the post-test
11 students were assessed in BIO
412
The average on the pre-test was
41% with a range of 20-67%
The average on the post-test was
73% with a range of 45-100%
The standard of 50% for the post
test was met and the standard for
100% improvement was met.
subject matter through
research perform better on
the pre and post tests.
Two homework
assignments on the
urinary system and
immunology in
BIO 209 and
homework about
the structure and
function of roots,
stems and leaves
using 30 multiple
choice questions on
WebCT in BIO 309
18 students were assessed in BIO
209 and 20 students were assessed
in BIO 309
78-94% of the students in BIO 209
achieved the MAS on the two
homework assignments.
84-100% of the students in BIO 309
achieved the MAS.
The standard of 80% meeting the
MAS was almost met in both
classes.
High percentages of
students achieving the
MAS n homework is
likely due to students’
ability to collaborate with
peers, consult outside
references and take time
to finish the work
Give more challenging
homework assignments.
Design more in-class
and homework
assignments to measure
the SLO
Design rubrics to grade
consistently the newly
designed assignments
In-class assignment
on the digestive
system in BIO 302
7 students were assessed
The average was 36% with a range
of 0-100%
14% of the students achieved the
MAS.
The standard of 75% was not met
on this one assignment.
This particular assignment
was very difficult
Professor felt that she did
not have enough time in
class to support the
students during the in-
class assignment
Give in-class
assignments that step-
wise increases the
difficulty level
Quiz on the
circulatory system
in BIO 209
18 students were assessed in BIO
209
The average was 74% with a range
of 0-92%
56% of the students achieved the
This quiz was the first in
the animal portion of the
course, students were
uncertain of what to
expect
In the future, student
will be given more
learning opportunities
to master the material
before quizzes.

29
Quizzes in BIO 412
MAS.
The standard of 75% was not met.
14 students were assessed in BIO
412
The average was 69% with a range
of 0-100%
64% of the students met the MAS
The standard of 75% was not met
Student had limited time
solving in-class
assignments with this
professor before the quiz
Keep the standard at
75% and work on
improving student
learning in and out of
class to reach the
standard.
MC questions on a
unit exam and a
final exam in BIO
302
MC questions on
three unit exams in
BIO 412. The third
exam was on
WebCT
7 students were assessed in BIO 302
The percentage achieving the MAS
was 83% on the unit exam, but
when the same questions were
asked on the final exam the
percentage was only 17%
While the standard of 75% was met
directly after learning took place, it
was not met at the end of the
semester.
14 students were assessed in BIO
412
The average (range) on the three
exams were: 65% (40-100%), 62%
(21-94%) and 94% (85-100%).
The percentage of students that met
the MAS was 43%, 16% and 100%.
The standard of 75% was only met
on the WebCT exam
Students do not retain
information
Students do not study old
exams for the final
Faculty do not emphasize
the importance of
studying old exams prior
to the final exam
Not enough time is spend
on review in the class
Students do much better
when they can answer the
questions at their leisure
and are allowed to
collaborate and use
outside resources.
Emphasize importance
of studying old exams
for the final.
Increase opportunity for
review in the classes,
especially before the
final exam.
Provide more feed-back
on MS questions, for
example, students may
be allowed to gain
points by explaining
why answers are correct
or incorrect on their
exams.
Short answer
questions on hour
exams in BIO 302
about the immune
system and the
urinary system and
in BIO 309 about
plant organs
7 students were assessed in BIO
302, while 21 students were
assessed in BIO 309
17% - 50% achieved the MAS in
BIO 302, while the percentage in
BIO 309 was 67% - 90%.
The standard of 50% was met in
BIO309, but only on one short
answer question in BIO 302.
Low percentages of
students achieving the
MAS may be due to
students inability to
retrieve information under
time-pressure
Students often seem to
have a difficult time
drawing or articulate
learned information – or
apply learned information
to solve new problems.
Short answer questions on
exams may be too
different from
assignments that students
have access to
Reduce time pressure
on exams by making
shorter exams
Practice phrasing
answers and drawing
structures in class or on
homework assignments
Write questions that
mimic more precisely
the other learning
opportunities that the
students have been
given access to
30
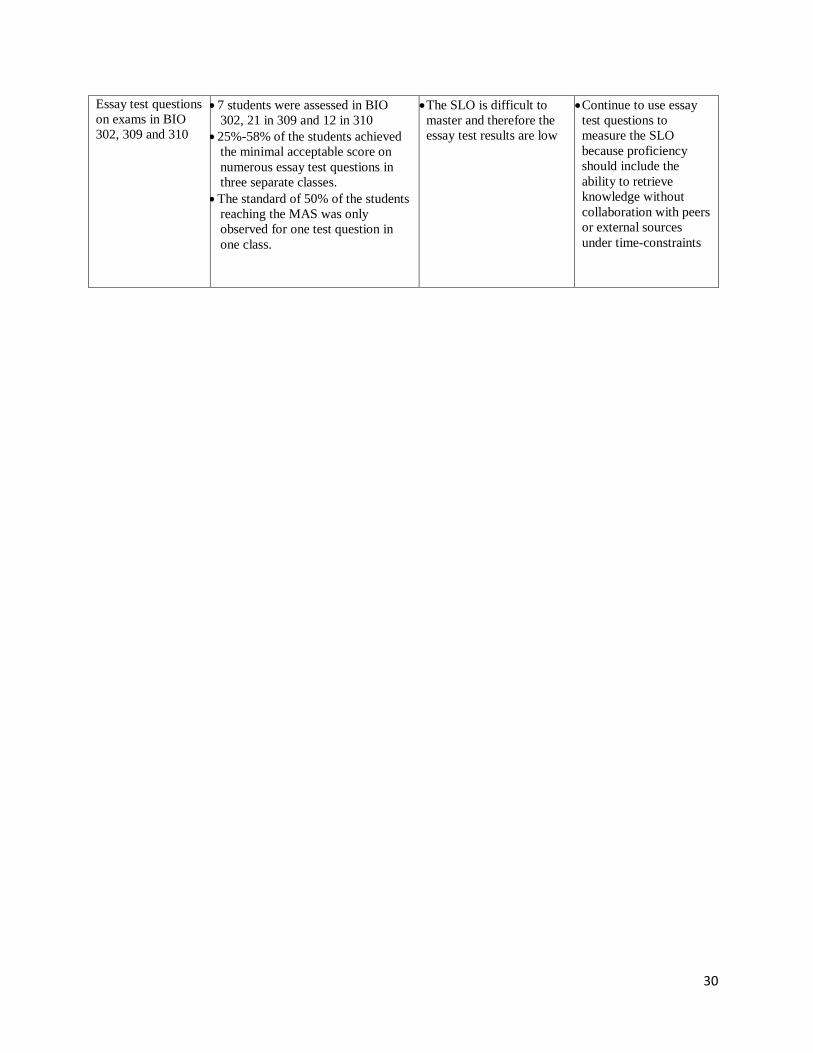
Essay test questions
on exams in BIO
302, 309 and 310
7 students were assessed in BIO
302, 21 in 309 and 12 in 310
25%-58% of the students achieved
the minimal acceptable score on
numerous essay test questions in
three separate classes.
The standard of 50% of the students
reaching the MAS was only
observed for one test question in
one class.
The SLO is difficult to
master and therefore the
essay test results are low
Continue to use essay
test questions to
measure the SLO
because proficiency
should include the
ability to retrieve
knowledge without
collaboration with peers
or external sources
under time-constraints

31
Appendix I Table 8: Program SLO 6: Percentage of students reaching the minimal
acceptable score (75%) for each direct measure Percentage of students meeting the MAS of 75% per direct measure
Course Course
ID
Semester Pre-post-test Homework MC
on
exam
Short
answer
on
exam
Essay on
Exam
Gen Bio II BIO 104 Fall Increased from 0% to
27%
23% - 86% 36% -
91%
Gen Bio II BIO 104 Spring Increased from 13% to
72%
71% - 94% 65% -
91%
Genetics BIO 208 Spring Increased from 0%
to70%
48%-96% 70% 52%-
95%
Cancer
biology
BIO 319 Spring 75% 78%
Cell biology BIO 406 Fall Increased from 5% to
14%
Appendix I Table 9: Program SLO 6 Analysis and Proposed Actions Direct Measure Results
Interpretation Proposed Actions
Pre and post-tests
in BIO 104 and
BIO 406 (fall)
Pre and post-tests
in BIO 104 and
BIO 208 (spring)
23 students were assessed in BIO
104 and 21 in BIO 406
The percentage of students who
achieved the MAS increased from
0% to 27% in BIO 104 and from
5% to 14% in BIO 406
The standard of reaching overall
improvement was met, but the
standard of 50% reaching the MAS
was not met.
32 students were assessed in BIO
104
The average on the pre-test was
53%
The average on the post test was
82%
13% achieved the MAS on the pre-
test. This increased to 72% on the
post-test.
The standard of 75% on the post
test was not met, neither was the
standard of 100% of the students
improving
28 students were assessed in BIO
208
The average on the pre-test was
50%
The average on the post-test was
84%
Tests do not always reflect
learning opportunities
Students do not retain
course information
Students are not given
enough learning
opportunities to master
course content
Students do better on this
SLO in their sophomore
year, because they were
exposed to it as 2nd
semester freshmen and
some of the information is
retained from the freshman
year and then emphasized
in a semester-long course
(BIO 208) in the
sophomore year
Learning gains are
observed from freshman to
sophomore year in genetics
content.
Improve test to better
reflect learning
opportunities
Provide more learning
opportunities to allow
the students to master
and retain the SLO

32
None of the students achieved the
MAS on the pre-test, while 70%
met the MAS on the post-test.
Both the standards of 50% meeting
the MAS on the post test and
100% of the students improving
were met.
Homework on
genetics problems
in BIO 104 (fall)
Homework on
identical genetics
problems in BIO
104 and BIO 208
(spring)
23 students were assessed in BIO
104
The percentage of students
achieving the MAS ranged from
23% to 86% on three separate
genetics homework assignments
The standard of 75% is met on all
assignments except for on the most
challenging problem-solving
homework
36 student were assessed in BIO
104 (spring) on the monohybrid
cross
The average was 87%, with a
range of 10-100%
94% of the students met the MAS
of 75%
The standard was met
38 students were assessed in BIO
104 (spring) on the dihybrid cross
The average was 73% with a range
of 0-100%
71% of the students met the MAS
The standard was not met
27 students were assessed in BIO
208 on the monohybrid cross
The average was 96% with a range
of 40-100%
The 75% MAS was met by 96% of
the students
The standard of 75% was met
25 students were assessed in BIO
208 on the dihybrid cross.
The average was 75%, with a
range of 18-100%
48% of the students met the MAS.
The standard of 75% was not met
The low percentage of
students achieving the
MAS on the most
challenging genetics
homework is consistent
with results from previous
years
The higher percentages on
other homework
assignments are likely due
to students’ ability to
collaborate with peers,
consult outside references
and take time to finish the
work
Slight learning gains are
observed from the
freshman to sophomore
year on the monohybrid
cross
For the dihybrid cross,
fewer students met the
MAS in the sophomore
class, however the average
was slightly increased and
the range was more narrow
in the sophomore year.
Divide challenging
concepts into step-wise
problems that guide
problem solving –
especially on
homework
Assign more
challenging homework
assignments
Design more in-class
and homework
assignments to measure
the SLO
Design rubrics to grade
consistently the newly
designed assignments

33
Five MC questions
on final exam in
BIO 208
MC questions on
unit exams in BIO
319
30 students were assessed
The average was 80% with a range
of 20-100%
70% met the MAS of 75%
The standard of 75% was not met
24 students were assessed
The average was 79%, with a
range of 40-100%
75% met the MAS of 75%
The standard of 75% was met
Students are retaining this
information from previous
classes
The subject matter will
be expanded upon to
give students a
stronger foundation for
advanced degrees
Short answer or
problem solving on
exams in BIO 104
and BIO 208
(spring)
39 students were assessed on the
monohybrid cross in BIO 104 on a
unit exam
The average was 94% with a range
of 0-100%
92% of the students met the MAS
of 75%
The standard of 75% was met
40 students were assessed on the
monohybrid cross in BIO 104 on
the final exam
The average was 90% with a range
of 20-100%
90% of the students met the MAS
The standard of 75% was met
29 students were assessed on the
monohybrid cross in BIO 208 on a
unit exam
the average was 95%, with a range
of 20-100%
93% of the students met the MAS
The standards was met
30 students were assessed on the
monohybrid cross in BIO 208 on
the final exam
The average was 95%, with a
range of 40-100%
95% of the students me the MAS
The 75% standard was met
40 students were assessed on the
dihybrid cross in BIO 104 on the
final
The average was 71%, with a
range of 0-100%
65% of the students reached the
MAS
The 75% standard was not met
Both freshmen and
sophomore students master
the monohybrid, but not
the dihybrid cross.
Students show minimal
learning gains from
freshman to sophomore
year on both monohybrid
and dihybrid crosses.
Learning gains are
observed within the
sophomore course for the
dihybrid cross.
Spend less class-time
on the monohybrid
cross and more on the
dihybrid cross.
Increase the hands-on
learning opportunities
for students to master
the dihybrid cross
Continue to assess only
the dihybrid cross in the
future in both BIO 140
and BIO 208 so that
cohort data will be
available; it may be
more informative of
actual learning gains
since it would follow
the same students.

34
29 students were assessed on the
dihybrid cross in BIO 208 on a
unit exam
The average was 68% with a range
of 10-100%
54% students met the MAS
The 75% standard was not met
30 students were assessed on the
dihybrid cross in BIO 208 on the
final exam
the average was 75% with a range
of 20-100%
67% of the students met the MAS
The 75% standard was not met
Essay test questions
on exams in BIO
104
Essay test questions
on exams in BIO
319
23 students were assessed in BIO
104
46%-64% of the students achieved
the MAS on five separate genetics
questions on the final exam.
The standard of 50% was met on 3
out of the 5 questions
23 students were assessed
The average was 87% with a range
of 53-100%
78% met the MAS
The 50% standard was met
The problem on which the
lowest percentage of
students achieved the MAS
(36%) was a dihybrid
cross, a type of problem
with which the students
consistently struggle.
Relatively high
percentages on essay test
questions are indicative of
student mastery of the SLO
Provide more learning
opportunities for
dihybrid cross problems
to allow student
mastery
Continue to use test
questions to measure
the SLO because
proficiency should
include the ability to
retrieve knowledge
without collaboration
with peers or external
sources under time-
constraints

35
Appendix II. Direct Measure for BIO 103 with Rubrics
BIO 103 Assessment Plan
SLO 4
A pre-post-test will be administered. Further, the students will be assessed via MC questions on
sectional exams as well as an essay. The essay being used for assessment is below followed by
the appropriate grading rubric:
Question:
Please explain how the electron transport chain works. Follow the process from NADH up to
and including to the creation of ATP. Also please state how the process is different with FADH2
instead of NADH.
Rubric:
The question is worth a total of 7 points which will be 25% of the exam. Each student will
receive points for including:
1 pt for mentioning NADH donating its electrons to Complex 1
1 pt for explaining how electrons are passed from complexes and electron carriers
down a chain.
1 pt for explaining how Complexes I, III and IV push H+ across the inner
mitochondrial membrane.
1 pt for discussing how this forms an electrochemical gradient.
1pt for discussing how H+ are permitted to come back across the membrane through
ATP- synthase creating ATP.
2 pts for using proper essay format
SLO 5
A pre-post-test will be administered. Further, the students will be assessed via MC questions on
sectional exams as well as an essay. The essay being used for assessment is below followed by
the appropriate grading rubric.
Question:
Cell cycle. Please tell me the process of the cell cycle. In particular, tell me the names of the
phases as well as what happens in each phase with particular reference to the nucleus, DNA,
centrosomes and microtubules.
Rubric:
The question is worth a total of 8 points which will be 25% of the exam. Each student will
receive points for including:
1 pt Prophase - Chromosomes condense, Centrosomes begin to move to poles
1 pt Prometaphase - Nuclear envelope dissolves, centrosomes align on the poles, microtubules form attached to the centrosomes.
1 pt Metaphase—Chromosomes line up along the metaphase plate.
1 pt Anaphase—Chromosomes start to move along the microtubules to the poles
1 pt Telophase—Nuclear envelopes reform and chromosomes start to decondense.
1 pt Cytokinesis—Cell Membranes reform
2 pts for using proper essay format

36
Appendix II. Direct Measure for BIO 104 and 208 with Rubrics
The ability to solve genetics problems is an important proficiency in biology majors as it requires
critical thinking and quantitative skills, but it is an ability that develops slowly in many students.
Because of its importance, we are planning to assess this ability in the spring, 2011 semester in
two courses, General Biology II (Biology 104) and Genetics (Biology 208). We will use the two
problems shown below for assessment. The problems will be explained in class, among other
examples, then assigned on homeworks, and included on an hour exam and on the final exam. In
all cases, the problems will be worth 10 points and graded using the rubrics that appears below.
At the end of the semester, student performance on these two problems will be assessed to
determine (1) proficiency rates based on earning at least 7.5 points of the 10 possible points and
(2) improvement rates with each opportunity to solve the problems.
Problem 1 (monohybrid cross):
In pea plants, the gene for tall plants is dominant to the gene for dwarf plants. I cross a
heterozygous plant with a homozygous recessive plant.
a. Do the Punnett square for this cross using a one-letter abbreviation for each trait
b. What is the genotypic ratio that results from this cross? Give both the ratio and the genotypes.
c. What is the phenotypic ratio that results from this cross? Give both the ratio and the
phenotypes.
Rubric for Problem 1:
a. 4 points for the correct construction of the Punnett square
- 2 points for the correct gamete genotypes
- 2 points for the correct offspring genotypes
b. 3 points for the correct genotypic ratio
- 2 points for the correct ratio numbers
- 1 point for the inclusion of the correct genotypes
c. 3 points for the correct phenotypic ratio
- 2 points for the correct ratio numbers
- 1 point for the inclusion of the correct phenotypes
Problem 2 (dihybrid cross):
In watermelons, bitter fruit is (B) is dominant over sweet fruit (b), and yellow spots (E) are
dominant over no spots (e). The genes for these two characteristics assort independently. A
homozygous plant that has bitter fruit and yellow spots is crossed with a homozygous plant that
has sweet fruit and no spots. The F1 offspring are crossed to produce the F2 generation.
a. Draw out the parent cross using the letters for the genes given above and give the genotype(s)
of the F1 offspring.

37
b. Using the same letters as in a, draw out the F1 cross and give the F2 offspring.
c. What will be the phenotypic ratio in the F2 generation? (Show both the genotypes and
phenotypes with the ratio)
Rubric for Problem 2:
a. 3 points for the correct parent cross with the F1 offspring
- 1 point for each correct genotype (BBEE, bbee and BbEe)
b. 4 points for the correct F2 cross (most students will use a Punnett square for this)
- 1 point for each major correct genotype (B_E_, bbE_, B_ee, bbee)
c. 3 points for the correct phenotypic ratio
- 1 point for the correct ratio numbers
- 1 point for the inclusion of the correct phenotypes
- 1 point for the inclusion of the correct genotypes

38
Appendix II. Sample of assignment to be assessed in BIO 311
Biology 311 – Conservation Biology
Research Paper/Presentation Timeline
The assignment is to research and report on a single species that is classified as vulnerable,
endangered, critically endangered on the IUCN Red List.
For each of the submissions below, I will review your submitted materials and return your
submission with comments and suggestions.
1. Choose a species from the listing at http://www.iucnredlist.org. Instructions will be given in
class on how to use this website.
Deadline: Friday, January 28
2. Identify five references for the species that you have chosen. The website above should be
one of those references.
Deadline: Friday, February 11
3. Submit an outline of what you plan to cover in your paper/presentation.
Deadline: Friday, February 25
4. Submit a rough draft of your research paper.
Deadline: Friday, March 11
5. Submit a rough draft of your presentation.
Deadline: Friday, March 25
Class presentations will be on Friday, April 8th
, Monday, April 11th
and Wednesday, April
13th
Papers will be due on Thursday, April 14th

39
Appendix II. Biology Program Common Rubric for Laboratory Reports
Lab Report
Exceeds
Expectations
Meets
Expectations
Approaches
Expectations
Does Not Meet
Expectations
Rubric, Pg 1 90-100% 75-89% 55-74% Below 55%
TITLE (5%)
Describes the lab
experiments
concisely and
accurately
Describes the lab
experiments
concisely and
accurately
Basic experiment is
described but
description is
slightly incomplete
Average - basics
covered, but
incomplete
description of the
lab.
Substantially
incomplete and/or
inaccurate
ABSTRACT (15%)
Significance,
hypothesis, purpose,
methodological
approach, results,
conclusion
Clearly stated
purpose/question,
method, results,
conclusion and
related to big picture
Contains all
directives but is
slightly lacking in
clarity and
conciseness
Major errors,
lacking 1-2
directives or most
are not stated clearly
or concisely
Missing several
directives, unclear,
major errors
INTRODUCTION
(10%) Background
including references,
hypothesis,
justification for
experiments (tie
background to rest
of report)
Clearly stated
background with
references. The
background is tied
into a clearly and
accurately stated
hypothesis.
Minor errors in the
background (like
lack of references or
no connection
between background
and hypothesis.
Major errors.
Lacking either
background with
references or an
outline/hypothesis.
Unclear. Major
errors and
omissions.
RESULTS (20%)
Results should be
presented in tables,
figures and graphs
that have legends
and are easy to
understand. All
tables, figures and
graphs MUST have
paragraph format
text that supports
and references the
material in the
figure.
All results are
presented in a
clearly stated
fashion. All figures
and tables labeled
and supported by
paragraph format
text.
Mostly accurate, no
omissions, all
figures and tables
supported by
paragraph format
text. Minor errors in
one or two areas. No
major error.
Multiple major
errors or missing 1-2
directives. Tables
and figures not
supported by text in
paragraph format.
Unclear, major
errors and
omissions.
Totals for columns

40
Lab Report
Exceeds
Expectations
Meets
Expectations
Approaches
Expectations
Does Not Meet
Expectations
Rubric, Pg 2 90-100% 75-89% 55-74% Below 55%
DISCUSSION
(20%) Summary of
results. Re-visit
hypothesis, did your
results support the
hypothesis?
Discussion of major
concepts,
significance and
techniques. Relation
to background with
references.
Suggestions for
improvement.
Clearly stated
summary and
conclusions. Critical
thinking applied to
discussion of
principles,
significance and
techniques. All
directives met.
Clearly stated
summary and
conclusions. Critical
thinking applied to
discussion. Minor
omissions/errors in
discussion.
Conclusions are
unclear and
disorganized. Lack
of in-depth analysis.
Lacking 1-2
directives in
discussion.
Conclusions unclear
and disorganized.
Critical thinking
skills not applied.
Major omissions in
discussion.
REFERENCES
(10%) References
cited correctly in the
text and formatted
correctly in the
reference list at the
end of the
document.
Perfect in fulfilling
all directives
appropriately.
Contains all required
fields but minor
errors, references
used appear
sufficient.
Minor Errors or
omissions. A few
references missing
or not proper
references.
Major errors or
omissions, did not
follow directives,
lacking references,
lack of or poor
paraphrasing.
WRITING (10%)
Cohesion and
organization (logic
and flow) Grammar,
spelling. Format
followed.
Cohesive, Concise,
Organization
enhances
presentation.
Guidelines met.
Proper grammar and
spelling.
Average
organization, some
areas could be better
organized. Minor
errors in both
guidelines and
grammar and
spelling.
Language usage not
proper. Major errors
in grammar and
spelling. Little to no
Cohesion
Chaotic. Detracts
from presentation.
Guidelines not met.
Major errors in
language usage.
Totals for columns

41
Appendix II. Biology Program Common Rubric for Research Papers
Research Paper
Exceeds
Expectations
Meets
Expectations
Approaches
Expectations
Does Not Meet
Expectations
Rubric 90-100% 75-89% 55-74% Below 55%
CONTENT (65%)
Clear thesis statement
(main idea), logical and
systematic development
of thesis, supporting
details and examples,
strong conclusion,
factual accuracy,
originality, content
organization -
introductory paragraph,
body of paper, summary
paragraph, and
conclusion
The thesis is stated
clearly in one
sentence in a strong
introductory
paragraph and well
developed with
supporting details
throughout the
body. Concise
summary and
strong conclusion
are given. The
content is logical,
original, and
accurate.
The thesis is
stated clearly in
a good
introductory
paragraph; more
supporting
details could be
presented.
Content is
accurate and
logical for the
most part.
Content
organization is
adequate.
The thesis needs
to be stated more
clearly and
developed more
systematically in
the body of the
paper. More
supporting
details and
examples are
needed. The
introductory
paragraph and
conclusion are
not strong.
The thesis is
unclear and not
developed. The
content is not
logically or
systematically
presented. Most
content is
inaccurate or not
supported with
details. Major
problems with
content
organization. No
originality.
REFERENCES (15%)
References cited
correctly in text and
formatted correctly in
reference list; adherence
to guidelines regarding
format of references and
number of references
Perfect in fulfilling
all directives
appropriately. All
references used are
of scholarly quality
and are important
to the researched
topic.
Contains all
required
elements but
minor errors in
formatting.
References used
appear sufficient.
Minor errors and
omissions. A few
references are
missing and/or
cited/formatted
incorrectly.
Some references
used are not
important to the
topic or not good
quality.
Major errors in
citations and
formatting and
omissions. Did
not follow
guidelines. Most
references used
are not important
and poor quality
or completely
lacking
references.
MECHANICS OF
WRITING (20%)
Adherence to guidelines
regarding page length,
fonts, spacing, margins,
cover page; correct
grammar, punctuation,
and spelling; sentence
structure (well-structured
and varied); transitions
(logical flow and
connection of ideas);
sequencing (logical
order); proper language
Paper is clear and
well written.
Guidelines met
completely.
Correct grammar,
punctuation, and
spelling. Well-
structured, clear,
concise, and varied
sentences. Logical
and cohesive
organization.
Minor errors in
guidelines,
grammar,
punctuation, and
spelling.
Average
organization,
some areas could
be better
organized.
Several elements
in guidelines not
met. Major
grammatical and
spelling errors.
Improper use of
language.
Several areas
could be better
organized. Little
to no cohesion.
Guidelines not
met. Unclear.
Poor organization.
Not cohesive.
Major errors in
grammar,
punctuation,
spelling, and
language usage.
Totals for columns

42
Appendix II. Biology Program Common Rubric for Oral Presentations
Presentation
Exceeds
Expectations
Meets
Expectations
Approaches
Expectations
Does Not Meet
Expectations
Rubric, Pg 1 90-100% 75-89% 55-74% Below 55%
Content (60% of
total points)
Objectives/hypothesis/
purpose
(15%)
Testable hypothesis
with objectives or
purpose is clearly
stated
Testable hypothesis
clearly stated;
objectives or purpose
incomplete
Hypothesis not
testable and/or
objectives incomplete
or poorly described
Hypothesis missing or
not testable as written
and/or objectives
poorly written or
missing
Main Ideas (15%)
The main ideas that
will be discussed are
presented with
supporting
documentation and
linked to hypothesis
Main ideas discussed
with inadequate
supporting
documentation and
inadequate connection
to hypothesis
Main ideas poorly
discussed, supporting
documentation
incomplete and/or
linkage to hypothesis
or purpose tenuous or
missing
Main ideas are
missing or listed with
no supporting
documentation; no
connection to
hypothesis, purpose,
or objectives
Introduction (10%)
Well researched
background material
discussed that support
hypothesis and main
ideas, and any
contradictory
evidence is discussed
An adequate amount
of material is
presented that
supports the
hypothesis and main
idea, but contradictory
information not
presented and/or
background material
not adequately linked
to hypothesis or main
idea
Insufficient
background material,
but what is presented
supports the
hypothesis and main
ideas; material may
not be well linked to
hypothesis and main
idea
Background
information is
inadequate and/or not
linked to hypothesis
and main ideas;
contradictory ideas
not presented
Conclusion (10%) A clear trajectory
from hypothesis or
purpose, main ideas of
research, and
background
information is made to
derive well-stated and
reasoned conclusions
Well stated
conclusions, but
connection to
hypothesis and
background
information unclear,
or conclusions may
not be complete
Inadequate or
incomplete
conclusions due to
poor trajectory from
hypothesis to
conclusions, with no
clear role of
background or main
ideas
The trajectory from
hypothesis through
ideas and background
material is not clear,
leading to poorly
worded and reasoned
conclusions or
conclusions not stated
References (10%) Correct number and
types of references in
accordance with
guidelines and they
were well chosen to
support hypothesis
and main ideas
Correct number and
types if references in
accordance with
guidelines (or only 1
missing), but the
references don’t
completely support
hypothesis and main
ideas
Number and/or types
of references not in
accordance with
guidelines OR quality
of references
insufficient to support
hypothesis and main
ideas
Number and/or types
of references not in
accordance with
guidelines;
insufficient to support
hypothesis and main
ideas
Totals for columns:

43
Presentation
Exceeds
Expectations
Meets
Expectations
Approaches
Expectations
Does Not Meet
Expectations
Rubric, Pg 2 90-100% 75-89% 55-74% Below 55%
Presentation (40% of
total points)
Organization (10%) Well organized with
hypothesis/
purpose/objectives
clearly stated up front;
arguments and
supporting evidence
for hypothesis
logically organized
with sufficient
information, but not
too much;
acknowledgements
and references
included
Organization allows
the logic of the idea
and supporting
evidence to be
followed, but some
information may be
presented out of order,
or some is missing
Major gaps in the
order of presentation
of information;
difficult to follow
arguments and
supporting evidence
for hypothesis
The order of
information is not
logical; ideas and
supporting
information jump
around; important
information lacking
Preparation (10%) All deadlines were
met; hypothesis and
main ideas well
thought out with
excellent supporting
figures; graphics
appropriate but not
overwhelming;
answers all or most
questions well
Most or all deadlines
met; hypothesis and
main ideas adequate,
but lack evidence of
long, deep thought;
supporting figures
adequate, but could be
improved; graphics
inappropriate – either
too much, too little, or
not relevant; answers
most questions
adequately
Missed some
deadlines; hypothesis
and main ideas
inadequate and show
evidence of being put
together with little
thought; lacks
appropriate supporting
figures; graphics
either insufficient,
irrelevant or
overwhelming;
answers only some
questions adequately
Met deadlines late;
hypothesis and main
ideas poorly presented
with little or no
supporting figures;
graphics either
completely missing or
overwhelm the
message; can’t answer
questions
Delivery (10%) Student dressed
appropriately; arrives
on time; poised;
makes eye contact;
doesn’t read from
notes or screen;
introduces each topic
before slide comes up;
answers questions
with confidence
Most of the following
apply and student
lacking in no more
than two areas:
Student dressed
appropriately; arrives
on time; poised;
makes eye contact;
doesn’t read from
notes or screen;
introduces each topic
before slide comes up;
answers questions
with confidence
Student’s appearance
is acceptable, but
interaction with
audience, and
confidence in
discussing material is
lacking
Most of the following
apply:
Inappropriate dress,
late arrival, eye
contact lacking, reads
from notes or slides,
can’t introduce each
topic; lack of
confidence apparent in
answering questions
Totals for columns:

44
Presentation Exceeds
Expectations
Meets
Expectations
Approaches
Expectations
Does Not Meet
Expectations
Rubric, Pg 3 90-100% 75-89% 55-74% Below 55%
Visuals (10%) Presentation is
pleasing to look at;
slides aren’t too
crowded; information
on each slide is
limited to one aspect
of the topic; fonts
large enough to read;
sharp contrast
between background
and font color;
appropriate figures,
such as pictures,
molecular structures,
etc. available from
internet are used to
illustrate main topic,
ideas, and data;
number of slides is
sufficient to length of
presentation (about
1/minute)
Presentation has most
of the qualities of an
exemplary
presentation, but one
or two may be missing
or inadequate
The presentation is
not pleasing to look
at; some of the slides
are difficult to read
due to color or font
choice, or
arrangement or
amount of material on
slide; figures and
pictures to illustrate
topic and ideas are
lacking or inadequate
Overall presentation
does not visually pull
in audience; most or
all slides are crowded
or lack important or
exciting material;
Topics on slides aren’t
logically organized;
colors and/or font
sizes make reading all
or most slides
difficult; pictures to
illustrate topic and
ideas are missing or
inadequate
Totals for columns:


![Histology Slides - mediconotes.commediconotes.com/freenotes/basic/histology_laboratory_slides.pdf[Histology] Histology Slides MedicoNotes provides real laboratory Histological slides](https://img.pdfslide.us/doc/110x75/5ae110e87f8b9a5a668e6aa3/histology-slides-histology-histology-slides-mediconotes-provides-real-laboratory.jpg)