Embed Size (px)
Citation preview
MID-TERM EVALUATION REPORT JENGA JAMAA II PROJECT
DFAP AID-FFP-A-11-00006
Prepared for
ADRA October 2014
Evaluation Team: Bertin Bisimwa Baharanyi, Bryan Crawford-Garrett, Charlie Kabanga Hughes, Kathy Tilford, Ange Tingbo
Supported by: Bernard Crenn, Damien Porcher, Behnaz Raufi, Brian Sage
JENGA II Mid-Term Evaluation Report i
Table of Contents Executive Summary ............................................................................................................................................................. viii I. Introduction .................................................................................................................................................................... 1
a. (E)DRC context ......................................................................................................................................................... 1 b. JENGA II project summary ................................................................................................................................... 1
II. MTE Scope ........................................................................................................................................................................ 3 a. Goal and Objectives ................................................................................................................................................. 3 b. MTE Key Questions and Sub-themes ............................................................................................................... 3 c. Evaluation team ........................................................................................................................................................ 4 d. Data Collection Methods, Sites, and Analysis ............................................................................................... 4 e. Constraints and limitations ................................................................................................................................. 6
III. MTE Findings and Recommendations .................................................................................................................. 9 a. Introduction and organization of findings .................................................................................................... 9 b. Findings in relation to the Results Framework ......................................................................................... 10
Strategic Objective 1: Food insecure farming households with increased incomes ....................... 10 Strategic Objective 2: Improved health and nutritional status of children under 5 ....................... 22 Strategic Objective 3: Increased women’s socio-economic empowerment in food insecure communities .................................................................................................................................................................. 34 Strategic Objective 4: Strengthened community resilience to food security shocks ...................... 48
IV. General and Cross-cutting Observations and Recommendations .......................................................... 54 a. General Observations ........................................................................................................................................... 54 b. General Recommendations ................................................................................................................................ 56 c. Program Management Observations and Recommendations ............................................................. 57 d. Cross-cutting Themes .......................................................................................................................................... 64
i. BCC.......................................................................................................................................................................... 64 ii. Gender ................................................................................................................................................................... 67 iii. Environmental Compliance .......................................................................................................................... 68 iv. FFW ........................................................................................................................................................................ 70
e. Commodities ............................................................................................................................................................ 73 f. Evaluation Themes and Conclusions ............................................................................................................. 77
JENGA II Mid-Term Evaluation Report ii
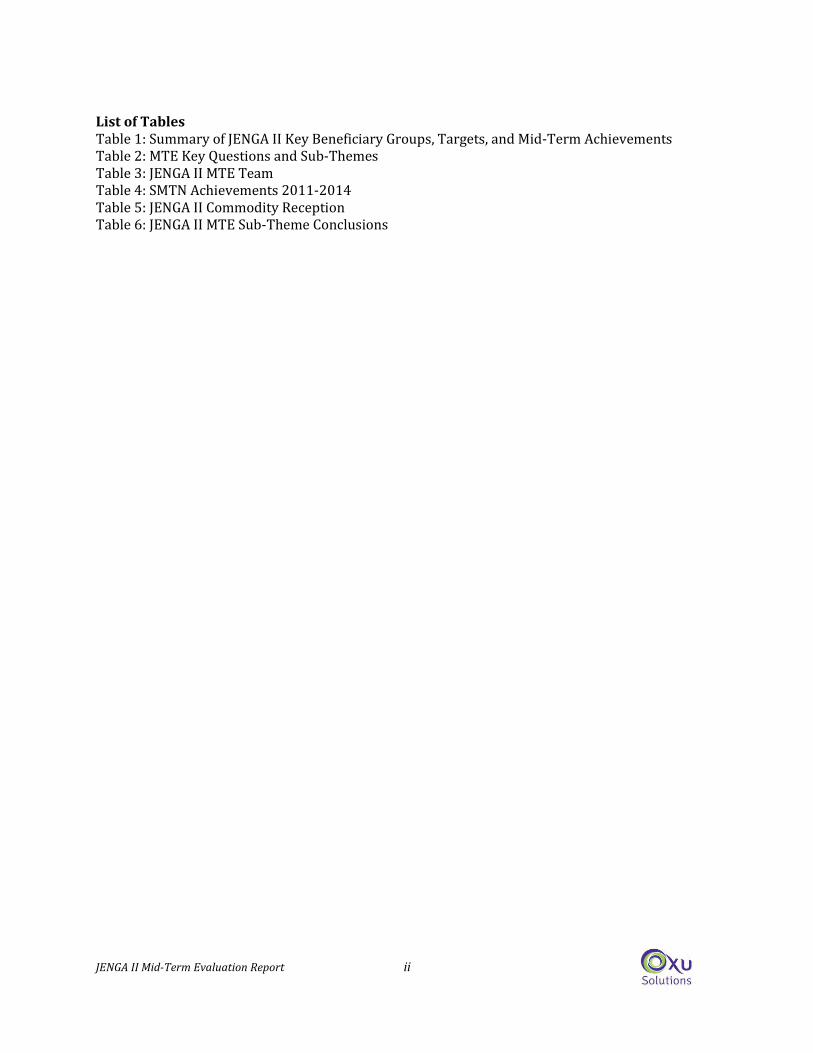
List of Tables Table 1: Summary of JENGA II Key Beneficiary Groups, Targets, and Mid-Term Achievements Table 2: MTE Key Questions and Sub-Themes Table 3: JENGA II MTE Team Table 4: SMTN Achievements 2011-2014 Table 5: JENGA II Commodity Reception Table 6: JENGA II MTE Sub-Theme Conclusions
JENGA II Mid-Term Evaluation Report iii
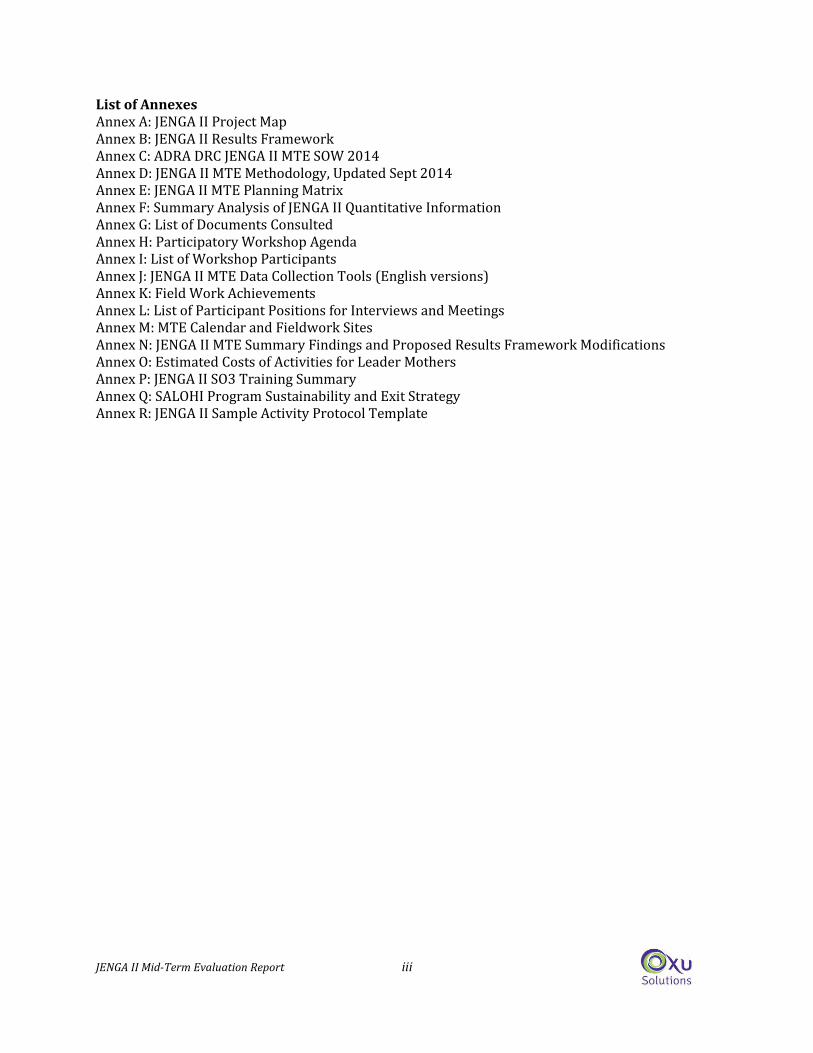
List of Annexes Annex A: JENGA II Project Map Annex B: JENGA II Results Framework Annex C: ADRA DRC JENGA II MTE SOW 2014 Annex D: JENGA II MTE Methodology, Updated Sept 2014 Annex E: JENGA II MTE Planning Matrix Annex F: Summary Analysis of JENGA II Quantitative Information Annex G: List of Documents Consulted Annex H: Participatory Workshop Agenda Annex I: List of Workshop Participants Annex J: JENGA II MTE Data Collection Tools (English versions) Annex K: Field Work Achievements Annex L: List of Participant Positions for Interviews and Meetings Annex M: MTE Calendar and Fieldwork Sites Annex N: JENGA II MTE Summary Findings and Proposed Results Framework Modifications Annex O: Estimated Costs of Activities for Leader Mothers Annex P: JENGA II SO3 Training Summary Annex Q: SALOHI Program Sustainability and Exit Strategy Annex R: JENGA II Sample Activity Protocol Template
JENGA II Mid-Term Evaluation Report iv
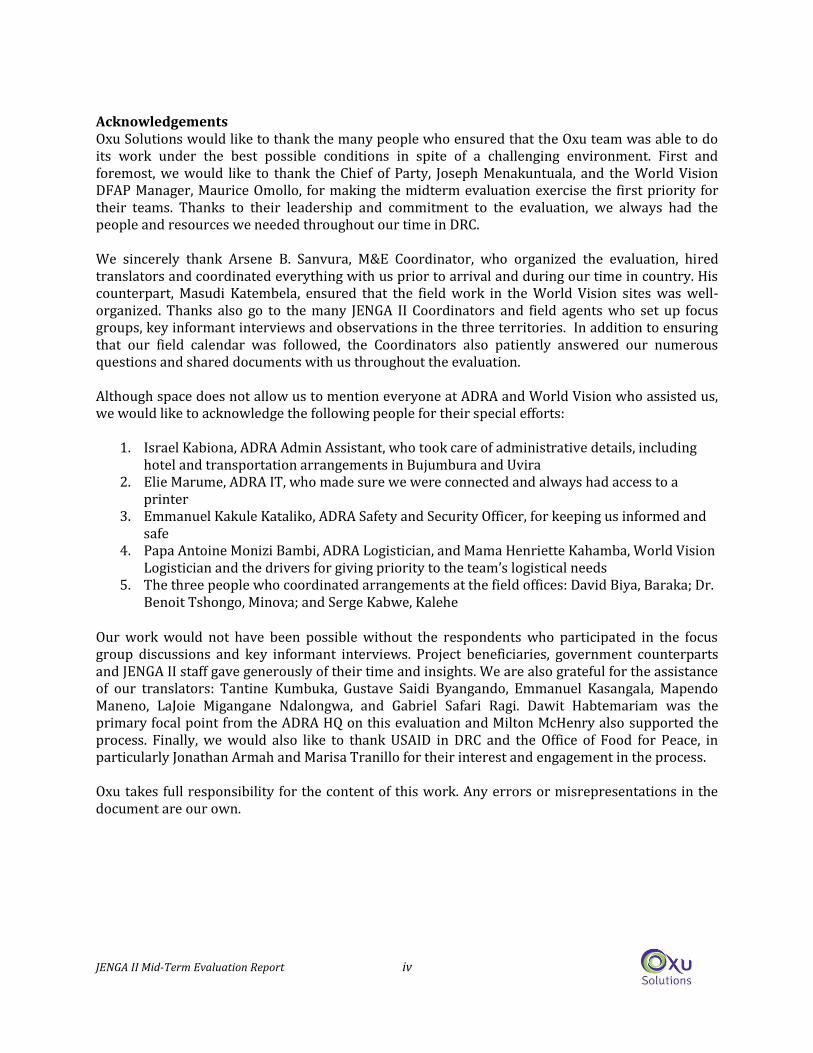
Acknowledgements Oxu Solutions would like to thank the many people who ensured that the Oxu team was able to do its work under the best possible conditions in spite of a challenging environment. First and foremost, we would like to thank the Chief of Party, Joseph Menakuntuala, and the World Vision DFAP Manager, Maurice Omollo, for making the midterm evaluation exercise the first priority for their teams. Thanks to their leadership and commitment to the evaluation, we always had the people and resources we needed throughout our time in DRC. We sincerely thank Arsene B. Sanvura, M&E Coordinator, who organized the evaluation, hired translators and coordinated everything with us prior to arrival and during our time in country. His counterpart, Masudi Katembela, ensured that the field work in the World Vision sites was well-organized. Thanks also go to the many JENGA II Coordinators and field agents who set up focus groups, key informant interviews and observations in the three territories. In addition to ensuring that our field calendar was followed, the Coordinators also patiently answered our numerous questions and shared documents with us throughout the evaluation. Although space does not allow us to mention everyone at ADRA and World Vision who assisted us, we would like to acknowledge the following people for their special efforts:
1. Israel Kabiona, ADRA Admin Assistant, who took care of administrative details, including hotel and transportation arrangements in Bujumbura and Uvira
2. Elie Marume, ADRA IT, who made sure we were connected and always had access to a printer
3. Emmanuel Kakule Kataliko, ADRA Safety and Security Officer, for keeping us informed and safe
4. Papa Antoine Monizi Bambi, ADRA Logistician, and Mama Henriette Kahamba, World Vision Logistician and the drivers for giving priority to the team’s logistical needs
5. The three people who coordinated arrangements at the field offices: David Biya, Baraka; Dr. Benoit Tshongo, Minova; and Serge Kabwe, Kalehe
Our work would not have been possible without the respondents who participated in the focus group discussions and key informant interviews. Project beneficiaries, government counterparts and JENGA II staff gave generously of their time and insights. We are also grateful for the assistance of our translators: Tantine Kumbuka, Gustave Saidi Byangando, Emmanuel Kasangala, Mapendo Maneno, LaJoie Migangane Ndalongwa, and Gabriel Safari Ragi. Dawit Habtemariam was the primary focal point from the ADRA HQ on this evaluation and Milton McHenry also supported the process. Finally, we would also like to thank USAID in DRC and the Office of Food for Peace, in particularly Jonathan Armah and Marisa Tranillo for their interest and engagement in the process. Oxu takes full responsibility for the content of this work. Any errors or misrepresentations in the document are our own.
JENGA II Mid-Term Evaluation Report v
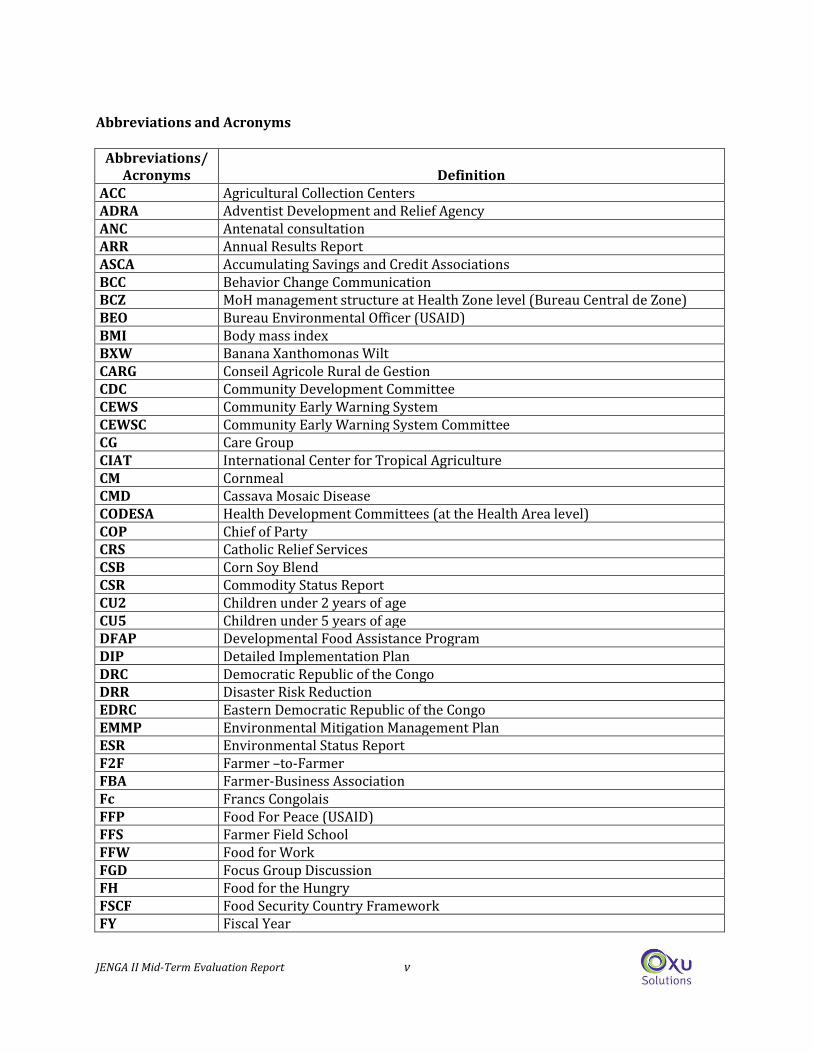
Abbreviations and Acronyms
Abbreviations/ Acronyms Definition
ACC Agricultural Collection Centers ADRA Adventist Development and Relief Agency ANC Antenatal consultation ARR Annual Results Report ASCA Accumulating Savings and Credit Associations BCC Behavior Change Communication BCZ MoH management structure at Health Zone level (Bureau Central de Zone) BEO Bureau Environmental Officer (USAID) BMI Body mass index BXW Banana Xanthomonas Wilt CARG Conseil Agricole Rural de Gestion CDC Community Development Committee CEWS Community Early Warning System CEWSC Community Early Warning System Committee CG Care Group CIAT International Center for Tropical Agriculture CM Cornmeal CMD Cassava Mosaic Disease CODESA Health Development Committees (at the Health Area level) COP Chief of Party CRS Catholic Relief Services CSB Corn Soy Blend CSR Commodity Status Report CU2 Children under 2 years of age CU5 Children under 5 years of age DFAP Developmental Food Assistance Program DIP Detailed Implementation Plan DRC Democratic Republic of the Congo DRR Disaster Risk Reduction EDRC Eastern Democratic Republic of the Congo EMMP Environmental Mitigation Management Plan ESR Environmental Status Report F2F Farmer –to-Farmer FBA Farmer-Business Association Fc Francs Congolais FFP Food For Peace (USAID) FFS Farmer Field School FFW Food for Work FGD Focus Group Discussion FH Food for the Hungry FSCF Food Security Country Framework FY Fiscal Year
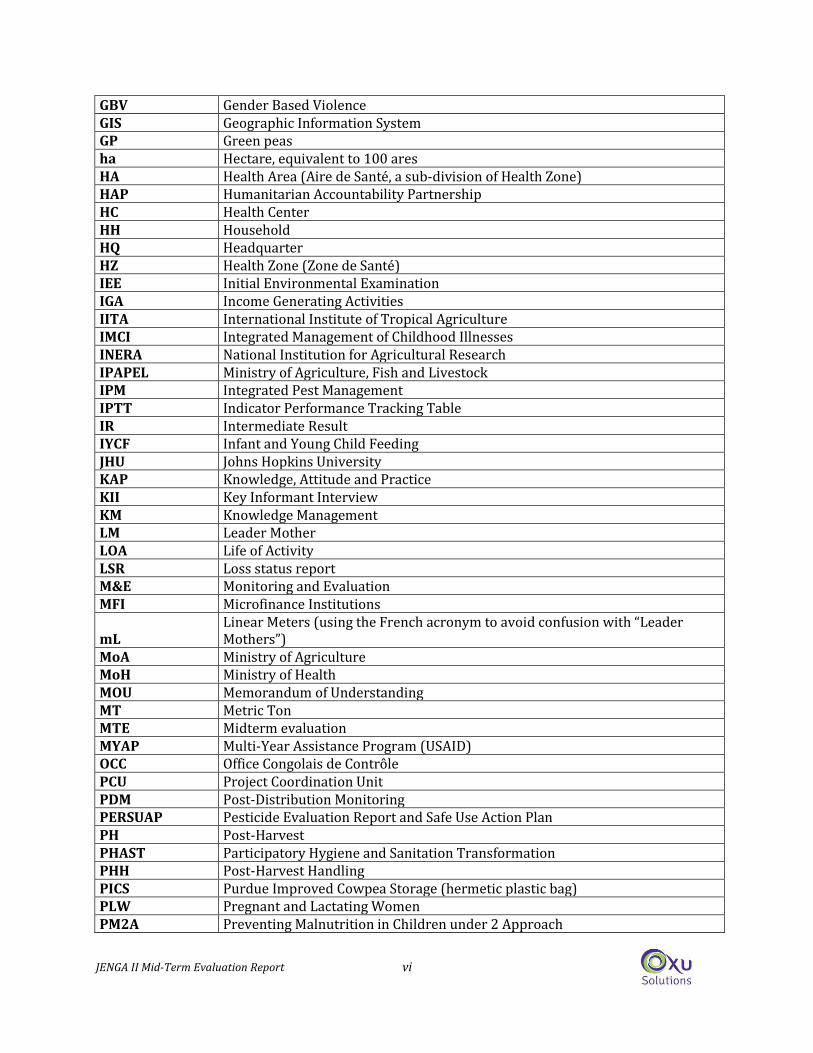
JENGA II Mid-Term Evaluation Report vi
GBV Gender Based Violence GIS Geographic Information System GP Green peas ha Hectare, equivalent to 100 ares HA Health Area (Aire de Santé, a sub-division of Health Zone) HAP Humanitarian Accountability Partnership HC Health Center HH Household HQ Headquarter HZ Health Zone (Zone de Santé) IEE Initial Environmental Examination IGA Income Generating Activities IITA International Institute of Tropical Agriculture IMCI Integrated Management of Childhood Illnesses INERA National Institution for Agricultural Research IPAPEL Ministry of Agriculture, Fish and Livestock IPM Integrated Pest Management IPTT Indicator Performance Tracking Table IR Intermediate Result IYCF Infant and Young Child Feeding JHU Johns Hopkins University KAP Knowledge, Attitude and Practice KII Key Informant Interview KM Knowledge Management LM Leader Mother LOA Life of Activity LSR Loss status report M&E Monitoring and Evaluation MFI Microfinance Institutions
mL Linear Meters (using the French acronym to avoid confusion with “Leader Mothers”)
MoA Ministry of Agriculture MoH Ministry of Health MOU Memorandum of Understanding MT Metric Ton MTE Midterm evaluation MYAP Multi-Year Assistance Program (USAID) OCC Office Congolais de Contrôle PCU Project Coordination Unit PDM Post-Distribution Monitoring PERSUAP Pesticide Evaluation Report and Safe Use Action Plan PH Post-Harvest PHAST Participatory Hygiene and Sanitation Transformation PHH Post-Harvest Handling PICS Purdue Improved Cowpea Storage (hermetic plastic bag) PLW Pregnant and Lactating Women PM2A Preventing Malnutrition in Children under 2 Approach
JENGA II Mid-Term Evaluation Report vii
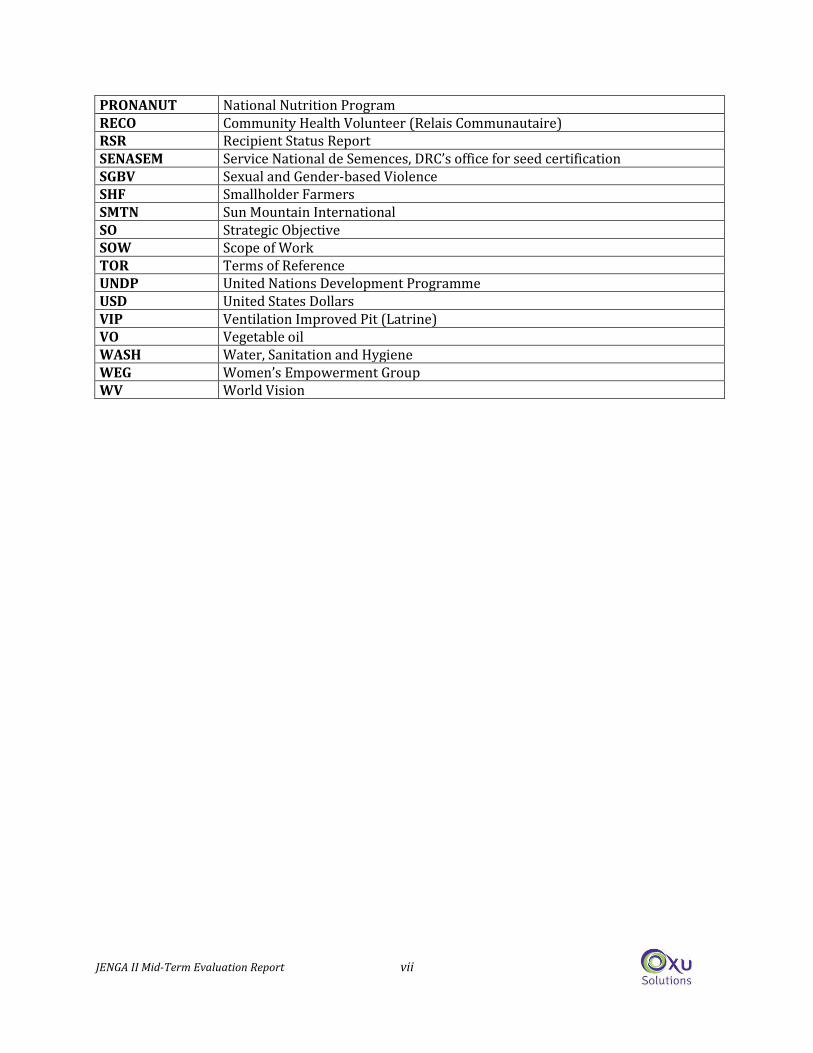
PRONANUT National Nutrition Program RECO Community Health Volunteer (Relais Communautaire) RSR Recipient Status Report SENASEM Service National de Semences, DRC’s office for seed certification SGBV Sexual and Gender-based Violence SHF Smallholder Farmers SMTN Sun Mountain International SO Strategic Objective SOW Scope of Work TOR Terms of Reference UNDP United Nations Development Programme USD United States Dollars VIP Ventilation Improved Pit (Latrine) VO Vegetable oil WASH Water, Sanitation and Hygiene WEG Women’s Empowerment Group WV World Vision
JENGA II Mid-Term Evaluation Report viii
Executive Summary JENGA JAMAA II (hereafter referred to as “JENGA II”) is a $50 million five-year Developmental Food Assistance Program (DFAP) funded by USAID’s Office of Food for Peace (FFP). JENGA II began in July 2011 and is being implemented by ADRA, World Vision (WV), Johns Hopkins University (JHU), and Sun Mountain International (SMTN) in Eastern Democratic Republic of the Congo (EDRC). JENGA II is a follow-on project to JENGA I, which was implemented in 2008-2011. The overall goal of JENGA II is to sustainably reduce food insecurity among vulnerable households in Fizi, Uvira, and Kalehe territories of South Kivu Province, in the Democratic Republic of the Congo (DRC). JENGA II aims to reach over 150,000 individuals during the life of the project. This Mid-Term Evaluation (MTE), conducted from June – August 2014, assesses progress towards the achievement of the JENGA II project strategy. The goal of the MTE is to improve the effectiveness and efficiency of JENGA II and to inform future programming and strategic project decisions. The period covered by this MTE report starts with the project’s initiation in July 2011 and goes through results as of the end of June 2014. The MTE was prepared and carried out by a team of evaluators using qualitative methods for primary data collection. The team conducted a thorough desk review of JENGA II project documents and other relevant documents, including quantitative information found in the baseline survey report, the Indicator Performance Tracking Tables (IPTTs), reports from the JHU Operations Research, the Detailed Implementation Plans (DIPs), and Annual Beneficiary Survey Reports. Primary data collection methods included: meetings and interviews with key JENGA II project staff and the donor; Focus Group Discussions with project beneficiaries and other community stakeholders; Key Informant Interviews with community and institutional stakeholders; direct observations of a number of project activities and initiatives; and a participatory workshop with JENGA II project staff to discuss the MTE team’s preliminary findings and recommendations. In general, we found that in spite of the myriad challenges of implementing a longer-term food security project in Eastern DRC, JENGA II overall appears to have performed well in terms of the level of activity achievement during the project’s first three years; there are also initial signs of positive change among target beneficiaries and communities. While there is anecdotal evidence at this stage of positive impacts from a number of the project activities, unfortunately the systems JENGA II has in place for monitoring and reporting on activities as well as for documenting and disseminating project strategies and learning are inadequate to demonstrate meaningfully this impact and equally importantly to monitor project progress to make adjustments along the way. As we detail in the full report, there are a number of positive findings from activity implementation, yet we have serious concerns about the quantitative project data that should theoretically be used to support these findings. We recognize that this is a major limitation of this MTE exercise and this report, as it suggests that findings about quality of intervention implementation are more reliable than those related to quantifiable project progress. During the MTE we had significant difficulties getting accurate information. For example, the project could not provide us with some basic documentation, such as a site list showing where activities under each Strategic Objective (SO) are being implemented. In addition, we requested numerous times to get a DIP with activity accomplishments through the end of Year 3. This request was finally fulfilled on 31 August (a week after we submitted the draft MTE report). Prior to getting the full DIP, Coordinators for each SO provided numerous versions of individual SO DIPs, but on each occasion for each SO there would be discrepancies or differences from previous versions, which raises numerous questions about the validity of the information. Even the final version of the DIP provided to us had quite a few numbers that were dramatically different from the previous SO DIPs we had received (and even some target levels had changed). A concerted effort to improve project Monitoring and Evaluation (M&E) and documentation systems in the remaining two years of the project is therefore critical.
JENGA II Mid-Term Evaluation Report ix
We also found that the project is responsive to the food security needs of the targeted communities, in terms of activities designed to address interrelated issues of food insecure populations related to food access, availability, utilization, and prevention of and coping with food security-related shocks. In this sense, the project design is relevant. JENGA II has also benefited from the fact that ADRA and WV, the two main implementing partners, are both well-known and respected at the community level. While there are successful activities and components within each SO (as described in detail in the report), the greatest community-level change that we observed is from SO3 women’s empowerment activities and in gender as a cross-cutting theme. To date, the majority of project beneficiaries are women, which was planned during project design. JENGA II also appears to be contributing to very positive impacts on women and gender relations in targeted communities. During our field work, we heard countless stories and reports from women beneficiaries, their male partners, community leaders, and other community members describing the benefits of the project related to women’s empowerment and overall gender relations. An additional initial positive impact is that we heard about and noted a number of examples and anecdotes of spillover effects on non-beneficiaries, especially in agriculture, health and nutrition. In addition to the overall strengths of JENGA II to date, there are several key lessons learned and challenges that the project has faced. First, while the project design mainly responds to local needs, we also found that it was an overly ambitious overall design – the project targeted too many intervention zones, included too many activities for available resources, and included a small number of activities that were not well-suited to the realities of the context in the three project territories. A second overarching lesson learned from JENGA II is that the majority of beneficiaries do not benefit from activities in multiple SOs and there is an overall lack of integration across sectors. Targeting, therefore, is not integrated across SOs at the household level. We also found that the JENGA II exit strategy / sustainability plan has not been updated since the project proposal submission. While it does seem that project staff think about sustainability and how various activities are or should be sustainable, there is no written guiding vision or concrete plan for project sustainability or exit. A detailed, concrete exit strategy/ sustainability plan should be one of the foundational guiding documents for a five-year development intervention. The project also overemphasizes achievement of targets in the DIP, to the detriment of overall implementation quality. For many activities the MTE team found that once a DIP target is reached, project staff have a tendency to move on to the next activity rather than ensure quality follow-up and activity monitoring. The project also suffers from poor quality of project documentation and M&E, as noted above. Documentation is incomplete, several important reports and strategies were either never produced (e.g. Behavior Change Communication (BCC) Strategy, Gender Analysis, etc.) or are not used, and three years into the project there is not yet a functioning global database for the project that houses all project data. As a result, while the project has significant amounts of data being collected, little information is actually analyzed. Finally, there are a number of questions about the reliability of the data being collected for output and outcome-level indicators. Within the Strategic Objectives, (SOs) our findings can be summarized as follows: SO1 – Agriculture and Marketing: The approach used in SO1 has proven relevant to helping smallholder farmers reduce food insecurity, with new techniques readily adopted and a general appreciation for the new varieties introduced. The majority of the agricultural production activities have been implemented and more than 14,000 farmers – over 60% of them women – have been reached through Farmer Field Schools (FFS). The FFS participants have in turn trained other
JENGA II Mid-Term Evaluation Report x
farmers and there is anecdotal evidence of a strong spillover effect, with non-SO1 community members also adopting new techniques and trying out the new varieties introduced by JENGA II. For the agricultural production component, improvements are still needed in several areas, especially the FFS approach, the seed multiplication activity, and collaboration with government entities. Although training has been conducted for 149 of the 183 farmer-business associations (FBAs) and a number of FBAs, especially in the WV zone, have achieved legal status, the marketing component of SO1 shows less progress with few concrete results and the project needs to be much more proactive if farmers are to be more successful marketing their production. SO2 – Health and Nutrition/ WASH: There are noticeable signs of progress across the major components of the health and nutrition SO with knowledge levels increasing and the observed adoption of certain improved practices for women and children. The WASH activities, a definite plus for this SO, are highly appreciated and although mid-project targets for some types of infrastructure have not yet been met, the water systems, latrines and other structures are being constructed with the participation of the beneficiaries, local leaders and the Government. There have been significant issues, however, with provision of PM2A (Preventing Malnutrition in Children under 2 Approach) rations, as JENGA II is using a targeted rather than blanket feeing approach. Ration distribution is limited to a small number of communities and within those communities, only 20-40% of pregnant and lactating women and children under two years of age receive them. The fact that a minority of women benefit from the rations is a major source of conflict and tension within communities. The lack of a household protection ration is also problematic, as focus group participants estimated that the ration lasts one week or less instead of a month as a result of ration sharing with other household (and at times non-household) members. Another major issue that will require human and financial resources during the rest of the project is finding ways to re-energize the Leader Mothers who are the engines of change for SO2. SO3 – Women’s Empowerment: Many of the activities that lead to the three Intermediate Results (IRs) in SO3 are intertwined and complementary, but the underlying logic for how the sub-IRs contribute to fulfillment of the IRs and how the IRs lead to achievement of the SO is not very clear. While the logic for the design does not seem to fit tightly together, the MTE team did find a number of positive achievements from SO3. Indeed, the project appears to have had a very positive impact on women and gender relations in targeted communities, as well as broadening livelihood options which are important for food security; these are the strongest outcomes the evaluation team observed of the project to date. However, this SO has been under-budgeted compared to the number of activities and beneficiaries targeted, resulting in staff and partners feeling overwhelmed and expected impact being lessened. SO4 – Resilience: SO4 was initially planned to be an IR under SO1 in the original project proposal, and at the request of USAID it was later taken out of SO1 to become its own SO. Based on our understanding of the logic of the project, we feel SO4 should have stayed as an IR under SO1. As it is, SO4 contains three main components – Natural Resource Management (NRM), Community Early Warning Systems (CEWS), and support to territory-level CARGs (Conseil Agricole Rural de Gestion). The overall organization of the SO is not very logical, though activities within SO4 are nevertheless progressing fairly well. A total of 6,990 FFS farmers have been trained in soil management techniques, and nine tree nurseries for agroforestry and fruit trees have been established. CEWS have been set-up in a dozen communities, though the systems are overly complex and include too many components with too many indicators for CEWS Committees to be expected to collect, analyze, and then take appropriate actions. Finally, the project is working with two territory-level CARGs, supporting them to collect and disseminate market information.
JENGA II Mid-Term Evaluation Report xi
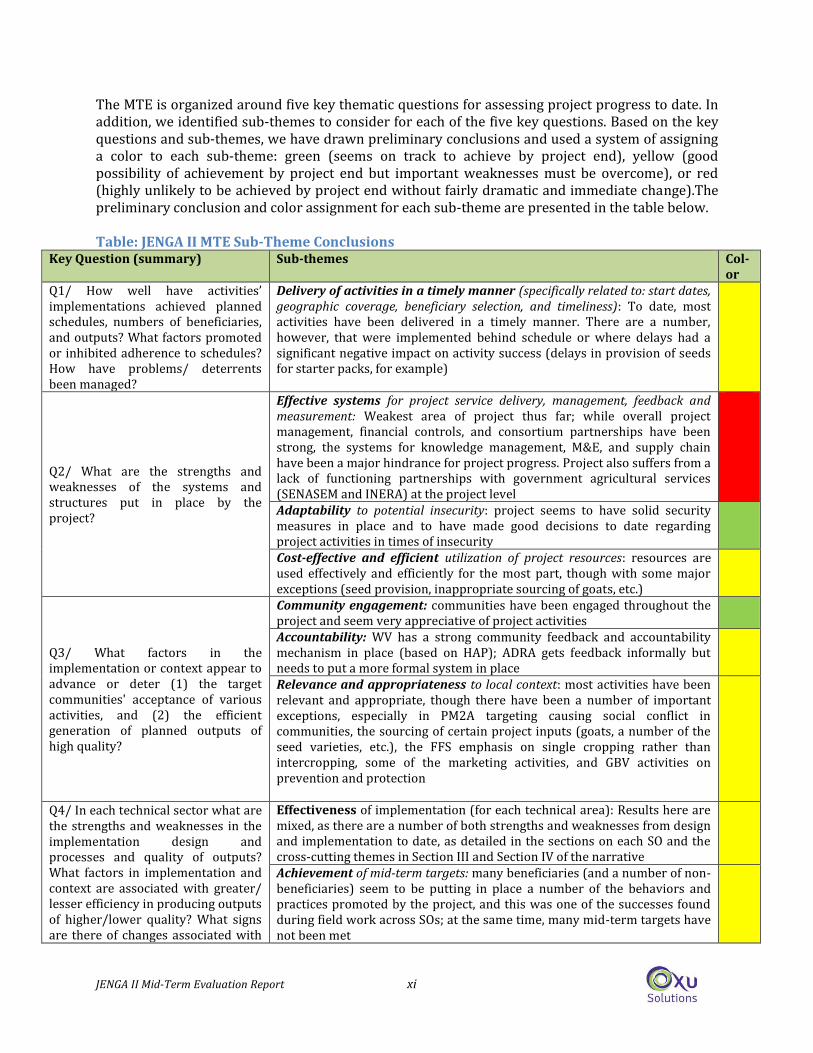
The MTE is organized around five key thematic questions for assessing project progress to date. In addition, we identified sub-themes to consider for each of the five key questions. Based on the key questions and sub-themes, we have drawn preliminary conclusions and used a system of assigning a color to each sub-theme: green (seems on track to achieve by project end), yellow (good possibility of achievement by project end but important weaknesses must be overcome), or red (highly unlikely to be achieved by project end without fairly dramatic and immediate change).The preliminary conclusion and color assignment for each sub-theme are presented in the table below. Table: JENGA II MTE Sub-Theme Conclusions
Key Question (summary) Sub-themes Col-or
Q1/ How well have activities’ implementations achieved planned schedules, numbers of beneficiaries, and outputs? What factors promoted or inhibited adherence to schedules? How have problems/ deterrents been managed?
Delivery of activities in a timely manner (specifically related to: start dates, geographic coverage, beneficiary selection, and timeliness): To date, most activities have been delivered in a timely manner. There are a number, however, that were implemented behind schedule or where delays had a significant negative impact on activity success (delays in provision of seeds for starter packs, for example)
Q2/ What are the strengths and weaknesses of the systems and structures put in place by the project?
Effective systems for project service delivery, management, feedback and measurement: Weakest area of project thus far; while overall project management, financial controls, and consortium partnerships have been strong, the systems for knowledge management, M&E, and supply chain have been a major hindrance for project progress. Project also suffers from a lack of functioning partnerships with government agricultural services (SENASEM and INERA) at the project level
Adaptability to potential insecurity: project seems to have solid security measures in place and to have made good decisions to date regarding project activities in times of insecurity
Cost-effective and efficient utilization of project resources: resources are used effectively and efficiently for the most part, though with some major exceptions (seed provision, inappropriate sourcing of goats, etc.)
Q3/ What factors in the implementation or context appear to advance or deter (1) the target communities' acceptance of various activities, and (2) the efficient generation of planned outputs of high quality?
Community engagement: communities have been engaged throughout the project and seem very appreciative of project activities
Accountability: WV has a strong community feedback and accountability mechanism in place (based on HAP); ADRA gets feedback informally but needs to put a more formal system in place
Relevance and appropriateness to local context: most activities have been relevant and appropriate, though there have been a number of important exceptions, especially in PM2A targeting causing social conflict in communities, the sourcing of certain project inputs (goats, a number of the seed varieties, etc.), the FFS emphasis on single cropping rather than intercropping, some of the marketing activities, and GBV activities on prevention and protection
Q4/ In each technical sector what are the strengths and weaknesses in the implementation design and processes and quality of outputs? What factors in implementation and context are associated with greater/ lesser efficiency in producing outputs of higher/lower quality? What signs are there of changes associated with
Effectiveness of implementation (for each technical area): Results here are mixed, as there are a number of both strengths and weaknesses from design and implementation to date, as detailed in the sections on each SO and the cross-cutting themes in Section III and Section IV of the narrative
Achievement of mid-term targets: many beneficiaries (and a number of non-beneficiaries) seem to be putting in place a number of the behaviors and practices promoted by the project, and this was one of the successes found during field work across SOs; at the same time, many mid-term targets have not been met
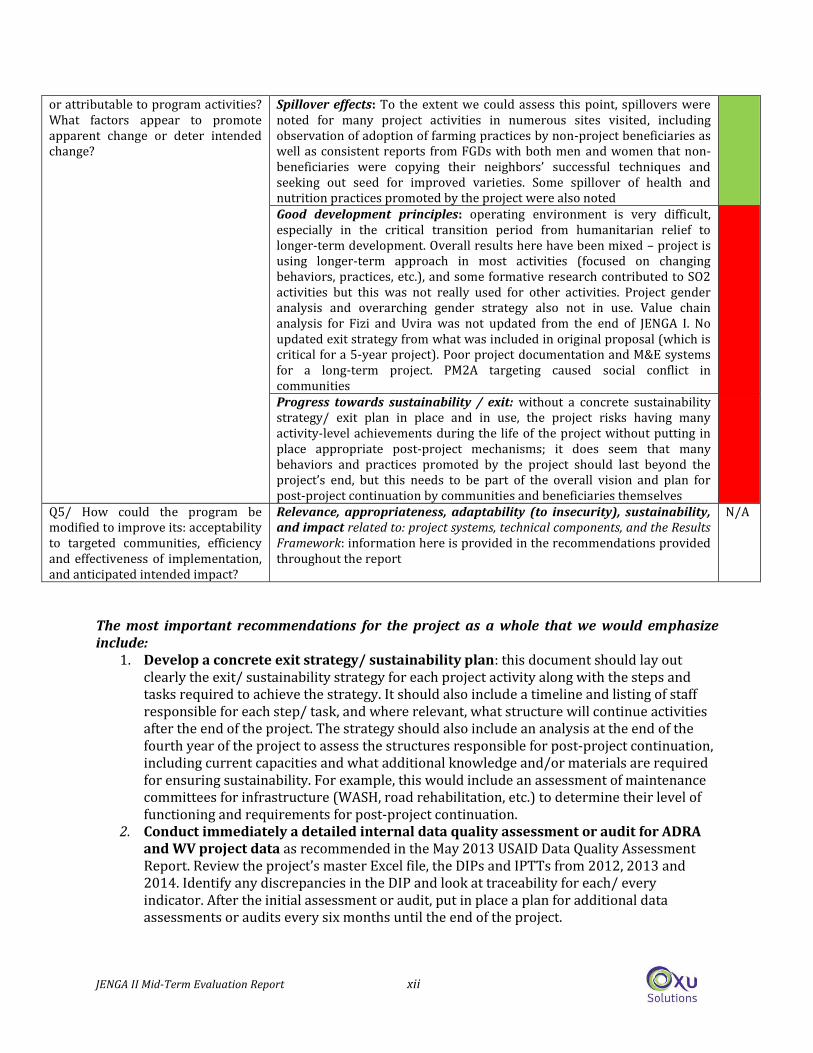
JENGA II Mid-Term Evaluation Report xii
or attributable to program activities? What factors appear to promote apparent change or deter intended change?
Spillover effects: To the extent we could assess this point, spillovers were noted for many project activities in numerous sites visited, including observation of adoption of farming practices by non-project beneficiaries as well as consistent reports from FGDs with both men and women that non-beneficiaries were copying their neighbors’ successful techniques and seeking out seed for improved varieties. Some spillover of health and nutrition practices promoted by the project were also noted
Good development principles: operating environment is very difficult, especially in the critical transition period from humanitarian relief to longer-term development. Overall results here have been mixed – project is using longer-term approach in most activities (focused on changing behaviors, practices, etc.), and some formative research contributed to SO2 activities but this was not really used for other activities. Project gender analysis and overarching gender strategy also not in use. Value chain analysis for Fizi and Uvira was not updated from the end of JENGA I. No updated exit strategy from what was included in original proposal (which is critical for a 5-year project). Poor project documentation and M&E systems for a long-term project. PM2A targeting caused social conflict in communities
Progress towards sustainability / exit: without a concrete sustainability strategy/ exit plan in place and in use, the project risks having many activity-level achievements during the life of the project without putting in place appropriate post-project mechanisms; it does seem that many behaviors and practices promoted by the project should last beyond the project’s end, but this needs to be part of the overall vision and plan for post-project continuation by communities and beneficiaries themselves
Q5/ How could the program be modified to improve its: acceptability to targeted communities, efficiency and effectiveness of implementation, and anticipated intended impact?
Relevance, appropriateness, adaptability (to insecurity), sustainability, and impact related to: project systems, technical components, and the Results Framework: information here is provided in the recommendations provided throughout the report
N/A
The most important recommendations for the project as a whole that we would emphasize include:
1. Develop a concrete exit strategy/ sustainability plan: this document should lay out clearly the exit/ sustainability strategy for each project activity along with the steps and tasks required to achieve the strategy. It should also include a timeline and listing of staff responsible for each step/ task, and where relevant, what structure will continue activities after the end of the project. The strategy should also include an analysis at the end of the fourth year of the project to assess the structures responsible for post-project continuation, including current capacities and what additional knowledge and/or materials are required for ensuring sustainability. For example, this would include an assessment of maintenance committees for infrastructure (WASH, road rehabilitation, etc.) to determine their level of functioning and requirements for post-project continuation.
2. Conduct immediately a detailed internal data quality assessment or audit for ADRA and WV project data as recommended in the May 2013 USAID Data Quality Assessment Report. Review the project’s master Excel file, the DIPs and IPTTs from 2012, 2013 and 2014. Identify any discrepancies in the DIP and look at traceability for each/ every indicator. After the initial assessment or audit, put in place a plan for additional data assessments or audits every six months until the end of the project.
JENGA II Mid-Term Evaluation Report xiii
3. Document training plans for project beneficiaries and government staff and develop a detailed plan for post-training follow-up. The training plan should include for each type of training: objective; frequency; duration; trainer; participants (number and type); training follow-up tasks, timeline, and project staff responsible; etc. Regardless of the training duration, and even if the training is part of a series, there should be a plan for how the parts of the series link together and how the project will ensure the application of the concepts learned in the training.
4. Review project activities based on findings and recommendations from the SO1-SO4 report sections and identify activities that could be removed or scaled back from Years 4 and 5 of the project (without causing negative repercussions for targeted beneficiary populations).
5. Improve project integration through the following: a. Utilize multi-sectoral BCC messages across activities in all SOs (see BCC
recommendations in the full report for further details) b. Promote joint field visits by field agent staff across SOs as well as more concrete
collaboration among SO Coordinators for: developing the concrete exit strategy/ sustainability plan and improving implementation of cross-cutting themes, including gender, BCC, and environmental compliance
c. For any activities that will still identify new beneficiaries before the end of the project, prioritize households that are already participating in other project activities.
d. Improve integration of components within an SO (e.g., Agriculture and Marketing) e. Incorporate health and nutrition messages into SO1 activities and SO3 women’s
group activities f. Plant trees (SO1, SO4) around capped springs (SO2)
JENGA II Mid-Term Evaluation Report 1
I. Introduction a. (E)DRC context
Ranked 186th out of 187 countries in the UNDP’s 2013 Human Development Index, the Democratic Republic of the Congo (DRC) faces critical challenges that affect its capacity to ensure a peaceful and sustainable living for its inhabitants. While showing signs of political and economic recovery following the transitional process (2005) that saw insecurity declining and international donors supporting and funding programs anew, the country is still prone to violence and insecurity. This is especially the case in Eastern DRC (EDRC), as evidenced by sporadic fighting and frequent insecurity incidents in many areas in EDRC, including a number of JENGA II project areas. Despite the potential stemming from its abundant natural resources, including 135 million hectares of fertile farmland, DRC faces extremely high levels of chronic food insecurity, in which households (HHs) are not able to meet food consumption requirements and remain undernourished. Underlying major causes of food insecurity include serious constraints in food access, availability, and utilization as well as inability to cope with shocks and risk. According to JENGA II baseline data, in the project areas in Fizi, Kalehe, and Uvira Territories in South Kivu Province, 30% of HHs experience moderate to severe hunger. The baseline study also found that farmers in the project areas have limited access to irrigation and arable land; very minimal crop diversification; and a large majority of farmers produce for HH consumption only. Access to agricultural extension and financial services remains very limited, and crop diseases (especially cassava mosaic disease (CMD) and banana xanthomanas wilt (BXW)) are highly prevalent. Use of improved farming techniques and seed varieties is low. Within health and nutrition, the baseline study also reports that in the project target areas, 45% of children under five (CU5) are stunted. A high prevalence of childhood illness is due in part to limited access to improved water sources and sanitation facilities as well as poor hygiene and sanitation practices – 44% of CU5 experienced diarrhea in the two weeks prior to the baseline survey. Women also have low dietary diversity (though generally healthy body mass index (BMI)). CU5 also have minimal dietary diversity and less than 50% of babies under six months of age are exclusively breastfed. Women also continue to suffer from inequality, as nearly 60% of the women in a partnership who were surveyed during the baseline experienced either physical or verbal abuse from their partner in the 12 months before the survey. A large majority of women did express, however, that they are able to make decisions alone or with their partner regarding personal health and HH purchases. The food insecurity situation in EDRC in general and South Kivu in particular is exacerbated by the incredibly challenging operating environment, which is characterized by: extremely poor infrastructure; little provision of services by the state, especially in rural areas1; and frequent insecurity caused by numerous armed groups active in the East. Furthermore, over a decade of emergency and humanitarian intervention has created certain expectations of local populations from international NGOs. The transition to longer-term assistance, while relevant, warranted and extremely necessary, is full of challenges. In this type of environment, realistic expectations and pragmatism about what can be accomplished are essential.
b. JENGA II project summary JENGA JAMAA II (hereafter referred to as “JENGA II”) is a $50 million five-year Developmental Food Assistance Program (DFAP) funded by USAID’s Office of Food for Peace (FFP). JENGA II began in
1 Health services are available in Government health facilities, but the quality is highly variable. Facilities often lack basic inputs and even where there are services and stocks of medicine, they can be too expensive for the average HH.
JENGA II Mid-Term Evaluation Report 2
July 2011 and is being implemented by ADRA, World Vision (WV), Johns Hopkins University (JHU) (the Bloomberg School of Public Health), and Sun Mountain International (SMTN) in EDRC. JENGA II is a follow-on project to JENGA I, which was implemented in 2008-2010. The overall goal of JENGA II is to sustainably reduce food insecurity among vulnerable households in Fizi, Uvira, and Kalehe Territories of South Kivu Province,2 and JENGA II aims to reach over 150,000 individuals during the life of the project. A project map (provided by ADRA) showing the geographic intervention areas can be found Annex A. JENGA II, which utilizes a gender-sensitive programming approach, includes four Strategic Objectives (SOs) to achieve the project goal:
SO1: Food insecure farming households with increased incomes (the project’s “Agriculture and Marketing” component)
SO2: Improved health and nutritional status of children under-5 (the project’s “Health and Nutrition” component)
SO3: Increased women’s socio-economic empowerment in food insecure communities SO4: Strengthened community resilience to food security shocks
The project’s detailed Results Framework is provided in Annex B. JENGA II activities address the challenges that vulnerable HHs face regarding food availability, access, utilization, and shock. ADRA leads the JENGA II consortium and implements all project activities in Fizi and Uvira Territories. WV is the other main implementing partner and is responsible for all programming in Kalehe Territory. JHU conducted formative research during the first year of the project to inform health and nutrition messaging and is conducting ongoing operations research related to the effectiveness of different project activities on food security outcomes in Fizi and Uvira Territories. JENGA II has a deliverable-based sub-contract with SMTN to lead disaster risk reduction and environmental compliance efforts. JENGA II collaborates with relevant government agencies (to varying degrees of success, as will be discussed in further detail in the findings presented in the report), including the Ministry of Agriculture, Fish and Livestock (IPAPEL), the National Institution for Agricultural Research (INERA), and the national seed service (SENASEM); the Ministry of Health (MoH) and its institutions (specifically the local Health Zone (HZ) structure; the National Nutrition Program (PRONANUT); and the provincial MoH office); and local food security governance structures, including CARGs (Conseil Agricole Rural de Gestion). JENGA II aims to reach a total of 162,000 individuals during the life of the project. As of the end of June 2014, JENGA II had benefited over 150,000 individuals, 70% of whom are female. Table 1: Summary of JENGA II Key Beneficiary Groups, Targets, and Mid-Term Achievements3 Beneficiary Group # Reached
(end June 2014) LOA Target % of LOA
Target Achieved Benefiting individuals 149,770 162,145 92.4% SO1 Beneficiaries 23,355 22,000 106% SO2 Beneficiaries 121,501 135,000 90% SO3 Beneficiaries 4644 4875 95% SO4 Beneficiaries 270 270 100%
2 The overall goal for Title II non-emergency funding in DRC is to reduce food insecurity among chronically food insecure households in the DRC. The JENGA II project goal is meant to contribute to the overall Title II goal for DRC multi-year programming. 3 The information in this table was provided via email exchanges with ADRA in late August/ early September.
JENGA II Mid-Term Evaluation Report 3
II. MTE Scope a. Goal and Objectives
Oxu Solutions was contracted by ADRA to conduct the Mid-Term Evaluation (MTE) of the JENGA II project in DRC. The period covered by this MTE report starts with the project’s initiation in July 2011 and goes through results as of June 2014. The goal of the JENGA II MTE is to improve the effectiveness and efficiency of JENGA JAMAA II and inform future programming and strategic project decisions. In so doing, the MTE team measures progress towards achievement of the project strategy (as articulated in the Results Framework) through the three evaluation objectives detailed on p. 4 in the ADRA Scope of Work (SOW) document:
A. To assess the strengths and weaknesses of program implementation and outputs in terms of adherence to agreed terms and the acceptability and usefulness of interventions to target communities
B. To present evidence of changes (intended and unintended) associated with program activities and outputs, and assess how they relate to progress toward program objectives, identifying factors that appear to promote or hinder the program’s progress toward desired objectives
C. To inform decision making that could improve program design, resource allocation, or implementation to improve the likelihood of achieving desired outcomes by the program’s end
The SOW document developed by ADRA with input from USAID is provided in Annex C. Oxu developed the detailed methodology for the evaluation based on the SOW document. A full detailed description of the evaluation methodology is provided in Annex D. A summary of the methodology is presented below.
b. MTE Key Questions and Sub-themes The JENGA II Results Framework serves as the primary focus document of the evaluation, particularly as the objectives of the MTE include assessing progress toward the project strategy, which is what the Results Framework is meant to capture. The MTE is organized around five key thematic questions for assessing project progress to date. Table 2 below presents the five key questions along with sub-themes for each of the key questions. In addition, Annex E, JENGA II MTE Planning Matrix is a detailed table that includes the five key questions; detailed areas of focus and main aspects to consider per key question; sub-themes per key question; and examples of data collection tools and respondents to gather data for each area of focus/ aspect to consider. Table 2: MTE Key Questions and Sub-Themes Key Question Sub-themes Q1/ How well have activities’ implementations achieved planned schedules, numbers of beneficiaries, and outputs? What factors promoted or inhibited adherence to schedules? How have problems/ deterrents been managed?
Delivery of activities in a timely manner (specifically related to: start dates, geographic coverage, beneficiary selection, and timeliness)
Q2/ What are the strengths and weaknesses of the systems and structures put in place by the project?
Effective systems for project service delivery, management, feedback and measurement; Adaptability to potential insecurity; Cost-effective and efficient utilization of project resources
Q3/ What factors in the implementation or context appear to advance or deter (1) the target communities' acceptance of various activities, and (2) the efficient generation of planned outputs of high quality?
Community engagement; Accountability; Relevance and appropriateness to local context
JENGA II Mid-Term Evaluation Report 4
Q4/ In each technical sector what are the strengths and weaknesses in the implementation design and processes and quality of outputs? What factors in implementation and context are associated with greater/ lesser efficiency in producing outputs of higher/lower quality? What signs are there of changes associated with or attributable to program activities? What factors appear to promote apparent change or deter intended change?
Effectiveness of implementation (for each technical area); Achievement of mid-term targets; Spillover effects; Good development principles Progress towards sustainability / exit
Q5/ How could the program be modified to improve its: acceptability to targeted communities, efficiency and effectiveness of implementation, and anticipated intended impact?
Relevance, appropriateness, adaptability (to insecurity), sustainability, and impact related to: project systems, technical components, and the Results Framework
c. Evaluation team
Table 3 below presents the team that conducted the JENGA II MTE. Table 3: JENGA II MTE Team Team member Role for MTE Kathleen (Kathy) Tilford Overall Team Lead and Technical Lead for: SO2 – Health & Nutrition/WASH
and BCC Bertin Baharanyi Technical Lead for: SO1: Agriculture and Marketing as well as the agriculture
technical components of SO4 Charlie Kabanga Technical Lead for: SO3: Women’s Empowerment; SO4: Resilience; and Gender Ange Tingbo Technical Lead for: Commodities, Financial Management, FFW, and
Environmental Compliance Bryan Crawford-Garrett Oxu Engagement Manager and Technical Support for Quality Assurance,
Project Systems and Structures, Sustainability, and Integration Bernard Crenn SO1 technical assistance and SO3 technical assistance for IGAs – provided
remotely Oxu management and support (Behnaz Raufi, Brian Sage, Damien Porcher)
Overall management and administrative support - provided remotely
d. Data Collection Methods, Sites, and Analysis
The MTE was conducted using qualitative methods for primary data collection. Quantitative information – including the baseline survey report, the Indicator Performance Tracking Tables (IPTTs), reports from the JHU Operations Research, the Detailed Implementation Plans (DIPs), and Annual Beneficiary Survey Reports (hereinafter referred to as Annual Survey Reports) – were also reviewed as part of the desk review. An analysis of much of the quantitative data contained in reports and other project documents that was reviewed for the MTE is provided in Annex F. The MTE team did not receive the actual component data for surveys, IPTT, etc. MTE methods included:
o Literature review (see Annex G for a list of main documents consulted). o Meetings and interviews with project staff. o Focus Group Discussions (FGDs) with project participants and community
stakeholders. o Key Informant Interviews (KIIs) with community, institutional stakeholders, and
project staff. o Direct observation of programming such as farmer field school (FFS) demonstration
plots, FFS member fields and storage areas, commodity storage and warehousing units, Behavior Change Communication (BCC) materials, infrastructure achievements, etc.
JENGA II Mid-Term Evaluation Report 5
o Participatory workshop with JENGA JAMAA II project staff to discuss Oxu’s initial findings, conclusions, and recommendations (see Annex H for the final workshop agenda and Annex I for the list of workshop participants).
o Donor briefing with USAID/DRC officials in Bujumbura. Data collection instruments – including FGD guides and KII question guides – were drafted prior to arrival in-country and then field-tested and finalized in-country. The individual SO tools also included questions related to cross-cutting issues such as gender, behavior change, knowledge management, commodity preferences, Food for Work (FFW), etc. Separate tools for commodities, financial management, general management, and FFW were also prepared for conducting interviews related to those aspects of the project. All of the question guides for the data collection tools are included in Annex J. In total, the MTE team visited 14 villages in five Health Zones in Uvira and Fizi Territories (i.e. the ADRA project zones) and 10 villages in two Health Zones in Kalehe Territory (WV project zones). The data collection methodology plan called for purposive sampling to select communities in which to conduct field work, with a view to cover: 1) diversity of geographic area, including all seven HZ in which JENGA II operates; 2) variations in quality of performance as perceived by project staff; 3) accessibility; 4) security; and 5) sites with activities in at least three of the four project SOs. The MTE team was not able to conduct the sampling as planned and the field work sites were ultimately selected using the following process:
- Oxu requested detailed site lists with a preference for sites with activities in at least three of the four SOs. Information requested included: time needed to travel from base to site; project staff ranking of participation and performance; accessibility, including no security issues; whether agricultural demonstration plots and health centers (HCs) were nearby; and diversity of ethnic groups.
- Neither ADRA nor WV could fulfill the information request for all project sites in the time available.4 To get this information, the MTE team would have had to delay the field work, and it was not clear how long it would have taken for ADRA and WV to provide the full information being requested.
- As a result, we asked ADRA for 20 sites and WV for 10 sites responding to the above criteria. - The main team (SO1, 2, 3, and 4 leads) then randomly selected 10 sites for ADRA and six
sites for WV, using the lists and other information provided upon arrival. The four ADRA sites and four WV sites for the team member responsible for FFW/ Commodities/ Environmental Compliance were selected primarily by project staff, based on sampling of the staff ranking of site performance, as well as the need to see sites with infrastructure activities and commodity warehouses.
The MTE team field work achievements are provided in Annex K. For the interviews and meetings held with project staff, government staff, and other key informants, a table that provides interviewee positions, organizations, whether the interview was individual or collective, and general subject(s) of the interviews is provided in Annex L. A detailed calendar for the field work is
4 Oxu sent the initial follow-up request for complete site lists on 26 June (the day after receiving a signed contract from ADRA), which was also in the draft contract and scope of work. The MTE also asked for the site lists with the additional components of information on 3 July, on 7 July, and again upon arrival in-country. Concerned by further delays to the field work, and with a very tight timeline for the fieldwork, the MTE team proceeded with the modified process.
JENGA II Mid-Term Evaluation Report 6
proved in Annex M. All data collected was consistent with good practices around informed consent and confidentiality with regard to information provided by evaluation participants, including using a standard informed consent protocol for all individual interviews and ensuring that project staff were not present for any of the FGDs or KIIs with external stakeholders.
All data collected during primary data collection was done by Oxu MTE team members with interpreters5 providing assistance when needed. Field notes were prepared by each team member for all data collected. Primary data collection was analyzed using the following steps:
- Regular review by each team member of field data notes from data collection exercises for the sectors/ topic areas for which each individual team member was responsible.
- Identification via open coding of major themes and patterns emerging in the data for each team member’s data, which was done in the initial days of data collection.
- Updating major themes and patterns based on additional data collection. This updating was repeated periodically throughout the field work.
- Daily discussion of findings and reflections among team members after each day of data collection, in order to: begin to categorize findings and confirm patterns in individual data as well as across data collected by multiple team members: discuss and consider cross-cutting issues; identify relationships among major themes and patterns, using axial coding; and consider additional focus or variation to questions in subsequent days’ data collection.
- Once field work concluded, each team member conducted another full review of his/ her data to confirm and sharpen findings and to begin to formulate conclusions and recommendations.
- After field work, the team also worked together to look across the data to confirm salient overall, general, and cross-cutting themes and also to discuss in more detail findings related to individual sectors or topic areas.
- A sample of each team member’s field notes were also reviewed by another Oxu team member to ensure an additional layer of review.
- Participatory analysis with JENGA II staff to discuss and further analyze the team’s preliminary findings and recommendations occurred during a results analysis workshop with JENGA II consortium staff.
- Upon conclusion of the workshop, each team member further refined his/her findings, conclusions and recommendations based on discussions and feedback from the workshop.
Rigor of data collection and analysis was ensured through: data collection with respondents representing a variety of subject positions and several data collection methods; detailed documentation from data collection events; triangulation of data across multiple sources and including evaluation participants from a variety of subject positions; and conducting additional checks, especially with project staff, to clarify outstanding questions or seek further information on certain topics.
e. Constraints and limitations There were a number of constraints encountered while conducting the MTE. First, many important project-related documents were received only a few days prior to or even after team members arrived in DRC. In addition, quantitative data on midterm results for all major activities was not provided in a timely fashion and raised questions about the data. A full version of the Year 3 DIP results was not received until one week after submission of the draft MTE report, and for many SOs
5 Interpreters were recruited and hired by JENGA II as independent contractors for the duration of the field work.
JENGA II Mid-Term Evaluation Report 7
there are still unanswered questions about achievements and targets in the Year 3 DIP. Along the same lines, the preliminary 2014 Annual Survey Report, which was supposed to be made available in mid-July, was received during the second week of August (during the team’s final days in-country). In both cases, the data was not available to guide field work and little time was available to discuss the documents with project staff. In addition, after reviewing this information along with other quantitative project data we had serious concerns about the quality and validity of the data, which should theoretically be used to support findings from the qualitative data collection. We recognize that this is a major limitation of this MTE exercise and this report, as it suggests that findings about quality of intervention implementation are more reliable than those related to quantifiable project progress. The team also did not receive the detailed information requested for all sites prior to arrival, so site selection was done once the team was in-country following the process identified above. The process was not ideal in that the team did not have information on all sites in advance and was thus unable to do purposive sampling based on a full site list. The sample of site choices that ADRA and WV gave still adhered to the initial criteria that Oxu provided, but the limitation is that the number of sites available to select from was smaller than if we had been provided all of the information we requested. Oxu also selected a small number of villages that were not on the list of 30 villages provided by ADRA and WV. While methodologically this issue is a source of possible bias, the number of critical findings that the team discovered in the sites visited combined with other means of triangulating information (detailed below) suggests that the bias for this issue is likely fairly limited. In addition, the team had wanted to observe a food distribution firsthand but was unable to do so given the timing of the field work. Finally, the team was not able to conduct FGDs with non-project participants as originally planned. Ideally, the team would have gone to nearby non-project communities to get a better sense of potential spillover effects or to identify possible targeting issues, but this was not possible due to time constraints. Instead, an FGD with non-beneficiaries was organized during the first week of field work in one of the project villages, but participants were clearly expecting that since they had been called to this meeting, they were now going to be included in the project. Based on this experience, the team decided to cancel other FGDs with non-beneficiaries in project villages and to rely on other core questions in the SO tools to gauge the extent of spillover effects and potential targeting issues. Sources of possible bias in the information collected by the team include:
- Only being able to visit a small proportion of project sites in relation to the total number; - The team not being able to select sites for field work based on having a full list of sites with
information provided for each of the criteria the team set for site selection. As a result the project staff had a more influential role in site selection than desired;
- Project staff, community leaders and project volunteers selected FGD participants and some of the key informants as well;
- Visiting sites that mostly had activities in three of four or all four SOs;6 - Excluding sites that were more than one and a half hours from the base (the majority of
sites are along main roads and close to bases); - Limited data collection with non-participants in project activities (even in project sites) to
assess targeting and access to project activities;
6 It was difficult to know how much bias might have been introduced by this limitation, as the project could not provide us with information in terms of the percentage of sites where activities in 1-2 SOs, 3 SOs, and 4 SOs are being implemented. Based on the information we did receive and our general perceptions, it seems the majority of project sites have activities in at least 3 SOs, but it was impossible to verify with certainty.
JENGA II Mid-Term Evaluation Report 8
- Project staff proposed most of the activities and sites for observations; - A number of evaluation respondents (program staff and project beneficiaries) seemed
reticent to share information, though this was mainly regarding aspects of the project that could be seen as negative;
- The possibility of the team being seen as part of the project (and therefore lacking independence) since the team used program branded vehicles and was introduced to evaluation participations by project staff;
- The team used translators for Swahili-French translations and on occasion, for translations in other local languages. While this did not pose any major constraints for the two team members who spoke Swahili, the quality of translating has the potential to bias the work of the two team members who did not speak Swahili.
The MTE team sought to mitigate these sources of bias through triangulation of the data collected in a number of ways: speaking with key project stakeholders (staff, relevant government officials etc.) with multiple project experiences at the territorial/provincial levels to get a global, general perspective; direct observation of a number of activities; follow-up meetings with project staff; review of past project documents and available quantitative information on the project; FGD and KII guides for different SOs that asked beneficiaries many of the same core questions in each site; and through the participatory workshop to discuss and validate findings. Through these means we did conclude that the findings from the data collection seem generalizable in spite of the potential sources of bias.
JENGA II Mid-Term Evaluation Report 9
III. MTE Findings and Recommendations a. Introduction and organization of findings
The Results Framework should be the central element of the JENGA II project as it articulates the project’s theory of change, should allow for tracking progress against the overall strategy (via the IPTT), and forms the basis for project management and the DIP. The evaluation methodology and tools were structured around the Results Framework and accordingly organized by the four Strategic Objectives. The team also addressed cross-cutting themes, program management and quality issues, and implementation processes. The MTE findings and recommendations presented in this section are organized according to the Results Framework structure (i.e. SO/ Intermediate Result (IR)/ sub-IR). Each SO section below is presented as follows: 1) an overall summary of progress under the SO; 2) an introduction to each IR; 3) within each IR, findings and conclusions are presented separately at the sub-IR level; 4) recommendations for each IR; and 5) any additional findings or recommendations for the SO. At the sub-IR level, we also provide updates on quantifiable achievements compared to targets during the first three years of the project for main activities. The data we provide at the beginning of each sub-IR description is taken from the Year 3 DIP, though we do have concerns about overall data reliability for the project (as described in further detail below in Section IV.c in the sub-section on Project Documentation and M&E, as well as in Annex F, Summary Analysis of JENGA II Quantitative Information).7 Where there are clear discrepancies between the Year 3 DIP and other information we received, we explain those in this section in footnotes or the narrative. The targets that are shown represent cumulative target levels for Years 1-3 of JENGA II (not the overall LOA target). We present the majority of the findings for the project as a whole. There are, however, a number of distinctions made for ADRA or WV, given that each organization is implementing all activities in distinct geographic areas. For some activities, for example, one agency may currently be on target while the other has not met targets to date. We note where such differences occur, and some recommendations are specified for one or the other organization. A summary of findings in relation to the Results Framework for each SO is provided in Annex N. In addition, based on the MTE findings there are a small number of proposed modifications to the Results Framework, which are also provided in Annex N. Finally, findings and recommendations related to cross-cutting themes, general overall observations, and program management are addressed in Section IV.
7 We requested numerous times to get a DIP with activity accomplishments through the end of Year 3 of the project. This request was finally fulfilled on 31 August (a week after we submitted the draft MTE report). Prior to getting the full DIP, Coordinators for each SO provided numerous versions of individual SO DIPs, but on each occasion for each SO there would be discrepancies or differences from previous versions, which raised a number of questions about the validity of the information. Even the final version of the DIP provided to us had quite a few numbers that were dramatically different from the previous SO DIPs we had received (and even some target levels had changed).
JENGA II Mid-Term Evaluation Report 10
b. Findings in relation to the Results Framework
Strategic Objective 1: Food insecure farming households with increased incomes Summary of SO1 progress At the time of the MTE field work, most SO1 activities had been implemented. The project implemented SO1 activities in the three territories but with a delay of approximately one year in Kalehe HZ due to issues beyond the project’s control, such as initial hostility by local communities to the project, including opposition to recruiting any personnel from outside Kalehe. The approach used in SO1 has proven relevant to helping smallholder farmers (SHFs) address their needs, with new techniques readily adopted and a general appreciation for the new crop varieties introduced. Cumulatively 500 FFS have been installed or 100% of what was planned by the third year. During the first three years of the project, ADRA and WV reached nearly 14,700 farmers in the FFS (out of 15,000 planned), and FFS participants in turn have reportedly trained over 40,000 farmers using the Farmer-to-Farmer (F2F) methodology. During the second year, SENASEM monitored 20 WV-supported seed multiplication producer groups but only for cassava. Of the 20 producer groups, 16 succeeded in gaining seed certification. For ADRA areas, SENASEM and INERA trained eight associations for different crops (cassava, groundnuts, beans, rice, and maize) but the monitoring visits and the certification failed to take place. By the end of Year 3, the project had trained 1,851 (111%) of the 1,500 seed producers planned. While training has been conducted for 149 of the 183 farmer-business associations (FBAs) and a number of FBAs, especially in the WV zone, have achieved legal status, the marketing component of SO1 shows less progress with few concrete results. Finally, a strength of the SO1 achievements to date is that over 60% of SO1 beneficiaries have been women. IR1.1: Increased agricultural productivity and diversified production of smallholder farmers IR1.1 includes FFS, improving SHF access to credit, and building/ rehabilitating irrigation and drainage facilities. Sub-IR1.1.1: Improved and diversified agricultural practices adopted 500 out of 500 FFS installed (100%) 14,688 out of 15,000 farmers trained via FFS (98%) 1,851 out of 1,500 seed producers trained (111%) Findings Of all the IR1.1 activities, the training on agricultural practices and the introduction of new varieties were generally much appreciated by the project participants. All of the planned 500 FFS through Year 3 were installed and the project has reached nearly 15,000 farmers through FFS. FFS participants also reported that they have each trained three farmers using the F2F methodology; the F2F FGD participants trained through the F2F approach expressed their satisfaction with the training and report that they have applied the techniques in their fields. FFS participants were also trained in the concepts of market-oriented agriculture. While ADRA conducted a study with INERA during JENGA I to try different varieties of cassava and beans in different agro-ecological systems, the current JENGA II project did not conduct seed varietal trials in new project sites or for other project crops. As a result some bean varieties that were distributed were not well-adapted to conditions in the Ruzizi Plain in five of the seven sites visited by the MTE team in Fizi and Uvira.
"The bean variety which was introduced by the project has not done well here at home (in the valley) but there is another variety of white bean that had largely adapted over time and came from Tanzania" (Interviewee in Ekwena in Fizi territory)
JENGA II Mid-Term Evaluation Report 11
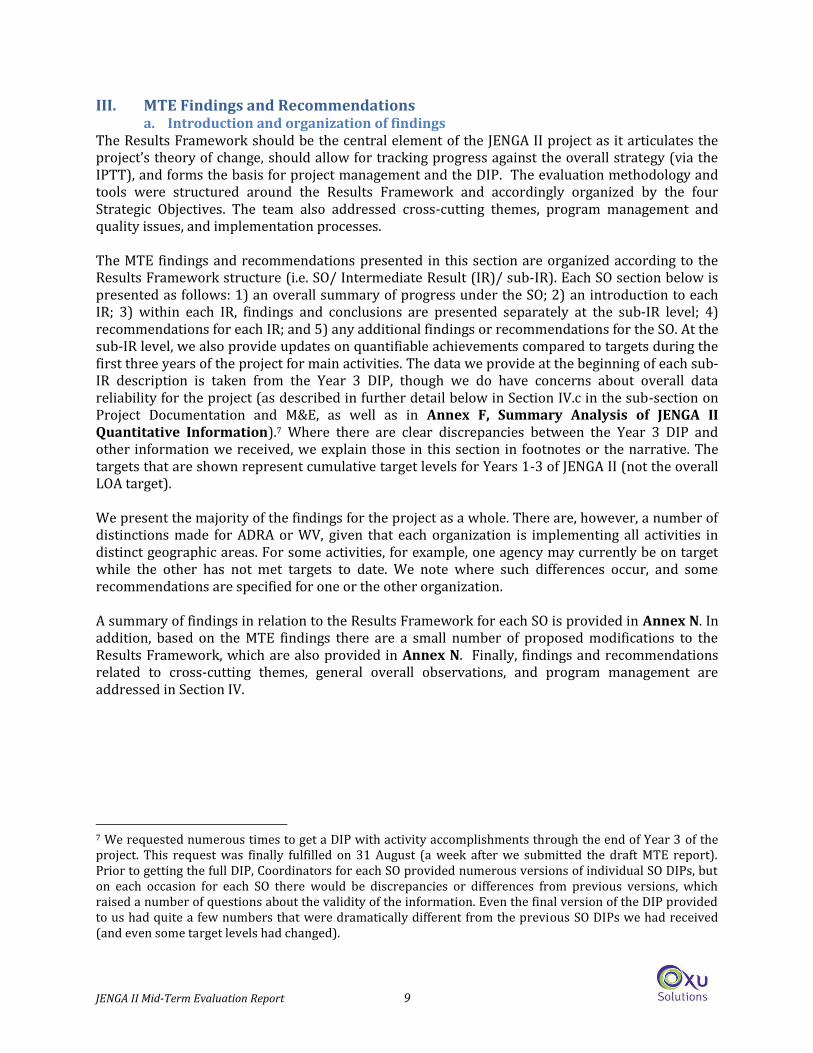
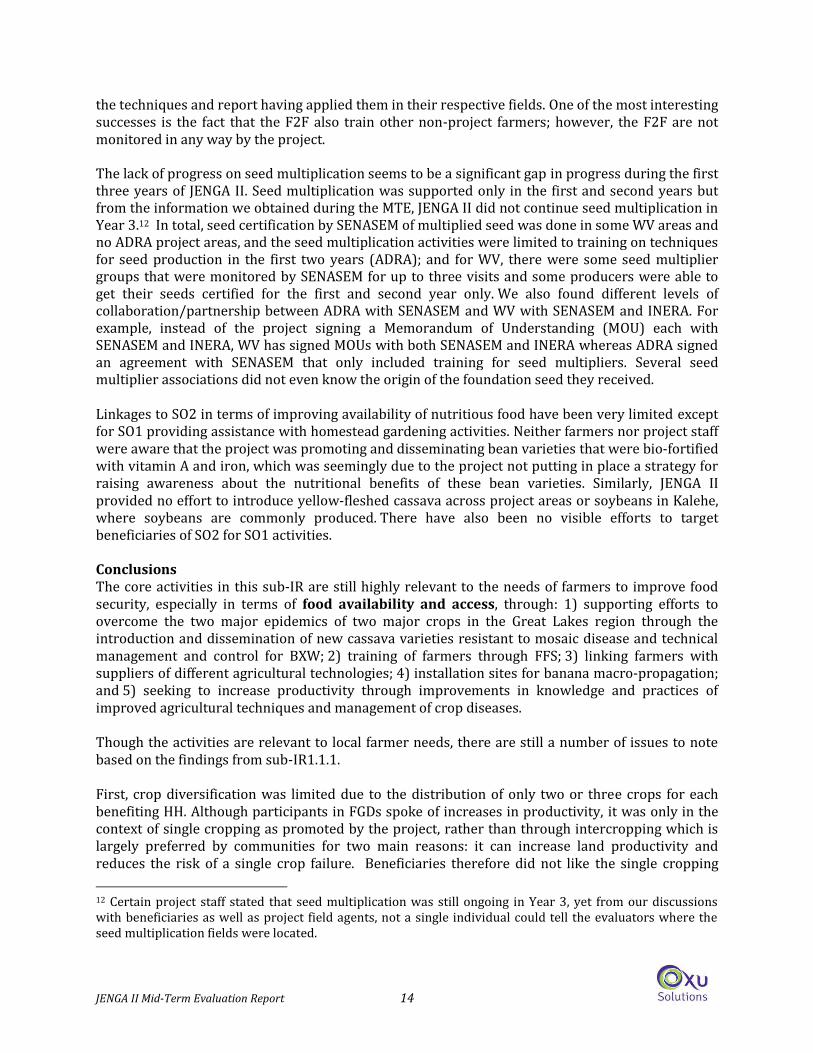
The MTE team observed the most progress in improving agricultural practices of SHFs in Fizi, Uvira and Kalehe for four crops (cassava, beans, groundnuts and bananas) and in the management of CMD (for cassava) and BXW for banana cultivation. There appears to be little progress so far for rice cultivation; as of the end of the second year of the project, in places where it is practiced, yields remained low with the varieties promoted by the project (SIPI and IRON8) being long-cycle crops (6-8 months), whereas 3-4 month varieties which can yield more than 5 tons/ha in farmer fields are available in EDRC.9 Based on FGDs, it is clear that farmers generally appreciate the new varieties, including cassava, beans (in higher elevations in the mountainous areas), peanuts, and maize and according to the participants there was an increase in productivity/performance, except for beans in the lowlands in the Ruzizi Plain (as described above) and some cassava that was attacked by CMD (see photos below, which show the difference between the varieties that have done well compared to those that have been attacked). There are cases of reported failures in some places where the project introduced cassava and in the same season plants already showed signs of disease.10 Farmers have appreciated the techniques they have learned and the associated benefits (using less seed, control of harmful weeds, and the fact that farmers can now know if a plant was taken from the field and take steps to prevent further theft). For two years, however, there has been a problem of late arrival of seeds in some areas, which drastically reduces yields and encourages pests.
8 The IRON variety was used only for the first year of the project and JENGA II staff reported the average yield of 2.1 tons/ha (which is a relatively low yield for irrigated rice). Project staff report that it was discontinued due to difficulties regarding the water requirements for rice until the drainage and irrigation canals of the infrastructure component were completed. 9 Performance of introduced irrigated rice varieties in Ruzizi plain, South Kivu province, DR Congo, Walangululu, M.J et al; Third RUFORUM Biennial Meeting 24 - 28 September 2012, Entebbe, Uganda. This study found that in the Ruzizi Plain the following: two improved varieties yielded up to 8 tons/ha; five improved varieties yielded up to 7 tons/ha; and the local SIPI and IRON varieties yielded at most 2.5 tons/ ha. The improved varieties are also short-cycle crops – 100-115 days, compared to the local varieties that are long-cycle crops – at least 180 days. 10 The MTE witnessed this during field visits in Kabondozi and Ake in Fizi territory.
A JENGA II cassava variety that has already been attacked (left) and the associated weak production (right)
JENGA II Mid-Term Evaluation Report 12
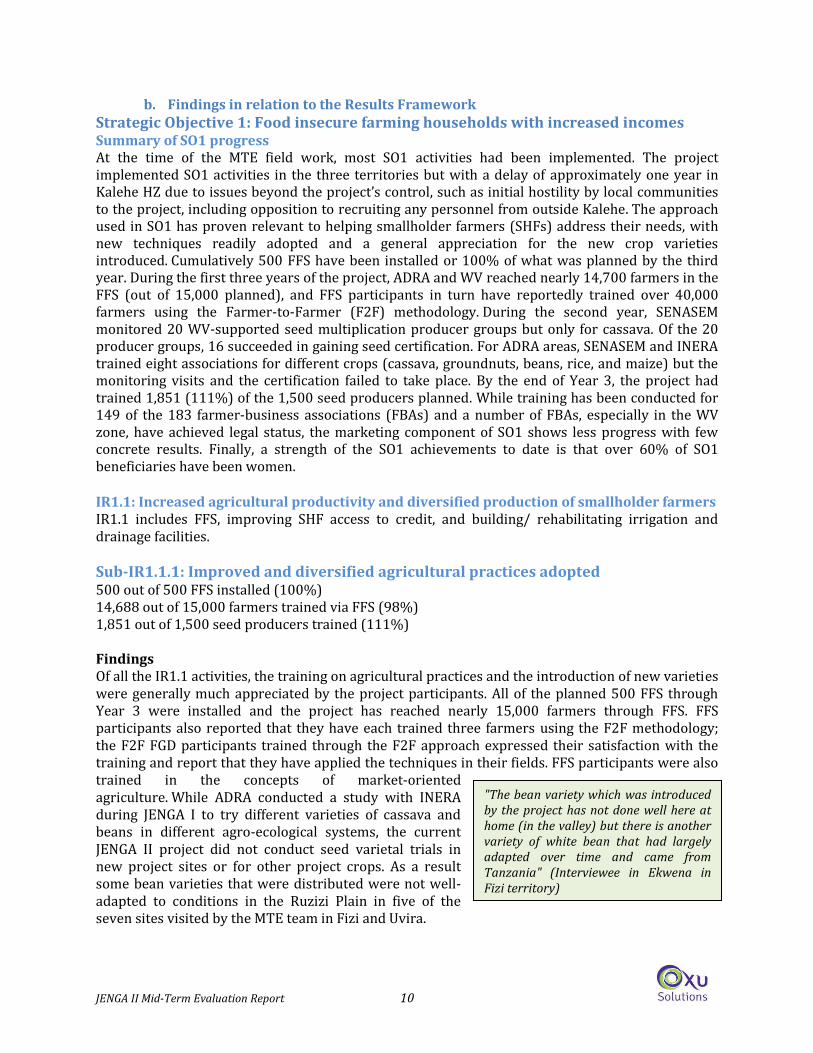
The rate of adoption and diffusion of new cassava varieties is also proving slow because a single cassava plant generates only about 5-6 roots. Currently, the project has multiplied 1,969,150 linear meters (mL) of mosaic-resistant cassava cuttings out of the 2,366,400 mL planned (a total of 84%).
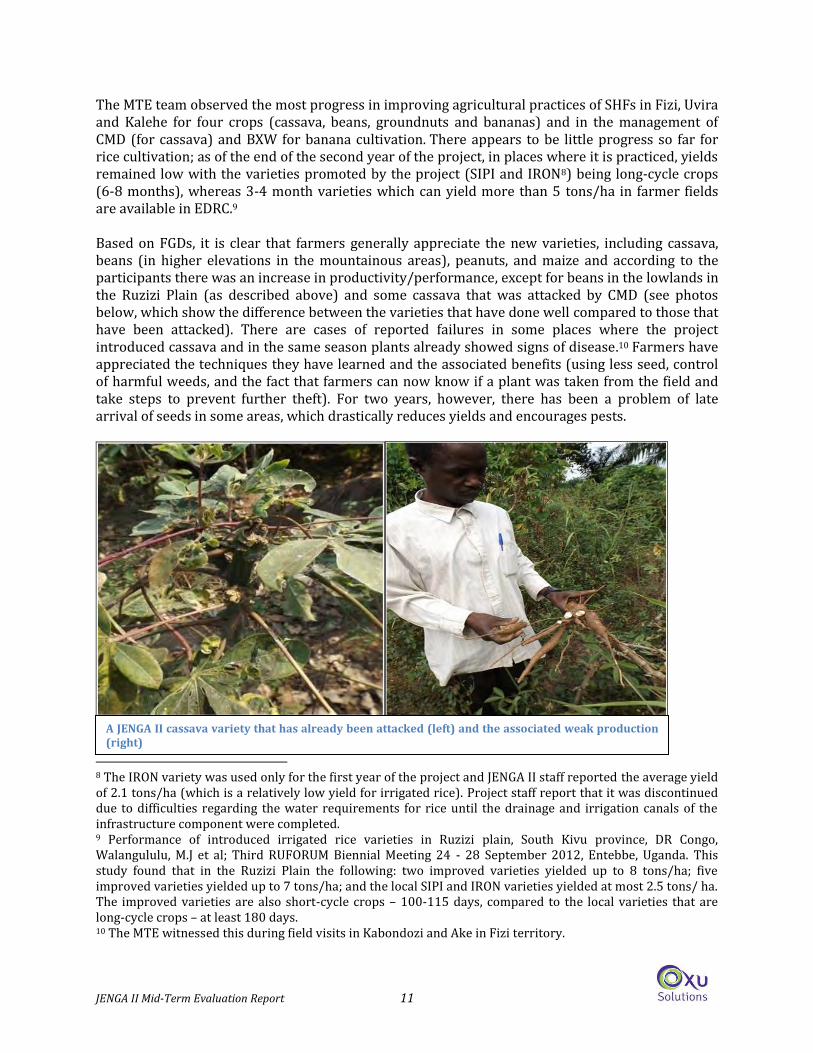
Activities for the management of BXW are appreciated but have been implemented with significant delay, and for the moment the number of healthy suckers is still far from the target (of the 300,000 plants planned, the project is only at 15%). This relatively low number is due to the fact that the activities for producing clean suckers began only in 2013 because WV had to reach an agreement with a research institution (i.e. the International Institute of Tropical Agriculture (IITA) or
Field with healthy cassava from project-provided cuttings (left) and the resulting production (right).
Field multiplication of healthy banana suckers 9 months after covering the macro-propagator site with mulch for soil improvement
JENGA II Mid-Term Evaluation Report 13
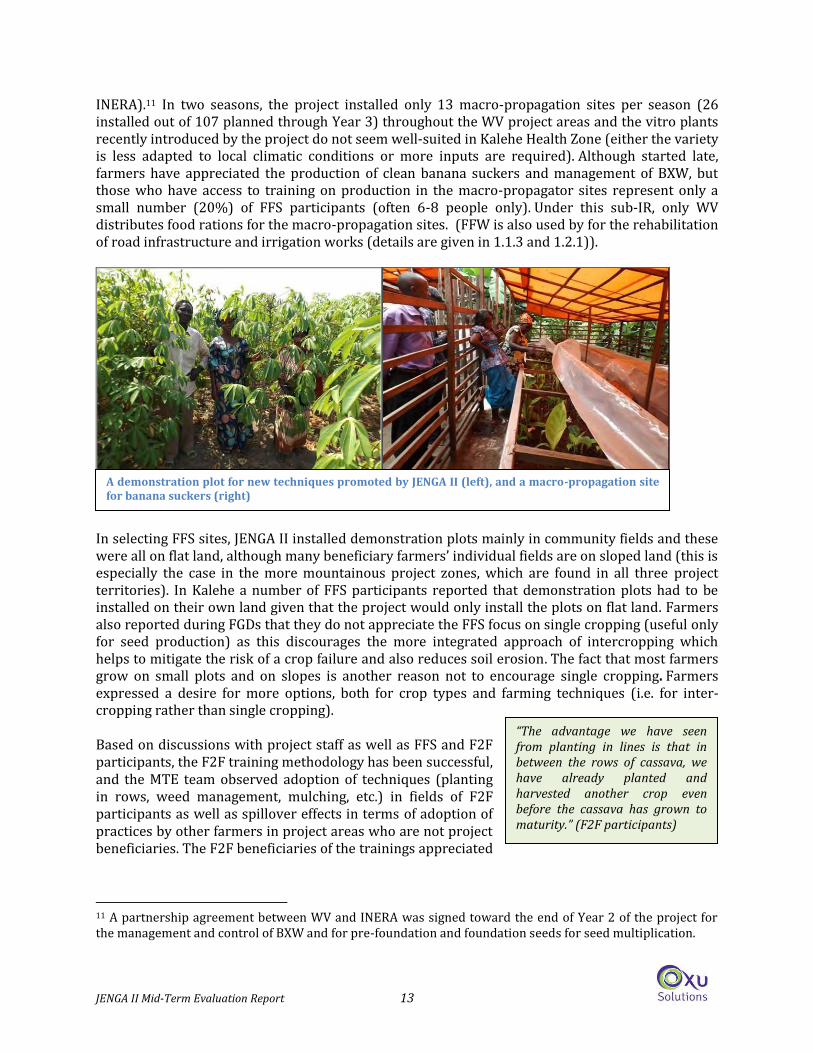
INERA).11 In two seasons, the project installed only 13 macro-propagation sites per season (26 installed out of 107 planned through Year 3) throughout the WV project areas and the vitro plants recently introduced by the project do not seem well-suited in Kalehe Health Zone (either the variety is less adapted to local climatic conditions or more inputs are required). Although started late, farmers have appreciated the production of clean banana suckers and management of BXW, but those who have access to training on production in the macro-propagator sites represent only a small number (20%) of FFS participants (often 6-8 people only). Under this sub-IR, only WV distributes food rations for the macro-propagation sites. (FFW is also used by for the rehabilitation of road infrastructure and irrigation works (details are given in 1.1.3 and 1.2.1)).
In selecting FFS sites, JENGA II installed demonstration plots mainly in community fields and these were all on flat land, although many beneficiary farmers’ individual fields are on sloped land (this is especially the case in the more mountainous project zones, which are found in all three project territories). In Kalehe a number of FFS participants reported that demonstration plots had to be installed on their own land given that the project would only install the plots on flat land. Farmers also reported during FGDs that they do not appreciate the FFS focus on single cropping (useful only for seed production) as this discourages the more integrated approach of intercropping which helps to mitigate the risk of a crop failure and also reduces soil erosion. The fact that most farmers grow on small plots and on slopes is another reason not to encourage single cropping. Farmers expressed a desire for more options, both for crop types and farming techniques (i.e. for inter-cropping rather than single cropping). Based on discussions with project staff as well as FFS and F2F participants, the F2F training methodology has been successful, and the MTE team observed adoption of techniques (planting in rows, weed management, mulching, etc.) in fields of F2F participants as well as spillover effects in terms of adoption of practices by other farmers in project areas who are not project beneficiaries. The F2F beneficiaries of the trainings appreciated
11 A partnership agreement between WV and INERA was signed toward the end of Year 2 of the project for the management and control of BXW and for pre-foundation and foundation seeds for seed multiplication.
“The advantage we have seen from planting in lines is that in between the rows of cassava, we have already planted and harvested another crop even before the cassava has grown to maturity.” (F2F participants)
A demonstration plot for new techniques promoted by JENGA II (left), and a macro-propagation site for banana suckers (right)
JENGA II Mid-Term Evaluation Report 14
the techniques and report having applied them in their respective fields. One of the most interesting successes is the fact that the F2F also train other non-project farmers; however, the F2F are not monitored in any way by the project. The lack of progress on seed multiplication seems to be a significant gap in progress during the first three years of JENGA II. Seed multiplication was supported only in the first and second years but from the information we obtained during the MTE, JENGA II did not continue seed multiplication in Year 3.12 In total, seed certification by SENASEM of multiplied seed was done in some WV areas and no ADRA project areas, and the seed multiplication activities were limited to training on techniques for seed production in the first two years (ADRA); and for WV, there were some seed multiplier groups that were monitored by SENASEM for up to three visits and some producers were able to get their seeds certified for the first and second year only. We also found different levels of collaboration/partnership between ADRA with SENASEM and WV with SENASEM and INERA. For example, instead of the project signing a Memorandum of Understanding (MOU) each with SENASEM and INERA, WV has signed MOUs with both SENASEM and INERA whereas ADRA signed an agreement with SENASEM that only included training for seed multipliers. Several seed multiplier associations did not even know the origin of the foundation seed they received. Linkages to SO2 in terms of improving availability of nutritious food have been very limited except for SO1 providing assistance with homestead gardening activities. Neither farmers nor project staff were aware that the project was promoting and disseminating bean varieties that were bio-fortified with vitamin A and iron, which was seemingly due to the project not putting in place a strategy for raising awareness about the nutritional benefits of these bean varieties. Similarly, JENGA II provided no effort to introduce yellow-fleshed cassava across project areas or soybeans in Kalehe, where soybeans are commonly produced. There have also been no visible efforts to target beneficiaries of SO2 for SO1 activities. Conclusions The core activities in this sub-IR are still highly relevant to the needs of farmers to improve food security, especially in terms of food availability and access, through: 1) supporting efforts to overcome the two major epidemics of two major crops in the Great Lakes region through the introduction and dissemination of new cassava varieties resistant to mosaic disease and technical management and control for BXW; 2) training of farmers through FFS; 3) linking farmers with suppliers of different agricultural technologies; 4) installation sites for banana macro-propagation; and 5) seeking to increase productivity through improvements in knowledge and practices of improved agricultural techniques and management of crop diseases. Though the activities are relevant to local farmer needs, there are still a number of issues to note based on the findings from sub-IR1.1.1. First, crop diversification was limited due to the distribution of only two or three crops for each benefiting HH. Although participants in FGDs spoke of increases in productivity, it was only in the context of single cropping as promoted by the project, rather than through intercropping which is largely preferred by communities for two main reasons: it can increase land productivity and reduces the risk of a single crop failure. Beneficiaries therefore did not like the single cropping
12 Certain project staff stated that seed multiplication was still ongoing in Year 3, yet from our discussions with beneficiaries as well as project field agents, not a single individual could tell the evaluators where the seed multiplication fields were located.
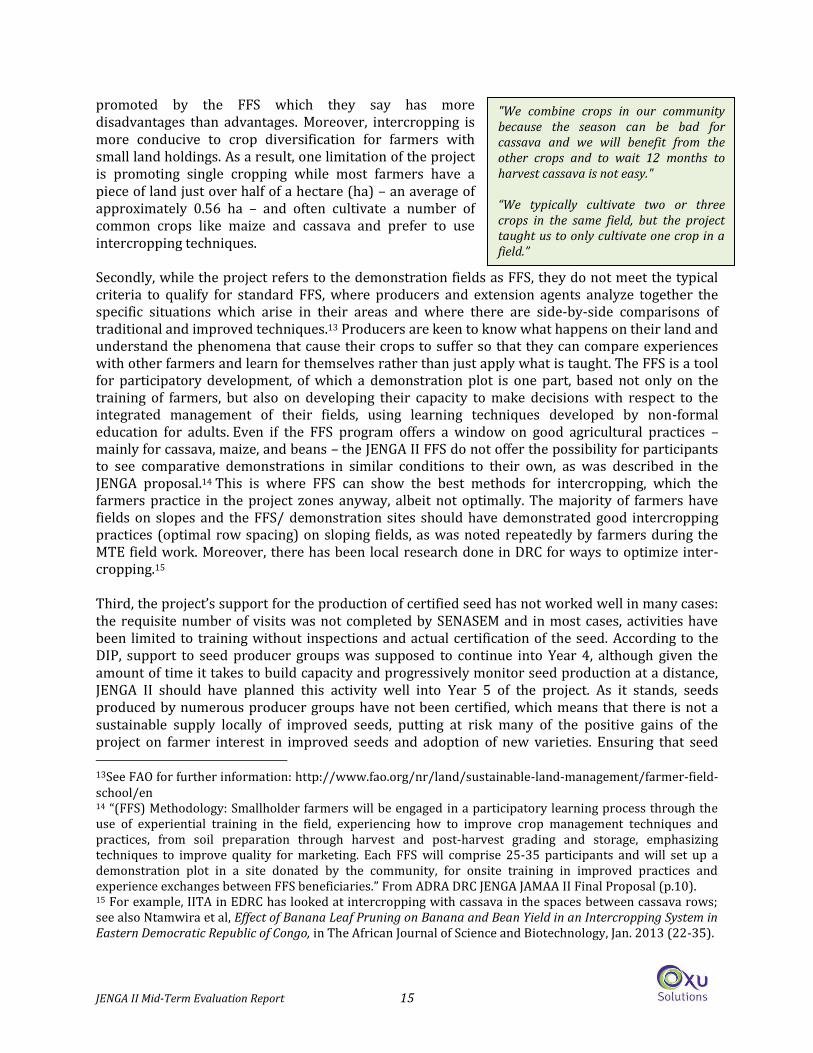
JENGA II Mid-Term Evaluation Report 15
promoted by the FFS which they say has more disadvantages than advantages. Moreover, intercropping is more conducive to crop diversification for farmers with small land holdings. As a result, one limitation of the project is promoting single cropping while most farmers have a piece of land just over half of a hectare (ha) – an average of approximately 0.56 ha – and often cultivate a number of common crops like maize and cassava and prefer to use intercropping techniques. Secondly, while the project refers to the demonstration fields as FFS, they do not meet the typical criteria to qualify for standard FFS, where producers and extension agents analyze together the specific situations which arise in their areas and where there are side-by-side comparisons of traditional and improved techniques.13 Producers are keen to know what happens on their land and understand the phenomena that cause their crops to suffer so that they can compare experiences with other farmers and learn for themselves rather than just apply what is taught. The FFS is a tool for participatory development, of which a demonstration plot is one part, based not only on the training of farmers, but also on developing their capacity to make decisions with respect to the integrated management of their fields, using learning techniques developed by non-formal education for adults. Even if the FFS program offers a window on good agricultural practices – mainly for cassava, maize, and beans – the JENGA II FFS do not offer the possibility for participants to see comparative demonstrations in similar conditions to their own, as was described in the JENGA proposal.14 This is where FFS can show the best methods for intercropping, which the farmers practice in the project zones anyway, albeit not optimally. The majority of farmers have fields on slopes and the FFS/ demonstration sites should have demonstrated good intercropping practices (optimal row spacing) on sloping fields, as was noted repeatedly by farmers during the MTE field work. Moreover, there has been local research done in DRC for ways to optimize inter-cropping.15 Third, the project’s support for the production of certified seed has not worked well in many cases: the requisite number of visits was not completed by SENASEM and in most cases, activities have been limited to training without inspections and actual certification of the seed. According to the DIP, support to seed producer groups was supposed to continue into Year 4, although given the amount of time it takes to build capacity and progressively monitor seed production at a distance, JENGA II should have planned this activity well into Year 5 of the project. As it stands, seeds produced by numerous producer groups have not been certified, which means that there is not a sustainable supply locally of improved seeds, putting at risk many of the positive gains of the project on farmer interest in improved seeds and adoption of new varieties. Ensuring that seed 13See FAO for further information: http://www.fao.org/nr/land/sustainable-land-management/farmer-field-school/en 14 “(FFS) Methodology: Smallholder farmers will be engaged in a participatory learning process through the use of experiential training in the field, experiencing how to improve crop management techniques and practices, from soil preparation through harvest and post-harvest grading and storage, emphasizing techniques to improve quality for marketing. Each FFS will comprise 25-35 participants and will set up a demonstration plot in a site donated by the community, for onsite training in improved practices and experience exchanges between FFS beneficiaries.” From ADRA DRC JENGA JAMAA II Final Proposal (p.10). 15 For example, IITA in EDRC has looked at intercropping with cassava in the spaces between cassava rows; see also Ntamwira et al, Effect of Banana Leaf Pruning on Banana and Bean Yield in an Intercropping System in Eastern Democratic Republic of Congo, in The African Journal of Science and Biotechnology, Jan. 2013 (22-35).
"We combine crops in our community because the season can be bad for cassava and we will benefit from the other crops and to wait 12 months to harvest cassava is not easy." “We typically cultivate two or three crops in the same field, but the project taught us to only cultivate one crop in a field.”
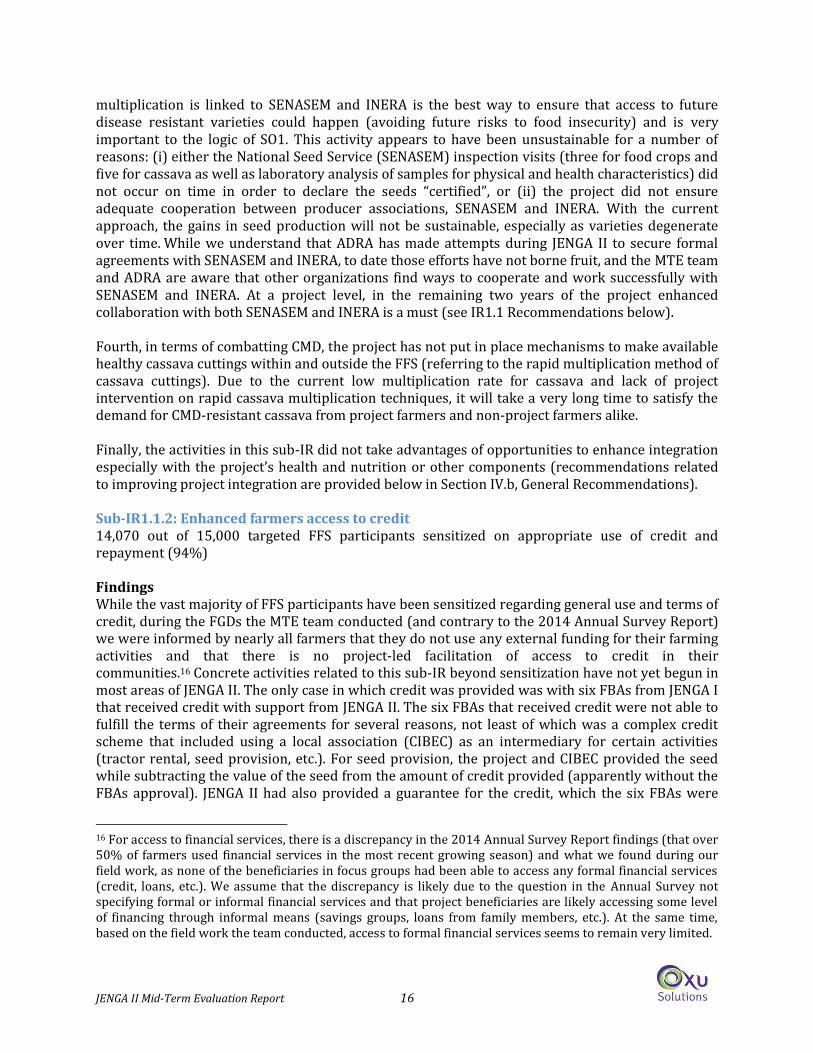
JENGA II Mid-Term Evaluation Report 16
multiplication is linked to SENASEM and INERA is the best way to ensure that access to future disease resistant varieties could happen (avoiding future risks to food insecurity) and is very important to the logic of SO1. This activity appears to have been unsustainable for a number of reasons: (i) either the National Seed Service (SENASEM) inspection visits (three for food crops and five for cassava as well as laboratory analysis of samples for physical and health characteristics) did not occur on time in order to declare the seeds “certified”, or (ii) the project did not ensure adequate cooperation between producer associations, SENASEM and INERA. With the current approach, the gains in seed production will not be sustainable, especially as varieties degenerate over time. While we understand that ADRA has made attempts during JENGA II to secure formal agreements with SENASEM and INERA, to date those efforts have not borne fruit, and the MTE team and ADRA are aware that other organizations find ways to cooperate and work successfully with SENASEM and INERA. At a project level, in the remaining two years of the project enhanced collaboration with both SENASEM and INERA is a must (see IR1.1 Recommendations below). Fourth, in terms of combatting CMD, the project has not put in place mechanisms to make available healthy cassava cuttings within and outside the FFS (referring to the rapid multiplication method of cassava cuttings). Due to the current low multiplication rate for cassava and lack of project intervention on rapid cassava multiplication techniques, it will take a very long time to satisfy the demand for CMD-resistant cassava from project farmers and non-project farmers alike. Finally, the activities in this sub-IR did not take advantages of opportunities to enhance integration especially with the project’s health and nutrition or other components (recommendations related to improving project integration are provided below in Section IV.b, General Recommendations). Sub-IR1.1.2: Enhanced farmers access to credit 14,070 out of 15,000 targeted FFS participants sensitized on appropriate use of credit and repayment (94%) Findings While the vast majority of FFS participants have been sensitized regarding general use and terms of credit, during the FGDs the MTE team conducted (and contrary to the 2014 Annual Survey Report) we were informed by nearly all farmers that they do not use any external funding for their farming activities and that there is no project-led facilitation of access to credit in their communities.16 Concrete activities related to this sub-IR beyond sensitization have not yet begun in most areas of JENGA II. The only case in which credit was provided was with six FBAs from JENGA I that received credit with support from JENGA II. The six FBAs that received credit were not able to fulfill the terms of their agreements for several reasons, not least of which was a complex credit scheme that included using a local association (CIBEC) as an intermediary for certain activities (tractor rental, seed provision, etc.). For seed provision, the project and CIBEC provided the seed while subtracting the value of the seed from the amount of credit provided (apparently without the FBAs approval). JENGA II had also provided a guarantee for the credit, which the six FBAs were
16 For access to financial services, there is a discrepancy in the 2014 Annual Survey Report findings (that over 50% of farmers used financial services in the most recent growing season) and what we found during our field work, as none of the beneficiaries in focus groups had been able to access any formal financial services (credit, loans, etc.). We assume that the discrepancy is likely due to the question in the Annual Survey not specifying formal or informal financial services and that project beneficiaries are likely accessing some level of financing through informal means (savings groups, loans from family members, etc.). At the same time, based on the field work the team conducted, access to formal financial services seems to remain very limited.
JENGA II Mid-Term Evaluation Report 17
aware of and as a result this lessened their feeling of responsibility for adhering to terms. Complicating matters further, CIBEC went bankrupt. At this point, the six FBAs are claiming that the project and/or CIBEC owe them money, and CIBEC believes the FBAs owe it money. For the FBAs established during JENGA II, none have received credit to date – there were five FBAs in Kalehe set to receive seed on credit, but the deal had to be canceled due to late arrival of the seed. Conclusions Progress in activities under Sub-IR 1.1.2 was very limited during Years 1-3 of the project and it is unclear if and how the project will continue with these activities. In addition, if the project does continue the credit facilitation activities it seems they would fit more logically under IR1.2 as part of the marketing and commercialization project components. Sub-IR1.1.3: Irrigation and drainage facilities improved/ built 29 out of 60 kilometers targeted through Year 3 of irrigation canals rehabilitated (48%)17 0 out of 80 kilometers targeted through Year 3 of drainage canals rehabilitated (0%) Findings Irrigation activities are only implemented in ADRA areas and have experienced delays in implementation due to the donor requirement for additional environmental assessments. However, the committees for the rehabilitation of irrigation channels were formed and construction activities are now in progress, though the project is significantly behind target for the number of kilometers that are supposed to be built/ rehabilitated for irrigation canals and drainage canals. Conclusions Irrigation infrastructure, having started in Year 3 and currently in progress, is appreciated by the beneficiaries, but so far has not had the chance to increase agricultural production (especially for rice growing areas).The construction of irrigation canals is therefore relevant to local needs and to achieving project results. Progress in Sub-IR1.1.3, however, was very limited during the first three years of JENGA II and it is therefore difficult to draw many conclusions at this time. IR1.1 Recommendations 1. FFS: Conduct Farmer Field Schools in which the basic standards for the activity are satisfied,
including: a) practicing intercropping (in association with certain crops/legumes that enrich the soil with nitrogen) with management and soil conservation for hillside plots; b) installing FFS on sloping ground under more realistic farmer conditions based on the local context; and c) putting in control plots to allow farmers to distinguish best practices and varieties. A sample training guide for FFS that was produced by the UN Food and Agricultural Organization in Niger was also provided with the Draft MTE Report.
2. FFS: Address certain key messages such as post-harvest management and soil and water management in FFS and in all other activities of SO1. Other key messages include: showing that seed production is far different from grain production; grading/ sorting; the moisture content required for each type of crop; pest management; management of BXW and other major crop diseases, etc. Finally, improvements in quality of agricultural products seem limited as farmers have been trained in post-harvest techniques but lack means for improving storage, such as the
17 Note that while the Year 3 DIP states that 29 km of a canal have been rehabilitated, during our field work we were informed by project staff and community members that only 12 of the 29 km had been completed and details regarding the completion of the remaining 17 km were being negotiated by project staff with the association managing the work.
JENGA II Mid-Term Evaluation Report 18
ready availability of affordable PICS bags for storage. There are, however, other physical and biological methods that are effective against post-harvest crop losses such as the strict respect of post-harvest techniques (drying, storing off the ground, protection from moisture, insects and rodents, etc.) and the use of plant pesticides such as tobacco and neem.
3. Banana: Promote more macro-propagation instead of vitro plants which require more care (mineral fertilizer); involve more members of the banana demonstration plots in trainings on the techniques for macro-propagation.
4. Banana: Enhance the level of cooperation with local authorities to raise awareness of control measures against BXW and to explore how to encourage local practices to prevent the wandering of animals that contribute to the spread of BXW. Conduct a mass awareness-raising campaign for BXW management and control.
5. Banana and CMD: Share lessons learned on BXW and CMD management with other FFP partners implementing DFAPs in EDRC, including FH and Mercy Corps.
6. Seeds: Strengthen seed multiplication by increasing the number of multiplier organizations, working much more closely with INERA and SENASEM and following all the standards required for the production of quality seed. To succeed in improving seed quality and variety adaptability in project areas, the project must engage collaboratively with these government entities.
7. Seeds: Conduct seed system assessments in targeted areas in collaboration with research centers (INERA, IITA, CIAT) to ensure the safety, sustainability, and performance of the seed system and widespread availability of quality seeds, potentially using or adopting a recently used HarvestPlus methodology for the assessments (HarvestPlus conducted a seed study in DRC in collaboration with SENASEM and INERA in 2012; while the report does not seem to be publically available, the project could request the report documents from HarvestPlus).
8. Seeds: Based on the results of the seed assessments, and in collaboration with the Inspection of Agriculture at the provincial and the territory levels as well as SENASEM, organize seed fairs with locally available quality seeds (focusing on areas where seed multiplication has taken place). These seed fairs would serve the triple purpose of: a) local seed producers (individuals or FBAs) will have a market to sell their seeds; b) local farmers will have access to new quality seeds; and c) providing venues to raise awareness around project activities and community and external resources (e.g. nutrition, FFS, management of BXW, the post-harvest operations, marketing, how and where to obtain seeds and advice, etc.). If successful, the project should work with the territory authorities and SENASEM in designing a plan to continue seed fairs organized by local actors even beyond the life of the project. Seed fairs could target F2F participants and other vulnerable farmers in the project areas that did not participate in FFS.
9. MoA Collaboration: Involve the territory agronomists and veterinarians in planning and implementation of project monitoring and post-project support, including the exit strategy and sustainability plan. They could be helpful with inputs, training, dissemination, and monitoring.
10. MoA Collaboration: Develop documented agreements with SENASEM and INERA including training, inspection and sampling visits and analysis of seed produced.
11. Varieties: The project must work with INERA and others for short-cycle (115 days) rice varieties that are more productive and are already available in the Ruzizi plain (Uvira).
IR1.2: Enhanced commercialization of agriculture products of smallholder farmers IR1.2 focuses on improving SHF access to markets through supporting FBAs, road rehabilitation, and market information, as well as improving the quality of agricultural products through better storage, post-harvest handling, and value-addition. The SO1 marketing component (i.e. IR1.2) has shown much less progress than the production component (i.e. IR1.1), with limited concrete results after three years of the project. To address the numerous constraints the project has faced with
JENGA II Mid-Term Evaluation Report 19
commercialization to date, ADRA organized a 10 week in-country technical visit from an agricultural marketing specialist to help strengthen the project’s marketing component but the report from the marketing specialist’s work was not available during the time of the MTE. Sub-IR1.2.1: Improved access to markets 149 out of a targeted 183 FBAs trained (81%)18 86 out of 183 targeted FBAs obtained formal association status (46.9%)19 84 out of 80 targeted km of road rehabilitated (105%) Findings FFS were grouped in farmer business associations (FBAs) and project staff trained farmers on various topics including: how to create an agricultural association/ cooperative, leadership, organization and management of a cooperative, agriculture as a business, and techniques for harvesting and post-harvest. FGDs and interviews with project staff from the marketing component suggest that these trainings are done routinely but that sometimes it is only the president of the FBA who attends the training, and yet the project is not doing any follow-up to ensure that there is cascade training provided to all FBA members. While approximately half of the project FBAs have obtained formal status, the process took a long time particularly in Fizi and Uvira due to the difficulties in trying to work with and through the CARGs to facilitate this for the FBAs. JENGA II also attempted to help facilitate the process but for some FBAs they provided the money to obtain formal status and waited eight months or longer to receive the formal documentation. Another challenge that arose is that the JENGA I associations were considered non-profits, and for achieving formal status the project had to change to the strategy to consider them FBAs, a process which took nearly a year. Two value chain studies have been completed, one conducted under JENGA I in Fizi and Uvira and another complementary study was done for Kalehe. The program has encouraged farmers to join together in FBAs, but these farmers have not found markets for the sale of their products. Farmers who produced seed (cassava cuttings and maize seed especially) had expectations that the project (ADRA and WV) would buy their products, which has created confusion among the FBAs. Although the project hosted a visit from an Agricultural Marketing Specialist from May-July 2014, the results of this analysis and the recommendations were not available at the time of the field work and the field team stated that they were waiting for the report. The MTE team also observed that for ADRA there appears to be two distinct teams within SO1 for agriculture and for marketing and there are risks of a lack of tight coordination between the two, particularly in the face of beneficiary communities.20 In FGDs, farmers noted the difficulties they have in marketing their agricultural products. The poor roads, especially during the rainy season, and lack of storage facilities were the main issues raised. They also mentioned the absence of value-added agricultural products. The project plans to conduct in the very near future updated value chain analyses and demand studies for all project
18 Note that by the end of Year 3, for certain topics the project had trained 149 FBAs of the 183 targeted, whereas for other topics only 108 out of the targeted 183 FBAs had been trained (59%). 19 This figure comes from the latest DIP received from ADRA HQ on 31 August 2014 although the MTE team received several other versions each with different numbers, some higher and some lower. 20 In one case, a community member asked a question about markets to a staff member from the agriculture team who responded “Wait for those who deal with that to arrive.”
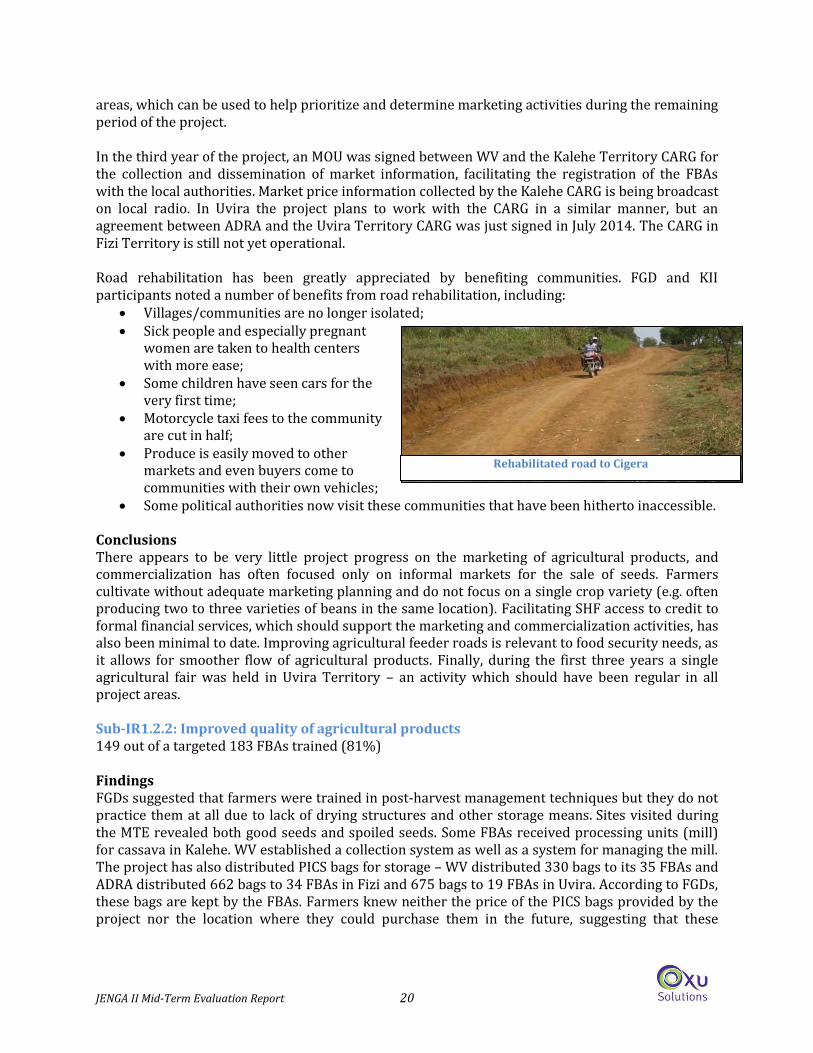
JENGA II Mid-Term Evaluation Report 20
areas, which can be used to help prioritize and determine marketing activities during the remaining period of the project. In the third year of the project, an MOU was signed between WV and the Kalehe Territory CARG for the collection and dissemination of market information, facilitating the registration of the FBAs with the local authorities. Market price information collected by the Kalehe CARG is being broadcast on local radio. In Uvira the project plans to work with the CARG in a similar manner, but an agreement between ADRA and the Uvira Territory CARG was just signed in July 2014. The CARG in Fizi Territory is still not yet operational. Road rehabilitation has been greatly appreciated by benefiting communities. FGD and KII participants noted a number of benefits from road rehabilitation, including:
Villages/communities are no longer isolated; Sick people and especially pregnant
women are taken to health centers with more ease;
Some children have seen cars for the very first time;
Motorcycle taxi fees to the community are cut in half;
Produce is easily moved to other markets and even buyers come to communities with their own vehicles;
Some political authorities now visit these communities that have been hitherto inaccessible. Conclusions There appears to be very little project progress on the marketing of agricultural products, and commercialization has often focused only on informal markets for the sale of seeds. Farmers cultivate without adequate marketing planning and do not focus on a single crop variety (e.g. often producing two to three varieties of beans in the same location). Facilitating SHF access to credit to formal financial services, which should support the marketing and commercialization activities, has also been minimal to date. Improving agricultural feeder roads is relevant to food security needs, as it allows for smoother flow of agricultural products. Finally, during the first three years a single agricultural fair was held in Uvira Territory – an activity which should have been regular in all project areas. Sub-IR1.2.2: Improved quality of agricultural products 149 out of a targeted 183 FBAs trained (81%) Findings FGDs suggested that farmers were trained in post-harvest management techniques but they do not practice them at all due to lack of drying structures and other storage means. Sites visited during the MTE revealed both good seeds and spoiled seeds. Some FBAs received processing units (mill) for cassava in Kalehe. WV established a collection system as well as a system for managing the mill. The project has also distributed PICS bags for storage – WV distributed 330 bags to its 35 FBAs and ADRA distributed 662 bags to 34 FBAs in Fizi and 675 bags to 19 FBAs in Uvira. According to FGDs, these bags are kept by the FBAs. Farmers knew neither the price of the PICS bags provided by the project nor the location where they could purchase them in the future, suggesting that these
Rehabilitated road to Cigera
JENGA II Mid-Term Evaluation Report 21
storage improvements were not sustainable. In most sites observed storage was not well-done, often with mixing of varieties as well as good and bad seeds. The MTE team also found that the lack of local storage facilities is still an obstacle. The project is putting in place a total of six Agricultural Collection Centers (ACCs), consisting of two ACCs in each territory. Although the latest DIP received from ADRA suggests that four ACCs had been constructed by the end of Year 3, according to project staff and field observations, the ACC in Sange in Uvira territory has already been completed and is functional; construction on the ACC in Minova in Kalehe Territory has been completed but the ACC is not yet operational; and construction on the other four ACCs is still in progress. There is a concern, however, that even when completed the ACCs will be unlikely to benefit the majority of farmers, many of whom will have to travel over three hours one way to reach the collection centers as the location of the ACCs was chosen to be in larger places that have bigger markets. Project beneficiaries during FGDs expressed a desire for smaller storage depots closer to their homes. Conclusions Improvements in quality of agricultural products seem limited as farmers have been trained in post-harvest techniques but lack means for improving storage (such as local storage depots, wooden pallets, storage bags, instruments for measuring humidity, etc.). Until addressed, the lack of appropriate storage will continue to be an obstacle in terms of improving commercialization, with many families continuing to store their harvests on the ground. IR1.2 Recommendations 1. The project must invest more in the training and awareness-raising of farmers on collective
sales and marketing, opening the lines of communication between stakeholders in the value chain, and illustrating the benefits of working with other farmers. A key initial action is to make and distribute catalogs with the following information: a) associations and the products that they produce (crops, varieties, quality, and quantity); b) buyers / processors of different products; c) credit providers; d) input (seeds, etc.) suppliers; and e) sources of market information.
2. Provide additional refresher trainings for FBAs on project and financial management, sales negotiations, business planning, and other aspects of working collaboratively to manage and run a business.
3. Promote the storage of agricultural products within the FBAs for those farmers relatively nearby and explore sustainable mechanisms for broader use of PICS bags.
4. Group the FBAs by crop type and encourage them to cultivate the same crop varieties within each group for a more uniform quality preferred by buyers.
5. Practice inventory credit in the FBAs, a technique in which the harvest serves as a guarantee for a credit for products which have potential for value addition.
6. Strengthen the capacity of farmers: (i) in the practice of agriculture as a business; (ii) to access and to use market information; (iii) to maintain the quality and quantity of agricultural products; and (iv) to add value to their products.
7. Train FBAs to collect their production in joint depots to facilitate access to markets and to increase their bargaining power.
8. Popularize successful local initiatives by organizing exchange visits for staff and farmers (e.g. in North Kivu and neighboring Rwanda)
9. Encourage value addition by farmers or entrepreneurs to increase their margins. 10. Put processing units in the ACCs (e.g. mill, shredders, peelers, etc.)
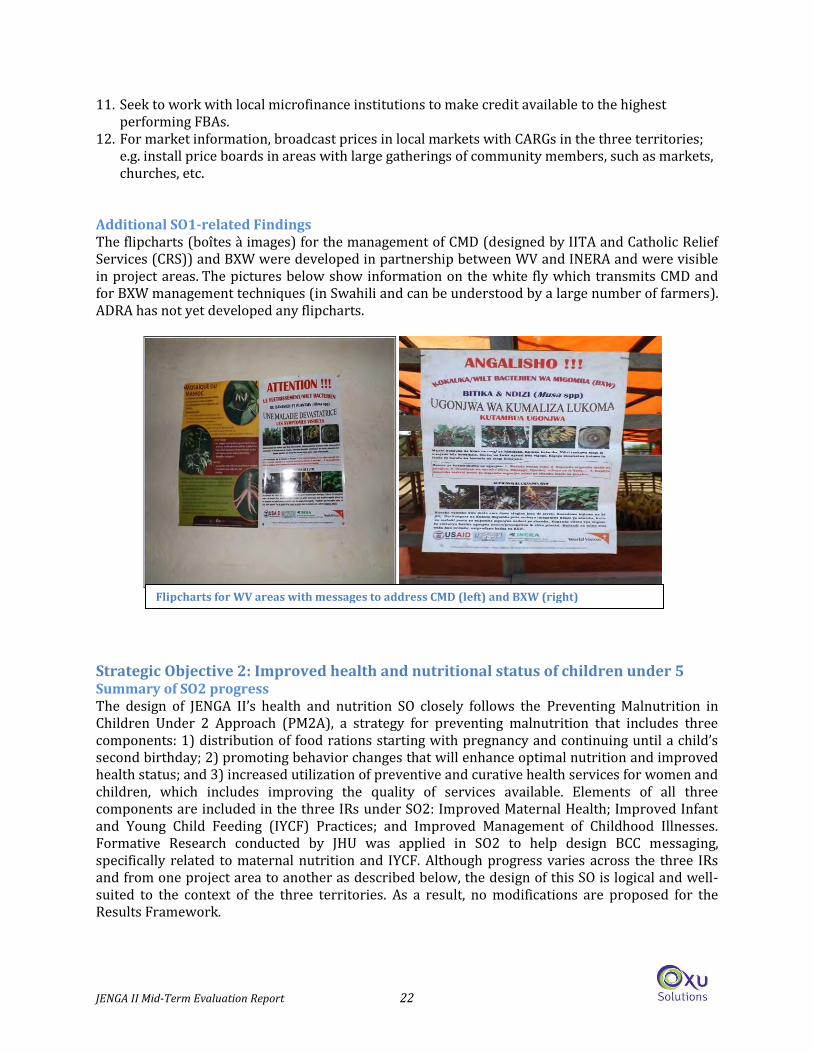
JENGA II Mid-Term Evaluation Report 22
11. Seek to work with local microfinance institutions to make credit available to the highest performing FBAs.
12. For market information, broadcast prices in local markets with CARGs in the three territories; e.g. install price boards in areas with large gatherings of community members, such as markets, churches, etc.
Additional SO1-related Findings The flipcharts (boîtes à images) for the management of CMD (designed by IITA and Catholic Relief Services (CRS)) and BXW were developed in partnership between WV and INERA and were visible in project areas. The pictures below show information on the white fly which transmits CMD and for BXW management techniques (in Swahili and can be understood by a large number of farmers). ADRA has not yet developed any flipcharts.
Strategic Objective 2: Improved health and nutritional status of children under 5 Summary of SO2 progress The design of JENGA II’s health and nutrition SO closely follows the Preventing Malnutrition in Children Under 2 Approach (PM2A), a strategy for preventing malnutrition that includes three components: 1) distribution of food rations starting with pregnancy and continuing until a child’s second birthday; 2) promoting behavior changes that will enhance optimal nutrition and improved health status; and 3) increased utilization of preventive and curative health services for women and children, which includes improving the quality of services available. Elements of all three components are included in the three IRs under SO2: Improved Maternal Health; Improved Infant and Young Child Feeding (IYCF) Practices; and Improved Management of Childhood Illnesses. Formative Research conducted by JHU was applied in SO2 to help design BCC messaging, specifically related to maternal nutrition and IYCF. Although progress varies across the three IRs and from one project area to another as described below, the design of this SO is logical and well-suited to the context of the three territories. As a result, no modifications are proposed for the Results Framework.
Flipcharts for WV areas with messages to address CMD (left) and BXW (right)
JENGA II Mid-Term Evaluation Report 23
SO2 activities are carried out in all seven Health Zones (HZs) covered by the project; however, not all Health Areas (HAs) within a HZ are included due to resource constraints. The decision as to which HAs and communities to include is based in large part on the recommendations of the MoH management teams in each of the seven HZs (the BCZs); on accessibility of sites as determined by security concerns, the location of WV and ADRA offices, and the availability of all-weather roads; and for ADRA, on the results of an October 2011 study done in Uvira and Fizi Territories (Rapport Evaluation Rapide des Communautés). The project has made measurable progress across all three IRs, but much remains to be done to meet the Life of Activity (LOA) targets and to ensure that the positive effects are sustained. Factors accounting for progress to date include: implementing the Care Group (CG) model starting in Year 1, with Leader Mothers (LMs) being the principal engines of change; reinforcing the knowledge and skills levels of volunteer community health workers (RECOs); including a WASH component, especially the activities related to clean water; proactive leadership from the two SO2 Coordinators; and dedicated project field agents. The project maintains a strong working partnership with the Ministry of Health (MoH), primarily through the MoH management teams in each of the seven HZs (BCZs) and via the Head Nurses at the Health Centers (HCs). Although there is no joint implementation of activities with other health projects, both ADRA and WV are active members of technical clusters, sometimes serving as the lead, and routinely share information and coordinate with other NGOs in their respective areas. Constraints to achieving LOA targets include: the fact that the majority of the approximately 2500 LMs currently active are showing less motivation and enthusiasm for continuing their activities due to a perceived lack of project-provided incentives; lack of follow-up for project-sponsored trainings; an overly ambitious set of targets; delays in implementing some key activities; and budget constraints for WV. The following findings, conclusions and recommendations are based on: FGDs with LMs, women benefitting from rations, men whose families benefit from rations, and members of Health Development Committees (CODESA); KIIs with community leaders, MoH personnel and project staff; observations of WASH infrastructure; and a thorough document review. IR2.1: Improved maternal health and nutritional status In addition to BCC, the principal activities for this IR consist of ration distribution to pregnant and lactating women (PLW) and the promotion of homestead gardens. Sub-IR2.1.1: Improved maternal access to a diversified diet 15,128 PLW enrolled in PM2A out of 13,065 targeted by end of Year 3 (116%) Findings Ration distribution: The process of distributing rations seems to go smoothly and beneficiaries are highly appreciative of the CSB and oil. They additionally know their rights and feel they have a voice in determining how the process is handled. For example, women reported that they had requested plastic bags for the CSB and these were provided; they also said they had asked that the CSB and oil not be mixed together at the distribution point and this request was also granted. The main complaint with the actual distribution process is that in many cases there is no shelter for the women and children while they wait; they are exposed to the elements, often for hours at a time. Targeting issues: While the PM2A strategy calls for blanket feeding JENGA II is using a targeted feeding approach since there are not enough rations to include all eligible beneficiaries in the
JENGA II Mid-Term Evaluation Report 24
communities with PM2A activities. Initially, the project enrolled PLW and children under 2 (CU2) without clear criteria for which PLW and CU2 should participate and in the early stages, some children were not kept in the program for the full recommended period (6-23 months of age). During Year 1, WV began to enroll only pregnant women. However, it was not until well into Year 2 that firm, standardized criteria for enrollment were established and that both ADRA and WV began to enroll only pregnant women. The criteria are similar across ADRA and WV zones and include: priority to women in their first pregnancy so that they learn good habits that they can continue into future pregnancies; women carrying twins; pregnant women over 35; and pregnant women whose previous child had a low birth weight. Project staff estimate that at most only 20-40% of eligible pregnant women in a given community are being enrolled in the program. The fact that a minority of women benefit from the rations is a major source of conflict within communities, an issue mentioned in every FGD and KII conducted for SO2. Exacerbating the problem is the fact that many people are unaware of the criteria and do not understand why some women are enrolled and others are not. In addition, it is not clear that the criteria are generally respected. For example, during the FGDs with beneficiary women, there were few first-time mothers, no older women and only two sets of twins. In one FGD with men whose families are enrolled, five of the first six men who arrived all worked at the HC. The MoH raised other issues with the targeting process: In a given HZ only a small number of HAs are included in the ration distribution and within each HA, a minority of communities are included, usually a maximum of two. This adds to the conflict around ration distribution and puts traditional leaders and government authorities on the defensive as they are hard-pressed to explain why one community in a HA is included but not the other communities. Lack of a protection ration: The original project proposal called for a protection ration for all HHs participating in the program but USAID removed this from the program. As a result, a unanimous complaint about the ration is that it is too small. Beneficiaries make no secret of the fact that the ration is shared with other family members, deeming it culturally unacceptable for a mother to eat while her children are hungry or for parents to “favor” one child over his siblings. Beneficiaries also said they sometimes share their ration with neighbors to avoid conflict. As a result, many FGD participants estimated that the ration lasts one week or less instead of a month. Homestead food production: To improve diets for women and children and to provide a small source of potential income, the project is promoting gardening, starting with the development of seedling centers and then the creation of demonstration gardens. A small number of LMs were selected for training in how to set up and manage the seedling centers. The plan is then to train all LMs in homestead gardening with the understanding that they in turn will train the women in their respective neighborhood groups. These activities are highly appreciated by the women who benefit, many of whom are undertaking gardening for the first time. The homestead food production component also provides an opportunity for the SO1 and SO2 teams to work together. Although this is a welcome addition to the project, it appears that only a small number of the 2600+ LMs are benefiting at this time. Based on the information we were provided, it seems that less than 15% of LMs had participated in this training by the end of Year 3.21 As for setting up the demonstration gardens, WV had established 24 demonstration gardens by the end of Year 3 out of a
21 The figures we were provided in the final Year 3 DIP did not match numbers given to us by the ADRA and WV SO Coordinators.
JENGA II Mid-Term Evaluation Report 25
target of 25. ADRA, however, has not yet set up any demonstration gardens according to the latest version of the DIP, but plans to pursue this activity in Year 4. Conclusions There has been progress within this sub-IR with the rations being distributed as scheduled. As noted, however, there are also some substantial issues linked to the provision of PM2A rations:
- There are significant problems with the targeting process for this activity, given that: only 20-40% of eligible pregnant women in targeted communities benefit from rations; concrete targeting criteria were not in place until Year 2; and there is evidence that the targeting criteria that was established is not being systematically applied. As a result, a minority of eligible women and children are receiving rations, which is creating conflict within communities.
- The lack of a protection ration is also problematic, resulting in the individual ration being shared, with the negative consequences this likely has on the nutritional status of the woman or child who should be benefitting from 100% of the ration.
- Not all project communities benefit from rations, which adds to the conflict around ration distribution and puts traditional leaders and government authorities on the defensive as they are hard-pressed to explain why one community in a HA is included but not the other communities.
- The projected end date for ration distribution. According to ADRA management staff, no more food will be distributed as of January 2016. Since we were also informed that pregnant women will be enrolled as late as June 2015, this means that many mother-child dyads will not benefit from the full recommended period of rations. This information has not yet been communicated to the beneficiaries and in fact, most field project staff seemed unaware that there will be no more food distribution as of January 2016.
For the homestead food production, without a more robust roll-out of the homestead gardening activity, in which the project reaches a majority of LMs, impacts on dietary diversity during the project period are in question and beyond the life of the project are even more doubtful. It will be important to ensure that once trained in the gardening activity, the LMs have the resources, time and motivation to train the women in their neighborhood group. This will also require an investment of time from project staff.
Sub-IR2.1.2: Increased practice of key health behaviors 222 out of 222 targeted Care Groups established (100%) 2,434 out of 2,664 targeted LMs in place (91%)22 Findings It was clear during the FGDs that knowledge levels about appropriate maternal health practices are high across the board. LMs and beneficiaries alike knew what PLW should eat, the danger signs during pregnancy, the importance of antenatal consultations (ANC), and why they should sleep under a mosquito net. Women indicated that they agree with the messages and when it is within their means (e.g., ability to buy food for a diversified diet, ability to purchase a mosquito net), they practice these behaviors. In the men’s FGDs there was also good knowledge of key health behaviors for PLW as men often listen in when the LMs visit their HHs; they also hear the messages on the radio. In fact, some men asked for more in-depth training on these topics and on child health topics.
22 We were informed by project staff that there were over 2600 LMs currently active in project activities. The final Year 3 DIP that we received, however, shows a slightly lower figure of 2,434 current LMs.
JENGA II Mid-Term Evaluation Report 26
Conclusions There has been progress under this sub-IR as evidenced by visible changes in behavior in terms of PLW adopting improved practices. The improvements in knowledge brought about are largely a result of the LMs’ work, counseling at the HC, and radio messages that reinforce the key messages. Sub-IR2.1.3: Increased appropriate utilization of health services 73 out of 73 targeted health center staff trained (100%) Findings In addition to BCC, activities to encourage increased utilization of health services include: improving skills of HC personnel through training; providing support to the BCZs, especially for joint field supervision; upgrading the skills on maternal health of some members of the Health Committees (CODESAs – those trained are RECOs); and providing inputs such as iron folate and Vitamin A to the HCs for PLW. There is clear anecdotal evidence from FGDs and KIIs that PLW have dramatically increased their utilization of health services, especially for ANCs and assisted deliveries at the HCs. Some of the motivation for this is of course the desire to receive rations but it now seems to be commonly accepted that starting ANC earlier, completing four visits and delivering at the HC can result in a healthier mother and child. JENGA II is meeting its targets for number of HC personnel trained and during KIIs with nurses, they stated that the training was very useful as many of them were receiving this training for the first time. WV for example asked the personnel in each of their HZs what topics they would like training on. Minova HZ chose family planning and Kalehe HZ chose infant resuscitation, a topic that most of them had not had any real training in. Further reinforcing the MoH, both ADRA and WV provide support to the seven BCZs, especially for supervision visits, which are often conducted jointly. During the MTE, the evaluation team met with representatives from five of the seven BCZs, all of whom began the interview with a thank you to USAID and the project for facilitating their work. They also expressed their appreciation for the fact that both ADRA and WV conduct all training of health personnel, including the RECOs, in close collaboration with the MoH. Conclusions There has also been progress in Sub-IR2.1.3 as evidenced by beneficiaries using appropriate maternal health services at a higher rate. IR2.1 Recommendations For the remaining two years: 1. The ADRA Chief of Party (COP) and the WV DFAP Manager will ensure that the communities
and the MoH, including the HCs, are informed that enrollment in the ration distribution activity has ended and that food distribution will end January 2016. The two senior managers will work with their staff to devise a plan for disseminating this information in a timely and sensitive manner as the news may not always be received well by participating communities. The LMs should not be the ones to disseminate this information. The project will use a multi-pronged approach for disseminating this information, including radio, to ensure that these messages are received and understood.
2. Conduct a review of the PM2A enrollment process given concerns around the degree to which the project is adhering to targeting criteria for ration provision. The review should seek to understand the level of compliance with PM2A targeting criteria and procedures and to recommend corrective measures as needed.
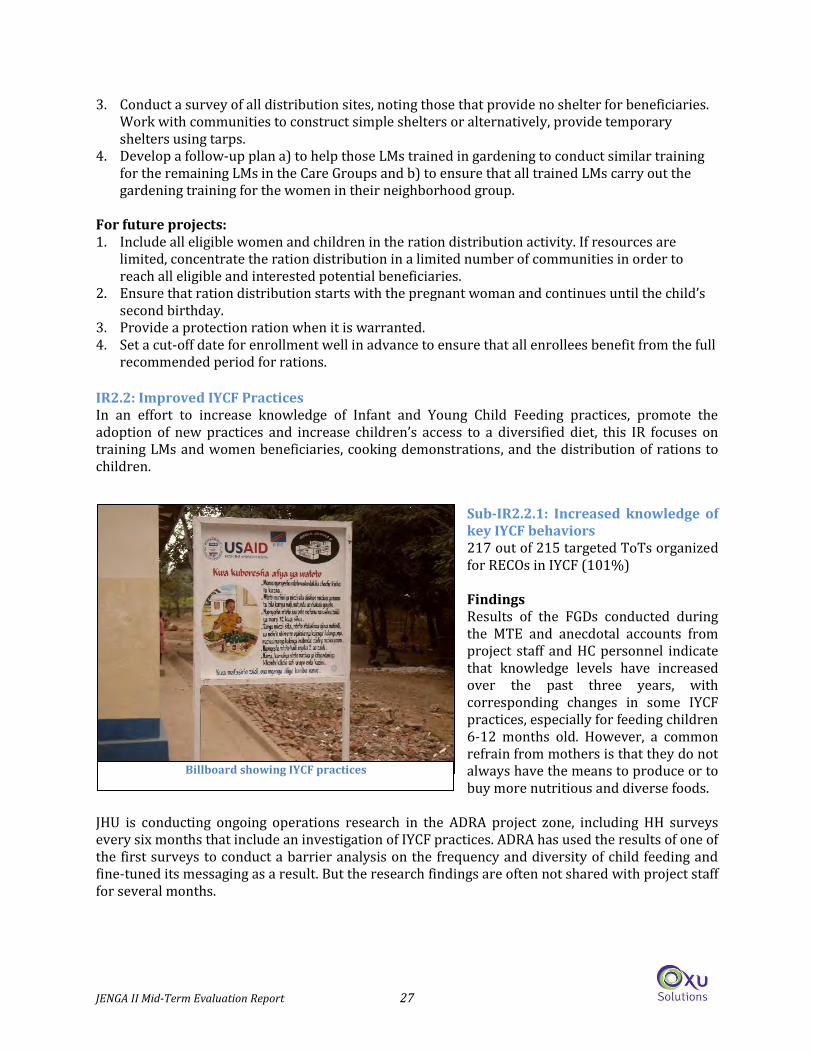
JENGA II Mid-Term Evaluation Report 27
3. Conduct a survey of all distribution sites, noting those that provide no shelter for beneficiaries. Work with communities to construct simple shelters or alternatively, provide temporary shelters using tarps.
4. Develop a follow-up plan a) to help those LMs trained in gardening to conduct similar training for the remaining LMs in the Care Groups and b) to ensure that all trained LMs carry out the gardening training for the women in their neighborhood group.
For future projects: 1. Include all eligible women and children in the ration distribution activity. If resources are
limited, concentrate the ration distribution in a limited number of communities in order to reach all eligible and interested potential beneficiaries.
2. Ensure that ration distribution starts with the pregnant woman and continues until the child’s second birthday.
3. Provide a protection ration when it is warranted. 4. Set a cut-off date for enrollment well in advance to ensure that all enrollees benefit from the full
recommended period for rations. IR2.2: Improved IYCF Practices In an effort to increase knowledge of Infant and Young Child Feeding practices, promote the adoption of new practices and increase children’s access to a diversified diet, this IR focuses on training LMs and women beneficiaries, cooking demonstrations, and the distribution of rations to children.
Sub-IR2.2.1: Increased knowledge of key IYCF behaviors 217 out of 215 targeted ToTs organized for RECOs in IYCF (101%) Findings Results of the FGDs conducted during the MTE and anecdotal accounts from project staff and HC personnel indicate that knowledge levels have increased over the past three years, with corresponding changes in some IYCF practices, especially for feeding children 6-12 months old. However, a common refrain from mothers is that they do not always have the means to produce or to buy more nutritious and diverse foods.
JHU is conducting ongoing operations research in the ADRA project zone, including HH surveys every six months that include an investigation of IYCF practices. ADRA has used the results of one of the first surveys to conduct a barrier analysis on the frequency and diversity of child feeding and fine-tuned its messaging as a result. But the research findings are often not shared with project staff for several months.
Billboard showing IYCF practices
JENGA II Mid-Term Evaluation Report 28
Conclusions Measurable progress has been made towards achieving this sub-IR. For example, when asked what they learned about IYCF and what they are putting into practice, women beneficiaries were able to describe an ideal diet complete with the type of foods by age group. However, they noted that they were not always able to follow these guidelines due to an inability to buy or produce different foods so access is a limitation. Continued adjustments to the IYCF messages are also needed, including how to overcome barriers to improved feeding practices. Sub-IR2.2.2: Increased access to a diversified diet 16,040 CU2 out of 17,660 targeted CU2 by end of Year 3 (91%) 347 out of 1763 targeted cooking demonstrations held (20%) Findings The principal activities for increasing access to a diversified diet for young children are distribution of rations for children 6-23 months of age; training in IYCF for LMs, RECOs and mothers of young children; and cooking demonstrations on preparing nutritious meals and snacks for children. (Note: for comments and recommendations regarding ration distribution, see IR 2.1.) Training in IYCF for the three main groups is proceeding as planned; to date 238 RECOs and 2,356 LMs have been trained. The LMs in turn have worked with 21,934 women to promote better feeding practices, especially for children 6-23 months. Both ADRA and WV are behind on meeting the midterm targets for cooking demonstrations with only 347 out of 1763 demonstrations conducted as of the end of June 2014. WV stated that they were waiting because they want to use the produce from the demonstration gardens in the cooking demonstrations; both WV and ADRA plan a concerted effort to conduct this activity in Year 4. Conclusions Greater effort is needed to promote the planned cooking demonstrations: one issue that needs to be resolved is who will provide the ingredients both for showing the LMs how to conduct demonstrations and for the follow-on demonstrations that the LMs will organize for the women they train. Traditional practice has been to ask participating women to bring ingredients but given that the LMs are already discouraged by the lack of incentives from the project, it is unlikely that they will agree to bring ingredients either for their own training or for the follow-on demonstrations for the women in their neighborhood. IR2.2 Recommendations 1. Provide adequate resources to LMs for conducting nutrition demonstrations for the women
they train. 2. Request that the JHU operations research team provide updates on their findings within 2-3
months of each survey and use these findings for adjusting the BCC messages. Even though project zones are different, share the findings with the WV team.
IR2.3: Improved management of childhood illnesses This IR includes two major components: increasing appropriate utilization of child health services and WASH activities. Progress has been made in both components, but achievements for some of the WASH activities lag behind the midterm targets. Sub-IR2.3.1: Increased appropriate utilization of health services 152 out of 162 targeted HC personnel trained in IMCI (94%) 263 out of 290 targeted RECOs trained in IMCI (91%)
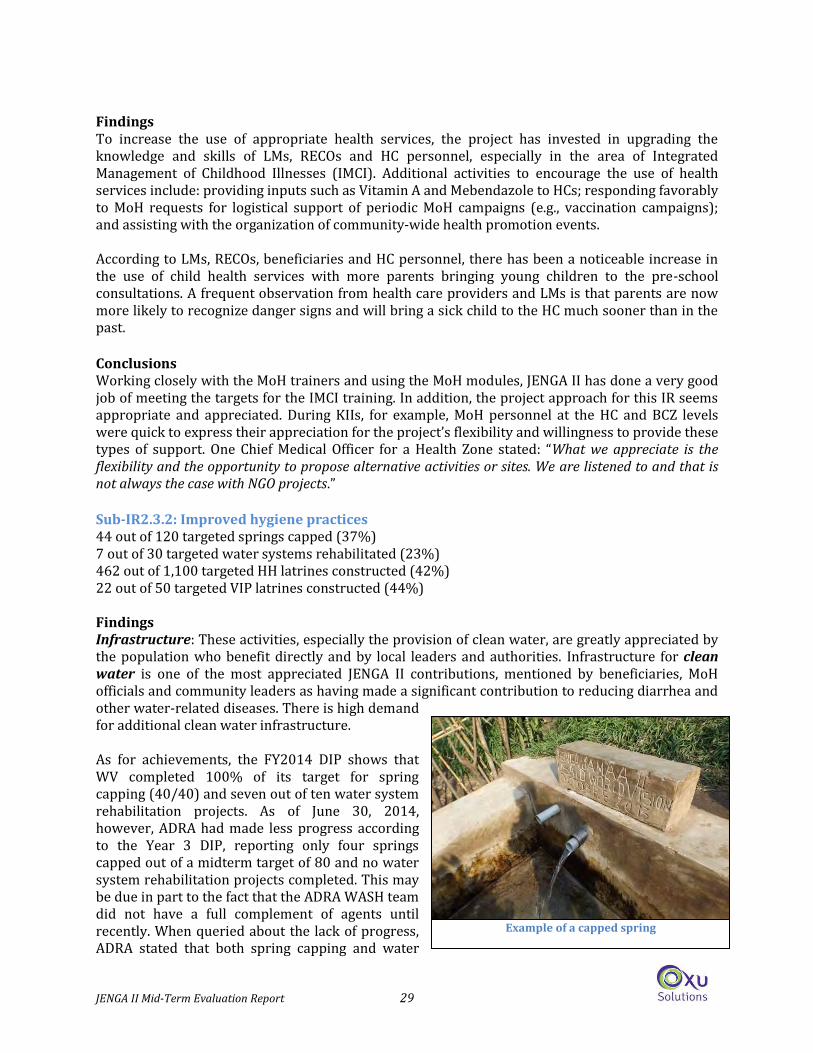
JENGA II Mid-Term Evaluation Report 29
Findings To increase the use of appropriate health services, the project has invested in upgrading the knowledge and skills of LMs, RECOs and HC personnel, especially in the area of Integrated Management of Childhood Illnesses (IMCI). Additional activities to encourage the use of health services include: providing inputs such as Vitamin A and Mebendazole to HCs; responding favorably to MoH requests for logistical support of periodic MoH campaigns (e.g., vaccination campaigns); and assisting with the organization of community-wide health promotion events. According to LMs, RECOs, beneficiaries and HC personnel, there has been a noticeable increase in the use of child health services with more parents bringing young children to the pre-school consultations. A frequent observation from health care providers and LMs is that parents are now more likely to recognize danger signs and will bring a sick child to the HC much sooner than in the past.
Conclusions Working closely with the MoH trainers and using the MoH modules, JENGA II has done a very good job of meeting the targets for the IMCI training. In addition, the project approach for this IR seems appropriate and appreciated. During KIIs, for example, MoH personnel at the HC and BCZ levels were quick to express their appreciation for the project’s flexibility and willingness to provide these types of support. One Chief Medical Officer for a Health Zone stated: “What we appreciate is the flexibility and the opportunity to propose alternative activities or sites. We are listened to and that is not always the case with NGO projects.”
Sub-IR2.3.2: Improved hygiene practices 44 out of 120 targeted springs capped (37%) 7 out of 30 targeted water systems rehabilitated (23%) 462 out of 1,100 targeted HH latrines constructed (42%) 22 out of 50 targeted VIP latrines constructed (44%) Findings Infrastructure: These activities, especially the provision of clean water, are greatly appreciated by the population who benefit directly and by local leaders and authorities. Infrastructure for clean water is one of the most appreciated JENGA II contributions, mentioned by beneficiaries, MoH officials and community leaders as having made a significant contribution to reducing diarrhea and other water-related diseases. There is high demand for additional clean water infrastructure. As for achievements, the FY2014 DIP shows that WV completed 100% of its target for spring capping (40/40) and seven out of ten water system rehabilitation projects. As of June 30, 2014, however, ADRA had made less progress according to the Year 3 DIP, reporting only four springs capped out of a midterm target of 80 and no water system rehabilitation projects completed. This may be due in part to the fact that the ADRA WASH team did not have a full complement of agents until recently. When queried about the lack of progress, ADRA stated that both spring capping and water
Example of a capped spring
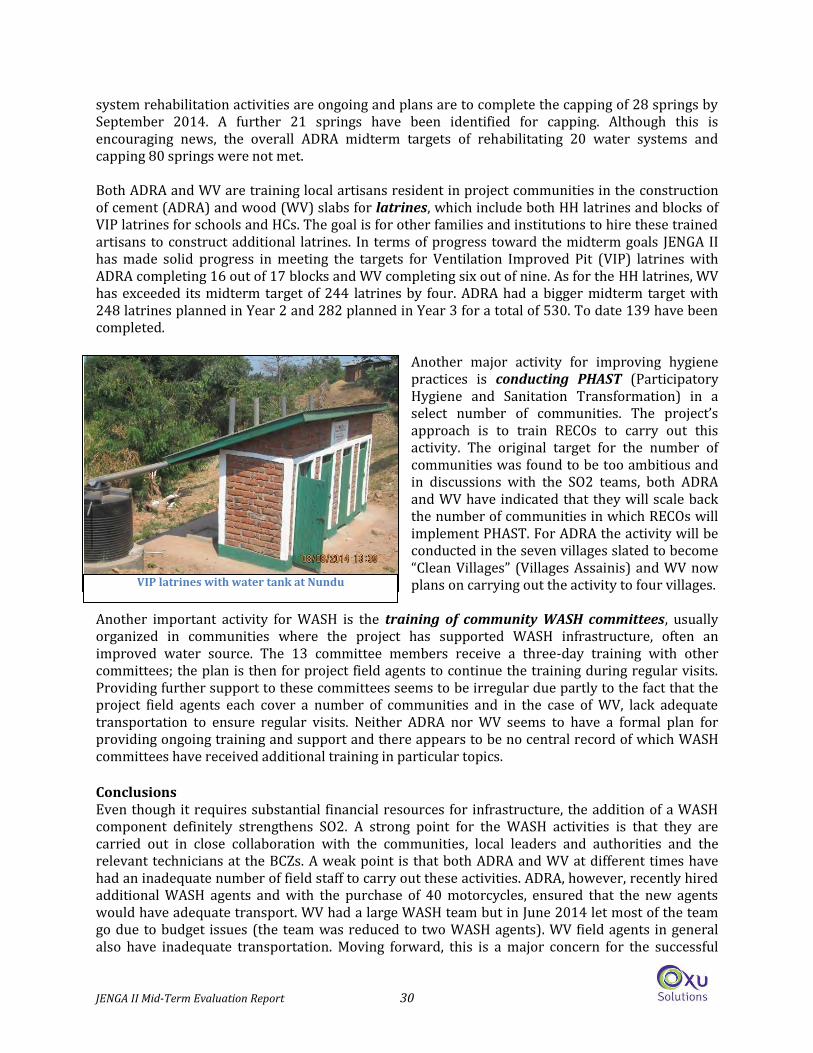
JENGA II Mid-Term Evaluation Report 30
system rehabilitation activities are ongoing and plans are to complete the capping of 28 springs by September 2014. A further 21 springs have been identified for capping. Although this is encouraging news, the overall ADRA midterm targets of rehabilitating 20 water systems and capping 80 springs were not met. Both ADRA and WV are training local artisans resident in project communities in the construction of cement (ADRA) and wood (WV) slabs for latrines, which include both HH latrines and blocks of VIP latrines for schools and HCs. The goal is for other families and institutions to hire these trained artisans to construct additional latrines. In terms of progress toward the midterm goals JENGA II has made solid progress in meeting the targets for Ventilation Improved Pit (VIP) latrines with ADRA completing 16 out of 17 blocks and WV completing six out of nine. As for the HH latrines, WV has exceeded its midterm target of 244 latrines by four. ADRA had a bigger midterm target with 248 latrines planned in Year 2 and 282 planned in Year 3 for a total of 530. To date 139 have been completed.
Another major activity for improving hygiene practices is conducting PHAST (Participatory Hygiene and Sanitation Transformation) in a select number of communities. The project’s approach is to train RECOs to carry out this activity. The original target for the number of communities was found to be too ambitious and in discussions with the SO2 teams, both ADRA and WV have indicated that they will scale back the number of communities in which RECOs will implement PHAST. For ADRA the activity will be conducted in the seven villages slated to become “Clean Villages” (Villages Assainis) and WV now plans on carrying out the activity to four villages.
Another important activity for WASH is the training of community WASH committees, usually organized in communities where the project has supported WASH infrastructure, often an improved water source. The 13 committee members receive a three-day training with other committees; the plan is then for project field agents to continue the training during regular visits. Providing further support to these committees seems to be irregular due partly to the fact that the project field agents each cover a number of communities and in the case of WV, lack adequate transportation to ensure regular visits. Neither ADRA nor WV seems to have a formal plan for providing ongoing training and support and there appears to be no central record of which WASH committees have received additional training in particular topics. Conclusions Even though it requires substantial financial resources for infrastructure, the addition of a WASH component definitely strengthens SO2. A strong point for the WASH activities is that they are carried out in close collaboration with the communities, local leaders and authorities and the relevant technicians at the BCZs. A weak point is that both ADRA and WV at different times have had an inadequate number of field staff to carry out these activities. ADRA, however, recently hired additional WASH agents and with the purchase of 40 motorcycles, ensured that the new agents would have adequate transport. WV had a large WASH team but in June 2014 let most of the team go due to budget issues (the team was reduced to two WASH agents). WV field agents in general also have inadequate transportation. Moving forward, this is a major concern for the successful
VIP latrines with water tank at Nundu
JENGA II Mid-Term Evaluation Report 31
completion of the WASH activities in the WV project areas. Although WV plans to recruit two more WASH agents, it is unlikely that even a team of four will be able to carry out the planned WV WASH program with any degree of quality given the scope of planned activities. For the PHAST interventions, neither ADRA nor WV should underestimate the effort and resources required to conduct these activities well, even in a small number of communities. The PHAST model consists of a number of steps over an extended period of time, starting with a baseline study and culminating with an endline survey. The “Clean Village” initiative also involves investments in clean water and latrines as well as other less expensive infrastructure. Both activities require a dedicated commitment from those implementing it. Given that the RECOs are volunteers and are also called upon to work during MoH campaigns and for other NGOs, both ADRA and WV should develop a detailed plan for providing adequate human and financial resources to support the RECOs in this work, including a budget for work-related incentives and for refresher training. IR2.3 Recommendations 1. For WV: Expand the current two-member WASH team to a team of adequate size to successfully
carry out the remaining activities. 2. For the PHAST activity:
a. For the project staff who will be providing support to the RECOs: Ensure that they have the necessary training themselves in order to better support the RECOs.
b. Develop a detailed plan for staff to provide additional support and guidance to the RECOs who will be conducting PHAST.
c. Provide adequate BCC materials such as portable flip charts to the RECOs. d. Provide additional incentives to the RECOs conducting PHAST: badges, T-shirts, public
recognition, etc. e. Organize cross-visits for RECOs to communities that have successfully conducted PHAST or
the “Clean Village” initiative. f. Provide additional resources to the BCZs, specifically for the Water and Hygiene
Supervisors, to ensure that the Clean Village guidelines are followed in each target village. 3. For WASH committees:
a. Develop a curriculum for the continuing training of WASH committees, including the priority themes to supplement the three-day project-sponsored training.
b. Maintain a table showing the ongoing training received by each committee; include the theme, the date and the name of the project agent who conducted the training.
c. Organize exchange visits between WASH committees that have shown good performance and/or innovative activities in their communities.
d. Provide adequate BCC materials for each committee and training in how to use them. At a minimum each committee should have at least one portable flipchart with the key WASH messages.
e. Ensure that there are sufficient project field agents so that each WASH committee benefits from regular quality support and training visits.
f. Ensure that WASH committees understand their roles for after the project has concluded and that they have what is needed (materials, knowledge, support, etc.) to continue their work post-project.
Additional SO2-related Findings and Recommendations Integration: A glaring flaw in project implementation is the fact that SO2 is not present in all communities, especially in many communities with SO1 activities. This lack of integration means that the benefits of PM2A and/or WASH are not being realized throughout the project.
JENGA II Mid-Term Evaluation Report 32
For future projects: 1. To maximize project impact, include health/nutrition/WASH activities in all targeted
communities. Another aspect of integration is the fact that improving health and nutritional status for women and young children cannot be achieved solely through the SO2 activities. Increasing access to food (quantity and diversity) depends also on SO1, especially the agricultural production component, and on having adequate income to 1) purchase more and better food and 2) to pay health care fees. It is true that SO3 helps to generate income through Income Generating Activities (IGAs) and the savings and credit associations but most of the SO2 HHs are not benefitting from the SO3 activities as it is most often another group of women selected to participate in SO3. For future projects: 1. To increase the possibility for improved health and nutritional status of women and young
children, aim for a more integrated approach in which SO2 HHs also benefit more directly from improving agricultural production and increasing their income.
Operations Research: The JHU team is only conducting research in the ADRA project zone. Since JHU is considered one of the three JENGA II partners, the benefits of their participation should have been extended to the WV project zone as well or somehow shared between the two respective zones of the two organizations (e.g., selecting Kalehe and either Uvira or Fizi since Uvira and Fizi are more similar to each other than to Kalehe). While we understand there are logistical constraints in terms of the distances between ADRA and WV areas, such constraints could have been taken into consideration when developing the budget and scope of work for the Operations Research, as the socio-cultural differences between the areas might have added value to the research. For future projects: 1. Ensure that the expertise and contributions of implementing partners benefit all partners in the
consortium. Motivating the LMs: Going forward, the major challenge to achieving the desired results for SO2 across the IRs is how to motivate the LMs to continue with the same level of enthusiasm and effectiveness they demonstrated during the first two years of JENGA II. Without their ongoing commitment, it will be difficult to sustain all the positive effects achieved to date and to attain the remaining targets. The principal issue concerns project-provided incentives. The LMs devote more hours to volunteer work than any other project volunteers yet they receive few incentives. This is in stark contrast to other volunteers who may receive cash (community literacy volunteers) or food (nursery workers). The fact that they receive few incentives creates problems with their husbands who complain that the LMs are neglecting their own domestic duties and receiving nothing. The lack of incentives also lowers their “value” in the eyes of some community members. As one LM put it: “I receive nothing for my efforts. If I make a home visit to a woman who receives [PM2A] rations, she will say: I don’t need you; I get rations and you don’t.” These issues also highlight the lack of an exit or sustainability plan, as the continuing motivation of LMs after the project in a sustainable way should have been part of the initial project design. The following recommendations will require an investment of human and financial resources. (See Annex O for estimated costs for providing incentives to LMs). For the remaining two years: 1. Have project staff meet with groups of husbands of LMs to secure their support for their wives’
activities.
JENGA II Mid-Term Evaluation Report 33
2. Organize interested Care Groups into Savings Groups following the WEG model. (Note: WV is already considering this activity, which has proven useful for reinforcing group cohesion and sustainability in other projects with Care Groups.)
3. Organize public recognition ceremonies at churches and in the community. At a minimum, publicly award certificates of recognition to the LMs.
4. Provide LMs with plastic-encased badges and other signs of “visibility” such as clothing (T-shirts already provided by ADRA and ordered by WV), head scarves, etc.
5. Include more LMs in periodic meetings and training events (rather than selecting just a few LMs per Care Group.)
6. Periodically provide work-related materials such as umbrellas, other rain gear, small waterproof bags for carrying flipcharts and documents, etc.
7. Design and distribute cloth with health messages and project logos. 8. Organize exchange visits for high-performing Care Groups. For future projects: 1. Meet with husbands of prospective LMs to ensure their full commitment and support. (Some
projects ask husbands for a written commitment prior to officially recognizing LMs.) 2. Provide an adequate budget for periodic work-related incentives to encourage LMs. 3. Ensure that all LMs benefit from all training events, including not only those held in their
community but more formal trainings at central locations. 4. Organize LMs around an activity that will continue to benefit them post-project. Examples
include IGAs, savings and credit schemes or literacy classes.
Following up on training: Due to resource constraints, the project has chosen to use cascade training for improving the knowledge and skills of RECOs and for some ongoing training of LMs in areas such as gardening. The assumption is that those selected will return to their groups and conduct training for their peers but there seems to be no consistent follow-up to ensure that the cascade training is taking place. Along the same lines, the project has made a considerable investment in training health center staff and RECOs during formal training events but there is little evidence that the “classroom” training is reinforced at the HC (for MoH personnel) and community level (for RECOs)other than through quarterly BCZ supervision visits. Both types of training are highly appreciated by the participants and by the MoH but need to be reinforced. For the remaining two years: 1. Develop and carry out a follow-up plan for each training conducted. This includes previous
training such as the gardening training for LMs; the training for WASH committees; and the PHAST training for RECOs.
2. Increase the support to the seven BCZs for joint supervisions so that those MoH personnel trained through the project can receive additional on-the-job training to reinforce the skills learned during the formal training events.
Financial issues for WV: WV is currently facing some budget issues that are having a negative impact on SO2 project activities: the recent downsizing of the WASH team; the lack of adequate transportation, especially for the field agents; insufficient budget to provide minimum incentives for LMs; inability to conduct even small-scale studies to gauge effectiveness of BCC activities, etc. Initial recommendations related to WV budgeting issues are provided below in Section IV.c, in the Operations/ Financial Management sub-section. DIP and IPTT: Both the DIP and the IPPT are somewhat out of date. Some activities will not be carried out during the LOA and certain targets need to be revised. The MTE is the ideal time to present these revisions to USAID for approval.
JENGA II Mid-Term Evaluation Report 34
Now: 1. Update the SO2 sections of the DIP and IPPT and prepare a thorough justification for proposed
changes for USAID review.
Motivating field agents: LMs are not the only project actors who could benefit from additional motivation. The dedicated ADRA and WV field agents are also good candidates. For the remaining two years: 1. Organize exchange visits for project field agents: from ADRA to WV zones and vice versa; to
similar projects in the region; and/or to projects in neighboring countries. Prioritize visits to those projects that have overcome some of the same obstacles facing JENGA II (e.g., motivation of community volunteers) and/or projects that have begun to implement their sustainability and exit plans.
Strategic Objective 3: Increased women’s socio-economic empowerment in food insecure communities Summary of SO3 progress The two organizations have used different approaches for the implementation SO3 as ADRA is doing direct implementation and WV is implementing through three local partners. While each approach has advantages and disadvantages, the MTE team did not observe any significant differences in terms of project results. Many of the activities that lead to the three SO3 IRs are intertwined and complementary, but the underlying logic for how the sub-IRs contribute to fulfillment of the IRs and how the IRs lead to achievement of the SO is not very clear. For example, for IR3.1 the project did not define precisely the HH resources over which women’s control would be increased. Increase in control of resources could be limited to resources brought to the HH by the project – the IGAs, the rotating goat scheme, or the savings and credit activities – or it could more broadly include other critical resources owned by the HH such as land, the house, or money made from sales of agricultural production. In addition, on their own the activities carried out under IR3.1 will not necessarily increase women’s control over HH resources. Some of the activities under IR3.2 and IR3.3 are also needed to fulfill IR3.1: the IR3.2 gender-awareness activities implemented are designed to help women understand the need for equality between men and women in terms of making decisions on the use of HH assets, and literacy activities in IR3.3 give women concrete skills to offer within the HH. While the logic for the design does not seem to fit tightly together, the MTE team did find a number of positive achievements from SO3. Indeed, the project appears to have had a very positive impact on women and gender relations in targeted communities, as well as broadening livelihood options which are important for food security; these are the strongest outcomes the evaluation team observed of the project to date. However, this SO has been under-budgeted compared to the number of activities and beneficiaries targeted, resulting in staff and partners feeling overwhelmed and expected impact being lessened. In general SO3 has made good progress in moving toward achieving its LOA targets and activities are appreciated by women and men, including local leaders. There was a sequence in starting activities under each IR, with some activities starting in Year 1 (e.g. the distribution of goats under IR 3.1.; the development and broadcast of radio shows on GBV and installation of listening committees under IR3.2; and literacy classes for women, under IR 3.3). During Year 2, for IR3.1 the savings and credit activity and most non-agricultural IGAs were begun, including provision of
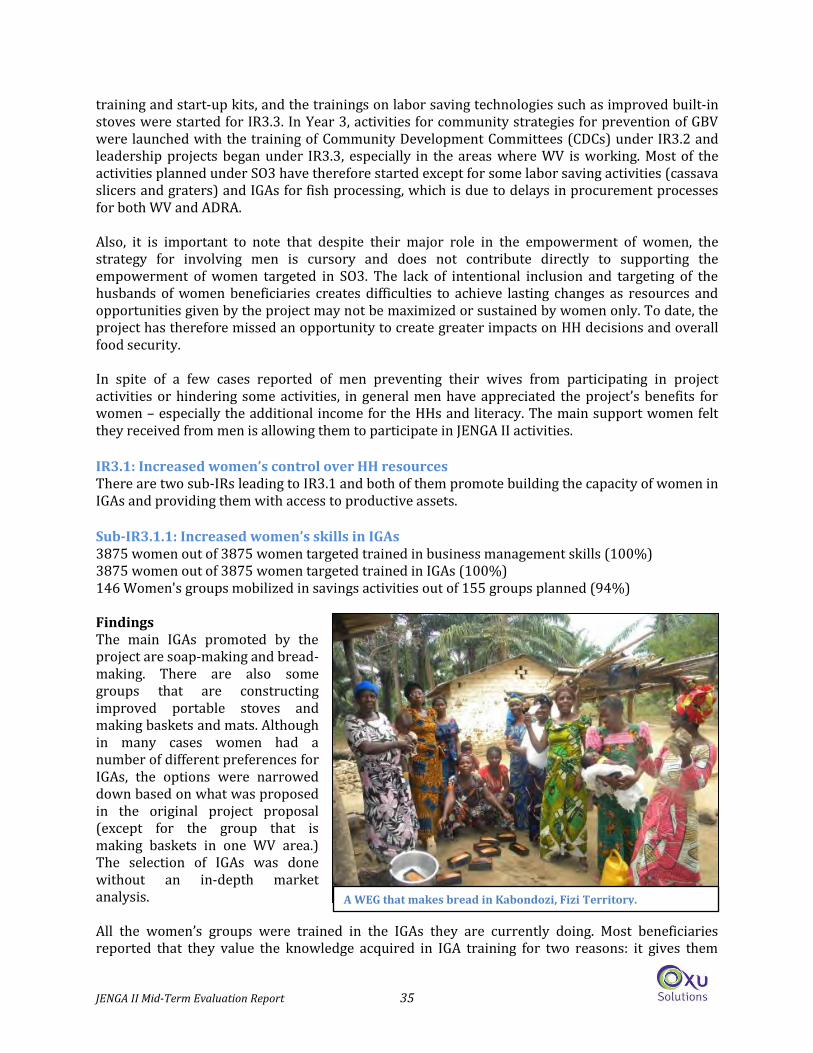
JENGA II Mid-Term Evaluation Report 35
training and start-up kits, and the trainings on labor saving technologies such as improved built-in stoves were started for IR3.3. In Year 3, activities for community strategies for prevention of GBV were launched with the training of Community Development Committees (CDCs) under IR3.2 and leadership projects began under IR3.3, especially in the areas where WV is working. Most of the activities planned under SO3 have therefore started except for some labor saving activities (cassava slicers and graters) and IGAs for fish processing, which is due to delays in procurement processes for both WV and ADRA. Also, it is important to note that despite their major role in the empowerment of women, the strategy for involving men is cursory and does not contribute directly to supporting the empowerment of women targeted in SO3. The lack of intentional inclusion and targeting of the husbands of women beneficiaries creates difficulties to achieve lasting changes as resources and opportunities given by the project may not be maximized or sustained by women only. To date, the project has therefore missed an opportunity to create greater impacts on HH decisions and overall food security. In spite of a few cases reported of men preventing their wives from participating in project activities or hindering some activities, in general men have appreciated the project’s benefits for women – especially the additional income for the HHs and literacy. The main support women felt they received from men is allowing them to participate in JENGA II activities. IR3.1: Increased women’s control over HH resources There are two sub-IRs leading to IR3.1 and both of them promote building the capacity of women in IGAs and providing them with access to productive assets. Sub-IR3.1.1: Increased women’s skills in IGAs 3875 women out of 3875 women targeted trained in business management skills (100%) 3875 women out of 3875 women targeted trained in IGAs (100%) 146 Women's groups mobilized in savings activities out of 155 groups planned (94%) Findings The main IGAs promoted by the project are soap-making and bread-making. There are also some groups that are constructing improved portable stoves and making baskets and mats. Although in many cases women had a number of different preferences for IGAs, the options were narrowed down based on what was proposed in the original project proposal (except for the group that is making baskets in one WV area.) The selection of IGAs was done without an in-depth market analysis. All the women’s groups were trained in the IGAs they are currently doing. Most beneficiaries reported that they value the knowledge acquired in IGA training for two reasons: it gives them
A WEG that makes bread in Kabondozi, Fizi Territory.
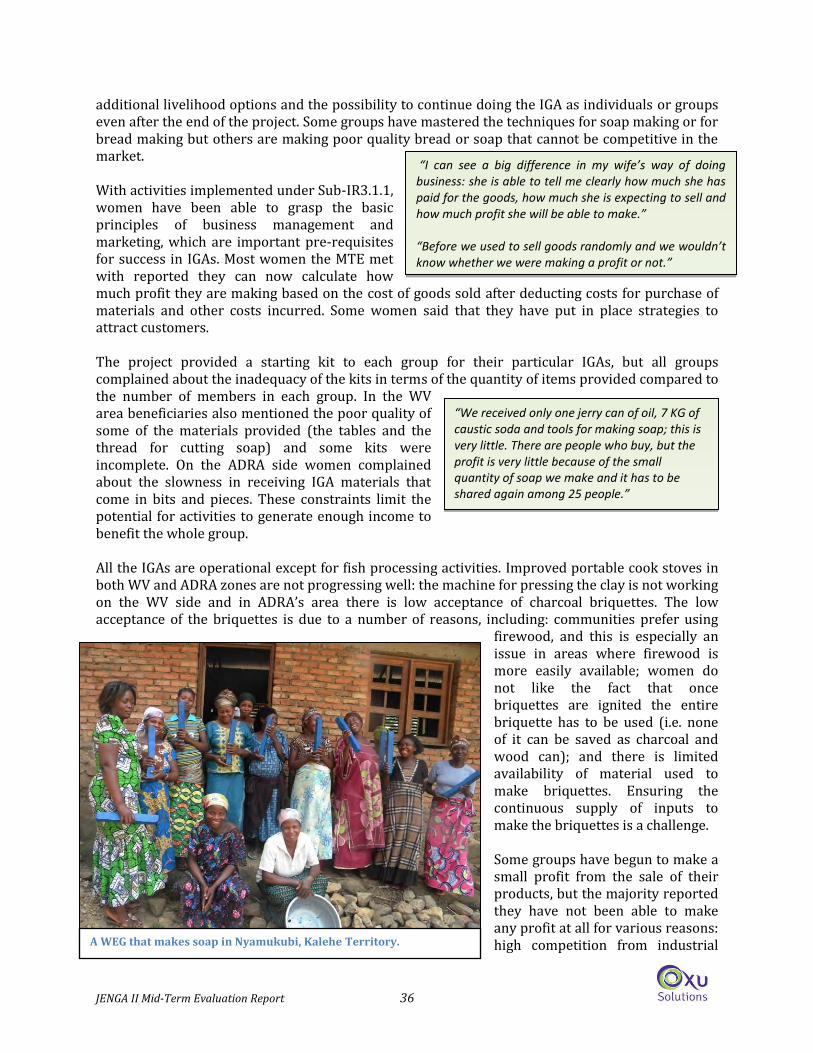
JENGA II Mid-Term Evaluation Report 36
“We received only one jerry can of oil, 7 KG of caustic soda and tools for making soap; this is very little. There are people who buy, but the profit is very little because of the small quantity of soap we make and it has to be shared again among 25 people.”
“I can see a big difference in my wife’s way of doing business: she is able to tell me clearly how much she has paid for the goods, how much she is expecting to sell and how much profit she will be able to make.” “Before we used to sell goods randomly and we wouldn’t know whether we were making a profit or not.”
additional livelihood options and the possibility to continue doing the IGA as individuals or groups even after the end of the project. Some groups have mastered the techniques for soap making or for bread making but others are making poor quality bread or soap that cannot be competitive in the market. With activities implemented under Sub-IR3.1.1, women have been able to grasp the basic principles of business management and marketing, which are important pre-requisites for success in IGAs. Most women the MTE met with reported they can now calculate how much profit they are making based on the cost of goods sold after deducting costs for purchase of materials and other costs incurred. Some women said that they have put in place strategies to attract customers. The project provided a starting kit to each group for their particular IGAs, but all groups complained about the inadequacy of the kits in terms of the quantity of items provided compared to the number of members in each group. In the WV area beneficiaries also mentioned the poor quality of some of the materials provided (the tables and the thread for cutting soap) and some kits were incomplete. On the ADRA side women complained about the slowness in receiving IGA materials that come in bits and pieces. These constraints limit the potential for activities to generate enough income to benefit the whole group. All the IGAs are operational except for fish processing activities. Improved portable cook stoves in both WV and ADRA zones are not progressing well: the machine for pressing the clay is not working on the WV side and in ADRA’s area there is low acceptance of charcoal briquettes. The low acceptance of the briquettes is due to a number of reasons, including: communities prefer using
firewood, and this is especially an issue in areas where firewood is more easily available; women do not like the fact that once briquettes are ignited the entire briquette has to be used (i.e. none of it can be saved as charcoal and wood can); and there is limited availability of material used to make briquettes. Ensuring the continuous supply of inputs to make the briquettes is a challenge. Some groups have begun to make a small profit from the sale of their products, but the majority reported they have not been able to make any profit at all for various reasons: high competition from industrial A WEG that makes soap in Nyamukubi, Kalehe Territory.
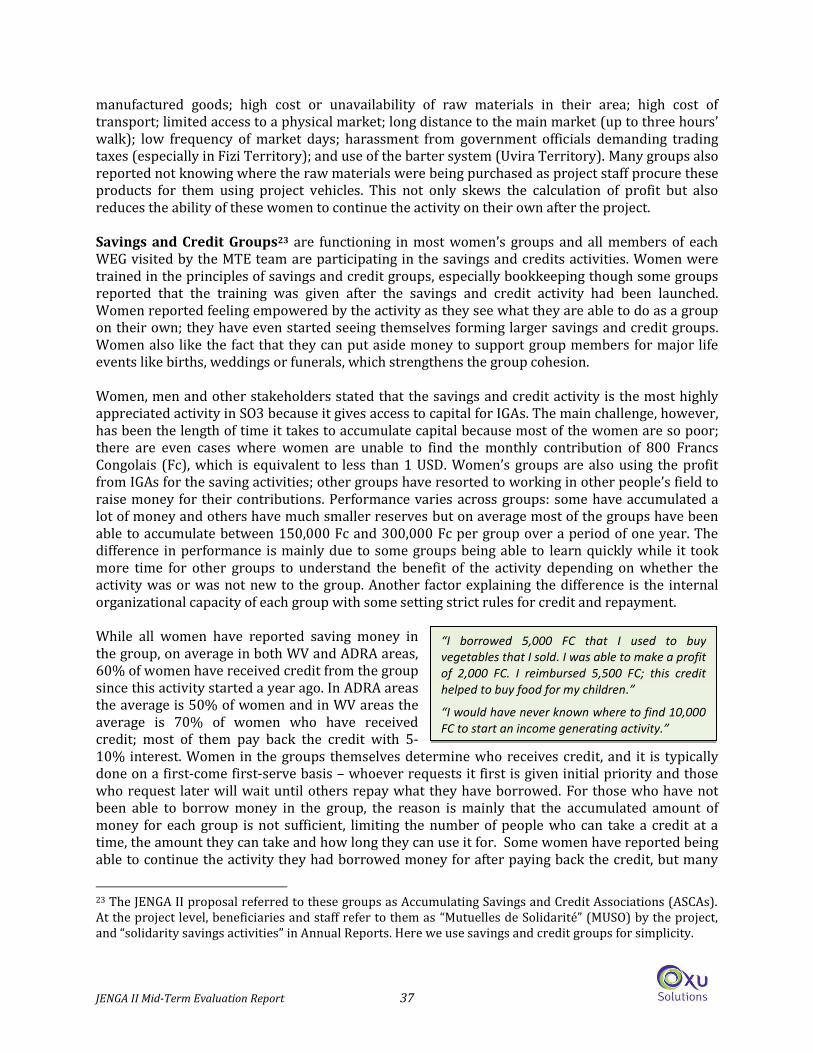
JENGA II Mid-Term Evaluation Report 37
“I borrowed 5,000 FC that I used to buy vegetables that I sold. I was able to make a profit of 2,000 FC. I reimbursed 5,500 FC; this credit helped to buy food for my children.”
“I would have never known where to find 10,000 FC to start an income generating activity.”
manufactured goods; high cost or unavailability of raw materials in their area; high cost of transport; limited access to a physical market; long distance to the main market (up to three hours’ walk); low frequency of market days; harassment from government officials demanding trading taxes (especially in Fizi Territory); and use of the barter system (Uvira Territory). Many groups also reported not knowing where the raw materials were being purchased as project staff procure these products for them using project vehicles. This not only skews the calculation of profit but also reduces the ability of these women to continue the activity on their own after the project. Savings and Credit Groups23 are functioning in most women’s groups and all members of each WEG visited by the MTE team are participating in the savings and credits activities. Women were trained in the principles of savings and credit groups, especially bookkeeping though some groups reported that the training was given after the savings and credit activity had been launched. Women reported feeling empowered by the activity as they see what they are able to do as a group on their own; they have even started seeing themselves forming larger savings and credit groups. Women also like the fact that they can put aside money to support group members for major life events like births, weddings or funerals, which strengthens the group cohesion. Women, men and other stakeholders stated that the savings and credit activity is the most highly appreciated activity in SO3 because it gives access to capital for IGAs. The main challenge, however, has been the length of time it takes to accumulate capital because most of the women are so poor; there are even cases where women are unable to find the monthly contribution of 800 Francs Congolais (Fc), which is equivalent to less than 1 USD. Women’s groups are also using the profit from IGAs for the saving activities; other groups have resorted to working in other people’s field to raise money for their contributions. Performance varies across groups: some have accumulated a lot of money and others have much smaller reserves but on average most of the groups have been able to accumulate between 150,000 Fc and 300,000 Fc per group over a period of one year. The difference in performance is mainly due to some groups being able to learn quickly while it took more time for other groups to understand the benefit of the activity depending on whether the activity was or was not new to the group. Another factor explaining the difference is the internal organizational capacity of each group with some setting strict rules for credit and repayment. While all women have reported saving money in the group, on average in both WV and ADRA areas, 60% of women have received credit from the group since this activity started a year ago. In ADRA areas the average is 50% of women and in WV areas the average is 70% of women who have received credit; most of them pay back the credit with 5-10% interest. Women in the groups themselves determine who receives credit, and it is typically done on a first-come first-serve basis – whoever requests it first is given initial priority and those who request later will wait until others repay what they have borrowed. For those who have not been able to borrow money in the group, the reason is mainly that the accumulated amount of money for each group is not sufficient, limiting the number of people who can take a credit at a time, the amount they can take and how long they can use it for. Some women have reported being able to continue the activity they had borrowed money for after paying back the credit, but many
23 The JENGA II proposal referred to these groups as Accumulating Savings and Credit Associations (ASCAs). At the project level, beneficiaries and staff refer to them as “Mutuelles de Solidarité” (MUSO) by the project, and “solidarity savings activities” in Annual Reports. Here we use savings and credit groups for simplicity.
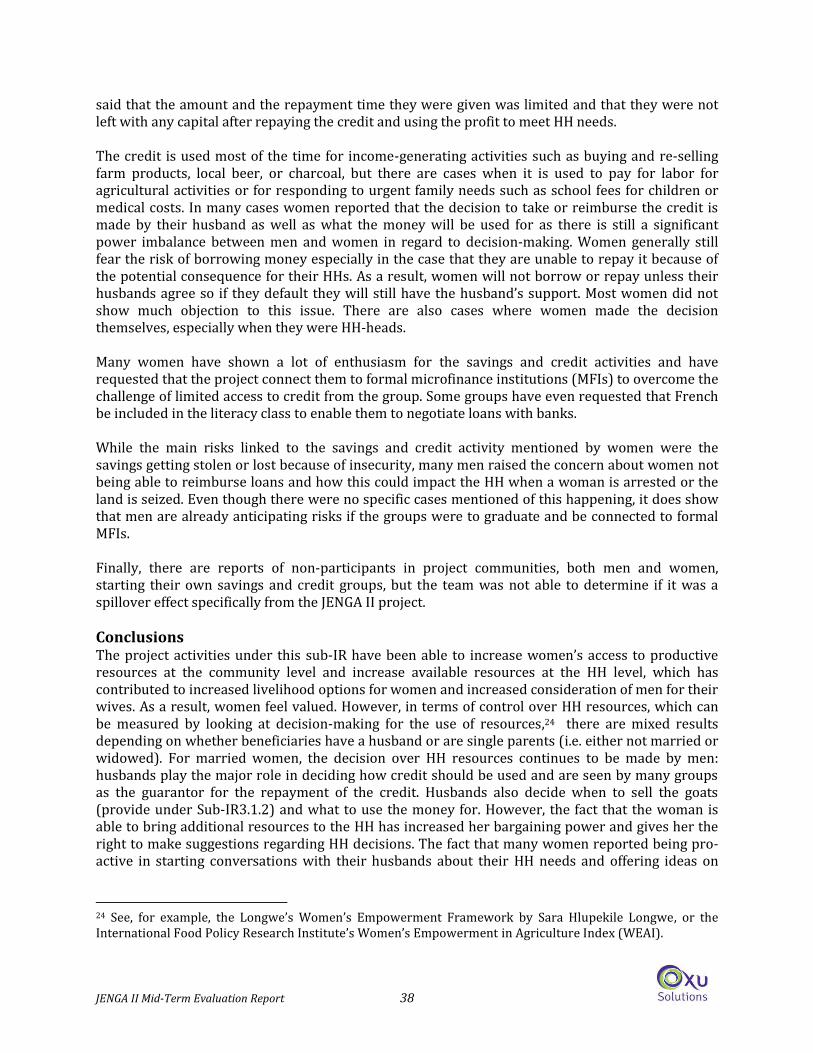
JENGA II Mid-Term Evaluation Report 38
said that the amount and the repayment time they were given was limited and that they were not left with any capital after repaying the credit and using the profit to meet HH needs. The credit is used most of the time for income-generating activities such as buying and re-selling farm products, local beer, or charcoal, but there are cases when it is used to pay for labor for agricultural activities or for responding to urgent family needs such as school fees for children or medical costs. In many cases women reported that the decision to take or reimburse the credit is made by their husband as well as what the money will be used for as there is still a significant power imbalance between men and women in regard to decision-making. Women generally still fear the risk of borrowing money especially in the case that they are unable to repay it because of the potential consequence for their HHs. As a result, women will not borrow or repay unless their husbands agree so if they default they will still have the husband’s support. Most women did not show much objection to this issue. There are also cases where women made the decision themselves, especially when they were HH-heads. Many women have shown a lot of enthusiasm for the savings and credit activities and have requested that the project connect them to formal microfinance institutions (MFIs) to overcome the challenge of limited access to credit from the group. Some groups have even requested that French be included in the literacy class to enable them to negotiate loans with banks. While the main risks linked to the savings and credit activity mentioned by women were the savings getting stolen or lost because of insecurity, many men raised the concern about women not being able to reimburse loans and how this could impact the HH when a woman is arrested or the land is seized. Even though there were no specific cases mentioned of this happening, it does show that men are already anticipating risks if the groups were to graduate and be connected to formal MFIs. Finally, there are reports of non-participants in project communities, both men and women, starting their own savings and credit groups, but the team was not able to determine if it was a spillover effect specifically from the JENGA II project. Conclusions The project activities under this sub-IR have been able to increase women’s access to productive resources at the community level and increase available resources at the HH level, which has contributed to increased livelihood options for women and increased consideration of men for their wives. As a result, women feel valued. However, in terms of control over HH resources, which can be measured by looking at decision-making for the use of resources,24 there are mixed results depending on whether beneficiaries have a husband or are single parents (i.e. either not married or widowed). For married women, the decision over HH resources continues to be made by men: husbands play the major role in deciding how credit should be used and are seen by many groups as the guarantor for the repayment of the credit. Husbands also decide when to sell the goats (provide under Sub-IR3.1.2) and what to use the money for. However, the fact that the woman is able to bring additional resources to the HH has increased her bargaining power and gives her the right to make suggestions regarding HH decisions. The fact that many women reported being pro-active in starting conversations with their husbands about their HH needs and offering ideas on
24 See, for example, the Longwe’s Women’s Empowerment Framework by Sara Hlupekile Longwe, or the International Food Policy Research Institute’s Women’s Empowerment in Agriculture Index (WEAI).
JENGA II Mid-Term Evaluation Report 39
how to resolve them suggests that women have begun to discover their potential as a result of their newfound knowledge and their access to productive resources. Non-farm IGAs are contributing to diversifying livelihood options for women; the additional income could potentially improve food security in their HHs and also could reduce shocks related to agricultural activities such as crop failure. The activity is very useful for group IGAs as well as for women’s individual business activities (in petty trade, sales, etc.). However, these non-farm IGAs do not currently seem to be profitable for groups because of: the limited resources invested per group; the high production costs; limited business experience; and strong competition from manufactured goods compared to poorer quality products currently made by the women. In many cases, the IGAs rather than helping women are increasing their workload because of the energy and time used for manufacturing or selling (being an ambulatory vendor in the village or taking their product to distant markets) and also the opportunity cost. Because a formal market analysis was not conducted, women’s groups are facing a number of challenges including market saturation when groups put similar products on the market or attempt to compete with much larger product competitors; such competition increases the time it takes to sell products, delaying the sharing of profits. While the training in business management and marketing has been very much appreciated by beneficiaries, there have been two main issues in its implementation: (1) the timing was not suitable for the marketing training, which was done after most of the IGAs were launched, thus not supporting women’s groups to put strategies in place to ensure that products are suitable to customers’ preferences and demands; and (2) very little marketing support has been given to women’s groups after the completion of the training. The savings and credit activity is increasing women’s access to capital for IGAs. Women have a strong ownership of the activity as they perceive that they have invested their own money and time to make it work and also because they are managing it themselves. The savings and credit activity was easily relevant to community needs and easily adopted as it is similar to revolving credit activities already carried out in many communities. However, its potential is limited by the inability to provide adequate credit to all women in a timely fashion (when it is mostly needed.) Many groups want to continue with both the IGAs promoted by the project and the savings and credit activities. They are well aware of the challenges that they will need to overcome in order to sustain these activities: insecurity, inability to remember key steps in making the products for IGAs, members not being able to pay back the credit, failing in their individual IGA, disease affecting goats, loss of motivation, lack of transparency, conflicts within the group, not being able to have regular meetings, and not being able to access other knowledge and opportunities such as MFIs.
Sub-IR3.1.2: Increased women’s access to IGA inputs 2013 goats distributed (1 goat /HH) out of 2205 targeted through Year 3 (91%) Findings All the women’s groups have received goats, with an average of eight goats per group on the WV side and 11 goats per group on the ADRA side. Most beneficiaries appreciated goats because of their cultural and economic value, especially as they can be transformed into cash to meet pressing needs in the HH such as school fees or emergency medical costs. Many women also said that they were taught how to take care of the goats. Community Animal Health Workers have also been trained to support the women in monitoring the goats’ health and providing basic medical care.
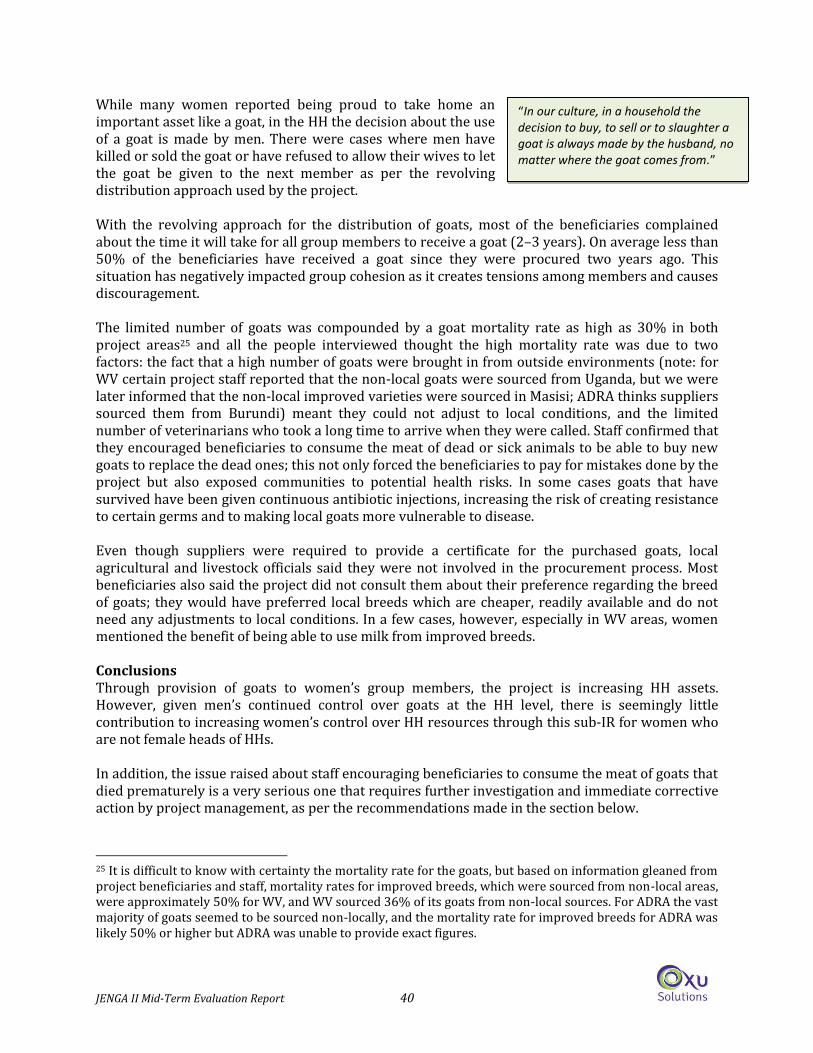
JENGA II Mid-Term Evaluation Report 40
“In our culture, in a household the decision to buy, to sell or to slaughter a goat is always made by the husband, no matter where the goat comes from.”
While many women reported being proud to take home an important asset like a goat, in the HH the decision about the use of a goat is made by men. There were cases where men have killed or sold the goat or have refused to allow their wives to let the goat be given to the next member as per the revolving distribution approach used by the project. With the revolving approach for the distribution of goats, most of the beneficiaries complained about the time it will take for all group members to receive a goat (2–3 years). On average less than 50% of the beneficiaries have received a goat since they were procured two years ago. This situation has negatively impacted group cohesion as it creates tensions among members and causes discouragement. The limited number of goats was compounded by a goat mortality rate as high as 30% in both project areas25 and all the people interviewed thought the high mortality rate was due to two factors: the fact that a high number of goats were brought in from outside environments (note: for WV certain project staff reported that the non-local goats were sourced from Uganda, but we were later informed that the non-local improved varieties were sourced in Masisi; ADRA thinks suppliers sourced them from Burundi) meant they could not adjust to local conditions, and the limited number of veterinarians who took a long time to arrive when they were called. Staff confirmed that they encouraged beneficiaries to consume the meat of dead or sick animals to be able to buy new goats to replace the dead ones; this not only forced the beneficiaries to pay for mistakes done by the project but also exposed communities to potential health risks. In some cases goats that have survived have been given continuous antibiotic injections, increasing the risk of creating resistance to certain germs and to making local goats more vulnerable to disease. Even though suppliers were required to provide a certificate for the purchased goats, local agricultural and livestock officials said they were not involved in the procurement process. Most beneficiaries also said the project did not consult them about their preference regarding the breed of goats; they would have preferred local breeds which are cheaper, readily available and do not need any adjustments to local conditions. In a few cases, however, especially in WV areas, women mentioned the benefit of being able to use milk from improved breeds. Conclusions Through provision of goats to women’s group members, the project is increasing HH assets. However, given men’s continued control over goats at the HH level, there is seemingly little contribution to increasing women’s control over HH resources through this sub-IR for women who are not female heads of HHs. In addition, the issue raised about staff encouraging beneficiaries to consume the meat of goats that died prematurely is a very serious one that requires further investigation and immediate corrective action by project management, as per the recommendations made in the section below.
25 It is difficult to know with certainty the mortality rate for the goats, but based on information gleaned from project beneficiaries and staff, mortality rates for improved breeds, which were sourced from non-local areas, were approximately 50% for WV, and WV sourced 36% of its goats from non-local sources. For ADRA the vast majority of goats seemed to be sourced non-locally, and the mortality rate for improved breeds for ADRA was likely 50% or higher but ADRA was unable to provide exact figures.
JENGA II Mid-Term Evaluation Report 41
IR3.1 Recommendations 1. Considering the idea of a HH as a business unit, include men more purposefully in the project by
developing a curriculum for training women and their male partners around working together, looking at issues of HH budgeting, power and control of productive resources in the HH.26
2. Provide refresher trainings in business management skills to all IR3.1 women beneficiaries. 3. Provide marketing support to women’s groups beyond the training for the remaining two years:
assign full-time marketing staff dedicated to IGAs in each territory who will regularly visit women’s groups to help them find solutions to their IGA problems.
4. Conduct a market study for IGAs and take appropriate actions based on each group’s challenges. This may include replacing IGAs that cannot work; supporting groups that do not have access to markets in getting a location where they can sell their products; refresher training for those who have not yet mastered the techniques (adapt IGA training material to the level of program participants by translating it into local language and making it user friendly with a lot of illustrations-see Annex P for a summary of trainings provided under SO3); and helping women to obtain tax documents.
5. Resources allowing, add to the quantity of items provided in IGA starter kit for each group to increase the potential for activities to generate enough income to benefit the whole group.
6. Progressively link groups that are performing well with MFIs and provide them with needed support such as training in business management, advice on wise investments, and understanding and managing the risks that come with lending institutions.
7. Identify strategies to ensure that all beneficiaries receive a goat in an acceptable timeframe including: accelerating the revolving process; buying goats to replace dead ones; or revolving the adult goat instead of the offspring.
8. Discourage consumption of meat from dead or sick animals by encouraging people to burn or bury them.
IR3.2: Reduced GBV in communities There are two sub-IRs leading to this IR; the first sub-IR is about increasing awareness about GBV at the community level and the second is about the community putting in place mechanisms for protection and prevention of GBV. It should be noted that the findings detailed below were reported during FGDs and KIIs, but as there are numerous GBV actors in project areas it is difficult to know the extent to which JENGA II activities actually contributed to these achievements, whether they were the result of other actors’ interventions, or some combination. Sub-IR3.2.1: Increased knowledge of GBV among men, women, and children in the beneficiary communities 202 out of 256 targeted programs through Year 3 on GBV developed and broadcast (79%) 58 out of 30 targeted Listening Groups established/strengthened (193%) Findings This sub-IR uses radio programming and listening committees (LC) as its main activities to increase knowledge of GBV in beneficiary communities. A communication plan and strategy to guide the development and broadcast of radio shows was developed and is being used by ADRA and WV. However, there was no formal assessment to identify key gender issues and barriers to behavior
26 Refer for example to the International Rescue Committee (Women’s Protection & Empowerment Technical Unit) for their work and research on their EA$E (Economic and Social Empowerment) program, which includes a detailed curriculum for couples on HH financial management aimed at safely shifting power dynamics in the home.
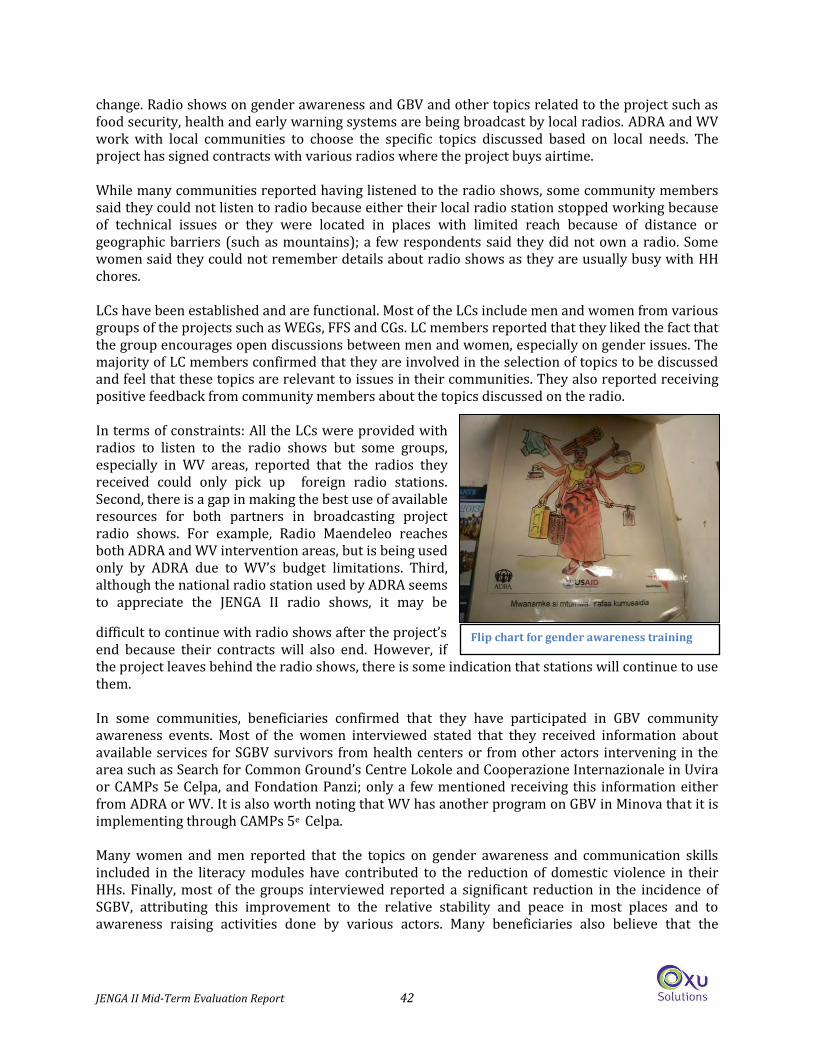
JENGA II Mid-Term Evaluation Report 42
change. Radio shows on gender awareness and GBV and other topics related to the project such as food security, health and early warning systems are being broadcast by local radios. ADRA and WV work with local communities to choose the specific topics discussed based on local needs. The project has signed contracts with various radios where the project buys airtime. While many communities reported having listened to the radio shows, some community members said they could not listen to radio because either their local radio station stopped working because of technical issues or they were located in places with limited reach because of distance or geographic barriers (such as mountains); a few respondents said they did not own a radio. Some women said they could not remember details about radio shows as they are usually busy with HH chores. LCs have been established and are functional. Most of the LCs include men and women from various groups of the projects such as WEGs, FFS and CGs. LC members reported that they liked the fact that the group encourages open discussions between men and women, especially on gender issues. The majority of LC members confirmed that they are involved in the selection of topics to be discussed and feel that these topics are relevant to issues in their communities. They also reported receiving positive feedback from community members about the topics discussed on the radio. In terms of constraints: All the LCs were provided with radios to listen to the radio shows but some groups, especially in WV areas, reported that the radios they received could only pick up foreign radio stations. Second, there is a gap in making the best use of available resources for both partners in broadcasting project radio shows. For example, Radio Maendeleo reaches both ADRA and WV intervention areas, but is being used only by ADRA due to WV’s budget limitations. Third, although the national radio station used by ADRA seems to appreciate the JENGA II radio shows, it may be
difficult to continue with radio shows after the project’s end because their contracts will also end. However, if the project leaves behind the radio shows, there is some indication that stations will continue to use them. In some communities, beneficiaries confirmed that they have participated in GBV community awareness events. Most of the women interviewed stated that they received information about available services for SGBV survivors from health centers or from other actors intervening in the area such as Search for Common Ground’s Centre Lokole and Cooperazione Internazionale in Uvira or CAMPs 5e Celpa, and Fondation Panzi; only a few mentioned receiving this information either from ADRA or WV. It is also worth noting that WV has another program on GBV in Minova that it is implementing through CAMPs 5e Celpa. Many women and men reported that the topics on gender awareness and communication skills included in the literacy modules have contributed to the reduction of domestic violence in their HHs. Finally, most of the groups interviewed reported a significant reduction in the incidence of SGBV, attributing this improvement to the relative stability and peace in most places and to awareness raising activities done by various actors. Many beneficiaries also believe that the
Flip chart for gender awareness training
JENGA II Mid-Term Evaluation Report 43
enactment of the law against GBV by the government is a strong deterrent for perpetrators since many of them fear being arrested. Conclusions One challenge for this entire IR is that there are multiple actors working on GBV prevention and response in areas overlapping with JENGA II project zones, and there does not seem to be a detailed understanding of where there are overlapping activities or particular gaps. Moreover, it does not appear that the project has conducted a detailed mapping of available services in each area, which should be an important step prior to starting awareness-raising activities around GBV. Project documents discuss awareness-raising related to gender and GBV, but it is not clear what particular types of GBV – e.g. stigmatization, availability of services, prevention, etc. – the project is attempting to address, which is important since the points of emphasis require very different messages. The approach used by JENGA II to involve beneficiaries in the development and broadcast of radio programs is effective in raising awareness about GBV. Listening to their own voices and those of their fellow community members attracts the attention of both project beneficiaries and non-beneficiaries. Without having influential people in the community championing changes on GBV, radio programs and public awareness campaigns on gender issues and GBV are not enough to bring people to change negative behavior given that gender inequities are deeply rooted in local culture and practices. “He/she who abandons his/her culture is a slave" said one man from the community.
Sub-IR3.2.2: Community mechanisms for GBV protection and prevention increased Findings 90 out of 78 targeted CDCs trained on protection issues (115%) CDCs confirmed receiving training on GBV prevention and protection. However, no one in the communities in which the MTE team conducted field work, especially women, were aware of any community protection and prevention plans against GBV put in place by CDCs. Additional findings related to this sub-IR include:
o There is no budget to support the CDCs proposed plans. o There has not been an assessment on whether service providers for GBV survivors (for both
medical and legal support) have appropriate and adequate capacity in targeted communities.
o Protection and prevention plans did not assess any unexpected negative consequences of their plans on women or men, such as arbitrary arrests of men or increased stigma for women who denounce domestic violence.
o There is no clear measurement criteria to assess the success of the work by CDCs. o The project document did not mention how the CDCs’ work on protection and prevention
will be monitored. o The project is working already on many other activities under SO3, and currently neither
field staff nor partners have the capacity in terms of time and technical skills to support the CDCs in these activities.
Conclusions Community GBV prevention and protection plans are very complex as GBV is a broad concept and, as noted above, it is not clear what aspects of GBV the project is trying to address. Based on the lack of progress in sub-IR3.2.2, the complexities inherent in addressing GBV at a community-level, and the logical linkage between reduction of HH-level GBV and improved HH food security, it seems that
JENGA II Mid-Term Evaluation Report 44
a re-focus of this IR on HH-level gender dynamics and GBV would be appropriate and more realistic than maintaining an emphasis on GBV at the community level. IR3.2 Recommendations 1. Drop activities related to CDC GBV community protection and prevention plans and strategies,
and focus activities in this IR on gender relations and addressing GBV at the HH-level (which will be a better complement to IR3.1 and IR3.3 activities).
2. Strengthen collaboration with other actors working on GBV to ensure JENGA II is complementing and not duplicating efforts of other actors in this sector in the project areas.
3. Focus on HH-level GBV, with a clear target and means of verification. Embedding this activity in ongoing activities in food security will enable a more tangible result. Maximize the impact already made by the project in reducing domestic violence at the HH-level by reaching beneficiaries’ husbands or wives for GBV awareness sessions.
4. Continue with radio programs and LCs to raise awareness on gender dynamics and GBV and their impact on food security, health and agriculture as it is effective in reaching the broad communities, beyond the direct beneficiaries of other JENGA II activities. Go beyond awareness-raising and put in place strategies for behavior changes in regard to gender relations and its impact on food security by (a) conducting an assessment on key barriers to adopting good practices related to gender relations and (b) work with influential men and women from the communities (traditional leaders or church leaders) who can champion good practices on gender relations.
5. Use other messaging channels such as churches to reach more people with GBV-based messages, but on a more focused area related to HH-level GBV and food security.
6. Maximize the use of available project resources for both WV and ADRA in broadcasting project radio shows by having ADRA include some WV messages in the Maendeleo radio programs as this station reaches both ADRA and WV intervention areas. ADRA and WV could also enhance coordination with Radio Maendeleo and alternate the broadcast of JENGA II radio shows from communities in different project areas on different days.
IR3.3: Increased participation of women in community leadership This IR is mainly about providing women with labor-saving skills and technology as well as increasing their literacy levels to be able to participate in community leadership.
Sub-IR3.3.1: Women’s leadership skills increased 155 WEGs out of 155 trained in community leadership (100%) 31 out of 60 targeted leadership projects have been carried out (52%) Findings Leadership projects have started in WV’s intervention areas but during the interviews, there were no women or men who made any connection between those leadership projects and the increase in women’s leadership skills. However, most of the women and men interviewed in both ADRA and WV areas mentioned that JENGA II’s contribution to increasing women’s leadership skills are through literacy and their participation in various groups created by the project (WEG, CG, FFS, FBA, Community Early Warning System Committees (CEWSC), CDC), especially having key positions in committees such as chair, vice chair or advisor. Conclusions The WV-sponsored leadership projects are contributing to the visibility of women’s groups, but do not do much to increase their participation in decision-making at the community level. Without a proper analysis and strategy, leadership projects could actually lead to increasing women’s
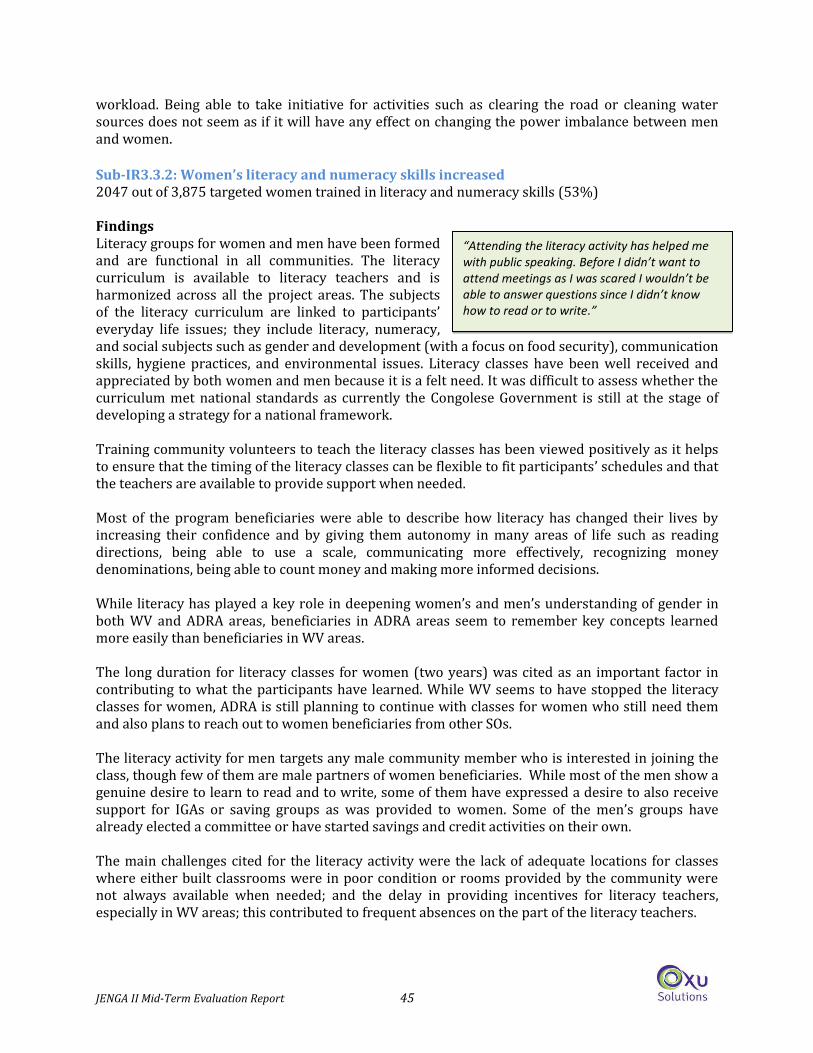
JENGA II Mid-Term Evaluation Report 45
“Attending the literacy activity has helped me with public speaking. Before I didn’t want to attend meetings as I was scared I wouldn’t be able to answer questions since I didn’t know how to read or to write.”
workload. Being able to take initiative for activities such as clearing the road or cleaning water sources does not seem as if it will have any effect on changing the power imbalance between men and women. Sub-IR3.3.2: Women’s literacy and numeracy skills increased 2047 out of 3,875 targeted women trained in literacy and numeracy skills (53%) Findings Literacy groups for women and men have been formed and are functional in all communities. The literacy curriculum is available to literacy teachers and is harmonized across all the project areas. The subjects of the literacy curriculum are linked to participants’ everyday life issues; they include literacy, numeracy, and social subjects such as gender and development (with a focus on food security), communication skills, hygiene practices, and environmental issues. Literacy classes have been well received and appreciated by both women and men because it is a felt need. It was difficult to assess whether the curriculum met national standards as currently the Congolese Government is still at the stage of developing a strategy for a national framework. Training community volunteers to teach the literacy classes has been viewed positively as it helps to ensure that the timing of the literacy classes can be flexible to fit participants’ schedules and that the teachers are available to provide support when needed. Most of the program beneficiaries were able to describe how literacy has changed their lives by increasing their confidence and by giving them autonomy in many areas of life such as reading directions, being able to use a scale, communicating more effectively, recognizing money denominations, being able to count money and making more informed decisions. While literacy has played a key role in deepening women’s and men’s understanding of gender in both WV and ADRA areas, beneficiaries in ADRA areas seem to remember key concepts learned more easily than beneficiaries in WV areas. The long duration for literacy classes for women (two years) was cited as an important factor in contributing to what the participants have learned. While WV seems to have stopped the literacy classes for women, ADRA is still planning to continue with classes for women who still need them and also plans to reach out to women beneficiaries from other SOs. The literacy activity for men targets any male community member who is interested in joining the class, though few of them are male partners of women beneficiaries. While most of the men show a genuine desire to learn to read and to write, some of them have expressed a desire to also receive support for IGAs or saving groups as was provided to women. Some of the men’s groups have already elected a committee or have started savings and credit activities on their own. The main challenges cited for the literacy activity were the lack of adequate locations for classes where either built classrooms were in poor condition or rooms provided by the community were not always available when needed; and the delay in providing incentives for literacy teachers, especially in WV areas; this contributed to frequent absences on the part of the literacy teachers.
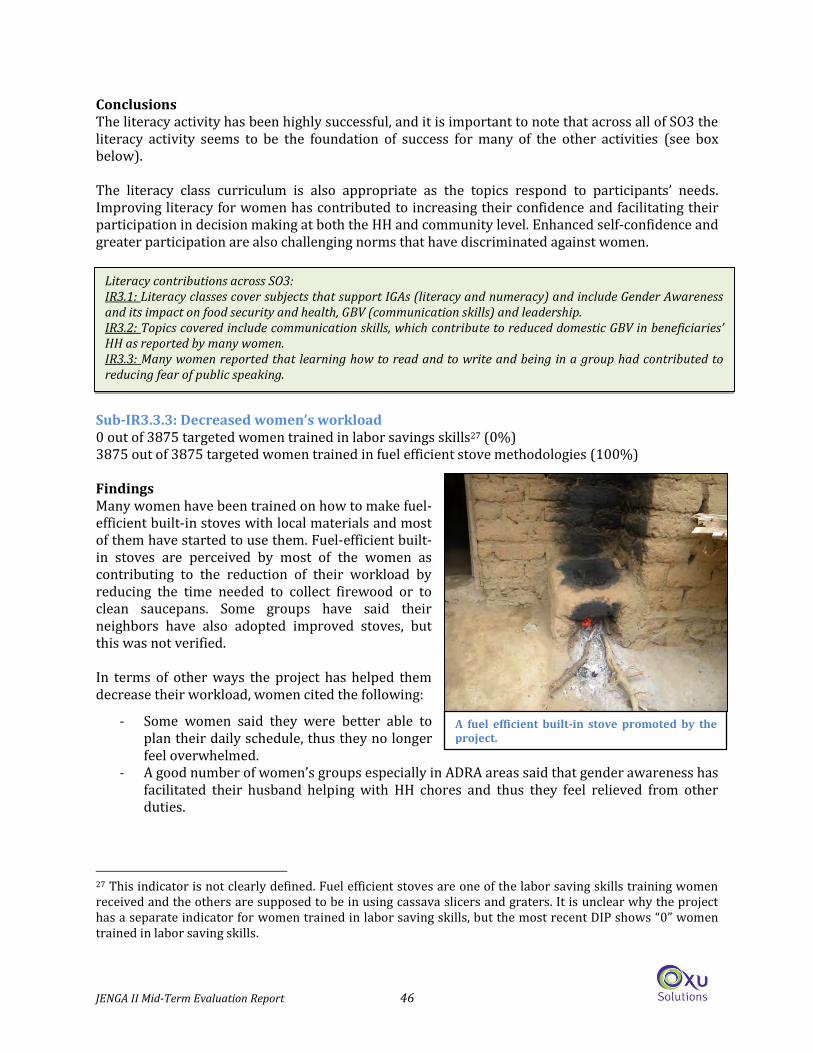
JENGA II Mid-Term Evaluation Report 46
Literacy contributions across SO3: IR3.1: Literacy classes cover subjects that support IGAs (literacy and numeracy) and include Gender Awareness and its impact on food security and health, GBV (communication skills) and leadership. IR3.2: Topics covered include communication skills, which contribute to reduced domestic GBV in beneficiaries’ HH as reported by many women. IR3.3: Many women reported that learning how to read and to write and being in a group had contributed to reducing fear of public speaking.
Conclusions The literacy activity has been highly successful, and it is important to note that across all of SO3 the literacy activity seems to be the foundation of success for many of the other activities (see box below). The literacy class curriculum is also appropriate as the topics respond to participants’ needs. Improving literacy for women has contributed to increasing their confidence and facilitating their participation in decision making at both the HH and community level. Enhanced self-confidence and greater participation are also challenging norms that have discriminated against women.
Sub-IR3.3.3: Decreased women’s workload 0 out of 3875 targeted women trained in labor savings skills27 (0%) 3875 out of 3875 targeted women trained in fuel efficient stove methodologies (100%) Findings Many women have been trained on how to make fuel-efficient built-in stoves with local materials and most of them have started to use them. Fuel-efficient built-in stoves are perceived by most of the women as contributing to the reduction of their workload by reducing the time needed to collect firewood or to clean saucepans. Some groups have said their neighbors have also adopted improved stoves, but this was not verified. In terms of other ways the project has helped them decrease their workload, women cited the following:
- Some women said they were better able to plan their daily schedule, thus they no longer feel overwhelmed.
- A good number of women’s groups especially in ADRA areas said that gender awareness has facilitated their husband helping with HH chores and thus they feel relieved from other duties.
27 This indicator is not clearly defined. Fuel efficient stoves are one of the labor saving skills training women received and the others are supposed to be in using cassava slicers and graters. It is unclear why the project has a separate indicator for women trained in labor saving skills, but the most recent DIP shows “0” women trained in labor saving skills.
A fuel efficient built-in stove promoted by the project.
JENGA II Mid-Term Evaluation Report 47
- Some women also mentioned other activities such as savings and credit groups and IGAs as also reducing their workload as they can get cash to pay for labor or do non-farming activities.
- Tippy taps were also cited as a labor-saving device. Other labor saving technologies planned by the project such as cassava graters or slicers have not yet been disseminated among project beneficiaries and the main reason given was because of delays in the procurement processes. Conclusions This is an important sub-IR for the overall achievement of SO3 and it seems there are a number of unanticipated positive impacts of other SO3 activities that are leading to reductions in women’s workloads (such as having men help out with chores and using money from IGAs or savings and credit groups to pay for hired labor). Impact could be strengthened during the remaining project duration by providing women with the additional labor-saving inputs that were supposed to be distributed during Year 2.
IR3.3 Recommendations 1. Instead of doing leadership projects, train women on simple leadership techniques such as
public speaking, how to motivate group members and conflict management. Women can practice these skills in the groups created by the project (FFS, WEG, FBA, and CG).
2. Work with local councils to invite women to places where decisions about community food security are being made, such as village councils or CARGs.
3. WV and ADRA: Harmonize approaches for men’s literacy, especially in term of duration. Longer is better.
4. Start other scheduled labor saving activities as soon as possible. Additional SO3-related Findings and Recommendations All the SO3 women’s groups were created by the project and have been in place for at least two years. This has enabled members to know each other and to build mutual trust that can contribute to the sustainability of the group and to greater social cohesion. All the groups in the project present similar characteristics in their size, on average 25 members. Other similarities include: size, structure, composition of committees, homogeneity in terms of gender, and heterogeneity in terms of age. Women’s group differences include: the performance of non-agricultural IGAs and savings and credit groups. Proximity to urban centers also has an effect on a group’s performance as proximity is a determining factor in challenges they face with IGAs (competition, cost or availability of raw material, outlet for products). In general, starting with literacy activities that do not involve material support (as opposed to the need for start-up inputs for IGAs) has contributed to women perceiving that they have invested their time for the success of the group activities, which has directly contributed to a sense of ownership of the project activities. As a result, activities involving material support such as IGAs have been perceived as a reward for being patient and committed. Women have realized what they are capable of achieving as a group (“the power of the group”) as opposed to working individually, especially with savings and credit activities where they have been able to accumulate capital. It is no surprise that nearly every SO3 participant finds this as the biggest achievement of the project - the ownership of the savings and credit groups is very strong since the women have invested in it financially and they are the ones managing it on their own.
JENGA II Mid-Term Evaluation Report 48
Finally, it is important to note for this SO that many other players are involved in activities similar to those in SO3 within the radius of ADRA or WV project zones. For certain activities such as gender awareness, the impact of the project is not only attributed to JENGA II. Other Recommendations 1. Develop an exit plan for the women’s empowerment activities. 2. Consult women beneficiaries when planning for the exit strategy to ensure that their
perspectives and needs are included as they know the challenges that can undermine the sustainability of the project.
3. Conduct a review of SO3 activities and drop those activities that will not add significant value before the end of the project.
4. WV: Ensure that the three local associations implementing SO3 activities have an adequate budget and are paid on time. Resources are especially needed for transport to sites so they can monitor activities and provide support.
Strategic Objective 4: Strengthened community resilience to food security shocks Summary of SO4 progress SO4 was initially an IR under SO1 in the original project proposal, and at the request of USAID it was later taken out of SO1 to become its own SO.28 Based on our understanding of the logic of the project and the implementation during the first three years of the project, we feel SO4 should have stayed as an IR under SO1. SO4 contains three main components – Natural Resource Management (NRM), Community Early Warning Systems (CEWS), and support to territory-level CARGs. The organization of the SO is not very logical, as CEWS contribute to ‘strengthened food security-related local governance’ (IR4.2) rather than ‘community response to disasters improved’ (IR4.1). Referring to the SO as “resilience” has further confused matters, as SO4 activities are more closely linked to disaster risk reduction (DRR) than to resilience, as resilience to food security shocks will be achieved through all JENGA II project activities and SOs rather than through a single SO focused on CEWS, CARGs, and NRM. The above being the case regarding the design and the logic of the outcomes, activities within SO4 are progressing fairly well, and the remaining activities to meet the targets can be achieved in the final two years of the project.
IR4.1: Community responses to disasters improved Sub-IR4.1.1: Improved NRM 12 out of 9 targeted tree nurseries established (133%) 6,990 FFS participants out of 11,220 targeted by end of Year 3 trained (62%)
28 Staff reported that creating SO4 as a separate objective was at the request of USAID/FANTA despite the objection of the consortium. This is potentially a lesson-learned for USAID/FANTA and of the consortium that reorganizing the logic of a results framework can create problems in implementation, even if at times it may appear to make sense administratively. The logic of project design in terms of community and beneficiary impact should be pre-eminent.
JENGA II Mid-Term Evaluation Report 49
Findings NRM is an area that includes several activities, including water management, soil management, flora and fauna management, and integrated pest management. JENGA II has implemented two specific activities related to NRM: soil management and reforestation. For soil management, over half of the targeted FFS farmers were trained on techniques of soil management (contour lines, windbreaks, reforestation, composting), and awareness of the importance of agroforestry in the maintenance of soil fertility and soil moisture. By the end of Year 4, all 15,000 FFS farmers are supposed to be trained in these topics. For reforestation, tree nurseries for agroforestry and fruit trees were set up and some of the trees were planted in large public sites and other distributed to individuals for transplantation in their own fields. Based on discussions in focus groups, farmers are knowledgeable of NRM issues and have been sensitized to the planting of trees as well as agroforestry and land protection for at-risk lands. Conclusions The project beneficiaries are informed about issues related to NRM, agroforestry, and the setup of tree nurseries. To date, however, it appears that JENGA II has not implemented any anti-erosion measures on hillside terrain in any project areas. In some project areas mainly in Fizi and Uvira there is a strong use of slash and burn farming and deforestation, both of which have a detrimental effect on soil and water conservation as well as on the climate. As of now, the project does not have a sustainability plan for the nurseries, and it is unclear how the activity might continue at the end of the project. There is no monitoring mechanism for distributed trees and some trees were given at the beginning of the dry season which resulted in a low success rate. IR4.1 Recommendations 1. Develop a sustainability plan for the management of trees planted and for the continuity of the
nurseries. This plan should consider who will manage the nurseries and ensure they have the skills and materials necessary for their management.
2. In collaboration with local authorities, raise awareness to end the use of slash and burn farming and raise awareness about the risks of wildfire and deforestation.
3. Install windbreaks in areas prone to wind erosion. 4. Provide training and practice in soil management techniques and soil conservation on hillside
lands. IR4.2: Strengthened food security-related local governance entities 12 out of a targeted 19 Community Early Warning System Committees (CEWSC) through Year 3 put in place (63%) 77 out of 78 CDCs trained on management (98%)29 12 out of 22 targeted CARG members trained (55%)
29 These figures are from the latest version of the DIP that was shared with the MTE team (for accomplishments through the end of Year 3 of the project). We had previously been informed that 28 of 30 CEWSC had been put in place, and 96 out 155 CDCs had been trained on management. It is unclear how the figures changed so dramatically (both the achievements and the targets), which makes us question the reliability of the numbers.
JENGA II Mid-Term Evaluation Report 50
“We saw signs of cracks on the slope of the mountain, we shared the information with the local chief, the community was warned not to grow any crop in that area. Later there was a land slide and there was no loss of life or crops.” A CEWSC Member
“These activities are good but we need more trainings since this subject is new to us – that is why we have forgotten many things .” A CEWSC “We need more training to be able to understand what all this is about” - A female member of a CEWSC
Findings All CEWS activities have been implemented in partnership with Sun Mountain International (SMTN), who have played a major role in: training WV and ADRA staff, CDCs and their CEWSC on CEWS; working with communities to do hazard mapping - using Geographic Information System (GIS) and Satellite maps; identification of key risk-related indicator; and developing community-level disaster management plans, which includes a CEWS and a response plan. WV and ADRA have monitored and supported communities in the CEWS activities. While the partnership with SMTN has been positive for the project it not clear to all project partners how the decision was made about it and whether JENGA II has found a lasting solution for the gap they have filled. CEWS activities are appreciated in most communities as they address actual food security needs related to DRR. The targeting process for selecting communities for CEWS activities, however, is not clear, as there is no written document specifying the criteria used for choosing each community. According to WV, the selection was based on places where CDCs have been established first, and for ADRA it was mainly in communities that were either centrally located or had high exposure to risks and hazards. As a pilot activity and due to budget constraints the project targeted to establish 30 CEWS only during the life of the project. The established CEWSC were trained once on food security issues and EWS. However the training module30 content, which was developed by the project, seems to be more academic rather than a practical community level training, which explains the confusion most CEWSC members had about key activities for a CEWS such as monitoring key indicators. The same approach was used in the establishment of all of the CEWSC thanks to the guide in the training module, and in general the composition of CEWSC roles is almost the same in all project areas: each CEWSC has members responsible for monitoring key indicators on food security, health and nutrition, environment, social aspects and human rights. All CEWSC visited are functional as most of them have developed their Disaster Management Plan, which include an EWS, a communication plan, and a response plan. Most of the CEWSC felt the material provided for the monitoring of key indicators and early warning was not adequate in terms of quantity (1 bicycle, 1 megaphone and some office stationary), especially considering the topography of their communities, which is mostly mountainous particularly in WV areas. The categories of key indicators were very variable among communities and over time, making it difficult to be able to see any trends about the information collected. CEWSC were able to give examples of cases when they had been monitoring hazard indicators and had given an early warning to communities and thus avoided a potential disaster, especially for hydrological, geological and health hazards.
30 Module de formation SCAP.
JENGA II Mid-Term Evaluation Report 51
Most of the CEWSC demonstrated understanding about the communities’ responsibility and capacity in responding to and mitigating certain levels of shocks but also expressed the need to have the government and other actors responsive to disasters that they could not manage themselves. There is a high expectation from CEWSC regarding what WV and ADRA should do when the community is affected by a serious hazard or shock. CDCs have been established or revived in communities where JENGA II is being implemented. A total of 98% of CDCs (77 out of 78) in the project areas have received training and have developed their own internal procedures. Most of the CDCs the MTE team visited complained that they were not involved in other activities being implemented by the project for SO1, SO2 and SO3, except for training on Gender and GBV in WV areas. In ADRA areas however, CDCs involvement was still limited to selection of project beneficiaries for SO1, SO2 and SO3; and the identification of community literacy teachers for SO3. There were concerns raised by CDCs and CEWSC about their legitimacy vis-a-vis the communities as well as the government structures regarding their activities. In some places CDCs were created by the project and in other places the project used existing structures created by other NGOs like the International Rescue Committee with its Tuungane project. Other actors in the area do not work necessarily through these structures, and the government has not done much to enforce the decentralization policy; for example people often use different names for these local structures. For CEWSC, the issue about their legitimacy is linked to the lack of a government structure and policy for disaster management at the local levels. There has been an effort from the WV side to connect CDCs with other development stakeholders including local government and other international NGOs, but this was done only once at the onset of JENGA II, and there has not been much follow up since. In the three project territories, there are two CARGs that exist (in Kalehe and Uvira), which are supported by the project and have received training on the collection and dissemination of market information. The CARG in Fizi Territory is still not yet operational. There is good collaboration between WV and the CARG in Kalehe (an MOU was signed between WV and the Kalehe CARG in Year 3), and efforts have been made by WV in continuing to revitalize the CARG. The Kalehe CARG for instance supported 35 of 41 FBAs supported by WV to secure their legalized documents from the territory and regularly collects market information, which is being disseminated on local radio. In Uvira ADRA has plans to work more closely with the Uvira Territory CARG, and an agreement outlining collaboration was signed in July 2014. Both operational CARGs have five-year agriculture plans, but they are not very widely known and are not disseminated to communities. Ten territory-level agronomists were trained by the project on improved agricultural practices. Conclusions The CEWS activity is relevant because it responds to a felt need from the communities. In most communities there were already existing basic traditional CEWS based on indigenous knowledge, though these CEWS were not systematic. In addition, there is a lot of overlap and/or duplication between the work that the CEWSC is doing and activities that are being implemented in SO1, SO2 or SO3 like identification of crop diseases, sensitization on health risks or on gender related issues. There are no mechanisms in place for ensuring collaboration rather than duplication of efforts. As noted above, the number of CEWSC established is inexplicably very low compared to the number of communities covered by the project.
JENGA II Mid-Term Evaluation Report 52
The CEWS that have been established are overly complex (which seems to be a result of a general focus on resilience) and include too many components (food security, health and nutrition, environment, social affairs, and human right) with too many indicators to collect. The communities simply do not have the capacity – human, time, financial, and technical –to collect, report on, and analyze all of the information, and then to take any necessary actions. Finally, collaboration with the two operational CARGs can continue to be emphasized during the remainder of the project to support this nascent state structure. IR4.2 Recommendations 1. Simplify the designed CEWS to monitor risks that are directly linked to food security and pick 2-
3 indicators for each sector that can be monitored on the same frequency for each community. For example: - Agriculture: incidence of crop diseases, rainfalls, yields, prices of main food commodities,
state of roads that connect to market; - Environmental risks: bushfire, tree cutting, signs of cracked lands, river water levels; - Health risks: children under 5 with diarrhea, people using unprotected water sources.
2. Provide more training to CEWSC, and focus more on practical aspects such as hazard mapping, monitoring of key indicators, community vulnerability and capacity assessment, and analysis of information gathered through the CEWS.
3. Provide adequate tools and/or equipment for monitoring key indicators and early warning allocated to CEWSC, which could include rain gauges, river gauges, measuring tapes, and means of transport suitable to the community topography.
4. Where relevant CEWSC should work with and support SO1, SO2 and SO3 activities to maximize project impact – this will strengthen the capacity of CEWSC as they will work directly with experts on agriculture, health or gender.
5. Formalize where needed partnership with local government structures relevant to the sectors included in the CEWS (such as agriculture, environment and health) and connect them with the CEWSC and CDCs so as they can be included in existing relevant local structures like CODESA.
6. Raise awareness of the existence and contents of the five-year agriculture plan in each territory (where a plan exists) to organizations working in the sector and to the general population.
7. Delegate certain activities (such as the macro propagator, seed multiplication plots, etc.) to the CARGs and strengthen their capacity to advocate to the authorities and other actors involved in the sector to strengthen its activities.
8. Collaborate with the CARGs in the monitoring of project activities. 9. For future projects, ADRA and WV should conduct in their respective areas tailored studies to
collect endogenous knowledge of community members that draw links between nature and environmental phenomena. These elements are all environmental considerations that should come into play in CEWS mechanisms.
Additional SO4-related Findings and Recommendations The logic for SO4 in the Results Framework is problematic in a number of ways, as noted above in the summary findings for SO4. Based on these issues, we would recommend the following:
- Reformulate the SO to be: strengthened food security-related community disaster risk reduction
- Move CEWS activities to be under IR4.1
JENGA II Mid-Term Evaluation Report 53
We also think that it makes sense from a project design and theory of change standpoint to move NRM under SO1, though we are reticent to make a recommendation for moving an entire project component from one SO to another at this stage of the project. Finally, SMTN’s work in this SO should be critical to successful activity implementation. SMTN has produced a comprehensive risk management tool kit and strategy for climate change adaptation for the JENGA II project, but it seems as though many project staff are not aware of these documents. JENGA II management needs to disseminate the risk management toolkit and climate change adaptation strategy among project staff and follow-up to ensure that the tools are being used.
JENGA II Mid-Term Evaluation Report 54
IV. General and Cross-cutting Observations and Recommendations a. General Observations
The operating environment in EDRC is characterized by insecurity, an enormously high level of need, serious logistical constraints, limited state provision of public services, and the challenge of transitioning from humanitarian and emergency response to longer-term development interventions. In the midst of such challenges, overall JENGA II appears to have performed well in terms of the level of activity achievement during the project’s first three years; there are also initial signs of target beneficiary and community change. While there is anecdotal evidence at this stage of positive impacts in a number of the project, unfortunately the systems JENGA II has in place for monitoring and reporting on activities as well as for documenting and disseminating project strategies and learning are inadequate to demonstrate meaningfully this impact and equally importantly to monitor project progress to make adjustments along the way. As we detail in Section III above, there are a number of positive findings from activity implementation, yet we have serious concerns about the quantitative project data that should help support findings from qualitative data collection. During the MTE we had significant difficulties getting accurate information. The project could not provide us with some basic information, such as a site list showing where activities under each SO are being implemented. In addition, we requested numerous times to get a DIP with activity accomplishments through the end of Year 3. This request was finally fulfilled on 31 August (a week after we submitted the draft report). Prior to getting the full DIP, SO Coordinators provided numerous versions of individual SO DIPs, but on each occasion for each SO there would be discrepancies or differences from previous versions, which made us seriously question the validity of the information being provided. Even the final version provided to us had numbers that were dramatically different from previous DIP versions (and even some target levels had changed). A concerted effort to improve project M&E and documentation systems in the remaining two years of the project is therefore critical. We also found that the project is responsive to the food security needs of the project communities, in terms of activities designed to address interrelated issues of food insecure populations related to food access, availability, utilization, and prevention of and coping with food security-related shocks. In this sense, the project design is relevant. JENGA II has also benefited from the fact that ADRA and WV, the two main implementing partners, are both well-known and respected at the community level. While there are successful activities and components within each SO (as described in detail above), the greatest impact that we observed is from SO3 and in gender as a cross-cutting theme. To date, the majority of project beneficiaries are women, which was planned during project design. JENGA II also appears to be contributing to very positive impacts on women and gender relations in targeted communities. During our field work, we heard countless stories and reports from women beneficiaries, their male partners, community leaders, and other community members describing the benefits of the project related to women’s empowerment (i.e. SO3) and overall gender relations. An additional initial positive impact is that we heard about and noted a number of examples and anecdotes of spillover effects on non-beneficiaries, especially in agriculture techniques and practices promoted in SO1 and health and nutrition practices promoted in SO2. In addition to the overall strengths of JENGA II to date, there are a number of lessons learned and challenges that the project has faced. First, while the project design is generally responsive to needs, we also found that it was an overly ambitious overall program design. The design targeted too many intervention zones, included too many activities for available resources, and included a small number of activities or activity components that were not well-suited to the realities of the context in the three project territories. The high number of intervention zones
JENGA II Mid-Term Evaluation Report 55
targeted by the project, for example, led directly to the significant issues with PM2A only being able to reach approximately 20-40% of eligible PLW and CU2 in target communities. Even if the proposal overestimated the number of communities to target, the project should have reduced the number during the initial months of the project during the detailed planning phase, which could have helped avoid implementing PM2A without being able to provide blanket feeding for all PLW and CU2 in target geographic areas. In addition, in SO1 the project focused too heavily on agricultural marketing, seemingly without a deep understanding or appreciation of the constraints farmers (especially food insecure, severely resource-constrained smallholder farmers or SHFs) would face in being able to enhance commercialization.31 The FY11 USAID/ FFP Food Security Country Framework (FSCF) document also noted that “Two local institutions are key entry points to agricultural activities in DRC: the CARGs and community development committees (CDCs)” (FSCF p. 8). The FSCF insistence on working with and through the CARGs and CDCs seemed to assume that throughout all possible geographic areas the CARGs and CDCs would be established and functioning. In JENGA II areas, however, only two of three CARGs are operational as of July 2014, and we were informed that the CDCs were established or revived by JENGA II (and are often seen at the community level as NGO creations rather than local institutions sanctioned by the Government). The disconnect between the FSCF description of CARGs and CDCs and the reality on the ground also created some difficulty in the actual attempts to implement activities designed to work closely with those two ‘institutions.’ At the same time, during project design or the initial months of project start-up, the consortium could have done a more in-depth assessment of the capacity and ability of the CARGs and CDCs to play the roles proposed in the project and made adjustments as necessary. A second general lesson learned from JENGA II is that the majority of beneficiaries do not benefit from activities in multiple SOs and there is an overall lack of integration across sectors. Targeting, therefore, is not integrated across SOs at the HH level and in fact, not all SOs are present in all communities. We recognize that for HH-level targeting the project wanted to avoid overtaxing women and also wanted to disperse project impact across more HHs. The result of such an approach, however, is that the impact of having an integrated food security program is lessened at the HH level. The project could have considered, for instance, intentionally targeting for SO1 activities the male partners of women involved in SO2 and SO3 activities. In addition, when the MTE team asked for data on the extent of beneficiary overlap among numerous activities, we were informed that the project does not track that information, which provides further evidence for the lack of a systematic project approach to HH-level integration. Integration is also limited within the project structure itself, as SO teams often operate in isolation of each other. We also found that the JENGA II exit strategy/sustainability plan has not been updated since the project proposal. While it does seem to be the case that project staff think about sustainability and how various activities are or should be sustainable, there is no written guiding vision or concrete plan for project sustainability or exit. The objective of a sustainability plan should be to ensure that the positive effects of the project continue, that new behaviors and practices continue, and that people exercise and share newly-acquired competencies and skills. For example, it is not enough to assume that project volunteers will simply continue their functions post-project. What needs to be in place is a plan for ensuring that they have the necessary resources: motivation, support, technical competencies, material resources (if needed), and time.
31 For example, while a number of FBAs have been able to become formally-recognized cooperatives, many FBAs lack basic levels of functioning in terms of financial management, business planning, etc.
JENGA II Mid-Term Evaluation Report 56
Additional overarching lessons learned include:
- The project also overemphasizes achievement of targets in the DIP, to the detriment of overall implementation quality. For many activities the MTE team found that once a DIP target is reached, project staff have a tendency to move on to the next activity rather than ensure quality follow-up and activity monitoring. We noted in multiple activities, for example, inconsistent follow-up on trainings to ensure that cascade trainings are happening.
- Incentives for project volunteers are inconsistent across activities and sectors. For example, LMs receive very little in terms of incentives for the numerous hours they spend each week working with the women in their group. Literacy instructors, who are also “community volunteers,” receive cash payment for their work. FFW participants in SO1 and SO4 receive food in exchange for the work they do on behalf of their communities. Such discrepancies are well-known among project participants in communities and have led to discouragement, especially for LMs but also for other volunteers such as RECOs. b. General Recommendations
There are a number of overall project recommendations for JENGA II to consider in the remaining two years of the project. There are additionally recommendations that ADRA and partners should bear in mind for similar programming in the future. Recommendations for the remaining two years in JENGA II: 1. Develop a concrete exit strategy/sustainability plan: this document should lay out clearly the
exit/sustainability strategy for each project activity along with the steps and tasks required to achieve the strategy. It should include a timeline and a list of staff responsible for each step/ task, and where relevant, what structure will continue activities after the end of the project. The strategy should also include an analysis at the end of the fourth year of the project to assess the structures responsible for post-project continuation, including current capacities and what additional knowledge and/or materials are required for ensuring sustainability. For example, this would include an assessment of maintenance committees for infrastructure (WASH, road rehabilitation, etc.) to determine their level of functioning and requirements for post-project continuation. Please see Annex Q for a sample exit strategy developed by the CRS-led Multi-Year Assistance Program (MYAP) in Madagascar (shared with the permission of CRS/Madagascar).
2. Document training plans for project beneficiaries and government staff and develop a detailed plan for post-training follow-up. The training plans should include for each type of training: objective; frequency; duration; trainer; participants (number and type); and training follow-up tasks complete with timeline and project staff responsible.
3. Review project activities based on findings and recommendations from SO1-SO4 sections above and identify activities that could be removed or scaled back from Years 4 and 5 of the project (without causing negative repercussions for targeted beneficiary populations).
4. Improve project integration through: - Utilizing multi-sectoral BCC messages across activities in all SOs (see BCC recommendations
below for further details) - Promoting joint field visits by field agent staff across SOs as well as closer collaboration
among SO Coordinators for: developing a concrete exit strategy and improving implementation of cross-cutting themes, including gender, BCC, and environmental compliance
- Improving integration of components within an SO (e.g., Agriculture and Marketing) - Planting trees (SO1, SO4) around capped springs (SO2)
JENGA II Mid-Term Evaluation Report 57
- Incorporating health and nutrition messages into SO1 activities and SO3 women’s group activities
- Finally, for any activities that will still identify new beneficiaries before the end of the project, prioritize HHs that are already participating in other project activities.
Recommendations for future programming: 1. When proposing PM2A, target the number of implementation zones appropriately so as to
ensure the standard blanket feeding approach. 2. Use a more intentional and systematic approach to project integration to maximize impact at
the HH-level. 3. During project start-up, conduct in-depth assessments of local partner institutions to ensure
they can fulfill the roles proposed in the project proposal. Adjust the program accordingly, such as through creating capacity strengthening plans for local partners as necessary, developing alternative means to activity implementation, etc. Any adjustments should strike a balance between immediate programming needs and longer-term sustainability issues (so the project is not simply working around local institutional structures).
c. Program Management Observations and Recommendations
The evaluation team looked at the following aspects of overall program management: o Consortium partnerships and staffing (ADRA, WV, JHU, SMTN) o Operations (including financial management) o Project Documentation and M&E
For each aspect of program management we provide findings according to strengths and weaknesses as well as proposed recommendations. Consortium partnerships and staffing: Strengths:
- The two main implementing partners, ADRA and WV, have an overall positive relationship – for project staff in the DRC as well as for headquarters-based staff in Washington, DC. ADRA and WV have sought to address problems and challenges collaboratively and have worked diligently to harmonize approaches where appropriate.
- Key management positions in both organizations have had continuity, including the overall COP (ADRA), who also managed JENGA I; the WV DFAP Manager, in place for two-and-a-half years; the ADRA Project Finance Manager; the WV Health and Nutrition Coordinator; etc. This type of continuity is extremely important in the EDRC context and helps staff with the shift in mentality from humanitarian to development programming.
- JHU and SMTN have staff based at the ADRA JENGA II project offices (JHU in Uvira and SMTN in Baraka), and both agencies have provided a high level of technical competency in fulfilling their roles (JHU as a project consortium member, SMTN as a sub-contractor). The reports and other deliverables from each agency are generally very well done and of a high quality, illustrating a clear added-value to the project.
- Staff generally seem to have the equipment, materials, experiences and knowledge necessary to do their jobs, with a few exceptions (noted in the weaknesses below).
Weaknesses:
- It is not entirely clear to us the added value of each of the main implementing partners (ADRA and WV) in the consortium, other than the fact that each agency has a distinct geographic operating area and therefore the geographic reach of the project is greater having both agencies in the consortium. In many other programs that the MTE team
JENGA II Mid-Term Evaluation Report 58
members have designed, implemented, or evaluated in which partners implement all activities in distinct geographic areas, the main consortium partners typically split technical leadership roles among the partners (e.g. for SOs, cross-cutting themes, commodity management, M&E, knowledge management, etc.). This was not done in JENGA II and may have led to missed opportunities to leverage organizational strengths of the respective consortium partners, and may have led to some of the issues noted especially for M&E and KM (detailed below). It seems, for instance, that ADRA being the lead agency on the project means that it is assumed to be the lead on all aspects of the project.
- For SO1, ADRA and WV have not signed tri-partite agreements with relevant Ministry of Agriculture (MoA) agencies, including INERA and SENASEM. This has led to a number of challenges with the MoA agencies (related to seed certification, sourcing of goats, etc., explained above under SO1 and SO3), since they are fully aware of the fact that ADRA and WV are working together on the JENGA II project.
- JHU is gathering a significant amount of Operations Research data related to project beneficiary groups. There are a number of limitations, many of which are inherent to this kind of intensive operational research; however, they are worth noting with regard to project implementation :
o Data is only collected in Fizi and Uvira Territories; o Data collection is done by JENGA II staff, and we were told this means that all ADRA
field agents spend two months of each year collecting data for JHU (our understanding is that this is for one month at a time twice during the year to collect data for the two surveys JHU conducts each year);
o It was difficult to ascertain how much the project is using the data collected by JHU to improve activity implementation. For example, after the second survey JHU produced a brief document on their findings (around frequency of feeding and diversity but especially frequency for IYCF) and they also came up with a number of concrete ideas for the BCC in response to these findings. ADRA took these findings and conducted a quick barrier analysis and modified their BCC approach for these messages. This is a great example of what can be done with the findings from the Operations Research, and there are also interesting findings from the WEG HHs, FFS HHs, etc. that could potentially be exploited and used by other SO teams. The findings do not, however, seem to be widely disseminated among project staff – SO Coordinators could not provide a number of the JHU reports, and the only formal mechanism for disseminating findings to project staff is through the annual review when a brief presentation is made on JHU’s work. This seems like a huge missed opportunity.
- For SMTN, there are a number of publications that do not seem to have been put in use by the project (such as the Climate Change Adaptation Strategy, which was finalized in English in February 2014 but has not yet been translated into French). There also seemed to be a perception that since SMTN is working on environmental compliance then ADRA and WV staff do not need to spend time on this project component.
- WV field agent staff in particular lack means of transport for going to the field. WV has a total of four vehicles and 21 motorbikes for around 70 project staff.
- Finance and logistics are understaffed at the project level at both ADRA and WV, which contributes to significant delays in fulfilling program-related requests and making payments to vendors, reimbursing staff, etc.
- The Project Coordination Unit (PCU) has not met regularly for at least the past six months.
JENGA II Mid-Term Evaluation Report 59
Recommendations: 1. Revitalize the PCU meetings and hold on a monthly basis for a period of 3-6 months, especially
to follow-up on the MTE recommendations and decisions that will be made during the upcoming Annual Review. After the 3-6 month period, continue to have the PCU meetings once a quarter.
2. ADRA and WV: Meet together to discuss collaboration with SENASEM and INERA for the remainder of the project period. If possible, it would be worth a slight modification to the WV agreements with SENASEM and INERA so that these are tri-partite agreements.
3. ADRA and JHU: Consider hiring at least some enumerators for data collection during the remaining project period. We realize that project staff are already trained and experienced in collecting the JHU OR data and that this might not be possible for all enumerators, but if the project could hire even a small number of enumerators this would allow some field agents to spend more time following up on activities and planning for and executing the exit strategy. Enumerators that are hired and who perform well could then be used to collect data for the final evaluation.
4. As part of the Knowledge Management plan (see below), develop a document that articulates the purposes and concrete uses of the reports, tools, and other documents being produced by SMTN and JHU.
Operations/Financial Management Strengths:
- To date, all consortium partners have stayed within budget during the project and while we did not conduct a full audit of project finances, it does seem that both ADRA and WV allocate funding appropriately across the four funding sources (202 e, monetization, ITSH, and match).
- Employee salaries are paid in USD, which is a good mechanism for protecting against possible devaluation of the Congolese franc.
- Both ADRA and WV have rigorous supply chain approval and payment procedures in place and these procedures seem to be followed.
Weaknesses: - There are serious delays in the supply chain approval and payment processes; the
underlying causes seem related to project finance and logistics teams being understaffed and in certain cases program requests for supply chain materials being submitted late. The consequences of the delays have included late distribution of seeds for starter packs, late payment of a variety of vendors for project supplies and services, late reimbursement of staff for project-related expenses incurred, etc.
- For ADRA, an inordinate amount of financial risk is concentrated in the Project Financial Manager position, which takes on detailed verification as well as approval of all supply chain requests. The ADRA Finance team is in the process of hiring additional finance staff, which should help spread some of the risk. If the current Project Financial Manager, who we found to be extremely capable, were to leave the position for any reason, the consequences would likely be grave.
- Both ADRA and WV have to submit numerous requests for approval to their offices in Goma, which also contributes to delays in approval processes.
- WV uses petty cash for its sub-office in Minova, and a trip to Goma is required by a staff member to replenish the petty cash allotment (of up to $2,000); this poses potential security problems for the staff member and vehicle driver.
- WV seems severely budget-constrained and has already nearly met or exceeded its budget allocation for certain expense categories (such as travel and transport especially). ADRA has
JENGA II Mid-Term Evaluation Report 60
an acceptable project burn rate but is $1.46 million underspent when considering budget to actuals as of the end of June 2014.
Recommendations: 1. ADRA: Fill the vacant Operations Director position as soon as possible. If the position is going to
remain vacant for a significant amount of time, look to fill the position temporarily with a logistics/operations-focused staff from another country office (with less urgent operations needs), the EDRC country office (in Goma), or headquarters. If the position remains vacant for several months, consider 2-3 month rotations. The project desperately needs someone in Uvira to fulfill this role.
2. ADRA: For one of the current finance openings, consider hiring a more senior national staff finance position. Having a national staff finance person in a deputy manager (or similar) role will allow the Project Finance Manager to hand certain substance-oriented tasks over to a department colleague, rather than simply having an accountant to check numbers and the books.
3. ADRA: The HQ Finance Team should assess the amount of financial risk being placed on the Project Finance Manager position and take additional measures to mitigate the level of risk. (Note: It is the position itself that seems to carry too much risk, regardless of the individual in the position.)
4. WV: Create a full-time logistics position to work exclusively for the JENGA II project. WV logistics staff work across projects and many current WV interventions in EDRC are emergency-focused. WV needs at least one logistician dedicated full-time to JENGA II.
5. WV: Explore possibilities of using financial institutions for cash transfers to Minova greater than $500.
6. Evaluate strategies to improve the efficiency and effectiveness of supply chain processes 7. Continue to raise awareness within both organizations of the supply chain procedures and
expected timelines. 8. ADRA and WV: Conduct monthly meetings in Uvira (ADRA) and Minova (WV) with each
organization’s project management team - the COP (ADRA)/ DFAP Manager (WV), Finance, Logistics, and Program Coordinators to: discuss urgent, short-term, and medium-term supply chain priorities, addressing potential problems and exploring joint solutions.
9. Increase the level of approvals that can be done without being submitted to Goma. For ADRA, the level was recently increased from $2,000 to $5,000. The COP for the project should have greater levels of approval authority. Assuming there are no issues in the first three months with having the $5,000 approval, then ADRA should increase the spending authority level again.
10. HQ Finance and Program management staff at ADRA and WV need to work together to analyze in more detail the underlying reasons for ADRA being underspent and WV often coming close to exceeding its budgetary allocations. Each agency should conduct their own thorough review of the budget allocations for the remaining two years and then discuss the reviews together. If necessary, ADRA and WV can reconsider budgetary allocations for the remaining project period.
Project Documentation and M&E Strengths:
- Participatory annual project review processes to discuss project achievements and challenges have been done in each year of the project thus far.
- Monthly program meetings to analyze achievements of targets for the previous month’s activities.
- HQ and/or regional office technical visits are done and follow-up reports include concrete recommendations for project improvements.
JENGA II Mid-Term Evaluation Report 61
- HQ staff also reported a number of project documentation/ M&E activities that are done, though these were not mentioned during the MTE’s field work:
o Collection of project success stories on a regular basis; o Quarterly meetings with the donor at the HQ and field levels with meeting minutes
shared with project partners - Standardized monitoring forms are used by project staff, seem to be used throughout the
project areas, and collect the essential information such as output indicators and DIP targets (though unfortunately the forms do not collect information on F2F).
- M&E system collects information disaggregated by sex for nearly all relevant indicators. - Monitoring forms do not include very much duplication of information across multiple
forms. - WV has put in place a strong community-based feedback and accountability system (based
on Humanitarian Accountability Partnership (HAP)). - Efforts are being made to gather outcome-level data for a number of project indicators via
the Annual Survey (which has been done in 2013 and 2014). - Field verification visits are conducted using standard forms by both agencies. - ADRA used tablets to collect and report data for the Annual Survey (2014) and the JHU
Operations Research data. Weaknesses:
- The project does not have a site list that includes information on what activities are implemented in every site, or what SOs have activities in every site.
- For activity planning, an in-depth analysis of risks and potential problems was not conducted for all activities, which resulted in an inefficient use of project resources (for example, the late provision of seeds led to low harvests, sourcing of goats not well-suited to many project areas led to high mortality rates, etc.).
- Inconsistent and incomplete project documentation: certain studies that were supposed to be done in the early stages of the project either were not done or were never used to develop project strategies; and certain documents could not be provided upon request (e.g. the project gender strategy, the training curricula for FBAs and for WEGs, etc.).
- As mentioned in the general observations, there is no updated concrete exit strategy/sustainability plan, which should be a critical component of a five-year development intervention.
- There is no systematic documentation for how activities are supposed to be carried out (i.e. activity protocols for each activity – how to implement, target beneficiaries, linkages to other activities within the SO and activities in other SOs, linkages to sustainability and exit, etc.).
- Each of the above weaknesses are exacerbated by staff turnover, especially at the coordinator level.
- While an M&E database in Microsoft Access has been developed for the project, it cannot be described as operational (three years after the project began). The “master version” only has information entered for beneficiary participation in project activities and does not have any information entered from the first three years of data collection from monitoring project activities. Data entry into the Access Database for activity monitoring is supposed to be done by SO Coordinators themselves, yet it is unclear how much data has been entered, and it will take an enormous amount of time for SO Coordinators to enter all of the data themselves.
- As a result of the database delays, the project has significant amounts of information being collected but little information actually being analyzed. Data seems to be used for reporting purposes only.
JENGA II Mid-Term Evaluation Report 62
- There are a number of questions about the reliability of the data being collected. For this evaluation, the team reviewed the quantitative reports from the project as a means of triangulating findings from the qualitative information collected during MTE fieldwork and to confirm that the M&E system was providing reliable data. As we explored some of the details of the various reports and quantitative information available for the project, it was a real challenge to interpret the data because there were so many questions about or inconsistencies in the data. Annex F provides further detail regarding the main issues that we noted in our review of JENGA II quantitative information, and those issues were categorized at three main levels: 1) Sampling and the Overall M&E System; 2) Outcome Indicators Measured through the Annual Survey Report; and 3) Output Indicators. A summary of key points from Annex F includes:
o For sampling and the overall system: the project IPTT does not appropriately distinguish between ‘target population’ (all HHs in targeted project villages) and ‘beneficiary population’ (all project beneficiary HHs). There are numerous outcome-level indicators in the IPTT that included ‘beneficiary population’ and ‘target population’ baseline data, but the baseline survey used a target population based two-staged cluster sample. For LOA targets, many indicators also have ‘population-based’ targets, yet the final evaluation will be conducted using a target population-based survey (to be comparable to the baseline). As a result it is unclear how the project will measure ‘beneficiary population’ data through the final evaluation. Finally, the Annual Surveys use beneficiary population-based sampling but there is no explanation or recognition in the IPTT that Annual Survey data is based on a beneficiary-only sample. There are a number of indicators that are supposed to be measured at a “target population” level that are being measured and reported on in the IPTT based on Annual Survey results. In summary, the IPTT does not accurately address the distinctions between target population and beneficiary population for many of the project indicators.
o For outcome indicators, the information is collected during the Annual Surveys and there are a number of data points for certain indicators when looking at the baseline and the Annual Surveys from 2013 and 2014 that are difficult to understand – such as volume of agricultural produce sold for a number of the project’s target crops and significant changes in crop yields (increases and decreases depending on the crop) from year to year, among others. There are other inconsistencies between findings reported in the Annual Survey Report and what is provided in the IPTT.
o For output indicators, the majority of the information is collected through standard monitoring forms, but certain information is reported on verbally by project participants and volunteers (LMs and FFS participants, for instance); we additionally had significant difficulties getting up-to-date DIPs with achievements through the end of project Year 3 (i.e. 30 June 2014) and we were informed during a site visit that a section of canal that was reported as being fully completed was only about 40% complete. We were finally provided on 31 August 2014 with a fully completed project DIP through Project Year 3 but did not have a chance to review this updated DIP in detail and compare to previous versions we received. These issues, combined with the lack of an operational project-level database, raise serious concerns about data reliability.
- Field verification visits are not systematic/routinized. - ADRA has a project ‘audit’ function with an overall manager and a number of audit agents
but does not have a formal community feedback / accountability system in place.
JENGA II Mid-Term Evaluation Report 63
Recommendations – Project Documentation: 1. Clarify responsibilities within project teams, particularly between M&E and management staff
and between organizations, for ensuring that documentation of project strategies are available and for documenting and sharing lessons learned. If necessary, consider the addition of a program officer-type position that would be focused on knowledge management for the entire project.
2. Prepare a comprehensive document list for the project, to include: 1) documents that are available, where they are located and language; 2) additional project documents that are needed (concrete sustainability and exit plan; any missing training curricula; activity protocols; etc.). For each document identify how it should be used and if it is in use. For activity protocols, see Annex R for a proposed activity protocol template that JENGA II could use or adapt. We also provided with the Draft MTE Report two activity protocol examples from the SALOHI MYAP.
3. Prepare an action plan, including timeline and prioritization, for essential documents that are not yet developed.
4. Ensure proper archiving and utilization of project documents. Recommendations – M&E: For the remaining two years of JENGA II: 1. Revise the current IPTT and indicator targets to make a clear distinction between indicators
and target levels measuring target population and those measuring beneficiary population. For any indicators that are using the baseline and final evaluations as start and end-points, the LOA target should be at the target population level. For indicators that are also reported on using the Annual Survey, these should include a target population baseline and LOA figures, along with annual figures (targets and achievements) based on beneficiary population.
2. Conduct immediately a detailed internal data quality assessment or audit for ADRA and WV project data as recommended in the May 2013 USAID Data Quality Assessment Report. Review the project’s master Excel file, the DIPs and IPTTs from 2012, 2013 and 2014. Identify any discrepancies in the DIP and look at traceability for each/ every indicator. After the initial assessment or audit, put in place a plan for additional data assessments or audits every six months until the end of the project.
3. Conduct a thorough review of the 2014 Annual Survey data to look for anomalies or irregularities in the data. The review should be done collaboratively among ADRA and WV HQ, JENGA II Management, JENGA II M&E Staff, and Annual Survey Enumerators. Output of review should include concrete recommendations for resolving data collection and data viability issues for the 2015 Annual Survey. If the data issues cannot be resolved, then JENGA II should reconsider the value of proceeding with the 2015 Annual Survey.
4. ADRA: Establish a formal community-level feedback and complaints system 5. Make a decision related to the project level database to use. Even without an operational
database for JENGA II, ADRA moved forward over the past year with setting up a separate Cloud-based database using “Data Winners” software. Using handheld tablets, data can be directly entered and stored in the Cloud. The Data Winners database includes a summary of the data provided on the activity monitoring forms, whereas for the Access database all data from the monitoring form must be entered into Access. Currently ADRA is trying to have all data entered into both the Access database and the Data Winners database, which will likely result in neither database ever being fully functional with all project data. WV, meanwhile, is not using the Cloud/ Data Winners. We would therefore recommend the following:
- Switch to using the Cloud/Data Winners database across the project. This will require investment in purchasing tablets by WV and further training for staff in using the tablets but these investments would likely be offset by the time (and financial) resources required to enter all project data into the Access database. We also realize there has
JENGA II Mid-Term Evaluation Report 64
been substantial investment in the Access database to date but if the project moves forward with the Cloud, the investments in Access should be seen as a sunk cost. An updated timeline for having all data from both partners entered into the Cloud/ Data Winners Database would also be needed.
- If ADRA and WV cannot agree on both agencies moving forward with the Cloud/Data Winners database and continue to use the Access database, a revised timeline must be put in place for having all project data to date entered into Access (and this must be in the very near future). The project would also need to find a way to hire day workers to enter data as it is unrealistic and unreasonable to require SO Coordinators to do all the data entry. If the project continues with Access, then the Cloud/ Data Winners can continue to be used for the Annual Surveys (as was done for the 2014 Annual Survey) and the JHU data collection. In addition, ADRA could select a small number of activities to for which data can be entered into the Cloud/ Data Winners Database as a sort of pilot for potential future use of the Cloud/ Data Winners across an entire project.
- Continue discussions with Data Winners as to the feasibility of connecting the Data Winners database with the Access database.
For future projects: 1. Make more explicit from the outset the difference between target population and beneficiary
population indicators and data. Think about project-level impact and what is important to look at for community-level impact and beneficiary HH-level impacts.
2. Put in place an efficient system for being able to enter project data and produce timely reports on monitoring data. This should be done in the first six months of a five-year project.
3. Annual Surveys: Consider Lot Quality Assurance (LQAS) or Knowledge Practice Coverage (KPC)-type surveys that are much smaller investments than a full-blown Annual Survey but can still yield very useful information on project progress at the outcome level.
4. In project M&E tools and documents (such as the PMP, the PIRS, etc.), be explicit and completely consistent especially about the data source for each and every indicator. In the JENGA II PMP, for example, some indicators appropriately note “households in targeted area,” or “targeted farmers,” whereas other indicators state simply “farmers” (such as the indicator for volumes sold in the PMP, whereas the actual target group for this indicator is farmer members of FBAs (rather than all farmers)). This type of inconsistency can cause confusion.
5. Elaborate a project-level learning agenda and analysis, which should be based on the IPTT, Results Framework, and findings from Formative Research conducted in the early stages of the project. The learning agenda and analysis plan should focus on a small number of questions deemed important to try and respond to during the life of the project, which can then be used to guide how M&E and research-related resources can best be allocated, including for Operations Research, Annual Surveys, other qualitative studies that could be useful in the project target areas, etc.
d. Cross-cutting Themes
i. BCC Findings The project is using a variety of channels for behavior change communication (BCC) including radio programs; posters and billboards; demonstrations; literacy classes; community-wide meetings; and most commonly, one-on-one interpersonal communication, often enhanced by sturdy portable flipcharts (“boîtes à images”). SO1, for example relies on demonstrations at FFS and interpersonal communication for the F2F program. Examples of communication aids include the flipcharts WV uses for teaching the management of BXW and CMD.
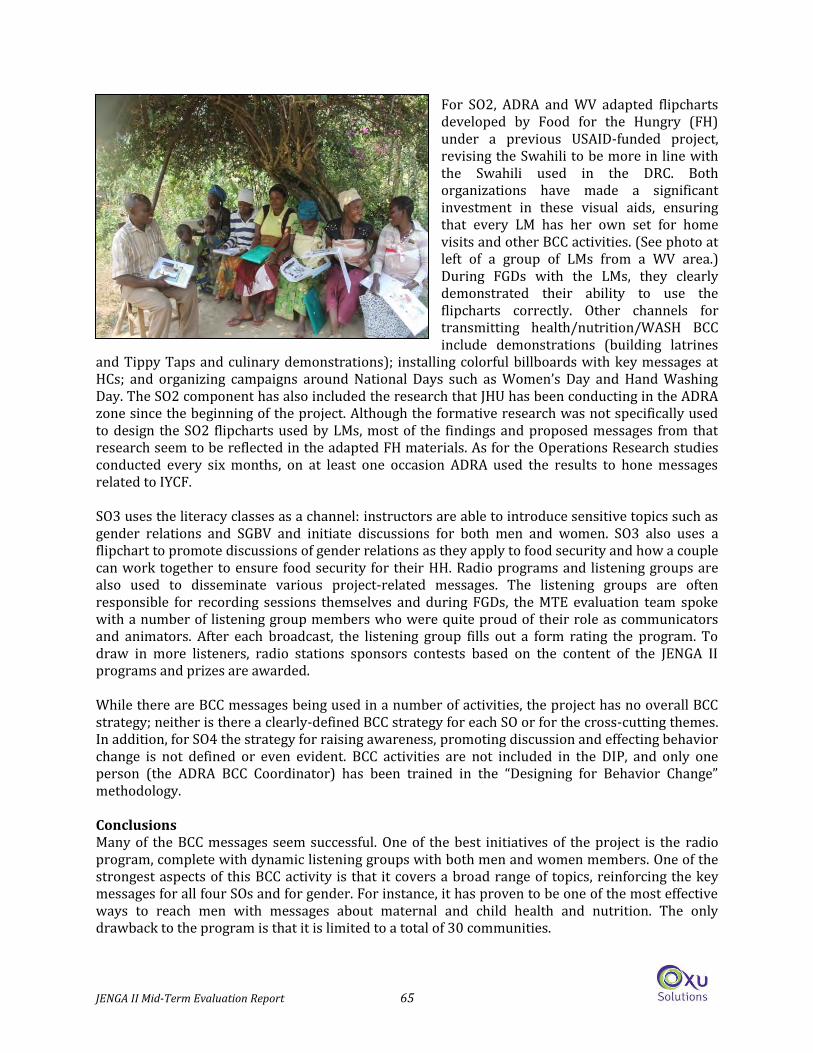
JENGA II Mid-Term Evaluation Report 65
For SO2, ADRA and WV adapted flipcharts developed by Food for the Hungry (FH) under a previous USAID-funded project, revising the Swahili to be more in line with the Swahili used in the DRC. Both organizations have made a significant investment in these visual aids, ensuring that every LM has her own set for home visits and other BCC activities. (See photo at left of a group of LMs from a WV area.) During FGDs with the LMs, they clearly demonstrated their ability to use the flipcharts correctly. Other channels for transmitting health/nutrition/WASH BCC include demonstrations (building latrines
and Tippy Taps and culinary demonstrations); installing colorful billboards with key messages at HCs; and organizing campaigns around National Days such as Women’s Day and Hand Washing Day. The SO2 component has also included the research that JHU has been conducting in the ADRA zone since the beginning of the project. Although the formative research was not specifically used to design the SO2 flipcharts used by LMs, most of the findings and proposed messages from that research seem to be reflected in the adapted FH materials. As for the Operations Research studies conducted every six months, on at least one occasion ADRA used the results to hone messages related to IYCF. SO3 uses the literacy classes as a channel: instructors are able to introduce sensitive topics such as gender relations and SGBV and initiate discussions for both men and women. SO3 also uses a flipchart to promote discussions of gender relations as they apply to food security and how a couple can work together to ensure food security for their HH. Radio programs and listening groups are also used to disseminate various project-related messages. The listening groups are often responsible for recording sessions themselves and during FGDs, the MTE evaluation team spoke with a number of listening group members who were quite proud of their role as communicators and animators. After each broadcast, the listening group fills out a form rating the program. To draw in more listeners, radio stations sponsors contests based on the content of the JENGA II programs and prizes are awarded. While there are BCC messages being used in a number of activities, the project has no overall BCC strategy; neither is there a clearly-defined BCC strategy for each SO or for the cross-cutting themes. In addition, for SO4 the strategy for raising awareness, promoting discussion and effecting behavior change is not defined or even evident. BCC activities are not included in the DIP, and only one person (the ADRA BCC Coordinator) has been trained in the “Designing for Behavior Change” methodology. Conclusions Many of the BCC messages seem successful. One of the best initiatives of the project is the radio program, complete with dynamic listening groups with both men and women members. One of the strongest aspects of this BCC activity is that it covers a broad range of topics, reinforcing the key messages for all four SOs and for gender. For instance, it has proven to be one of the most effective ways to reach men with messages about maternal and child health and nutrition. The only drawback to the program is that it is limited to a total of 30 communities.
JENGA II Mid-Term Evaluation Report 66
In SO2, providing flipcharts to every LM greatly facilitates the LMs’ work, and JENGA II is one of the rare projects to make this investment. Some of the more creative BCC methods can be found in the SO3 activities. At the same time, the lack of an overall BCC strategy for the project leads to a number of limitations to achieving greater BCC impact. For example, there seems to be very little attempt to use methods such as barrier analysis to determine why certain practices and behaviors are not adopted (other than one or two examples from SO2). There are also missed opportunities to include BCC in many project activities such as FFW interventions and food distributions. Some BCC is carried out during the PM2A distributions but much of the time the focus seems to be on reminding people about the correct ration size and how to prepare the CSB. There are also missed opportunities to carry out BCC in public venues such as markets and other gatherings. (The WV SO3 Coordinator is proposing to use football matches as a venue to reach men and boys.) Further, more could be done to tailor communication activities to men, especially for gender discussions and for family health. Other than literacy classes for men, most of the BCC activities around gender are directed to women. Finally, there appears to be no concerted attempt to integrate messages from one SO to another or to ensure that cross-cutting themes such as gender are included in all four SOs. The FFS, for instance, include little if any nutritional messages in their curriculum and gender is a theme that could be incorporated into all components. Recommendations 1. Prepare a document describing the BCC methods currently being used including such topics as
agents (who delivers the messages), channels, key messages for each SO, resource materials (e.g., flipcharts) and lessons learned to date on what has proven effective. (Although it is too late in the project to invest resources in developing a comprehensive BCC strategy, this descriptive document will be useful to those who want to know what the project did to effect change.)
2. M&E teams and BCC Coordinator: Revise the DIP to include the BCC activities so that they can be monitored.
3. If resources are available: Conduct at least one barrier analysis or similar exercise for a behavior or practice for each SO. Share the findings with field agents and work with them to adjust the messages and target groups.
4. If resources are limited: Have each LM work with a small group of women to identify barriers to one or more behaviors and ways to overcome the barriers. Bring the LMs together to discuss their findings and adjust messages and channels based on their suggestions. The same exercise could be carried out by other SO teams.
5. Select three to five key messages that can be disseminated by all project teams across SOs. Topics might include a gender message, a message on the importance of a diversified diet for young children, a communication related to environmental protection, etc. In WV areas a message related to addressing BXW would be appropriate.
6. Develop strategies to discuss gender and family health topics with men, complementing the messages already communicated to women.
7. Use public venues such as markets for demonstrations and exhibits (e.g., improved varieties with better yields, a Tippy Tap, etc.) to disseminate messages.
8. Explore using religious leaders as BCC “agents” by incorporating messages around themes such as responsible parenthood and working together as a couple into church gatherings.
JENGA II Mid-Term Evaluation Report 67
ii. Gender Findings For all SOs, the majority of direct project beneficiaries are women. Men also participate in the activities, especially for SO1, SO3 and SO4. Women and men both participate in groups created by the project (including CEWSC, WEG, CARG, FFS, CDCs, etc.); though the exception is the CGs in which only women participate. While it seems that staff have tried to take into account the needs of both women and men in project activities, there has not been a comprehensive gender analysis and strategy to guide activity implementation. There has been an effort to train staff and beneficiaries of all SOs on gender issues, especially its impact on food security, and many beneficiaries from S01, SO2, SO3 and SO4 could mention one or two concepts related to gender. However, neither ADRA nor WV has a plan for gender training and there are no clear numbers about how many beneficiaries have been trained in gender-related topics. Most M&E forms are, however, disaggregated by sex for activities targeting men and women (except for literacy). Finally, there is limited organizational effort to promote gender equality and equity internally: - Few staff are aware of their organization’s gender policies - The vast majority of staff are men as female staff represent only 10% of the total project staff. Conclusions The project has made considerable efforts to address the practical needs of women by increasing access to productive resources, increasing access to water, reducing workload and improving nutritional status of women and children. The project also addresses the strategic needs of women by challenging norms and practices that discriminate against women by supporting gender awareness-raising and attempting to increase women’s decision-making control and power. The lack of a concrete gender analysis and subsequent strategy has resulted in many activities not taking a gender-sensitive approach – e.g. food distributions for PLW and young children take the whole day; some ACCs have been constructed in locations that are far from beneficiaries, requiring men and women to walk long distances carrying heavy loads, etc. Finally, there is a serious gender imbalance for the project at all staff levels: field, coordination and management. While the MTE team is sensitive to personal safety issues for women in particular in the EDRC context and we understand that EDRC is a male-dominated society, if ADRA and WV are concerned about women’s empowerment and gender equity in their programs, then these values then should be reflected by internal organizational practice. Recommendations 1. Integrate gender analysis into the development of the exit strategy to ensure that needs,
constraints and opportunities of women and men are taken into account. 2. Develop and document a plan for gender training for staff (both new and veteran) and
beneficiaries. 3. WV and ADRA: Take significant steps to promote gender equality and equity:
- Increase the awareness of staff on organizational gender policy; - Think deeply, creatively, and critically about how to put in place strategies that are tailored
to women’s needs and men’s needs in the EDRC context and that ensure that women and men are not exposed to safety risks;
- Increase the female proportion of the project staff. Measures could include setting a quota for recruitment, providing adequate maternity leave, providing special trainings;
JENGA II Mid-Term Evaluation Report 68
appropriate transport, creating professional opportunities for students and young female graduates, and recruiting more widely by using the Web;
- Ensure there is a gender focal person in each organization to follow up on gender issues, with these responsibilities detailed in the staff member’s job description.
4. Check all data collection tools to ensure they allow disaggregating information by sex.
iii. Environmental Compliance Findings ADRA signed an agreement with SMTN for the provision of environmental and risk management support for the implementation of JENGA II. The contract is on a yearly renewable basis, ending June 30 of each year. SMTN completes much of its work through its staff member based in the JENGA II office in Baraka. Many of the deliverables that have been completed to date are detailed in the table below. Table 4: SMTN Achievements 2011-2014
The current year’s contract focuses on: Environmental Mitigation Monitoring Plan (EMMP) monitoring, GIS training, emergency simulation, and definition of strategies to better support JENGA II activities. During the proposal phase, SMTN prepared the Initial Environmental Examination (IEE), which was revised by ADRA before its submission to FFP. In the IEE that gained USAID approval, we noted the following: i) Categorical Exclusion has been obtained for activities such as training, PM2A, credit, etc.; ii) a Negative Determination was recommended for irrigation and drainage construction and rehabilitation activities; iii) a Negative Determination with Conditions was recommended for road rehabilitation activities and a number of other project activities (a total of 20 activities were recommended for negative determination with conditions). The Environmental Status Report (ESR), in response to the recommended Negative Determination with Conditions, identifies direct impacts such as erosion, damage to ecologically sensitive areas, and material sourcing/borrow pits
Provide training to JENGA II staff on environmental and disaster risk management to comply with USAID Reg.216.
Completed
Integrate EMMP into the IPTT and program monitoring and evaluation activities and systems. Completed
Produce an environmental handbook with checklists for the tracked mitigation components to be measured, for use by field agents.
Completed
Produce a threats and vulnerabilities analysis. Completed
Environmental Impact Assessment Completed
Complete Refresher training on environmental/risk management and M&E reporting systems. Completed
Develop community capacity building tools for emergency early warning systems and planning. Completed
Prepare and present a manual for risk mitigation strategies to support Community Early Warning Systems and JENGA II’s resiliency efforts.
Completed
Prepare a Climate Change Assessment and Strategy based on a review of predicted climate change and its risks to project activities and objectives.
Completed
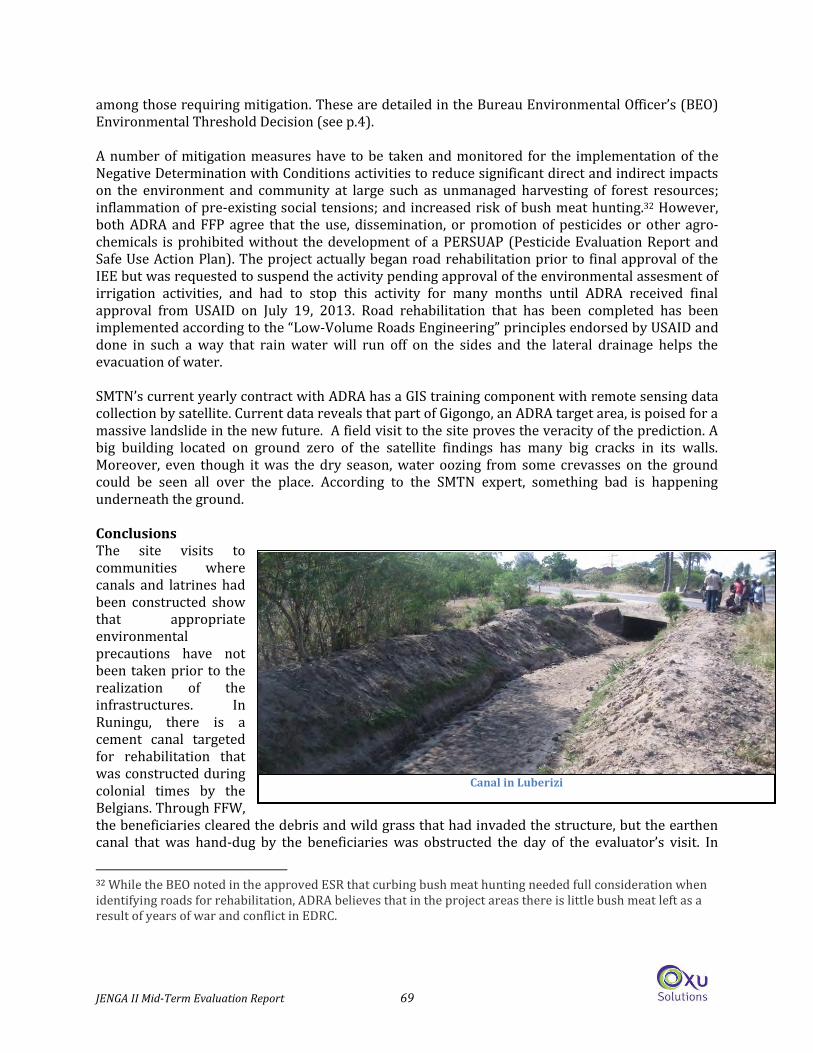
JENGA II Mid-Term Evaluation Report 69
among those requiring mitigation. These are detailed in the Bureau Environmental Officer’s (BEO) Environmental Threshold Decision (see p.4). A number of mitigation measures have to be taken and monitored for the implementation of the Negative Determination with Conditions activities to reduce significant direct and indirect impacts on the environment and community at large such as unmanaged harvesting of forest resources; inflammation of pre-existing social tensions; and increased risk of bush meat hunting.32 However, both ADRA and FFP agree that the use, dissemination, or promotion of pesticides or other agro-chemicals is prohibited without the development of a PERSUAP (Pesticide Evaluation Report and Safe Use Action Plan). The project actually began road rehabilitation prior to final approval of the IEE but was requested to suspend the activity pending approval of the environmental assesment of irrigation activities, and had to stop this activity for many months until ADRA received final approval from USAID on July 19, 2013. Road rehabilitation that has been completed has been implemented according to the “Low-Volume Roads Engineering” principles endorsed by USAID and done in such a way that rain water will run off on the sides and the lateral drainage helps the evacuation of water. SMTN’s current yearly contract with ADRA has a GIS training component with remote sensing data collection by satellite. Current data reveals that part of Gigongo, an ADRA target area, is poised for a massive landslide in the new future. A field visit to the site proves the veracity of the prediction. A big building located on ground zero of the satellite findings has many big cracks in its walls. Moreover, even though it was the dry season, water oozing from some crevasses on the ground could be seen all over the place. According to the SMTN expert, something bad is happening underneath the ground. Conclusions The site visits to communities where canals and latrines had been constructed show that appropriate environmental precautions have not been taken prior to the realization of the infrastructures. In Runingu, there is a cement canal targeted for rehabilitation that was constructed during colonial times by the Belgians. Through FFW, the beneficiaries cleared the debris and wild grass that had invaded the structure, but the earthen canal that was hand-dug by the beneficiaries was obstructed the day of the evaluator’s visit. In
32 While the BEO noted in the approved ESR that curbing bush meat hunting needed full consideration when identifying roads for rehabilitation, ADRA believes that in the project areas there is little bush meat left as a result of years of war and conflict in EDRC.
Canal in Luberizi
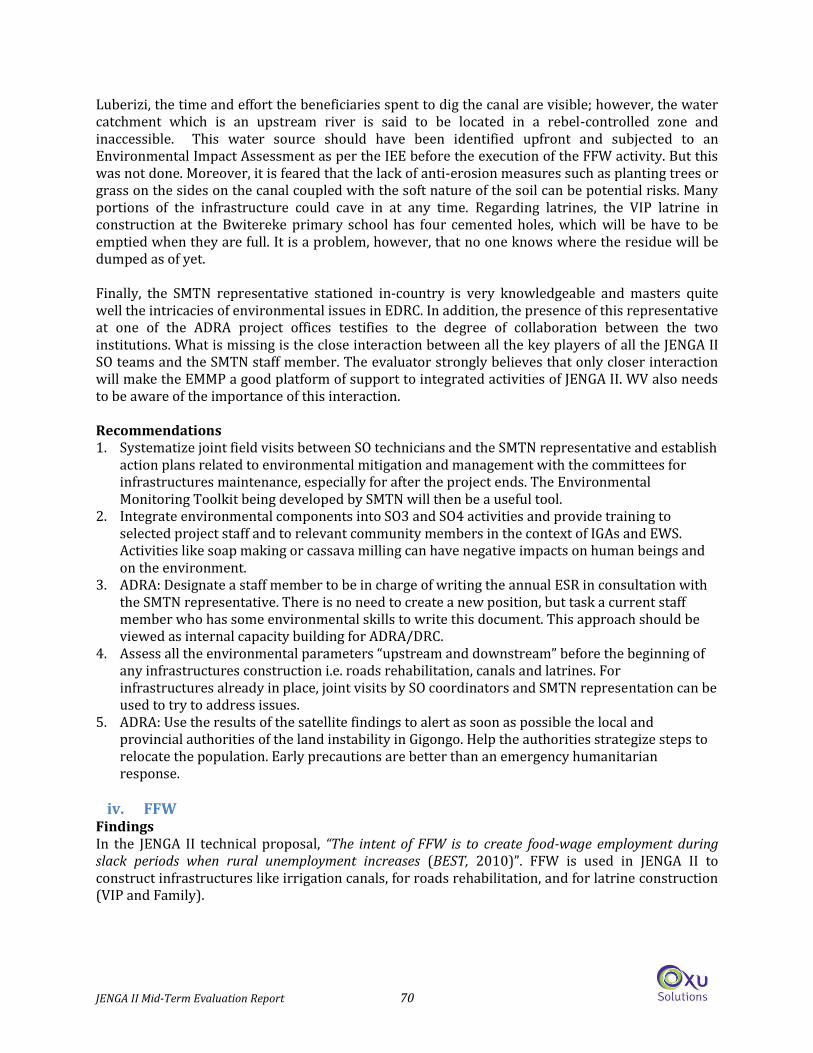
JENGA II Mid-Term Evaluation Report 70
Luberizi, the time and effort the beneficiaries spent to dig the canal are visible; however, the water catchment which is an upstream river is said to be located in a rebel-controlled zone and inaccessible. This water source should have been identified upfront and subjected to an Environmental Impact Assessment as per the IEE before the execution of the FFW activity. But this was not done. Moreover, it is feared that the lack of anti-erosion measures such as planting trees or grass on the sides on the canal coupled with the soft nature of the soil can be potential risks. Many portions of the infrastructure could cave in at any time. Regarding latrines, the VIP latrine in construction at the Bwitereke primary school has four cemented holes, which will be have to be emptied when they are full. It is a problem, however, that no one knows where the residue will be dumped as of yet. Finally, the SMTN representative stationed in-country is very knowledgeable and masters quite well the intricacies of environmental issues in EDRC. In addition, the presence of this representative at one of the ADRA project offices testifies to the degree of collaboration between the two institutions. What is missing is the close interaction between all the key players of all the JENGA II SO teams and the SMTN staff member. The evaluator strongly believes that only closer interaction will make the EMMP a good platform of support to integrated activities of JENGA II. WV also needs to be aware of the importance of this interaction. Recommendations 1. Systematize joint field visits between SO technicians and the SMTN representative and establish
action plans related to environmental mitigation and management with the committees for infrastructures maintenance, especially for after the project ends. The Environmental Monitoring Toolkit being developed by SMTN will then be a useful tool.
2. Integrate environmental components into SO3 and SO4 activities and provide training to selected project staff and to relevant community members in the context of IGAs and EWS. Activities like soap making or cassava milling can have negative impacts on human beings and on the environment.
3. ADRA: Designate a staff member to be in charge of writing the annual ESR in consultation with the SMTN representative. There is no need to create a new position, but task a current staff member who has some environmental skills to write this document. This approach should be viewed as internal capacity building for ADRA/DRC.
4. Assess all the environmental parameters “upstream and downstream” before the beginning of any infrastructures construction i.e. roads rehabilitation, canals and latrines. For infrastructures already in place, joint visits by SO coordinators and SMTN representation can be used to try to address issues.
5. ADRA: Use the results of the satellite findings to alert as soon as possible the local and provincial authorities of the land instability in Gigongo. Help the authorities strategize steps to relocate the population. Early precautions are better than an emergency humanitarian response.
iv. FFW
Findings In the JENGA II technical proposal, “The intent of FFW is to create food-wage employment during slack periods when rural unemployment increases (BEST, 2010)”. FFW is used in JENGA II to construct infrastructures like irrigation canals, for roads rehabilitation, and for latrine construction (VIP and Family).
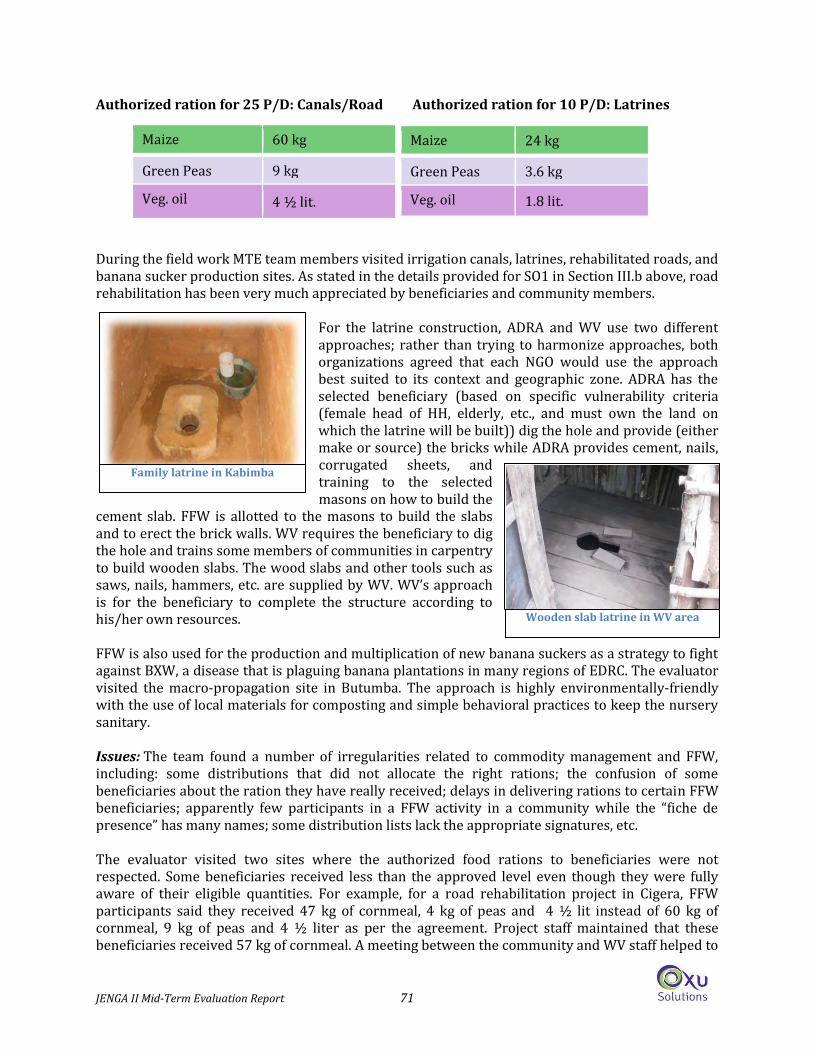
JENGA II Mid-Term Evaluation Report 71
Authorized ration for 25 P/D: Canals/Road Authorized ration for 10 P/D: Latrines During the field work MTE team members visited irrigation canals, latrines, rehabilitated roads, and banana sucker production sites. As stated in the details provided for SO1 in Section III.b above, road rehabilitation has been very much appreciated by beneficiaries and community members.
For the latrine construction, ADRA and WV use two different approaches; rather than trying to harmonize approaches, both organizations agreed that each NGO would use the approach best suited to its context and geographic zone. ADRA has the selected beneficiary (based on specific vulnerability criteria (female head of HH, elderly, etc., and must own the land on which the latrine will be built)) dig the hole and provide (either make or source) the bricks while ADRA provides cement, nails, corrugated sheets, and training to the selected masons on how to build the
cement slab. FFW is allotted to the masons to build the slabs and to erect the brick walls. WV requires the beneficiary to dig the hole and trains some members of communities in carpentry to build wooden slabs. The wood slabs and other tools such as saws, nails, hammers, etc. are supplied by WV. WV’s approach is for the beneficiary to complete the structure according to his/her own resources. FFW is also used for the production and multiplication of new banana suckers as a strategy to fight against BXW, a disease that is plaguing banana plantations in many regions of EDRC. The evaluator visited the macro-propagation site in Butumba. The approach is highly environmentally-friendly with the use of local materials for composting and simple behavioral practices to keep the nursery sanitary. Issues: The team found a number of irregularities related to commodity management and FFW, including: some distributions that did not allocate the right rations; the confusion of some beneficiaries about the ration they have really received; delays in delivering rations to certain FFW beneficiaries; apparently few participants in a FFW activity in a community while the “fiche de presence” has many names; some distribution lists lack the appropriate signatures, etc. The evaluator visited two sites where the authorized food rations to beneficiaries were not respected. Some beneficiaries received less than the approved level even though they were fully aware of their eligible quantities. For example, for a road rehabilitation project in Cigera, FFW participants said they received 47 kg of cornmeal, 4 kg of peas and 4 ½ lit instead of 60 kg of cornmeal, 9 kg of peas and 4 ½ liter as per the agreement. Project staff maintained that these beneficiaries received 57 kg of cornmeal. A meeting between the community and WV staff helped to
Maize 60 kg
Green Peas 9 kg
Veg. oil 4 ½ lit.
Maize 24 kg
Green Peas 3.6 kg
Veg. oil 1.8 lit.
Family latrine in Kabimba
Wooden slab latrine in WV area
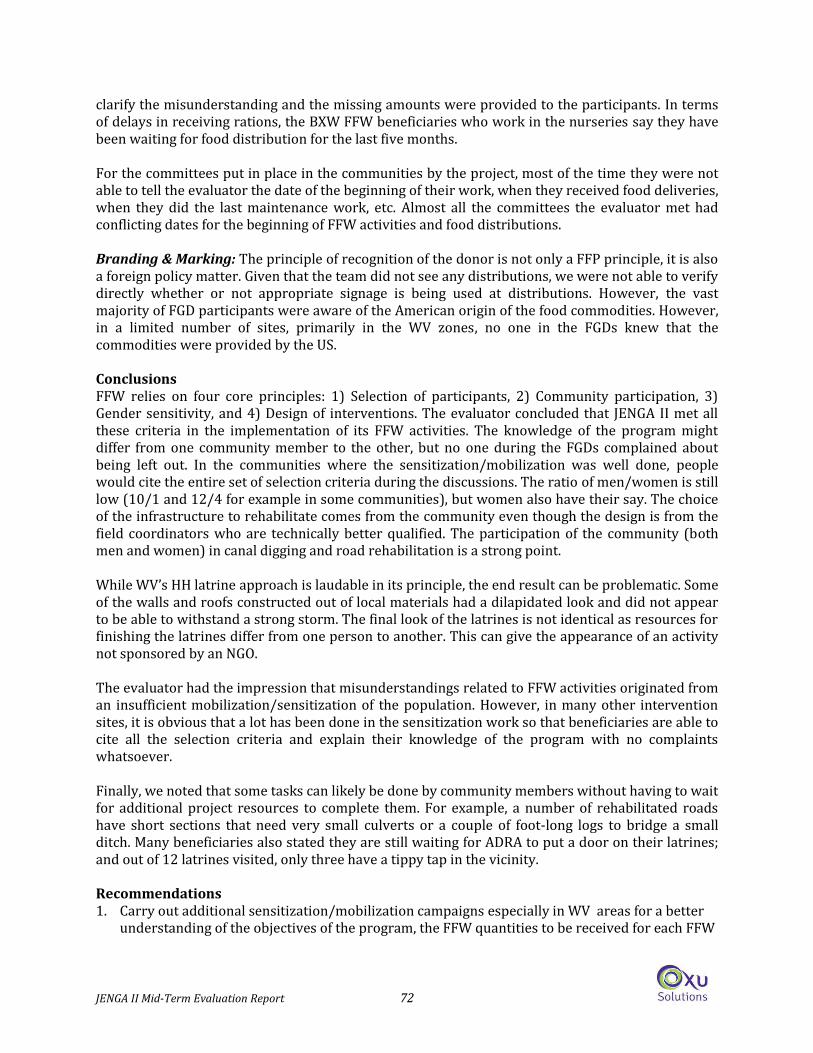
JENGA II Mid-Term Evaluation Report 72
clarify the misunderstanding and the missing amounts were provided to the participants. In terms of delays in receiving rations, the BXW FFW beneficiaries who work in the nurseries say they have been waiting for food distribution for the last five months. For the committees put in place in the communities by the project, most of the time they were not able to tell the evaluator the date of the beginning of their work, when they received food deliveries, when they did the last maintenance work, etc. Almost all the committees the evaluator met had conflicting dates for the beginning of FFW activities and food distributions. Branding & Marking: The principle of recognition of the donor is not only a FFP principle, it is also a foreign policy matter. Given that the team did not see any distributions, we were not able to verify directly whether or not appropriate signage is being used at distributions. However, the vast majority of FGD participants were aware of the American origin of the food commodities. However, in a limited number of sites, primarily in the WV zones, no one in the FGDs knew that the commodities were provided by the US. Conclusions FFW relies on four core principles: 1) Selection of participants, 2) Community participation, 3) Gender sensitivity, and 4) Design of interventions. The evaluator concluded that JENGA II met all these criteria in the implementation of its FFW activities. The knowledge of the program might differ from one community member to the other, but no one during the FGDs complained about being left out. In the communities where the sensitization/mobilization was well done, people would cite the entire set of selection criteria during the discussions. The ratio of men/women is still low (10/1 and 12/4 for example in some communities), but women also have their say. The choice of the infrastructure to rehabilitate comes from the community even though the design is from the field coordinators who are technically better qualified. The participation of the community (both men and women) in canal digging and road rehabilitation is a strong point. While WV’s HH latrine approach is laudable in its principle, the end result can be problematic. Some of the walls and roofs constructed out of local materials had a dilapidated look and did not appear to be able to withstand a strong storm. The final look of the latrines is not identical as resources for finishing the latrines differ from one person to another. This can give the appearance of an activity not sponsored by an NGO. The evaluator had the impression that misunderstandings related to FFW activities originated from an insufficient mobilization/sensitization of the population. However, in many other intervention sites, it is obvious that a lot has been done in the sensitization work so that beneficiaries are able to cite all the selection criteria and explain their knowledge of the program with no complaints whatsoever. Finally, we noted that some tasks can likely be done by community members without having to wait for additional project resources to complete them. For example, a number of rehabilitated roads have short sections that need very small culverts or a couple of foot-long logs to bridge a small ditch. Many beneficiaries also stated they are still waiting for ADRA to put a door on their latrines; and out of 12 latrines visited, only three have a tippy tap in the vicinity. Recommendations 1. Carry out additional sensitization/mobilization campaigns especially in WV areas for a better
understanding of the objectives of the program, the FFW quantities to be received for each FFW
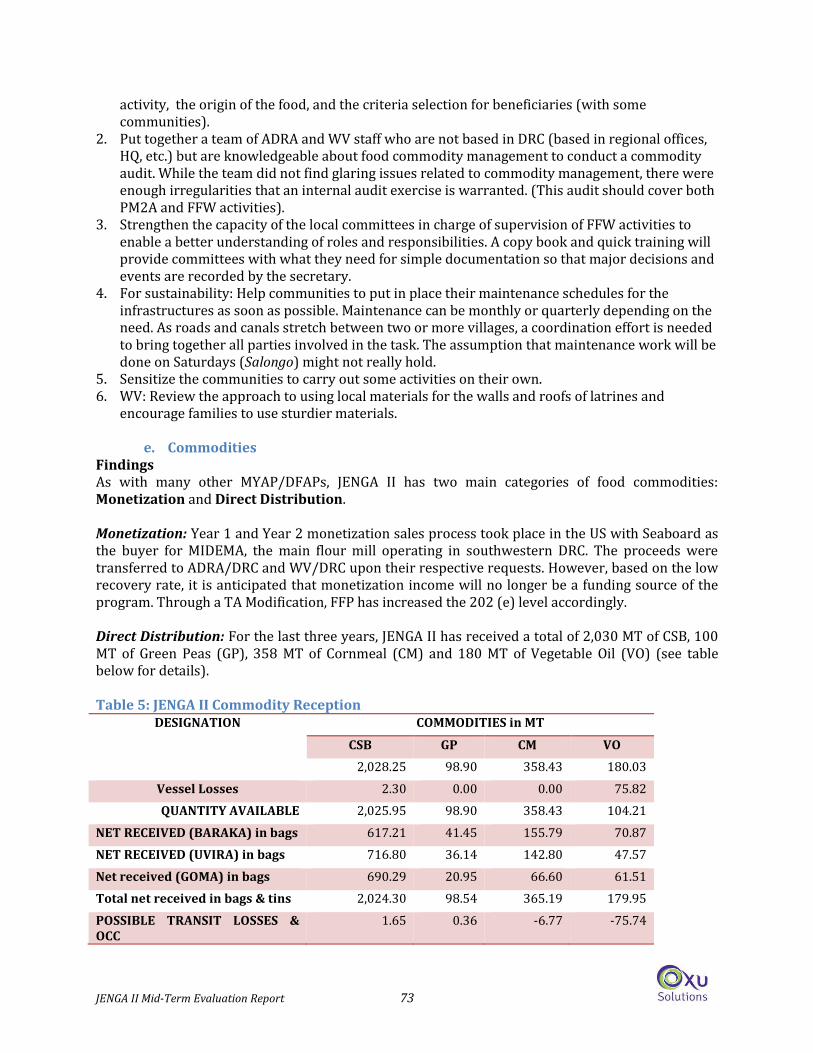
JENGA II Mid-Term Evaluation Report 73
activity, the origin of the food, and the criteria selection for beneficiaries (with some communities).
2. Put together a team of ADRA and WV staff who are not based in DRC (based in regional offices, HQ, etc.) but are knowledgeable about food commodity management to conduct a commodity audit. While the team did not find glaring issues related to commodity management, there were enough irregularities that an internal audit exercise is warranted. (This audit should cover both PM2A and FFW activities).
3. Strengthen the capacity of the local committees in charge of supervision of FFW activities to enable a better understanding of roles and responsibilities. A copy book and quick training will provide committees with what they need for simple documentation so that major decisions and events are recorded by the secretary.
4. For sustainability: Help communities to put in place their maintenance schedules for the infrastructures as soon as possible. Maintenance can be monthly or quarterly depending on the need. As roads and canals stretch between two or more villages, a coordination effort is needed to bring together all parties involved in the task. The assumption that maintenance work will be done on Saturdays (Salongo) might not really hold.
5. Sensitize the communities to carry out some activities on their own. 6. WV: Review the approach to using local materials for the walls and roofs of latrines and
encourage families to use sturdier materials.
e. Commodities Findings As with many other MYAP/DFAPs, JENGA II has two main categories of food commodities: Monetization and Direct Distribution. Monetization: Year 1 and Year 2 monetization sales process took place in the US with Seaboard as the buyer for MIDEMA, the main flour mill operating in southwestern DRC. The proceeds were transferred to ADRA/DRC and WV/DRC upon their respective requests. However, based on the low recovery rate, it is anticipated that monetization income will no longer be a funding source of the program. Through a TA Modification, FFP has increased the 202 (e) level accordingly. Direct Distribution: For the last three years, JENGA II has received a total of 2,030 MT of CSB, 100 MT of Green Peas (GP), 358 MT of Cornmeal (CM) and 180 MT of Vegetable Oil (VO) (see table below for details). Table 5: JENGA II Commodity Reception
DESIGNATION COMMODITIES in MT
CSB GP CM VO
2,028.25 98.90 358.43 180.03
Vessel Losses 2.30 0.00 0.00 75.82
QUANTITY AVAILABLE 2,025.95 98.90 358.43 104.21
NET RECEIVED (BARAKA) in bags 617.21 41.45 155.79 70.87
NET RECEIVED (UVIRA) in bags 716.80 36.14 142.80 47.57
Net received (GOMA) in bags 690.29 20.95 66.60 61.51
Total net received in bags & tins 2,024.30 98.54 365.19 179.95
POSSIBLE TRANSIT LOSSES & OCC
1.65 0.36 -6.77 -75.74
JENGA II Mid-Term Evaluation Report 74
NB. More CM and VO were delivered to the warehouses than what was received. The ADRA Food Coordinator is trying to reconcile the figures. The first potential explanation is the poor performance of the surveyors. Commodity Logistics: ADRA is responsible for the commodity pipeline that delivers the commodities to the project warehouses. The commodities are shipped to the port of Dar-es-Salaam in Tanzania and then sent overland to Goma for WV and to Uvira and Baraka for ADRA. The marine survey company Intertek is used to provide the required marine discharge survey and the loading survey for the trucks carrying the inland commodities. The inland transport company initially was TransAmi, who was responsible for the clearing of the commodities from the port facilities and the transport of the commodities to DRC. Their performance in providing the required transport was marked by delays of 6-10 weeks, which contributed to a pipeline break and an infestation in a shipment of peas. TransAmi was initially replaced by Postserv in 2013, though we were informed that the performance of Postserv was also unsatisfactory, and as a result ADRA has now contracted Magellan Logistics to provide inland transport of the food commodities for the remainder of the project. The discharge surveys for food arrival in DRC are performed by DRC customs (Office Congolais de Contrôle-OCC). From the main warehouses in Goma, Uvira and Baraka, ADRA and WV use their own means to move commodities to sub-regional warehouses in Fizi, Kalehe and Minova. Food Dispatching: The two institutions have a procedure in place with a good internal control mechanism. 1) The field agents make their requests based on the needs for their specific activities; 2) The request is sent to the Food Coordinator for his approval; 3) Request goes to the COP’s or the Chef de Base’s approval; 4) The warehouse person prepares the waybill; 5) The vehicle is loaded and the trucker approves the cargo (quality and quantity); 6) The health center acknowledges receipt for PM2A commodities and the FFW representatives acknowledge receipt for FFW commodities; 7) Distribution with beneficiary names; and finally, 8) Commodity Status Reports, (CSRs), Recipient Status Reports (RSRs), and Loss Status Reports (LSRs) reports are sent to USAID. Food Management - Warehousing: The evaluator visited the warehouses in Kalundu/Uvira (ADRA) and the sub-warehouses in Kalehe and Minova (WV). By their location, the three warehouses meet FFP’s requirements in terms of security. Kalundu is within the port in Uvira; the secondary warehouse of Kalehe is located within the premises of the Kalehe field office of WV; the other warehouse in Minova is housed in a big parish of the Order of the Marist Brothers. All three warehouses are monitored 24/7 by a security company. Floors, roofs and walls are water-proof. All three buildings have metal doors with a double-padlock system. Inside, there is the basic equipment indispensable for the management of a warehouse: pallets, scales, ladders, gauges, empty containers for reconditioning, and extinguishers with their maintenance dates. With the exception of Kalehe, each warehouse has a well-kept ledger for each commodity. In addition to the monthly physical inventories, Food Coordinators also pay impromptu visits to the warehouses and do the inspection. The three warehouses visited are remarkably clean. The Title II commodities are stacked for easy counting during loading for deliveries or physical inventories. Spacing between piles and walls is in accordance with good management principles. The most remarkable practice is the handling of the stock cards, lodged in a transparent plastic bag for protection with no erasures in the data entries. Issues: The forms for the monthly physical inventories of the warehouses are not on shelves, but are kept in the computer (ADRA). The CSR, RSR, and LSR reports are also only in the computer. For the two institutions, the same people conduct the inventories every month. ADRA has an internal
JENGA II Mid-Term Evaluation Report 75
audit unit in its staffing pattern, but the visits of the latter to the warehouses or distribution sites are not systematic. As for the forms used, some WV food management tools include the same information i.e. Fiche de comptage, Rapport d’Inspection Camions, Fiche d’Inventaires Hebdomadaires, Fiche d’Inventaires Mensuel etc. During the field visits, the evaluator found examples of distribution lists with no signatures of the NGO staff in charge of the operation; some lists were also missing signatures of the beneficiaries. Delays in food deliveries or late deliveries also came as points to improve on from the communities. As mentioned above, the beneficiaries at the banana nursery in Butumba have been waiting for their food distribution for five months. As in Minova, Kalehe needs to have a warehouse ledger for each commodity. It is worth noting that having a ledger divided for many types of commodities is an option but when it is too big (Kalehe), its handling is a serious problem and it presents a not so attractive appearance. Also noted were the thousands of empty vegetable oil tins stored in the vicinity of ADRA’s and WV’s warehouses. One of the limitations of this evaluation was the evaluator’s inability to attend an actual food distribution – PM2A or FFW. No distribution coincided with our field visit and we did not want to have any staged. Yet, we learned that in one community, FFW commodities were delivered in an open field space and subject to the vagaries of the weather. Furthermore, while the PM2A commodities are under a roof for distribution, the majority of the mothers and their children wait unprotected before they are called in to receive their rations. In addition, a PM2A distribution session can last from 9:00 to 16:00/17:00 (a bit too long). Conclusions Overall commodity management for the project seems fairly solid, with some minor adjustments needed. Recommendations 1. ADRA Food Coordinator and Assistant: Go to Dar-es-Salam whenever there is a food shipment
to speed up the process with the transit company. FFP has nothing against this practice as the shipment is yours as soon as it is loaded on the marine vessel in the US loadport.
2. As noted above under the FFW recommendations, conduct an internal an audit of the food management system to assess the shortcomings and irregularities. This audit should cover both PM2A and FFW activities.
3. Make copies of the monthly physical inventories and keep them simultaneously at the office and the warehouse.
4. Designate project staff who are not necessarily from the food department to conduct the monthly physical inventories at the warehouse. This will avoid the ongoing situation where the warehouse person and the food monitor are both judge and jury. The Physical Inventory form should be reviewed, and we provided a proposed updated template with the Draft MTE Report.
5. ADRA: Have the internal audit unit staff establish a regular program for monitoring. 6. Designate two persons as end use checkers for post distribution controls. 7. Ensure that all data collection tools and CSR, RSR, and LSR reports are on file and readily
available. 8. Have the communities construct shelters made of thatch or banana leaves for temporary
accommodations at the distribution sites. 9. Develop strategies to reduce the waiting time of the participating women in PM2A ration
distributions – i.e. reduce group size, extend distribution days, create additional sites (cost involved), review the distribution methods, etc.
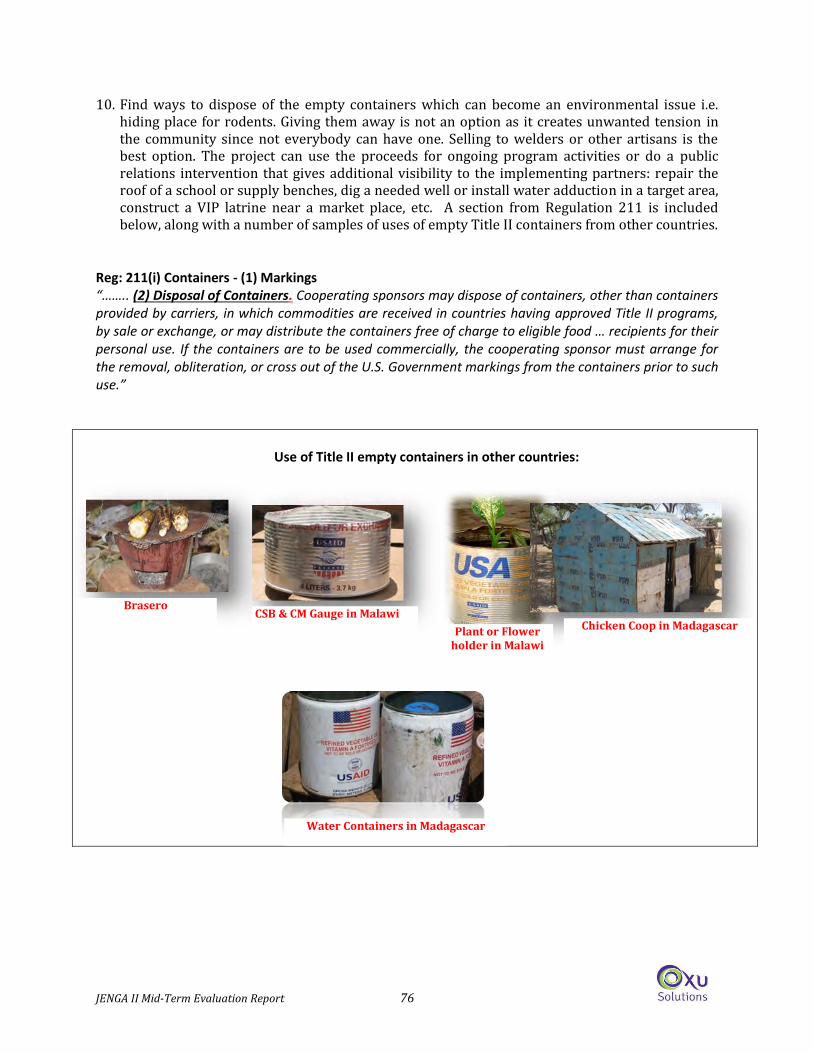
JENGA II Mid-Term Evaluation Report 76
10. Find ways to dispose of the empty containers which can become an environmental issue i.e. hiding place for rodents. Giving them away is not an option as it creates unwanted tension in the community since not everybody can have one. Selling to welders or other artisans is the best option. The project can use the proceeds for ongoing program activities or do a public relations intervention that gives additional visibility to the implementing partners: repair the roof of a school or supply benches, dig a needed well or install water adduction in a target area, construct a VIP latrine near a market place, etc. A section from Regulation 211 is included below, along with a number of samples of uses of empty Title II containers from other countries.
Reg: 211(i) Containers - (1) Markings “…….. (2) Disposal of Containers. Cooperating sponsors may dispose of containers, other than containers provided by carriers, in which commodities are received in countries having approved Title II programs, by sale or exchange, or may distribute the containers free of charge to eligible food … recipients for their personal use. If the containers are to be used commercially, the cooperating sponsor must arrange for the removal, obliteration, or cross out of the U.S. Government markings from the containers prior to such use.”
Use of Title II empty containers in other countries:
Chicken Coop in Madagascar
Brasero CSB & CM Gauge in Malawi
Water Containers in Madagascar
Plant or Flower holder in Malawi
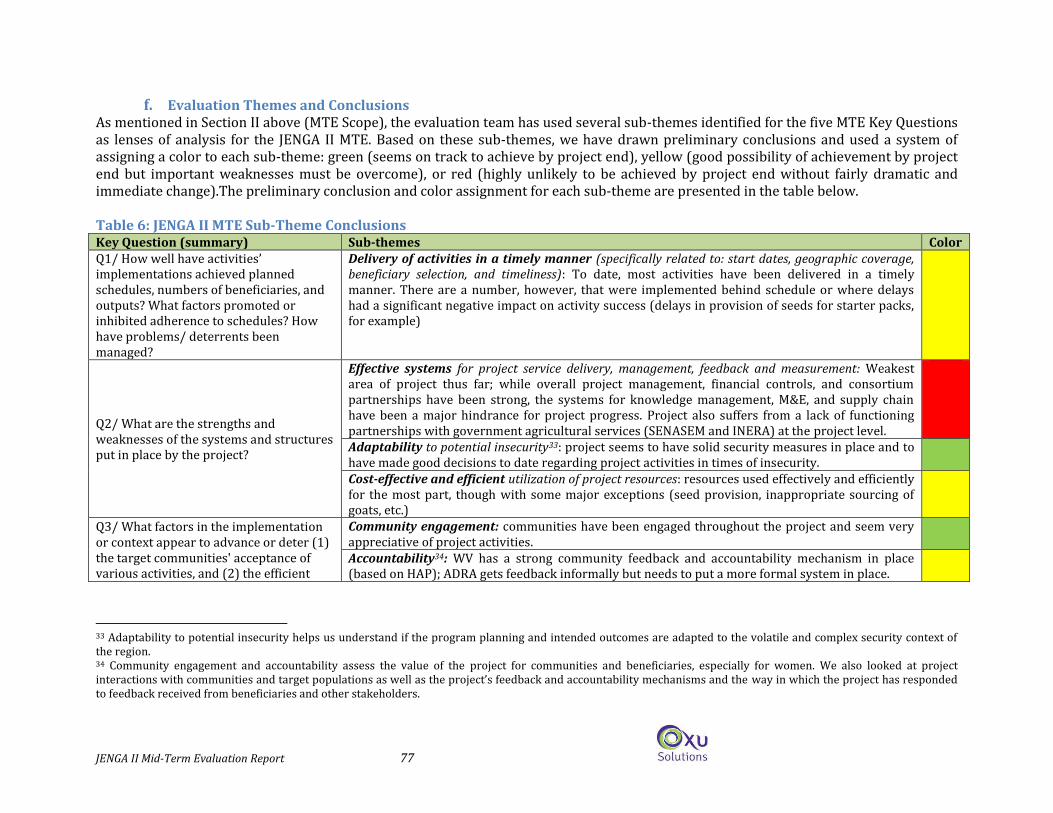
JENGA II Mid-Term Evaluation Report 77
f. Evaluation Themes and Conclusions As mentioned in Section II above (MTE Scope), the evaluation team has used several sub-themes identified for the five MTE Key Questions as lenses of analysis for the JENGA II MTE. Based on these sub-themes, we have drawn preliminary conclusions and used a system of assigning a color to each sub-theme: green (seems on track to achieve by project end), yellow (good possibility of achievement by project end but important weaknesses must be overcome), or red (highly unlikely to be achieved by project end without fairly dramatic and immediate change).The preliminary conclusion and color assignment for each sub-theme are presented in the table below. Table 6: JENGA II MTE Sub-Theme Conclusions Key Question (summary) Sub-themes Color Q1/ How well have activities’ implementations achieved planned schedules, numbers of beneficiaries, and outputs? What factors promoted or inhibited adherence to schedules? How have problems/ deterrents been managed?
Delivery of activities in a timely manner (specifically related to: start dates, geographic coverage, beneficiary selection, and timeliness): To date, most activities have been delivered in a timely manner. There are a number, however, that were implemented behind schedule or where delays had a significant negative impact on activity success (delays in provision of seeds for starter packs, for example)
Q2/ What are the strengths and weaknesses of the systems and structures put in place by the project?
Effective systems for project service delivery, management, feedback and measurement: Weakest area of project thus far; while overall project management, financial controls, and consortium partnerships have been strong, the systems for knowledge management, M&E, and supply chain have been a major hindrance for project progress. Project also suffers from a lack of functioning partnerships with government agricultural services (SENASEM and INERA) at the project level.
Adaptability to potential insecurity33: project seems to have solid security measures in place and to have made good decisions to date regarding project activities in times of insecurity.
Cost-effective and efficient utilization of project resources: resources used effectively and efficiently for the most part, though with some major exceptions (seed provision, inappropriate sourcing of goats, etc.)
Q3/ What factors in the implementation or context appear to advance or deter (1) the target communities' acceptance of various activities, and (2) the efficient
Community engagement: communities have been engaged throughout the project and seem very appreciative of project activities.
Accountability34: WV has a strong community feedback and accountability mechanism in place (based on HAP); ADRA gets feedback informally but needs to put a more formal system in place.
33 Adaptability to potential insecurity helps us understand if the program planning and intended outcomes are adapted to the volatile and complex security context of the region. 34 Community engagement and accountability assess the value of the project for communities and beneficiaries, especially for women. We also looked at project interactions with communities and target populations as well as the project’s feedback and accountability mechanisms and the way in which the project has responded to feedback received from beneficiaries and other stakeholders.
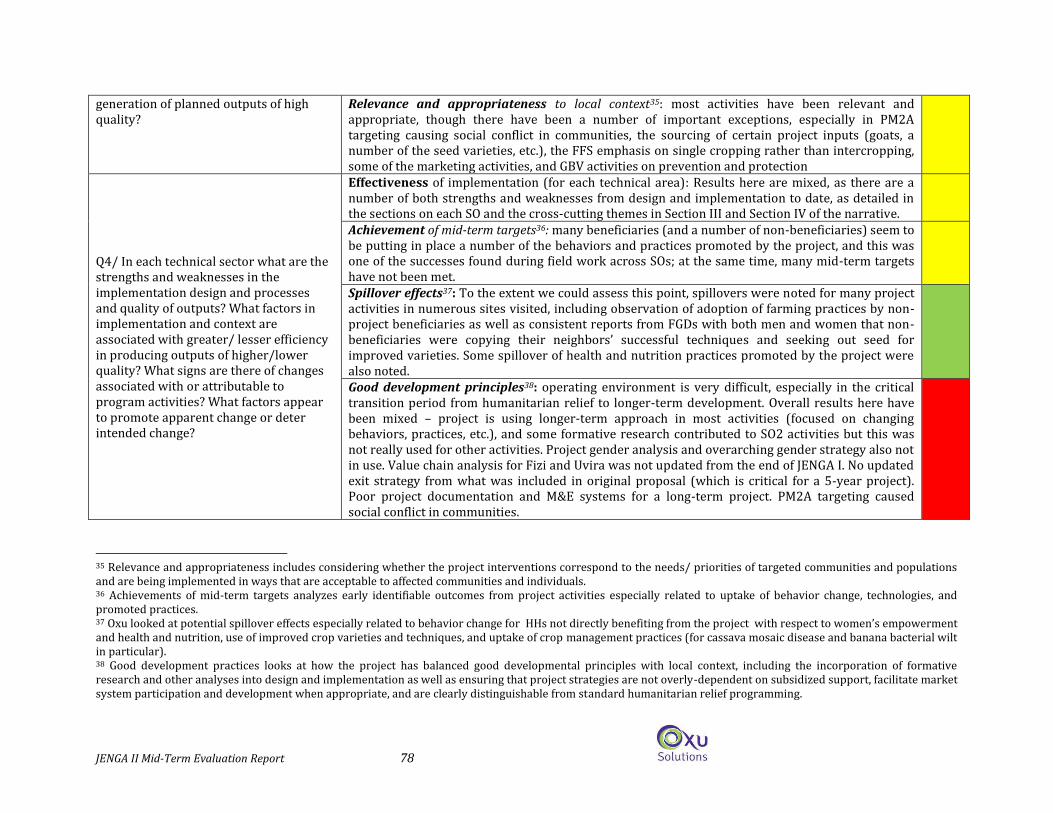
JENGA II Mid-Term Evaluation Report 78
generation of planned outputs of high quality?
Relevance and appropriateness to local context35: most activities have been relevant and appropriate, though there have been a number of important exceptions, especially in PM2A targeting causing social conflict in communities, the sourcing of certain project inputs (goats, a number of the seed varieties, etc.), the FFS emphasis on single cropping rather than intercropping, some of the marketing activities, and GBV activities on prevention and protection
Q4/ In each technical sector what are the strengths and weaknesses in the implementation design and processes and quality of outputs? What factors in implementation and context are associated with greater/ lesser efficiency in producing outputs of higher/lower quality? What signs are there of changes associated with or attributable to program activities? What factors appear to promote apparent change or deter intended change?
Effectiveness of implementation (for each technical area): Results here are mixed, as there are a number of both strengths and weaknesses from design and implementation to date, as detailed in the sections on each SO and the cross-cutting themes in Section III and Section IV of the narrative.
Achievement of mid-term targets36: many beneficiaries (and a number of non-beneficiaries) seem to be putting in place a number of the behaviors and practices promoted by the project, and this was one of the successes found during field work across SOs; at the same time, many mid-term targets have not been met.
Spillover effects37: To the extent we could assess this point, spillovers were noted for many project activities in numerous sites visited, including observation of adoption of farming practices by non-project beneficiaries as well as consistent reports from FGDs with both men and women that non-beneficiaries were copying their neighbors’ successful techniques and seeking out seed for improved varieties. Some spillover of health and nutrition practices promoted by the project were also noted.
Good development principles38: operating environment is very difficult, especially in the critical transition period from humanitarian relief to longer-term development. Overall results here have been mixed – project is using longer-term approach in most activities (focused on changing behaviors, practices, etc.), and some formative research contributed to SO2 activities but this was not really used for other activities. Project gender analysis and overarching gender strategy also not in use. Value chain analysis for Fizi and Uvira was not updated from the end of JENGA I. No updated exit strategy from what was included in original proposal (which is critical for a 5-year project). Poor project documentation and M&E systems for a long-term project. PM2A targeting caused social conflict in communities.
35 Relevance and appropriateness includes considering whether the project interventions correspond to the needs/ priorities of targeted communities and populations and are being implemented in ways that are acceptable to affected communities and individuals. 36 Achievements of mid-term targets analyzes early identifiable outcomes from project activities especially related to uptake of behavior change, technologies, and promoted practices. 37 Oxu looked at potential spillover effects especially related to behavior change for HHs not directly benefiting from the project with respect to women’s empowerment and health and nutrition, use of improved crop varieties and techniques, and uptake of crop management practices (for cassava mosaic disease and banana bacterial wilt in particular). 38 Good development practices looks at how the project has balanced good developmental principles with local context, including the incorporation of formative research and other analyses into design and implementation as well as ensuring that project strategies are not overly-dependent on subsidized support, facilitate market system participation and development when appropriate, and are clearly distinguishable from standard humanitarian relief programming.
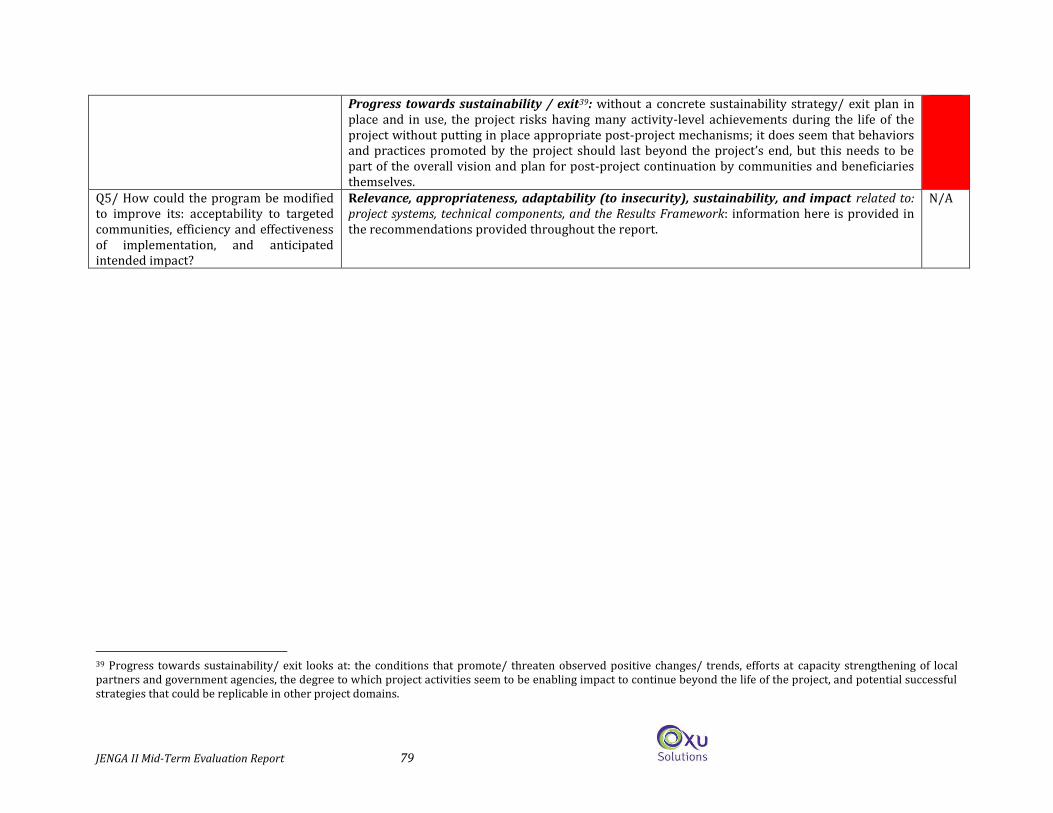
JENGA II Mid-Term Evaluation Report 79
Progress towards sustainability / exit39: without a concrete sustainability strategy/ exit plan in place and in use, the project risks having many activity-level achievements during the life of the project without putting in place appropriate post-project mechanisms; it does seem that behaviors and practices promoted by the project should last beyond the project’s end, but this needs to be part of the overall vision and plan for post-project continuation by communities and beneficiaries themselves.
Q5/ How could the program be modified to improve its: acceptability to targeted communities, efficiency and effectiveness of implementation, and anticipated intended impact?
Relevance, appropriateness, adaptability (to insecurity), sustainability, and impact related to: project systems, technical components, and the Results Framework: information here is provided in the recommendations provided throughout the report.
N/A
39 Progress towards sustainability/ exit looks at: the conditions that promote/ threaten observed positive changes/ trends, efforts at capacity strengthening of local partners and government agencies, the degree to which project activities seem to be enabling impact to continue beyond the life of the project, and potential successful strategies that could be replicable in other project domains.