Embed Size (px)
Citation preview

Question 1
6 out of 6 points
Exhibit 3-2A researcher has collected the following sample data. The mean of the sample is 5.
3 5 12 3 2
Refer to Exhibit 3-2. The standard deviation is
Answer
Selected Answer: d.
4.062
Correct Answer: d.
4.062
Question 2
6 out of 6 points
Exhibit 3-2A researcher has collected the following sample data. The mean of the sample is 5.
3 5 12 3 2
Refer to Exhibit 3-2. The coefficient of variation is
Answer
Selected Answer: c.
81.24%
Correct Answer: c.
81.24%
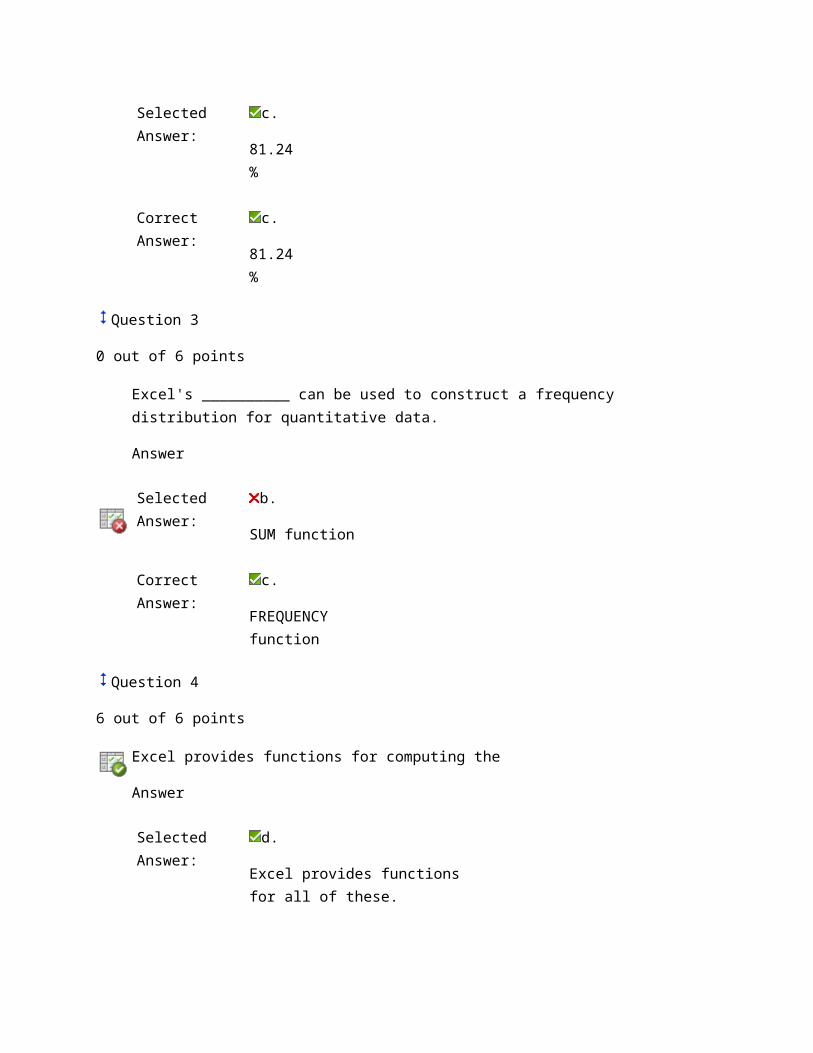
Question 3
0 out of 6 points
Excel's __________ can be used to construct a frequency distribution for quantitative data.
Answer
Selected Answer:
b.
SUM function
Correct Answer: c.
FREQUENCY function
Question 4
6 out of 6 points
Excel provides functions for computing the
Answer
Selected Answer:
d.
Excel provides functions for all of these.
Correct Answer: d.
Excel provides functions for all of these.
Question 5
6 out of 6 points
The fact that the sampling distribution of the sample mean can be approximated by a normal probability distribution whenever the sample size is large is based on the
Answer
Selected Answer:
a.
central limit theorem

Correct Answer: a.
central limit theorem
Question 6
6 out of 6 points
Exhibit 7-1The following data was collected from a simple random sample from an infinite population
13 15 14 16 12
Refer to Exhibit 7-1. The point estimate of the population mean
Answer
Selected Answer: d.
is 14
Correct Answer: d.
is 14
Question 7
0 out of 6 points
Exhibit 6-7
f(x) = (1/10) e-x/10 x ³ 0
Refer to Exhibit 6-7. The probability that x is between 3 and 6 is
Answer
Selected Answer: c.
0.2592

Correct Answer: d.
0.1920
Question 8
6 out of 6 points
Exhibit 6-4The starting salaries of individuals with an MBA degree are normally distributed with a mean of $40,000 and a standard deviation of $5,000.
Refer to Exhibit 6-4. What is the probability that a randomly selected individual with an MBA degree will get a starting salary of at least $47,500?
Answer
Selected Answer: c.
0.0668
Correct Answer: c.
0.0668
Question 9
6 out of 6 points
Exhibit 6-7
f(x) = (1/10) e-x/10 x ³ 0
Refer to Exhibit 6-7. The probability that x is less than 5 is
Answer
Selected Answer: b.
0.3935
Correct Answer: b.

0.3935
Question 10
6 out of 6 points
An important numerical measure of the shape of a distribution is the
Answer
Selected Answer:
a.
skewness
Correct Answer: a.
skewness
Question 11
6 out of 6 points
Exhibit 3-1A researcher has collected the following sample data.
5 12 6 8 5
6 7 5 12 4
Refer to Exhibit 3-1. The 75th percentile is
Answer
Selected Answer: a.
8
Correct Answer: a.
8
Question 12
0 out of 6 points

When the data are labels or names used to identify an attribute of the elements and the rank of the data is meaningful, the variable has which scale of measurement?
Answer
Selected Answer:
a.
nominal
Correct Answer: d.
ordinal
Question 13
6 out of 6 points
For a uniform probability density function, the height of the function
Answer
Selected Answer: a.
is the same for each value of x
Correct Answer: a.
is the same for each value of x
Question 14
6 out of 6 points
A numerical measure from a sample, such as a sample mean, is known as
Answer
Selected Answer: d.
a statistic
Correct Answer: d.
a statistic

Question 15
6 out of 6 points
Exhibit 2-4A survey of 400 college seniors resulted in the following crosstabulation regarding their undergraduate major and whether or not they plan to go to graduate school.
Undergraduate Major
Graduate School Business Engineering Others Total
Yes 35 42 63 140
No 91 104 65 260
Total 126 146 128 400
Refer to Exhibit 2-4. Among the students who plan to go to graduate school, what percentage indicated "Other" majors?
Answer
Selected Answer: a.
45
Correct Answer: a.
45
Question 16
6 out of 6 points
X is a normally distributed random variable with a mean of 12 and a standard deviation of 3. The probability that x equals 19.62 is
Answer
Selected Answer: d.
0.000

Correct Answer: d.
0.000
Question 17
6 out of 6 points
Statistical studies in which researchers do not control variables of interest are
Answer
Selected Answer:
c.
observational studies
Correct Answer: c.
observational studies
Question 18
6 out of 6 points
Facts and figures that are collected, analyzed and summarized for presentation and interpretation are
Answer
Selected Answer: a.
data
Correct Answer: a.
data
Question 19
6 out of 6 points
The expected value of the random variable is
Answer

Selected Answer:
b.
m
Correct Answer: b.
m
Question 20
0 out of 6 points
Which of the following is not a characteristic of the normal probability distribution?
Answer
Selected Answer: a.
The mean, median, and the mode are equal
Correct Answer: b.
The standard deviation must be 1
Question 21
6 out of 6 points
In constructing a frequency distribution, as the number of classes are decreased, the class width
Answer
Selected Answer: a.
increases
Correct Answer: a.
increases
Question 22
6 out of 6 points

The summaries of data, which may be tabular, graphical, or numerical, are referred to as
Answer
Selected Answer:
d.
descriptive statistics
Correct Answer: d.
descriptive statistics
Question 23
6 out of 6 points
The __________ denotes the number of standard deviations xi is from the mean .
Answer
Selected Answer: d.
z-score
Correct Answer: d.
z-score
Question 24
6 out of 6 points
A statistics professor asked students in a class their ages. On the basis of this information, the professor states that the average age of all the students in the university is 21 years. This is an example of
Answer
Selected Answer: c.
statistical inference
Correct Answer: c.

statistical inference
Question 25
6 out of 6 points
Random samples of size 100 are taken from an infinite population whose population proportion is 0.2. The mean and standard deviation of the distribution of sample proportions are
Answer
Selected Answer: a.
0.2 and .04
Correct Answer: a.
0.2 and .04
Question 26
6 out of 6 points
Exhibit 3-2A researcher has collected the following sample data. The mean of the sample is 5.
3 5 12 3 2
Refer to Exhibit 3-2. The variance is
Answer
Selected Answer:
d.
16.5
Correct Answer: d.
16.5
Question 27
6 out of 6 points

Exhibit 6-4The starting salaries of individuals with an MBA degree are normally distributed with a mean of $40,000 and a standard deviation of $5,000.
Refer to Exhibit 6-4. What is the random variable in this experiment?
Answer
Selected Answer:
a.
the starting salaries
Correct Answer: a.
the starting salaries
Question 28
6 out of 6 points
Exhibit 6-7
f(x) = (1/10) e-x/10 x ³ 0
Refer to Exhibit 6-7. The mean of x is
Answer
Selected Answer:
b.
10
Correct Answer: b.
10
Question 29
6 out of 6 points
The standard deviation of all possible values is called the
Answer

Selected Answer:
b.
standard error of the mean
Correct Answer: b.
standard error of the mean
Question 30
0 out of 6 points
A tabular summary of a set of data showing the fraction of the total number of items in several nonoverlapping classes is a
Answer
Selected Answer:
a.
frequency distribution.
Correct Answer: c.
relative frequency distribution.
Question 31
6 out of 6 points
In a cumulative frequency distribution, the last class will always have a cumulative frequency equal to
Answer
Selected Answer: c.
the total number of elements in the data set
Correct Answer: c.
the total number of elements in the data set
Question 32
6 out of 6 points

Exhibit 7-5Random samples of size 17 are taken from a population that has 200 elements, a mean of 36, and a standard deviation of 8.
Refer to Exhibit 7-5. Which of the following best describes the form of the sampling distribution of the sample mean for this situation?
Answer
Selected Answer: d.
None of the alternative answers is correct.
Correct Answer: d.
None of the alternative answers is correct.
Question 33
6 out of 6 points
The purpose of statistical inference is to provide information about the
Answer
Selected Answer: c.
population based upon information contained in the sample
Correct Answer: c.
population based upon information contained in the sample
Question 34
6 out of 6 points
Excel's NORMDIST function can be used to compute
Answer
Selected Answer:
d.
cumulative probabilities for a normally distributed x value

Correct Answer: d.
cumulative probabilities for a normally distributed x value
Question 35
0 out of 6 points
A graphical presentation of the relationship between two quantitative variables is
Answer
Selected Answer:
c.
either a pie chart or a histogram, depending on the type of data
Correct Answer: b.
a scatter diagram
Question 36
6 out of 6 points
Exhibit 7-1The following data was collected from a simple random sample from an infinite population
13 15 14 16 12
Refer to Exhibit 7-1. The point estimate of the population standard deviation is
Answer
Selected Answer: b.
1.581
Correct Answer: b.
1.581
Question 37
0 out of 6 points
Ordinary arithmetic operations are meaningful
Answer
Selected Answer:
b.
either with quantitative or qualitative data
Correct Answer: c.
only with quantitative data
Question 38
6 out of 6 points
A standard normal distribution is a normal distribution with
Answer
Selected Answer: d.
a mean of 0 and a standard deviation of 1
Correct Answer: d.
a mean of 0 and a standard deviation of 1
Question 39
6 out of 6 points
Exhibit 7-5Random samples of size 17 are taken from a population that has 200 elements, a mean of 36, and a standard deviation of 8.
Refer to Exhibit 7-5. The mean and the standard deviation of the sampling distribution of the sample means are
Answer
Selected Answer:
b.
36 and 1.86

Correct Answer: b.
36 and 1.86
Question 40
6 out of 6 points
A graphical device for depicting qualitative data that have been summarized in a frequency distribution, relative frequency distribution, or percent frequency distribution is a(n)
Answer
Selected Answer:
d.
bar graph
Correct Answer: d.
bar graph
Question 41
6 out of 6 points
Exhibit 6-4The starting salaries of individuals with an MBA degree are normally distributed with a mean of $40,000 and a standard deviation of $5,000.
Refer to Exhibit 6-4. What is the probability that a randomly selected individual with an MBA degree will get a starting salary of at least $30,000?
Answer
Selected Answer: b.
0.9772
Correct Answer: b.
0.9772
Question 42
6 out of 6 points
Exhibit 6-4The starting salaries of individuals with an MBA degree are normally distributed with a mean of $40,000 and a standard deviation of $5,000.
Refer to Exhibit 6-4. What percentage of MBA's will have starting salaries of $34,000 to $46,000?
Answer
Selected Answer: a.
76.98%
Correct Answer: a.
76.98%
Question 43
6 out of 6 points
The 50th percentile is the
Answer
Selected Answer:
a.
median
Correct Answer: a.
median
Question 44
6 out of 6 points
Exhibit 2-4A survey of 400 college seniors resulted in the following crosstabulation regarding their undergraduate major and whether or not they plan to go to graduate school.
Undergraduate Major
Graduate School Business Engineering Others Total

Yes 35 42 63 140
No 91 104 65 260
Total 126 146 128 400
Refer to Exhibit 2-4. Of those students who are majoring in business, what percentage plans to go to graduate school?
Answer
Selected Answer: b.
27.78
Correct Answer: b.
27.78
Question 45
6 out of 6 points
Exhibit 3-1A researcher has collected the following sample data.
5 12 6 8 5
6 7 5 12 4
Refer to Exhibit 3-1. The median is
Answer
Selected Answer: c.
6
Correct Answer: c.

6
Question 46
0 out of 6 points
For a continuous random variable x, the probability density function f(x) represents
Answer
Selected Answer:
c.
Both the probability at a given value of x and the area under the curve at x are correct answers.
Correct Answer:
a.
the height of the function at x
Question 47
0 out of 6 points
Exhibit 3-1A researcher has collected the following sample data.
5 12 6 8 5
6 7 5 12 4
Refer to Exhibit 3-1. The mean is
Answer
Selected Answer: a.
8
Correct Answer: c.
7
Question 48

6 out of 6 points
Which of the following is NOT a scale of measurement?
Answer
Selected Answer:
d.
All of these are scales of measurement.
Correct Answer: d.
All of these are scales of measurement.
Question 49
6 out of 6 points
Exhibit 3-1A researcher has collected the following sample data.
5 12 6 8 5
6 7 5 12 4
Refer to Exhibit 3-1. The mode is
Answer
Selected Answer:
d.
5
Correct Answer: d.
5
Question 50
6 out of 6 points

Which of the following symbols represents the size of the population?
Answer
Selected Answer: a.
N
Correct Answer: a.
N