Embed Size (px)
Citation preview

MID-MARKET M&A REVIEW FINANCIAL ADVISORS Full Year 2017
REUTERS / Coldagh Kilcoyne
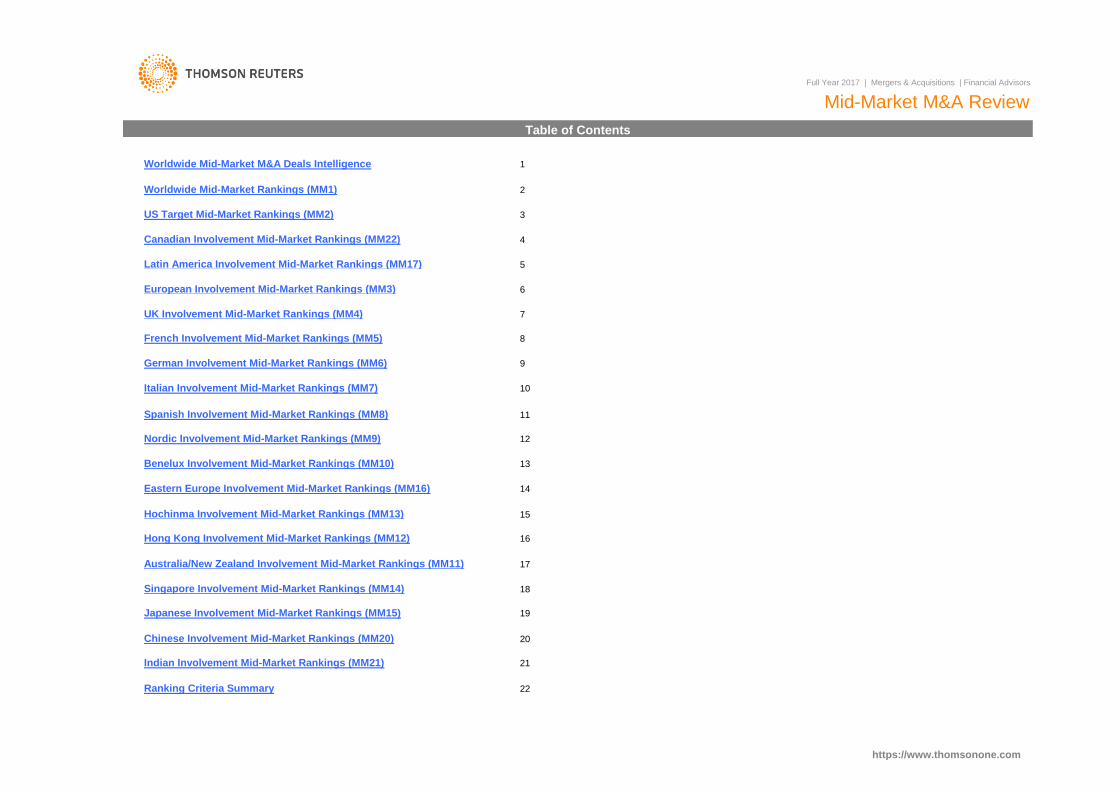
Indian Involvement Mid-Market Rankings (MM21)
22
7
8
9
10
Hong Kong Involvement Mid-Market Rankings (MM12)
Singapore Involvement Mid-Market Rankings (MM14)
Benelux Involvement Mid-Market Rankings (MM10)
Eastern Europe Involvement Mid-Market Rankings (MM16)
3
Ranking Criteria Summary
20
11
Australia/New Zealand Involvement Mid-Market Rankings (MM11)
6
Italian Involvement Mid-Market Rankings (MM7)
Spanish Involvement Mid-Market Rankings (MM8)
Chinese Involvement Mid-Market Rankings (MM20)
21
https://www.thomsonone.com
Full Year 2017 | Mergers & Acquisitions | Financial Advisors
Mid-Market M&A Review
Table of Contents
Worldwide Mid-Market M&A Deals Intelligence
UK Involvement Mid-Market Rankings (MM4)
French Involvement Mid-Market Rankings (MM5)
1
2
5
Hochinma Involvement Mid-Market Rankings (MM13)
Worldwide Mid-Market Rankings (MM1)
US Target Mid-Market Rankings (MM2)
Latin America Involvement Mid-Market Rankings (MM17)
European Involvement Mid-Market Rankings (MM3)
Nordic Involvement Mid-Market Rankings (MM9)
German Involvement Mid-Market Rankings (MM6)
Canadian Involvement Mid-Market Rankings (MM22) 4
Japanese Involvement Mid-Market Rankings (MM15)
12
13
14
15
16
17
18
19
Worldwide Mid-Market M&A up to US$500m by Rank Value Range Jan 1 - Dec 31
Jan 1 - Dec 31
Mid-Market Deals Intelligence
Argentina 2,249.5 114 2,685.9 101
Rank Value
US$m
47,197 ▲
Worldwide Mid-Market M&A up to US$500m by Target Industry
https://www.thomsonone.com
Full Year 2017
DEALS VALUED UP TO US$500 MILLION
MID-MARKET M&A REVIEW
M&A Rankings For Small-Cap Deals Valued Up To US$50m Are Also Available
33,267.427,730.0
1,591
21434,606.9
1,485
320South Africa 5,099.9 327 6,530.4129
5,766
1,269
▼▲
-1.4
-1.30.8Asia-Pacific (ex Central Asia)
▼
▲
-4.84.0
12.917.05.6
30.6
17.666.4
▼
Africa/Middle East/Central Asia ▼
Visit http://dmi.thomsonreuters.com to View Archives and Order Custom League Tables
12,709 219,260.9
595 ▲Mexico 4,625.7 162
-2.4-6.5-8.8
13,970
3,828.9 113▼
15,926.0
Israel 3,578.4
21,301.03,680.9
422 6,458.9
718
24.7
287
632
Brazil
34,613.2 ▲
15,049.3
Australia
-4.5
406,716.4162 3,625.7
13,570 13,215403,636.3
▲
-1.5
11,147.8
5,998.58,818.1
Republic of Ireland
7,329.0 ▲
305
▼▼
▼
2,245.4 1,598.816,290
49,527.2
31.652.1
▼
904
▼1834,035.5 199 4,092.3
6,500.1 1,7877,087.0
945 12,097.7
483 11,524.3
▲
▲453
Russian Federation586
1,251
South Korea
Colombia
21,001.1
34,190.4
5,732
6,508.4
2,471
448Malaysia229
193 4,271.2
772
3,911.6
▲
Netherlands
1,339
1,56531,320.3
2,811
Finland 3,626.1 267
Spain
Sweden -19.6-7.7
-16.0-1.4
▲
▲
20,616.6
487
Singapore
1,671 ▼Italy 18,294.2 1,133 19,151.3 990 ▼Germany 18,726.0
2,630 ▼France 21,456.2 1,960 22,959.5 2,601 ▼
117 ▲
Europe 195,481.5 14,769 205,742.4
# of
Deals
United States of America 240,012.5Canada 32,032.2 2,690 25,025.9
2.8937,228.7▲
20,533.7
United Kingdom 48,351.6
1,603 ▲
78
48,867
11,045 ▲
73
3,449.0
526
▼
3,708.1 169 ▲
13,888.7
1,421
Worldwide 963,913.1
11,815.3
Chile
12.49.5
28.017.5
Americas 306,107.2 16,642 272,358.5
Jan 1 - Dec 31Announced Mid-Market M&A by Target Nation Up To US$500m
27,326.9 8471,130
Region/Nation
1/1/2017 - 12/31/2017 1/1/2016 - 12/31/2016 % Change
in Rank
ValueRank Value
US$m
690
14.01.2
-21.9
1,322 19,525.1India
Thailand 4,867.5
China 242,050.1
80423,359.5
11.0-16.240.4-5.0
# of
Deals
▲
Hong Kong
▲
Japan
▲6,647.7
2,646
Poland 5,427.4
Taiwan7,815.8
1,237
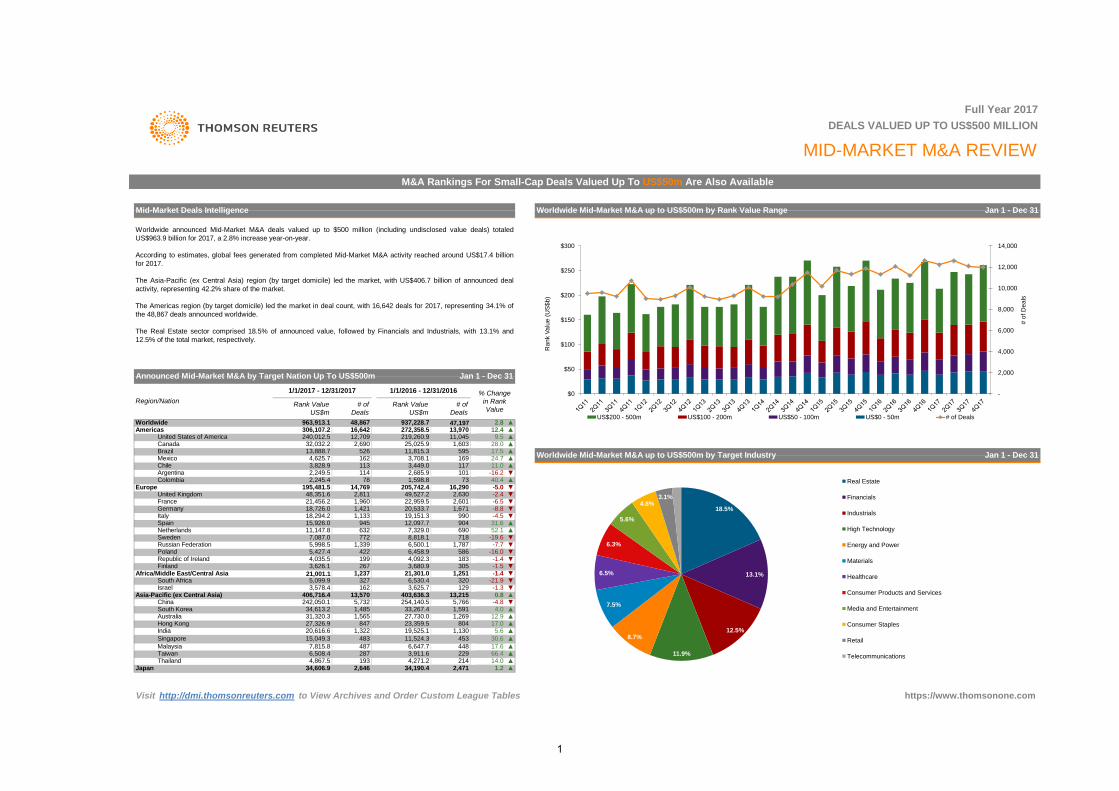
Worldwide announced Mid-Market M&A deals valued up to $500 million (including undisclosed value deals) totaled
US$963.9 billion for 2017, a 2.8% increase year-on-year.
According to estimates, global fees generated from completed Mid-Market M&A activity reached around US$17.4 billion
for 2017.
The Asia-Pacific (ex Central Asia) region (by target domicile) led the market, with US$406.7 billion of announced deal
activity, representing 42.2% share of the market.
The Americas region (by target domicile) led the market in deal count, with 16,642 deals for 2017, representing 34.1% of
the 48,867 deals announced worldwide.
The Real Estate sector comprised 18.5% of announced value, followed by Financials and Industrials, with 13.1% and
12.5% of the total market, respectively.
254,140.5
-
2,000
4,000
6,000
8,000
10,000
12,000
14,000
$0
$50
$100
$150
$200
$250
$300
# o
f D
ea
ls
Ra
nk V
alu
e (
US
$b
)
US$200 - 500m US$100 - 200m US$50 - 100m US$0 - 50m # of Deals
18.5%
13.1%
12.5%
11.9%
8.7%
7.5%
6.5%
6.3%
5.6%
4.8% 3.1%
Real Estate
Financials
Industrials
High Technology
Energy and Power
Materials
Healthcare
Consumer Products and Services
Media and Entertainment
Consumer Staples
Retail
Telecommunications
1
* Source: Thomson Reuters
** Fee exposure indicates each firm's mid-market fees from deals valued at up to US$500m as a percentage of its overall M&A fees in the relevant region.† Imputed Fees shown are based on completed deal activity, whereas deal count & rank values are compiled based on announced deal activity.
Visit http://dmi.thomsonreuters.com to View Archives and Order Custom League Tables
55 -14 ▼ 4,589.1 - 42.5 ▲ 35.7 54 95.2
Jan 1 - Dec 31Worldwide Mid-Market M&A up to US$500m by Target Nation Region
38*
64.7
60.8
56.7
74.0
98.2
16.2
67.3
44.8
30.7
100.0
84.6
86.4
Generational Equity
9
35*
Globalscope
Industry Total 48,864
21.0
55.5
189
53
32
41
CITIC
▲
-
-
Moelis & Co
RBC Capital Markets
Deutsche Bank
Clearwater International 39
88
43
-12
▼-0.8
-85.2
-55.6
-
35*
33*
42
Piper Jaffray Cos
47
48*
48*
Duff & Phelps
46
33
▲
6,772.6
72.2
96.2
97.7
30
Evercore Partners
Clairfield International
18
11
7
▼ 18,547.7 -31.6
IMAP
20
Mizuho Financial Group
▲ 17,699.4
1114
▼
148.0▼ 8,595.3
19.9
114.6
175
13.5
Citi
▲
65.9
29
20
Stifel/KBW
11,357.4
3
131.8-
24
▼17
▲
233.7-10
Daiwa Securities Group Inc 50 47
-34.7
-20.5
▲
-19.6
-
Lincoln International
▼
Credit Suisse 17 21 151 25
141
5
▼
-
9
14
25
24
25* ▼25
27
Nomura
10
28 -1
▼
BNP Paribas SA
1.0
41
6,309.1 27
▼-15.2
▲Lazard
2,412.6
16 15
7
▲ 6,358.3
190.24
263.7
-40
▼
▼
14,569.6
▲ 7,683.3
206 9
22 -3.4
32
8
18
21 27 129
▲
163.7
▼
56 ▼
6,663.7 25
-8 23
2.8
-32 ▼
56 -4
57
-21 ▼
58
135.9
102.6
70.4
81.1
-
97
91
▲
▲
-34
7,873.4
▲
23
1,332.2
▼
60.5
100.0
-30.57,026.3
70
-8
136
44
https://www.thomsonone.com
93.2
49.2 45 36.5
67.8
6
11
91.4
55.9 40
100.0
106.2
46 100.0
23 90.7
51.4
17
12
59.2
26
Worldwide Estimated Mid-Market Investment Banking Fees by Quarter*
- -0.5 ▼
17.2 - -2.8▼
-
133.9
109.7
36.1
-14
13,560.9
▼-
▼
53.1▲
31.7
1,011.3
▼
▼
28*
103
101
248.4
30*
33* 44
30*
2
11,263.6
32
KBS Corporate Sales Ltd
CFI
Grant Thornton
▼
42
▼
72
4,865.6 - 6.9
33 50.9
▲
31
95
27.2
94.3
31.7
100.0
57.4
100.0
49.4
▼
6
Global M&A
116
Goldman Sachs & Co
-0.2
9.7
▼
13
15
38
32
▼
108
34*
1,073.876 ▼-
23.9
▲
-22.64,887.4
Source: Thomson Reuters
286.9
963,913.1
43
61.2
*tie
119.6
149.3
105.4
-31.5-22
12 ▲
18
Morgan Stanley 15
23 ▲15.7
263.9 -
▲
Oaklins (FKA M&A Intl Inc)
23.2
158.6
▲Robert W Baird & Co Inc
34*
▼
72.2 21.5
2,306.1
11.0
72
29
▼
-293.0 43
22
▼
▲
▲
▼
100.0
Bank of America Merrill Lynch 38
▲
30*
11,104.2
10,028.5
20 ▲
▲
17
▲
-69.2
16
109.8
115.8
-47.1
-32.2
35▼
20
-25
▲
12
10,782.3
1,103.5
78.4
100.0
48.4
72.3
103.9
127.1
53.7
20
106
100.0
17,399.7
5,864.3 --0
41
45
26
Full Year 2017 │ Mid-Market M&A Up To US$500m │ Financial Advisors
Worldwide Mid-Market Rankings (MM1)
-1 ▼ 2,532.6 -
Jefferies LLC 22
▲
▲
183.6
19
332.1
16.9
24.6
100.0
25.0169.9
45.3
17,258.0
Houlihan Lokey 10
134
▲
▼
14
100.0
79.4
20.8
89.5
1
16
92.8
# of Deals
1
9 6
BDO
30.2
12,699.6 8
14
▲9
8 12*
▲
3
-22.7
5 5
Ernst & Young LLP 4 4
2
5,578.7
▼
JP Morgan
Sumitomo Mitsui Finl Grp Inc
43
8
▲
8
21
4
6
213
22,268.5
130
-1.7
▼
8,983.6
Change (%)
Advisor 2017
▲
▼9,100.3
48
2017
US$m
8,506.8
215
-42
▼
▼
1,555.3 -238 73
66.1
5
-13 ▼
243
26.7
44.2
Imputed Fees (US$m) †
27
Fees Rank
Change in 2016
Rank Value per Advisor (US$m)
Rank Value Rank Value2016
-10
113
▼
▼
-24
22
103
28*
19
25*
1,907.7 -
185
-7
110
18
▲
73
-8
80
71 -23 ▼
- 27.4
101
10 189
13
▼
Jan 1 - Dec 31
Exp (%)
** Fee
▼8,592.6-15
Barclays
▼
▼
19
7
37
40 79
107
10
Baker Tilly International
-3.9
-4
Alantra Partners SA 24
19
UBS
107
-10.0
-60.0
158 ▼5
18.2
7 12*
MM1 - Undisclosed Values & Values up to US$500m
# of Deals per Advisor
Rank
273 -24
1
Financial Advisor
KPMG
Deals
6
-16.7
481 -41.5
Rank
16 ▼
Rothschild & Co 3 3
Deloitte
36* -
24
▼
1 12,395.3▲
2097
95
36*
56
38*
53*
48*
1,667
Macquarie Group
BMO Capital Markets
RSM Corporate Fin LLP
Benchmark International
▲
▼
44
45
46.2
4
▼
46
123.8
150.4
282.9
34
40 -40.8
-44.8
2
19PricewaterhouseCoopers 2
339
11*
36
22
15
Industrial & Comm Bank China
-1.1
2
# of
64.3
-14.6164 ▼
▲
3,858.9
-
▼
-2.4
Rank
199
11*
5
118.0
3
221.31
2 -74
-20.719,813.8
6
-14 ▼
350
Raymond James Financial Inc 30*
5137.7
42
13
99
13.8
477.5 -
40
-
-54.2 ▼
91.5
-25.3 ▼
7,780.8 21 8.4 ▲
55.3 41
8
15.1
121.1
$0 $100 $200 $300 $400 $500 $600 $700 $800 $900 $1,000
2010
2011
2012
2013
2014
2015
2016
2017
Rank Value (US$b)
Africa/Middle East Americas Asia-Pacific Europe Japan
0%
10%
20%
30%
40%
50%
60%
70%
80%
$0
$1
$2
$3
$4
$5
1Q 2Q 3Q 4Q 1Q 2Q 3Q 4Q 1Q 2Q 3Q 4Q 1Q 2Q 3Q 4Q 1Q 2Q 3Q 4Q 1Q 2Q 3Q 4Q 1Q 2Q 3Q 4Q 1Q 2Q 3Q 4Q
2010 2011 2012 2013 2014 2015 2016 2017
Perc
enta
ge o
f Tota
l F
ees
Inve
stm
en
t B
an
kin
g F
ee
s (
US
$b
)
Mid-Market I.B. Fees ($500mil or less) % of Total Fees
2
Full Year 2017 │ Mid-Market M&A Up To US$500m │ Financial Advisors
US Target Mid-Market Rankings (MM2)
*tie
** Fee exposure indicates each firm's mid-market fees from deals valued at up to US$500m as a percentage of its overall M&A fees in the relevant region.† Imputed Fees shown are based on completed deal activity, whereas deal count & rank values are compiled based on announced deal activity.
Visit http://dmi.thomsonreuters.com to View Archives and Order Custom League Tables
Global M&A 46* 36 18 -6 ▼ 11.6 - -97.4 ▼ 17.3 44 80.8
IMAP 46* 41 18 -3 ▼ 35.7 - -58.0
DA Davidson & Co Inc 41* 49* 21 5
33*
Chartwell Financial Advisory
11.0 ▲
-
▼
22
-
29
37.4
87.3
100.0
Imputed Fees (US$m) †
Exp. (%)
25.7
KPMG
33* 37
-74.7
▼
12* 16
6,080.1
23*
Bank of America Merrill Lynch 28
Jan 1 - Dec 31
Source: Thomson Reuters
74.7
2,488.0 24 81.1
836.0 45 4.6
0.0 - -
92.6 - -42.1
6.4
17.0 45 100.0
15.9 47 100.0
22
9
3,670.7
99
▲
4
746* -5 -26.0
▼
Stifel/KBW
Rank
1
9,079.5
20172016
-18 ▼
2
7,223.3
-13
1,641.1
▲
-11.0
-2.3
4,688.4
963
71.6
101.3
18
UBS
Evercore Partners
12*
▼
15
122.3
▼
▼
4*
▼ 15.7
-
42 31.4
5.5 89
19
22
101
Raymond James Financial Inc
6*
6 4*
8Generational Equity
▲
Jefferies LLC
Goldman Sachs & Co
15
Morgan Stanley
Stephens Inc
▲
Macquarie Group 43* 44* 20 1 ▲
PJT Partners Inc 43* 32 20 -11 ▼
MarshBerry & Co Inc 45 47* 19 2 ▲
Cascadia Capital 46* 38* 18 -4 ▼
1,189.2
▼
19
5,180.8▲
13 ▲
96 - 191.4
▼
Rank Value per Advisor (US$m)
153.2
29
63*
-
▲
21
5.7
Prairie Capital Advisors Inc
Fig Partners LLC 41*
KeyBanc Capital Markets Inc
Rothschild & Co
023
▼
172.7
4607.6
54.2
4,885.5
BMO Capital Markets
▲
1
-
22
4,460.5
18
RBC Capital Markets
37
-64.4
33*
▲3,088.6
23*
-
1 ▲
▲
▲
-
▼
117.6
36.4 28
31.2
24
89.0
10
29
77.5
16
4,528.2
16
49.3
27
-5
38
▼
17
6,531.5
29.9
100.0
▲
▲ 30.0
▲853.021
Centerview Partners LLC
21.4
41.9
Fees
▲
2
15.4
Rank
3
11
13*
21.1
69
70
13*
14
25.3
130.4
102.5
6
100.0
▼
2017
11
44
Financial Advisor
Piper Jaffray Cos
12
32.9
20
-5.6
69.3
7,523.9
▼
13
-31.6
▼
US$m
▲
17
88.4
11.2
-10.6
▲
JP Morgan
2
1
100.0
Deals
-33.8
283.2
3
-7 ▼
10
5
Rank Value
20.0
41.6
8
17
116.1
37
104.3
9
15
5
75.9
3
-29.9
▼
17
45
41
9
▼
10,190.7
9
5,111.82121
7.4
12*
63
3
76
18
# of Deals per Advisor
5
Rank
11*
Rank
2017
1
Rank Value Advisor
3
-6
# of
272.8
▲
7
Change (%)
-37.8
Change in
# of Deals
46.4
13
▲
William Blair & Co
2
30
17.0
18
4
86.7
US Mid-Market M&A up to US$500m by Rank Value Range
50.9
58.1
31
0 -
53
29
30
▲
2 ▼
▼
13
20.3
6,559.7
1
60.5
20
3,925.7
7
Houlihan Lokey 151 ▼5,010.1
-33.2
▲
29
Barclays
Moelis & Co
63
Oaklins (FKA M&A Intl Inc) 23
24*
78.1
7
61 98.5
16 22
Lazard
4.4
Robert W Baird & Co Inc
1,471.0
301.0
22.0
▼
12
-2.4
-
-26.7
1,354.3
35.0
71.3
67.9
23
39.8
40.7
32
Deutsche Bank
Wells Fargo & Co
3,034.2
0
9.5240,012.5
35
566.5
▲
▼
22.0
16
10
23*
21.9
** Fee
6
▲
▲
1,939.4
▼
-
11
0.0 100.0
-
▲
▲
87*
2.5
16.8
▲
▲
-
▼
6.5 80 49.2
18.8
78.8
47.2
24.0
58.5 91.019
▲
100.0
92.0
30.2
1,666
-73.4
81.3
21.0
6.3
9.4
-6
100.0
▲
100.0
10.6
78.5
▲
15 ▲50 6,066.4
11.1
27
2,302.1
-
4
-
28 520.0
▲
161.7
23*
19*
73.4
71.5
53.7
100.0
31
US Mid-Market M&A up to US$500m by Target Industry
86
87.9
81
▲-8
3.1
10
52* 22
3,168.6
25
26
▲
5,655.8 8
▲
▲
90.211*
▼
-3
▼
2736.5
38
21
34.61.3
97.3
28
-4
43.1
30*
48
100.0-
71.8
3640
37 68* ▲
▲
▲
▼
3,766.1
-
52.5
34
53.6
22
25.2
▲
▼
28
▼
▲
24.7
3327.8
32
88.4
2.3 153*
42.4
▲
1,694.3
35 ▼
-4
84.5
▲
46
-11
44* 9
Jan 1 - Dec 31
25
12
-
43
▼
-
30 19*
30* 233,005.45
MM2 - Undisclosed Values & Values up to US$500m
Duff & Phelps 10
55* 1023
59
-7
13
18
38* 37
26
11 65
https://www.thomsonone.com
64*
14
-9.0 17.7
37
36
-3
11
34
32*
36
24*
20
▲15
1,424.8
▲
Credit Suisse
-
Tudor Pickering & Co LLC
PricewaterhouseCoopers
-
5,340.0
33
38*
▲
-18.0▼
7
SunTrust Banks
Sandler O'Neill Partners
Citi
Stout Risius Ross Inc
-
-
67
Lincoln International
22735
AGC Partners
24*
PNC Financial Services Group
1,684.2
25
182.4
1,111.7
12,710Industry Total
-38*
32*
8
-37.032
-15
-
▼
-
500
1,000
1,500
2,000
2,500
3,000
3,500
4,000
$0
$10
$20
$30
$40
$50
$60
$70
$80
# o
f D
ea
ls
Ra
nk V
alu
e (
US
$b
)
US$0 - 50m US$50 - 100m US$100 - 200m US$200 - 500m
19.9%
14.2%
13.6%
9.7%
9.0%
7.5%
7.4%
6.9%
4.2%
3.4% 3.3%
Real Estate
High Technology
Financials
Energy and Power
Healthcare
Industrials
Consumer Products and Services
Media and Entertainment
Materials
Consumer Staples
Retail
Telecommunications
3
Full Year 2017 │ Mid-Market M&A Up To US$500m │ Financial Advisors
Canadian Involvement Mid-Market Rankings (MM22)
*tie
** Fee exposure indicates each firm's mid-market fees from deals valued at up to US$500m as a percentage of its overall M&A fees in the relevant region.† Imputed Fees shown are based on completed deal activity, whereas deal count & rank values are compiled based on announced deal activity.
Visit http://dmi.thomsonreuters.com to View Archives and Order Custom League Tables
Needham & Co LLC 38* - 4 4 ▲ 56.6 - -81.1 ▼ 2.2 61 100.0
William Blair & Co 38* 61* 4 2 ▲ 136.0 - -89.4 ▼ 4.0 41 100.0
34* 12* 5 -7 ▼
Wells Fargo & Co 38*
-
5.0
3.1 46 100.0
Jefferies LLC 12* 15* 11 1 ▲ 1,720.6 9 223.7 ▲ 20.2 7 100.0
▲
- -
517.8 -
19 15940.0 ▲ 8.6
Duff & Phelps 24* 35* 9 4 ▲ 48.2 - -91.4 ▼
96.2 82 -80.2 ▼ 17.7 9 81.6
Piper Jaffray Cos 20* 35* 14 69.8
14.2
10 5
Rothschild & Co 27* 8 8 -8 ▼ 962.4
10 ▲ 4,830.5
2017
Haywood Securities Ltd. 20* 14
26.1
23* 11 3 ▲ 831.4
Ernst & Young LLP 24*
852.3 20 136.8 ▲ 13.4
10.7 - -8.5 ▼
1.1 - -99.9 ▼
1,016.2 18 89.4 ▲
327.2 45
Source: Thomson Reuters
https://www.thomsonone.com
Industry Total 3,723 1,197 ▲ 61,621.8 27.0 ▲ 1,191.1 54.4
38*
Canadian Mid-Market M&A up to US$500m by Target Industry Jan 1 - Dec 31
Houlihan Lokey 24* 5 9 -11 ▼
3.8 42* 100.0
Citi 20* 61* 10 8 ▲ 2,037.7 7 152.1 ▲ 11.6 16 31.5
Canaccord Genuity 20* 15* 10 0 - 1,151.3 14 81.9 ▲
4.3 36 100.0
13
42* 9 5 ▲ 424.2 35 -19.5 ▼ 1.8 69*
Lazard 12* 27* 11 4 ▲ 1,047.2 17 -43.2 ▼ 5.0 31* 22.9
JP Morgan 12* 29* 11 5 ▲ 1,877.5 8 408.5 ▲ 27.6 4 31.2
Evercore Partners 12* 15* 11 1 ▲ 841.2 21 -45.2 ▼ 20.0 8 74.6
Credit Suisse 12* 21* 11
Macquarie Group 12* 11 11 -2 ▼ 1,148.2 15 -27.5 ▼ 9.0
Deloitte 12*
Raymond James Financial Inc 9 15* 14 4 ▲ 1,179.3 13 70.1 ▲ 16.6 10* 84.3
▲ 760.8 23 -42.9 ▼ 5.5 29 100.0
Goldman Sachs & Co 10* 21* 12 3 ▲ 1,572.4 10 6.4 ▲ 22.1 3 23.8
Scotiabank 12* 12* 11 -1 ▼ 2,206.3 6 282.4 ▲
2 17.6
12.5 15 24.5
RBC Capital Markets 3* 1 30 3 ▲ 4,929.6 1 257.5 ▲ 41.1 1 54.8
GMP Capital Corp 7* 9* 15 1 ▲ 1,569.3 11 829.7 ▲ 7.3 22 100.0
3*
28.8▼
22 134.1 ▲ 2.9 51 45.3
CIBC World Markets Inc 5 6* 22 5 ▲ 2,396.6 5 -45.0 ▼ 20.5 6 37.4
National Bank of Canada Fin'l 6 2* 20 -4
Cormark Securities Inc 10* 15* 12 2
MM22 - Undisclosed Values & Values up to US$500m Jan 1 - Dec 31
# of Deals per Advisor
2 63.6 ▲ 32.1 2 48.7
20 68.3
TD Securities Inc 2 2*
▲ 1,360.7 12 102.2 ▲ 11.1 18
31 7 ▲ 4,062.0 3 2046.9 ▲ 28.8
2017 ** Fee
KPMG
Rank Value Advisor
Canadian Mid-Market M&A up to US$500m by Rank Value Range
Imputed Fees (US$m) †
3 29.7
42*
-1 ▼
Bank of America Merrill Lynch 38* 23* 4 -4 ▼
Maxit Capital LP 38* 86* 4 3 ▲
Fort Capital Corp
- 4 4 ▲
Lincoln International
Evans & Evans Inc 38* 35* 4
- - -
190.7 -
- - -
717.7 24 -
10 -1 ▼ 206.5 - -47.1 ▼ 4.1 37* 100.0
Generational Equity 27* 52*
Baker Tilly International 27* 29*
Morgan Stanley 30 23*
2 ▲
86*
HSBC Holdings PLC 31* - 6 6 ▲
CFI 31*
19 42.7
6* 30 13 ▲ 354.3 - -91.7 ▼
Rank Value per Advisor (US$m)
▼ 2,397.0 4
2016 # of Change in Rank Value 2017
31*
100.0
8 5 ▲
8 2 ▲
2.1 62
Itau Unibanco 34*
Moelis & Co
▼
BNP Paribas SA
PricewaterhouseCoopers 7* 9* 15 1 ▲ 109.2 - -91.8
▼
50.0 - - -
354.4 - -73.6 ▼
498.0 28 1186.8 ▲
496.7
7 -1
Financial Advisor Rank Rank Deals # of Deals US$m Rank Change (%)
BMO Capital Markets
6 2 ▲
4 3 ▲
Blair Franklin Capital Part
403.7 ▲
3.5 127 -99.3 ▼
438.3 - -4.6
7.0 23 100.0
Fees Rank Exp. (%)
5203.1 ▲ 16.6 10* 41.0
38* 61* 4
42* 6 2 ▲
Deutsche Bank 34* 35*
38*
27* 5 -2 ▼
- 5 5 ▲
34*
1 4 33
5 0 -
IMAP
.6 136* 100.0
15.5 12 16.8
5.1 30 100.0
5.6 28 51.9
4.1 37* 100.0
6.7 24 100.0
3.0 47* 100.0
1.9 67* 100.0
6.0 27 54.5
2.4 58* 100.0
.6 136* 100.0
2.3 60 100.0
4.1 37* 6.6
5.0 31* 59.5
2.5 56* 100.0
5.0 31* 100.0
7.8 21 100.0
61* 4 2 ▲
Oaklins (FKA M&A Intl Inc) 38* 52* 4 1 ▲
Robert W Baird & Co Inc 38* 86* 4 3 ▲
246.7 ▲
100.3 - -48.7 ▼
25.6 - -97.0 ▼
1,049.1 16 2028.0 ▲
290.5 - 42.8 ▲
365.8 - -18.7 ▼
-
200
400
600
800
1,000
1,200
$0
$5
$10
$15
$20
$25
# o
f D
ea
ls
Ra
nk V
alu
e (
US
$b
)
US$0 - 50m US$50 - 100m US$100 - 200m US$200 - 500m
19.8%
19.3%
14.5%
10.4%
7.9%
6.8%
5.1%
4.9%
3.9%
3.8%
2.6% Real Estate
Energy and Power
Materials
Industrials
High Technology
Financials
Media and Entertainment
Healthcare
Consumer Products and Services
Consumer Staples
Retail
Telecommunications
4
Full Year 2017 │ Mid-Market M&A Up To US$500m │ Financial Advisors
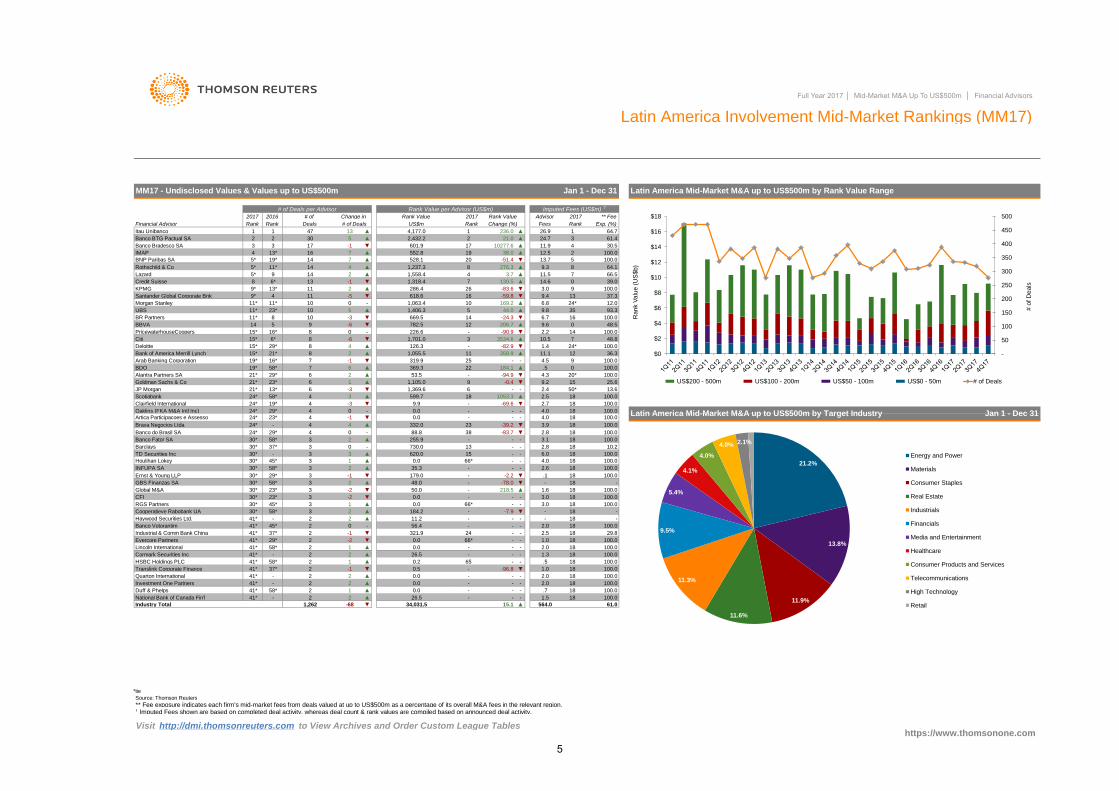
Latin America Involvement Mid-Market Rankings (MM17)
*tie
Source: Thomson Reuters
** Fee exposure indicates each firm's mid-market fees from deals valued at up to US$500m as a percentage of its overall M&A fees in the relevant region.† Imputed Fees shown are based on completed deal activity, whereas deal count & rank values are compiled based on announced deal activity.
Visit http://dmi.thomsonreuters.com to View Archives and Order Custom League Tables
National Bank of Canada Fin'l 41* - 2 2 ▲ 26.5 - - - 1.5 18 100.0
Translink Corporate Finance 41* 37* 2 -1 ▼ 0.5 - -96.8 ▼ 1.0 18 100.0
Quarton International 41* - 2 2 ▲ 0.0 - - - 2.0 18 100.0
Investment One Partners 41* - 2 2 ▲ 0.0 - - - 2.0 18
Cormark Securities Inc 41* - 2 2 ▲ 26.5 - - - 1.3 18 100.0
HSBC Holdings PLC 41* 58* 2 1 ▲ 0.2 65 - - .5 18
Duff & Phelps 41* 58* 2 1 ▲ 0.0 - - - .7 18 100.0
Evercore Partners 41* 29* 2 -2 ▼ 0.0 66* - - 1.0 18 100.0
0 - 56.4 - - - 2.0 18 100.0
Industrial & Comm Bank China 41* 37* 2 -1 ▼ 321.9 24 - - 2.5 18 29.8
21*
8
▼
CFI 30* 23* 3 -2
2017 Advisor 2017
100.0
100.0
18 1053.3
100.0▼
2.4 50*
▲
3 ▲
4
24* - 4 4 ▲
Banco do Brasil SA 24*
100.0
0
Rank
-
Bank of America Merrill Lynch
11*
▼
13*
44.0
14
5
14
11*
9
1,369.6
21*
PricewaterhouseCoopers
29*
Lincoln International
Cooperatieve Rabobank UA 30* 58* 3 2 ▲ 184.2 - -7.9 ▼ - 18 -
6 -3
319.9 9
8
100.0
18 100.0
18
▼ 179.0 ▼ .1 18 100.0
30* 45* 3 1 ▲
▼
RGS Partners
2017 Rank Value# of
9.3
10
2
601.9
US$m
3.7
10
286.4
71,318.4
1
4
3
Credit Suisse
6*
58*
6
8
3 3 ▲
Global M&A 30* 23* 3 -2 ▼ 50.0
GBS Finanzas SA 30* 58* 3
Houlihan Lokey
30.5
13.6JP Morgan
-24.3
5
4.5
1,105.0
-
▲
206.7
669.5
▲
13
▲
20*
Deals
2
Morgan Stanley
21*
▼
-69.6 ▼
11.9
8
▲
Haywood Securities Ltd. 41* -
0
15
13* 6
15*
599.7
5
Scotiabank
Change (%)
16
14
1 -0.4
48.8
218.5 ▲ 1.6 18
24*
24* 58*
-
564.0
100.0
37.3
9.2
.5
25.6
11.5
14.6
2.7
100.0
24*
100.0
35
▼
11.1
620.0 15 - - 6.0 18 100.0
0.0 66* - - 4.0
0.0 -
100.0
- - 3.0 18 100.0
- -78.0 ▼ - 18 -
-
100.0
- - - - 18 -
-82.9
▲
64.1
93.3
12.0
48.5
100.0
Latin America Mid-Market M&A up to US$500m by Target Industry Jan 1 - Dec 31
5*
11 ▲ 26
14
-1
24*
7
30* 45* 3 1
2.6 18 100.0
2 ▲ 48.0
41* 58* 2 1 ▲ 0.0 - - - 2.0 18 100.0
1
100.0
100.0
-59.8
▲
Change in
-
36.3
-
34,031.5 15.1
100.0
INFUPA SA 30* 58* 3 2 ▲ 35.3
2
19*
3
▼
6.7
9*
Financial Advisor
Itau Unibanco
Banco BTG Pactual SA
6.8▲
1
0
4,177.0
2
24*
17
▲
6* 39.0
Rank Value per Advisor (US$m)
236.0
5
Rank
66.5
Latin America Mid-Market M&A up to US$500m by Rank Value Range
126.3
MM17 - Undisclosed Values & Values up to US$500m
1,237.3
38.0
9
4
26.9
16BR Partners
12.5
9.4
3.0
130.5
19*
10
100.0
▼
Deloitte
1
-5 ▼11
-1
IMAP 7
618.6
61.4
KPMG
-
-3
4
▼
-6
25* 1,558.4
▲
# of Deals per Advisor
47
11
Exp. (%)
** FeeRank Value
4
Citi ▲1,701.0
15* 226.6
BBVA
Imputed Fees (US$m) †
64.7
2,432.2
Fees
24.7
13.7
▼
10.5
▲
782.5
20
https://www.thomsonone.com
-
Industry Total 1,262 -68
-3
16*
Artica Participacoes e Assesso 24* 23* 4 -1 ▼
Brava Negocios Ltda
9.9
BDO
Clairfield International
2.5 18
100.0
30* -
100.0
▲
2 ▲ 11.2
23* 1,406.3
11*
Rank Rank
4
▼
29* 4 0 -
2.8 18
4
2016
1.4
Jan 1 - Dec 31
▲
▼
▲
- -
61.0
18
▼
0.0
7
0
- 1,063.4
▲ 9.6
▼
-6
4.0 18 100.0
▲
-
3.9
- -
10
22
7
18 100.0
-
25
UBS
13
6
29* 3 -1
▲
0
Alantra Partners SA
369.3
358.92 ▲
Arab Banking Corporation -1
16*
30
4
12
21.0
Oaklins (FKA M&A Intl Inc)
19*
▲
4.3
7
21*
-90.9
▼
Santander Global Corporate Bnk
23* 9
2
3
29* 4 0 - 38 -83.7 ▼
4.00.0 - - -
332.0
TD Securities Inc
3534.6
-
184.1
9
9.8
▲
528.1
▼
7
▼
▲
▲
# of Deals
10277.6
15*
1,055.5
▲
30*
19*
Banco Bradesco SA
Rothschild & Co 14
552.8
8
19
17
BNP Paribas SA
▲
-94.953.5
29* 8
3
12
▼
13
5
16
276.3
▲
8
8
11*
2
15*
▲
14
2.2
11*
9* 2 -83.6
169.2
13*
-51.45*
Lazard
Goldman Sachs & Co
- - 3.0
Banco Votorantim 41* 45* 2
▲ 255.9 - - - 3.1 18 100.0
Barclays 30* 37* 3 0 - 730.0 13 - - 2.8 18 10.2
18
23 -39.2 ▼
88.8
-
6
Ernst & Young LLP
Banco Fator SA 30* 58* 3 2
- -2.2
▲ 0.0 66*
-
50
100
150
200
250
300
350
400
450
500
$0
$2
$4
$6
$8
$10
$12
$14
$16
$18
# o
f D
ea
ls
Rank V
alu
e (
US
$b)
US$200 - 500m US$100 - 200m US$50 - 100m US$0 - 50m # of Deals
21.2%
13.8%
11.9%
11.6%
11.3%
9.5%
5.4%
4.1%
4.0%
4.0% 2.1%
Energy and Power
Materials
Consumer Staples
Real Estate
Industrials
Financials
Media and Entertainment
Healthcare
Consumer Products and Services
Telecommunications
High Technology
Retail
5
Full Year 2017 │ Mid-Market M&A Up To US$500m │ Financial Advisors
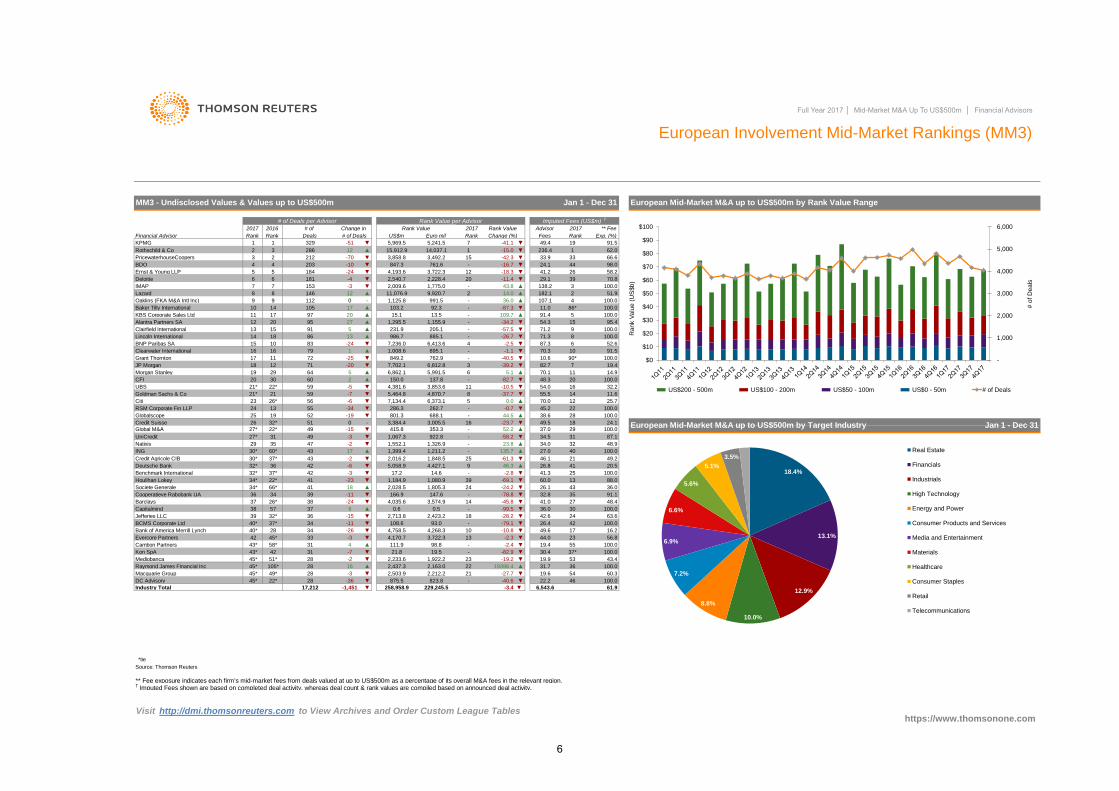
European Involvement Mid-Market Rankings (MM3)
** Fee exposure indicates each firm's mid-market fees from deals valued at up to US$500m as a percentage of its overall M&A fees in the relevant region.† Imputed Fees shown are based on completed deal activity, whereas deal count & rank values are compiled based on announced deal activity.
Visit http://dmi.thomsonreuters.com to View Archives and Order Custom League Tables
42
UniCredit
39
Rank Exp. (%)
▼
5
3
43*
2,713.8
▼
19.5
16.2
56.8
31
63.6
100.0
26.4
▼
Industry Total
Deutsche Bank
ING
-2.3
43* -
45*
Cooperatieve Rabobank UA
Credit Agricole CIB
-7
36
▼
93.0
-15
98.858*
44.0
31
33Evercore Partners
Barclays
Cambon Partners
Bank of America Merrill Lynch
Kon SpA 42
-61.3
0.6
▼
24
▼
27
4
4,170.7
-19 28
49
14
43
-99.5
688.1
-23.7
-15.0
Globalscope 52
57
4,193.6
20
103.2
1,155.9
15.1 13.5
-
Deloitte 6 -4181
1
83
25
23.8
-82.9
38
▼
37*
40* 28
-3
23
▲
212
8
-
▼
-0.7
26*
** Fee
135.7
-11
-45.8
415.8
0
-26
20.5
90*
European Mid-Market M&A up to US$500m by Target Industry
-82.7
49.6
32.2
https://www.thomsonone.com
49.2
48.9
40
45.2
Jan 1 - Dec 31
6
100.0
14.9
-34.2
52.6
86*
5,241.5
-87.3
762.9
▼
62.0
20172017
2
-
-16.7
100.0
91.5
15
1
1,125.8
92.3
European Mid-Market M&A up to US$500m by Rank Value Range
41.2
Deals
▼
847.3
58.2
70.8
15
17
PricewaterhouseCoopers
100.0
2
14
112
27
236.4
7
6
13
2
-40.5
▲
34.5
47
▲
13
55
Natixis
1
-79.1
▲
-
22
54.0-10.5
29
986.7
▼
-3
-
19.4
▲
7,236.0
▼
105
▼
▲
108.6
111.9
2,423.2
-11 ▼
▼3,384.4
Change (%)
91.1
▼
-69.1
▲
30.4
Capitalmind
Societe Generale
BCMS Corporate Ltd
66*
22*
32*
6,543.6
37
32*
30*
34*
40*
34*
100.0
61.9
-
▼
▲
5,058.9
-10.8
▼
88.0
41.3
34
48.4
39
4,427.1
19.4
4,268.3
▼
18
▼
100.0
3,722.3
21.8
30
71.2 9
54.3
-
-2
70.0
▼ 48.3
21
6,862.1 5,991.5
▲1,775.0
Advisor
1,211.2
37*
-18.3
-51
5
991.5
-25
71.3
1,067.331
0.5
2,016.2 1,848.5
229,245.5▼ ▼
36.0
37*
-1,451
▼ 21
36
▲
35▼
4142
4,758.5
-
37*
▼
Source: Thomson Reuters
100.0
100.0
-
-2.8
52.2
38.6
27*
5
2,028.5 24
-78.8
Lincoln International
16
885.1
▼
-34
-3.4
▲
6,812.8
1,399.4
60.0
▼-
13
17 ▲
-23
-3
258,958.9
▼
100.0
42
*tie
▼
49.5
Baker Tilly International
▼
37
▼
36.0
Goldman Sachs & Co
60
-6
42.6
16
▼
-24 ▼ 4,035.6
27.0-60*
▼
-15
41
34
▼
86
5,464.8
19Morgan Stanley
-39.2
5.1
30
-20
▼-6
-3
9
-37.7
5
44.5
43
20
18
▲
▼
59
▲
▲
1,184.9
-24.2
41
13
▼ -58.2
▼
10
26
5
-24
Oaklins (FKA M&A Intl Inc)
15
Imputed Fees (US$m) †
Fees
19
5
12
44
▲Rothschild & Co
138.2
87.3
184 12
36.0
Grant Thornton
Clearwater International
▲
-57.5
-42.3 ▼
Euro mil
5,969.5
29.1
▼
16 79
-10
Ernst & Young LLP
4
▼
2016
MM3 - Undisclosed Values & Values up to US$500m
1,008.6
-
4
-
-2.5
Rank
761.6
9,920.7
329 -41.1
15 10BNP Paribas SA
US$m
3,858.8
4,381.622*
25.723
95
10
Rank
203
286.3 262.7
72
Jan 1 - Dec 31
91 100.0
7,702.1▼
39
▼
3,492.2
9
Rank Value per Advisor
Rank Value
2
-
12
100.0
100.0
87.1
29
32
801.3
146
▼
97
20
7
137.8
14.6
43
▼
Citi
▼
Rank
RSM Corporate Fin LLP
18
4
3
153
71
849.2
14
66.633
98.0
895.1
▲
55
▼
-
3,853.6
109.7
55.5
17 11
▼
-
Alantra Partners SA
9 0
82.7
KBS Corporate Sales Ltd
12
3,722.3
91.5
20
2,540.7
100.0
-26.7
100.0
2,228.4
100.0
BDO
10.6
70.3-1.1
7
15,912.9
11.0
11.6
46.1
1,805.3
147.6
▼
19
21*
2
21*
59
12
0.0
11
46.3
10
3,574.9
29
54
20
▲
Houlihan Lokey
286
33.9
2017
24.1
Lazard
Clairfield International
-
▲
IMAP
▼
-
▼
43.8
UBS
2,233.6 1,922.2
Benchmark International
49.4
8
6
150.0
Rank Value
11
-11.4
▼
▼
-2.4
42 17.2
26.1
-
KPMG
-70 ▼
8
32.8
6,373.1
3,005.5
353.3
18
39
▼
1,080.9
▲
19.6
91.4
-7
Mediobanca 45* 51* 28 -2 ▼
Raymond James Financial Inc 45* 105* 28 16 ▲
▲
17
13
# of Deals
1
23 -19.2 ▼
14
26.8
70.1
9
34
45* 49* 28 -3 ▼
45* -36 ▼
Financial Advisor
14.0
4
-24
6,413.6
11,076.9
Jefferies LLC
-
-
100.0
56
51
31
-
37.0Global M&A
100.0
51.9
CFI
95.4
▼
12
Credit Suisse
49
22*
25
27* 922.8
▼
JP Morgan 3
2,009.6
Macquarie Group
DC Advisory 22* 28
1164
1,295.5
7
-
14,037.1
231.9
▲
▼
26
24
24.118
205.1
3
182.1
107.1
▼
8
-28.2
32*
30*
38
17
▲
# of Deals per Advisor
# of Change in
60.3
22.2 46 100.0
-5 16
▼
7,134.4
19.9 53 43.4
31.7 36 100.0
-40.6 ▼
4,870.7
36
32*
166.9
41.0
34.0
25
▲
-
1,552.1
1
2,437.3 2,163.0 22 19398.4 ▲
2,503.9 2,212.2 21 -27.7 ▼
875.5 823.8 -
-2
▼
17,212
1,326.935
26*
-
1,000
2,000
3,000
4,000
5,000
6,000
$0
$10
$20
$30
$40
$50
$60
$70
$80
$90
$100
# o
f D
ea
ls
Ra
nk V
alu
e (
US
$b
)
US$200 - 500m US$100 - 200m US$50 - 100m US$0 - 50m # of Deals
18.4%
13.1%
12.9%
10.0%
8.8%
7.2%
6.9%
6.6%
5.6%
5.1%
3.5% Real Estate
Financials
Industrials
High Technology
Energy and Power
Consumer Products and Services
Media and Entertainment
Materials
Healthcare
Consumer Staples
Retail
Telecommunications
6

Full Year 2017 │ Mid-Market M&A Up To US$500m │ Financial Advisors
UK Involvement Mid-Market Rankings (MM4)
** Fee exposure indicates each firm's mid-market fees from deals valued at up to US$500m as a percentage of its overall M&A fees in the relevant region.
Visit http://dmi.thomsonreuters.com to View Archives and Order Custom League Tables
553.3
100.0▼
21.8
4,580
17.6 21
1,944.2
▲
19
# of Deals per Advisor
Clairfield International
6
39.313.0
-
Grant Thornton
6.1
21.5
Investec
-
Baker Tilly International
170.9
16 25.8
7.3 49
3,347.6
27
304.5
22*
94*
15
† Imputed Fees shown are based on completed deal activity, whereas deal count & rank values are compiled based on announced deal activity.
27
▼
▼
-3
▼
51.1
24
Benchmark International
69*
Financial Advisor
69.8
1,121.5
2.1
17 ▼
1,476.3
▼
21
▲
Oaklins (FKA M&A Intl Inc)
2
20* 46*Morgan Stanley
24.6
17
34*
-12
47.1
finnCap Ltd
Barclays
▼
1 6
-42.2 ▼
50
▼
45
30*
100.0
9
15.835.9
-
Citi
343.5
27.4
https://www.thomsonone.com
-48.6
24*
-5
6.9
1027.9
▼
-37.0
6
109.7
2,623.1
3
-4.6
26*
▲
JP Morgan
RSM Corporate Fin LLP
Goldman Sachs & Co
BDO
Ernst & Young LLP
31.1
▲
16*
1.0
# of
3▼
▲
602.8
85
BCMS Corporate Ltd
-9
▲
KPMG
-13.3
11
-0.7
934.4
▼-2
Rothschild & Co
-
-42.0
1,616.0
44
▲
Deals
2017
Rank
60
97
2,790.3 2,161.2
▲
▼
124 -79.9
7.2
14.9
33
226.6
26*
19
2,584.4
37.2
▼165
Rank Value Rank Value
454
52.3
100.0
93.6
15.0
44*
100.0
UK Mid-Market M&A up to US$500m by Target Industry Jan 1 - Dec 31
Jan 1 - Dec 31
Change (%)
UK Mid-Market M&A up to US$500m by Rank Value Range
100.0
30*
23.5
-
100.0
100.0
-2
292.3
867.3
5.7 66
10.8
61.7
100.0
11.0
▼
11
8
30*
44.2
100.0
15.1
▼
▲
196.0 152.3 - 167.4
5
2016
5,329.3
-30.2
61.7
100.0
100.0
-6
-11
32.1
11
100.0
3.0
▼
-
65.2
11
34*
91.4
26.3
▲
10.0 34*
▲
▼
41
▼
24* 45
-28 7.8
13*
18
577.9
MM4 - Undisclosed Values & Values up to US$500m
Rank Value per Advisor
▲
10
-
▼ ▼
2017
▼
-34
Fees
10
7
1,245.8 20.1▼
Imputed Fees (US$m) †
100.0
-3
44.5
8.3
22
Piper Jaffray Cos
Credit Suisse
17
2.984.8
125.4
13*
51
46.2
85.6
74,382.8
25
100.0
GBP mil
21*
9.8
61*
4 ▼
-94.9
7
695.3
5
20
-8.0
454.1
100.0
▼
-2.8
10
-
-25.7
▲
-57.6
-2
85*
** Fee
▼
▼
391.1
29
▼
38
▼ ▼
2,110.5
12
7
17.2
▼
8
▲
8 9.8
13.8
94.0
727.3
-
49.5
53*
16
-61.0
100.0
-13
▼
23
646.0
- 815.6
▼
21.9
-21
2
24
▼
581.2
-
887.6
6
Change in
# of Deals
Advisor2017
629.5
12.9
60
US$m
245.8
▲
7
9
24.4
707.0
11
-
28
▲
1,659.4 1,285.3
11.7
715.8
42 56.8
-
▲ -35.4
286.3
58
95.4
61.1
100.0
-34.25
26.9
2.6
49.7
▲
108*
12
2,443.0
-2
19
-
1,151.5
37.3
24.4
▼
38
-65.6
104.2
2
▼
2
29
30*
22
1,607.0
*tie
Source: Thomson Reuters
Exp. (%)
KBS Corporate Sales Ltd
101*
Lincoln International
IMAP
80.1
-
7.1
28
Rank
36*
36*
899.7
27.3
PricewaterhouseCoopers 5*
13*Deloitte
Alantra Partners SA
Clearwater International
12
9
Rank
1011
▼
Rank
9
13*
14
100.017*
2,305.3Industry Total
▲
19
40*
15
17.2
13
▲58.7
26*
▼
266.6
4
30*
1,249.5
UBS
-3 ▼
Cenkos Securities PLC
Evercore Partners
Liberum Capital
▼
▼
▲
30*
27*
-2
17 -4
21 369.9
-31.8
-55.5
27*
18
816 -3
-1.7
13
▼
-85.7
751.4
7
576.6
32
20
7
237
▼
11
▲
5*
40 ▼
6,909.8
2,260.7
Mazars SA
2,021.422*
Bank of America Merrill Lynch
Duff & Phelps
Jefferies LLC
Numis
1
Lazard
18*
38.7
314.8
15.5
500.5
4
34.6
546.1
▲
1
66
19
20
1
1,808.8
38
465.1▲
100.0
16
18*
15
21.3
3
▲
11
96,141.7
▲
-72.8
1,107.4
21 -42.3 ▼
57.9 44.3
16* 17 -14
14
▲
-521*
8
32
▼
58.6
-7
37*
24
22
2,936.8
-3.52
8
2
531.4
▼
837.2▲ 417.9 ▲
Canaccord Genuity 37* 51*
Macquarie Group 37* 34* 14 -6 ▼
▼
1,517.5
▼
-2
224.1
Houlihan Lokey
- -37.8
724.5 555.0 34
65.3
20*
15
27
18*
3
24
2
38 100.0
10.6 33 24.1
1,349.5 1,047.0 14 -33.5 ▼
1,078.9 843.0 24 75.8 ▲
1,112.4 812.2
13.9 26
46* 14
30*
34*
34*
36
37*
37*
14 2 ▲
Deutsche Bank 37* 37* 14 -5 ▼
25* 16
▼
8.9
31 100.0
21.5 17* 46.6
6.4 58* 100.0
3.2 84 100.0
1.7 128* 100.0
5.4 68 100.0
8.7 39* 100.0
WH Ireland Ltd 46* 40* 11 -5 ▼
Standard Chartered PLC 46* 88* 11 6 ▲
CFI 46* 40* 11 -5 ▼
125.5 ▲
1,314.8 1,014.7 15 212.2 ▲
245.6 185.2 - 46.2 ▲
1,017.2 783.2 - 77.2 ▲
115.9 89.0 - 83.1 ▲
1,142.4 867.5 20
Sentio Partners LLP
40.5 ▲
6.1 4.8 - -96.3 ▼
Peel Hunt LLP 43* 46* 13 0 -
11.3
22 -10.9
37* 54* 14 4 ▲
BNP Paribas SA 43* 40* 13 -3 ▼
Global M&A 43* 39 13 -4 ▼
132.8 101.0 -
-
200
400
600
800
1,000
1,200
1,400
$0
$5
$10
$15
$20
$25
$30
$35
$40
# o
f D
eals
Rank V
alu
e (
US
$b)
US$200 - 500m US$100 - 200m US$50 - 100m US$0 - 50m # of Deals
21.3%
14.0%
11.1%
9.6%
8.4%
7.9%
7.8%
5.7%
5.7%
4.5% 3.7% Real Estate
Financials
High Technology
Consumer Products and Services
Industrials
Media and Entertainment
Energy and Power
Healthcare
Materials
Retail
Consumer Staples
Telecommunications
7
Full Year 2017 │ Mid-Market M&A Up To US$500m │ Financial Advisors
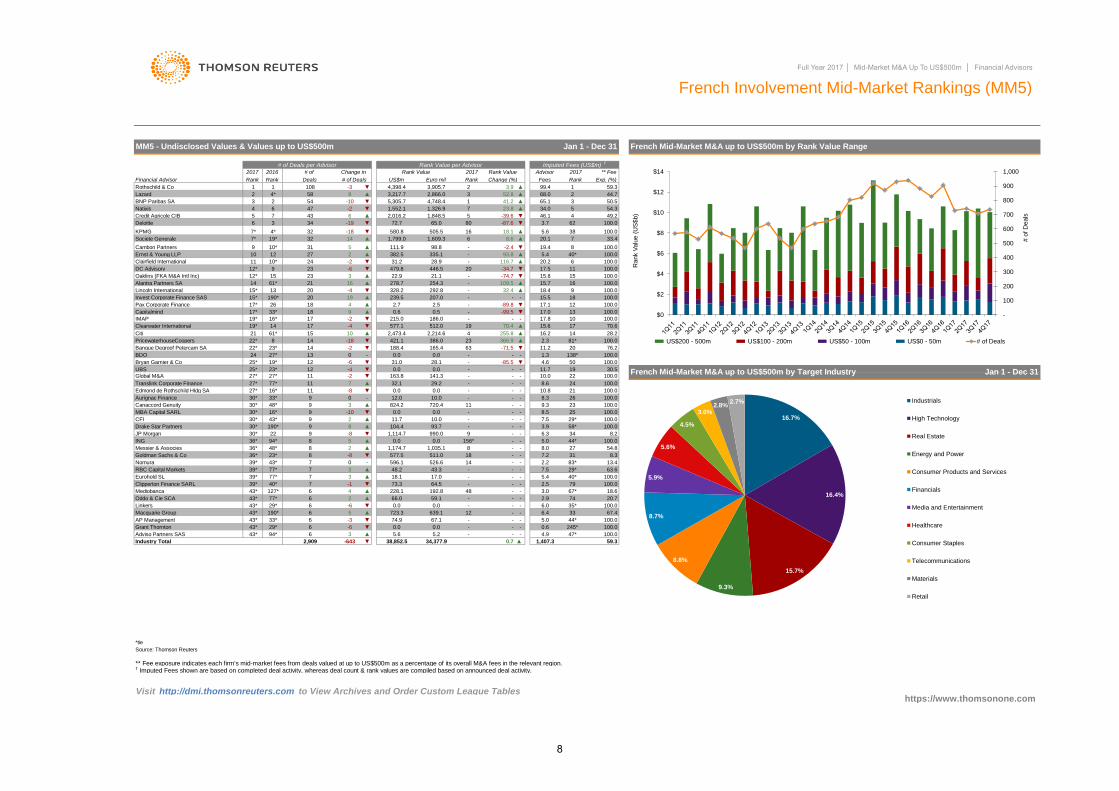
French Involvement Mid-Market Rankings (MM5)
** Fee exposure indicates each firm's mid-market fees from deals valued at up to US$500m as a percentage of its overall M&A fees in the relevant region.† Imputed Fees shown are based on completed deal activity, whereas deal count & rank values are compiled based on announced deal activity.
Visit http://dmi.thomsonreuters.com to View Archives and Order Custom League Tables
100.0
Grant Thornton 43* 29* 6 -6 ▼ 0.0 0.0 - - - 0.6 245* 100.0
Adviso Partners SAS 43* 94* 6 3 ▲ 5.6 5.2 - - - 4.9 47* 100.0
*tie
0.7
27*
Oaklins (FKA M&A Intl Inc)
3.9
▼
100.0
59.3
33.4
70.6
28.2
100.0
100.0
100.0
100.0
- -
-
32.4
1.3
8.6
Canaccord Genuity 30* 48* 9 3 ▲ 824.2
ING
Messier & Associes 36* 48* 8
▼
5
Rothschild & Co
-196
▲476
-87.6
▲
-39.6
18 13
6
-4
9 -8 ▼ 1,114.7
▲386.0
0.6
17.1
2
# of
20
-
Rank
15*
10*
1,848.5Credit Agricole CIB
18
8 -8 ▼ 577.5
36*
6 -3 ▼ 74.9 67.1 - - - 5.0 44*
Euro mil
Natixis
BNP Paribas SA
-4
-2
6
2
17*
27*
12*
328.2
-
15.7
15
40*
9
▼24
1127* -8
58
3
49.2
17.8
Rank Value per Advisor
Source: Thomson Reuters
512.0
2,473.4
PricewaterhouseCoopers
7
19*
-3
Lincoln International
DC Advisory
Citi
Pax Corporate Finance
Nomura
9
RBC Capital Markets 39*
13
-
8.2
8 - - 8.0
366.9
- -
50
▼
8 5 ▲ 0.0 0.0
- 7.5
MBA Capital SARL 30* 16* 9 -10 ▼ 0.0
66.0 59.1
▼
1,035.1
34,377.9▼
10.0
720.4
94*
JP Morgan 30* 22
Aurignac Finance 30*
Eurohold SL 39*
Clipperton Finance SARL
33*
1,609.3▲
CFI 30*
▼
77*
Goldman Sachs & Co 36*
39*
65.0
111.9
▼ 0.0
Clearwater International
Societe Generale
Deloitte
Invest Corporate Finance SAS
Global M&A
Bryan Garnier & Co
BDO
0.0
▲
6 2 ▲
18.1 17.0
9 0 - 12.0
990.0 9 - - 6.3 34
- - -
5.4 40*
59.3
156*
11
▲38,852.5
▲ 1,174.7
2.2 83* 13.4
23*
2
Industry Total
34
8
▼
6
0.0 19
9
11
23
1,799.0
▲
12*
27 54.8
511.0 18 - - 7.2 31
25*
- 10.0
27*
7*
▼
▲
UBS
▲
15
▲
382.5 5.4
23 ▲
▲
15*
21
141.3
446.5
-
93.8
4
▼
10
-18
French Mid-Market M&A up to US$500m by Rank Value Range
138*
65.1
46.1
20.1
1
https://www.thomsonone.com
French Mid-Market M&A up to US$500m by Target Industry Jan 1 - Dec 31
100.0
Imputed Fees (US$m) †
54.3
Advisor ** Fee
9.3
99.4
3
1 24,398.4
Fees
2016
4*
20172017 Rank Value2017 Rank Value
Jan 1 - Dec 31
50.5
Rank Exp. (%)Change (%)US$m# of Deals
IMAP
3
-
▲
7
-4
2.5 79
3.0 67*
2.9 74
- - - 8.3 26
32
32
31
-74.7
43* 7
19*
10*
38
31.012
23*
-2
11 29.2
188.4
▼
1223*
18.1
-2.45
▼
27
77*
2.3
207.0
77* 29*7 3 ▲ 48.2 43.3 -
77*
73.3 64.5 - - -
228.1 192.8 48 - -
11
-71.5 ▼
6 4
▲
28.1
-
-
-
▲
7 -1 ▼
- -
7*
Banque Degroof Petercam SA 22*
25*
27*
0 - 596.1 526.6 14 - -
AP Management 43* 33*
Edmond de Rothschild Hldg SA
16*
26 -89.8
3
Cambon Partners
Clairfield International
-
22.9
-
23
-
▼
2
▲
5,305.7 4,748.4
17*
Translink Corporate Finance
Capitalmind
70.4
8
20
14
2,214.6 ▲
15.6
-
2 ▲ 11.7 10.0 - -
100.0
Drake Star Partners 30* 190* 9
39* 40*
Mediobanca 43* 127*
Oddo & Cie SCA 43*
10
24
24
-
8.6
580.8 505.5
7
Lazard
20
-99.5
▲
20.2
17.0
22*
3.7
44.7
20
98.8
335.1
72.7
54
▲
19*
18.4
34.0
21.1
3,905.7
19.4
17
-10
Deals
7
62
- - - 8.5 25
21
-18 ▼ 421.1
▼
-
13
▼
4.6
292.8
81*
109.5 16
15
11▼
15.8
1,326.9
68.0
-6
14
1 41.2
52.82,866.03,217.7
43
523.8
33*
8
-2
▲
16.2
-2
-
▲
▼
9
61*
16*
-2 ▼
17
-
0.0
577.1
14
4
Financial Advisor
# of Deals per Advisor
▲ 104.4
61* 10
- -
43*
KPMG
108
MM5 - Undisclosed Values & Values up to US$500m
Rank
1,552.1
Change in
100.0
-
17
4
15.5
2.7 2.5
163.8
11.7
-
5.6
-
▲16
479.8
44*
9
1,407.3
Rank
11.2
1
4* 100.0
17.5
▼
0
3
2,016.2
186.0
2,909
- -
80
5
- 3.9 58* 100.0
7 3
Alantra Partners SA
100.0
Ernst & Young LLP
-6
- -
100.0
116.7
▼
10.8
-643
▲ 32.1
100.0
100.031.2 28.9
14
23
8.3
100.0
5.0
100.0
100.0
100.0
18.6
20.7
63.6
100.0
76.2
22
- - -
14
▼
215.0
0.0
0.0
239.5▲
254.3
▲
100.0
-
- 7.5 29* 100.0
100.0
12
18
▲
19
16
-85.5 ▼
63
0.5
100.0
100.0
-
100.0
100.0
100.0
30.5
19
0.0
278.7
▲
93.7 - -
-
190*
14
4
-34.7
19*
212
21
8
255.8
▼
▲
165.4
Linkers 43* 29* 6 -6 ▼
Macquarie Group 43* 190* 6 5 ▲
0.0 0.0 - - -
723.3 639.1 12 - -
6.0 35* 100.0
6.4 33 67.4
-
100
200
300
400
500
600
700
800
900
1,000
$0
$2
$4
$6
$8
$10
$12
$14
# o
f D
eals
Rank V
alu
e (
US
$b)
US$200 - 500m US$100 - 200m US$50 - 100m US$0 - 50m # of Deals
16.7%
16.4%
15.7%
9.3%
8.8%
8.7%
5.9%
5.6%
4.5%
3.0% 2.8%
2.7% Industrials
High Technology
Real Estate
Energy and Power
Consumer Products and Services
Financials
Media and Entertainment
Healthcare
Consumer Staples
Telecommunications
Materials
Retail
8
Full Year 2017 │ Mid-Market M&A Up To US$500m │ Financial Advisors
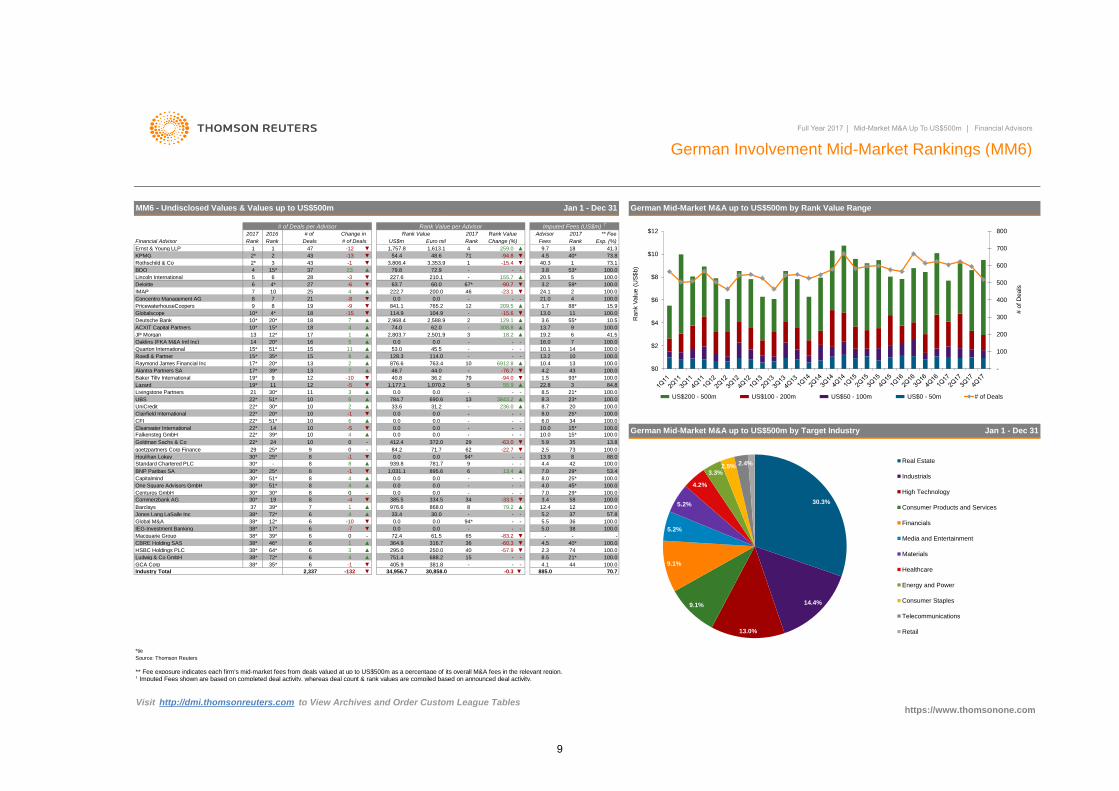
German Involvement Mid-Market Rankings (MM6)
** Fee exposure indicates each firm's mid-market fees from deals valued at up to US$500m as a percentage of its overall M&A fees in the relevant region.† Imputed Fees shown are based on completed deal activity, whereas deal count & rank values are compiled based on announced deal activity.
Visit http://dmi.thomsonreuters.com to View Archives and Order Custom League Tables
CBRE Holding SAS 38* 46* 6 1 ▲ 364.9 316.7 36 -60.3 ▼ 4.5 40* 100.0
Global M&A 38* 12* 6 -10 ▼ 0.0 0.0 94* - - 5.5 36 100.0
IEG-Investment Banking 38* 17* 6 -7 100.0
-
8.0
84.2
12
Centuros GmbH 30* 30* 8 0 -
-1
Clearwater International
Globalscope
-
55.9 3
-94.0
-
-
20
- -
▼
73
46
▲
15*
22.8
12765.2
11
-
PricewaterhouseCoopers
Goldman Sachs & Co 22*
22* ▲
▼
-
38* 39* 6
German Mid-Market M&A up to US$500m by Rank Value Range
-0.0
# of Deals
12.4 12
0 - 72.4 61.5 65 -83.2 ▼ - -
100.0
Jones Lang LaSalle Inc 38* 72* 6 4 ▲ 33.4 30.0 - - - 5.2 37 57.8
30*
1 ▲
*tie
Livingstone Partners
30* 51*
CFI
Raymond James Financial Inc
Quarton International
Oaklins (FKA M&A Intl Inc)
40*
40.3
-1
976.6
-
-90.7
- - -
14
13
▼ 0.0 0.0 - - - 5.0 38
8.7
1.5
9
93*
59*
23*
2.5
▲
3.6
6912.8
15*-
6.0
10
-
3843.2
8 0.0
10
841.1
25*
7
35*
13
10
# of
4.2
34,956.7
-5
5
43
11
-15*
13.0
# of Deals per Advisor
2016
1
Advisor
Imputed Fees (US$m) †
Change (%)
100.0
3
27
10
15
1,613.1
Rothschild & Co
▼
37
1
Euro mil
0.0
4
40.8 36.2
10*
Change in
222.7
Macquarie Group
10*
39*
2
-10
4 74.0
2,803.7
8
17
24
22*
30*
▼
2*
6
17*
Lincoln International
UBS
Clairfield International
21
33.6
22*
22*
19*
19*
22*
22*
Roedl & Partner
8Concentro Management AG
Deloitte
4 0.0
Rank Value
4
US$m
20*
-3
0.0 -
67*
45.5
▲
0.0
100.0
-15
100.0
▼
▲10
-
1.7
53.0
10.4
129.1
-
-
55*
8
100.0
21*
763.4▲
6
7 ▲
100.0
100.0
100.0
100.0
209.5
6
114.9
1,757.8
German Mid-Market M&A up to US$500m by Target Industry
-5
0.0
51*
13
11
13.8
71.7 62 -22.7 ▼
39*
9
20*
15
** Fee
48.6
84.8
4*
25*
-
0.0 94*
412.4
IMAP
Barclays 37 39* 7
-46.7
18
KPMG
Ernst & Young LLP
Financial Advisor
100.0
▼
▼
868.0 8 79.2 ▲
0.0
-
40 -57.9 ▼ 2.3 74 100.0
4 ▲ 751.4 688.2 15 - - 8.5 21* 100.0
-1 ▼ 405.9 381.8 - - - 4.1 44 100.0
3 ▲ 295.0 250.0
▼
3,353.9 -15.4
8.3
▼ 1,177.1 1,070.2
79
5
18.2
0.0
-
-
34
876.6
▲
▲
-
Jan 1 - Dec 31
-
100.0
▼
▲
2
3
100.0
-
-
Rank
259.0 9.7
Jan 1 - Dec 31
25* 100.0
10
236.0
-
▼
17*
11
4
20* 516
1
2017
UniCredit
Rank Deals
7
47
28
12
20*
BDO
19
885.0
4.0
100.0
4.5
Fees
-12
▼43
2
53*
-23.1
54.443
Deutsche Bank 2,588.9
▼
7
65
70.72,337Industry Total
13.9 8 88.0
4.4 42
Capitalmind 30* 51* 8 4
-0.3
100.0
29*
45*
▲ 0.0 0.0
19 8 -4 ▼ 385.5 334.5 34 -33.5
0.0 0.0 - 100.0
Commerzbank AG 30*
Rank
1
Rank
https://www.thomsonone.com
53.4895.6 6 13.4 ▲
29 25* 9 0 -
100.0
ACXIT Capital Partners
▼ 3.4 58 100.0
-
939.8 781.7
6
10 ▲
1014
0.0
35
-8 0.0
-6
79.8 72.9
21
2
Standard Chartered PLC
Houlihan Lokey
goetzpartners Corp Finance
30,858.0
15*
21.0
10.0
8 8 ▲
9
▲
100.0
7.0 29*
▼
51*
31.2
▲
- -
JP Morgan
23 -
-
Source: Thomson Reuters
3.2▼
227.6
7
▲
▼
▲
▲
60.0
Alantra Partners SA
▼
25
Rank Value
24.1
▼
3.8
-
-
- 155.7
Lazard ▲
BNP Paribas SA 30* 25* 8 -1 ▼
7.0
9 - -
1,031.1
One Square Advisors GmbH
372.0 29 -63.0 ▼
▲
Baker Tilly International
30*
Falkensteg GmbH
Ludwig & Co GmbH 38* 72* 6
GCA Corp 38* 35* 6
HSBC Holdings PLC 38* 64* 6
18
8.5
690.6
▲
44.0
13.2
▲
-
0.0
▼
-132 ▼
0.0
8.0
10.0
30*
10 0
13 12*
-1
2*
15*
784.7
10.1
8 4 ▲ 0.0 0.0 - - -
10* 4*
51*
5.9
▲
0.0
71
-76.7
▲
20.5
2017 2017
100.0
15.9
100.0
Rank Value per Advisor
MM6 - Undisclosed Values & Values up to US$500m
-13
13.7308.8
4
18
3,806.4
-
▲
15*
210.1
▼-15.6
63.7
41.3
62.0
100.0
100.0
88*
2
1
Exp. (%)
100.0
41.5
73.1
73.8
16.0
13
128.3
--
-
100.0
-
2,501.9
▲
▲
0.0
104.9
-9
100.0
▼
18
19.23
100.0
114.0
10.5
200.0
-
10
14
-94.8
2,968.4
-
100
200
300
400
500
600
700
800
$0
$2
$4
$6
$8
$10
$12
# o
f D
ea
ls
Ra
nk V
alu
e (
US
$b
)
US$200 - 500m US$100 - 200m US$50 - 100m US$0 - 50m # of Deals
30.3%
14.4%
13.0%
9.1%
9.1%
5.2%
5.2%
4.2%
3.3% 2.5% 2.4% Real Estate
Industrials
High Technology
Consumer Products and Services
Financials
Media and Entertainment
Materials
Healthcare
Energy and Power
Consumer Staples
Telecommunications
Retail
9
Full Year 2017 │ Mid-Market M&A Up To US$500m │ Financial Advisors
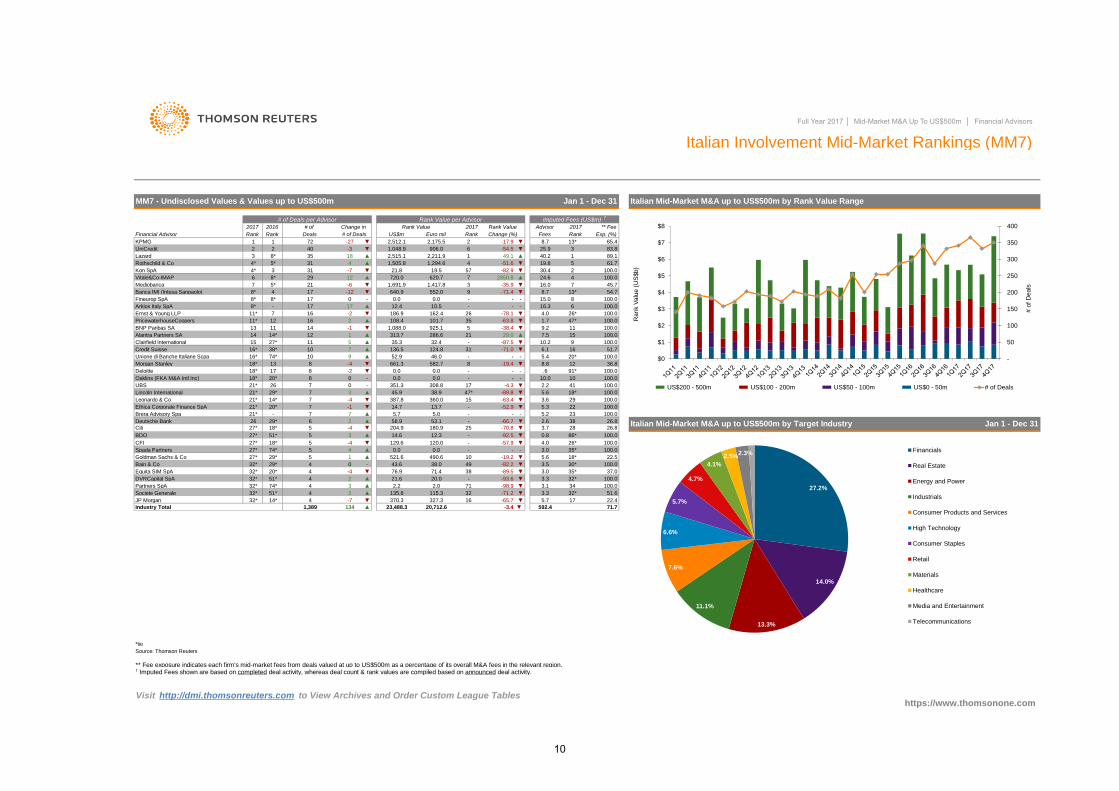
Italian Involvement Mid-Market Rankings (MM7)
*tie
** Fee exposure indicates each firm's mid-market fees from deals valued at up to US$500m as a percentage of its overall M&A fees in the relevant region.† Imputed Fees shown are based on completed deal activity, whereas deal count & rank values are compiled based on announced deal activity.
Visit http://dmi.thomsonreuters.com to View Archives and Order Custom League Tables
40.2
4
-2
40
2,512.1
30.4
1,691.9
RankFees
32 -71.2 ▼ 3.3 32* 51.6
JP Morgan 32* 14* 4 -7 ▼ 370.3 327.3 16 -65.7 ▼ 5.7 17 22.4
▼
74* 4 3 ▲ 2.2 2.0 71 -98.9 ▼ 3.1 34 100.0
3.7
4*
100.0
-63.8
10 -19.2 ▼
-71.0
13*
16
3
12
21*
21*
21
8*
15
- -
Ethica Corporate Finance SpA 5.3
Deutsche Bank
7 -1 ▼
21*
22
21*
-
5.7
180.9
136.5
-
-
1
100.0
-
-87.5
▼
BNP Paribas SA
2.2
▼
27*
1
31
1,088.0
-12
Rothschild & Co
16*
4 2 ▲ 21.6 20.0 - -93.6 ▼ 3.3 32*
7
32* 29* 4
16*
Goldman Sachs & Co
CFI
BDO
Citi
Oaklins (FKA M&A Intl Inc)
Unione di Banche Italiane Scpa
Mediobanca
Kon SpA
Lazard
UniCredit
Leonardo & Co
Morgan Stanley
Deloitte
4*
18*
18*
Ernst & Young LLP
74*
Brera Advisory Spa
Bain & Co
27*
27*
Lincoln International
Alantra Partners SA
2
Fineurop SpA
DVRCapital SpA 32* 51*
11*
74*Spada Partners
Partners SpA 32*
2,211.9
8.7
18*
30*
- 3.0
5.4
-3.4
-
14
-2
-3
▼
7
29*
-
47*
-4 ▼
29*
-
-4
18
1,294.6
-78.1
Euro mil
0.0
▲
KPMG
5
Arkios Italy SpA
18*
27*
14
Clairfield International
PricewaterhouseCoopers
3
Deals
▲
-17.9
▼
5.6
20*
1,048.9
▲21286.6
-7
- 35*
6
15
▲
▲
# of Deals
41
313.7
100.0
29.0
11
6.1
-
91*
25.9
-
0
0.0
582.7
-
2
49.1
▼
Rank
▼
1.7101.7
-0
-6
10.2
▼
12
521.6 490.6
-70.8
0
▼
▲
100.0
100.0
351.3
5
6
32.4
Rank Value per Advisor# of Deals per Advisor
35
57
382.6
100.0
7
** Fee
Italian Mid-Market M&A up to US$500m by Rank Value Range
▼
3
204.9
5.0▲
17
8.8
26*
15.0
15
10
-8
-4.3
7
14*
14.7
51* 12.3
7
13.7
5.2
▲
▲
5 3
Change (%)
0.0
47*
1
19.5
4
100.0
-82.9
17
Exp. (%)
▼
▲
29
0.0
Imputed Fees (US$m) †
83.8
5
100.0
12
25
▼
▼
-71.4
▼
23
360.0
26
.6
4
1 ▲
-57.9
18*
12
13
0.0
9
17
17
10
-35.9
387.8
8
38*
1010.0
https://www.thomsonone.com
▼
7
9
▼
0.8
8
17
16
100.0
0.0
592.4
100.0
5.629*
43.6
5
▼
135.8 115.3
Industry Total
▼
Credit Suisse
17
4.0
Jan 1 - Dec 31Italian Mid-Market M&A up to US$500m by Target Industry
20*
100.0
2017Rank Value
620.7
3
65.4
14*
8*
▼
100.0
100.0
9
925.1
1,505.8
45.7
▲
UBS
100.0
▼
26
1 89.1
▼
54.7
61.7
1,417.8
2
308.8
7.5
100.0
38.9
-4 8
Rank Value
13*
Financial Advisor
2017Change in
72
Rank
Jan 1 - Dec 31
7
120.0
2017
8*
-27
5*
▼
24.6Vitale&Co-IMAP
Banca IMI (Intesa Sanpaolo)
-
35.3
-54.5
2016
2
-89.8
-
20*
7
-
45.9
-
▼
-
8
31 19.8
2,175.5
162.4
-
7
-4 -129.6
9.2
8.74
0.0
11
4 ▼-51.6
13 ▼
▲
-
16.0
5*
35
▼
-
16.3
21*
▲
-
-66.7
▲6
8*
49
134
18*
23,488.3
6 2
4 2 ▲
100.0
26
18*
661.3 -19.4
-
8*
906.0
3
-1
11*
38.0
5
▲
3.5
Source: Thomson Reuters
27*
53.1
-14.6
Societe Generale 32* 51*
27*
▼-92.5
5
0.0
4.0
100.0
51.7
-38.4
108.4
▼
Advisor
MM7 - Undisclosed Values & Values up to US$500m
▼1
124.8
52.9
11
US$m
# of
7
720.0
2
5
▲ 46.0
16
▲
Rank
186.9
8*
2850.8
640.9 552.0
2,515.1
21.8
▼
▼
58.9
0 -
-
-63.4
-52.9 ▼
3.6▼
31
▲
-
20,712.61,389 71.7
-
12.4 10.5
36.8
-82.2
28 26.8
26*
22.5
86*
100.0
100.0
29
100.0
26.8
100.0
100.0
Equita SIM SpA 32* 20* 4 -4 ▼ 76.9 71.4 38 -89.5 ▼ 3.0 35* 37.0
-
50
100
150
200
250
300
350
400
$0
$1
$2
$3
$4
$5
$6
$7
$8
# o
f D
eals
Rank V
alu
e (
US
$b)
US$200 - 500m US$100 - 200m US$50 - 100m US$0 - 50m # of Deals
27.2%
14.0%
13.3%
11.1%
7.6%
6.6%
5.7%
4.7%
4.1%
2.5% 2.3%
Financials
Real Estate
Energy and Power
Industrials
Consumer Products and Services
High Technology
Consumer Staples
Retail
Materials
Healthcare
Media and Entertainment
Telecommunications
10
Full Year 2017 │ Mid-Market M&A Up To US$500m │ Financial Advisors
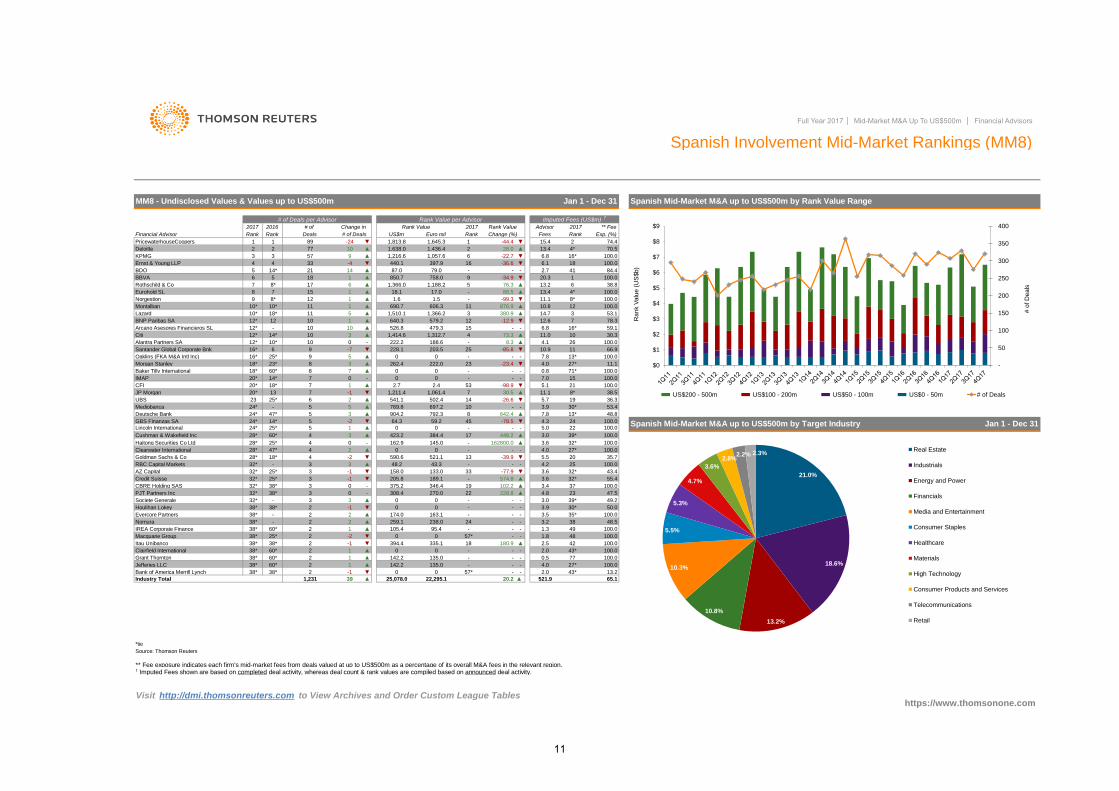
Spanish Involvement Mid-Market Rankings (MM8)
** Fee exposure indicates each firm's mid-market fees from deals valued at up to US$500m as a percentage of its overall M&A fees in the relevant region.† Imputed Fees shown are based on completed deal activity, whereas deal count & rank values are compiled based on announced deal activity.
Visit http://dmi.thomsonreuters.com to View Archives and Order Custom League Tables
- 53.4
21
59.2
8*
308.4 270.0 22 228.8
- 2.0 43* 100.0
Grant Thornton 38* 60* 2 1 ▲ 142.2 135.0 - - - 0.5 77 100.0
Jefferies LLC 38* 60* 2 1 ▲
Bank of America Merrill Lynch 38* 38* 2 ▼ 0 0 57* - - 2.0 43* 13.2
Itau Unibanco 38* 38* 2 -1 ▼ 394.4 335.1 18 180.9 ▲ 2.5 42 100.0
440.1
18*
4.1
100.0
-
16*
13.4
33
38.8
15.4
▲
Rothschild & Co
1
4 2 ▲ 0
▼
1,211.4 1,061.4 7 30.5 ▲
541.1 502.4
162.9
Deutsche Bank
GBS Finanzas SA
162800.0
Source: Thomson Reuters
*tie
Cushman & Wakefield Inc
UBS
5
2
16*
10*
Credit Suisse 32*
RBC Capital Markets 32* - 3
32* - 3
BBVA
Haitong Securities Co Ltd
Clearwater International 28* 47*
PJT Partners Inc
Societe Generale
Houlihan Lokey
Evercore Partners
Nomura
Arcano Asesores Financieros SL
Ernst & Young LLP
KPMG
PricewaterhouseCoopers
Financial Advisor
CFI
JP Morgan
12*
CBRE Holding SAS 32* 38*
8
20*
AZ Capital 32* 25*
Goldman Sachs & Co
38* -
IREA Corporate Finance 38* 60*
IMAP
20*
20*
23
2016
28*
24*
76.3
5
1,231
12
▲
0.8 71*
20.3
▲
-98.9
▲
-
10
1
5
21
-
1,216.6
2
5
89
9
14*
375.2
23*
Rank
2.4
-7
28*
▲
1 ▲
-1 ▼
2.7
13* 48.8
4.3 24 100.0
5.0 22
3
850.7
0
0 0
-
142.2 135.0 - - - 4.0 27* 100.0
-
78.3
2.7
Fees
-
-24
▲
1,638.0
-1
10
1,645.3
100.0
38.5
222.0
6.8
100.0
-
▼
769.8
# of Deals US$m
https://www.thomsonone.com
1
16
100.0
10
-
10 -
145.0 -
262.4
30*
4*
27*
27*
Jan 1 - Dec 31
84.4
▲
Spanish Mid-Market M&A up to US$500m by Target Industry
▲
66.9
9
25*
87.0
7.8
▲
-
6
-
▲
0
4.0
▲
4*
12*
8
18*
59.1
7.8
100.0
3.0 39* 100.0
22,295.1
12
3
9
521.9
▲18*
28* 18* 4
3
25* 2 -2 ▼
Spanish Mid-Market M&A up to US$500m by Rank Value Range
12.6
100.0
-
-
15
4
-
100.0
1,436.4
Rank
18
11
-23.4
14* 7 0
1.5
▲
74.4
1
10
30.3
8 7
0 - - - 4.0
3 ▲ 48.2 43.3 - - -
-
26
64.3
28.0
▼
697.2
60* 2 1 ▲ 0 0 -
397.9
13.4
▼12
15
6.1
-12.9
-1 ▼ 205.8 189.1 -
18*
-
70.5
▼
79.0
▲
▼
▼
5
11.1
1
32* 100.0
904.2 792.3 8
19
526.8
25*
10.8
17.0
203.5
▼
6.8
▼
1,312.7
9
39
640.3 ▼
11.1
▲
-44.4
-
0 0 - - -
2 2 ▲
Industry Total
1
1,510.1
▲
2
2017
1,813.8
100.0
-2 ▼ 590.6 521.1 13 -39.9 ▼
7.0
642.4
2
0 0 - -
3
▲
13*
579.2
6
Morgan Stanley
Norgestion
10*Montalban
8*
1,188.2 5
20.225,078.0
-
▲
▼
4
1
0
3
17
- -
10
10
479.3
448.2
5
5.5 20
▼ 158.0
-
423.2 17
13.2
0
3
7
3
77
18
12
1,414.6
5.1
10*
-
5
▲
▼
Change (%)
8*
606.3
-99.3
-22.7
Rank
9
8.3
10.9
60*
3.9
1
-
876.9
10*12*
▼
0
Rank Value per Advisor
MM8 - Undisclosed Values & Values up to US$500m
14*
24*
Euro mil
▲
1,366.0
73.3
758.0
▲
690.7
-
6
Santander Global Corporate Bnk 25
Oaklins (FKA M&A Intl Inc)
11
10
Advisor
18.1
11.0
6 -85.8
15
Mediobanca
BDO
Rank Value
3
Jan 1 - Dec 31
53.1
100.0
Deals
100.0
Rank
Citi
Eurohold SL
6
1.6
11
12*
8*
▲
14.7
▼ 16*
11.1
4
3
▼
100.0
53
5
6
0
41
▲
228.1
▲ -
24*
24*
7
13 7
25*
BNP Paribas SA
Lazard
47* 5
16*
▲
14*
7
1,366.2
▲
14
88.5
11
380.9 ▲
-2
1,057.6
-36.6
-34.9
45
38* 2 -1 ▼
100.0
3 -1
346.4 19 102.2 ▲ 3.4 37 100.0
35.7
574.8 ▲ 3.6
▲
3 ▲
38*
38* - 2 2
2 1 ▲
0 - -
174.0 163.1 - - -
259.1 238.0 24 - -
105.4 95.4 - - -
Clairfield International 38* -
▲
0
32* 38* 3 0 -
4.2 25
2017
4
14 -26.6
32* 55.4
384.4
▲
▲
65.1▲
-77.9 ▼ 3.6 32* 43.4
# of Deals per Advisor
Exp. (%)
** Fee
Deloitte
Alantra Partners SA
Baker Tilly International
Rank Value
-
1
7
188.6222.2
1
-78.5
3.6
▲
2
2017
36.3
4.8 23 47.5
3.0 39* 49.2
3.9
100.0
# of
▲
Change in
25* 4 0
5.7
60*
Lincoln International
23
3
-4
57
133.0 33
25*
30* 50.0
3.5 35* 100.0
3.2 38 48.5
1.3 49 100.0
Imputed Fees (US$m) †
100.0
0 0 57* - - 1.8 48 100.0Macquarie Group 38*
-
50
100
150
200
250
300
350
400
$0
$1
$2
$3
$4
$5
$6
$7
$8
$9
# o
f D
eals
Rank V
alu
e (
US
$b)
US$200 - 500m US$100 - 200m US$50 - 100m US$0 - 50m # of Deals
21.0%
18.6%
13.2%
10.8%
10.3%
5.5%
5.3%
4.7%
3.6%
2.8% 2.2% 2.3%
Real Estate
Industrials
Energy and Power
Financials
Media and Entertainment
Consumer Staples
Healthcare
Materials
High Technology
Consumer Products and Services
Telecommunications
Retail
11
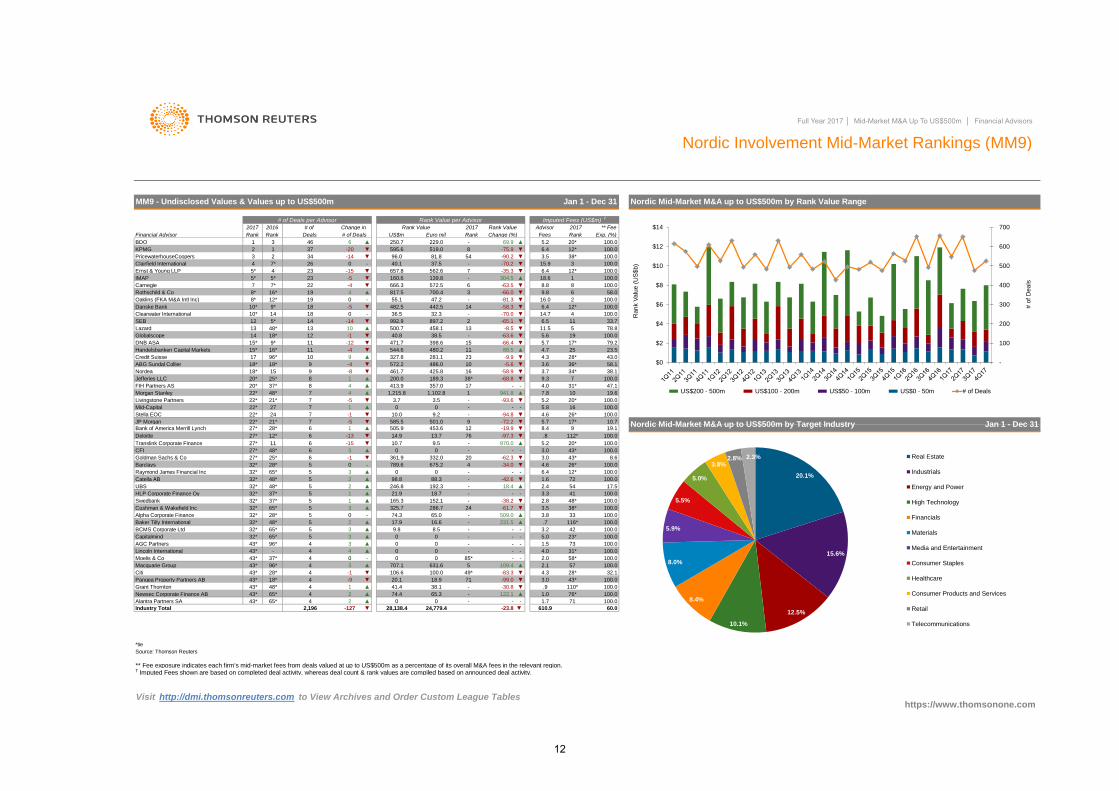
Full Year 2017 │ Mid-Market M&A Up To US$500m │ Financial Advisors
Nordic Involvement Mid-Market Rankings (MM9)
** Fee exposure indicates each firm's mid-market fees from deals valued at up to US$500m as a percentage of its overall M&A fees in the relevant region.† Imputed Fees shown are based on completed deal activity, whereas deal count & rank values are compiled based on announced deal activity.
Visit http://dmi.thomsonreuters.com to View Archives and Order Custom League Tables
Alantra Partners SA 43* 65* 4 2 ▲ 0 0 - - - 1.7 71 100.0
FIH Partners AS 37* 8 4 ▲ 413.9 357.0 17 - - 4.0 31* 47.1
Morgan Stanley 48* 7 4 ▲ 1,215.8 1,102.8 1 941.8 ▲ 7.8 10 19.6
20*
32*
32*
32*
32*
*tie
32*
▼ 9.3 7 100.0
13
Nordea 18* 15 9 -8 ▼ 461.7
13
Globalscope
SEB
Financial Advisor
KPMG
Danske Bank
-
Carnegie
IMAP
Clairfield International
PricewaterhouseCoopers
BDO
15*
2016
1
Rank
12
5*
3
6.4519.0
5.2
6.5897.2
58.019
2017
-
69.9
5.6 100.0
Clearwater International
27*
Jefferies LLC 20* 25* 8 1 ▲ 200.0 189.3 38* -68.8
5*
12*
15.9
572.5
▼
572.2 -5.6 ▼
Rothschild & Co
Ernst & Young LLP
DNB ASA
10*
4
58.1
43*
425.8 16 -58.9 ▼ 3.7 34* 38.1
817.5
11.5
20*
6.4
486.0 10
11
9.8
458.1
2 -65.1
12*
160.6
471.7 398.6 -66.4
-9.9
18.6
-14
▼
▼
43*
-4
▲ 281.1
-12
12
16* 544.6 25
-63.6
14.7
11
-4 ▼
43*
18*
15
88.511
0
54
139.8
19
610.928,138.4
-1
10
11
13
18
Fees
▼
2
657.8
7
▼
US$m
100.081.8
Jan 1 - Dec 31
38.5
8
5*
500.7
▼
-81.3
3
562.6
-
4
Rank Value
▼
0
6
7
Nordic Mid-Market M&A up to US$500m by Rank Value Range
33.7
17* 79.2
78.8
Nordic Mid-Market M&A up to US$500m by Target Industry
Jan 1 - Dec 31
992.9
▼
100.0
16.0
-70.0
100.0
19
Imputed Fees (US$m) †
-90.2
Rank
8*
-35.3
0 40.1
-20
250.7
▼
666.3 ▼
304.5
6.4
Euro mil
22 8.8
47.2
3
2017
▲
14
-66.0
6
2017 Rank Value
38*
26
Change (%)
-63.5
12* 100.0
7* -4
3-
-5
46
-14
-
1
Rank Value per Advisor
12*
-70.2
▲
100.0
-
▼
100.0
# of Deals
# of
# of Deals per Advisor
229.0
▼
23
9*
40.8
7*
14
5*
https://www.thomsonone.com
** Fee
▼
Source: Thomson Reuters
43*
5.7
Handelsbanken Capital Markets
Credit Suisse
37.5
-
482.5 442.5
36.5
▼
32.3
▼
2 1
▼
Change in
27*
▼
0
9
▼
-5
43*
▼
Raymond James Financial Inc
27*
Industry Total
Catella AB
UBS
HLP Corporate Finance Oy
2,196
▼
5 2 ▲
32*
27*
▼
10 9
16*
327.8
3 ▲
5 3 ▲
4 3 ▲
4 4 ▲
4 0 -
4 3 ▲
4 -1 ▼
4
24,779.4
74.3 65.0 - 509.0 ▲
17.9 16.6 - 231.5 ▲
9.8 8.5 3.2 42 100.0
4.3 28* 32.1
2.0 58* 100.0
2.1 57 100.0
- -
0 0 - - -
0
5 0 -
-
165.3 152.1 -
60.0
-
▲
14
8*
34
18*
4.3
Bank of America Merrill Lynch
Deloitte
Translink Corporate Finance
CFI
Goldman Sachs & Co
Barclays
28*
12*
11
48*
25*
28*
48*
48*
▲
▼
▼
7 -5 ▼
6 1 ▲
6
5
10* 14
-
18*
27*
43*
43*
-23.8
Advisor
▼
480.2
-58.3
Exp. (%)
96.0
4
▲
Swedbank
Cushman & Wakefield Inc
Alpha Corporate Finance
Baker Tilly International
BCMS Corporate Ltd
Capitalmind
AGC Partners
Lincoln International
Livingstone Partners
Mid-Capital
Stella EOC
JP Morgan
5 1 ▲
5 1 ▲
5 3
-5 ▼
27
ABG Sundal Collier
Lazard
9*
Oaklins (FKA M&A Intl Inc)
32*
32*
32*
Deals
22*
23
32*
32*
43*
37
18
65*
22* 21* 7
24
21*
15*
55.1
▲
▲
6
22*
22*
22*
Rank
23
17
4 -15
▼
▼
8 -75.9595.6
Rank
▼
-93.6 ▼
0 0 - - -
10.0 9.2 - -94.8 ▼
585.5 501.0
-
-8.548*
96*
37*
37*
65*
28*
7 1 ▲
7 -1
100.0
100.0
100.0
3.6 36*
4.7
3.7 3.5
MM9 - Undisclosed Values & Values up to US$500m
21.9 18.7 - -
-38.2 ▼
325.7 286.7 24 -61.7 ▼
5.2 20* 100.0
5.8 16 100.0
100.0
3.5
2
5
700.4
23.5
28* 43.0
▼
246.8
98.8 88.3 - -42.6
-13 ▼
6 -15 ▼
6 3 ▲
6 -1 ▼
5 0 -
5 3 ▲
5 2 ▲
5 2 ▲ 192.3 - 18.4 ▲
505.9 453.6 12 -19.9 ▼
14.9 13.7 76 -97.3 ▼
10.7 9.5 - 970.0 ▲
4 -34.0 ▼
0 0 - - -
4.6 26* 100.0
5.7 17* 10.7
8.4 9 19.1
.8 112* 100.0
5.2 20* 100.0
3.0 43* 100.0
3.0 43* 8.6
4.6 26* 100.0
6.4 12* 100.0
0 - - -
361.9 332.0 20 -62.3 ▼
789.6 675.2
9 -72.2 ▼
1.6 72 100.0
2.4 54 17.5
3.3 41 100.0
2.8 48* 100.0
3.5 38* 100.0
3.8 33 100.0
.7 116* 100.048*
65*
65*
96*
-
37*
96*
28*
18*
48*
65*
41.4 38.1 - -30.8 ▼
74.4 65.3 - 122.1 ▲
0 0 85* - -
707.1 631.6 5 109.4 ▲
106.6 100.0 49*
- - -
-83.3 ▼
20.1
0 0 -
0 - - -
18.9 71 -99.0 ▼
5.0 23* 100.0
3.0 43* 100.0
1 ▲
4 2 ▲
-9 ▼
4
-127
.9 110* 100.0
1.0 76* 100.0
1.5 73 100.0
4.0 31* 100.0
Moelis & Co
Macquarie Group
Citi
Pangea Property Partners AB
Grant Thornton
Newsec Corporate Finance AB
-
100
200
300
400
500
600
700
$0
$2
$4
$6
$8
$10
$12
$14
# o
f D
eals
Ra
nk V
alu
e (
US
$b
)
US$200 - 500m US$100 - 200m US$50 - 100m US$0 - 50m # of Deals
20.1%
15.6%
12.5%
10.1%
8.4%
8.0%
5.9%
5.5%
5.0%
3.8% 2.8% 2.3% Real Estate
Industrials
Energy and Power
High Technology
Financials
Materials
Media and Entertainment
Consumer Staples
Healthcare
Consumer Products and Services
Retail
Telecommunications
12
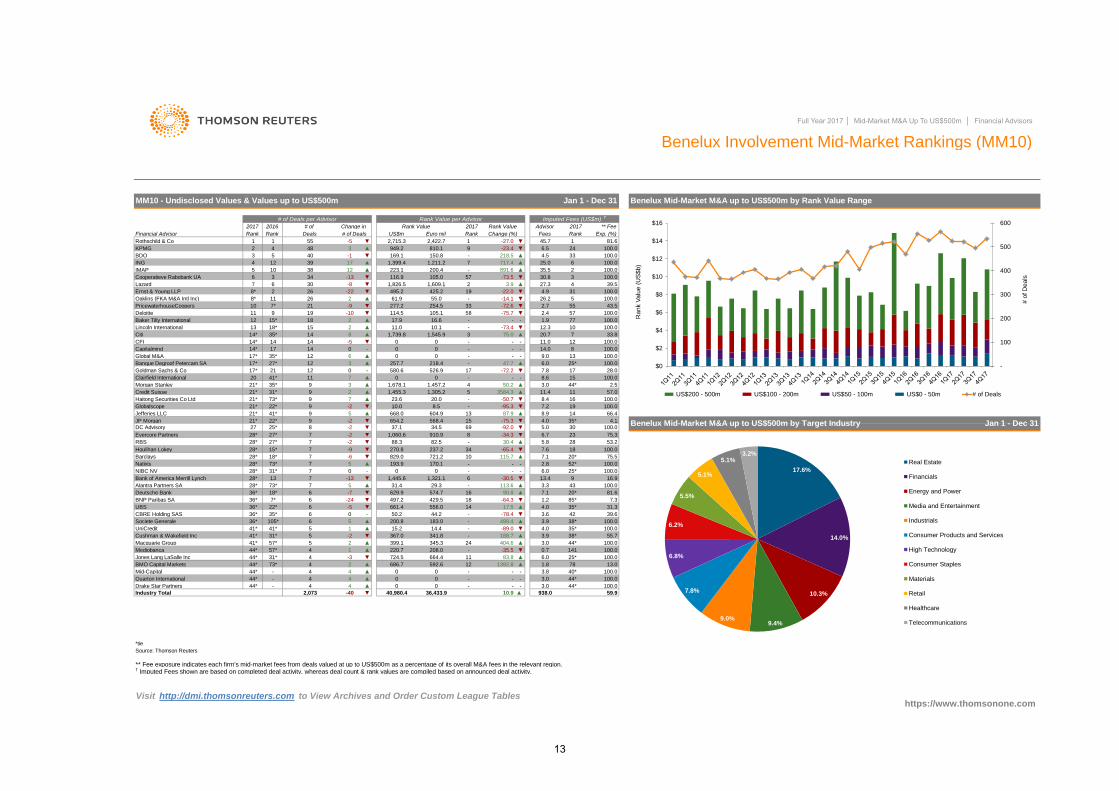
Full Year 2017 │ Mid-Market M&A Up To US$500m │ Financial Advisors
Benelux Involvement Mid-Market Rankings (MM10)
** Fee exposure indicates each firm's mid-market fees from deals valued at up to US$500m as a percentage of its overall M&A fees in the relevant region.† Imputed Fees shown are based on completed deal activity, whereas deal count & rank values are compiled based on announced deal activity.
Visit http://dmi.thomsonreuters.com to View Archives and Order Custom League Tables
Deutsche Bank 36* 18* 6 -7 ▼ 629.9 574.7 16 90.8 ▲ 7.1 20* 81.6
6.0 25* 100.0NIBC NV 28* 31* 7 0 - 0 0 - - -
Bank of America Merrill Lynch 28* 13 7 -13 ▼ 1,445.6 1,321.1 6 -30.5 ▼ 13.4 9 16.9
Alantra Partners SA 28* 73* 7 5 ▲ 31.4 29.3 - 113.6 ▲ 3.3 43 100.0
Evercore Partners 28* 27* 7 -2 ▼ 1,060.6 910.9 8 -34.3 ▼ 6.7 23 75.3
100.0
17*
100.0
12.3
Deals
▼ 5.0 30
2
▲200.4
1,826.5
100.0-
24
4.5
DC Advisory 27 25* 8
22* 9
5.8 28 53.2
Houlihan Lokey 28*
Barclays 28* 18* 7 -6 ▼ 829.0 721.2 10 115.7 ▲ 7.1 20* 75.5
Natixis 28* 73* 7 5 ▲ 193.9 170.1 - - - 2.8
2
580.6
-2
39
568.4
52* 100.0
82.5
57Deloitte
PricewaterhouseCoopers
Oaklins (FKA M&A Intl Inc)
Ernst & Young LLP
Lazard
Cooperatieve Rabobank UA
IMAP
ING
-
7 ▲
▲
23.6
Globalscope
BDO
KPMG
Rothschild & Co
Financial Advisor
Citi
Rank
19-22
4
JP Morgan
Haitong Securities Co Ltd
Credit Suisse
Morgan Stanley
Clairfield International
Goldman Sachs & Co
21* 41*
▼
14*
Rank
13
116.9 105.0
-9
8*
-73.4
0
9
20
15* 7
21
3
Benelux Mid-Market M&A up to US$500m by Rank Value Range
77
▼
5
2,715.3
▼
-
Change (%)
16.6
270.8 237.2 34 -65.4 ▼ 7.6 18 100.0
654.2
-9 ▼
254.5
- 30.4 ▲
- -50.7
7
27*
19
# of Deals
2
8 1,545.9
40
▼ 10.0
-22.0
55 -5
-40
Change in
▲
-2 ▼
9
11 7
Benelux Mid-Market M&A up to US$500m by Target Industry
Exp. (%)
3.0
33.8
-
▼
2.54
0
21
Jan 1 - Dec 31
12 7
https://www.thomsonone.com
-
▼
Jan 1 - Dec 31
100.0
Advisor
100.0
▼
▲
** Fee
11.0
14
-
31
▼
75.0
0
-
20.7
4 48
4
-
14 0
6.5
114.5
810.1 9 ▼
1,609.1
26 61.9
58105.1
55
0
1.9
87.9
0-
0
25.0
-75.7
11
2
3
Global M&A
Capitalmind
CFI
Lincoln International
Baker Tilly International
1
14*
13
-27.0
17
33
891.6
▼
-
-13
▲
-72.6
11
▲
3.9
4.9
11.0
1.2
3.0
5 33218.5
10.940,980.4
14
▼
20.0
35*
100.0
17
▼-73.5
5
2017
257.7
2.7
14.0
1,739.8
6
57
12
-12
9
18*
2
100.0
526.9
6.0
14*
21*
7.8
9
0
100.0
15
3
- 12
1,399.4
100.0
100.0
27.3
2
495.2
35.5
45.7
19
1
▼
12
26.2
1,455.3 3584.3
▲ 47.7
-
-
Jefferies LLC
Banque Degroof Petercam SA
RBS 28*
# of Deals per Advisor
Source: Thomson Reuters
*tie
6
41* 31* 5 -2
6 -24 ▼
8.9
36* 7*
57.0
3
26
43.5
100.0
11
-
9.0
14
# of 2016
▼
-
44* - 4
MM10 - Undisclosed Values & Values up to US$500m
Rank
Rank Value
-
-
▲
▼
0
100.0
13
11.4
8.4
8.5 - -95.3
5
717.4
▼
59.9
-
-8
▲
10.1
10
5
30.8
6
34
9
2
8*
▲
BNP Paribas SA
Quarton International 4 ▲
Industry Total ▲36,433.9
12
-
2.4
37.1 34.5 69 -92.0
▲ 100.0
8.641*
15*
-23.4
1
38
2017
35*
UBS 36* 22* 6 -5 ▼
CBRE Holding SAS 36* 35* 6 0 -
Societe Generale 36* 105*
30
6
17*
44* - 4 4 ▲
6 5 ▲
UniCredit 41* 41* 5 1 ▲
▲
44* 73* 4 2 ▲
Mid-Capital
-
- -
-
938.0
Mediobanca 44* 57*
Cushman & Wakefield Inc
0 0 -
4 1 ▲
Jones Lang LaSalle Inc 44* 31*
2,073
0 - - -
41* 57* 5 2
4
44*
3
18
▲
8
7
100.0
949.2
15
Rank
▲
2
▼
277.2
223.1
4.0
Imputed Fees (US$m) †
▼
-10
2,422.7
31*
-14.1
425.2
▼
-
▲
100.0
100.0
▼
1,211.2 ▲
Euro mil
2017
55.0
14
US$m
Rank Value
Fees
35*
81.6
39.5
▲
▲
1,457.2
0
-2 ▼
▲
▼
-1
12
66.4
16 100.0
▲
25*
15
17.9
218.4
▲
-5
1
17-72.2
▲ 1,678.1
85* 7.3
4.0 35* 31.3
3.6 42 39.6
3.9 38* 100.0
4.0 35* 100.0
▼
-
Rank Value per Advisor
150.8
17
-
28.0
169.1 ▲
7 -2 ▼ 88.3
9
4.1
100.0
668.0 604.9
1,305.2
7*
10
3
27*
21* 73*
17*
21*
21*
35*
3
22*21*
50.2
3.0 44* 100.0
Drake Star Partners 44* - 4 4 ▲
497.2 429.5 18 -64.3 ▼
661.4 556.0 14 17.5 ▲
0 0 -
Macquarie Group
-35.5 ▼
724.5 664.4 11 83.8 ▲
686.7 592.6 12 1392.8 ▲
0
-3 ▼
BMO Capital Markets
10
-75.3 ▼
7.2
44* 100.0
50.2 44.2 - -78.4 ▼
200.8 183.0 - 499.4 ▲
15.2 14.4 - -89.0 ▼
367.0 341.8 - 188.7 ▲
399.1 345.3 24 404.6 ▲
220.7 208.0
3.9 38* 55.7
3.0 44* 100.0
0.7 141 100.0
6.0 25* 100.0
1.8 78 13.0
3.8 40* 100.0
-
100
200
300
400
500
600
$0
$2
$4
$6
$8
$10
$12
$14
$16
# o
f D
eals
Ra
nk V
alu
e (
US
$b
)
US$200 - 500m US$100 - 200m US$50 - 100m US$0 - 50m # of Deals
17.6%
14.0%
10.3%
9.4% 9.0%
7.8%
6.8%
6.2%
5.5%
5.1%
5.1% 3.2%
Real Estate
Financials
Energy and Power
Media and Entertainment
Industrials
Consumer Products and Services
High Technology
Consumer Staples
Materials
Retail
Healthcare
Telecommunications
13
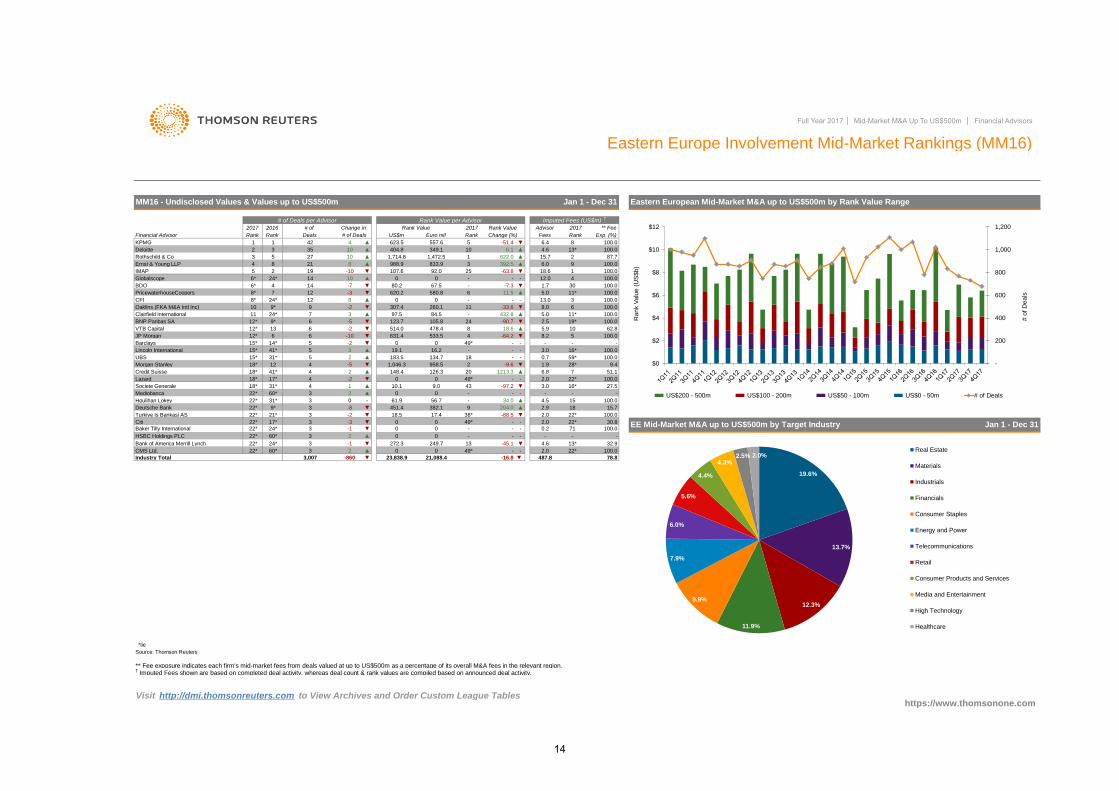
Full Year 2017 │ Mid-Market M&A Up To US$500m │ Financial Advisors
Eastern Europe Involvement Mid-Market Rankings (MM16)
** Fee exposure indicates each firm's mid-market fees from deals valued at up to US$500m as a percentage of its overall M&A fees in the relevant region.† Imputed Fees shown are based on completed deal activity, whereas deal count & rank values are compiled based on announced deal activity.
Visit http://dmi.thomsonreuters.com to View Archives and Order Custom League Tables
10
-
958.512
▼
-
Barclays
Rank
6*
24*
2
MM16 - Undisclosed Values & Values up to US$500m
*tie
Deutsche Bank
Houlihan Lokey
2016
100.0
▲ 11*
100.0
-
12*
97.5 432.8
100.0
▼
392.5
Rank ValueChange in
833.98
▼
67.56*
5.9
5
260.1
123.7
-24*8*
IMAP
▲0
-
100.0
11.5
8.0-2
▲
-
3
100.0
-
-7.3
Clairfield International 84.5
107.6
349.1
21* 3
13*
-
3,007
30.8
-860
Source: Thomson Reuters
-
126.32
3
-
-
Financial Advisor
▼ 2.0
2
1
7
▼
2.5
18
4
-8
▼
▲
9.4
18*
22*
18
-2 ▼
▲
27
-
134.7
17*
5
- 0.2 71
- 2.0
1
307.4
5
# of
3
2017
15.7
-2
2.0
8.2
0
0
-
382.1
- -
4.6
22*
Advisor
5.0 11*
30
12
14
6.1
16*
-
1.9
22*
Rank Value
4
https://www.thomsonone.com
EE Mid-Market M&A up to US$500m by Target Industry Jan 1 - Dec 31
21,088.4
3
Eastern European Mid-Market M&A up to US$500m by Rank Value Range
487.8
▼
▲
12
15*
5
9*
▲
622.0
4
2017
4
10
92.019
▼
13.0
3
US$m
12.0
Fees
0 0
-90.7
-
6
9
Deals
62.8
Rank
04
-5 28*
-
41*
41*
514.06
24*
-10
-3
11
-9.6
19*
8
631.4
9*
1
Rank
-
-
17.4
22*
100.0
100.0
▼
22*
Deloitte
2
Rothschild & Co
Globalscope
Ernst & Young LLP
4
10
-97.24
13*
16.2
43
-
5
▲
14*
0
0
80.2
25
16*
4.534.0
- 100.0
2
148.4
▼
478.4
105.8
18.6 ▲
2
533.5
19.1
▼ -
0
1,046.3
4 ▲
BDO
▲
18*
100.04.6
31*
11
2.9
# of Deals
2
61.9
22*
3
- 0.7
7
Mediobanca
59*5
3.0
6.81213.3
100.0
100.0
27.5
-64.2
-
100.0
31*
18.6
51.1
▲
7
10
Societe Generale
Credit Suisse
Morgan Stanley
UBS
Lincoln International
JP Morgan
VTB Capital
PricewaterhouseCoopers
100.0
-33.6
-10
6
1
# of Deals per Advisor
623.5 557.6
9
38* -88.5
23,838.9
014
CFI
6
0
1
6
21
-
15
18*
15* -
▼
5
8*
▲
9
988.9
▲
404.8
1,714.8
▼
100.0
Exp. (%)
10
▼▲
100.0
** Fee
100.0
87.7
8
15.7
6.0
Lazard
Baker Tilly International 22* 24* 3 -1 ▼ 0 0 -
HSBC Holdings PLC
-
-51.4
3.0
▼
-63.8
Change (%)
-5
6.4
2017
620.2
10
4
35
42
24
15*
▼
Industry Total
Oaklins (FKA M&A Intl Inc)
49*
▼
6
1312*
8
12* ▼
5.0
Citi 0 49* -
Bank of America Merrill Lynch 272.3
2 ▲
56.7
60*
▼
10.1 9.0
49*
18*
CMS Ltd.
3 1,472.5
580.8▼
Rank Value per Advisor
Euro mil
▼
Turkiye Is Bankasi AS
KPMG
BNP Paribas SA
-3 ▼ 0
204.0
31*
▲
-16.8
451.4
-
3 2
9*
- -
▲
22* 60* 3
22* 17* 3
▲ 0 0 -
-2
249.7 13 -45.1 ▼
22* 60* -
3
22*
3
183.5
20
▲
-1 ▼
-
3
100.0
100.0
22*
0 0 49* - - 2.0 22* 100.0
▼
-
78.8
18.5
▲
▲
8
Jan 1 - Dec 31
-7
▲
1.7
Imputed Fees (US$m) †
Rank
24*
-2
32.9
-
200
400
600
800
1,000
1,200
$0
$2
$4
$6
$8
$10
$12
# o
f D
ea
ls
Ra
nk V
alu
e (
US
$b
)
US$200 - 500m US$100 - 200m US$50 - 100m US$0 - 50m # of Deals
19.6%
13.7%
12.3%
11.9%
9.9%
7.9%
6.0%
5.6%
4.4%
4.3% 2.5% 2.0%
Real Estate
Materials
Industrials
Financials
Consumer Staples
Energy and Power
Telecommunications
Retail
Consumer Products and Services
Media and Entertainment
High Technology
Healthcare
14

Full Year 2017 │ Mid-Market M&A Up To US$500m │ Financial Advisors
Hochinma Involvement Mid-Market Rankings (MM13)
** Fee exposure indicates each firm's mid-market fees from deals valued at up to US$500m as a percentage of its overall M&A fees in the relevant region.† Imputed Fees shown are based on completed deal activity, whereas deal count & rank values are compiled based on announced deal activity.
Visit http://dmi.thomsonreuters.com to View Archives and Order Custom League Tables
Rank Value per Advisor (US$m)
Jan 1 - Dec 31
10.4
-2
2.3
3.3 56* 84.6
40*
Huatai Securities Co Ltd
Morgan Stanley
2,598.6
9
26*
79*
-
-1
18*
▼746.8 -
35
40*
▲ 598.9
China eCapital Corp
73*
12
13
19
16
23*
48*
13*
6
100.0
40.6
21
89*
-29.8
*tie
Lazard
BNP Paribas SA
Red Sun Capital Ltd
Amasse Capital Ltd
CSC Financial Co Ltd
# of Deals
3,078.3
3*
4
-19
14
-19
Imputed Fees (US$m) †
-
10.6
7*
19.9
18*
201*
0.5
-74.3
-11.1
2,627.0
100.0
25*
32* -
-
-1
-9
26
77.8
-4
31
16
▼
27 - -
2,163.9
23
▼ 23
Rank
27.3
3*
23*
▼
▼
5
23*
208 1
5
94.8
20
7
▲
Rank
27* 20*
7 -34.3
2.4
27.2
18
22
100.0
4.3
31
6,526.3
2017
▼17
-34.7
11*
2.0
▼
986.3
8
21
Hochinma Mid-Market M&A up to US$500m by Target Industry Jan 1 - Dec 31
502.9
-44.0
325.3
807.6 49
100.0
59*
▼
▼-9
62.8
6,764.3
2
GF Securities
Mercury Securities
2017
▲
-9
10
-24.6
2,384.6
612.1
19
1
2,457.1
▲
13.5
3,046.4
133.77
Rank
Deloitte
Credit Suisse
Octal Capital Ltd
15*
38
2,219.4
** Fee
62.9
US$m
Rank Value 2017
13.5
730.7
100.0
39.9
23.2
69.2
▲
7*
-
23
▼
▲
13
22 -48.9
22
15*
68*
9.1
3,075.5
▲
5.0
11
▲
35*
18* 8
▲19
5
▼
9,743
1041
18*
76*
20
▼
9
44,468.9
17.4-4
15*
11*
▲
2,320.3
▼ 19.4
52*
141.7
-39.7
4
29*
▲
9.9
9.2
43
-
54*
25*
-5
29*
31
22
2
-23.2
3.4
27
17
Gram Capital
14
9
Change (%)
10
-35.4
-
Veda Capital Ltd
9.5
-64.5
Euto Capital Partners Ltd
-62.5
24
8.7
▼ 110.4
11 32 3,221.2 8
-12
9.5
# of
34*
19
7
▼
5
1
247 14 ▲
▼
35.6
▼
-
62*
-35*
10.5
37* 32* ▼
55*
23
40*
12*
2.8
6
▼
14
-2
13
32.91,725.5
1.0
2.2
13 ▲
▲
12 12 ▲
▲
28*
15
▼342,702.1
-68.9
14
201*
▲68*
▲
229
3.5
38.1
▼ 0.5
12 9 ▲
12 5
131*
81*
-
678.3 -
3.4
100.0
9.4
24
▼
Source: Thomson Reuters
6.9
100.0
100.0
-8 ▼ 1,186.2 35
10.9
Industry Total
Advisor
1,723.1
▼ 3.2-
-
2
▲
2.0
17
▲
▼
7
100.0
-17 8.3-56.3 ▼
100.0
51
27
331.8
15*
31
26
46*
951.4
20*
Deals
38
8
16
14
22.0
62.4
▼
121.1
1,627.9
▼
10
15* 35*
66.7
50.3
100.0
25
-5
100.0
15*
-13.4
1,169.1
Hochinma Mid-Market M&A up to US$500m by Rank Value Range
-▲
2,486.0
- 215.1
25
62.0
24
15*
-4
100.0
46.8
https://www.thomsonone.com
48*
472.4
21
▼
Exp. (%)
65.1
Rank
▼
4
43
2016
Haitong Securities Co Ltd
Goldman Sachs & Co 15.2
MM13 - Undisclosed Values & Values up to US$500m
Industrial & Comm Bank China
▲
8
9.4
▲
▲
▲
-2
89.8
679.5 -
▼
5,031.6
1,288.5
3,900.9
32
▲
Change in
1,148.7
-5.2
Rank Value
1,832.2
-40.3
1,653.7
27*
223*
30
▼
▼
▼
25
3,239.4
-
1,278.95
3
71
1
2
41*
▼
18
160*
-14
▼
-47.3
37*
28.4
43
3,390.9
1.7
China Securities Co Ltd
12
3
- -
5.9 30
11
23
▼
-2.5
2.8
-34.8
18.5
Citi
Rothschild & Co
-
Guotai Junan Securities
▼
Lego Corporate Finance Ltd
-
12* 55*
6
6
RHB
UBS
Deutsche Bank
Kingston Corporate Finance Ltd
Optima Capital Ltd
23
-8
▼ ▼
23*
40*
-8
32* 32*
100.0
554.9
1,058.7 -
16 -
4 47.7
-
Minsheng Securities Co Ltd
Dongxing Securities
Zhongtian Guofu Sec Co Ltd
37* 48* 13 2
▲
▲
16
CIMB Group Holdings Bhd
Guosen Securities Co Ltd 40*
Duff & Phelps
88.5
100.013
63.1
12
▲
-
3.0
1,021.4 39 -
-28.0
3
▼
# of Deals per Advisor
61.5
23*
▼
81.3
100.0
89*
139*
103*1,554.2
-4.7
3.9
54.6
10.6
Fees
▲
-55.7
▲
18
17
36
China Merchants Securities Co
▲
18
7 ▲
▼
34
8.9
9
7.0
15
5.4▼
15*
100.0
1.3 124* 100.0
Sumitomo Mitsui Finl Grp Inc 44* 99* 11 6 ▲
HSBC Holdings PLC 44* 15* 11 -17 ▼
Zhongtai Securities Co Ltd 44* 131* 11 8 ▲
▲
-10 ▼
▲
54*
▼
22
14
7.7
▲
365.9
7.5
1,763.1 21
17
▼PricewaterhouseCoopers
Somerley
▲
▲
Ernst & Young LLP
China International Capital Co
KPMG
China Renaissance Partners
CITIC
Financial Advisor
JP Morgan 44* 25* 11 3.8
100.0
1,459.6 - 104.8
-18.1
565.1 - 158.6
26144.4
4.6 38* 100.0
324.3
4.5
▲
-
500
1,000
1,500
2,000
2,500
3,000
$0
$20
$40
$60
$80
$100
$120
# o
f D
eals
Ra
nk V
alu
e (
US
$b
)
US$200 - 500m US$100 - 200m US$50 - 100m US$0 - 50m # of Deals
16.2%
14.6%
14.3%
13.4%
9.0%
7.2%
6.5%
5.8%
4.9%
4.6% 2.1%
Real Estate
Industrials
Financials
High Technology
Materials
Energy and Power
Healthcare
Consumer Products and Services
Media and Entertainment
Consumer Staples
Retail
Telecommunications
15
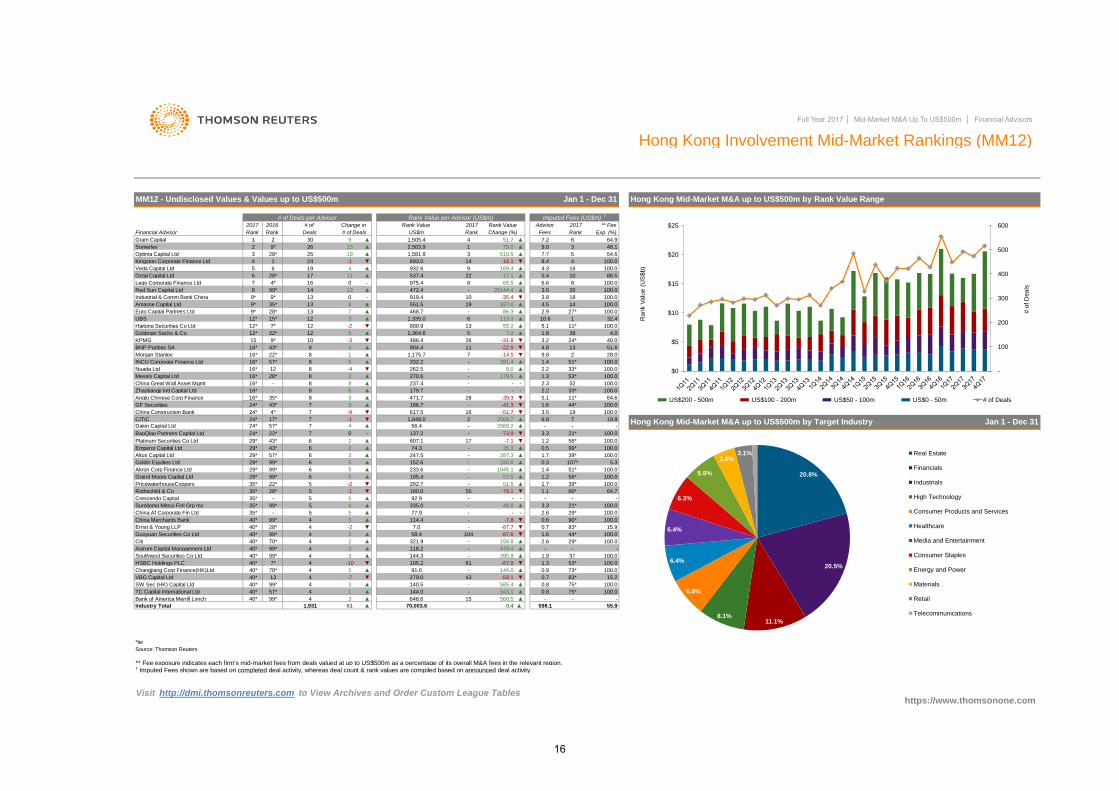
Full Year 2017 │ Mid-Market M&A Up To US$500m │ Financial Advisors
Hong Kong Involvement Mid-Market Rankings (MM12)
** Fee exposure indicates each firm's mid-market fees from deals valued at up to US$500m as a percentage of its overall M&A fees in the relevant region.† Imputed Fees shown are based on completed deal activity, whereas deal count & rank values are compiled based on announced deal activity.
Visit http://dmi.thomsonreuters.com to View Archives and Order Custom League Tables
99* 4 3 ▲ 648.6 15 560.5 ▲ - - -
- 585.4 ▲ 0.8 75* 100.0
TC Capital International Ltd 40* 57* 4 1 ▲ 144.0 - 343.1 ▲ 0.8 75* 100.0
Zhaobangji Intl Capital Ltd
China Great Wall Asset Mgmt
Nuada Ltd
INCU Corporate Finance Ltd
3
BNP Paribas SA
VBG Capital Ltd 40* 13 4 -7 ▼ 279.0 43 -59.1 ▼ 0.7 83* 15.2
Emperor Capital Ltd
*tie
29*
237.4 100.0
179.7
1,175.7
43*
16*
2
8
12*
Deals
Grand Moore Capital Ltd
Akron Corp Finance Ltd
Goldin Equities Ltd
Bank of America Merrill Lynch 40*
SW Sec (HK) Capital Ltd 40* 99*
24*
Change in
332.2
MM12 - Undisclosed Values & Values up to US$500m
2017
16
2
1
8
1
▲
8.0
24* 2
Anglo Chinese Corp Finance
919.4
Rank
CITIC
Messis Capital Ltd
Morgan Stanley
Haitong Securities Co Ltd
UBS
Euto Capital Partners Ltd
Amasse Capital Ltd
Red Sun Capital Ltd
Lego Corporate Finance Ltd
Octal Capital Ltd
-39.3▲
2566.7
GF Securities
4Kingston Corporate Finance Ltd
Optima Capital Ltd
Somerley
Gram Capital
100.0
10.6
33*
44*
53*
1
5
6
▲
100.0
3
3
100.0
19.9
43*
7
2
▼
-2
2069.2
-
1.2
▲
1.7
35.3
468.7
607.1
7.7
6
932.6
39*
▲
-7.1
-
598.1▲
57*
43* 6
486.4
▲
13
471.7
12*
-51.7 3.5
13
3
3.2
▲
6
2016
391.4
8
22
16
17
4
35*
29*
16*
-
56*
0 18
▼
4.0
100.0
137.2
2.3
617.5
▼
▲
1.4
28* - 179.5
35*
100.0
-73.9
-
7
56*
57.5
99*
- 51*
12
14
10
12
22* 9.8▼
▲
29*
35*
29*
7
1.2
29*
17
▼
-
7
▲
-
https://www.thomsonone.com
8
99*
10 3.8
12*
16* 12
4
1.8
16*
7.2
-14.5
5
▲
15
▲
2.9
5
16*
55.2
▼
-
113.3
5
▲57*
6
-
▲
22*
▲
5.1
9*
▲
-9
10
100.0
17*
152.6
8
5
▲
-
1.3
1.6
100.0
28.0
13
▼
100.0
13
-35.4
28
4.8
8
11
▲
100.026144.4472.4
8
51.6
-87.6 ▼
321.9
24*
Jan 1 - Dec 31
5
Rank
9.0
Change (%)
51.7
Jan 1 - Dec 31
Exp. (%)
54.6
▲
1,505.4
1,581.9
▲
48.1
2
7 65.5
4.3
13
9 ▲
19
-1 ▼
510.5
9*
8 26
9*
6.6
9*
2017
551.5
975.44*
▲
2,503.9
▼
3.0
4
▲
Hong Kong Mid-Market M&A up to US$500m by Rank Value Range
8.4
2017
100.0
100.096
-18.1
64.9▲
19
14
Rank Value
28*
79.0
Imputed Fees (US$m) †
▼
▲
▲
8
3.3
▲
▲6 5
▼
4
-
100.0
9*
3
8
-
29*
99*
25
-
88.5
Rank Value
Source: Thomson Reuters
Hong Kong Mid-Market M&A up to US$500m by Target Industry
241
US$m
9*
5.4
4.5
0 -
35* - 5 5 ▲
Sumitomo Mitsui Finl Grp Inc 35* 99* 5 4 ▲
China Af Corporate Fin Ltd 35* - 5 5 ▲
China Merchants Bank 40* 99* 4 3 ▲
Ernst & Young LLP
3 ▲
Southwest Securities Co Ltd
▼ 21*
1,335.0
-
30
# of Deals per Advisor
Financial Advisor Rank
1,364.6
6.8
99*
-1
▲
3
2.2-
16*
▲
1
▼
186.7
1,848.0
▼
▲
282.7
Goldman Sachs & Co
FeesRank
24*
74.3
▲
262.5
28* 7
19
-
8
-41.3
▲
- 86.3
Platinum Securities Co Ltd
Dakin Capital Ltd
China Construction Bank
15*
PricewaterhouseCoopers 22*
0.3
Advisor
55.9
1045.1
26
33*
▲
4
Rank Value per Advisor (US$m)
17.128*
7*
43*
-
▲537.4
0.5
Citi
- - -
114.4 -
** Fee
2
-22.9
57*
-31.8
7.2
32
-
▼
270.6
26
11*
927.0
693.0
-
KPMG
Industrial & Comm Bank China
Veda Capital Ltd
▲
12
-4 2.2
7
39*
100.0
▲
6
- 51.5
19
51*
100.0
-
100.0
100.0
91.0 - 144.0 ▲
32.4
100.0
6
14
8
5.1
▲
5 -2
-7.8 ▼
7.0 - -87.7
180.0 55 -79.1
- 158.8 ▲
35* 28* 5 -1
8
Industry Total
38
16*
-3
61
Altus Capital Ltd
BaoQiao Partners Capital Ltd
7 ▲
▲1,931
4 3 ▲ 140.5
16*
24*
0
1.4
▼
▲
99*
▲
▲
40* 70* 4 2 ▲
77.9
-2 ▼
800.9
233.6
100.0
-
40.0
8
287.3
904.4
7
1.7
107*
70,003.6 0.4
169.4
16
13
▲
240.6
3
▼
24*
100.0
100.0
-
56.4
6 5 ▲
5.3
▲
100.0
64.6
-
2
11*
4*
99* 4 3 ▲
▼
58.4 104 100.0
2.6 29* 100.0
- -
247.5
3
Astrum Capital Management Ltd
144.3 - 395.9
118.2 - 479.4 ▲40* 99* 4
Changjiang Corp Finance(HK)Ltd 40* 70* 4 2 ▲
40*
22*
▲13
# of Deals
11
27*
105.4 -
# of
▲
▲
▲
0.9 73* 100.0
HSBC Holdings PLC 40* 7* 4 -10 ▼
▲
105.2 81 -87.9 ▼
1.1 60* 64.7
- - -
3.3 21* 100.0
2.6 29* 100.0
0.6 90* 100.0
0.7 83* 15.9
1.6 44*
-
1.9 37 100.0
1.3 53* 100.0
▼
92.9 - - -
335.0 - 49.8 ▲
40* 28* 4
Rothschild & Co ▼
Crescendo Capital
Guoyuan Securities Co Ltd 40* 99* 4
-
100
200
300
400
500
600
$0
$5
$10
$15
$20
$25
# o
f D
eals
Ra
nk V
alu
e (
US
$b
)
US$200 - 500m US$100 - 200m US$50 - 100m US$0 - 50m # of Deals
20.8%
20.5%
11.1% 8.1%
6.8%
6.4%
6.4%
6.3%
5.9%
3.8% 3.1% Real Estate
Financials
Industrials
High Technology
Consumer Products and Services
Healthcare
Media and Entertainment
Consumer Staples
Energy and Power
Materials
Retail
Telecommunications
16
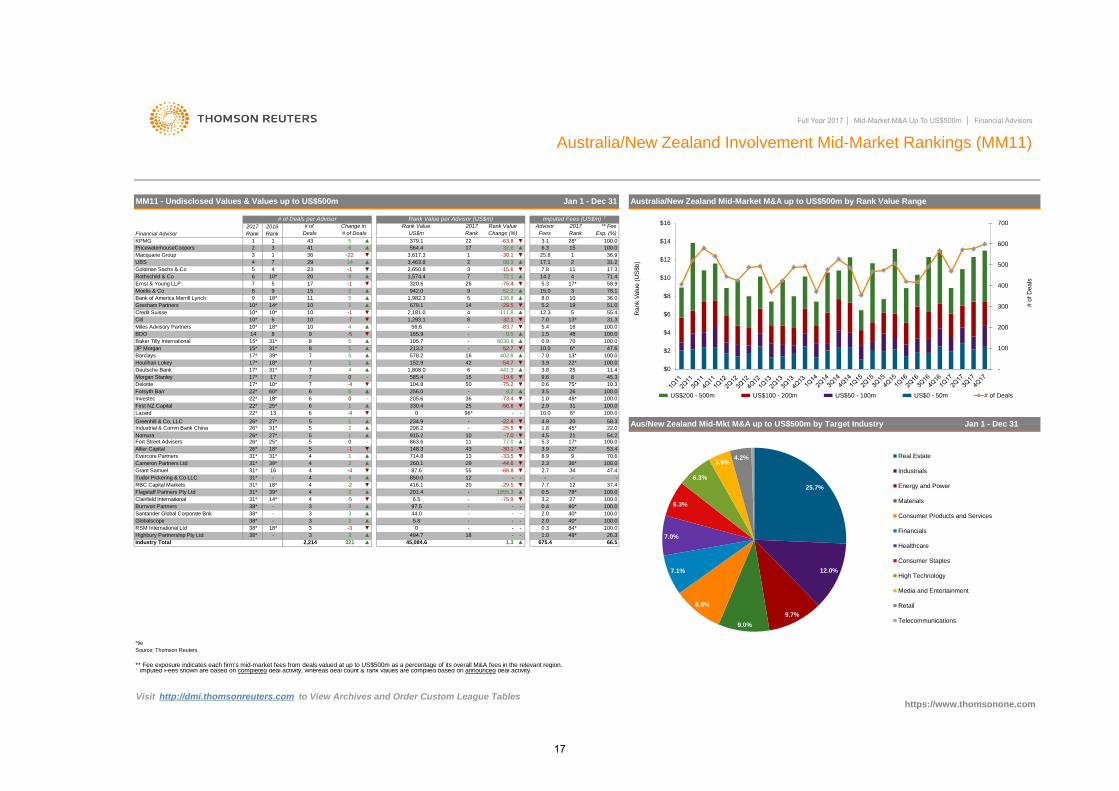
Full Year 2017 │ Mid-Market M&A Up To US$500m │ Financial Advisors
Australia/New Zealand Involvement Mid-Market Rankings (MM11)
*tie
** Fee exposure indicates each firm's mid-market fees from deals valued at up to US$500m as a percentage of its overall M&A fees in the relevant region.† Imputed Fees shown are based on completed deal activity, whereas deal count & rank values are compiled based on announced deal activity.
Visit http://dmi.thomsonreuters.com to View Archives and Order Custom League Tables
8
75*
5.2
0.6
▼
▼
50
10* -1
15*
Rank Value
Source: Thomson Reuters
15*
▲
Gresham Partners
Moelis & Co
MM11 - Undisclosed Values & Values up to US$500m
Financial Advisor
578.2
17*
1
26*
-
▼
47.6
▲
3 -3 ▼
148.3 43 -30.1 ▼
714.8 13 -33.5 ▼
260.1 29 -44.6 ▼
87.6 55 -88.8 ▼
-83.7
31*
70
10*
▲
100.0
1 ▲25* 5 027*
863.6 11 77.0 ▲
9
8030.8
330.4
585.4
441.3▲
-5
15
14
1,574.4
-1
72.1
▼
9
26
5
2
2.9
136.8
379.1
Aus/New Zealand Mid-Mkt M&A up to US$500m by Target Industry
-22
25
-54.7
9
▲
13*
1
5
10
▲
8
▲
-
-32.1 7.0
-
▼
-19.6
10*
2,181.0
▲
6
100.0
4.2
-
2 ▲
▲
22
17 ▲
Change in
▼ 1,293.1
3
▼
▼
** Fee
Exp. (%)
7
9
10*
17*
https://www.thomsonone.com
-75.2104.8
5 1
52.2
10
4
17*
5
22*
▼7
18*22*
36.9
▲
1
Barclays
JP Morgan
Baker Tilly International
BDO
Miles Advisory Partners
Citi
Credit Suisse
Ernst & Young LLP
-
-
First NZ Capital
Lazard
Greenhill & Co, LLC
Investec
Forsyth Barr
Deloitte
0.5
3.9
25* 1
22*
1
14
7
▲
54.2
45.3
10.3
44.0 - - -
5.8 - - -
0 - - -
494.7 18
-25.5 ▼
3
-73.4
100.0
25.8
# of
8
234
3
2016
Australia/New Zealand Mid-Market M&A up to US$500m by Rank Value Range
17.3
1
32.6
7
51.0
56.6
165.9
▼
2
Industry Total
Jan 1 - Dec 31
1.0
45,084.62,214 675.4
11
2
100.0
4
10*
UBS
▼
100.0
16
-52.7▲
Rank
▲
-15.6
100.0
6Rothschild & Co
Goldman Sachs & Co
Macquarie Group
10
Bank of America Merrill Lynch
Deutsche Bank
Houlihan Lokey
Morgan Stanley
Industrial & Comm Bank China
NomuraFort Street Advisers
-63.8
PricewaterhouseCoopers
KPMG
11.4
▲
3.5
1.3
6 49*
22* 13
14
100.0
100.0
14*
▲
▼
28*
Imputed Fees (US$m) †
10*
13*
9
100.0
4.9
7
26▲
10 -7.0 ▼
▼
Fees
-1
15
Rank Value per Advisor (US$m)
6.3
36.0
100.0
78.1
43
▲
679.1
29
7
6*
18*
10
0
564.4
11
▲
Rank Rank
15
17
111.8
36
31
▲
0
256.0
298.2
205.6
5
17*
17*
17*
42152.9
17
▲
▼
3,463.8
320.6
1▼
7.8
20
1855.3 ▲
6.5 - -75.9 ▼
97.5 - - -
▲
18*
9.6
7.0
Rank Value
Jan 1 - Dec 31
8
-
17*
3.8
▲321
41
8
▼7
60*
1,808.0
▲
▲
5
6*
6
402.8
1.5
22*
25
-
31*
18*
8 48
3,617.3
5
▼-30.1
17.1
2017
10.0
6 -4 ▼
27*
6
-
-56.8
105.7
2017
31* 5
▲
1,982.3
3
21
6
4
0 96* - -
234.9
5.3
-22.8
US$m
Advisor
26*
26*26*
31*
Rank
31.3
2017
45* 22.0
4.5
-29.5
5
5
36
Deals
3.1▼
0.9 100.0
5.4
19
▲
15.0
68.3
1
Change (%)
8.0
100.0
2,650.8
▲
5
# of Deals
58.3
1.8
5
▼ 58.9
▼
-75.4
10*
942.0
12.3
7
# of Deals per Advisor
▲
71.4
31.2
-7
16
-
55.4
14.2
10.0
Allier Capital 26* 18* 5 -1 ▼
Evercore Partners 31* 31* 4 1 ▲
Cameron Partners Ltd 31* 39* 4
6
4 ▼
2 ▲
Grant Samuel 31* 16 4 -4 ▼
Tudor Pickering & Co LLC 31* - 4 4 ▲
20
915.2
213.2
5.3
4
2
10
5
-4
39*
RBC Capital Markets 31* 18* 4 -2 ▼
- -
Flagstaff Partners Pty Ltd 31* 39* 4 2 ▲
Clairfield International 31* 14* 4 -5 ▼
Burnvoir Partners 38* - 3 3 ▲
Santander Global Corporate Bnk 38* - 3 3 ▲
Globalscope 38* - 3 3 ▲
RSM International Ltd 38* 18*
-
416.1 20 -29.5 ▼
201.4 -
3.9 22* 53.4
8.9 9 70.6
2.3 36* 100.0
2.7 34 47.4
- - -
7.7 12 37.4
0.5 78* 100.0
3.2 27 100.0
0.4 80* 100.0
850.0 12 -
2.0 40* 100.0
2.0 40* 100.0
0.3 84* 100.0
1.0 49* 26.3
66.5
Highbury Partnership Pty Ltd 38* - 3 3 ▲
-
100
200
300
400
500
600
700
$0
$2
$4
$6
$8
$10
$12
$14
$16
# o
f D
eals
Rank V
alu
e (
US
$b)
US$200 - 500m US$100 - 200m US$50 - 100m US$0 - 50m # of Deals
25.7%
12.0%
9.7%
9.0%
8.8%
7.1%
7.0%
6.3%
6.3%
3.9% 4.2% Real Estate
Industrials
Energy and Power
Materials
Consumer Products and Services
Financials
Healthcare
Consumer Staples
High Technology
Media and Entertainment
Retail
Telecommunications
17
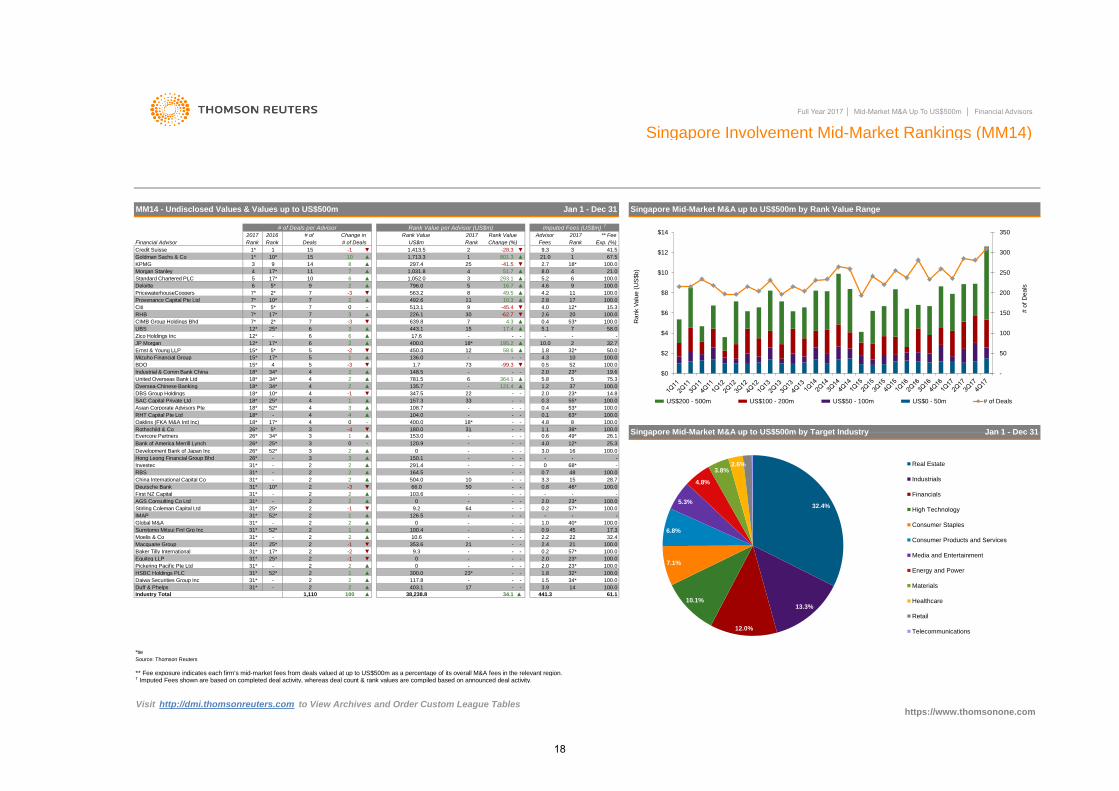
Full Year 2017 │ Mid-Market M&A Up To US$500m │ Financial Advisors
Singapore Involvement Mid-Market Rankings (MM14)
*tie
** Fee exposure indicates each firm's mid-market fees from deals valued at up to US$500m as a percentage of its overall M&A fees in the relevant region.† Imputed Fees shown are based on completed deal activity, whereas deal count & rank values are compiled based on announced deal activity.
Visit http://dmi.thomsonreuters.com to View Archives and Order Custom League Tables
Equiteq LLP 31* 25* 2 -1 ▼ 0 - - - 2.0 23* 100.0
Pickering Pacific Pte Ltd 31* - 2 2 ▲ 0 - - - 2.0 23* 100.0
HSBC Holdings PLC 31* 52* 2 1 ▲ 300.0 23* - - 1.8 32* 100.0
Daiwa Securities Group Inc 31* - 2 2 ▲ 117.8 - - - 1.5 34* 100.0
Duff & Phelps 31* - 2 2 ▲ 403.1 17 - - 3.9
Moelis & Co 31* - 2 2 ▲ 10.6 - - - 2.2 22 32.4
Macquarie Group 31* 25* 2 -1 ▼ 353.6 21 - - 2.4 21 100.0
Baker Tilly International 31* 17* 2 -2 ▼ 9.3 - - - 0.2 57* 100.0
IMAP 31* 52* 2 1 ▲ 126.5 - - - - - -
100.0
12*
4.6 100.0
2.8
1 801.3
-28.3
100.0
US$m
▲
Oversea-Chinese Banking
United Overseas Bank Ltd
Stirling Coleman Capital Ltd 31* 25* 2 -1 ▼ 9.2 64 - - 0.2 57* 100.0
3
Rank Deals
2016
1*
Global M&A 31* - 2 2 ▲ 0
Mizuho Financial Group
Ernst & Young LLP
JP Morgan
- - - 1.0 40* 100.0
Sumitomo Mitsui Finl Grp Inc 31* 52* 2 1 ▲ 100.4
5 10 6
Rank
297.4
5.26
15
Rank Value
67.5
▲
7
4
▲
Industrial & Comm Bank China
BDO
12
7
▼
400.0
6
8
10*
Fees
-
# of Deals per Advisor
Singapore Mid-Market M&A up to US$500m by Target Industry
Singapore Mid-Market M&A up to US$500m by Rank Value Range
-
100.0
19.6
11
10.3
Zico Holdings Inc
100.0
Morgan Stanley
CIMB Group Holdings Bhd
25* 3
17*
▼
Imputed Fees (US$m) †
MM14 - Undisclosed Values & Values up to US$500m
▲
4.0
6
17*
-
▼
-
Source: Thomson Reuters
▲Industry Total
https://www.thomsonone.com
1,110 38,238.8
Jan 1 - Dec 31
441.3
75.3
Rank Exp. (%)
2017
1,713.3
347.5 22 -
41.5
100.0
58.0
4
9
12* - -
▲
9 -45.4
-
5
2.7
61.1
Rank Value
32.7
100.0
21.0
7*
15*
10*
5 1 ▲ 136.0
-
15
25
7
5*
▲
# of Advisor
16.7
▲
-
11
4.2
9.3 3
7*
7*
4 5
6
2
UBS
Citi
Provenance Capital Pte Ltd
PricewaterhouseCoopers
Deloitte
Standard Chartered PLC
KPMG
Goldman Sachs & Co
Credit Suisse
▲
-41.5
51.71,031.8
2 ▲
0.5
100.0
-
17.6
50.0
15.3
34.1 ▲100
30
164.5 - - -
504.0 10
100.0
23* 14.8
9
5*
▲
781.5
10
Change in 2017
Rank# of Deals
1,413.5
2.0
6 2
5.1
▲▲
1
1.2
7* 2*
7*
17.4
9
6
-
66.0 50 - -
103.6 - - -
0 - - -
121.0
0
148.5 - -
100.0
2.0
▲
34* 4
5
7
▲
1,052.0
2*
▼
DBS Group Holdings
15
1*
4
3 ▲17*
4
492.6
RHB
2017
7
8
▲10*
-3
4.3 10
▲
15*
▼
Rank Value per Advisor (US$m)
Financial Advisor
▼
17*
14
-1
7
-
▲450.3
443.1
12*
- - - 0.9 45 17.3
14 100.0
SAC Capital Private Ltd 18* 25* 4 1 ▲
Asian Corporate Advisors Pte 18* 52* 4 3 ▲
RHT Capital Pte Ltd 18* - 4 4 ▲
Oaklins (FKA M&A Intl Inc) 18* 17* 4 0 -
513.1
▲
1.7
- -
-3
34* 2 ▲
34*18*
18*
▲
796.0
563.2
17*
6 364.1 ▲
135.7 - 121.4 ▲
4.3
58.6
▲
5.8
0.3 55* 100.0
Rothschild & Co 26* 5* 3 -4 ▼
7
3 293.1
25*
15*
18*
18*
639.8
49.5
100.0
20
17
226.1 -62.7
23*
195.2
12*
37
▼ 53*
18*
▼
▼
32*
0.4
1.8
-
2
2
10.0
Jan 1 - Dec 31
Change (%)
** Fee
8.0
18*
5273 -99.3-3 ▼
2
4
11
5
-1
▲
4
2.6
▼
7
-2
Evercore Partners 26* 34* 3 1 ▲
Bank of America Merrill Lynch 26* 25* 3 0 -
Development Bank of Japan Inc 26* 52* 3 2 ▲
Hong Leong Financial Group Bhd 26* - 3 3 ▲
Investec 31* - 2 2 ▲
RBS 31* - 2 2 ▲
China International Capital Co 31* - 2 2 ▲
Deutsche Bank 31* 10* 2 -3 ▼
First NZ Capital 31* - 2 2 ▲
AGS Consulting Co Ltd 31* - 2 2 ▲
157.3 33 - -
108.7 - - -
104.0 - - -
400.0 18* - -
180.0 31 - -
153.0 - - -
120.9 - - -
0 - - -
150.1 - - -
291.4 - - -
0.4 53* 100.0
0.1 63* 100.0
4.8 8 100.0
1.1 38* 100.0
0.6 49* 26.1
4.0 12* 25.3
3.0 16 100.0
- - -
0 68* -
0.7 48 100.0
3.3 15 28.7
0.8 46* 100.0
- - -
2.0 23*
-
50
100
150
200
250
300
350
$0
$2
$4
$6
$8
$10
$12
$14
# o
f D
ea
ls
Ra
nk V
alu
e (
US
$b
)
US$200 - 500m US$100 - 200m US$50 - 100m US$0 - 50m # of Deals
32.4%
13.3%
12.0%
10.1%
7.1%
6.8%
5.3%
4.8%
3.8% 2.6% Real Estate
Industrials
Financials
High Technology
Consumer Staples
Consumer Products and Services
Media and Entertainment
Energy and Power
Materials
Healthcare
Retail
Telecommunications
18
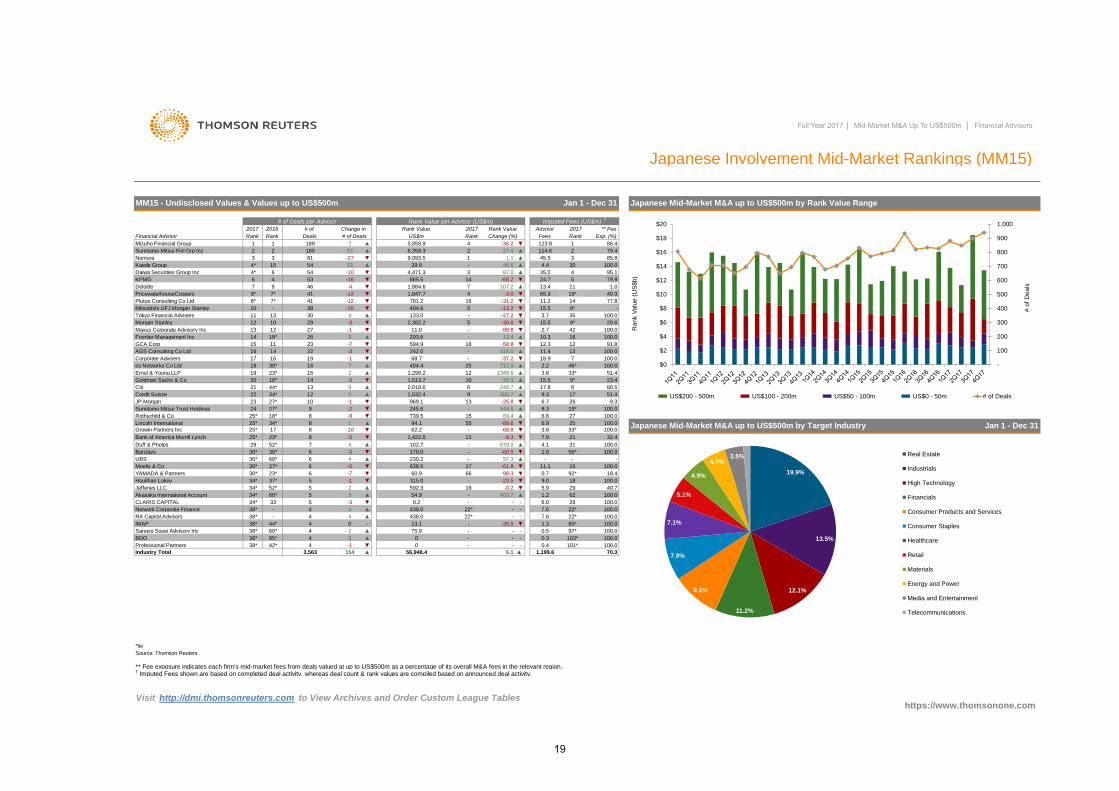
Full Year 2017 │ Mid-Market M&A Up To US$500m │ Financial Advisors
Japanese Involvement Mid-Market Rankings (MM15)
** Fee exposure indicates each firm's mid-market fees from deals valued at up to US$500m as a percentage of its overall M&A fees in the relevant region.† Imputed Fees shown are based on completed deal activity, whereas deal count & rank values are compiled based on announced deal activity.
Visit http://dmi.thomsonreuters.com to View Archives and Order Custom League Tables
- 7.6 22* 100.0
RA Capital Advisors 38* - 4 4 ▲ 438.0 22* - - 7.6 22* 100.0
IMAP 38* 44* 4 0 - 13.1 - -35.5 ▼ 1.3 60* 100.0
https://www.thomsonone.com
Houlihan Lokey 34* 37* 5 -1 ▼ 315.0
BDO 38* 85* 4 3 ▲ 0
Professional Partners 38* 42* 4 -1 ▼
Duff & Phelps
Bank of America Merrill Lynch
Growin Partners Inc
Lincoln International
Rothschild & Co
Sumitomo Mitsui Trust Holdings
JP Morgan
Credit Suisse
Goldman Sachs & Co
Ernst & Young LLP
es Networks Co Ltd
Corporate Advisers
AGS Consulting Co Ltd
GCA Corp
Frontier Management Inc
Maxus Corporate Advisory Inc
Morgan Stanley
Change in
13
4
3
2017
1
-3
▲
▼
Deloitte
KPMG
Daiwa Securities Group Inc
Kaede Group
Nomura
Sumitomo Mitsui Finl Grp Inc
-3.0
Mizuho Financial Group
Financial Advisor
Tokyo Financial Advisers
Japanese Mid-Market M&A up to US$500m by Rank Value Range
20.3 ▲
23
2
25
54
14 18*
246.7
9*
-68.2
10.3
100.0
6,358.3 79.4
85.8
100.0▼16
▲
2
11
-12
23
▲
# of Deals per Advisor
969.1
13
12 10
4*
19
7
8*
17
# of Deals
Advisor
53 79.9
35.2
865.5
MM15 - Undisclosed Values & Values up to US$500m
▼-3
11.0
▲
3
100.0
4
1.1
53
▼
30
2
-
20.6
▼
22
8.3 100.019*
34*
14
▲
▲
9
2
▲
17
6.7-1
15
2017
3.7
404.6 5
189
13.4
1,847.7
24.7
44*
Mitsubishi UFJ Morgan Stanley
Plutus Consulting Co Ltd
PricewaterhouseCoopers
1,532.4
13
Fees
2017
▼
6
1,884.6
12
701.2-12
16
▲
45.5
54
# of
46.6-
▲
▼
-36.2
▼
51.4
Japanese Mid-Market M&A up to US$500m by Target Industry
32.4
-68.8-10
▼ 7.9
2,018.6
▲
18.9
8
9*
100.0
100.0▼ 3.8
12
23.410
▼
12.3
3.8
6.6
11.4
712.0 2.2
25
19*
▼ 15.5
293.6
100.0
95.1
1.0
3
-10
80.5
▲
7
14
Rank Value
33*
7
2.7
35
27.4
-
46*
242.0
404.4
▲
65.3
9*
▲
77.8-31.2
100.0
US$m
91.8
100.0
Jan 1 - Dec 31
86.4
1,513.7
81
Rank
4
9
2016
14
-27.2
40.3
30
38
▼ 56*
29
▼
3,858.9
DealsRank Change (%)
Barclays
UBS 30* 60* 6 4 ▲
*tie
30* 30* 170.0
1,199.6 70.3
-1
13 100.0
-27
-80.8
▼ -30.6
Rank Value
114.6
Exp. (%)
** Fee
14
Rank
4.4
Imputed Fees (US$m) †
- -60.5 ▼ 1.9
3,563 ▲
-
185
87.0
9,093.5 1
Rank
▼
123.8
2
29.9
4,471.3
Rank Value per Advisor (US$m)
-
1630*
2,382.2
▲
▼-58.8
5
▼
9
▼-7 18594.9
Jan 1 - Dec 31
▲
-
22
4.1
20
25*
▲▼
-
Source: Thomson Reuters
1,299.2
416.0
Citi
6
23*
25*
25*
25*
-1
-3
9.39 385.7
17.8
14
230.2 - 57.3
11
6 3
▲
94.1 55 ▼
15.5
42
13.4
33
▼7*
▼
71
9
678.0 ▲ 31
68.7
Moelis & Co 30* 27* 6 -5 ▼ 638.5 17 -61.8 ▼
27*
▼
27
-20 ▼
41
▲
▼
21
▼
18
5
11
15.5
16
34* 8
18*
6
5
-25.8
41
107.2
-16
4* 15
--2
13
1343.612
▲
12
26
▼
8
6.9▲
▼
▲
-89.6
69.4
-37.2-
21
739.5 27
7
17
46 -4 ▼
7*
10 -
27*
18*
4
29
133.0 -
-13.2
11.2
-98
24 245.6
26
▼
15
100.0
4
6.1
52*
1,422.6 11 -9.323*
40.7
34* 60* 5
▲
-90.3 ▼ 0.7 92* 18.4
168*
▼
-
100.0
38* 60* 4 2 ▲ 75.9 - - - 0.5
11.1 15 100.0
8
-3
9.3
51.4
62.2 -
-5 ▼
1
19
▲ -
100.0▲ 102.7
- -23.5 ▼ 9.0 18 100.0
97* 100.0
- - - 0.3
▲
15
10
▲
7
33*
844.6
YAMADA & Partners 30* 23* 6 -7 ▼ 60.9 66
- - 6.0 28 100.0
Network Corporate Finance 38* - 4
154 56,948.4
103* 100.0
0 - - - 0.4 101* 100.0
4 ▲
Jefferies LLC 34* 52* 5 2 ▲ 592.3 19 -0.2 ▼ 5.9 29
Akasaka International Account 3 ▲ 54.9 - 403.7 ▲ 1.2 62 100.0
CLARIS CAPITAL 34* 33 5 -3 ▼ 0.2 -
Industry Total
438.0 22* -
Sangyo Sosei Advisory Inc
-
100
200
300
400
500
600
700
800
900
1,000
$0
$2
$4
$6
$8
$10
$12
$14
$16
$18
$20
# o
f D
ea
ls
Ra
nk V
alu
e (
US
$b
)
US$200 - 500m US$100 - 200m US$50 - 100m US$0 - 50m # of Deals
19.9%
13.5%
12.1%
11.2%
9.1%
7.9%
7.1%
5.1%
4.9%
4.5% 3.5% Real Estate
Industrials
High Technology
Financials
Consumer Products and Services
Consumer Staples
Healthcare
Retail
Materials
Energy and Power
Media and Entertainment
Telecommunications
19
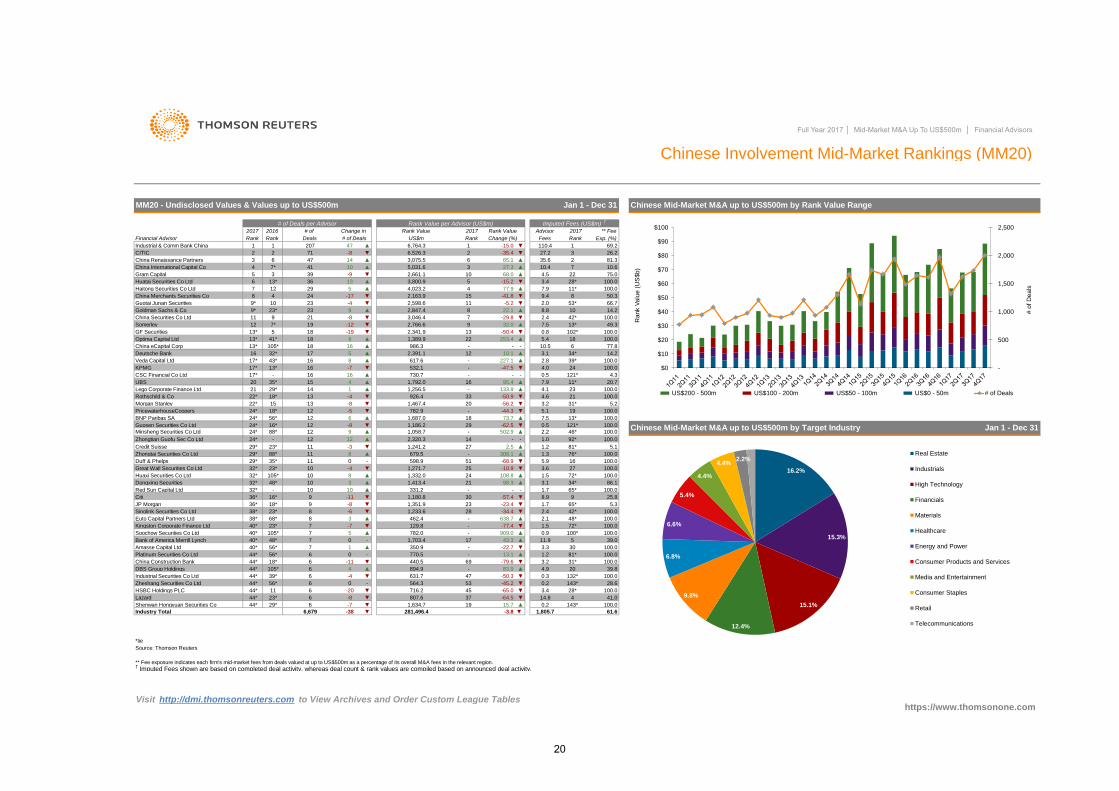
Full Year 2017 │ Mid-Market M&A Up To US$500m │ Financial Advisors
Chinese Involvement Mid-Market Rankings (MM20)
** Fee exposure indicates each firm's mid-market fees from deals valued at up to US$500m as a percentage of its overall M&A fees in the relevant region.† Imputed Fees shown are based on completed deal activity, whereas deal count & rank values are compiled based on announced deal activity.
Visit http://dmi.thomsonreuters.com to View Archives and Order Custom League Tables
28.6
HSBC Holdings PLC 44* 11 6 -20 ▼ 716.2 45 -65.0 ▼ 3.4 28*
41.0
61.66,679
Shenwan Hongyuan Securities Co 44* 29* 6 -7 ▼ 1,634.7 19 15.7 ▲ 0.2 143* 100.0
Industrial Securities Co Ltd 44* 39* 6 -4 ▼ 631.7 47 -50.3 ▼ 0.3 132* 100.0
Zheshang Securities Co Ltd 44* 56* 6 0 - 564.3 53 -45.2 ▼ 0.2 143*
PricewaterhouseCoopers
100.0
Morgan Stanley
Rothschild & Co
CSC Financial Co Ltd
KPMG
China eCapital Corp
Optima Capital Ltd
Goldman Sachs & Co
Guotai Junan Securities
China Merchants Securities Co
Haitong Securities Co Ltd
Gram Capital
China Renaissance Partners
CITIC
770.5 - 13.1
3.1 34*
3 26.2
3 6 47
▲
1,332.0 24 108.8 ▲
1,413.4 21 98.3 ▲
331.2
Guosen Securities Co Ltd 24* 16* 12 -8 ▼ 1,186.2 29 -62.5 ▼ 0.5 121* 100.0
Lazard 44* 23* 6 -8 ▼ 807.6 37 -64.5 ▼ 14.8 4
73.7
▲
▲ 6,764.3
8
10
20
Jan 1 - Dec 31
100.0
18*
15
18*
21
1
▼ 27.2
Chinese Mid-Market M&A up to US$500m by Rank Value Range
18
-12 ▼ 2,766.6 9 32.0 ▲ 7.5 13* 49.3
2.0 53* 66.7
Somerley 12
▲ 10.4 7 10.6
GF Securities 13* 5 18 -19 ▼ 2,341.9 13 -50.4 ▼ 0.8 102* 100.0
Veda Capital Ltd 17* 43* 16
3 39
-5.2 ▼
2.4 42* 100.0
4.5
5 -15.2 ▼ 3.4
13* 105*
39*
24* 56* 12BNP Paribas SA
14.2
MM20 - Undisclosed Values & Values up to US$500m Jan 1 - Dec 31
1
100.0
13* 16 -7
Change (%) Fees
▲
100.0
1 69.247
Deutsche Bank
2017
9* 23* 23 9 ▲ 2,847.4 8 22.1 ▲ 8.8 10 14.2
3,800.9
Rank Value
17* -
▼
100.0
5.1
Lego Corporate Finance Ltd 21 29*
1
6 77.8
16 ▲ 4.3
Rank
4,023.229
8 4
4
China International Capital Co 4 7* 41
986.3 - - -
23 -4
3,046.4
US$m Rank
14 1 ▲
1,792.0 16
81.3
2
▲
10
1,687.0 18 ▲
1,256.5
13 -4 ▼
12 -5 ▼
23
7*
181,389.9 100.0
7
13
22*
22*
24*
33 -50.9
19
-
16 32* 17 5
730.7 - -
227.1
16
16 ▲
-29.8
22 253.4 ▲
- 0.5
100.0
17*
18
2,391.1
100.0
-56.2 ▼
9 ▲
5.2
19-44.3 ▼
13*
-8 ▼
▲ 7.9 11* 20.7▲
- 133.9 ▲ 4.1
10.5
▲ 617.6
14
7.5
782.9
▲
11*
-9 2,661.1 10
28*
-17 ▼ 2,163.9 15 -41.8 ▼ 9.4 8 50.3
5 ▲
22 75.0
7.9
13
-35.4
532.1 - -47.5 ▼ 4.0
6 ▲
462.4 - 638.7 ▲
129.8 - -77.4 ▼
782.0 - 909.0 ▲
1,703.4 17 43.3 ▲
350.9 - -22.7 ▼
-38 ▼
95.4
11 -3 ▼
https://www.thomsonone.com
2.2 46* 100.0
1.0 92* 100.0
1.2 81* 5.1
1.3 76* 100.0
5.9 16 100.0
3.6 27 100.0
1.5 72* 100.0
3.2 31*
35*
-
1,058.7 - 502.9 ▲
2,320.3 14 - -
1,241.2
926.4
Zhongtian Guofu Sec Co Ltd 24* - 12 12 ▲
Credit Suisse 29* 23*
281,496.4 -3.8 ▼ 1,805.7
3.1
Chinese Mid-Market M&A up to US$500m by Target Industry
9 -8 ▼
Sinolink Securities Co Ltd 38* 23* 8 -6 ▼
Minsheng Securities Co Ltd 24* 88* 12 9
6,526.3 2
Rank
20172016 # of
# of Deals
** Fee
-
77.9
▼ 4.6
12
41*
1,467.4 20
2,598.6 11
2017 Rank Value Advisor
▲
4
Industry Total
35.6 2
13*
China Securities Co Ltd 11 9 21 -8 ▼
100.0
# of Deals per Advisor
-15.0 ▼ 110.4
Rank Value per Advisor (US$m) Imputed Fees (US$m) †
▼
▲
Change in
68.0▼
Rank
2 71 -8 ▼
5
24
7
9*
6Huatai Securities Co Ltd 36
24 100.0
UBS 15
▼
121*
▲ 3,075.5 6 65.1 ▲
27.3
207
2.8
12 10.1
13* 5.4
Deals Exp. (%)
Industrial & Comm Bank China
Financial Advisor
▲ 5,031.6 3
32* 23* 10 -4 ▼
- 308.1 ▲
598.9 51 -68.9 ▼
1,271.7 25 -10.9 ▼
23 -23.4 ▼
Amasse Capital Ltd 40* 56* 7 1 ▲
Huaxi Securities Co Ltd 32* 105* 10 8 ▲
Dongxing Securities 32* 48* 10 3 ▲
Red Sun Capital Ltd 32* - 10 10 ▲
Citi 36* 16* 9 -11 ▼
JP Morgan 36* 18*
- - -
1,180.8 30 -57.4 ▼
1,351.9
1,233.6 28 -34.4 ▼
34* 86.1
1.7 65* 100.0
8.9 9 25.8
1.7 65* 5.3
Euto Capital Partners Ltd 38* 68* 8 3 ▲
Kingston Corporate Finance Ltd 40* 23* 7 -7 ▼
Soochow Securities Co Ltd 40* 105* 7 5 ▲
Bank of America Merrill Lynch 40* 48* 7 0
Platinum Securities Co Ltd 44* 56* 6 0 -
*tie
China Construction Bank
Source: Thomson Reuters
27 2.5 ▲
679.5
44* 18* 6 -11 ▼
DBS Group Holdings 44* 105* 6 4 ▲
440.5 69 -79.6 ▼
894.9 - 83.9 ▲
3.2 31* 100.0
4.9 20 39.8
2.1 48* 100.0
1.5 72* 100.0
0.9 100* 100.0
11.9 5 39.0
3.3 30 100.0
1.2 81* 100.0▲
2.4 42* 100.0
Zhongtai Securities Co Ltd 29* 88* 11 8 ▲
Duff & Phelps 29* 35* 11 0 -
Great Wall Securities Co Ltd
-
500
1,000
1,500
2,000
2,500
$0
$10
$20
$30
$40
$50
$60
$70
$80
$90
$100
# o
f D
ea
ls
Ra
nk V
alu
e (
US
$b
)
US$200 - 500m US$100 - 200m US$50 - 100m US$0 - 50m # of Deals
16.2%
15.3%
15.1%
12.4%
9.8%
6.8%
6.6%
5.4%
4.4%
4.4% 2.2%
Real Estate
Industrials
High Technology
Financials
Materials
Healthcare
Energy and Power
Consumer Products and Services
Media and Entertainment
Consumer Staples
Retail
Telecommunications
20
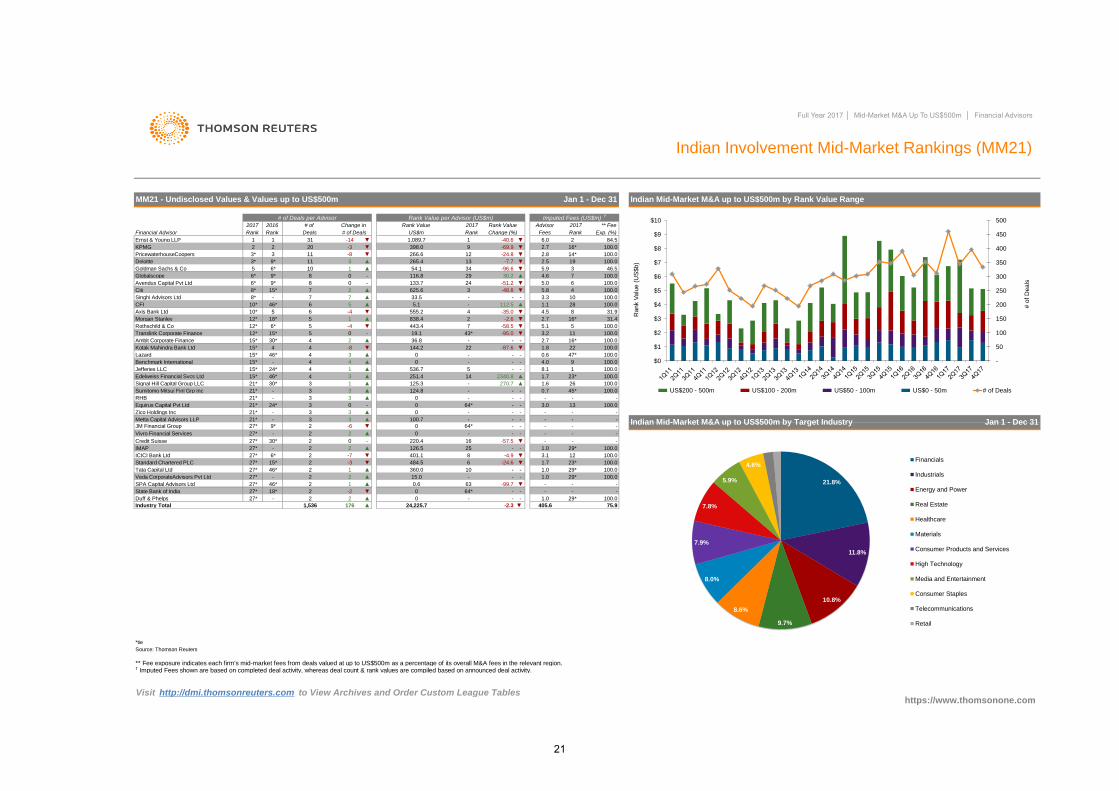
Full Year 2017 │ Mid-Market M&A Up To US$500m │ Financial Advisors
Indian Involvement Mid-Market Rankings (MM21)
** Fee exposure indicates each firm's mid-market fees from deals valued at up to US$500m as a percentage of its overall M&A fees in the relevant region.† Imputed Fees shown are based on completed deal activity, whereas deal count & rank values are compiled based on announced deal activity.
Visit http://dmi.thomsonreuters.com to View Archives and Order Custom League Tables
State Bank of India 27* 18* 2 -2 ▼ 0 64* - - -
15* 2 -3 ▼ 484.5 6 -24.6 ▼ 1.7 23* 100.0
-
Tata Capital Ltd 27* 46* 2 1 ▲ 360.0 10 - - 1.0 29* 100.0
Duff & Phelps 27* - 2 2 ▲ 0 - - - 1.0 29* 100.0
Veda CorporateAdvisors Pvt Ltd 27* - 2 2 ▲ 15.0 - - - 1.0 29* 100.0
SPA Capital Advisors Ltd 27* 46* 2 1 ▲ 0.6 63 -99.7 ▼ - - -
Vivro Financial Services 27* - 2 2 ▲ 0 - - - - - -
Credit Suisse 27* 30* 2 0 - 220.4 16 -57.5 ▼ - - -
3 ▲
- - -
3.0 13 100.0
6* 0 - 116.8 100.0
9 -69.9 ▼ 2.7 16*
-8 ▼
-
3*
▲
24*
0.6
Rank
# of
Morgan Stanley
5
▲
6*
33.5
Axis Bank Ltd
CFI
7
8 0 - 133.7 6 100.0
7
# of Deals per Advisor Rank Value per Advisor (US$m) Imputed Fees (US$m) †
Singhi Advisors Ltd
Citi
Avendus Capital Pvt Ltd
Goldman Sachs & Co
Deloitte
PricewaterhouseCoopers
KPMG
Ernst & Young LLP
Financial Advisor
0 - -
1 100.0
4 4
47*
16*
443.4
2.8 14* 100.0
11
-58.5 ▼ 5.17
26 100.0
0.7 45* 100.0
10 1
2017 2016
-
-51.2 ▼ 5.024
▼
265.4
-2.6 ▼ 2.7 16* 31.4▲ 838.4 2
22
10* 46* 6 5 ▲ 5.1 - 112.5 ▲ 1.1 28 100.0
1.8 100.0
12*
8* 15* 7 2 ▲ 625.6
19
3 -48.8 ▼ 5.8 4 100.0
8* -
-4 ▼
2.7
5
4
5
144.2
12*
22
▼ 3.2 11 100.0
100.0
-87.6 ▼15* 4
100.0
15*
15*
15*
46* 4 3
4.0 9 100.0
8.1
19.1 43* -95.0
100.0
12* 18* 5 1
124.8 - - -
0 - - -
15*
10* 5 6 -4 ▼ 555.2 4 -35.0 ▼ 4.5
1.6
https://www.thomsonone.com
1,536 176 ▲ 24,225.7 -2.3 ▼ 405.6Industry Total
*tie
Source: Thomson Reuters
-
IMAP 27* - 2 2 ▲ 126.5 25 - - 1.0 29* 100.0
ICICI Bank Ltd 27* 6* 2 -7 ▼ 401.1 8 -4.9 ▼ 3.1 12 100.0
Standard Chartered PLC 27*
2017 Rank Value
13 -7.7 ▼ 2.5
Change in Rank Value
MM21 - Undisclosed Values & Values up to US$500m Jan 1 - Dec 31 Indian Mid-Market M&A up to US$500m by Rank Value Range
Change (%)
6.0 2 84.5
75.9
Indian Mid-Market M&A up to US$500m by Target Industry
1 ▲
Jan 1 - Dec 31
8 31.9
398.0
▲ 54.1 34 -96.6 ▼
# of Deals US$m Rank
3.3 10 100.0
0 64* - -
0
6*
100.0
Kotak Mahindra Bank Ltd
Jefferies LLC
Benchmark International
Lazard
Translink Corporate Finance
Rothschild & Co
Ambit Corporate Finance
- - -
100.7 - - -
0 64* - -
-
0 - - -
- -536.7
1.7 23* 100.0
- - -
- - -
-
-
Globalscope 8 29 30.2 ▲
Advisor 2017 ** Fee
266.6 12
5.9 3 46.5
Fees Rank Exp. (%)
4.6 7
100.0
3 11 -8
Edelweiss Financial Svcs Ltd 15* 46* 4 3 ▲
Signal Hill Capital Group LLC 21* 30* 3 1 ▲
251.4 14 2340.8 ▲
125.3 - 270.7 ▲
9*
9*
Rank Deals
15* 5
2 2 20 -3 ▼
-24.8 ▼
Sumitomo Mitsui Finl Grp Inc 21* - 3 3 ▲
RHB 21* - 3 3 ▲
Equirus Capital Pvt Ltd 21* 24* 3 0 -
3* 9*
1 1 31 -14 ▼ 1,089.7 1 -40.6 ▼
4
▲
-
0 -
30* 4 2 ▲ 36.8 - -
6* 5
-
Zico Holdings Inc 21* - 3 3 ▲
Metta Capital Advisors LLP 21* - 3 3 ▲
JM Financial Group 27* 9* 2 -6 ▼ - -
-
50
100
150
200
250
300
350
400
450
500
$0
$1
$2
$3
$4
$5
$6
$7
$8
$9
$10
# o
f D
ea
ls
Ra
nk V
alu
e (
US
$b
)
US$200 - 500m US$100 - 200m US$50 - 100m US$0 - 50m # of Deals
21.8%
11.8%
10.8%
9.7%
8.6%
8.0%
7.9%
7.8%
5.9%
4.6% Financials
Industrials
Energy and Power
Real Estate
Healthcare
Materials
Consumer Products and Services
High Technology
Media and Entertainment
Consumer Staples
Telecommunications
Retail
21
Ranking Criteria Summary
-
-
-
-
-
Asia-PacificCatherina Guinto-RoldanTel: +81 3 6441-1142E-mail: [email protected]
-
JapanKaori Motohashi (Ishida) Tel: +813 6441 1338
- League tables, commentary, and charts citing announced activity are based on Rank Date and include intended, pending, partially complete, completed, pending regulatory, and unconditional transactions. Rank Date is
defined as the earliest public announcement of when a value can be applied to a transaction.
Full Year 2017 │ Mid-Market M&A Up To US$500m │ Financial Advisors
Americas
League tables include rank eligible mergers, acquisitions, repurchases, spin-offs, self-tenders, minority stake purchases and debt restructurings.
A tender/merger transaction is considered to be effective at the time of consummation of the merger or the date on which it is declared wholly unconditional.
Deals with undisclosed dollar values are rank eligible but with no corresponding Rank Value. Non-US dollar denominated transactions are converted to the US dollar equivalent at the time of announcement of terms.Europe, Middle East & AfricaEwelina Jarecka
Any Involvement league tables include deals where the target, acquiror, or either ultimate parent are domiciled (nation of headquarters) in the specified region or nation.
Announced league tables include all deals that were announced between January 1, 2017 and December 31, 2017 and of which Thomson Reuters was made aware. All current data and previous year's data is as of 6:00
pm EST on January 8, 2018.
Financial and legal advisors receive full credit for each deal on which they provide financial or legal advisory services, unless they represent minority sellers or advise on only a portion of the transaction or Thomson
Reuters has not been made aware of their participation in that transaction. For pending transactions, advisors to targets of multiple bids receive credit for the transaction agreed to or, in the absence of an agreement, the
value of the highest offer.
While Thomson Reuters has used reasonable endeavors to ensure that the information provided in this document is accurate and up to date as at the time of issue, neither Thomson Reuters nor its third party content
providers shall be liable for any errors, inaccuracies or delays in the information, nor for any actions taken in reliance thereon, nor does it endorse any views or opinions of any third party content provider. Thomson
Reuters disclaims all warranties, express or implied, as to the accuracy or completeness of any of the content provided, or as to the fitness of the content for any purpose to the extent permitted by law. The content herein
is not appropriate for the purposes of making a decision to carry out a transaction or trade and does not provide any form of advice (investment, tax, legal) amounting to investment advice, nor make any recommendations
or solicitations regarding particular financial instruments, investments or products, including the buying or selling of securities. Thomson Reuters has not undertaken any liability or obligation relating to the purchase or
sale of securities for or by any person in connection with this document.
Robert Levine
E-mail: [email protected]
E-mail: [email protected]
E-mail: [email protected]
Tel: +44 (0) 207 542 2246
Tel: +1 646 223 5682
If you would like to participate in the submission
process, receive quarterly press releases, or have
questions about league table criteria please contact:
© 2017 Thomson Reuters. All rights reserved.
Thomson Reuters and the Thomson Reuters logo are registered trademarks and trademarks of Thomson Reuters and its affiliated companies. Any third party name or mark herein belongs to the relevant third party.
https://www.thomsonone.com
22
Thomson Reuters Solutions for the Deal Making Community
FOR STRATEGY AND PLANNING TEAMSFOR INFORMATION PROFESSIONALSSDC Platinum is the world’s foremost financial transactions database, covering new issues, M&A, syndicated loans, private equity, project finance, poison pills, and more.
Solution for:• Market Analysis & Trends (Geography, Sector,Asset Class, Deal Type, Deal Size, etc.)• Deal Origination (Debt Maturity Analysis,Company Lifecycle including Private Equity)• Pitch Creation (Firm Credentials, Representative Acquirors)• M&A Targeting (Active Strategic/SponsorAcquirors, Target Company Screener)• Negotiation (T&C Benchmarking)
Thomson Reuters Deals Business Intelligence enables you to slice and dice our renowned Deals and Fees data to create ad hoc reports, analyze market trends, benchmark your performance and identify opportunities – all within a tool built into your workflow in Excel®, saving you valuable time and giving you a competitive edge.
Solution for:• Conducting market analysis and identifying trends• Benchmarking your performance and monitoring competitors• Targeting clients by wallet size and banking relationship• Allocating resources more effectively by evaluating and analyzing lost deals
FOR INVESTMENT BANKERS
evaluating and analyzing lost deals
Send us a sales enquiry at: financial.thomsonreuters.com/salesRead more about our products at: financial.thomsonreuters.com/products
To purchase individual Thomson reuters Deals or League Table reports, please contact our Thomson Reuters On Demand group:
Email: [email protected]
Access unique analysis for free anytime using Thomson Reuters Deals Intelligence website and receive regular updates, delivered direct to your inbox.
Go to: dmi.thomsonreuters.com/dealsintelligence
Thomson Reuters Eikon is the most intuitive and comprehensive way of staying informed. With natural-language search, you can quickly find global information,news, charts and analytics. Company and industry views provide top-level summaries, and then detailed information is just a click away. Identify new opportunities and gain deep understanding of markets, industries, companies and events.
Thomson Reuters Eikon also includes an Add-In for Microsoft® Office to help you increase your efficiency. From screening and targeting to comparables analysis, building league tables, valuing a company
and developing a client pitch book, you can do all this without leaving Microsoft Office. Search and autosuggest features in Excel make model-building easier.
Solution for:• Managing Client Relationships• Deal Origination• New Issues Pre-Marketing/Roadshows• Financial Modeling• Customized League Tables• Simple Deals screening• Valuation analysis and comparabledeal screening• On-brand pitch book creation
©2017 Thomson ReutersThomson Reuters and the Kinesis logo are trademarks of Thomson Reuters. 23