Embed Size (px)
Citation preview

Natural Product Sciences
23(2) : 75-83 (2017)
https://doi.org/10.20307/nps.2017.23.2.75
75
Microwave Assisted Extraction, Optimization using Central Composite Design,
Quantitative Estimation of Arjunic Acid and Arjunolic Acid using HPTLC and
Evaluation of Radical Scavenging Potential of Stem Bark of Terminalia arjuna
Sarita Khatkar1, Arun Nanda2*, and S. H. Ansari3
1Vaish Institute of Pharmaceutical Education and Research, Rohtak, India2Faculty of Pharmaceutical Sciences, M.D. University, Rohtak, India
3Faculty of Pharmacy, Jamia Hamdard, New Delhi, India
Abstract − The optimization and microwave assisted extraction of stem bark of Terminalia arjuna, quantitativeestimation of the marker compounds arjunic acid and arjunolic acid using HPTLC and the evaluation of freeradical scavenging activity has been performed in this study. The central composite design was used foroptimization and the values of parameters for optimized batch of microwave assisted extraction were 1000 W(Power), 3 minutes (Time) and 1/120 (Solid/solvent ratio). The solvent system to carry out the HPTLC was toluene:acetic acid: ethyl acetate (5: 5: 0.5) and quantitative estimation was done using standard equations obtained fromthe marker compounds. The in-vitro free radical scavenging activity was performed spectrophotometrically usingascorbic acid as standard. The value of estimated percentage yield of arjunic acid and arjunolic acid was 1.42%and 1.52% which upon experimentation was obtained as 1.38% and 1.51% respectively. The DPPH assay of thedifferent batches of microwave assisted extraction and marker compounds taken suggested that the markercompounds arjunic acid and the arjunolic acid were responsible for the free radical scavenging activity as thebatch having the maximum percentage yield of the marker compounds showed best free radical scavenging effectas compared to standard ascorbic acid. The IC50 value of the optimized batch was found to be 24.72 while that ofthe standard ascorbic acid was 29.83. Hence, the yield of arjunic acid and arjunolic acid has direct correlation withthe free radical scavenging activity of stem bark extract of Terminalia arjuna and have potential to serve as activelead compounds for free radical scavenging activity.Keywords − Arjunic acid, Arjunolic acid, Central composite design, Free radical scavenging activity, HPTLC,Microwave assisted extraction
Introduction
The bioactive compounds have recently gained the
interest of researchers due to their health benefits.1-3 It is
now believed that a plant or any part of the plant reported
for biological effects viz. anti-diabetic, antibacterial,
antipyretic, anti-inflammatory etc. may contain N number
of compounds with them while the particular phyto-
constituents responsible for the biological effect has to be
screened so that the specific medicines could be designed
from them. There are many very common examples of
the bioactive compounds that have been in use as
medicines viz. quinine (antiinflammatory and antimalarial
drug) isolated from Cinchona bark, aspirin (antipyretic
NSAID) isolated from bark of Willow tree, vinblastine
and vincristine (anticancer drug) isolated from Cathranthus
rosesus etc.4-6
The chromatographic techniques viz. HPLC, HPTLC,
GC-MS, LC-MS etc. play important role in identification
and separation of bioactive compounds both quantitatively
and quantitatively. Several studies have been reported for
the use of abovementioned studies describing the role of
chromatographic techniques effectively.7-11 Further, the
use of HPTLC technique for the estimation of the bioactive
marker compounds has been reported by many researchers
viz. HPTLC densitometric estimation of andrographolides
and antioxidant efficiency of Andrographis paniculata,12
bio-active marker plumbagin from Plumbago species,13
HPTLC estimation of ephedrine from Sida species,14
HPTLC estimation of rutin, gallic acid and quercetin from
Terminalia chebula,15 HPTLC densitometric estimation of
flavonoids present in Passiora alata, Passiora edulis,
*Author for correspondenceProf. Arun Nanda, Department of Pharmaceutical Sciences,M.D.University, Rohtak, Haryana, India (124001).E-mail: [email protected]

76 Natural Product Sciences
Passiora incarnata and Passiora caerulea.16-17
The extraction of plant material had been the ancient
processing technique to get biological effects from them.
Further, the extraction has also been the main factor that
effects the isolation of the bioactive compounds from the
crude drug. The extraction method used in common
includes the classical soxhlet extraction, room temperature
extraction, decoction and the novel methods of extraction
like microwave assisted extraction, ultrasound assisted
extraction, supercritical fluid extraction etc.18-25 The novel
methods of extraction have advantages over the classical
methods of extractions in terms of the extraction efficiency,
extraction time, solvent consumption, higher percentage
yield of marker compounds etc. The microwave assisted
extraction technique has recently gained importance due
to its thermal effects which enables it to get more penetrated
inside the plant cells and cause better extraction.26-28
Several researchers including our team have reported the
extraction and estimation of different bioactive plant
material using microwave assisted extraction technique.29-32
Free radicals have recently gained attention of many
researchers due to its major effects on different body
parts. The free radicals present in our body may oxidize
the biomolecules present in different sites of our body and
may lead to various complications like cardiac problems,
cancer, arteriosclerosis, skin irritations, inflammatory
disorders etc.33-35 The antioxidant compounds may cause
the deactivation of the free radicals present and inhibits
the effect by donation of hydrogen.36-37 The synthetic
antioxidants butylated hydroxyanisole (BHA) and butylated
hydroxytoluene (BHT) have been used in food products
to prevent the oxidation of lipids while the chemical
antioxidants in use have also been reported to cause toxic
and carcinogenic effects in the body.38-39 Hence, the need
of better antioxidants fostered the researchers to search
them from natural sources so that the minimal side effects
shall be there. Due to this the bioactive markers obtained
from different plant materials which are responsible for
the antioxidant effects have been on target. The bioactive
markers viz. lycopene from tomato fruit,40 polyphenols
from different plants etc. have been reported for their
antioxidant effects in the literature.41
Terminalia arjuna plant has been associated with
various biological activities viz. cardiotonic, antiulcer, anti-
diabetic, hypolipidemic, anti-inflammatory, wound healing,
antioxidant and immunomodulatory etc.42-45 The antioxidant
effect of Terminalia arjuna has been associated with the
phenolic constituents of the plant46 and among them the
arjunic acid and the arjunolic acid have been reported for
major antioxidant effect.47-50 Hence, the authors have
planned to explore the effect of novel extraction method,
MAE to enhance the yield of the marker compounds
arjunic acid and arjunolic acid in Terminalia arjuna stem
bark via estimation of marker compounds with HPTLC
and compared the results of antioxidant efficiency of
different extracts with different yield of the marker
compounds.
Experimental
Materials and methods − The stem bark of Terminalia
arjuna was procured from the local market in Khari
Baoli, New Delhi, India. The identification of the plant
material was made by CSIR-NISCAIR, New Delhi vide.
Ref. No. NISCAIR/RHMD/Consult/2014/2551/130. The
air dried stem bark was placed in laboratory until no
weight variation was observed. The dried stem bark was
powdered coarsely with help of a laboratory grinder. All
the chemicals used during the study were of analytical
grade, the marker compounds arjunic acid and arjunolic
acid were purchased from Fluka and Sigma Aldrich
respectively and were of highest purity available. Microwave
assisted extraction was done on Sineo Microwave UWave-
1000 instrument. High Performance Thin Layer Chroma-
tography (HPTLC) was performed on CAMAG system
using WINCATS version 1.4.1. Absorbance study of free
radical scavenging activity of the extracts was carried on
Shimadzu double beam UV-Visible spectrophotometer.
Experimental design and statistical analysis − On-
face central composite design (CCD), a method of response
surface methodology was used for the determination of
the optimum conditions of microwave assisted extraction.
JMP 12.1.0 software was used to carry out the statistical
analysis and design of experiments (DOE). Based on the
preliminary experiments, the power, time and solid/
solvent ratio were selected as the independent variables to
carry out the extraction using microwave. The response
variables to get the results were percentage yield of
arjunolic acid and arjunic acid in stem bark of Terminalia
arjuna for the selected conditions/parameters of experiment.
The values of power, time and solid/solvent ratio were
400 W, 700 W and 1000 W; 3 min, 7 min and 12 min;
1:4, 1:8 and 1:12 respectively in microwave assisted
extraction (Table 1). The temperature was kept constant at
55oC and solvent used was ethanol for all the experiments
performed and the complete design consisted of 16 com-
binations of different selected parameters for microwave
assisted extraction of stem bark of Terminalia arjuna
(Table 2).
HPTLC Estimation − High performance thin layer

Vol. 23, No. 2, 2017 77
chromatography technique (HPTLC) was used for the
quantitative determination of arjunolic acid and arjunic
acid in stem bark extracts of Terminalia arjuna. The pre-
coated silica gel aluminum plate 60F254 plates were
spotted with a Camag microlitre syringe having 4 µl of
extract’s solution. The solution of different extracts was
filtered by 0.22 µm membrane filter and was stored at
4oC. The pre-saturated CAMAG twin trough glass tank,
having toluene: acetic acid: ethyl acetate (5: 5: 0.5) as
mobile phase at (23 ± 2oC) and 55 ± 5% RH was used for
the development of the TLC.51 The Camag TLC scanner
III densitometer having deuterium as source lamp was
used for scanning of dried TLC plates at an absorbance of
366 nm. The solutions of arjunolic acid and arjunic acid
having concentration, 100 µg/ml in ethanol were stan-
dardized, using eight point calibration curve. The volume
of 2 - 16 µl of arjunic and arjunolic acids were applied on
TLC plate having corresponding concentration of 200 -
1600 ng respectively. The area under the peaks of the
obtained chromatogram was quantitatively estimated and
standard equations were derived.
Validation of design − The unique feature of DOE
(design of experiments) was to derive the optimum con-
ditions of the selected parameters to get the maximum
percentage yield of marker compounds arjunic acid and
arjunolic acid in the given extract. Hence, the validation
of design to get optimized batch was performed on JMP
Software 12.1.0. The desirability factor was maximized to
get the values of selected parameters. The parameters thus
obtained were checked experimentally and the results
obtained were compared with the proposed percentage
yield values of the software.
Antioxidant evaluation using DPPH method − Free
radical scavenging activity of different extracts was
determined spectrophotometrically using DPPH method.
The DPPH (1,1-diphenyl-2-picrylhydrazyl) is a stable
radical because of the paramagnetism conferred by its odd
electron present on the nitrogen atom. When the DPPH
reacts with antioxidant constituents of the extracts having
ability to donate hydrogen, it gets reduced. The deep
violet color of DPPH bleaches to yellow due to the
reduction effect, which shows a significant absorption
decrease at 517 nm.52-53 Fifty milliliters of various con-
centrations of the extracts were dissolved in methanol and
this was added to 5 ml of a 0.004% methanol solution of
DPPH. After a 30 minutes reaction time in dark at room
temperature, the absorbance was read against a blank at
517 nm. Free radical DPPH inhibition as a percentage
(IC5o) was calculated as follows:
%Inhibition =
Where, Acontrol = Absorbance of the control reaction; Asample
= Absorbance of the sample
Result and Discussion
Optimization of design − The response surface plots
and the contour plots obtained according to the percentage
yield of arjunic acid and arjunolic acid in accordance with
the values of power, time and solid/solvent ratio have
been shown in Fig. 1 and 2.. The CCD design model
applied was significant as P < 0.05 and R2 is 0.95 (arjunic
acid) and 0.99 (arjunolic acid). The magnitudes of selected
parameters involved to carry out the experiments have
been represented in equations below:
Y = β0 + Σ βi xi + Σ βii xi2 + Σ βij xi xj Equation 1
Y = 0.938 + 0.215 X1 + 0.024 X2 + 0.12 X3 – 0.0063
X1X2 + 0.038 X1X3 − 0.108 X2X3 + 0.056 X12 –
0.038 X22 + 0.167 X3
2 + 0.011 X1X2X3 Equation 2
Acontrol Asample–
Acontrol
--------------------------------------- 100×
Table 1. Factors and levels for central composite design
Level Power, W Time, min Solid/solvent ratio
-1 400 53 40
0 700 57.5 80
1 1000 12 120
Table 2. Assigned parameters for microwave assisted extractionin central composite design
S.No. Power (X1) Time (X2) Solvent (X3)
Batch1. 1000 12 12
Batch2. 700 57.5 4
Batch3. 700 57.5 12
Batch4. 400 12 4
Batch5. 400 53 12
Batch6. 400 53 4
Batch7. 700 53 8
Batch8. 700 57.5 8
Batch9. 700 12 8
Batch10. 1000 53 12
Batch11. 1000 12 4
Batch12. 400 57.5 8
Batch13. 1000 53 4
Batch14. 700 57.5 8
Batch15. 400 12 12
Batch16. 1000 57.5 8
78 Natural Product Sciences
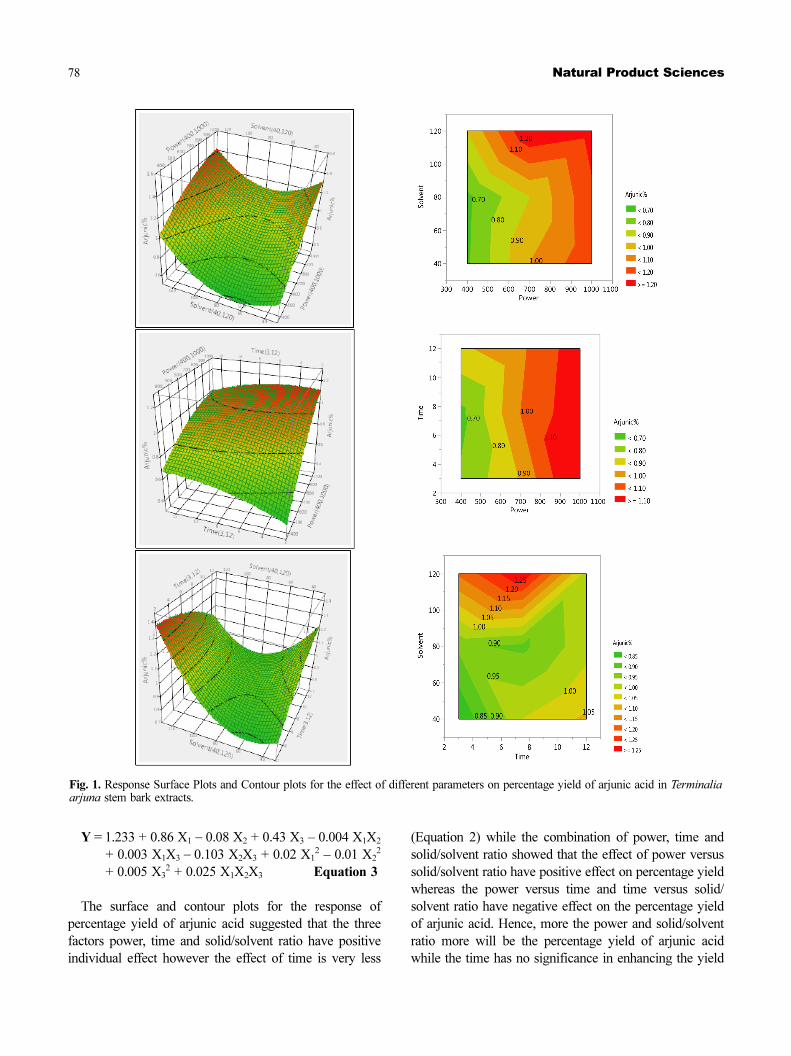
Y = 1.233 + 0.86 X1 − 0.08 X2 + 0.43 X3 – 0.004 X1X2
+ 0.003 X1X3 − 0.103 X2X3 + 0.02 X12 – 0.01 X2
2
+ 0.005 X32 + 0.025 X1X2X3
Equation 3
The surface and contour plots for the response of
percentage yield of arjunic acid suggested that the three
factors power, time and solid/solvent ratio have positive
individual effect however the effect of time is very less
(Equation 2) while the combination of power, time and
solid/solvent ratio showed that the effect of power versus
solid/solvent ratio have positive effect on percentage yield
whereas the power versus time and time versus solid/
solvent ratio have negative effect on the percentage yield
of arjunic acid. Hence, more the power and solid/solvent
ratio more will be the percentage yield of arjunic acid
while the time has no significance in enhancing the yield
Fig. 1. Response Surface Plots and Contour plots for the effect of different parameters on percentage yield of arjunic acid in Terminaliaarjuna stem bark extracts.

Vol. 23, No. 2, 2017 79
of marker compound. Similar, results for the marker
arjunolic acid were observed as the percentage yield of
arjunolic acid also enhanced with the increase in value of
power and solid/solvent ratio while the effect of time is
negligible (Equation 3).
HPTLC Analysis − The HPTLC analysis of stem bark
extract of Terminalia arjuna was done for the quantitative
estimation of arjunic acid and arjunolic acid in the
different extract solutions obtained. The standard equations
for the different concentrations of arjunic acid and
arjunolic acid were obtained from the plot of area under
peaks versus the concentration of corresponding acid
Fig. 2. Response Surface Plots and Contour plots for the effect of selected parameters on percentage yield of arjunolic acid in Terminaliaarjuna stem bark extracts.
80 Natural Product Sciences
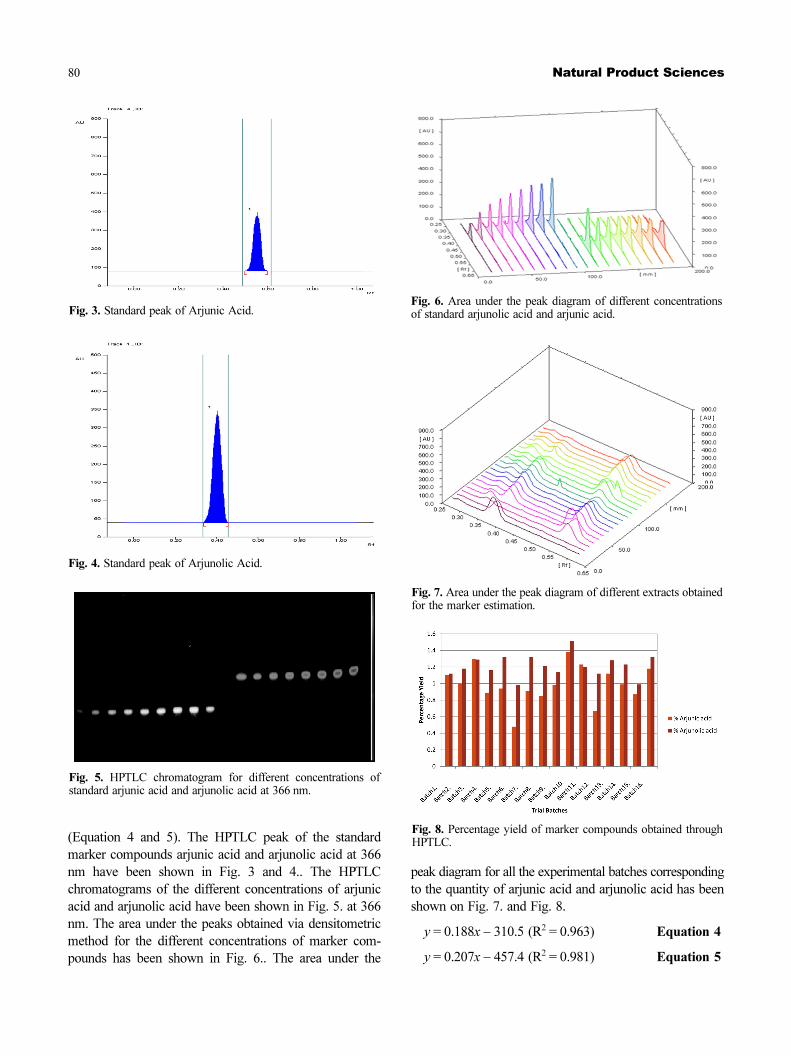
(Equation 4 and 5). The HPTLC peak of the standard
marker compounds arjunic acid and arjunolic acid at 366
nm have been shown in Fig. 3 and 4.. The HPTLC
chromatograms of the different concentrations of arjunic
acid and arjunolic acid have been shown in Fig. 5. at 366
nm. The area under the peaks obtained via densitometric
method for the different concentrations of marker com-
pounds has been shown in Fig. 6.. The area under the
peak diagram for all the experimental batches corresponding
to the quantity of arjunic acid and arjunolic acid has been
shown on Fig. 7. and Fig. 8.
y = 0.188x − 310.5 (R2 = 0.963) Equation 4
y = 0.207x − 457.4 (R2 = 0.981) Equation 5
Fig. 3. Standard peak of Arjunic Acid.
Fig. 4. Standard peak of Arjunolic Acid.
Fig. 5. HPTLC chromatogram for different concentrations ofstandard arjunic acid and arjunolic acid at 366 nm.
Fig. 6. Area under the peak diagram of different concentrationsof standard arjunolic acid and arjunic acid.
Fig. 7. Area under the peak diagram of different extracts obtainedfor the marker estimation.
Fig. 8. Percentage yield of marker compounds obtained throughHPTLC.

Vol. 23, No. 2, 2017 81
Validation of design − The validation of central
composite design applied to carry out the microwave
assisted extraction effectively was validated using the
JMP software by generation of output grid table. The
combination of three parameters viz. power, time and
solid/solvent ratio suggested for percentage yield of
arjunic acid were 1000 W power, 3 minutes time and
1:120 ratio of solid: solvent to get the percentage yield of
1.42%. The suggested parameters were tested for the
validation of results and the percentage yield was found to
be 1.38 % which confirms the validation of design to get
maximum optimized yield. The combination of three
parameters viz. power, time and solid/solvent ratio suggested
for percentage yield of arjunolic acid were 1000 W
power, 3 minutes time and 1:120 ratio of solid: solvent to
get the percentage yield of 1.52%. The suggested
parameters were tested for the validation of results and the
percentage yield was found to be 1.51% which confirms
the validation of design to get maximum optimized yield.
Radical Scavenging Activity − The marker compounds
arjunic acid and arjunolic acid as well as the microwave
assisted extracts were evaluated for the free radical
scavenging activity using DPPH method. The results of
IC50 values obtained have been shown in Table 3. The
microwave assisted extraction has variable results of IC50
among the different experimental batches probably with
the change in the values of parameters (Power, time and
solid/solvent ratio). The standard ascorbic acid having the
IC50 value of 29.83 was used to compare the results of all
given batches. The batches 1, 3, 5, 7, 8, 11, 13, 14 and 16
showed better free radical scavenging activity as com-
pared to standard ascorbic acid, the batches 2, 4, 6, 9, 12
and 15 showed poor free radical scavenging activity. The
optimized batch (10th batch), arjunic acid and arjunolic acid
showed best results (IC50 values 23.38, 24.72, 21.54 and
19.43 respectively) for free radical scavenging activity as
compared with the standard ascorbic acid (IC50 value
29.83). The results obtained and presented in Table 3
suggested that the yield of marker compounds arjunic
acid and arjunolic acid has been the key factor for
possessing of free radical scavenging activity by the
Table 3. Percentage yield of marker compounds arjunic acid and arjunolic acid, the IC50 value of different batches using DPPH method
Batch.No. Power Time Solvent % Arjunic acid % Arjunolic acid IC50 values
Batch1. 1000 12 12 1.1 1.12 29.41
Batch2. 700 57.5 4 1 1.18 30.33
Batch3. 700 57.5 12 1.3 1.29 28.54
Batch4. 400 12 4 0.89 1.16 30.12
Batch5. 400 53 12 0.94 1.32 27.43
Batch6. 400 53 4 0.48 0.98 49.56
Batch7. 700 53 8 0.91 1.32 27.67
Batch8. 700 57.5 8 0.85 1.21 29.19
Batch9. 700 12 8 0.98 1.14 30.22
Batch10. 1000 53 12 1.38 1.51 24.72
Batch11. 1000 12 4 1.23 1.2 28.97
Batch12. 400 57.5 8 0.67 1.12 31.00
Batch13. 1000 53 4 1.12 1.28 28.99
Batch14. 700 57.5 8 0.99 1.23 29.32
Batch15. 400 12 12 0.87 0.99 41.25
Batch16. 1000 57.5 8 1.18 1.32 28.13
Arjunolic Acid 19.43
Arjunic Acid 21.54
Ascorbic Acid (Standard) 29.83
Fig. 9. IC50 values of the test batches, the marker compounds andstandard ascorbic acid.

82 Natural Product Sciences
different extracts as with the increase in the yield of
marker compounds the activity also enhanced significantly.
The results of the antioxidant activity of the trial batches,
marker compounds and the standard ascorbic acid have
been shown in Fig. 9.
Conclusion
The Terminalia arjuna stem bark was extracted using
microwave assisted extraction technique and the percentage
yield of the marker compounds arjunic acid and arjunolic
acid was quantitatively estimated using the HPTLC
method of estimation. The design of experiments was
applied to get the optimum yield of the marker com-
pounds for which the central composite design was used
and the suggested combination of parameters were
evaluated for the free radical scavenging activity for the
extracts obtained thereof. The marker compounds arjunic
and arjunolic acid taken were also evaluated for their free
radical scavenging effect using the DPPH method of
estimation. The values of parameters for optimized batch
of microwave assisted extraction as suggested by the JMP
software were 1000 W (power), 3 minutes (time) and 1/
120 (solid/solvent ratio) to get the proposed percentage
yield of 1.42% and 1.52% respectively. The cross-
validation of the suggested parameters was done and the
percentage yield thus obtained for arjunic acid and
arjunolic acid was 1.38% and 1.51% respectively. The
surface plots and the contour plots along with the
quadratic equations derived for the design applied suggested
that the power and solid/solvent ratio have positive effect
on percentage yield of marker compounds while the effect
of time is negligible. The DPPH assay of the different
batches of microwave assisted extraction and marker
compounds taken suggested that the marker compounds
arjunic acid and the arjunolic acid were responsible for
the free radical scavenging activity as the batch having
the maximum percentage yield of the marker compounds
showed best free radical scavenging effect as compared to
standard ascorbic acid. The IC50 value of the optimized
batch was found to be 24.72 while that of the ascorbic
acid was 29.83. Hence, the yield of arjunic acid and
arjunolic acid has direct correlation with the free radical
scavenging activity of stem bark extract of Terminalia
arjuna and shall serve as active lead molecules for future
research in free radical scavenger search studies.
List of Abbreviations
MAE (Microwave Assisted Extraction), HPTLC (High
Performance Thin Layer Chromatography), HPLC (High
Performance Liquid Chromatography), LC-MS (Liquid
Chromatography-Mass Spectroscopy), GC-MS (Gas Chro-
matography-Mass Spectroscopy), CCD (Central Composite
Design).
References
(1) Sasidharan, S.; Chen, Y.; Saravanan, D.; Sundram, K. M.; Latha, L.
Y. Afr. J. Tradit. Complement Altern. Med. 2011, 8, 1-4.
(2) Rufino, M. S. M.; Alves, R. E.; de Brito, E. S.; Pérez-Jiménez, J.;
Saura-Calixto, F.; Mancini-Filho, J. Food Chem. 2010, 121, 996-1002.
(3) Bandaranayake, W. M. Wetl. Ecol. Manag. 2002, 10, 421-452.
(4) Vlachojannis, J.; Magora, F.; Chrubasik, S. Phytother. Res. 2011, 25,
1102-1104.
(5) Staba, E. J.; Chung, A. C. Phytochemistry 1981, 20, 2495-2498.
(6) Aslam, J.; Mujib, A.; Nasim, S. A.; Sharma, M. P. Sci. Hortic. 2009,
119, 325-329.
(7) Xie, P.; Chen, S.; Liang, Y. Z.; Wang, X.; Tian, R.; Upton, R. J.
Chromatogr. A. 2006, 1112, 171-180.
(8) Pozharitskaya, O. N.; Ivanova, S. A.; Shikov, A. N.; Makarov, V. G.
J. Sep. Sci. 2007, 30, 1250-1254.
(9) Pirisi, F. M.; Cabras, P.; Cao, C. F.; Migliorini, M.; Muggelli, M. J.
Agric. Food Chem. 2000, 48, 1191-1196.
(10) de la Torre-Carbot, K.; Jauregui, O.; Gimeno, E.; Castellote, A. I.;
Lamuela-Raventós, R. M.; López-Sabater, M. C. J. Agric. Food Chem.
2005, 53, 4331-4340.
(11) Daferera, D. J.; Ziogas, B. N.; Polissiou, M. G. J. Agric. Food
Chem. 2000, 48, 2576-2581.
(12) Akowuah, G. A.; Zhari, I.; Norhayati, I.; Mariam, A. J. Food
Compos. Anal. 2006, 19, 118-126.
(13) Mallavadhani, U. V.; Sahu, G.; Muralidhar, J. Pharm. Biol. 2002,
40, 508-511.
(14) Khatoon, S.; Srivastava, M.; Rawat, A.; Mehrotra, S. JPC-J.
Planar Chromatogr. Mod. TLC. 2005, 18, 364-367.
(15) Kumar, A.; Lakshman, K.; Jayaveera, K. N.; Tripathi, S. M.;
Satish, K. V. Jordan J. Pharm. Sci. 2010, 3, 63-68.
(16) Pereira, C. A.; Yariwake, J. H.; Lanças, F. M.; Wauters, J. N.; Tits,
M.; Angenot. L. Phytochem. Anal. 2004, 15, 241-248.
(17) Mehta, M.; Kaur, N.; Bhutani, K. K. Phytochem. Anal. 2001, 12,
91-95.
(18) Hawthorne, S. B.; Grabanski, C. B.; Martin, E.; Miller, D. J. J.
Chromatogr. A. 2000, 892, 421-433.
(19) De Castro, M. D. L.; Garcýa-Ayuso, L. E. Anal. Chim. Acta 1998,
369, 1-10.
(20) Huddleston, J. G.; Willauer, H. D.; Swatloski, R. P.; Visser, A. E.;
Rogers, R. D. Chem. Commun. 1998, 16, 1765-1766.
(21) Khan, M. K.; Abert-Vian, M.; Fabiano-Tixier, A. S.; Dangles, O.;
Chemat, F. Food Chem. 2010, 119, 851-858.
(22) Dai, J.; Mumper, R. J. Molecules 2010, 15, 7313-7352.
(23) Núñez Sellés, A. J.; Vélez Castro, H. T.; Agüero-Agüero, J.;
González-González, J.; Naddeo, F.; De Simone, F.; Rastrelli, L. J. Agric.
Food Chem. 2002, 50, 762-766.
(24) Pourmortazavi, S. M.; Hajimirsadeghi, S. S. J. Chromatogr. A
2007, 1163, 2-24.
(25) Routray, W.; Orsat, V. Food Bioprocess Technol. 2012, 5, 409-424.
(26) Kaufmann, B.; Christen, P. Phytochem. Anal. 2002, 13, 105-113.
(27) Lu, Y.; Ma, W.; Hu, R.; Dai, X.; Pan, Y. J. Chromatogr. A 2008,
1208, 42-46.
(28) Spigno, G.; De Faveri, D. M. J. Food Eng. 2009, 93, 210-217.
(29) Devgan, M.; Nanda, A.; Ansari, S. H. Pak. J. Pharm. Sci. 2013, 26,
973-976.
(30) Devgun, M.; Nanda, A. R. U. N.; Ansari, S. H. Acta Pol. Pharm.
2012, 69, 475-485.

Vol. 23, No. 2, 2017 83
(31) Devgun, M.; Nanda, A.; Ansari, S. H; Swamy, S. K. Res. J. Pharm.
Technol. 2010, 3, 644-649.
(32) Valko, M.; Jomova, K.; Rhodes, C. J.; Kuèa, K.; Musílek, K. Arch.
Toxicol. 2016, 90, 1-37.
(33) Przyklenk, K.; Kloner, R. A. Circ. Res. 1989, 64, 86-96.
(34) Prasad, K.; Kalra, J. Am. Heart J. 1993, 125, 958-973.
(35) Puthur, J. T. South Indian J. Biol. Sci. 2016, 2, 14-17.
(36) Galano, A.; Mazzone, G.; Alvarez-Diduk, R.; Marino, T.; Alvarez-
Idaboy, J. R.; Russo, N. Annu. Rev. Food Sci. Technol. 2016, 7, 335-352.
(37) Fang, Y.; Luo, Y.; Yu, P. J. Renew. Sust. Energ. 2016, 8, 033103.
(38) Choi, S.; Kim, J. M.; Shin, G. H.; Jung, T. D.; Oh, J. W.; Choi, S.
H.; Cho, B. Y.; Lee, J. H.; Lee, O. H. FASEB J. 2016, 30, 1174-1175.
(39) Martinez-Valverde, I.; Perago, M. J.; Provan, G.; Chesson, A. J.
Sci. Food Agr. 2002, 82, 323-330.
(40) Duthie, G. G.; Duthie, S. J.; Kyle, J. A. Nut. Res. Rev. 2000, 13, 79-
106.
(41) Halder, S.; Bharal, N.; Mediratta, P. K.; Kaur, I.; Sharma, K. K.
Indian. J. Exp. Biol. 2009, 47, 577-583.
(42) Chaudhari, M. Mengi, S. Phytother. Res., 2006, 20, 799-805.
(43) Chatha, S. A. S.; Hussain, A. I.; Asad, R.; Majeed, M.; Aslam, N.
J. Food Process Technol. 2014, 5, 298.
(44) Bachaya, H. A.; Iqbal, Z.; Khan, M. N.; Jabbar, A.; Gilani, A. H.;
Din, I. U. Int. J. Agric. Biol. 2009, 11, 273-278.
(45) Sultana, B.; Anwar, F.; Przybylski, R. Food Chem. 2007, 104,
1106-1114.
(46) Manna, P.; Sinha, M.; Sil, P. C. Arch. Toxicol. 2008, 82, 137-149.
(47) Elsherbiny, N. M.; Eladl, M. A.; Al-Gayyar, M. M. H. Cytokine.
2016, 77, 26-34.
(48) Sumitra, M.; Manikandan, P.; Kumar, D. A.; Arutselvan, N.;
Balakrishna, K.; Manohar, B. M.; Puvanakrishnan, R. Mol. Cell. Biochem.
2001, 224, 135-142.
(49) Sun, F. Y.; Chen, X. P.; Wang, J. H.; Qin, H. L.; Yang, S. R.; Du, G.
H. Am. J. Chin. Med. 2008, 36, 197-207.
(50) Pharmacopoeia of India. Herbs and Herbal Monographs: Indian
Pharmacopoeial Commission; Ministry of Health and Family Welfare:
India, 2010, pp 8-9.
(51) Bondet, V.; Brand-Williams, W.; Berset, C. LWT-Food Sci. Tech.
1997, 30, 609-615.
(52) Novilla, A.; Nawawi, A.; Sugihartina, G.; Widowati, W. Cukurova
Med. J. 2014, 39, 224-233.
Received September 22, 2016
Revised November 8, 2016
Accepted November 18, 2016
![Phytochemical Investigations of the Medicinal Plant ... · PDF fileIsolation of any compound from any plants is un- ... Quinine [6], an anti-malarial alkaloid, was isolated from cinchona](https://img.pdfslide.us/doc/110x75/5ab577a97f8b9ab7638cca99/phytochemical-investigations-of-the-medicinal-plant-of-any-compound-from-any.jpg)