Embed Size (px)
DESCRIPTION
survey starnet
Citation preview

MicroSurvey
STAR*NETLeast Squares Survey Adjustment Package
Reference Manual
Illustrating The LEV Edition
v 7.0 (7/6/2011)
Copyright © 2011 MicroSurvey Software Inc.All Rights Reserved


MicroSurvey End-User License Agreement
- iii -
MICROSURVEY END-USER LICENSE AGREEMENTThisMicroSurveyEnd-User License Agreement ("Agreement") is a legal and binding agreement between you ("Licensee") andMicroSurveySoftwareInc., a BC corporation ("MICROSURVEY") concerning the use of theMicroSurveyproducts (the "Product"), the software provided in connection with theuse and operation of the Product, including firmware and storedmeasurement data (collectively the "Software") and all related documentation providedin connection with the acquisition of the Product ("Documentation"). The Software includes software owned by, and licensed from, third party licensors.
By clicking the "I ACCEPT" checkboxand completing the processof installing the Software, LICENSEE consents to and agrees to be bound byall of thetermsand conditionsof thisAgreement. BYCLICKINGTHE "I DO NOT ACCEPT"CHECKBOXor IF LICENSEEdisagreeswith anyof the termsor con-ditionsof thisAgreement, LICENSEE IS not permitted to install and/or use the Software, PRODUCT AND DOCUMENTATION. IF LICENSEEHASANYquestionsOR COMMENTSCONCERNINGTHISAGREEMENT LICENSEEMAYCONTACT MICROSURVEYATWestbank, BC Canada.
1. Title to Product and Rights to Use Software and Documentation. Title to the Product and the rights to use the Software and Doc-umentation are conditioned upon the payment of the required purchase price and anyapplicable license andmaintenance feesand Licensee'sacceptance of the termsand conditionsof thisAgreement.
2. License.
1. License Grant. MICROSURVEYherebygrants Licensee a nonexclusive, non-transferable, non-sublicensable right to (i) install anduse one copyof the Software and Documentation on the Product and one copy for use on nomore than one personal computer simul-taneously, and , (ii) to access the storedmeasurement data generated by the Software, for Licensee's own internal businesspurposesand in accordance with the termsand conditionsof thisAgreement. MICROSURVEYalso herebygrants Licensee a nonexclusive, non-sublicensable right to reproduce the Documentation, solely asnecessary for Licensee's internal use of the Product and Software.
2. Conditions and Restrictions. The following conditionsand restrictionsapply to the use of the Product, Software and Documentation:
i. Licensee shall not, and shall not attempt to, reverse engineer, decompile, disassemble or otherwise attempt to identify thesource code of anyobject code portionsof, distribute, modify, encrypt, or create derivative worksof the Software, Doc-umentation, and/or any storedmeasurement data in whole or in part, including, but not limited to, storedmeasurement data.
ii. Licensee shall not use the Software or Documentation for anypurpose not expressly permitted by thisAgreement.
iii. Licensee shall not copyanypart of the Software, except that Licenseemaymake one copyof the Software for backup purposesonly.
iv. Licensee agreesnot to remove or destroyany copyright, logo, trademark, trade name, proprietarymarkings, or confidentialitylegendsplaced upon or contained within the Software or Documentation. Licensee shall not, and agree not to assist others to,circumvent or disable the license provisioning technology for the Software.
v. Licensee's license to the Software under thisAgreement continuesuntil it is terminated byLicensee or MICROSURVEY.Licenseemay terminate the license bydiscontinuing use of all or anyof the Software and bydestroying all Licensee copiesof theSoftware and Documentation.
vi. ThisAgreement will terminate automatically if (x) Licensee violate anyof the termsor conditionsof thisAgreement, (y) MICRO-SURVEYpublicly posts a written notice of termination on itswebsite www.microsurvey.com (that, or any successor site, the"Site"); or (z) MICROSURVEY revokes thisAgreement or issuesa new agreement in writing or electronic form and conditionsLicensee continued use of the Software upon acceptance of the new agreement.
3. Ownership.All rights, title and interest in and to the Software and Documentation including, without limitation, all copyright, patent, trade secretand other intellectual property rights shall at all times remain the property of MICROSURVEY, it licensors, or its suppliers, as applicable. The Soft-ware and Documentation are licensed, not sold, and are protected by copyright and other intellectual property lawsand treaties. Licensee shalltake appropriate steps reasonably calculated to notify others of MICROSURVEYand its licensor's/suppliers' ownership of the Software and Doc-umentation.
4. Warranty.MICROSURVEYwarrants that the Product will, for 90 daysafter the Effective Date (the "WarrantyPeriod"), substantially conform tothe Documentation; provided, that Licenseemust notifyMICROSURVEY in writing of anybreach of the foregoing warrantywithin theWarrantyPeriod. For anybreach of the foregoing warranty reported during theWarrantyPeriod, MICROSURVEYwill use reasonable efforts to promptlycorrect such defect without further charge. If MICROSURVEY is unable to correct such defect, thenMICROSURVEYwill refund the license feespaid for the Product. This representsMICROSURVEY'S exclusive liability and Licensee's sole and exclusive remedy in the event of a breach ofthe foregoing warranty.
5. Warranty Disclaimer.EXCEPT ASDESCRIBED IN SECTION 4 (WARRANTY), MICROSURVEYHEREBYDISCLAIMSALLWARRANTIESRELATINGTOTHEPRODUCT, SOFTWARE, AND DOCUMENTATION, INCLUDINGWITHOUT LIMITATION THE IMPLIEDWAR-RANTIESOF MERCHANTABILITY, NON-INFRINGEMENT AND FITNESSFOR APARTICULAR PURPOSE.MICROSURVEYDOESNOT

MicroSurvey STAR*NET-LEV ReferenceManual
- iv -
REPRESENT THAT THEOPERATIONOF THEPRODUCT AND/OR SOFTWAREWILL BEUNINTERRUPTEDOR ERROR-FREE.WITH-OUT LIMITINGTHEGENERALITYOF THEFOREGOING,MICROSURVEYMAKESNOWARRANTYTHAT: (A) OPERATIONOF THEPRODUCT AND/OR SOFTWAREWILL BEUNINTERRUPTEDOR ERROR-FREE, (B) THEPRODUCT AND/OR SOFTWAREWILLMEETLICENSEESPECIFIC NEEDS, (C) SPECIFIC RESULTSWILL BEACHIEVEDWITH THEPRODUCT AND/OR SOFTWARE, OR (D) ALLERRORSOR FAILURESWILL BECORRECTED. IN NOEVENT SHALLMICROSURVEY'S, ITS LICENSORS', OR ITSSUPPLIERS' LIA-BILITYTOLICENSEEFOR THEPRODUCT AND/OR SOFTWARE,WHETHER BASEDONCONTRACT, TORT,WARRANTY, OR ANYOTHER LEGAL THEORY, EXCEED THEAMOUNT OF PURCHASEPRICEPAID FOR THEPRODUCT AND ANYRELATED LICENSEORMAINTENANCEFEESPAID BYLICENSEE.
6. Exclusion of Damages. TOTHEMAXIMUMEXTENT PERMITTED BYAPPLICABLELAW, IN NOEVENT SHALLMICROSURVEY, ITSLICENSORS, OR ITSSUPPLIERSBELIABLEFOR ANYSPECIAL, INCIDENTAL, PUNITIVE, INDIRECT, OR CONSEQUENTIALDAM-AGESWHATSOEVER (INCLUDING, BUT NOT LIMITED TO, DAMAGESFOR LOSSOF PROFITSOROTHER DATAOR INFORMATION,OR FOR BUSINESS INTERRUPTION) ARISINGOUT OF OR IN ANYWAYRELATED TOTHEUSEOF OR INABILITYTOUSETHEPROD-UCT AND/OR SOFTWARE, EVEN IN THEEVENT OF THEFAULT, TORT (INCLUDINGNEGLIGENCE), STRICT LIABILITY, BREACHOFCONTRACT OR BREACHOFWARRANTYOF MICROSURVEY, ITS LICENSORSOR ANYSUPPLIERS, AND EVEN IF MICROSURVEYOR ANYof ITS LICENSORSOR SUPPLIERSHAVEBEEN ADVISEDOF THEPOSSIBILITYOF SUCHDAMAGES. BECAUSESOMEJURIS-DICTIONSDONOT ALLOWTHEEXCLUSIONOR LIMITATIONOF LIABILITYFOR CONSEQUENTIALOR INCIDENTALDAMAGES, THEABOVELIMITATIONMAYNOT APPLYTOLICENSEE.
7. Limitation of Liability.NOTWITHSTANDINGANYDAMAGESTHAT LICENSEEMIGHT INCUR FOR ANYREASONWHATSOEVER(INCLUDING,WITHOUT LIMITATION, ALL DAMAGESREFERENCED ABOVEAND ALLDIRECT ORGENERALDAMAGES), THEENTIRELIABILITYOF MICROSURVEYAND ANYOF ITS LICENSORSOR SUPPLIERSUNDER ANYPROVISIONOF THISAGREEMENTAND LICENSEEEXCLUSIVEREMEDYFOR ALLOF THEFOREGOINGSHALL BELIMITED TOTHEAMOUNT ACTUALLYPAID BYLICENSEEFOR THEPRODUCT AND ANYRELATED LICENSEORMAINTENANCEFEESPAID BYLICENSEE. THEFOREGOINGLIM-ITATIONS, EXCLUSIONSAND DISCLAIMERS (INCLUDINGSECTIONS5 AND 6ABOVE) SHALL APPLYTOTHEMAXIMUMEXTENTPERMITTED BYAPPLICABLELAW, EVEN IF ANYREMEDYFAILS ITSESSENTIAL PURPOSE. LICENSEEACKNOWLEDGESTHAT (A)THEPROVISIONOF THEPRODUCT AND SOFTWARE ISCONDITIONALUPONMICROSURVEYEXCLUDINGAND/OR LIMITING ITSAND ITS LICENSORS' AND SUPPLIERS' LIABILITYTOLICENSEE IN ACCORDANCEWITH THISAGREEMENT, AND (B) THEEXCLU-SIONSAND LIMITATION CONTAINED IN THISAGREEMENT AREFAIR AND REASONABLE IN ALL THECIRCUMSTANCESKNOWNATTHEDATEOF THISAGREEMENT.
8. Indemnification. Licensee agrees to defend, indemnify and holdMICROSURVEY, its affiliates, distributors, licensors, and suppliers harmlessfrom and against anyand all losses, damages, costs or expenses (including reasonable attorney's fees) (a) suffered byLicensee related in anyway to the Product, Software, or thisAgreement and/or (b) related to any claim or demandmade byany third party in connection with or arisingout of (i) anybreach byLicensee of anyof the termsand conditionsof thisAgreement, (ii) Licensee use or misuse of the Product or Software, (iii)Licensee violation of applicable laws, and/or (iv) Licensee violation of the rights of anyother person or entity. MICROSURVEY reserves the right,at its own expense, to assume the exclusive defense and control of (but not liability for) anymatter otherwise subject to indemnification byLicensee. Licensee will be liable toMICROSURVEY for reasonable attorney's fees in any such case.
9. Support.
a. General.Except as set forth in Section 9(b) (Website Support) and 9(c) (Contract Support), MICROSURVEYshall have no obligationunder thisAgreement to maintain or support the Software. Licenseemaycontact MICROSURVEY to inquire about MICROSURVEY'Scommercially available support andmaintenance servicesprovided pursuant to separate agreements. ThisAgreement shall not obli-gate either party to enter into any such separate agreement. Anyupdatesor error corrections to the Software that maybe provided toLicensee from time-to-time, if any, shall be deemed Software hereunder and shall be licensed to Licensee under the termsand con-ditionsof thisAgreement. If any such updatesor error correctionsaremade available to Licensee, then Licensee shall promptly (a) imple-ment such updatesor error corrections, (b) cease using the earlier versionswithout such updatesor error corrections, and (c) makesuch updatesor error correctionsavailable to the users of the earlier versions. Licensee shall be solely responsible for procuring all hard-ware and third-party software necessary to operate the Software.
b. Website Support.MICROSURVEYwill use reasonable commercial efforts to host andmaintain a web site (the "Support Site") for theSoftware during its commercial life (as reasonably determined byMICROSURVEY) that will include some or all of the following features:
l A "FrequentlyAskedQuestions" section with answers to common questionsabout the Software.
l A searchable "Helpdesk" section with general user instructionsand information about the Software.
l A link to allow end users of the Software to download anybug fixes, error correctionsor other updates to the Software thatMICROSURVEYmaymake available through the Site.

MicroSurvey End-User License Agreement
- v -
l "Contact MICROSURVEY" electronic response capability. MICROSURVEYwill use reasonable commercial efforts to respondwithin two (2) businessdays to a customer inquiry received via this system. Answers to such inquireswill be added to the FAQ's,as appropriate.
c. Contract Support.Uponmutual agreement in writing between Licensee andMICROSURVEY, or between Licensee and one ofMICROSURVEY'S authorized reseller's, MICROSURVEYwill provide contracted support services to Licensee asmaybe agreed uponand related to the Software.
10. Term and Termination.
a. ThisAgreement is effective until terminated. Licenseemay terminate thisAgreement at any time, with or without cause, upon notice toMICROSURVEY.MICROSURVEYmay terminate thisAgreement for Licensee's breach of thisAgreement.
b. Upon termination of thisAgreement, Licensee shall immediately cease all use of the Software and Documentation and return toMICRO-SURVEYall copiesof thereof within five (5) daysafter such termination. UponMICROSURVEY'S request, Licensee will certify in writingtoMICROSURVEY that all such copieshave been returned toMICROSURVEY. The following provisionsof thisAgreement shall survivetermination or expiration of thisAgreement: Sections2(b) (Restrictions), 3 (Ownership), 5 (WarrantyDisclaimer), 6 (Exclusion of Dam-ages), 7 (Limitation of Liability), 10 (Term and Termination), and 11 (General).
11. General.
a. Assignment.MICROSURVEYmayassign thisAgreement without notice to Licensee. Licensee shall not assign thisAgreement ortransfer anyof the rights, duties, or obligationsarising under thisAgreement without the prior written consent of MICROSURVEY. ThisAgreement shall be binding upon, and inure to the benefit of, the permitted successors and assignsof the parties thereto.
b. Amendments;Modifications. Noticesof changes to thisAgreement or other mattersmaybemade to Licensee bydisplaying noticesorlinks to notices to Licensee generally on the Site.
c. Governing Law; Forum; Attorney'sFees, Injunctive Relief. The termsof thisAgreement shall be construed and governed exclusivelyby the lawsof the province of British Columbia, excluding the application of its conflict of law provisionsand rules. Anydispute, con-troversyor claim between the parties arising out of or relating to thisAgreement or a breach of thisAgreement shall be settled pursuantto the termsof thisSection 11(c) byarbitration before three neutral arbitrators (selected from a panel of personshaving experience withand knowledge of the computer business), provided at least one of which arbitrators shall be an attorney, and administered by the Arbi-tratorsAssociation of British Columbia in accordance with itsCommercial Arbitration Rules in Kelowna, British Columbia. Anyprovisionalor equitable remedywhich would be available from a court of law shall be available from the arbitrators to the parties. Judgment uponthe award of the arbitratorsmaybe enforced in any court having jurisdiction thereof. The parties hereby consent to the non-exclusivejurisdiction of the courts of the Province of British Columbia for anyaction (i) to compel arbitration, (ii) to enforce the award of the arbi-trators or (iii) prior to the appointment and confirmation of the arbitrators, for temporary, interim or provisional equitable remedies, andto service of process in any such action by registeredmail, return receipt requested, or byanyother meansprovided by law. The appli-cation of the United NationsConvention of Contracts for the InternationalSale of Goods is expressly excluded.
d. Severability. The illegality, invalidity or unenforceability of one or more provisionsof thisAgreement shall not affect the legality, validityor enforceability of anyother provision, and thisAgreement shall be construed in all respects as if such illegal, invalid or unenforceableprovision were deemed amended to achieve asnear aspossible the same economiceffect as the original in a legal, valid and enforce-ablemanner if possible.
e. Further Relationships.Neither party is obligated by thisAgreement to enter into any further business relationship after the ter-mination or expiration of thisAgreement.
f. Notices.All noticesunder thisAgreement shall be in writing, and shall be deemed given when personally delivered, when received if bynationally recognized courier, or three daysafter being sent bypostage prepaid, certified or registered CanadianMail, as applicable, toMICROSURVEYatMICROSURVEY's addressas set forth herein or to Licensee at the address that Licensee provided upon enteringinto thisAgreement, or such other addressasa party last provided to the other bywritten notice.
g. Independent Contractor.MICROSURVEYand Licensee are independent contractors. No partnership, joint venture, or other jointrelationship is created by thisAgreement.
h. Entire Agreement. ThisAgreement represents the entire agreement between the parties relating to its subject matter and supersedesall prior representations, discussions, negotiationsand agreements. All changes, modifications, additionsor deletions shall be effectiveimmediately upon notice thereof, whichmaybe given bymeans including, but not limited to, posting on the Site, or byelectronic or con-ventionalmail, or byanyother meansbywhich Licenseemayobtain notice thereof. Use of the Product and/or Software after such noticeconstitutesacceptance of such changes, modificationsor additions. ThisAgreement maybe amended at any time bymutual agreementof the parties.

MicroSurvey STAR*NET-LEV ReferenceManual
- vi -
MICROSURVEY TECHNICAL SUPPORTMicroSurvey Software Technical Support is available to help you get themost out of your MicroSurvey product. The followinginformation explains how to prepare for your call so that your inquiry can be answered promptly and accurately.
Please prepare yourself before you call for Technical Support
Take a few minutes before you place your call to check the printed documentation and the online help files to see if the answeris already at your disposal. OurWeb site on the Internet can also save time. Please check it for assistance if you can. Pleasehave the following information available if requested: version of the program, operating system version and architecture, andyour Technical Support Number.
Pleasemake sure that you have all the steps you completed prior to your problem and can explain them to the technical sup-port representative. Wemay ask that you forward a copy of your data to us if we cannot find the problem immediately.
MicroSurvey offers a 90-day complimentary support period to all of our registered users, starting the date of purchase. Intro-ductory support is available weekdays between 8:00 am and 5:00 pm (Pacific Time) excluding holidays.
Yearly Support
For clients who have had their original 90-day complimentary support period expire and feel that they will need on going supportover the next year, we have a Yearly Support Contact option available. This gives you the ability to contact us for technical sup-port, as much as you require, and you pay a flat fee once a year. This option is not to be used in place of training but is to assistyou on the occasions when you really need it. The charge for the Yearly Support Contract is to be billed and paid for prior to thesupport commencing. This rate is subject to change, call for current rates.
Electronic Support
MicroSurvey maintains and provides at no charge, our Internet Web site at www.microsurvey.com
This web site has sections on frequently asked questions, Technical Notes, Technical Specifications, and as required, freeupdates and program fixes, along with a lot of other helpful information.
Training
MicroSurvey Software Inc. can provide training to you, in your office or in a classroom situation (where facilities and numbersallow. MicroSurvey has training staff that will travel to almost anywhere and provide you with the professional skills you requireto operate your MicroSurvey program. Please feel free to call and ask for a quotation or inquire about potential classroom sit-uations. Your local dealer may also be able to setup or arrange a training session for you. Contact our head office for more infor-mation about training.

MicroSurvey Contact Information
- vii -
MICROSURVEY CONTACT INFORMATIONInternet
CorporateWebsite: www.microsurvey.comTechnical Support Helpdesk: www.microsurvey.com/helpdeskGeneral Information E-Mail: [email protected]
Telephone
Phone (Toll Free): 1-800-668-3312Phone (International): 1-250-707-0000Fax: 1-250-707-0150
8:00 am to 5:00 pm (Pacific Time)(Monday to Friday, except holidays)
Mailing Address
MicroSurvey Software Inc.205 - 3500 Carrington RoadWest Kelowna, BC V4T 3C1Canada

MicroSurvey STAR*NET-LEV ReferenceManual
- viii -

Table of Contents
- 9 -
TABLE OF CONTENTSMicroSurvey End-User License Agreement iii
MicroSurvey Technical Support vi
MicroSurvey Contact Information vii
Table of Contents 9
Chapter 1: Overview 15
Chapter 2: Installation 17
2.1 Installing STAR*NET 17
2.2 Starting STAR*NET 17
2.3 File Reference 17
Program Files 17
System Configuration Files 18
User Configuration Files 18
Project Files 18
2.4 Registry Reference 19
Chapter 3: Using STAR*NET 21
3.1Workflow 21
Open a new project. 21
Set options describing your project. 21
Create one or more input data files containing observations and control points. 21
Run the adjustment. 21
Check the Error File 22
Edit your input data files to correct any errors found. 22
Review the output listing. 22
Review the Network Plot 22
Review Other Output Files 23
Repeat the edit-run-review cycle 23
Print output listing, coordinate information and plot diagrams. 23
3.2 How STAR*NET Handles Output Windows 23
3.3 Customizable Screen Layout 24
Docking Panels 24

MicroSurvey STAR*NET-LEV ReferenceManual
- 10 -
Auto-Hiding Panels 25
Resizing Panels 25
Reset Layout 25
3.4 TheMenu System 25
3.5 Project Manager 27
3.6 Integrated Data Editor 28
Syntax Highlighting 28
Block Commenting 28
TheGutter 29
Bookmarks 29
Line Numbers 29
3.7 Set External Editor 30
3.8 Editor Options 30
Editor 30
Editor Font 31
Syntax Color 31
Reset Font and Color Options 32
3.9 Customize 33
Commands 33
Toolbars 34
Keyboard Shortcuts 35
Menus 36
Options 37
3.10 Find Point 37
Chapter 4: OPTIONS 39
4.1 Overview 39
4.2 Changing Project Options Using Options Dialogs 39
4.3 Changing Project Options Using Inline Options 39
4.4 Setting Project Options (LEV Edition) 40
Adjustment Options (LEV Edition) 40
General Options (LEV Edition) 41
Instrument Options (LEV Edition) 42

Table of Contents
- 11 -
Listing File Options (LEV Edition) 43
Other Files Options (LEV Edition) 44
4.5 Company Options 45
Chapter 5: Preparing Input Data 47
5.1 Overview 47
5.2 Input Data Files 47
Using the Input Data Files Panel 47
5.3 AnOverview of STAR*NET Data Files 48
5.4 Naming Data Files 48
5.5 TheGeneral Content of Data Lines 49
Data Type Codes 49
Station Names 49
Standard Errors 50
Point Descriptors 50
5.6 Description of Data Formats 51
The "E" Code: Elevation for a Station 51
The “C” Code: Coordinates for a Station 51
The "L" Code: Differential Level Observation Information 52
Example of Differential Leveling Data 53
5.7 Inline Options 53
Using Inline Options 54
Description of Inline Options 55
INLINE OPTION:.UNITS LinearType 55
INLINE OPTION:.DATA ON/OFF 55
INLINE OPTION:.SEPARATOR Character 55
INLINE OPTION:.2D or .3D 56
INLINE OPTION:.LWEIGHT Value [Turns] 56
INLINE OPTION:.VLEVEL SectionLengthUnits/NONE/OFF 57
Chapter 6: Running Adjustments 59
6.1 Overview 59
6.2 Adjust Network 59
6.3 Data Check Only 60

MicroSurvey STAR*NET-LEV ReferenceManual
- 12 -
6.4 Level Loop Check 60
Chapter 7: Viewing and Printing Output 65
7.1 Overview 65
7.2 Output Files 65
7.3 Listing File 65
7.4 Error File 67
7.5 Adjusted Points 67
7.6 Network Plot 67
Plot Options 68
Popup "Quick Change" Menu 69
7.7 Print / Print Preview 69
Chapter 8: ANALYSIS OF ADJUSTMENT OUTPUT 73
8.1 Overview 73
8.2 Sections of the Output Listing 73
8.3 Summary of Files Used andOptions Settings 73
8.4 Listing of Input Data Files (Optional) 74
8.5 Summary of Unadjusted Input Observations (Optional) 74
8.6 Adjustment Statistical Summary 74
8.7 Chi Square Test 76
8.8 Coordinate Changes from Entered Provisionals (Optional) 77
8.9 Adjusted Elevations and Error Propagation 78
8.10 Adjusted Observations and Residuals 78
Chapter 9: Tools 81
9.1 Overview 81
9.2 Points Reformatter 81
Defining Format Styles 82
9.3 DXF Exporter 85
Exporting a "LEV" Project to a DXF file 85
Loading the DXF File into AutoCAD 86
9.4 Editor Options 86
Editor 86
Editor Font 87

Table of Contents
- 13 -
Syntax Color 88
Reset Font and Color Options 89
9.5 Reset Layout 90
Chapter 10: APPENDIX A - TOUR OF THE STAR*NET-LEV PACKAGE 91
10.1 Overview 91
Appendix A: A Tour of STAR*NET 93
A.1 Overview 93
0.1 Example 10: Differential Leveling Network 95
Appendix B: References 101
Appendix C: Additional Technical Information 103
C.1 Program Limits 103
10.2 Error Messages andWarnings 103
Index 105

MicroSurvey STAR*NET-LEV ReferenceManual
- 14 -

Chapter 1: Overview
- 15 -
CHAPTER 1: OVERVIEWThe STAR*NET software suite handles general purpose, rigorous least squares analysis and adjustments of 2D, 3D and 1Dland survey networks.
This referencemanual is amuch-shortened version of the full STAR*NETmanual and documents features mainly relevant tothe STAR*NET-LEV edition. Most of the information relating to 2D and 3D options and data types has been removed. Somesections in this manual, however, do reference or illustrate 2D or 3D information but these references are usually general innature and relate to the operation of the program for all types of networks.
Four STAR*NET editions are available to fit the particular needs of the user:
n Standard Edition – Handles 2D/3D survey networks. Differential leveling datamay also be combined in a 3D adjustment.This edition includes all the base features that make STAR*NET so useful to surveyors. Some of these base featuresinclude an instrument library facility, points reformatter tool, DXF transfer tool, grid-to-ground coordinates converter, net-work graphics display with zoom, pan, find and inverse capabilities, point and connection inquiry from the graphics display,andmuchmore.
n PLUS Edition – Adds a separate 1D differential leveling network adjustment facility to all features of the Standard Edition.
n PRO Edition – This high-end edition adds GPS handling and geoid/deflectionmodeling capabilities to all features of thePLUS Edition. It includes a vector importer that supports most popular baseline formats. Special GPS options allow scal-ing of vector weighs and application of centering errors separately in horizontal and vertical directions. Combining con-ventional, leveling andGPS is made easy!
n LEV Edition – This subset edition handles differential leveling network adjustments, a perfect low-cost solution for con-sultants requiring this this type of adjustment only.
One of themain features of STAR*NET is the capacity to weight all input data both independently or by category. This meansthat accurately knownmeasurements can be givenmore weight in the adjustment than thosemeasurements known to be lessaccurate. Completely unknown quantities, such as the coordinates of a new station, may be given a special code indicatingthat they are “FREE” in the adjustment. The user can “FIX” other data with a code so that they receive no correction. The abilityto control the weighting of data provides the user with a powerful adjustment tool.
The user may select a number of options to determine the type of adjustment to be performed. All option selections and pro-gram commands aremade through a dialog interface, making program operation simple, even for casual users. Every attempthas beenmade to simplify the input of data, and the analysis of the results. The program performs gross error checking, andwarns the user if input data appear incorrect.

MicroSurvey STAR*NET-LEV ReferenceManual
- 16 -
Chapter 2: Installation
- 17 -
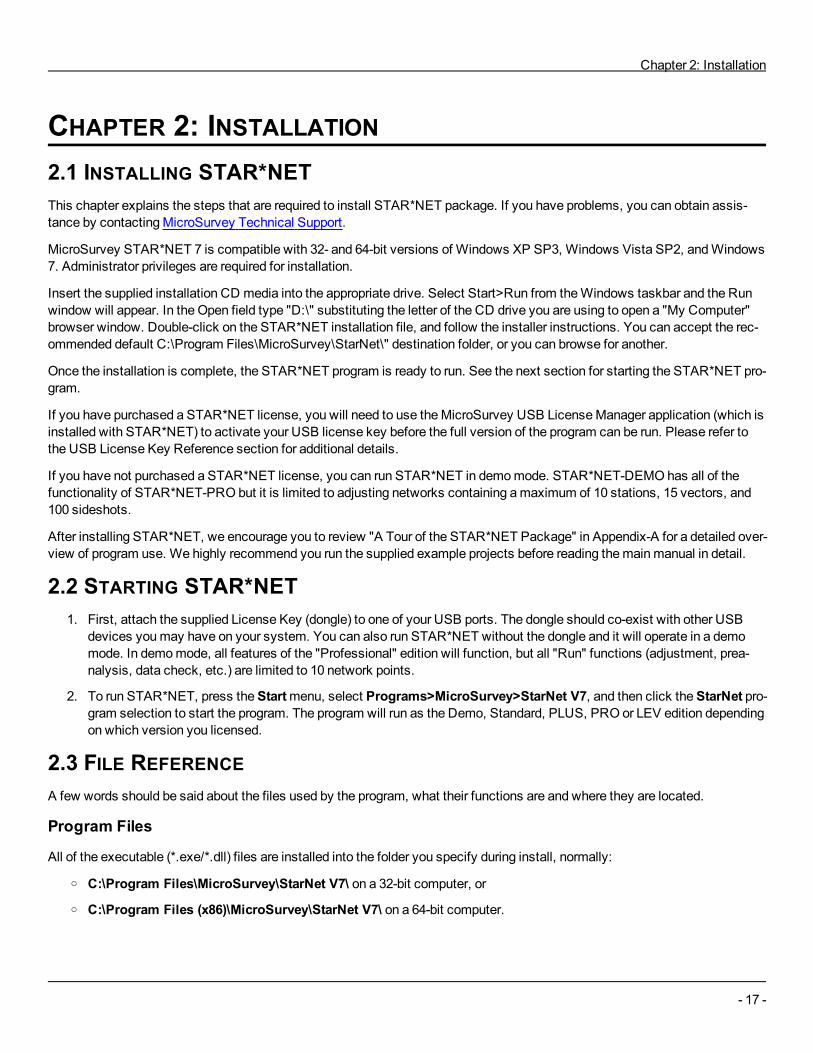
CHAPTER 2: INSTALLATION2.1 INSTALLING STAR*NETThis chapter explains the steps that are required to install STAR*NET package. If you have problems, you can obtain assis-tance by contactingMicroSurvey Technical Support.
MicroSurvey STAR*NET 7 is compatible with 32- and 64-bit versions of Windows XP SP3, Windows Vista SP2, andWindows7. Administrator privileges are required for installation.
Insert the supplied installation CD media into the appropriate drive. Select Start>Run from theWindows taskbar and the Runwindow will appear. In the Open field type "D:\" substituting the letter of the CD drive you are using to open a "My Computer"browser window. Double-click on the STAR*NET installation file, and follow the installer instructions. You can accept the rec-ommended default C:\Program Files\MicroSurvey\StarNet\" destination folder, or you can browse for another.
Once the installation is complete, the STAR*NET program is ready to run. See the next section for starting the STAR*NET pro-gram.
If you have purchased a STAR*NET license, you will need to use theMicroSurvey USB LicenseManager application (which isinstalled with STAR*NET) to activate your USB license key before the full version of the program can be run. Please refer tothe USB License Key Reference section for additional details.
If you have not purchased a STAR*NET license, you can run STAR*NET in demomode. STAR*NET-DEMO has all of thefunctionality of STAR*NET-PRO but it is limited to adjusting networks containing amaximum of 10 stations, 15 vectors, and100 sideshots.
After installing STAR*NET, we encourage you to review "A Tour of the STAR*NET Package" in Appendix-A for a detailed over-view of program use. We highly recommend you run the supplied example projects before reading themainmanual in detail.
2.2 STARTING STAR*NET1. First, attach the supplied License Key (dongle) to one of your USB ports. The dongle should co-exist with other USB
devices youmay have on your system. You can also run STAR*NET without the dongle and it will operate in a demomode. In demomode, all features of the "Professional" edition will function, but all "Run" functions (adjustment, prea-nalysis, data check, etc.) are limited to 10 network points.
2. To run STAR*NET, press theStartmenu, select Programs>MicroSurvey>StarNet V7, and then click theStarNet pro-gram selection to start the program. The program will run as the Demo, Standard, PLUS, PRO or LEV edition dependingon which version you licensed.
2.3 FILE REFERENCEA few words should be said about the files used by the program, what their functions are and where they are located.
Program Files
All of the executable (*.exe/*.dll) files are installed into the folder you specify during install, normally:
o C:\Program Files\MicroSurvey\StarNet V7\ on a 32-bit computer, or
o C:\Program Files (x86)\MicroSurvey\StarNet V7\ on a 64-bit computer.
MicroSurvey STAR*NET-LEV ReferenceManual
- 18 -
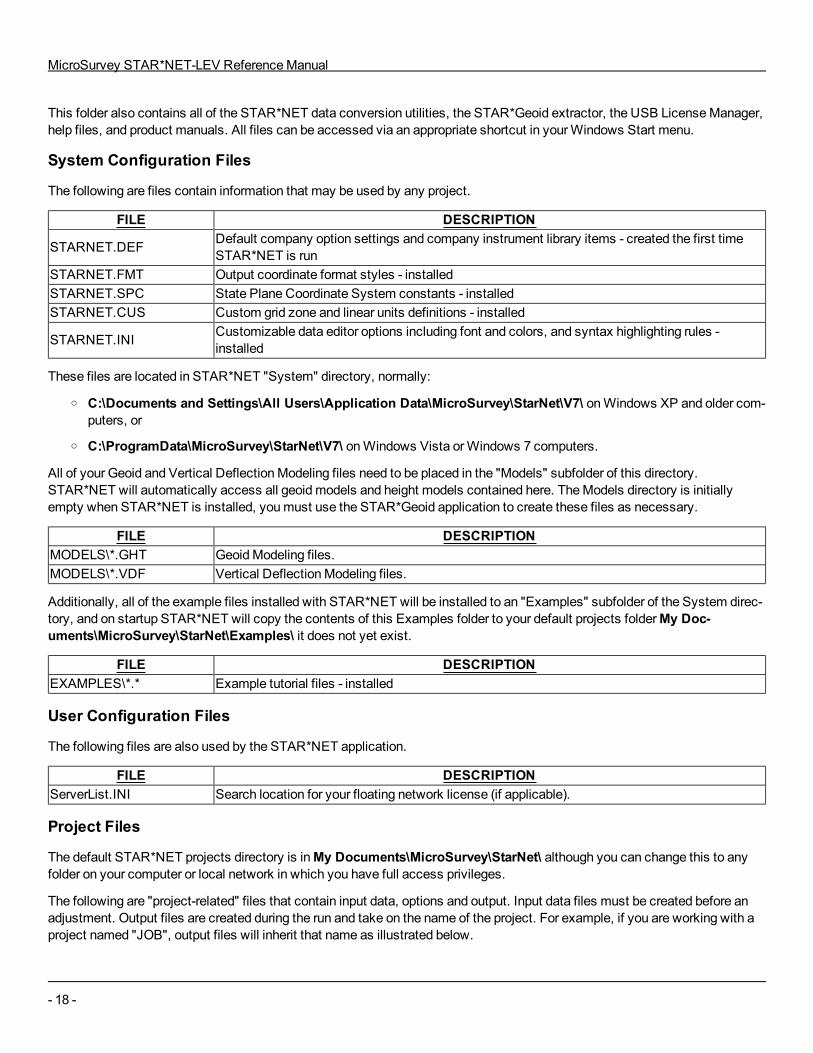
This folder also contains all of the STAR*NET data conversion utilities, the STAR*Geoid extractor, the USB LicenseManager,help files, and product manuals. All files can be accessed via an appropriate shortcut in yourWindows Start menu.
System Configuration Files
The following are files contain information that may be used by any project.
FILE DESCRIPTION
STARNET.DEF Default company option settings and company instrument library items - created the first timeSTAR*NET is run
STARNET.FMT Output coordinate format styles - installedSTARNET.SPC State Plane Coordinate System constants - installedSTARNET.CUS Custom grid zone and linear units definitions - installed
STARNET.INI Customizable data editor options including font and colors, and syntax highlighting rules -installed
These files are located in STAR*NET "System" directory, normally:
o C:\Documents and Settings\All Users\Application Data\MicroSurvey\StarNet\V7\ onWindows XP and older com-puters, or
o C:\ProgramData\MicroSurvey\StarNet\V7\ onWindows Vista orWindows 7 computers.
All of your Geoid and Vertical DeflectionModeling files need to be placed in the "Models" subfolder of this directory.STAR*NET will automatically access all geoid models and height models contained here. TheModels directory is initiallyempty when STAR*NET is installed, youmust use the STAR*Geoid application to create these files as necessary.
FILE DESCRIPTIONMODELS\*.GHT GeoidModeling files.MODELS\*.VDF Vertical DeflectionModeling files.
Additionally, all of the example files installed with STAR*NET will be installed to an "Examples" subfolder of the System direc-tory, and on startup STAR*NET will copy the contents of this Examples folder to your default projects folderMy Doc-uments\MicroSurvey\StarNet\Examples\ it does not yet exist.
FILE DESCRIPTIONEXAMPLES\*.* Example tutorial files - installed
User Configuration Files
The following files are also used by the STAR*NET application.
FILE DESCRIPTIONServerList.INI Search location for your floating network license (if applicable).
Project Files
The default STAR*NET projects directory is inMy Documents\MicroSurvey\StarNet\ although you can change this to anyfolder on your computer or local network in which you have full access privileges.
The following are "project-related" files that contain input data, options and output. Input data files must be created before anadjustment. Output files are created during the run and take on the name of the project. For example, if you are working with aproject named "JOB", output files will inherit that name as illustrated below.

Chapter 2: Installation
- 19 -
By default, all files for a project are located in one directory, normally called the project folder, although your .DAT and .GPSdata files may be located elsewhere.
FILE DESCRIPTION
JOB.PRJ
STAR*NET V6 (or older) Project File. Contains data file references, project options and projectinstrument library items. Created when a project is first created in STAR*NET V6 or older. If a.prj file is opened in STAR*NET V7, a new .snproj file will be created based on it and the original.prj file will be left untouched so it can still be used in V6 if necessary.
JOB.SNPROJ
STAR*NET V7 Project File. Contains data file references, project options and project instrumentlibrary items. Created when a project is first created in STAR*NET V6 or older.While the internalfile format has not changed between V6 and V7, there are new options present in the V7 .snprojfile which are not compatible with V6.
JOB.DAT One ormore input data files - the "DAT" extension is suggested however other file names andextensions may be used
JOB.GPS One ormore GPS vector input data files - the "GPS" extension is suggested however other filenames and extensions may be used
JOB.LST Output - adjustment listingJOB.ERR Output - error listing - created when errors or warnings found
JOB.SBF Output - Star Binary File - adjusted information used for the creation of plots, reformatted pointsand DXF export
Depending on settings in the Project Options, the following additional files may also be created during an adjustment:
FILE DESCRIPTIONJOB.PTS Output - Cartesian CoordinatesJOB.POS Output - Geodetic PositionsJOB.GND Output - Ground-scaled Cartesian CoordinatesJOB.DMP Output - Ground station information dump file.
Additional files can also be exportedmanually:
FILE DESCRIPTIONJOB.DXF Output - DXF Exporter.
JOB.REF Output - Point Reformatter. This is the default filename, however the filename, extension, anddefault extension can all be customized.
2.4 REGISTRY REFERENCEThe STAR*NET programmakes use of your computer’s registry to keep track of certain default directories, files and options.The items saved in the registry are automatically created andmanaged by the program.
The following describes some of the information stored there.
l The location of the STAR*NET "system" directory, the directory containing the system files described in the previoussection.
l The size and location of themain STAR*NET window, plus the size and location of most sub-windows (i.e. the listingand plot windows) when the program was last used. The windows will come up looking the same the next run.
l The Text Editor and Start-in Directory items selected by you using dialogs accessed from the Files menu.
l The "Recent Projects" list appearing at the bottom of the Files menu.

MicroSurvey STAR*NET-LEV ReferenceManual
- 20 -
l Printer and Plotter device preferences.
l The options last-used by the Points Reformatter tool.
l The options last-used by the GPS vector importer in the PRO edition for specific baseline formats.
When you install STAR*NET on another computer, these registry entries, of course, are not copied and they will be rees-tablished by the program or reset by you.
If you reinstall the program (or install an updated version) over the original installation on your computer, all existing registryinformation is preserved.
If you uninstall the program, all existing registry information for the program is removed.
Since this information is internally managed by STAR*NET, no documentation is given to externally edit information in the reg-istry.

Chapter 3: Using STAR*NET
- 21 -
CHAPTER 3: USING STAR*NET3.1 WORKFLOWThis chapter briefly describes the steps in running a typical STAR*NET adjustment. Subsequent chapters will cover these top-ics and specialized features in detail. The list below summarizes the sequence of tasks you generally follow when creating aproject and performing adjustments with the STAR*NET program.
Open a new project.
Create a new project by choosing File>New Project or by pressing the New tool button. Browse if required to a folder whereyou want to create the project. Enter the name of the project (with no extension) and press Open. For example, if you enter theproject name SouthPark, a new SouthPark.prj file is created which will contain options for the your new project.
Open an existing project by choosing File>Open Project, or by pressing the Open tool button. Browse if required to the foldercontaining your project. Highlight your existing project’s "PRJ" file and press Open – or simply double-click the existing "PRJ"file.
Alternately, if your project is one you recently worked with, open it by selecting its name from the "recent projects" list at thebottom of the File menu.
Set options describing your project.
STAR*NET saves a group of option settings for each project. These options define characteristics of the survey networkadjustment and are remembered for the duration of the project. ChooseOptions>Project Options or press the Project Optionstool button. A tabbed dialog with eight categories is shown: Adjustment, General, Instrument, Listing File, Other Files, Special,GPS andModeling. Make changes to settings in one or more of the option pages and press OK to save. TheGPS andModelingoption pages are active only in the Professional edition. (See "PRO" edition supplement.)
See Chapter 4, "Options" for complete details on setting project options.
Create one or more input data files containing observations and control points.
Before you can run an adjustment, STAR*NET needs at least one input data file containing your field observations. ChooseInput>Data Files or press the Input Data Files tool button. An Input Data File dialog appears and is used to specify what datafiles to include in your adjustment. For a new project, a file namewith your project name and the "DAT" extension is auto-matically provided for your convenience. Data files are standard text files that consist of lines of data conforming toSTAR*NET’s rules. To edit new survey observation data into this file, highlight its name in the dialog’s Data File List, and pressthe Edit button.
Additional text files may be added to the project by pressing the Add button in the dialog and then selecting an existing file ornew file. When an adjustment is performed, each file is read intomemory in the order it appears in this dialog.
See Chapter 5, "Preparing Data" for details on using the Input Data Files dialog and a complete description of input data for-mats.
Run the adjustment.
To run an adjustment for your project, chooseRun>Adjustment, or press the Run Adjustment tool button. STAR*NET loadsyour data file or files into memory, checks the information, and then runs the adjustment. A "Processing Summary" window
MicroSurvey STAR*NET-LEV ReferenceManual
- 22 -
opens so you can see the progress of the adjustment. When the processing finishes, a short statistical summary is shownwhich should be inspected to judge the success of the adjustment.
Besides the full adjustment, there are several other choices that may be selected from the Runmenu: Data Check Only readsand checks the data but does not perform an actual adjustment. Blunder Detect helps you detect gross errors in your inputdata. And Preanalysis analyzes the survey network configuration and predicts the accuracy of a proposed survey
See Chapter 6, "Running Adjustments" for complete details on these Run features.
Check the Error File
If errors or warnings were found, check the error listing for specific details.
When STAR*NET encounters problems during the adjustment run, it lists amessage in the "Processing Summary" Windowthat errors or warnings were detected. To view this error file, chooseOutput>Errors, or press the Errors tool button. Based onwhat the error file says, youmay need to change one of the project options or edit an input data file to correct a data error, andthen rerun the adjustment.
The error file viewed below shows that typing errors were found in two lines of a data file. In the first case, a non-numeric char-acter was found in an elevation value. In the second case, an invalid horizontal angle was found - the "minutes" value is toolarge. Whenever possible, STAR*NET tries to show you where the error is by printing a line of asterisks "*******" over to a badcharacter or to an illegal value.
For a listing of the common error and warningmessages youmight encounter, see Appendix-D, "Error andWarningMes-sages."
Edit your input data files to correct any errors found.
To edit your data files, or to add additional data files, use the Input Data dialog as described in "Creating Input Data Files" ear-lier in this section.
This dialog allows you edit any file by pressing the Edit button or by simply double-clicking the file name. The dialog also allowsyou to add or remove data files from the list, and to rearrange their order. You can also "uncheck" a data file whichmeans itremains part of the project, but will not be read for the next adjustment run.
Repeat the edit-run-review cycle as necessary until there are no errors generated when the adjustment is run.
Review the output listing.
When you run an adjustment for a project, STAR*NET writes the results to an output listing file. To review this file, chooseOut-put>Listing, or press the Listing tool button. TheOutput Listing window appears, and it includes its own tool buttons whichallow you to jump forward or backward in the file to view different sections.
Click the Listing Tree Index tool button, or right-click anywhere in the listing window and a small "Listing Index Tree" windowwill appear which allows you to quickly navigate to any section of the listing you are interested in seeing.
Review the Network Plot
Youmay view a diagram of your adjusted network, including station and relative error ellipses. ChooseOutput>Plot, or pressthe Network Plot tool button.
If you are using STAR*NET-LEV to perform a leveling adjustment, youmust enter horizontal “reference coordinates” for all sta-tions in your level network data in order to generate a Network Plot.
Chapter 3: Using STAR*NET
- 23 -
Several tool buttons on the plot window allow you to zoom in and out, pan, center the plot at amouse click, find a point by giv-ing its name, and inverse between given points. You can also zoom by dragging a box round an area with your mouse. Right-click your mouse on the plotting window to bring up a "Quick-Change" menu where you can quickly turn off or on plot itemssuch as point names, markers or ellipses.
Click on the plot window Options tool button to bring up a tabbed options dialog. Here you can set many options including whatitems to show on the plot and the sizes of names, markers and ellipses.
Review Other Output Files
As a result of an adjustment, other output files may be created depending on whether they were requested in the ProjectOptions settings. These text files may include:
l Coordinates (adjusted coordinates - elevations only for a Lev Network run)
l Dump File (comma-delimited station information details)
As with the listing file, you can choose to view any one of these output files from theOutput menu. For details, see Chapter 7,"Viewing and Printing Output."
Repeat the edit-run-review cycle
Repeat all previous steps as necessary until you have satisfactory results within your required tolerances.
Print output listing, coordinate information and plot diagrams.
Any of the output files can be previewed and printed from within the program. For example, the listing file is themain output doc-ument for your adjustment, and you will usually want to print it when the project is adjusted to your satisfaction. To print any out-put file, its window must be active.
Prior to actually printing output, choose File>Text Page Setup to select the output printer and to set options such as marginsizes and page numbering. These settings are saved as defaults and will be used for future STAR*NET printing until changed.
To preview how the printed output will look, choose File>Print Preview or press the Print Preview tool button. To print the out-put, choose File>Print or press the Print tool button. You can highlight any section of an output text file and print just that part.
When a Plot Window is active, you can also preview and print the plot diagram. Prior to actually printing the plot, chooseFile>Plot Page Setup to select the output printer and orientation. You can choose different printers for the text output (listings,etc.) and the plot diagram output.
In your plot window, only display the items you want to see on your printed plot. For example, if you do not want to see pointnames or ellipses, turn them off. Resize the window to approximate the shape of your printed sheet. Zoom in or out to fill theimage space to the way you want the image to appear on your printed sheet.
Preview how the plot will look on a printed sheet by choosing File>Print Preview, or by pressing the Print Preview tool button.Then actually print your network plot by choosing File>Print, or by pressing the Print tool button.
See Chapter 7, "Viewing and Printing Output" for complete details on viewing output listing files and network plots, and printingthem.
3.2 HOW STAR*NET HANDLES OUTPUT WINDOWSBefore going on, a word should be said about how window sizing and placement is handled by STAR*NET. The size and loca-tion of themain program window as well as all the output windows (listing window, plot window, etc.) are remembered! You

MicroSurvey STAR*NET-LEV ReferenceManual
- 24 -
have full control of the size and location of these windows, and therefore you should set them the way you feel is most con-venient for you. When you exit the program and later restart it, all the windows locate and size themselves the sameway.
For example, the output listing file window is one that you will always view, therefore you shouldmake it as large as possiblevertically and as wide as the output listing text. Once you do this, it will stay this way. You should also choose a convenientsize and location for your plot window.
Note that you can leave output windows open while you edit data and rerun an adjustment. Output windows (listings and plots)that are left open, will automatically regenerate to show the newly adjusted results.
See Chapter 7, "Viewing and Printing Output" for more details on output windows.
3.3 CUSTOMIZABLE SCREEN LAYOUTSTAR*NET V7 features a new fully integrated user interface. Please note that the default screen layout may not be appropriatefor all display sizes and resolutions, and we do recommend that you customize the interface to best suit your specific needsand workflow habits. The following customization abilities are available...
Docking PanelsEvery "panel" (Input Data Files, Output Files, Processing Summary, Network Plot, Find Point Tool) within STAR*NET V7 canbe rearranged to your own preferences. Panels can be dock or floating, auto-hidden to a small tab, or hidden from view com-pletely,
Panels can be drag-and-dropped into a new position, easily snapping into a desired position. While dragging the title-bar of anypanel, you will see various icons appear on your screen which you can drop the panel onto, causing it to snap into the interfacein a specific way as follows:
Snap Top: This icon will appear centered horizontally near the top of your window; dropping a panel here willsnap it along the top edge of the window.Snap Left: This icon will appear centered vertically near the left edge of your window; dropping a panel herewill snap it along the left edge of the window.Snap Right: This icon will appear centered vertically near the right edge of your window; dropping a panelhere will snap it along the right edge of the window.Snap Bottom: This icon will appear centered horizontally near the bottom edge of your window; dropping apanel here will snap it along the bottom edge of the window.
Dock Primary: This group of four icons will appear centered over the primary (Data File Editor) area of yourwindow as you drag over it. Dropping a panel onto one of the four directional icons in this group will snap italong the selected edge of themain editor area. The screen space will be split equally between themovedpanel and the existing editor panel.
Dock Secondary: This group of five icons will appear centered over any other docked or floating secondarypanels (Project File List, Network Plot, Processing Summary, Output Files, Network Plot) as you drag overthem. Similar to the above, Dropping a panel onto this central docking icon (or onto the title bar of anotherpanel) will cause the two panels to share the same screen space, one over top of the other with a "tab" con-trol along the bottom of the panel to switch between them.
Float: Dropping a panel onto any empty space on your screen will float it above themain interface. This isuseful for moving items onto a secondary display.
Chapter 3: Using STAR*NET
- 25 -
Auto-Hiding PanelsEvery secondary panel (Project File List, Output Files, Processing Summary, Network Plot, Find Point Tool) withinSTAR*NET V7 can be hidden or shrunk from view if desired.
All docked secondary panels show the following icons in the top-right corner of their title bar:
Window Position: This icon displays a pulldownmenu which can be used to set the display mode for that panel withoptions for Floating, Docking, Auto Hide, or Close. Right-clicking on the title bar of a floating or docked panel will also displaythis menu.
Auto Hide: This icon causes the panel to collapse down to a tab docked along an edge of themain window, or return a pre-viously auto-hidden panel to its previous docked position.
Close: This button closes the panel.
Once a panel has been closed, it can be reopened using the appropriate option under theViewmenu.
Resizing PanelsAny of the docked panels can be resized by dragging the horizontal or vertical "splitter" bar between two adjacent panels. Youwill see themouse cursor change to a splitter icon when hovering over a splitter bar; simply drag the splitter bar left-right or up-down to adjust the panel sizes as desired.
Floating panels can be resized by dragging the window edges or corners as desired.
Reset LayoutYou can reset your layout customizations using the Tools | Reset Default Layout command.
3.4 THE MENU SYSTEM
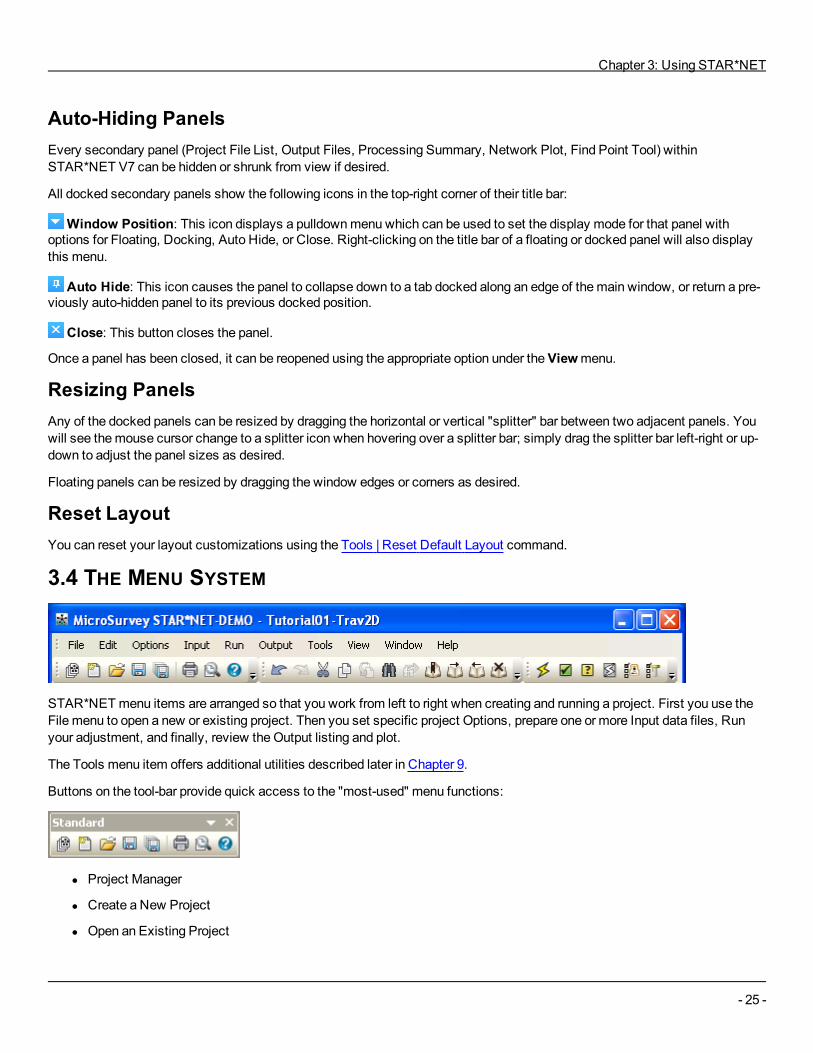
STAR*NETmenu items are arranged so that you work from left to right when creating and running a project. First you use theFile menu to open a new or existing project. Then you set specific project Options, prepare one or more Input data files, Runyour adjustment, and finally, review theOutput listing and plot.
The Tools menu item offers additional utilities described later in Chapter 9.
Buttons on the tool-bar provide quick access to the "most-used" menu functions:
l Project Manager
l Create a New Project
l Open an Existing Project

MicroSurvey STAR*NET-LEV ReferenceManual
- 26 -
l Save Current Data File
l Save All Data Files
l Print
l Print Preview
l Help
l Undo
l Redo
l Cut
l Copy
l Paste
l Find
l Find Next
l Toggle Bookmark
l Next Bookmark
l Previous Bookmark
l Clear All Bookmarks
l Run Adjustment
l Data Check Only
l Blunder Detect
l Preanalysis
l Level Loop Check
l GPS Loop Check
l AddNew Data File
l Add Existing Data File
l Import GPS Vectors

Chapter 3: Using STAR*NET
- 27 -
l Remove Selected Data File
l Delete Selected Data File
l Open Selected Data File
l Open Selected Data File with External Editor
l Move Selected Data File Up
l Move Selected Data File Down
Also note that all toolbars andmenus can be customized using theView | Customize command, as discussed in the Cus-tomize topic.
3.5 PROJECT MANAGERThe STAR*NET Project Manager provides an easy means of opening and creating your STAR*NET projects. It is auto-matically displayed on startup by default, and it can also be opened by selecting File | Project Manager.
A list of your 10most recently used project (*.snproj) files will be listed on the dialog for quick one-click access. While only thefilename is displayed on the dialog, hovering your mouse over any of the filenames will display a tooltip containing the full pathand file name.

MicroSurvey STAR*NET-LEV ReferenceManual
- 28 -
TheShow On Startup checkbox controls whether or not to automatically display this Project Manager on startup. If you do notwish to use the Project Manager, you can disable this option.
New Project
Pressing theNew Project icon will step you through creation of a new STAR*NET project. You will be prompted for a folderand filename to create. When a new project is created, it will look for amatching .dat file with the same name and if one isfound it will automatically add it to the new project; if a matching .dat file is not found, one will be created using the cus-tomizable template data file.
The Template data file is located in one of the following default locations, and can be customized or deleted for your preferredbehavior.
Windows XP:C:\Documents and Settings\All Users\Application Data\MicroSurvey\StarNet\V7\template.dat
Windows Vista/7:C:\ProgramData\MicroSurvey\StarNet\V7\template.dat
Open Project
Pressing theOpen Project icon will let you select any project file in your computer. You will be prompted for a folder and file-name to open.
If you open a .prj project file from previous versions of STAR*NET, a new .snproj project file will be created and the original .prjfile will be left untouched.
3.6 INTEGRATED DATA EDITORSTAR*NET V7 features a new integrated and customizable data file (*.dat, *.gps) editor, which provides the following powerfulfeatures...
Syntax Highlighting Your input data files will be displayed (by default) with syntax highlighting enabled, with the following defaults:
o Data Record Types - Blue
o .Inline Options - Magenta
o Text/Numbers - Black
o Fixity Codes - Red
o #Comments - Green
o 'Descriptions - Light Blue
If desired, the highlight colors can be customized by using the "View | Fonts/Colors" command.
Block CommentingYou can automatically comment and un-comment blocks of selected text by pressing the # key with multiple lines selected.Any selected lines will automatically be commented or uncommented via the addition or removal of one # character at the startof each line. If all of the selected lines are already commented, they will be uncommented by the removal of one # character. Ifall or some of the selected lines are already commented, all selected lines will receive one new # character.
Chapter 3: Using STAR*NET
- 29 -
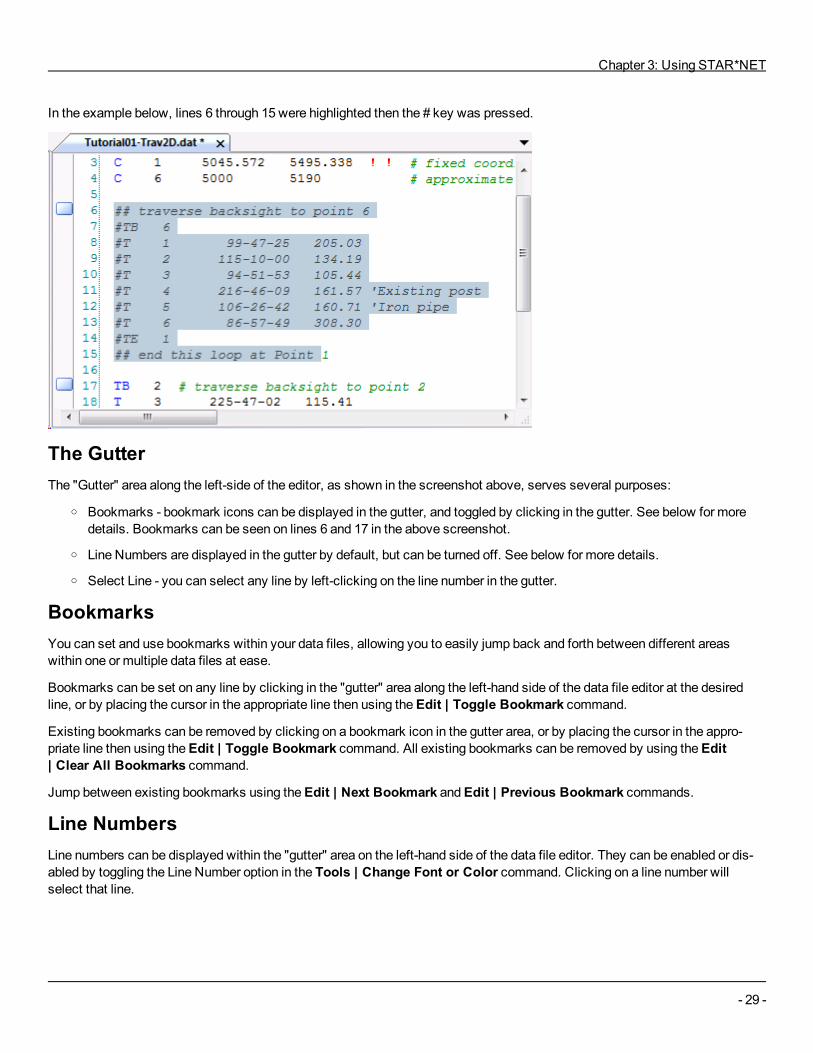
In the example below, lines 6 through 15 were highlighted then the # key was pressed.
The GutterThe "Gutter" area along the left-side of the editor, as shown in the screenshot above, serves several purposes:
o Bookmarks - bookmark icons can be displayed in the gutter, and toggled by clicking in the gutter. See below for moredetails. Bookmarks can be seen on lines 6 and 17 in the above screenshot.
o Line Numbers are displayed in the gutter by default, but can be turned off. See below for more details.
o Select Line - you can select any line by left-clicking on the line number in the gutter.
BookmarksYou can set and use bookmarks within your data files, allowing you to easily jump back and forth between different areaswithin one or multiple data files at ease.
Bookmarks can be set on any line by clicking in the "gutter" area along the left-hand side of the data file editor at the desiredline, or by placing the cursor in the appropriate line then using theEdit | Toggle Bookmark command.
Existing bookmarks can be removed by clicking on a bookmark icon in the gutter area, or by placing the cursor in the appro-priate line then using theEdit | Toggle Bookmark command. All existing bookmarks can be removed by using theEdit| Clear All Bookmarks command.
Jump between existing bookmarks using theEdit | Next Bookmark andEdit | Previous Bookmark commands.
Line NumbersLine numbers can be displayed within the "gutter" area on the left-hand side of the data file editor. They can be enabled or dis-abled by toggling the Line Number option in the Tools | Change Font or Color command. Clicking on a line number willselect that line.
MicroSurvey STAR*NET-LEV ReferenceManual
- 30 -
3.7 SET EXTERNAL EDITORSTAR*NET uses text files as data. Therefore to enter or modify data, you will be using a text editor.
By default STAR*NET will use its own integrated data editor, but if you prefer it can be configured to use any external texteditor application.
Windows Notepad editor is assigned as the default external editor, but you can redefine the default editor be to your own favor-ite text editor:
1. Choose File>Set Editor.
2. In the dialog, type the name of your editor including its full path in the field, or press Browse to select the editor programusing standardWindows file dialogs.
To open a data file with your selected program instead of the internal editor panels, use theEdit External button on theDataInput Files panel.
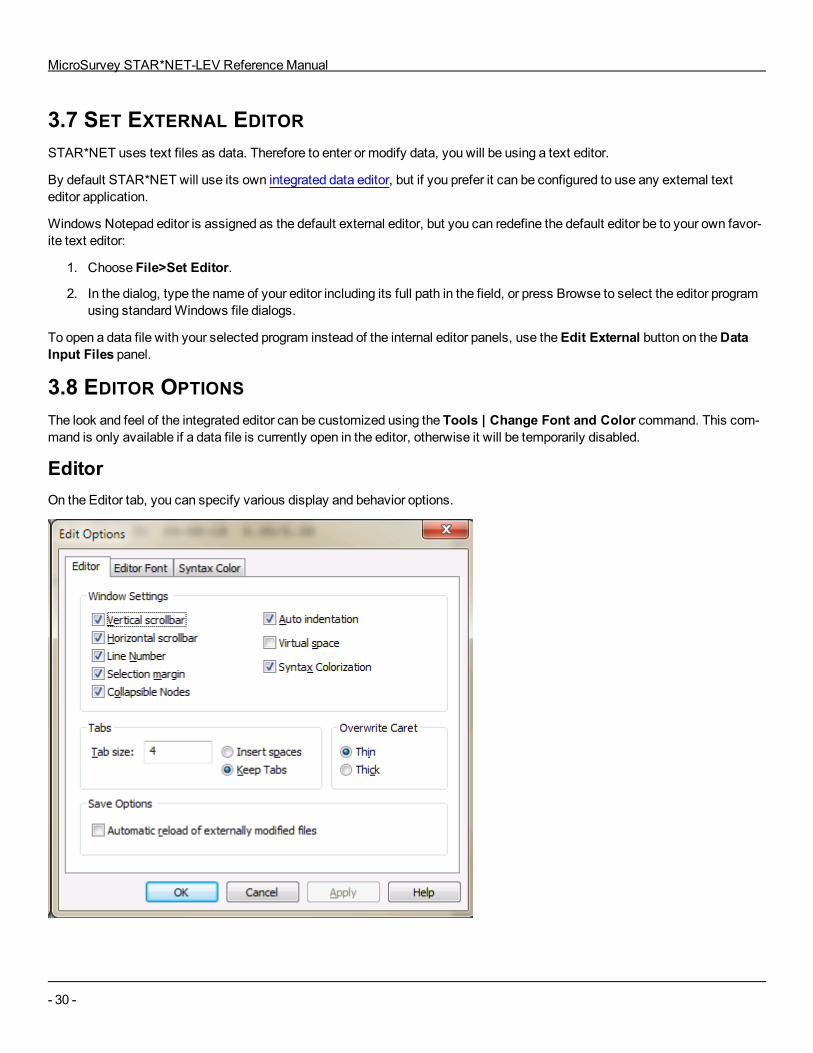
3.8 EDITOR OPTIONSThe look and feel of the integrated editor can be customized using the Tools | Change Font and Color command. This com-mand is only available if a data file is currently open in the editor, otherwise it will be temporarily disabled.
EditorOn the Editor tab, you can specify various display and behavior options.
Chapter 3: Using STAR*NET
- 31 -
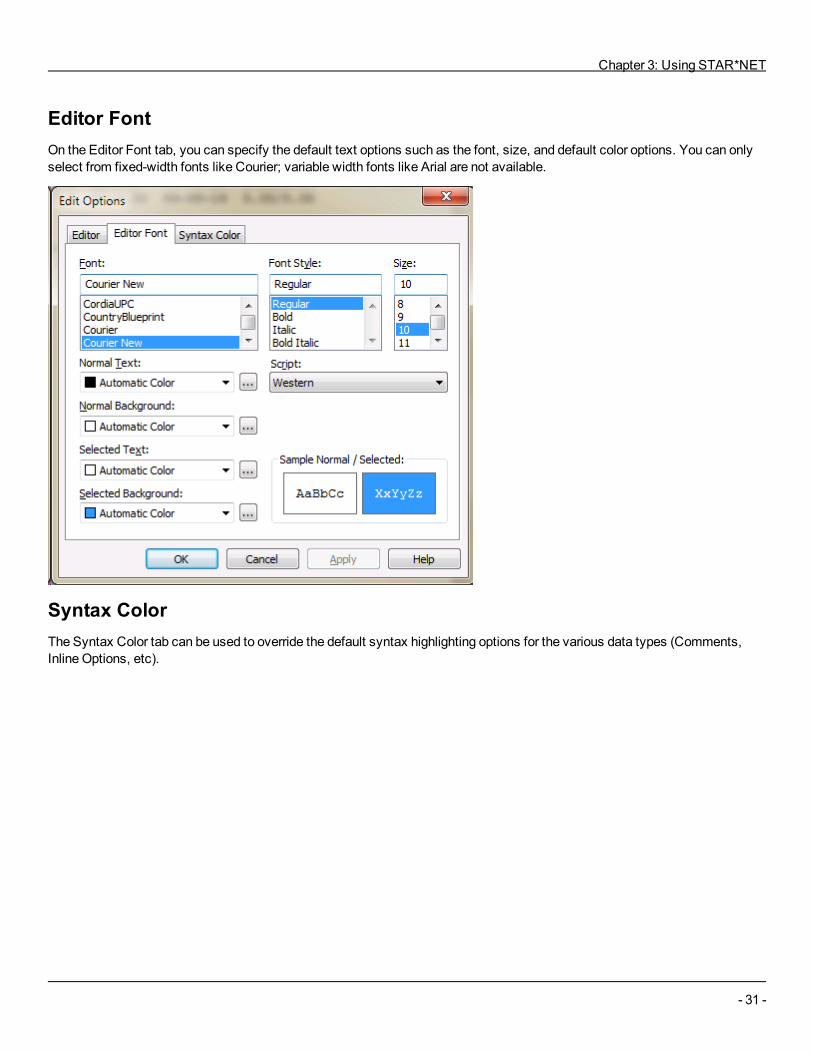
Editor FontOn the Editor Font tab, you can specify the default text options such as the font, size, and default color options. You can onlyselect from fixed-width fonts like Courier; variable width fonts like Arial are not available.
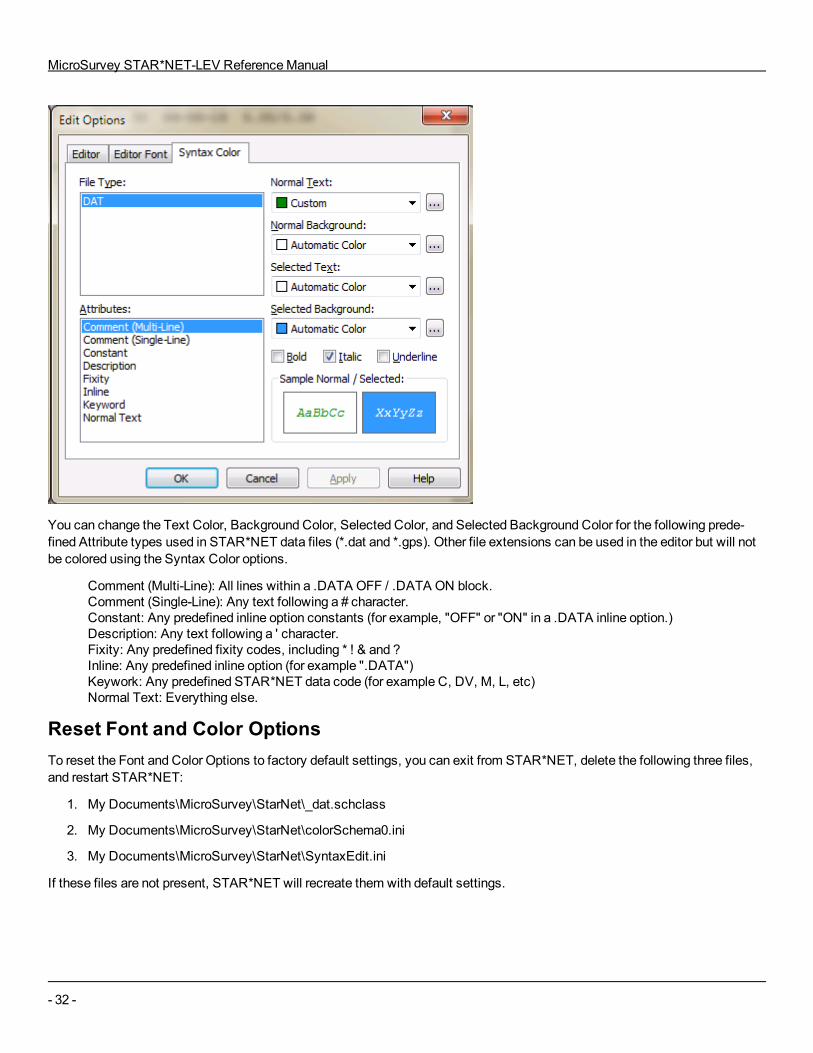
Syntax ColorThe Syntax Color tab can be used to override the default syntax highlighting options for the various data types (Comments,Inline Options, etc).
MicroSurvey STAR*NET-LEV ReferenceManual
- 32 -
You can change the Text Color, Background Color, Selected Color, and Selected Background Color for the following prede-fined Attribute types used in STAR*NET data files (*.dat and *.gps). Other file extensions can be used in the editor but will notbe colored using the Syntax Color options.
Comment (Multi-Line): All lines within a .DATA OFF / .DATA ON block.Comment (Single-Line): Any text following a # character.Constant: Any predefined inline option constants (for example, "OFF" or "ON" in a .DATA inline option.)Description: Any text following a ' character.Fixity: Any predefined fixity codes, including * ! & and ?Inline: Any predefined inline option (for example ".DATA")Keywork: Any predefined STAR*NET data code (for example C, DV, M, L, etc)Normal Text: Everything else.
Reset Font and Color OptionsTo reset the Font and Color Options to factory default settings, you can exit from STAR*NET, delete the following three files,and restart STAR*NET:
1. My Documents\MicroSurvey\StarNet\_dat.schclass
2. My Documents\MicroSurvey\StarNet\colorSchema0.ini
3. My Documents\MicroSurvey\StarNet\SyntaxEdit.ini
If these files are not present, STAR*NET will recreate them with default settings.
Chapter 3: Using STAR*NET
- 33 -
3.9 CUSTOMIZEYourmeans of access to all commands within STAR*NET 7 is customizable using theView | Customize command, as fol-lows:
Commands
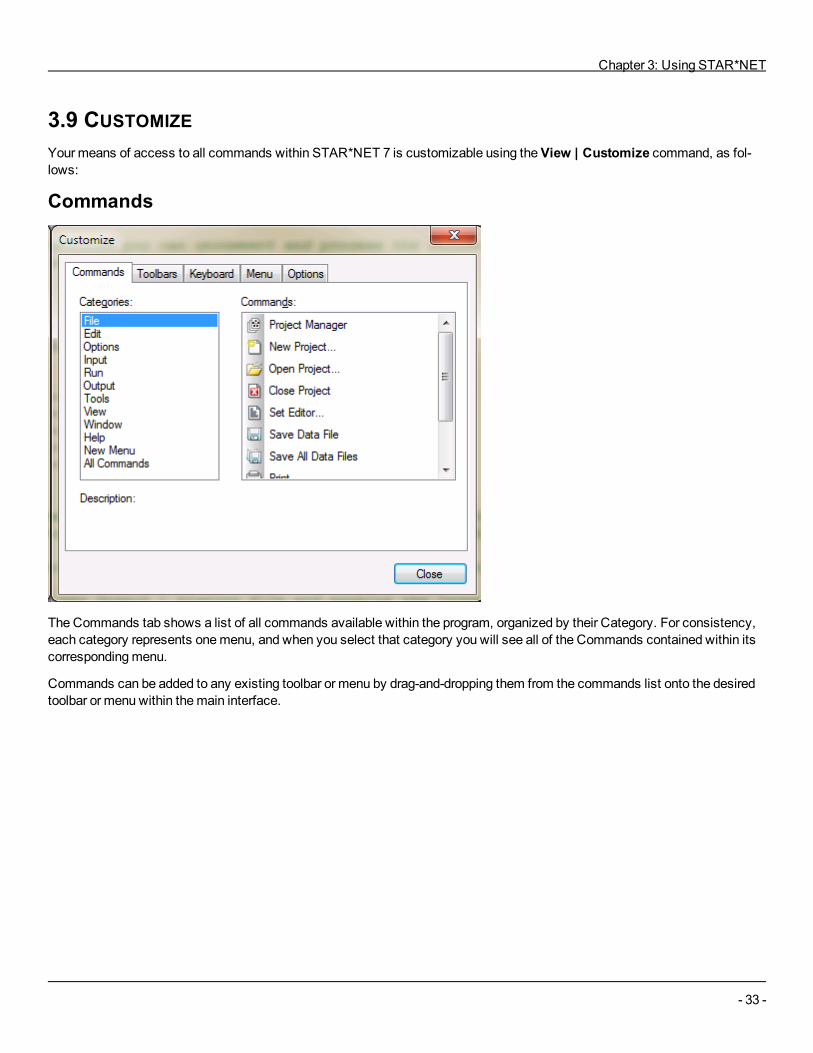
The Commands tab shows a list of all commands available within the program, organized by their Category. For consistency,each category represents onemenu, and when you select that category you will see all of the Commands contained within itscorrespondingmenu.
Commands can be added to any existing toolbar or menu by drag-and-dropping them from the commands list onto the desiredtoolbar or menu within themain interface.
MicroSurvey STAR*NET-LEV ReferenceManual
- 34 -
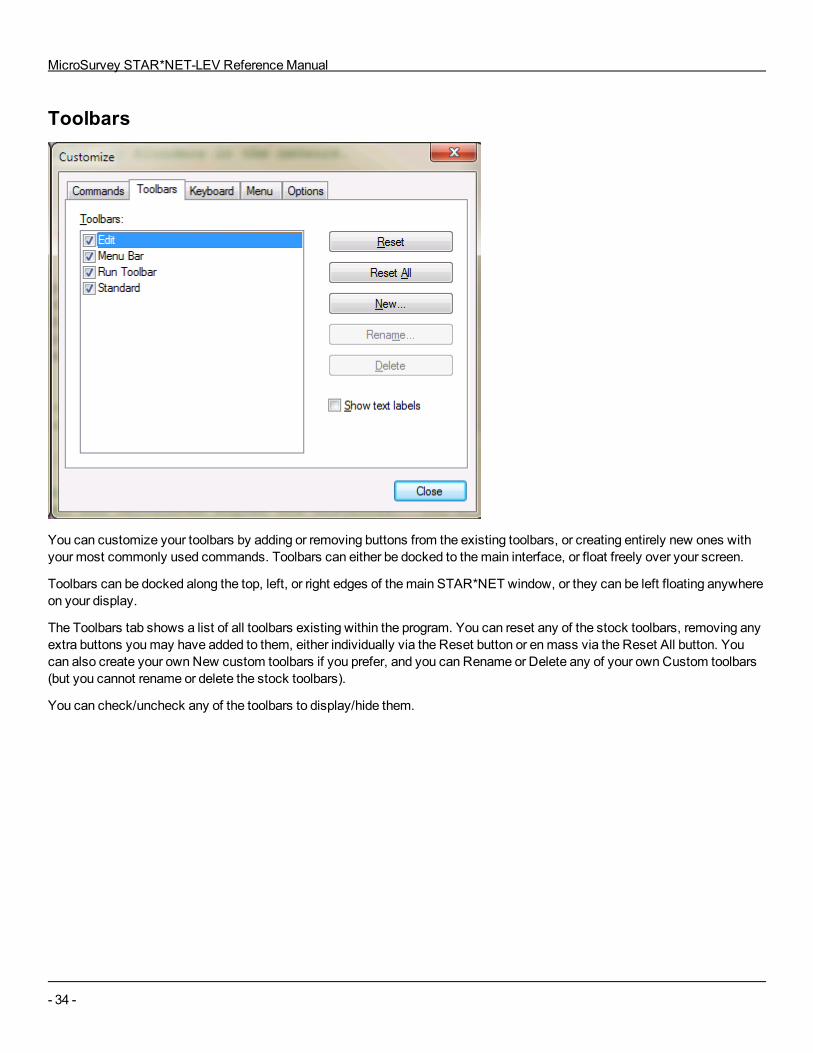
Toolbars
You can customize your toolbars by adding or removing buttons from the existing toolbars, or creating entirely new ones withyour most commonly used commands. Toolbars can either be docked to themain interface, or float freely over your screen.
Toolbars can be docked along the top, left, or right edges of themain STAR*NET window, or they can be left floating anywhereon your display.
The Toolbars tab shows a list of all toolbars existing within the program. You can reset any of the stock toolbars, removing anyextra buttons youmay have added to them, either individually via the Reset button or enmass via the Reset All button. Youcan also create your ownNew custom toolbars if you prefer, and you can Rename or Delete any of your ownCustom toolbars(but you cannot rename or delete the stock toolbars).
You can check/uncheck any of the toolbars to display/hide them.
Chapter 3: Using STAR*NET
- 35 -
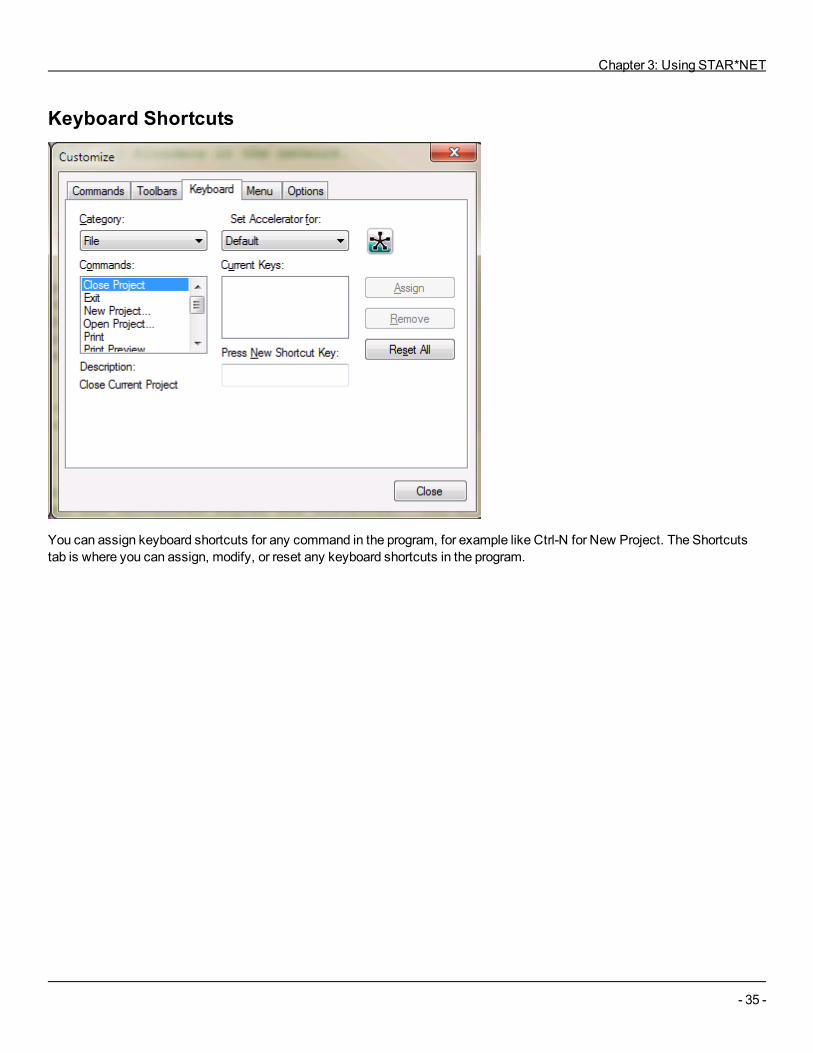
Keyboard Shortcuts
You can assign keyboard shortcuts for any command in the program, for example like Ctrl-N for New Project. The Shortcutstab is where you can assign, modify, or reset any keyboard shortcuts in the program.
MicroSurvey STAR*NET-LEV ReferenceManual
- 36 -
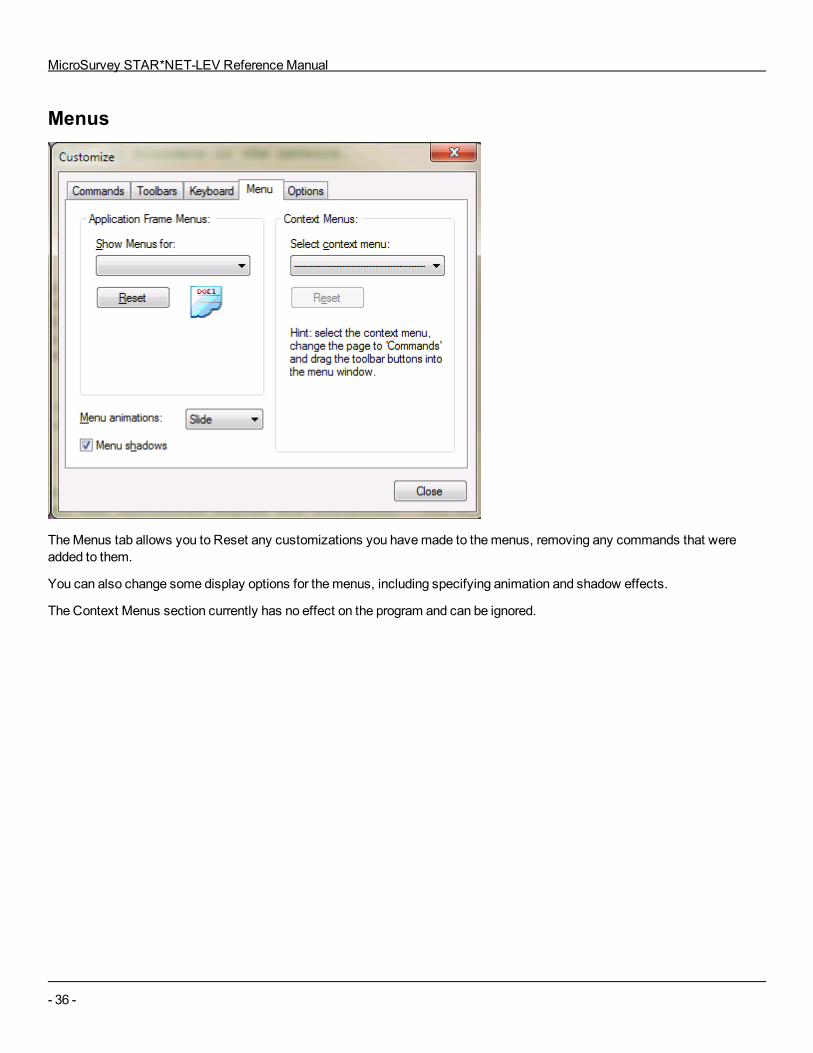
Menus
TheMenus tab allows you to Reset any customizations you havemade to themenus, removing any commands that wereadded to them.
You can also change some display options for themenus, including specifying animation and shadow effects.
The Context Menus section currently has no effect on the program and can be ignored.
Chapter 3: Using STAR*NET
- 37 -
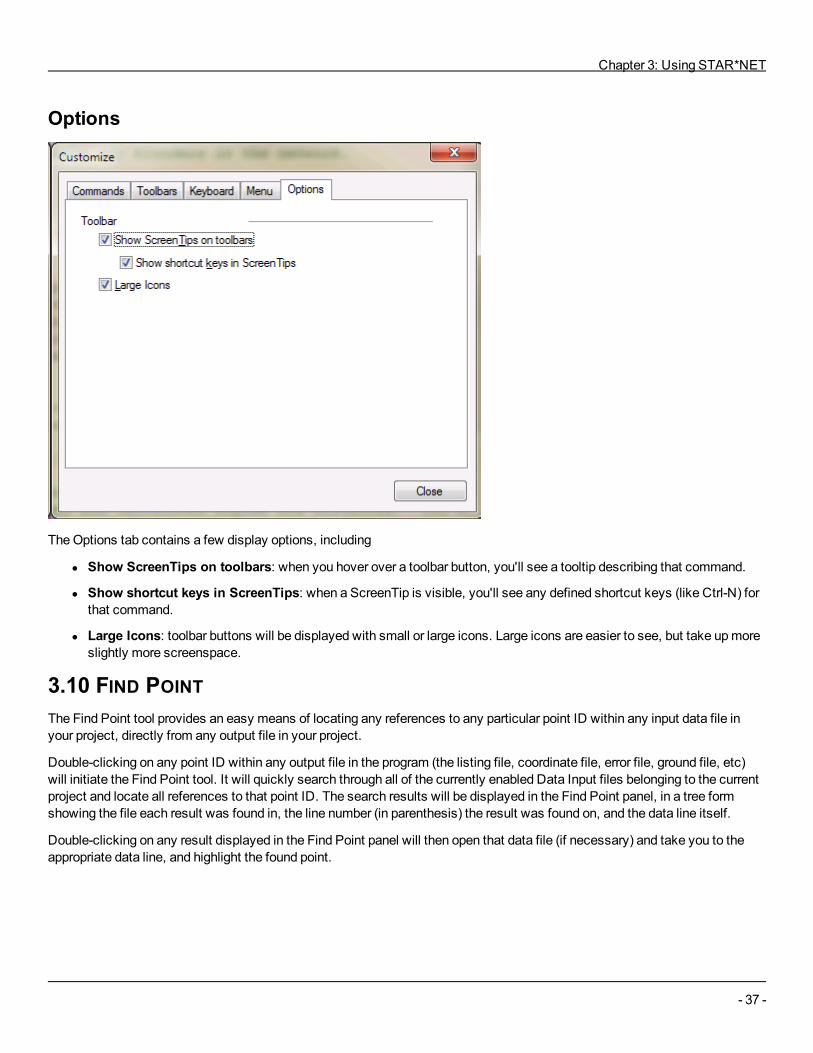
Options
TheOptions tab contains a few display options, including
l Show ScreenTips on toolbars: when you hover over a toolbar button, you'll see a tooltip describing that command.
l Show shortcut keys in ScreenTips: when a ScreenTip is visible, you'll see any defined shortcut keys (like Ctrl-N) forthat command.
l Large Icons: toolbar buttons will be displayed with small or large icons. Large icons are easier to see, but take upmoreslightly more screenspace.
3.10 FIND POINTThe Find Point tool provides an easy means of locating any references to any particular point ID within any input data file inyour project, directly from any output file in your project.
Double-clicking on any point ID within any output file in the program (the listing file, coordinate file, error file, ground file, etc)will initiate the Find Point tool. It will quickly search through all of the currently enabled Data Input files belonging to the currentproject and locate all references to that point ID. The search results will be displayed in the Find Point panel, in a tree formshowing the file each result was found in, the line number (in parenthesis) the result was found on, and the data line itself.
Double-clicking on any result displayed in the Find Point panel will then open that data file (if necessary) and take you to theappropriate data line, and highlight the found point.
MicroSurvey STAR*NET-LEV ReferenceManual
- 38 -
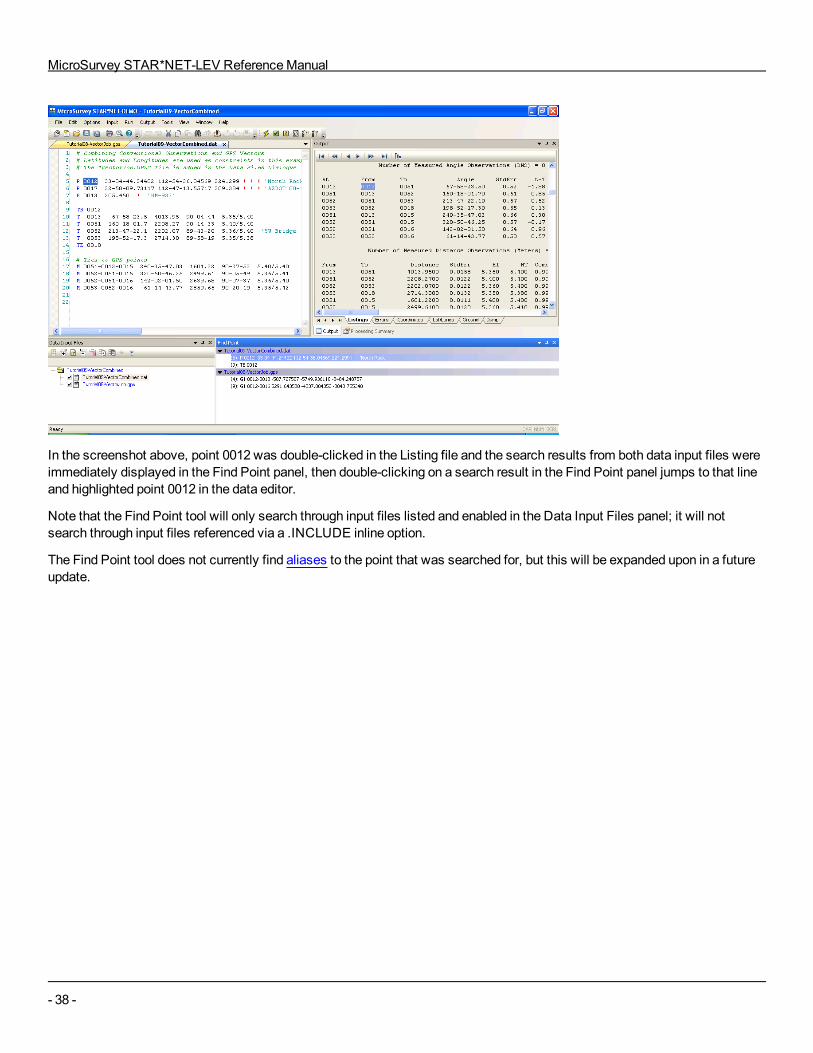
In the screenshot above, point 0012 was double-clicked in the Listing file and the search results from both data input files wereimmediately displayed in the Find Point panel, then double-clicking on a search result in the Find Point panel jumps to that lineand highlighted point 0012 in the data editor.
Note that the Find Point tool will only search through input files listed and enabled in the Data Input Files panel; it will notsearch through input files referenced via a .INCLUDE inline option.
The Find Point tool does not currently find aliases to the point that was searched for, but this will be expanded upon in a futureupdate.
Chapter 4: OPTIONS
- 39 -
CHAPTER 4: OPTIONS4.1 OVERVIEW
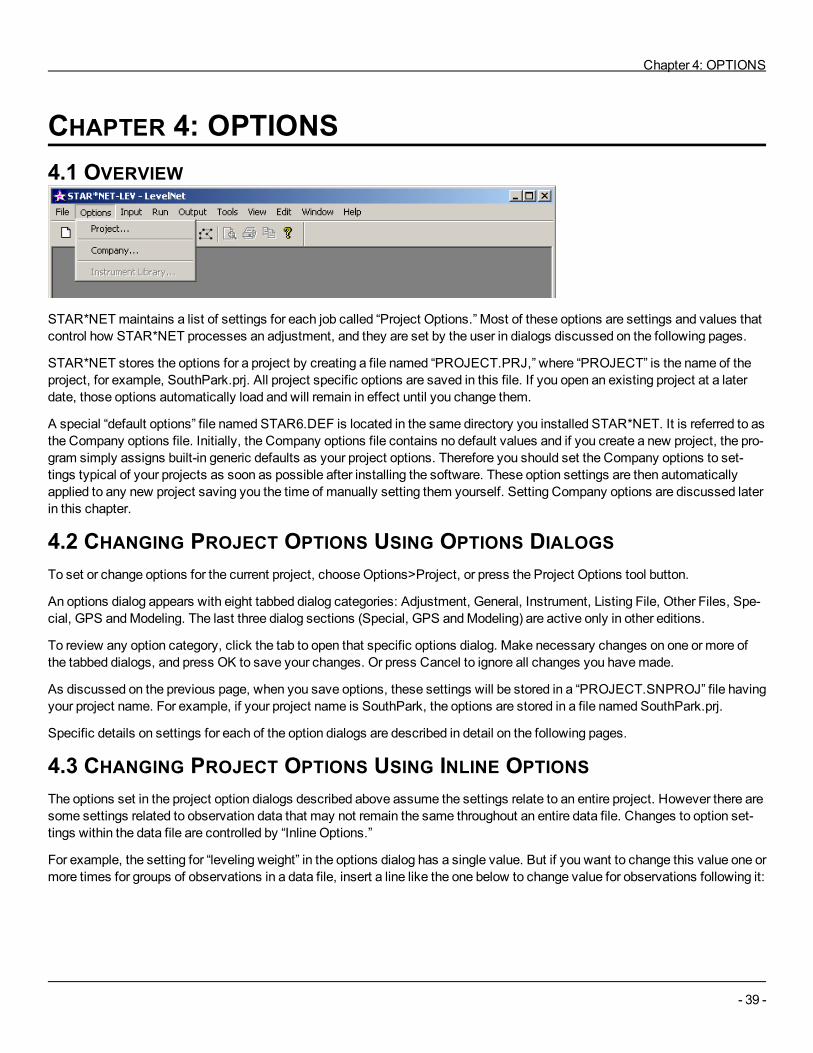
STAR*NETmaintains a list of settings for each job called “Project Options.” Most of these options are settings and values thatcontrol how STAR*NET processes an adjustment, and they are set by the user in dialogs discussed on the following pages.
STAR*NET stores the options for a project by creating a file named “PROJECT.PRJ,” where “PROJECT” is the name of theproject, for example, SouthPark.prj. All project specific options are saved in this file. If you open an existing project at a laterdate, those options automatically load and will remain in effect until you change them.
A special “default options” file named STAR6.DEF is located in the same directory you installed STAR*NET. It is referred to asthe Company options file. Initially, the Company options file contains no default values and if you create a new project, the pro-gram simply assigns built-in generic defaults as your project options. Therefore you should set the Company options to set-tings typical of your projects as soon as possible after installing the software. These option settings are then automaticallyapplied to any new project saving you the time of manually setting them yourself. Setting Company options are discussed laterin this chapter.
4.2 CHANGING PROJECT OPTIONS USING OPTIONS DIALOGSTo set or change options for the current project, chooseOptions>Project, or press the Project Options tool button.
An options dialog appears with eight tabbed dialog categories: Adjustment, General, Instrument, Listing File, Other Files, Spe-cial, GPS andModeling. The last three dialog sections (Special, GPS andModeling) are active only in other editions.
To review any option category, click the tab to open that specific options dialog. Make necessary changes on one or more ofthe tabbed dialogs, and press OK to save your changes. Or press Cancel to ignore all changes you havemade.
As discussed on the previous page, when you save options, these settings will be stored in a “PROJECT.SNPROJ” file havingyour project name. For example, if your project name is SouthPark, the options are stored in a file named SouthPark.prj.
Specific details on settings for each of the option dialogs are described in detail on the following pages.
4.3 CHANGING PROJECT OPTIONS USING INLINE OPTIONSThe options set in the project option dialogs described above assume the settings relate to an entire project. However there aresome settings related to observation data that may not remain the same throughout an entire data file. Changes to option set-tings within the data file are controlled by “Inline Options.”
For example, the setting for “leveling weight” in the options dialog has a single value. But if you want to change this value one ormore times for groups of observations in a data file, insert a line like the one below to change value for observations following it:
MicroSurvey STAR*NET-LEV ReferenceManual
- 40 -
.LWEIGHT 0.05
These “inline” options give you added flexibility – you are not tied down just to option settings in the option dialogs. “Inlines”allow you to change units anywhere in your data, change weighting groups of observations andmore.
Some of these inline options arementioned in the descriptions of the project option dialog settings on the following pages.Since these inline options are entered right in your data files, their full descriptions along with examples are discussed in Chap-ter 5, “Preparing Data,” in a section named “Using Inline Options.”
4.4 SETTING PROJECT OPTIONS (LEV EDITION)To set options for your project, chooseOptions>Project, or press the Project Options tool button. Use the tabbed dialog tochange settings in the several categories and press OK to save. The following pages describe all option settings in detail.
For the STAR*NET-LEV edition, the remaining three sections in the Project Options dialog (Special, GPS andModeling) arenot active as they currently relate only to data types and options available in the Standard, PLUS and PRO editions.
Adjustment Options (LEV Edition)
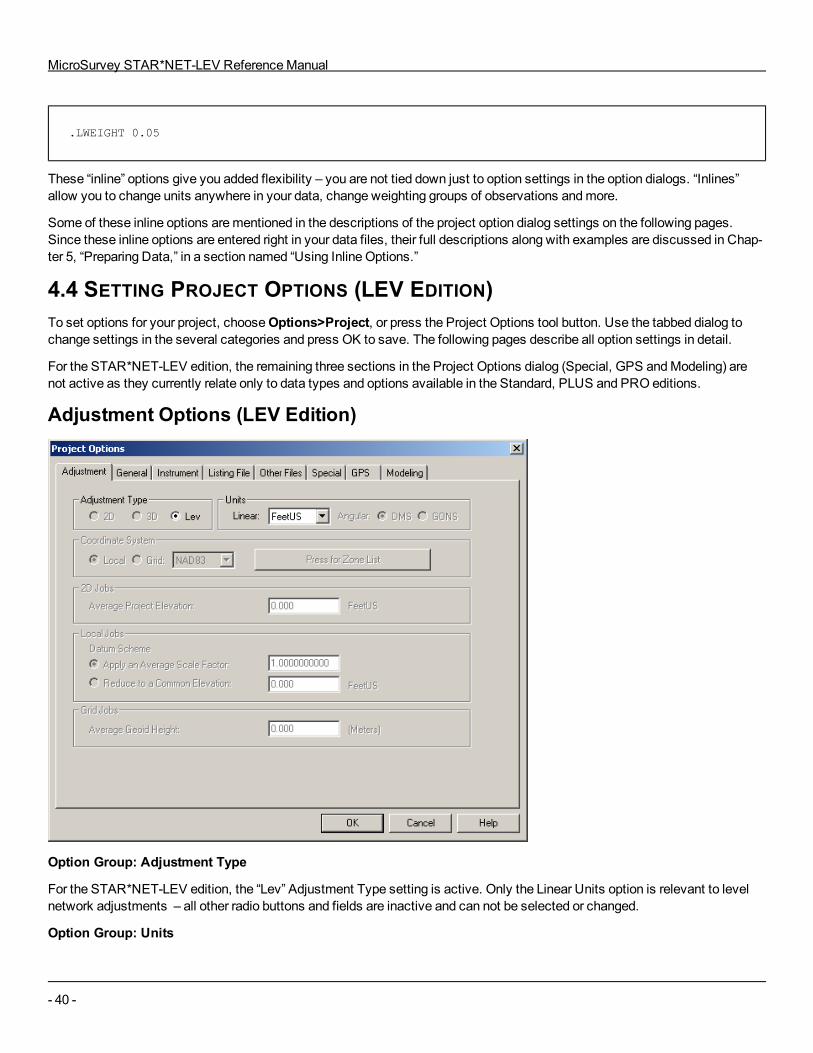
Option Group: Adjustment Type
For the STAR*NET-LEV edition, the “Lev” Adjustment Type setting is active. Only the Linear Units option is relevant to levelnetwork adjustments – all other radio buttons and fields are inactive and can not be selected or changed.
Option Group: Units
Chapter 4: OPTIONS
- 41 -
Select the linear units for your level network project from the dropdown selection list. Adjustment results are always publishedusing the selected units. By default, your input data is assumed to be entered in these units.
An inline “.UNITS” option, however, may be used in your data to allow entry of measurements in other units. Measurementsentered in these alternate units are automatically converted to the units set for the project during the run.
General Options (LEV Edition)
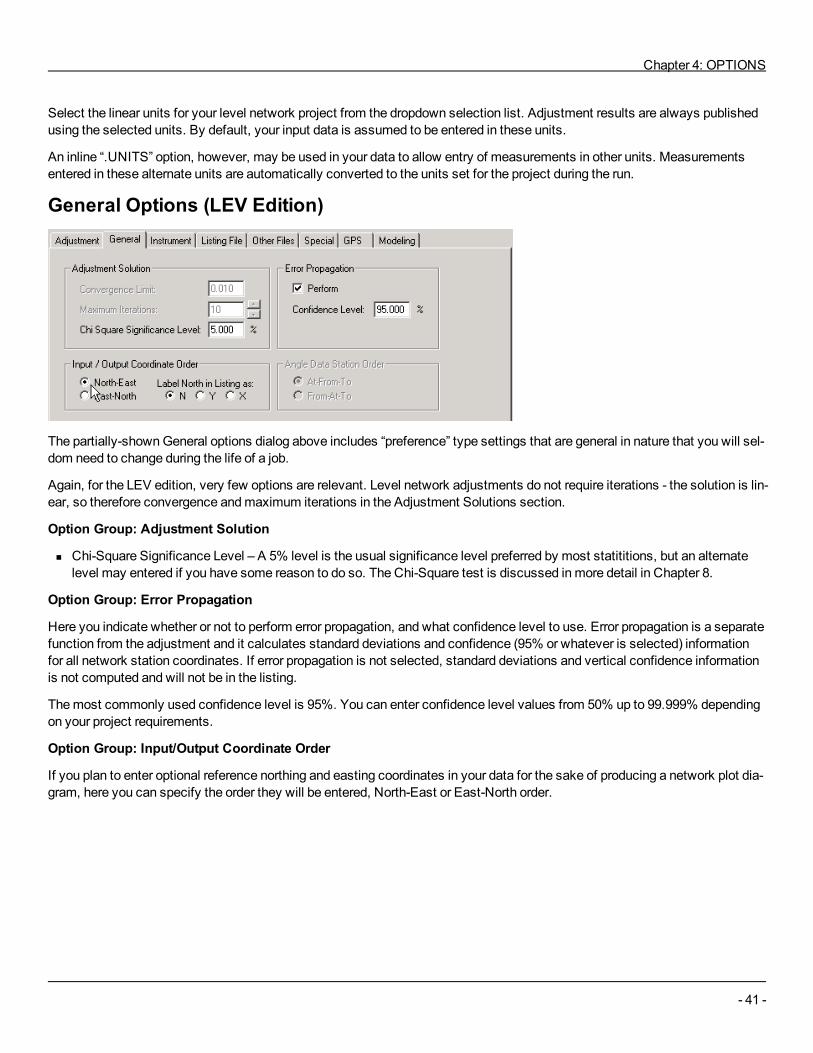
The partially-shownGeneral options dialog above includes “preference” type settings that are general in nature that you will sel-dom need to change during the life of a job.
Again, for the LEV edition, very few options are relevant. Level network adjustments do not require iterations - the solution is lin-ear, so therefore convergence andmaximum iterations in the Adjustment Solutions section.
Option Group: Adjustment Solution
n Chi-Square Significance Level – A 5% level is the usual significance level preferred by most statititions, but an alternatelevel may entered if you have some reason to do so. The Chi-Square test is discussed inmore detail in Chapter 8.
Option Group: Error Propagation
Here you indicate whether or not to perform error propagation, and what confidence level to use. Error propagation is a separatefunction from the adjustment and it calculates standard deviations and confidence (95% or whatever is selected) informationfor all network station coordinates. If error propagation is not selected, standard deviations and vertical confidence informationis not computed and will not be in the listing.
Themost commonly used confidence level is 95%. You can enter confidence level values from 50% up to 99.999% dependingon your project requirements.
Option Group: Input/Output Coordinate Order
If you plan to enter optional reference northing and easting coordinates in your data for the sake of producing a network plot dia-gram, here you can specify the order they will be entered, North-East or East-North order.
MicroSurvey STAR*NET-LEV ReferenceManual
- 42 -
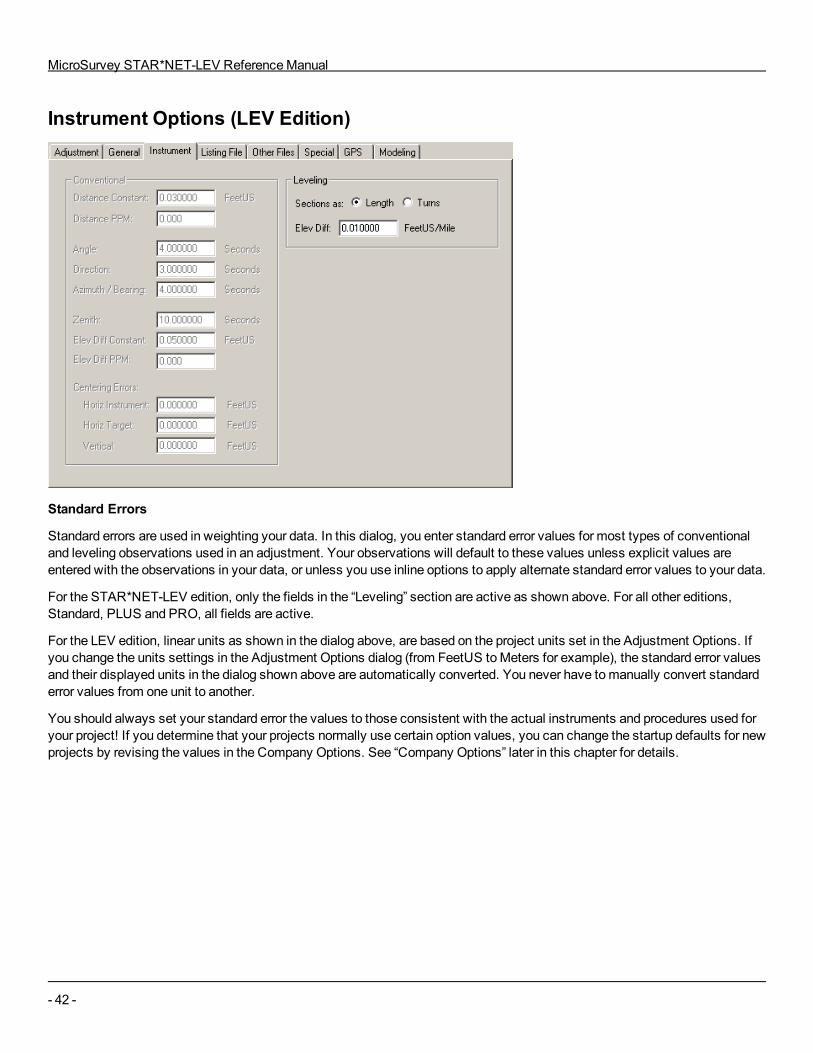
Instrument Options (LEV Edition)
Standard Errors
Standard errors are used in weighting your data. In this dialog, you enter standard error values for most types of conventionaland leveling observations used in an adjustment. Your observations will default to these values unless explicit values areentered with the observations in your data, or unless you use inline options to apply alternate standard error values to your data.
For the STAR*NET-LEV edition, only the fields in the “Leveling” section are active as shown above. For all other editions,Standard, PLUS and PRO, all fields are active.
For the LEV edition, linear units as shown in the dialog above, are based on the project units set in the Adjustment Options. Ifyou change the units settings in the Adjustment Options dialog (from FeetUS toMeters for example), the standard error valuesand their displayed units in the dialog shown above are automatically converted. You never have tomanually convert standarderror values from one unit to another.
You should always set your standard error the values to those consistent with the actual instruments and procedures used foryour project! If you determine that your projects normally use certain option values, you can change the startup defaults for newprojects by revising the values in the Company Options. See “Company Options” later in this chapter for details.

Chapter 4: OPTIONS
- 43 -
Listing File Options (LEV Edition)
These setting allow you to control the contents and appearance of your listing file that results from an adjustment. With all thecontents settings unchecked, aminimum sized listing will be produced. But even with all contents items selected, some sec-tions will be listed only if applicable to a particular kind of run.
For the STAR*NET-LEV edition, only the fields relevant to level networks are active as shown above. For all other editions,Standard, PLUS and PRO, all fields are active.
Option Group: Unadjusted Contents
n Network Observations –When selected, all unadjusted network observation data will be listed in the output listing file. Thisis an organized review of all your input data, sorted by data type. Although this sectionmay be turned off to shorten the list-ing file, it is a highly recommended part of any output adjustment report.
n Copy of Input Data File(s) –When selected, an exact copy of your input data file or files will be copied to your output listingfile. Including this section in your listing greatly increases its length and therefore for normal runs, you will probably notwant to include it. However, in certain cases, it can be very useful for creating a complete history of an adjustment projectincluding a listing of all original field observation input data along with the final results.
Option Group: Adjusted Contents
n Observations and Residuals –When selected, adjusted observations, residuals, the standard errors and standardizedresiduals will be shown in the listing file. This is a tabulation of all adjusted observations, organized by the type of obser-vation. Although this sectionmay be turned off to shorten the output listing file, it is an important part of any final report andnormally should be included because it clearly shows how much each observation was changed in the adjustment proc-ess.
n Coordinates –When this item is selected, final adjusted elevations will be listed in the output listing file. When the pres-ence of these values in the listing file is not important, this option can be unchecked to reduce the size of the listing file.
MicroSurvey STAR*NET-LEV ReferenceManual
- 44 -
n Station Standard Deviations and Station Error Ellipses –When selected, computed elevation standard deviations and/orelevation vertical confidence values respectively are included in the listing when error propagation is performed.
n Coordinate Changes from Entered Provisionals –When selected, a tabulation of the differences between hand-entered pro-visional elevations and the final adjusted elevations is included in your listing. This is particularly useful in deformationstudies when you are trying to determine themovement of specific stations since the previous survey was performed.Only those stations that have explicitly hand-entered provisional elevations are listed in this section - not those stationswhose approximate elevations are computed by the program.
Option Group: Conventional and Leveling Observations Appearance
n Show Extended Linear Precision – By default, the number of decimal places shown for linear values in the listing is set toshow adequate precision for normal leveling observations. (For example, 4 places for elevations, distances, standarderrors and residuals.)When this option is selected, 2 additional places of precision are shown for most linear items. Thisoption satisfies a certain group of users who record leveling observations using very high precisionmeasuring equipment.
n Sort Coordinates by – You can select to have elevations shown in the output listing shown in the same order the pointswere first found in the input data, or sorted by point name. Requesting that elevations be sorted by name also causes sort-ing in the other output files selected in the “Other Files” options dialog.
n Sort Unadjusted Input Observations by – Likewise, you can select whether to have the review of unadjusted input shownin the same order as originally found in the input data, or sorted by their point names. When sorted, data is sorted first bythe instrument name, then followed by the target name.
n Sort Adjusted Observations and Residuals by – Just as with unadjusted observations, the adjusted observations may beshown in the same order as originally found in the data, or sorted by point names. In addition, adjusted observations maybe sorted by the size of their residuals which in some cases may be helpful while debugging a network adjustment.
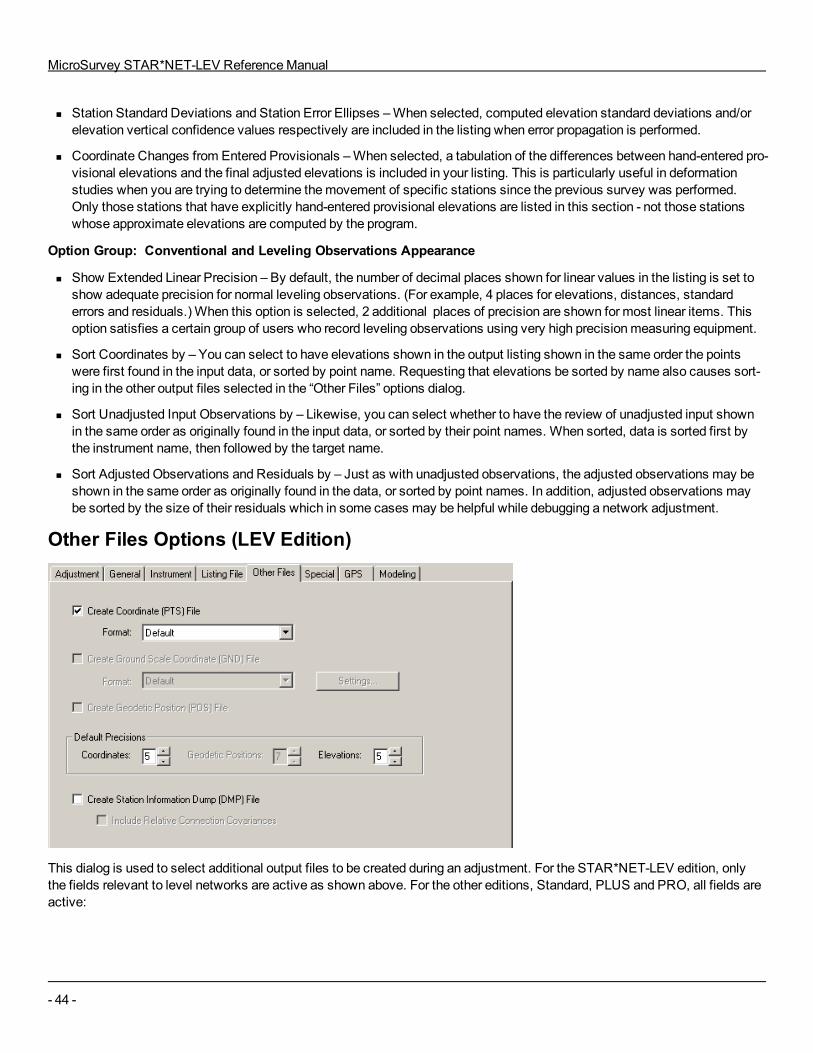
Other Files Options (LEV Edition)
This dialog is used to select additional output files to be created during an adjustment. For the STAR*NET-LEV edition, onlythe fields relevant to level networks are active as shown above. For the other editions, Standard, PLUS and PRO, all fields areactive:
Chapter 4: OPTIONS
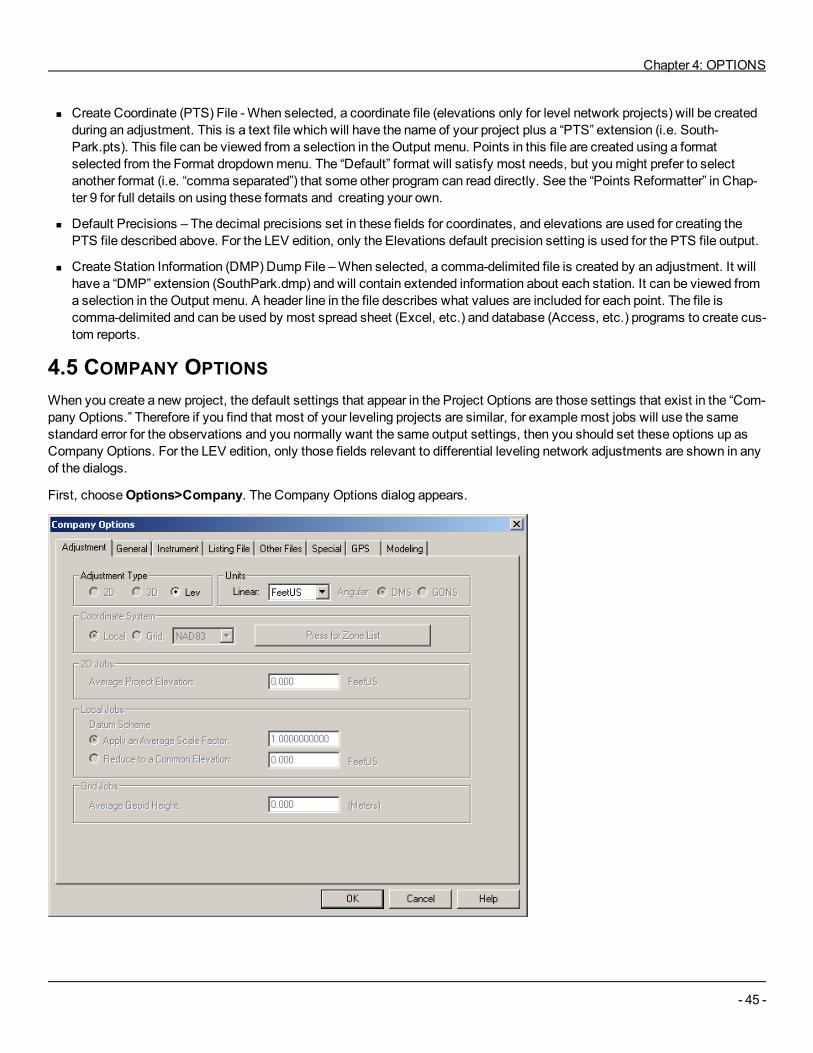
- 45 -
n Create Coordinate (PTS) File -When selected, a coordinate file (elevations only for level network projects) will be createdduring an adjustment. This is a text file which will have the name of your project plus a “PTS” extension (i.e. South-Park.pts). This file can be viewed from a selection in the Output menu. Points in this file are created using a formatselected from the Format dropdownmenu. The “Default” format will satisfy most needs, but youmight prefer to selectanother format (i.e. “comma separated”) that some other program can read directly. See the “Points Reformatter” in Chap-ter 9 for full details on using these formats and creating your own.
n Default Precisions – The decimal precisions set in these fields for coordinates, and elevations are used for creating thePTS file described above. For the LEV edition, only the Elevations default precision setting is used for the PTS file output.
n Create Station Information (DMP) Dump File –When selected, a comma-delimited file is created by an adjustment. It willhave a “DMP” extension (SouthPark.dmp) and will contain extended information about each station. It can be viewed froma selection in the Output menu. A header line in the file describes what values are included for each point. The file iscomma-delimited and can be used by most spread sheet (Excel, etc.) and database (Access, etc.) programs to create cus-tom reports.
4.5 COMPANY OPTIONSWhen you create a new project, the default settings that appear in the Project Options are those settings that exist in the “Com-pany Options.” Therefore if you find that most of your leveling projects are similar, for examplemost jobs will use the samestandard error for the observations and you normally want the same output settings, then you should set these options up asCompany Options. For the LEV edition, only those fields relevant to differential leveling network adjustments are shown in anyof the dialogs.
First, chooseOptions>Company. The Company Options dialog appears.

MicroSurvey STAR*NET-LEV ReferenceManual
- 46 -
Then, change settings in all of the options dialogs to those settings most commonly used for your typical leveling jobs, andpress OK to save.
Company Options are stored in the file STARNET.DEF located the STAR*NET system directory. Whenever you create a newproject, this file is automatically read to initialize the Project Options settings for the new project, saving you the time to do ityourself. Then, after that, you can fine-tune the settings using the Project Options dialogs when required.
The Company Options default settings can be changed as often as you wish. Just remember that changing default settings inthe Company Options only affects initial defaults assigned to new projects being created. Existing projects are not affected!
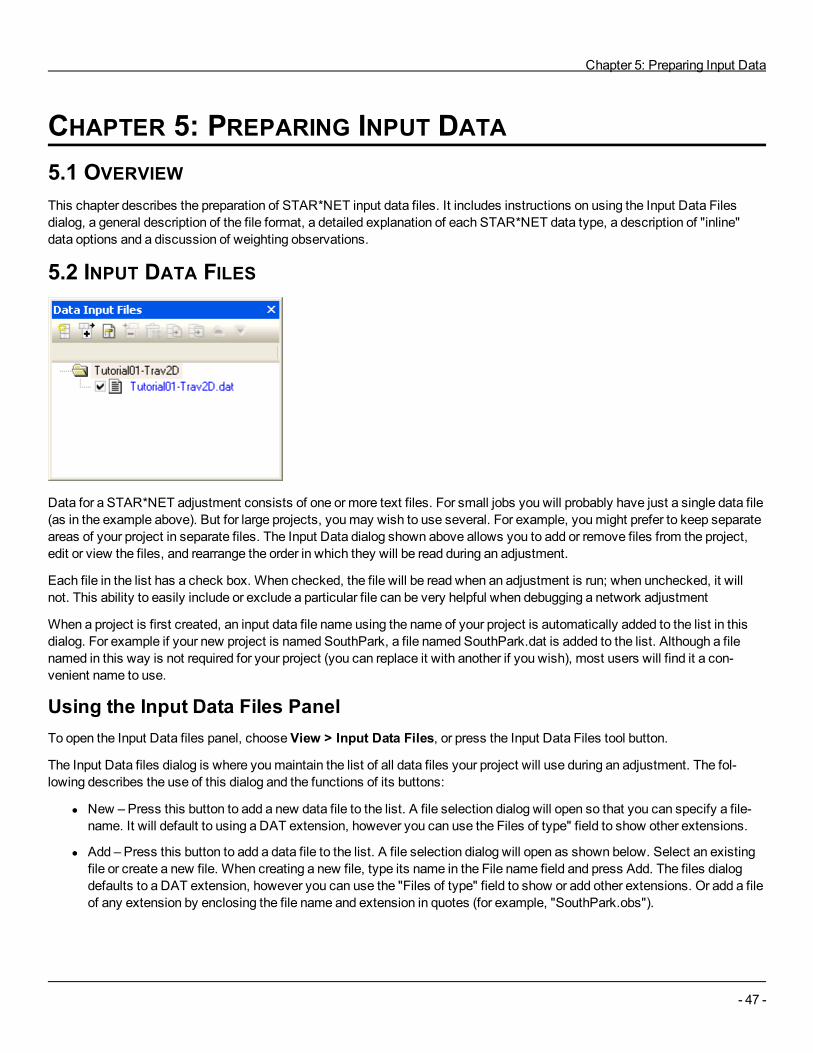
Chapter 5: Preparing Input Data
- 47 -
CHAPTER 5: PREPARING INPUT DATA5.1 OVERVIEWThis chapter describes the preparation of STAR*NET input data files. It includes instructions on using the Input Data Filesdialog, a general description of the file format, a detailed explanation of each STAR*NET data type, a description of "inline"data options and a discussion of weighting observations.
5.2 INPUT DATA FILES
Data for a STAR*NET adjustment consists of one or more text files. For small jobs you will probably have just a single data file(as in the example above). But for large projects, youmay wish to use several. For example, youmight prefer to keep separateareas of your project in separate files. The Input Data dialog shown above allows you to add or remove files from the project,edit or view the files, and rearrange the order in which they will be read during an adjustment.
Each file in the list has a check box. When checked, the file will be read when an adjustment is run; when unchecked, it willnot. This ability to easily include or exclude a particular file can be very helpful when debugging a network adjustment
When a project is first created, an input data file name using the name of your project is automatically added to the list in thisdialog. For example if your new project is named SouthPark, a file named SouthPark.dat is added to the list. Although a filenamed in this way is not required for your project (you can replace it with another if you wish), most users will find it a con-venient name to use.
Using the Input Data Files PanelTo open the Input Data files panel, chooseView > Input Data Files, or press the Input Data Files tool button.
The Input Data files dialog is where youmaintain the list of all data files your project will use during an adjustment. The fol-lowing describes the use of this dialog and the functions of its buttons:
l New – Press this button to add a new data file to the list. A file selection dialog will open so that you can specify a file-name. It will default to using a DAT extension, however you can use the Files of type" field to show other extensions.
l Add – Press this button to add a data file to the list. A file selection dialog will open as shown below. Select an existingfile or create a new file. When creating a new file, type its name in the File name field and press Add. The files dialogdefaults to a DAT extension, however you can use the "Files of type" field to show or add other extensions. Or add a fileof any extension by enclosing the file name and extension in quotes (for example, "SouthPark.obs").
MicroSurvey STAR*NET-LEV ReferenceManual
- 48 -
l Import GPS Vectors – Press this to open theGPS Vector Importer which you can use to import various baseline for-mats into a new or existing data file.
l Remove – Press to remove one or more highlighted files from the list. Files are not deleted from your computer system,just removed from the list.
l Delete – Press to delete one or more highlighted files from the list. Files are completely deleted from your computer sys-tem.
l Edit – Press to view a highlighted file in the internal editor.
l Edit Externally – Press to edit a highlighted file, or simply double-click the file in the list. Note that you can quickly editthe currently highlighted file without even opening the data files dialog! Just right-click the Input Data Files tool button.(The tool tip for that button shows the "current" file name.)
l Up/Down –When two or more files exists in the list, you canmove a file name to a new position. Highlight the file andpress Up or Down to change its position. The order the files appear is the order they are read when you run an adjust-ment.
5.3 AN OVERVIEW OF STAR*NET DATA FILESSTAR*NET input data files are relatively free in format. Generally, lines begin with a one or two character code identifying thetype of data, followed by the station names and actual observations. These data elements do not have fixed positions on a line,but they must appear in the proper order.
Youmay insert comment lines anywhere in the file using the "#" symbol. Anything following the "#" on a line is interpreted as acomment, and is ignored. We highly recommend that you add notes and comments to your data files documenting survey data,field conditions, or any unusual situations that may prove valuable later. Tomany users, comments added to their data filesbecome part of an historical document.
Input data files are standard text (ASCII) files that can be created with a text editor, either inside the STAR*NET program orexternal to the program.
Data files might also be generated as output from some another program, such as a third party COGO program or a data col-lector routine. MicroSurvey Software Inc., for example, supplies several utility programs that convert raw data collector fieldfiles to files formatted for STAR*NET use. And certain large companies and public organizations have written their own dataconverter utilities based on the way their surveyors collect field data and how they wish to use that data in the STAR*NET pro-gram.
Data lines may be up to 500 characters long.
Blank lines can be placed anywhere in the file. You can use spaces and tabs to align the data items if you wish. Comments,beginning with "#" characters, can be freely entered, both as separate lines, and attached to the ends of data lines.
5.4 NAMING DATA FILESFile dialogs have been designed in STAR*NET to expect, by default, that input data files will have a DAT extension. This is adescriptive extension which is very easy to distinguish from all other file types.
However, the use of DAT as an extension is not required. For example, in the "Professional" edition, a GPS extension is usedwhen adding GPS vector data to the data file list. Although it is recommended that observations be created in data files usingthe DAT extension so that you can use default file types built into the dialogs, any extensionmay be used as long as it is notone of the several reserved output file extensions automatically used by the program when creating output files.
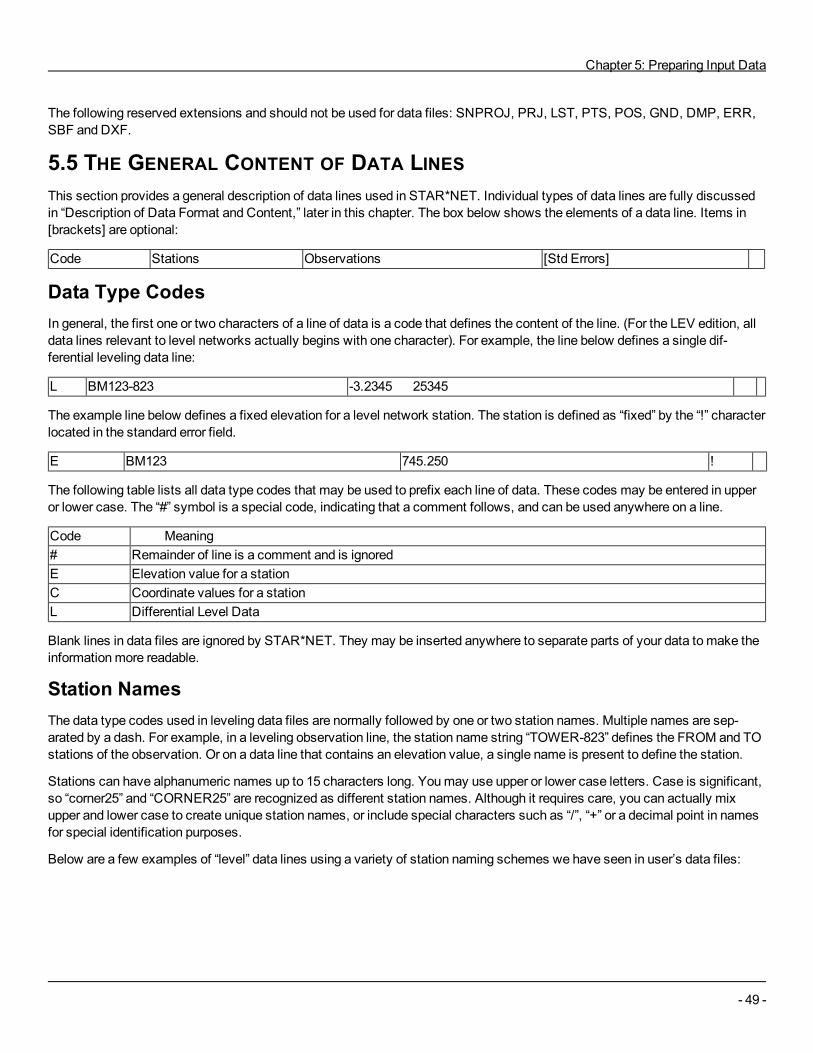
Chapter 5: Preparing Input Data
- 49 -
The following reserved extensions and should not be used for data files: SNPROJ, PRJ, LST, PTS, POS, GND, DMP, ERR,SBF and DXF.
5.5 THE GENERAL CONTENT OF DATA LINESThis section provides a general description of data lines used in STAR*NET. Individual types of data lines are fully discussedin “Description of Data Format and Content,” later in this chapter. The box below shows the elements of a data line. Items in[brackets] are optional:
Code Stations Observations [Std Errors]
Data Type CodesIn general, the first one or two characters of a line of data is a code that defines the content of the line. (For the LEV edition, alldata lines relevant to level networks actually begins with one character). For example, the line below defines a single dif-ferential leveling data line:
L BM123-823 -3.2345 25345
The example line below defines a fixed elevation for a level network station. The station is defined as “fixed” by the “!” characterlocated in the standard error field.
E BM123 745.250 !
The following table lists all data type codes that may be used to prefix each line of data. These codes may be entered in upperor lower case. The “#” symbol is a special code, indicating that a comment follows, and can be used anywhere on a line.
Code Meaning# Remainder of line is a comment and is ignoredE Elevation value for a stationC Coordinate values for a stationL Differential Level Data
Blank lines in data files are ignored by STAR*NET. They may be inserted anywhere to separate parts of your data tomake theinformationmore readable.
Station NamesThe data type codes used in leveling data files are normally followed by one or two station names. Multiple names are sep-arated by a dash. For example, in a leveling observation line, the station name string “TOWER-823” defines the FROM and TOstations of the observation. Or on a data line that contains an elevation value, a single name is present to define the station.
Stations can have alphanumeric names up to 15 characters long. Youmay use upper or lower case letters. Case is significant,so “corner25” and “CORNER25” are recognized as different station names. Although it requires care, you can actually mixupper and lower case to create unique station names, or include special characters such as “/”, “+” or a decimal point in namesfor special identification purposes.
Below are a few examples of “level” data lines using a variety of station naming schemes we have seen in user’s data files:
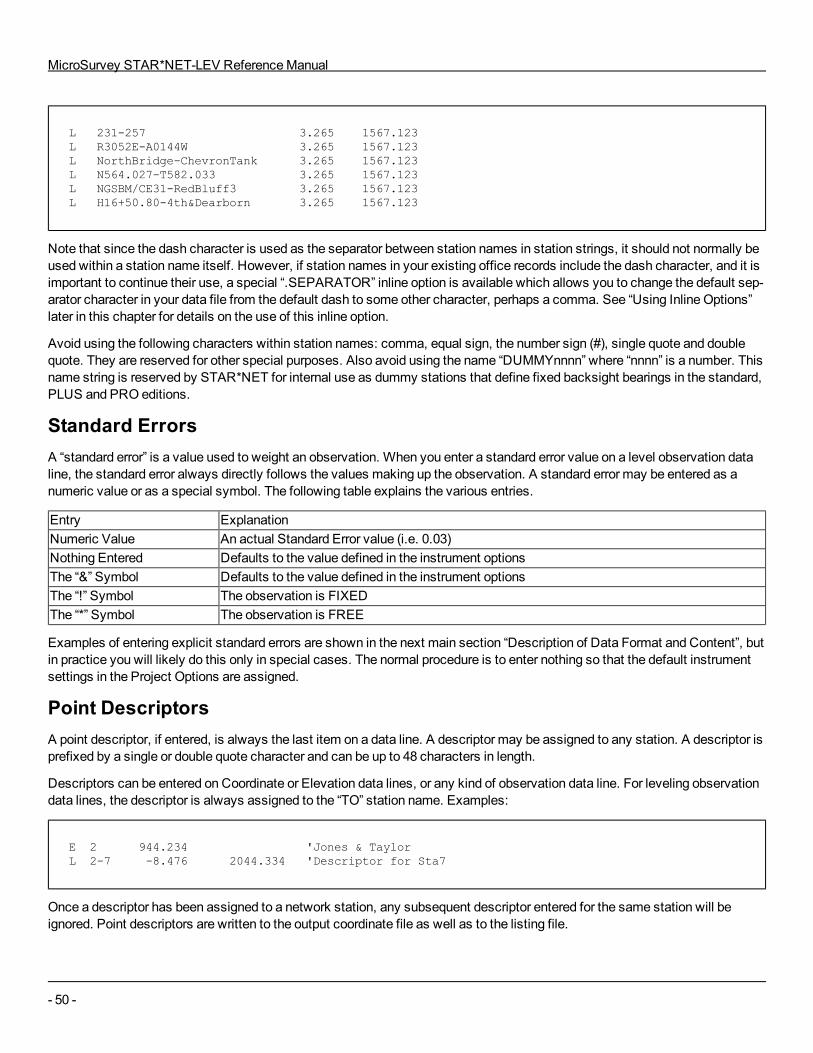
MicroSurvey STAR*NET-LEV ReferenceManual
- 50 -
L 231-257 3.265 1567.123L R3052E-A0144W 3.265 1567.123L NorthBridge-ChevronTank 3.265 1567.123L N564.027-T582.033 3.265 1567.123L NGSBM/CE31-RedBluff3 3.265 1567.123L H16+50.80-4th&Dearborn 3.265 1567.123
Note that since the dash character is used as the separator between station names in station strings, it should not normally beused within a station name itself. However, if station names in your existing office records include the dash character, and it isimportant to continue their use, a special “.SEPARATOR” inline option is available which allows you to change the default sep-arator character in your data file from the default dash to some other character, perhaps a comma. See “Using Inline Options”later in this chapter for details on the use of this inline option.
Avoid using the following characters within station names: comma, equal sign, the number sign (#), single quote and doublequote. They are reserved for other special purposes. Also avoid using the name “DUMMYnnnn” where “nnnn” is a number. Thisname string is reserved by STAR*NET for internal use as dummy stations that define fixed backsight bearings in the standard,PLUS and PRO editions.
Standard ErrorsA “standard error” is a value used to weight an observation. When you enter a standard error value on a level observation dataline, the standard error always directly follows the values making up the observation. A standard error may be entered as anumeric value or as a special symbol. The following table explains the various entries.
Entry ExplanationNumeric Value An actual Standard Error value (i.e. 0.03)Nothing Entered Defaults to the value defined in the instrument optionsThe “&” Symbol Defaults to the value defined in the instrument optionsThe “!” Symbol The observation is FIXEDThe “*” Symbol The observation is FREE
Examples of entering explicit standard errors are shown in the next main section “Description of Data Format and Content”, butin practice you will likely do this only in special cases. The normal procedure is to enter nothing so that the default instrumentsettings in the Project Options are assigned.
Point DescriptorsA point descriptor, if entered, is always the last item on a data line. A descriptor may be assigned to any station. A descriptor isprefixed by a single or double quote character and can be up to 48 characters in length.
Descriptors can be entered on Coordinate or Elevation data lines, or any kind of observation data line. For leveling observationdata lines, the descriptor is always assigned to the “TO” station name. Examples:
E 2 944.234 'Jones & TaylorL 2-7 -8.476 2044.334 'Descriptor for Sta7
Once a descriptor has been assigned to a network station, any subsequent descriptor entered for the same station will beignored. Point descriptors are written to the output coordinate file as well as to the listing file.
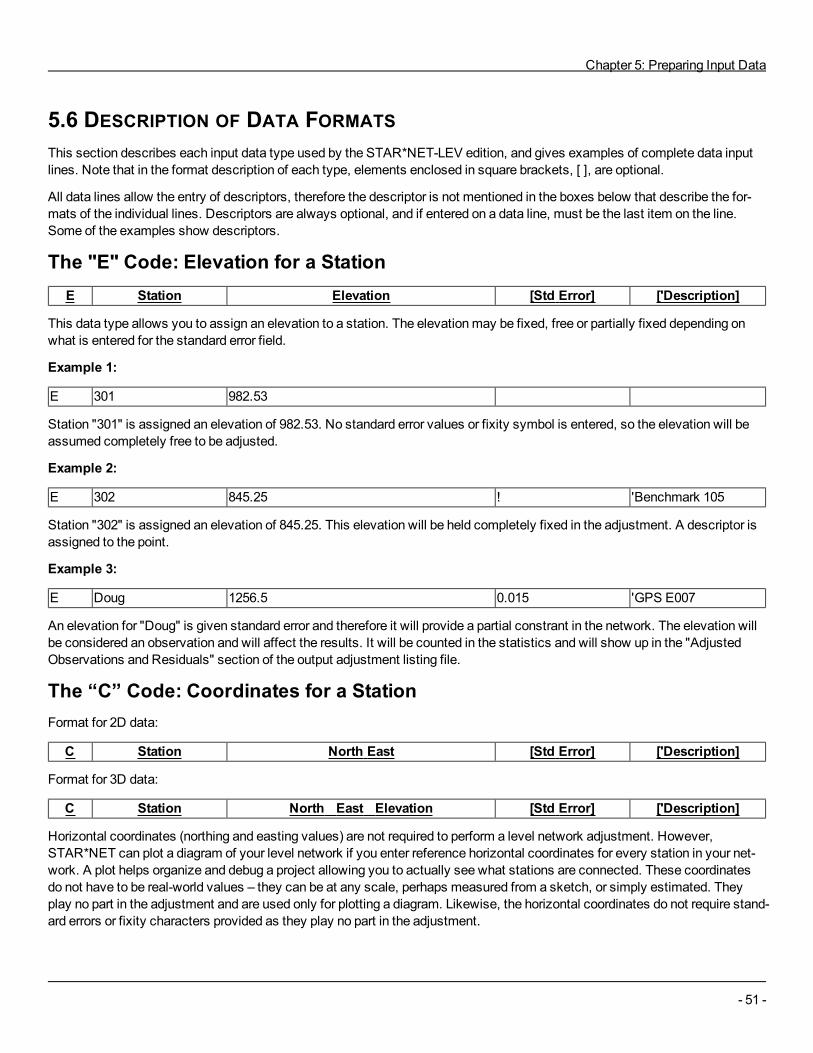
Chapter 5: Preparing Input Data
- 51 -
5.6 DESCRIPTION OF DATA FORMATSThis section describes each input data type used by the STAR*NET-LEV edition, and gives examples of complete data inputlines. Note that in the format description of each type, elements enclosed in square brackets, [ ], are optional.
All data lines allow the entry of descriptors, therefore the descriptor is not mentioned in the boxes below that describe the for-mats of the individual lines. Descriptors are always optional, and if entered on a data line, must be the last item on the line.Some of the examples show descriptors.
The "E" Code: Elevation for a StationE Station Elevation [Std Error] ['Description]
This data type allows you to assign an elevation to a station. The elevationmay be fixed, free or partially fixed depending onwhat is entered for the standard error field.
Example 1:
E 301 982.53
Station "301" is assigned an elevation of 982.53. No standard error values or fixity symbol is entered, so the elevation will beassumed completely free to be adjusted.
Example 2:
E 302 845.25 ! 'Benchmark 105
Station "302" is assigned an elevation of 845.25. This elevation will be held completely fixed in the adjustment. A descriptor isassigned to the point.
Example 3:
E Doug 1256.5 0.015 'GPS E007
An elevation for "Doug" is given standard error and therefore it will provide a partial constrant in the network. The elevation willbe considered an observation and will affect the results. It will be counted in the statistics and will show up in the "AdjustedObservations and Residuals" section of the output adjustment listing file.
The “C” Code: Coordinates for a StationFormat for 2D data:
C Station North East [Std Error] ['Description]
Format for 3D data:
C Station North East Elevation [Std Error] ['Description]
Horizontal coordinates (northing and easting values) are not required to perform a level network adjustment. However,STAR*NET can plot a diagram of your level network if you enter reference horizontal coordinates for every station in your net-work. A plot helps organize and debug a project allowing you to actually see what stations are connected. These coordinatesdo not have to be real-world values – they can be at any scale, perhaps measured from a sketch, or simply estimated. Theyplay no part in the adjustment and are used only for plotting a diagram. Likewise, the horizontal coordinates do not require stand-ard errors or fixity characters provided as they play no part in the adjustment.
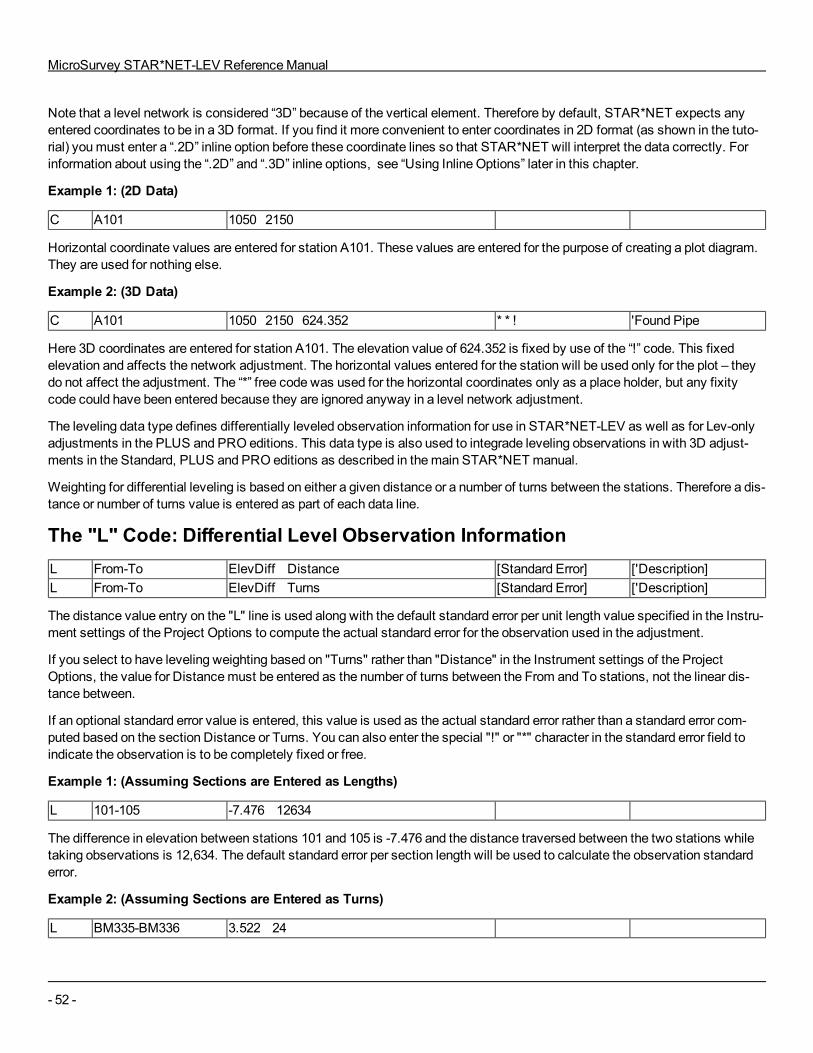
MicroSurvey STAR*NET-LEV ReferenceManual
- 52 -
Note that a level network is considered “3D” because of the vertical element. Therefore by default, STAR*NET expects anyentered coordinates to be in a 3D format. If you find it more convenient to enter coordinates in 2D format (as shown in the tuto-rial) youmust enter a “.2D” inline option before these coordinate lines so that STAR*NET will interpret the data correctly. Forinformation about using the “.2D” and “.3D” inline options, see “Using Inline Options” later in this chapter.
Example 1: (2D Data)
C A101 1050 2150
Horizontal coordinate values are entered for station A101. These values are entered for the purpose of creating a plot diagram.They are used for nothing else.
Example 2: (3D Data)
C A101 1050 2150 624.352 * * ! 'Found Pipe
Here 3D coordinates are entered for station A101. The elevation value of 624.352 is fixed by use of the “!” code. This fixedelevation and affects the network adjustment. The horizontal values entered for the station will be used only for the plot – theydo not affect the adjustment. The “*” free code was used for the horizontal coordinates only as a place holder, but any fixitycode could have been entered because they are ignored anyway in a level network adjustment.
The leveling data type defines differentially leveled observation information for use in STAR*NET-LEV as well as for Lev-onlyadjustments in the PLUS and PRO editions. This data type is also used to integrade leveling observations in with 3D adjust-ments in the Standard, PLUS and PRO editions as described in themain STAR*NETmanual.
Weighting for differential leveling is based on either a given distance or a number of turns between the stations. Therefore a dis-tance or number of turns value is entered as part of each data line.
The "L" Code: Differential Level Observation InformationL From-To ElevDiff Distance [Standard Error] ['Description]L From-To ElevDiff Turns [Standard Error] ['Description]
The distance value entry on the "L" line is used along with the default standard error per unit length value specified in the Instru-ment settings of the Project Options to compute the actual standard error for the observation used in the adjustment.
If you select to have leveling weighting based on "Turns" rather than "Distance" in the Instrument settings of the ProjectOptions, the value for Distancemust be entered as the number of turns between the From and To stations, not the linear dis-tance between.
If an optional standard error value is entered, this value is used as the actual standard error rather than a standard error com-puted based on the section Distance or Turns. You can also enter the special "!" or "*" character in the standard error field toindicate the observation is to be completely fixed or free.
Example 1: (Assuming Sections are Entered as Lengths)
L 101-105 -7.476 12634
The difference in elevation between stations 101 and 105 is -7.476 and the distance traversed between the two stations whiletaking observations is 12,634. The default standard error per section length will be used to calculate the observation standarderror.
Example 2: (Assuming Sections are Entered as Turns)
L BM335-BM336 3.522 24
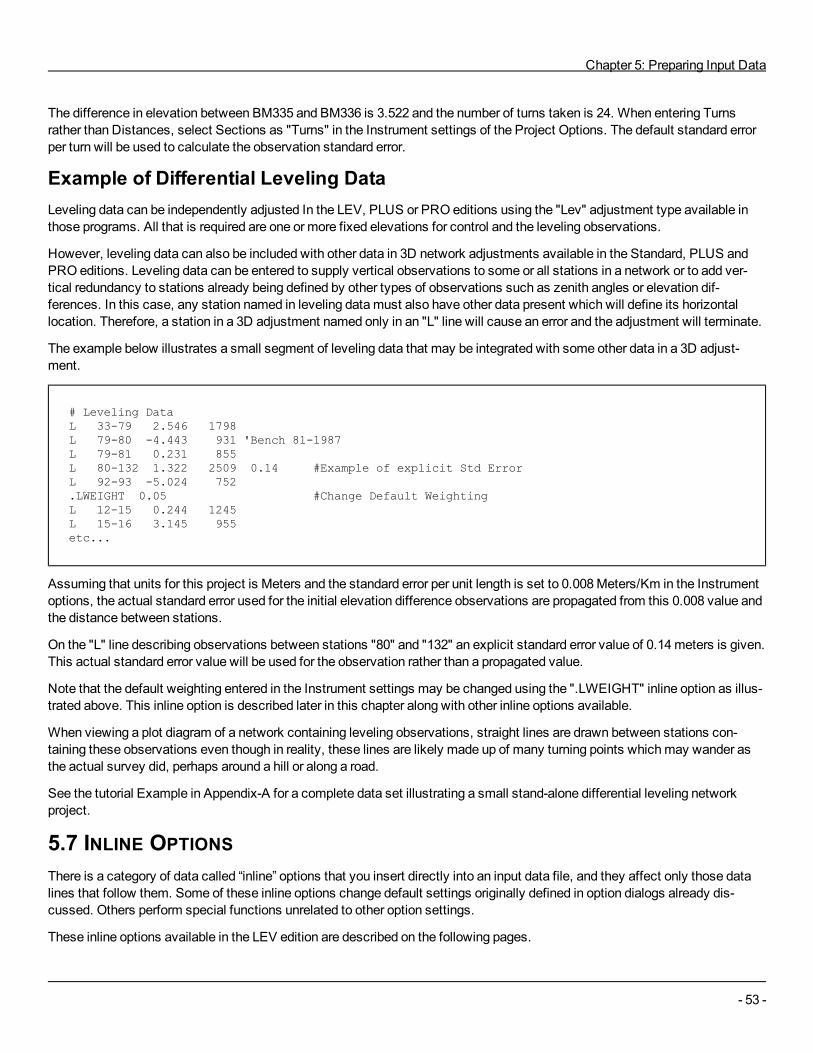
Chapter 5: Preparing Input Data
- 53 -
The difference in elevation between BM335 and BM336 is 3.522 and the number of turns taken is 24. When entering Turnsrather than Distances, select Sections as "Turns" in the Instrument settings of the Project Options. The default standard errorper turn will be used to calculate the observation standard error.
Example of Differential Leveling DataLeveling data can be independently adjusted In the LEV, PLUS or PRO editions using the "Lev" adjustment type available inthose programs. All that is required are one or more fixed elevations for control and the leveling observations.
However, leveling data can also be included with other data in 3D network adjustments available in the Standard, PLUS andPRO editions. Leveling data can be entered to supply vertical observations to some or all stations in a network or to add ver-tical redundancy to stations already being defined by other types of observations such as zenith angles or elevation dif-ferences. In this case, any station named in leveling datamust also have other data present which will define its horizontallocation. Therefore, a station in a 3D adjustment named only in an "L" line will cause an error and the adjustment will terminate.
The example below illustrates a small segment of leveling data that may be integrated with some other data in a 3D adjust-ment.
# Leveling DataL 33-79 2.546 1798L 79-80 -4.443 931 'Bench 81-1987L 79-81 0.231 855L 80-132 1.322 2509 0.14 #Example of explicit Std ErrorL 92-93 -5.024 752.LWEIGHT 0.05 #Change Default WeightingL 12-15 0.244 1245L 15-16 3.145 955etc...
Assuming that units for this project is Meters and the standard error per unit length is set to 0.008Meters/Km in the Instrumentoptions, the actual standard error used for the initial elevation difference observations are propagated from this 0.008 value andthe distance between stations.
On the "L" line describing observations between stations "80" and "132" an explicit standard error value of 0.14meters is given.This actual standard error value will be used for the observation rather than a propagated value.
Note that the default weighting entered in the Instrument settings may be changed using the ".LWEIGHT" inline option as illus-trated above. This inline option is described later in this chapter along with other inline options available.
When viewing a plot diagram of a network containing leveling observations, straight lines are drawn between stations con-taining these observations even though in reality, these lines are likely made up of many turning points whichmay wander asthe actual survey did, perhaps around a hill or along a road.
See the tutorial Example in Appendix-A for a complete data set illustrating a small stand-alone differential leveling networkproject.
5.7 INLINE OPTIONSThere is a category of data called “inline” options that you insert directly into an input data file, and they affect only those datalines that follow them. Some of these inline options change default settings originally defined in option dialogs already dis-cussed. Others perform special functions unrelated to other option settings.
These inline options available in the LEV edition are described on the following pages.
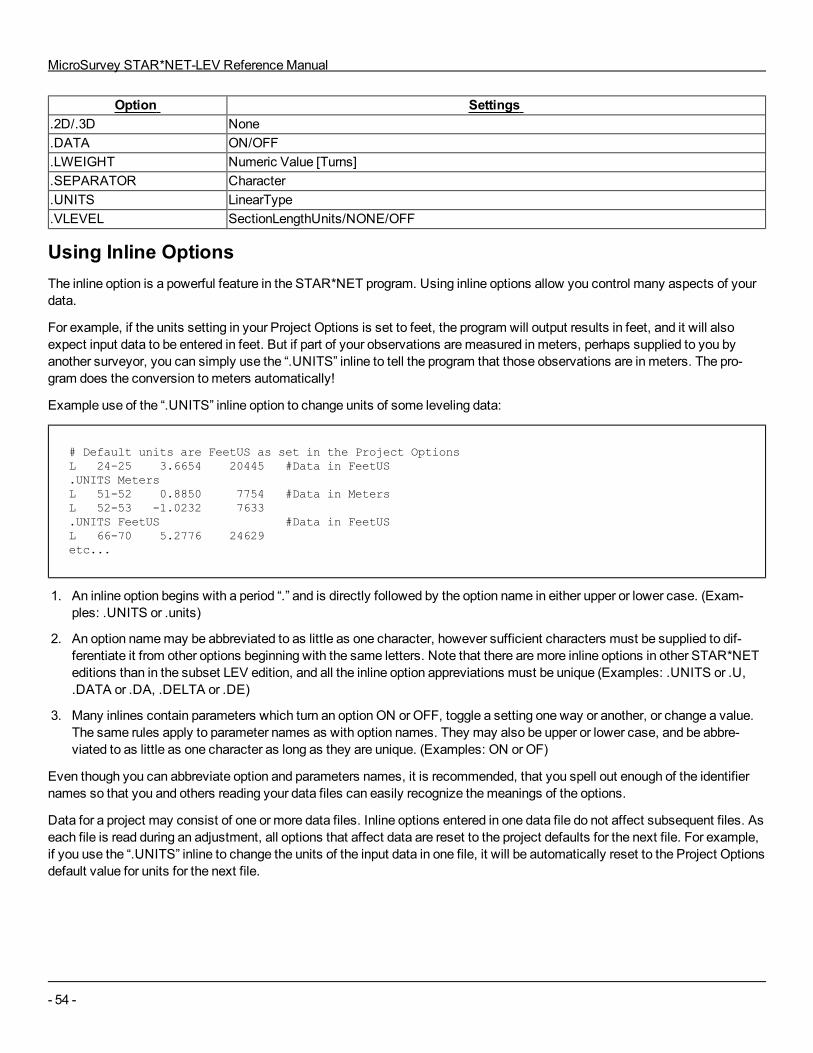
MicroSurvey STAR*NET-LEV ReferenceManual
- 54 -
Option Settings.2D/.3D None.DATA ON/OFF.LWEIGHT Numeric Value [Turns].SEPARATOR Character.UNITS LinearType.VLEVEL SectionLengthUnits/NONE/OFF
Using Inline OptionsThe inline option is a powerful feature in the STAR*NET program. Using inline options allow you control many aspects of yourdata.
For example, if the units setting in your Project Options is set to feet, the program will output results in feet, and it will alsoexpect input data to be entered in feet. But if part of your observations aremeasured inmeters, perhaps supplied to you byanother surveyor, you can simply use the “.UNITS” inline to tell the program that those observations are in meters. The pro-gram does the conversion tometers automatically!
Example use of the “.UNITS” inline option to change units of some leveling data:
# Default units are FeetUS as set in the Project OptionsL 24-25 3.6654 20445 #Data in FeetUS.UNITS MetersL 51-52 0.8850 7754 #Data in MetersL 52-53 -1.0232 7633.UNITS FeetUS #Data in FeetUSL 66-70 5.2776 24629etc...
1. An inline option begins with a period “.” and is directly followed by the option name in either upper or lower case. (Exam-ples: .UNITS or .units)
2. An option namemay be abbreviated to as little as one character, however sufficient characters must be supplied to dif-ferentiate it from other options beginning with the same letters. Note that there aremore inline options in other STAR*NETeditions than in the subset LEV edition, and all the inline option appreviations must be unique (Examples: .UNITS or .U,.DATA or .DA, .DELTA or .DE)
3. Many inlines contain parameters which turn an option ON or OFF, toggle a setting one way or another, or change a value.The same rules apply to parameter names as with option names. They may also be upper or lower case, and be abbre-viated to as little as one character as long as they are unique. (Examples: ON or OF)
Even though you can abbreviate option and parameters names, it is recommended, that you spell out enough of the identifiernames so that you and others reading your data files can easily recognize themeanings of the options.
Data for a project may consist of one or more data files. Inline options entered in one data file do not affect subsequent files. Aseach file is read during an adjustment, all options that affect data are reset to the project defaults for the next file. For example,if you use the “.UNITS” inline to change the units of the input data in one file, it will be automatically reset to the Project Optionsdefault value for units for the next file.
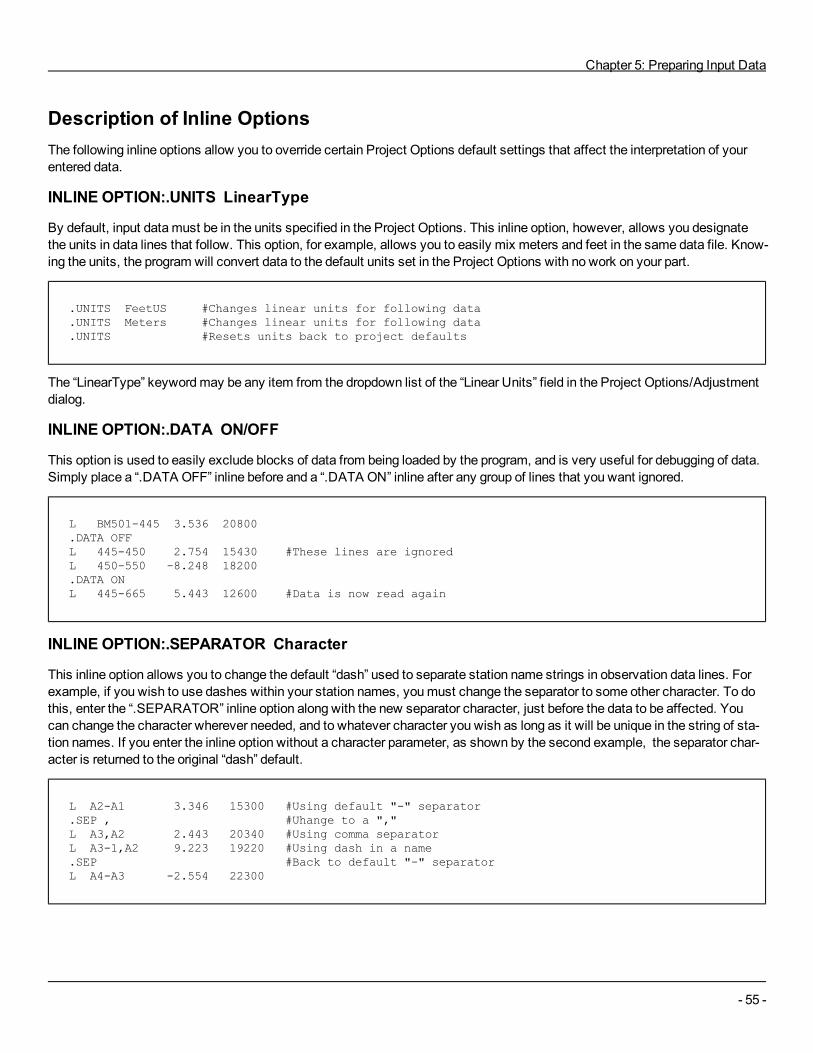
Chapter 5: Preparing Input Data
- 55 -
Description of Inline OptionsThe following inline options allow you to override certain Project Options default settings that affect the interpretation of yourentered data.
INLINE OPTION:.UNITS LinearType
By default, input datamust be in the units specified in the Project Options. This inline option, however, allows you designatethe units in data lines that follow. This option, for example, allows you to easily mix meters and feet in the same data file. Know-ing the units, the program will convert data to the default units set in the Project Options with no work on your part.
.UNITS FeetUS #Changes linear units for following data
.UNITS Meters #Changes linear units for following data
.UNITS #Resets units back to project defaults
The “LinearType” keywordmay be any item from the dropdown list of the “Linear Units” field in the Project Options/Adjustmentdialog.
INLINE OPTION:.DATA ON/OFF
This option is used to easily exclude blocks of data from being loaded by the program, and is very useful for debugging of data.Simply place a “.DATA OFF” inline before and a “.DATA ON” inline after any group of lines that you want ignored.
L BM501-445 3.536 20800 .DATA OFFL 445-450 2.754 15430 #These lines are ignoredL 450-550 -8.248 18200.DATA ONL 445-665 5.443 12600 #Data is now read again
INLINE OPTION:.SEPARATOR Character
This inline option allows you to change the default “dash” used to separate station name strings in observation data lines. Forexample, if you wish to use dashes within your station names, youmust change the separator to some other character. To dothis, enter the “.SEPARATOR” inline option along with the new separator character, just before the data to be affected. Youcan change the character wherever needed, and to whatever character you wish as long as it will be unique in the string of sta-tion names. If you enter the inline option without a character parameter, as shown by the second example, the separator char-acter is returned to the original “dash” default.
L A2-A1 3.346 15300 #Using default "-" separator.SEP , #Uhange to a ","L A3,A2 2.443 20340 #Using comma separatorL A3-1,A2 9.223 19220 #Using dash in a name.SEP #Back to default "-" separatorL A4-A3 -2.554 22300
MicroSurvey STAR*NET-LEV ReferenceManual
- 56 -
INLINE OPTION:.2D or .3D
The LEV edition, because of the vertical element, expects data in 3D format. However, in a level network data file, youmaywant to enter 2D horizontal coordinates so that a plot diagram can be created. You can use the “.2D” inline to temporarilychange the datamode to 2D and allow 2D coordinates to be entered. For example:
.2D #Change to 2D data format modeC BM501 5000 5000 #Enter some 2D coordinatesC BM538 8300 4350 .3D #Change back to 3D data modeL BM501-445 3.536 20800 #Enter regular 3D dataetc ...
INLINE OPTION:.LWEIGHT Value [Turns]
This inline option allows you to change the leveling data “Elev Diff” standard error per section value specified in the InstrumentOptions to a new value. Enter the inline option preceding the differential leveling data to be affected and it will remain in affectuntil again changed or until the end of the file. At the end of a data file, the the weighting and section type reverts back to thatspecified in the project options.
When the inline option is entered with a value only (i.e. without the “Turns” key word), the program considers the section typebased on “Length.”When the “Turns” key word is included, the program considers the section type based on “Turns.”
The first example sets the value to 0.038 with the section type as “Length.”
The second example sets the value to 0.012 with the section type as “Turns.”
.LWEIGHT 0.038 #Sets 0.038 value and “Length” section typeL BM75-125 15.920 31200L 129-130 22.130 37400L 130-125 3.833 28100.LWEIGHT 0.012 Turns #Sets 0.012 value and “Turns” section typeL 130-126 24.065 46 L 128-126 34.422 38L 126-127 -15.485 42.LWEIGHT #Reset to project defaultsL 127-128 9.234 24660etc...
Units of the entered data are the same units set for the project in the adjustment options, or the current units if redefined usingthe “.UNITS” inline option.
If the current units are FeetUS, the new Elev Difference standard error per section length set for the first example above wouldbe 0.038 Feet/Mile. And the total standard error propagated for the 31200 foot survey line would be:
Total Std Error = 0.038 FeetUS/Mile x SQRT(31200/5280) = 0.0924 FeetUS.
Likewise the new Elev Difference standard error per section length set for the second example above would be 0.012Feet/Turn. And the total standard error propagated for the survey line having 46 turns would be:
Total Std Error = 0.012 FeetUS/Turn x SQRT(46) = 0.0814 FeetUS
Chapter 5: Preparing Input Data
- 57 -
When the inline is entered without parameters as illustrated by the third example, the weighting scheme reverts to the originaldefault set in the Project Options.
INLINE OPTION:.VLEVEL SectionLengthUnits/NONE/OFFThis inline allows data from the discontinued DOS-based STAR*LEV program to be used unchanged in STAR*NET by inter-nally converting the original “V” line leveling data to information compatible with new the “L” line data format.
The old STAR*LEV program allowed section values to be entered in a variety of units: Feet (handled as US feet), Miles,Meters, Kilometers, Turns or None. However STAR*NET expects a section value to be either a Length (in the same units asthe current project units, usually Feet or Kilometers), or as number of Turns.
Enter the “.VLEVEL” option preceding your old STAR*LEV data. Add a keyword to describe the old data: FEET, MILES,METERS, KILOMETERS, TURNS or NONE. The examples below illustrate themost common of ways one would use thisinline.
The first example inline option tells STAR*NET that the sections are entered as Miles. Assuming the current project units are inFeetUS, the program will internally convert the section lengths fromMiles to FeetUS.
The second example inline option says to interpret the section value as number of turns.
The third example illustrates the “None” option. In the old STAR*LEV program, the “None” section length optionmeant that thesection value was not to be used for weighting and that a given total standard error was to be used for each section. So in thisexample, if the project units are FeetUS and the weighting of the old STAR*LEV data was set to 0.05 feet total per survey line,the following inline would cause a constant 0.05 feet standard error for all following observations regardless of the sectionvalues entered. The entered section length values are ignored.
The last example line turns the “.VLEVEL” option off indicating that any subsequent data will not need conversion from the oldSTAR*LEV data format.
.VLEVEL MILES #Indicates sections are in MilesV 101-102 2.5443 2.32 #2.32 Miles will be converted to Feet.VLEVEL TURNS #Indicates sections are in TurnsV 101-102 2.5443 8 #The number of Turns is 8.VLEVEL NONE=0.05 #Indicates to assign 0.05 and simplyV 101-102 2.5443 123 #ignore section values, 123 in this case.VLEVEL OFF #Turns the option off
Note that if your old STAR*LEV section data is already in Feet, Meters or Turns, the data is already compatible withSTAR*NET except the “V”codes should be “L” codes. You can use the “.VLEVEL” inline to define the old data to STAR*NET,but in such a case, youmay find it easier to simply edit your old STAR*LEV data files and change the data line codes from “V”to “L” and just be done with it!

MicroSurvey STAR*NET-LEV ReferenceManual
- 58 -
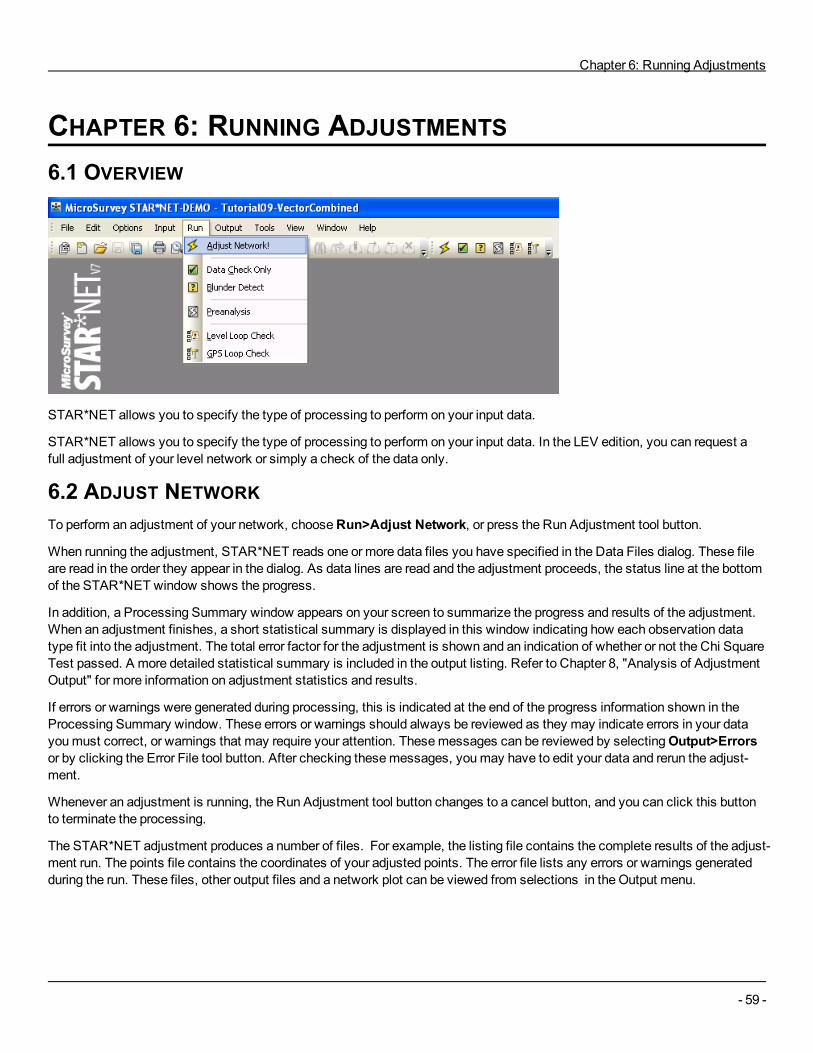
Chapter 6: Running Adjustments
- 59 -
CHAPTER 6: RUNNING ADJUSTMENTS6.1 OVERVIEW
STAR*NET allows you to specify the type of processing to perform on your input data.
STAR*NET allows you to specify the type of processing to perform on your input data. In the LEV edition, you can request afull adjustment of your level network or simply a check of the data only.
6.2 ADJUST NETWORKTo perform an adjustment of your network, chooseRun>Adjust Network, or press the Run Adjustment tool button.
When running the adjustment, STAR*NET reads one or more data files you have specified in the Data Files dialog. These fileare read in the order they appear in the dialog. As data lines are read and the adjustment proceeds, the status line at the bottomof the STAR*NET window shows the progress.
In addition, a Processing Summary window appears on your screen to summarize the progress and results of the adjustment.When an adjustment finishes, a short statistical summary is displayed in this window indicating how each observation datatype fit into the adjustment. The total error factor for the adjustment is shown and an indication of whether or not the Chi SquareTest passed. A more detailed statistical summary is included in the output listing. Refer to Chapter 8, "Analysis of AdjustmentOutput" for more information on adjustment statistics and results.
If errors or warnings were generated during processing, this is indicated at the end of the progress information shown in theProcessing Summary window. These errors or warnings should always be reviewed as they may indicate errors in your datayoumust correct, or warnings that may require your attention. Thesemessages can be reviewed by selectingOutput>Errorsor by clicking the Error File tool button. After checking thesemessages, youmay have to edit your data and rerun the adjust-ment.
Whenever an adjustment is running, the Run Adjustment tool button changes to a cancel button, and you can click this buttonto terminate the processing.
The STAR*NET adjustment produces a number of files. For example, the listing file contains the complete results of the adjust-ment run. The points file contains the coordinates of your adjusted points. The error file lists any errors or warnings generatedduring the run. These files, other output files and a network plot can be viewed from selections in the Output menu.
MicroSurvey STAR*NET-LEV ReferenceManual
- 60 -
6.3 DATA CHECK ONLYBefore you run an adjustment the first time, youmay wish to simply check the input data rather than run the adjustment.ChooseRun>Data Check Only to run this routine. This is not an adjustment! When you run Data Check Only, a modified ver-sion of the listing file is generated, and you can plot the unadjusted network.
The Data Check Only feature performs two functions:
1. First, all input data is read intomemory. If you have any syntax errors in your data files, STAR*NET will issue error orwarningmessages in the error file which you can review and take any action required. Your input data observations willbe summarized in the listing file.
2. Secondly, all observations (angles, distances, etc.) found in the input data are checked for consistency with the approx-imate coordinates.
Whenever STAR*NET reads in data, approximate coordinates are computed for all points using the observations found in yourdata. The program then calculates the difference between each "entered" observation and its respective "inversed" observationcalculated from the approximate coordinates. Your listing file will contain a section entitled "Differences from Observations" foreach data type. Some observations will show no differences since they may have been used to actually calculate the approx-imate coordinates. But other observations not used to calculate coordinates may show some differences. When observationsin a network are consistent with each other, differences shown in the listing should be quite small. The appearance of large dif-ference values likely indicates bad observations, or errors in preparing data.
This ability to check consistency of input observations to approximate coordinates is particularly useful for finding "badly" fit-ting observations being added to a known "good" network. Simply supply the coordinates from your previous good adjustmentof the network as approximate coordinates in your new data. (When approximate coordinates are supplied, they won’t be com-puted from the observations.) Run the Data Check Only routine and then check the listing for any of the new observations notfitting the "good" approximate coordinates.
As indicated above, the Data Check Only routine only reads in data and does a simple check of consistency between obser-vations and approximate (calculated or entered) coordinates. For amore rigorous method of finding blunders, see BlunderDetect in the next section.
6.4 LEVEL LOOP CHECKLoop closure checking is a new blunder detection feature in STAR*NET Version 7. It is selected from the "Run" menu.
Level loop closure checking is available to the following project types:
l 3D Local
l 3D Grid
l Lev
STAR*NET will automatically construct loops from the "L" Level records from your input data. No other special data or inlineoptions are required to perform the loop check. It will determine closed loops that exist when a series of L observations closesback to an earlier station (like a-b-c-d-a), and open loops when a series of L observations exist between two fixed stations (likeA-b-c-d-E, where A and E are fixed stations). Multiple loops may exist, and they may share common connections.
While constructing these loops, STAR*NET will average any redundant observations for each connection, and will auto-matically reject any observations that do not fit that connection within expected statistical tolerances. While the L level recordsare directional in nature, the loop check uses them bi-directionally which allows reverse observations like a-b and b-a to be aver-aged together.
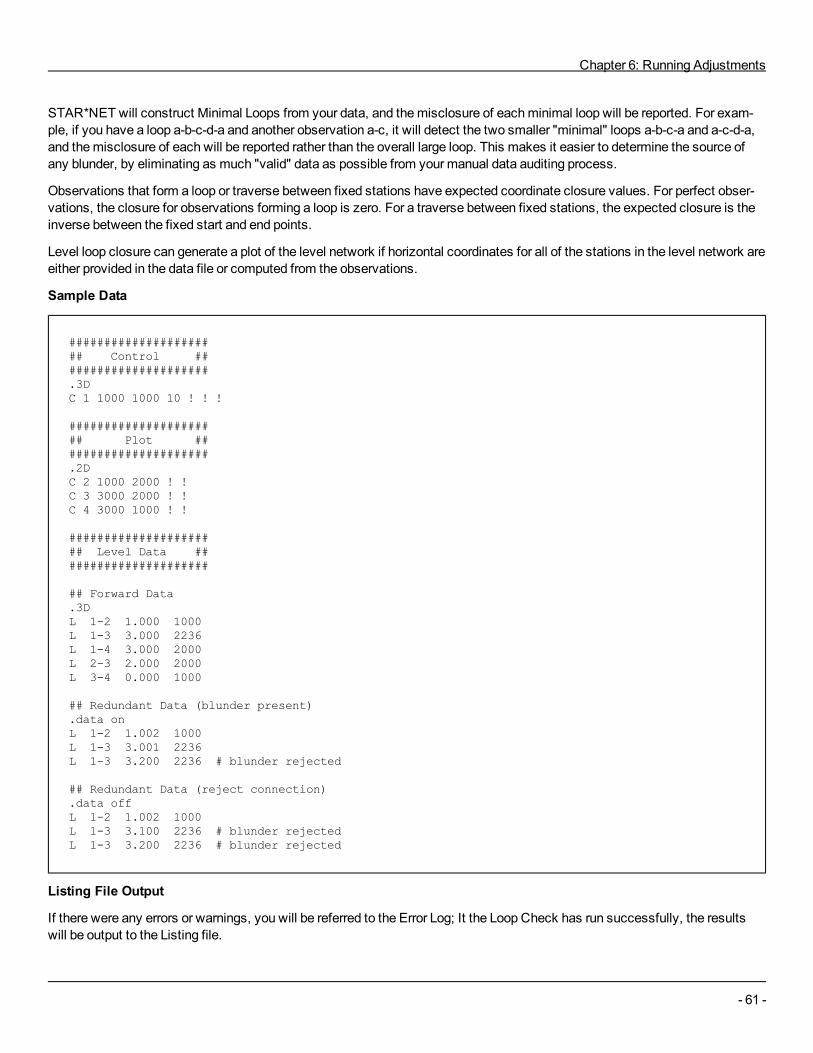
Chapter 6: Running Adjustments
- 61 -
STAR*NET will construct Minimal Loops from your data, and themisclosure of eachminimal loop will be reported. For exam-ple, if you have a loop a-b-c-d-a and another observation a-c, it will detect the two smaller "minimal" loops a-b-c-a and a-c-d-a,and themisclosure of each will be reported rather than the overall large loop. This makes it easier to determine the source ofany blunder, by eliminating as much "valid" data as possible from your manual data auditing process.
Observations that form a loop or traverse between fixed stations have expected coordinate closure values. For perfect obser-vations, the closure for observations forming a loop is zero. For a traverse between fixed stations, the expected closure is theinverse between the fixed start and end points.
Level loop closure can generate a plot of the level network if horizontal coordinates for all of the stations in the level network areeither provided in the data file or computed from the observations.
Sample Data
###################### Control ######################.3DC 1 1000 1000 10 ! ! !
###################### Plot ######################.2DC 2 1000 2000 ! !C 3 3000 2000 ! !C 4 3000 1000 ! !
###################### Level Data ######################
## Forward Data.3DL 1-2 1.000 1000L 1-3 3.000 2236L 1-4 3.000 2000L 2-3 2.000 2000L 3-4 0.000 1000
## Redundant Data (blunder present).data onL 1-2 1.002 1000L 1-3 3.001 2236L 1-3 3.200 2236 # blunder rejected
## Redundant Data (reject connection).data offL 1-2 1.002 1000L 1-3 3.100 2236 # blunder rejectedL 1-3 3.200 2236 # blunder rejected
Listing File Output
If there were any errors or warnings, you will be referred to the Error Log; It the Loop Check has run successfully, the resultswill be output to the Listing file.
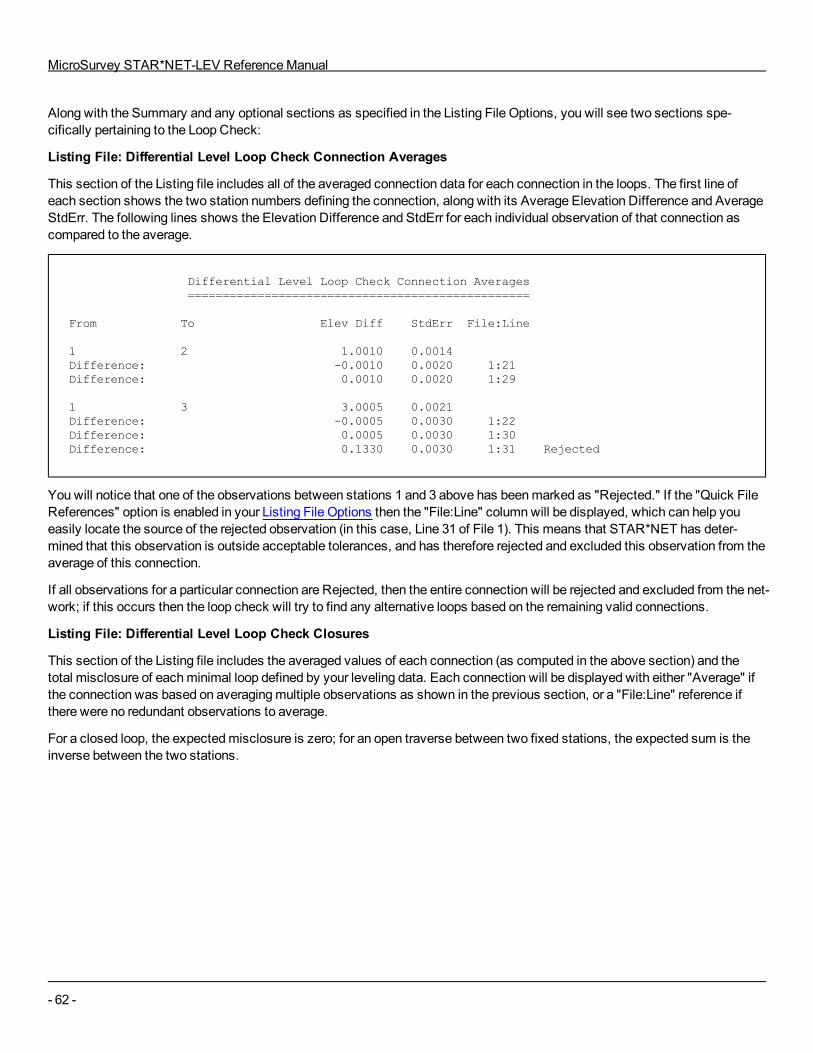
MicroSurvey STAR*NET-LEV ReferenceManual
- 62 -
Along with the Summary and any optional sections as specified in the Listing File Options, you will see two sections spe-cifically pertaining to the Loop Check:
Listing File: Differential Level Loop Check Connection Averages
This section of the Listing file includes all of the averaged connection data for each connection in the loops. The first line ofeach section shows the two station numbers defining the connection, along with its Average Elevation Difference and AverageStdErr. The following lines shows the Elevation Difference and StdErr for each individual observation of that connection ascompared to the average.
Differential Level Loop Check Connection Averages=================================================
From To Elev Diff StdErr File:Line
1 2 1.0010 0.0014Difference: -0.0010 0.0020 1:21Difference: 0.0010 0.0020 1:29
1 3 3.0005 0.0021Difference: -0.0005 0.0030 1:22Difference: 0.0005 0.0030 1:30Difference: 0.1330 0.0030 1:31 Rejected
Youwill notice that one of the observations between stations 1 and 3 above has beenmarked as "Rejected." If the "Quick FileReferences" option is enabled in your Listing File Options then the "File:Line" columnwill be displayed, which can help youeasily locate the source of the rejected observation (in this case, Line 31 of File 1). This means that STAR*NET has deter-mined that this observation is outside acceptable tolerances, and has therefore rejected and excluded this observation from theaverage of this connection.
If all observations for a particular connection are Rejected, then the entire connection will be rejected and excluded from the net-work; if this occurs then the loop check will try to find any alternative loops based on the remaining valid connections.
Listing File: Differential Level Loop Check Closures
This section of the Listing file includes the averaged values of each connection (as computed in the above section) and thetotal misclosure of eachminimal loop defined by your leveling data. Each connection will be displayed with either "Average" ifthe connection was based on averagingmultiple observations as shown in the previous section, or a "File:Line" reference ifthere were no redundant observations to average.
For a closed loop, the expectedmisclosure is zero; for an open traverse between two fixed stations, the expected sum is theinverse between the two stations.
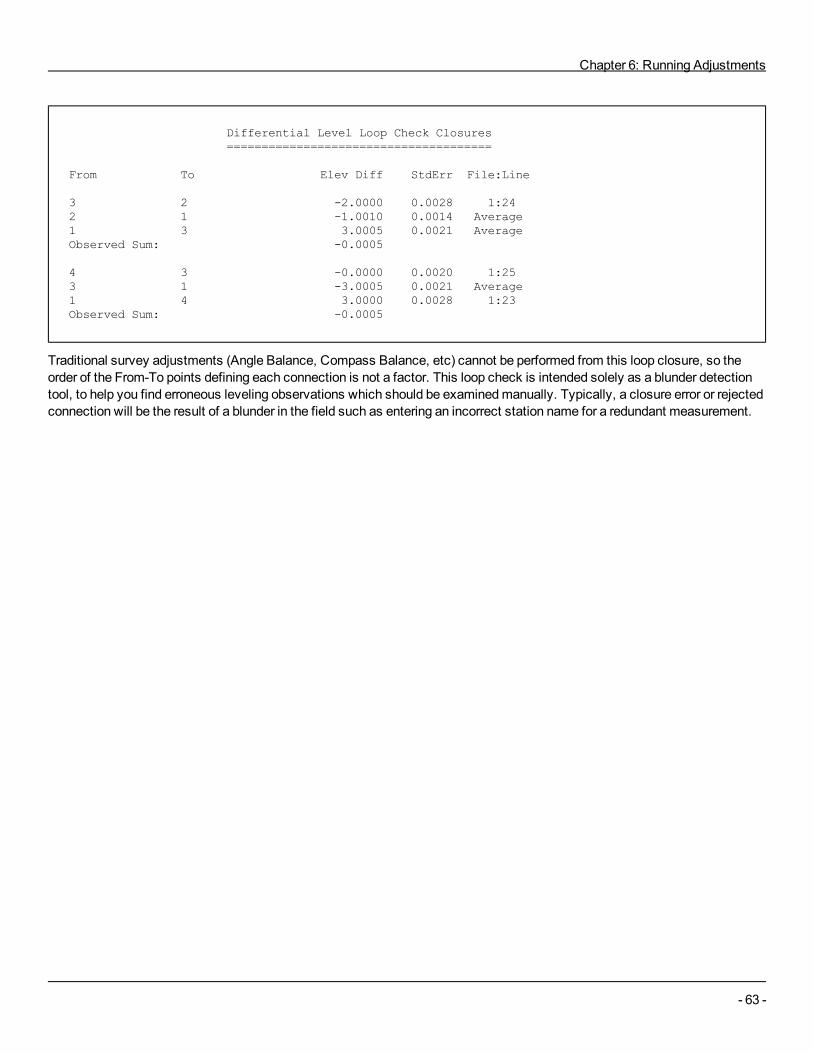
Chapter 6: Running Adjustments
- 63 -
Differential Level Loop Check Closures======================================
From To Elev Diff StdErr File:Line
3 2 -2.0000 0.0028 1:242 1 -1.0010 0.0014 Average1 3 3.0005 0.0021 AverageObserved Sum: -0.0005
4 3 -0.0000 0.0020 1:253 1 -3.0005 0.0021 Average1 4 3.0000 0.0028 1:23Observed Sum: -0.0005
Traditional survey adjustments (Angle Balance, Compass Balance, etc) cannot be performed from this loop closure, so theorder of the From-To points defining each connection is not a factor. This loop check is intended solely as a blunder detectiontool, to help you find erroneous leveling observations which should be examinedmanually. Typically, a closure error or rejectedconnection will be the result of a blunder in the field such as entering an incorrect station name for a redundant measurement.

MicroSurvey STAR*NET-LEV ReferenceManual
- 64 -
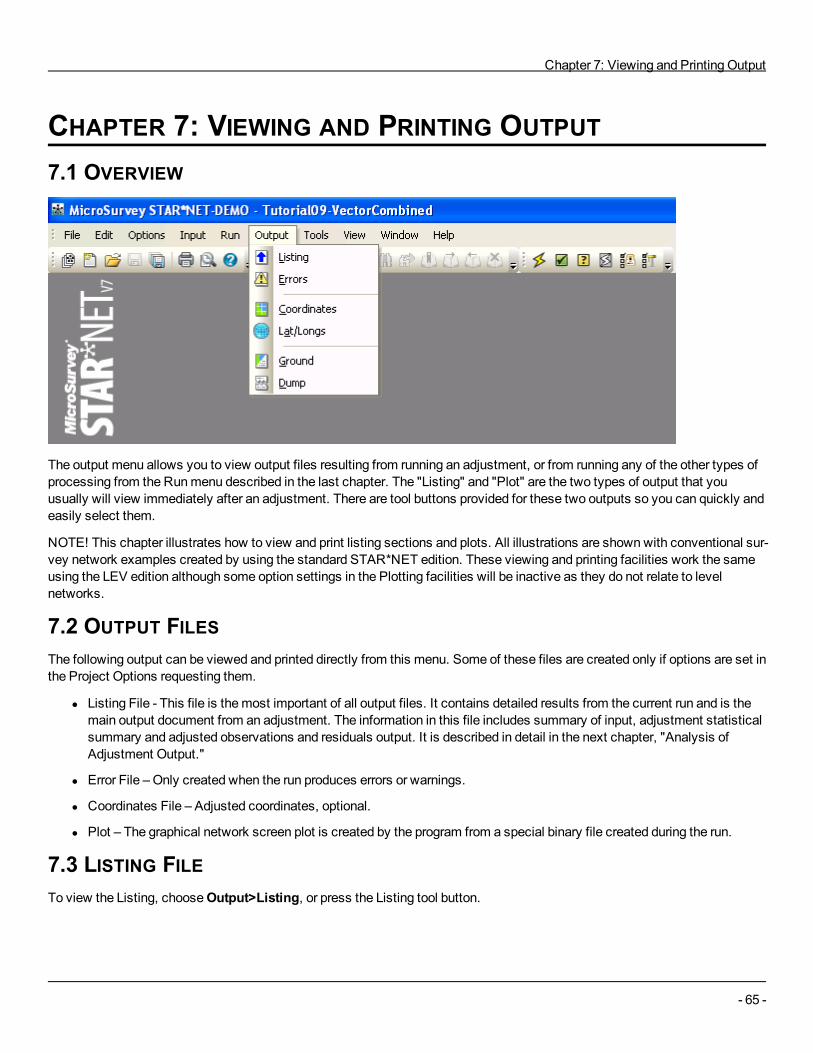
Chapter 7: Viewing and Printing Output
- 65 -
CHAPTER 7: VIEWING AND PRINTING OUTPUT
7.1 OVERVIEW
The output menu allows you to view output files resulting from running an adjustment, or from running any of the other types ofprocessing from the Runmenu described in the last chapter. The "Listing" and "Plot" are the two types of output that youusually will view immediately after an adjustment. There are tool buttons provided for these two outputs so you can quickly andeasily select them.
NOTE! This chapter illustrates how to view and print listing sections and plots. All illustrations are shownwith conventional sur-vey network examples created by using the standard STAR*NET edition. These viewing and printing facilities work the sameusing the LEV edition although some option settings in the Plotting facilities will be inactive as they do not relate to levelnetworks.
7.2 OUTPUT FILESThe following output can be viewed and printed directly from this menu. Some of these files are created only if options are set inthe Project Options requesting them.
l Listing File - This file is themost important of all output files. It contains detailed results from the current run and is themain output document from an adjustment. The information in this file includes summary of input, adjustment statisticalsummary and adjusted observations and residuals output. It is described in detail in the next chapter, "Analysis ofAdjustment Output."
l Error File – Only created when the run produces errors or warnings.
l Coordinates File – Adjusted coordinates, optional.
l Plot – The graphical network screen plot is created by the program from a special binary file created during the run.
7.3 LISTING FILETo view the Listing, chooseOutput>Listing, or press the Listing tool button.
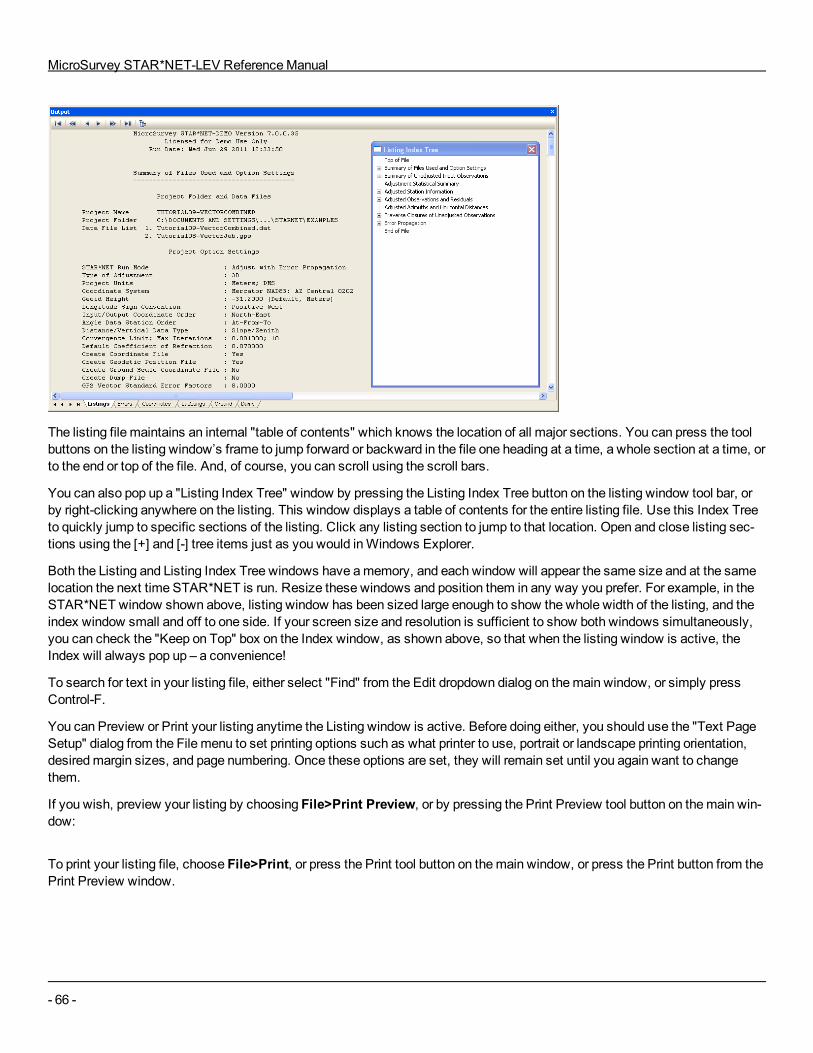
MicroSurvey STAR*NET-LEV ReferenceManual
- 66 -
The listing file maintains an internal "table of contents" which knows the location of all major sections. You can press the toolbuttons on the listing window’s frame to jump forward or backward in the file one heading at a time, a whole section at a time, orto the end or top of the file. And, of course, you can scroll using the scroll bars.
You can also pop up a "Listing Index Tree" window by pressing the Listing Index Tree button on the listing window tool bar, orby right-clicking anywhere on the listing. This window displays a table of contents for the entire listing file. Use this Index Treeto quickly jump to specific sections of the listing. Click any listing section to jump to that location. Open and close listing sec-tions using the [+] and [-] tree items just as you would inWindows Explorer.
Both the Listing and Listing Index Tree windows have amemory, and each window will appear the same size and at the samelocation the next time STAR*NET is run. Resize these windows and position them in any way you prefer. For example, in theSTAR*NET window shown above, listing window has been sized large enough to show the whole width of the listing, and theindex window small and off to one side. If your screen size and resolution is sufficient to show both windows simultaneously,you can check the "Keep on Top" box on the Index window, as shown above, so that when the listing window is active, theIndex will always pop up – a convenience!
To search for text in your listing file, either select "Find" from the Edit dropdown dialog on themain window, or simply pressControl-F.
You can Preview or Print your listing anytime the Listing window is active. Before doing either, you should use the "Text PageSetup" dialog from the File menu to set printing options such as what printer to use, portrait or landscape printing orientation,desiredmargin sizes, and page numbering. Once these options are set, they will remain set until you again want to changethem.
If you wish, preview your listing by choosing File>Print Preview, or by pressing the Print Preview tool button on themain win-dow:
To print your listing file, choose File>Print, or press the Print tool button on themain window, or press the Print button from thePrint Preview window.
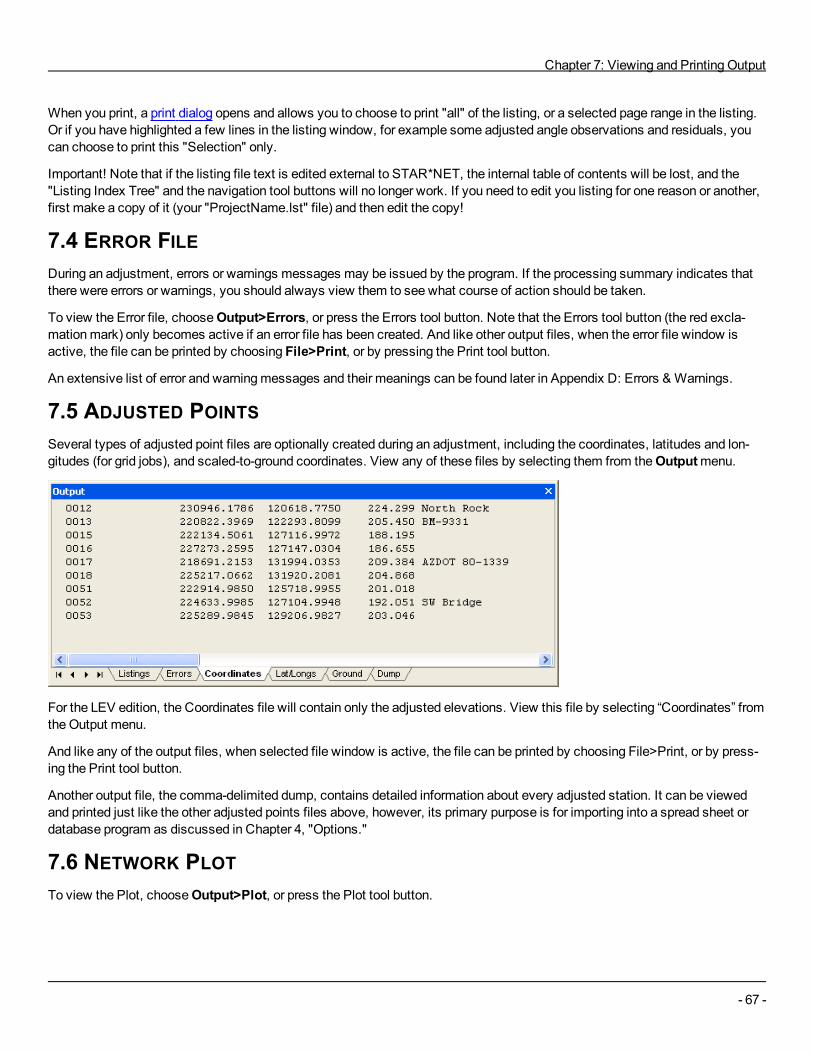
Chapter 7: Viewing and Printing Output
- 67 -
When you print, a print dialog opens and allows you to choose to print "all" of the listing, or a selected page range in the listing.Or if you have highlighted a few lines in the listing window, for example some adjusted angle observations and residuals, youcan choose to print this "Selection" only.
Important! Note that if the listing file text is edited external to STAR*NET, the internal table of contents will be lost, and the"Listing Index Tree" and the navigation tool buttons will no longer work. If you need to edit you listing for one reason or another,first make a copy of it (your "ProjectName.lst" file) and then edit the copy!
7.4 ERROR FILEDuring an adjustment, errors or warnings messages may be issued by the program. If the processing summary indicates thatthere were errors or warnings, you should always view them to see what course of action should be taken.
To view the Error file, chooseOutput>Errors, or press the Errors tool button. Note that the Errors tool button (the red excla-mationmark) only becomes active if an error file has been created. And like other output files, when the error file window isactive, the file can be printed by choosing File>Print, or by pressing the Print tool button.
An extensive list of error and warningmessages and their meanings can be found later in Appendix D: Errors & Warnings.
7.5 ADJUSTED POINTSSeveral types of adjusted point files are optionally created during an adjustment, including the coordinates, latitudes and lon-gitudes (for grid jobs), and scaled-to-ground coordinates. View any of these files by selecting them from theOutputmenu.
For the LEV edition, the Coordinates file will contain only the adjusted elevations. View this file by selecting “Coordinates” fromtheOutput menu.
And like any of the output files, when selected file window is active, the file can be printed by choosing File>Print, or by press-ing the Print tool button.
Another output file, the comma-delimited dump, contains detailed information about every adjusted station. It can be viewedand printed just like the other adjusted points files above, however, its primary purpose is for importing into a spread sheet ordatabase program as discussed in Chapter 4, "Options."
7.6 NETWORK PLOTTo view the Plot, chooseOutput>Plot, or press the Plot tool button.
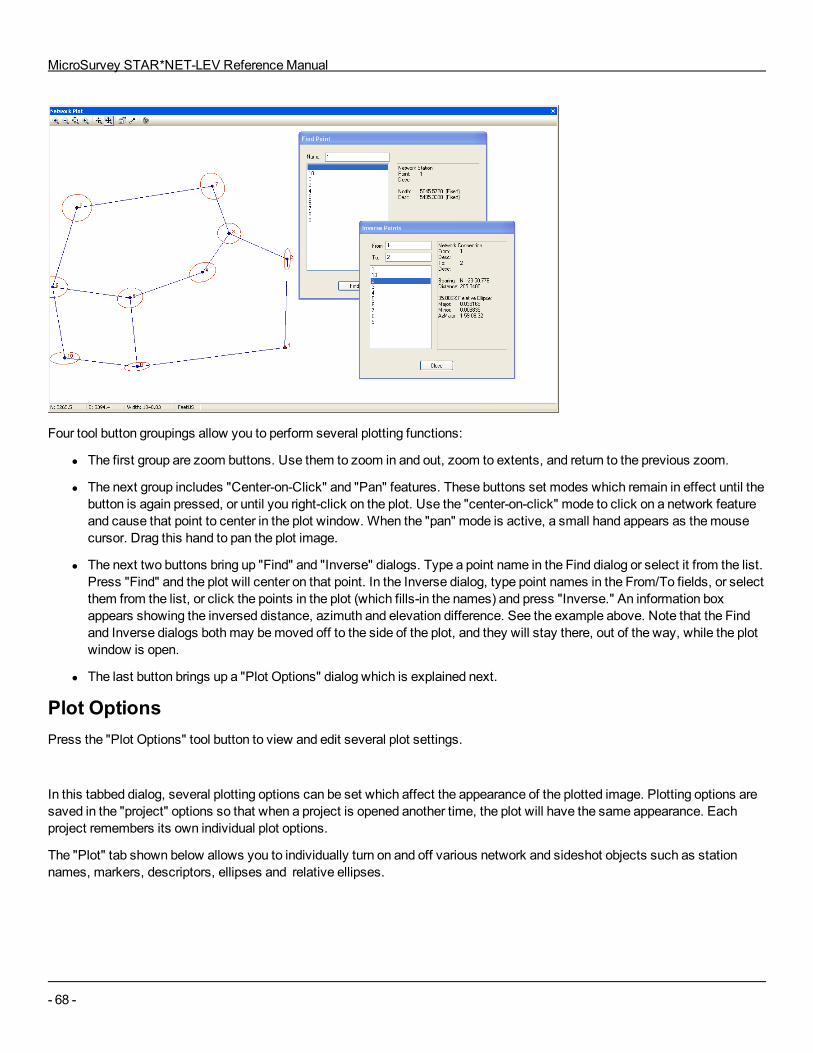
MicroSurvey STAR*NET-LEV ReferenceManual
- 68 -
Four tool button groupings allow you to perform several plotting functions:
l The first group are zoom buttons. Use them to zoom in and out, zoom to extents, and return to the previous zoom.
l The next group includes "Center-on-Click" and "Pan" features. These buttons set modes which remain in effect until thebutton is again pressed, or until you right-click on the plot. Use the "center-on-click" mode to click on a network featureand cause that point to center in the plot window. When the "pan" mode is active, a small hand appears as themousecursor. Drag this hand to pan the plot image.
l The next two buttons bring up "Find" and "Inverse" dialogs. Type a point name in the Find dialog or select it from the list.Press "Find" and the plot will center on that point. In the Inverse dialog, type point names in the From/To fields, or selectthem from the list, or click the points in the plot (which fills-in the names) and press "Inverse." An information boxappears showing the inversed distance, azimuth and elevation difference. See the example above. Note that the Findand Inverse dialogs bothmay bemoved off to the side of the plot, and they will stay there, out of the way, while the plotwindow is open.
l The last button brings up a "Plot Options" dialog which is explained next.
Plot OptionsPress the "Plot Options" tool button to view and edit several plot settings.
In this tabbed dialog, several plotting options can be set which affect the appearance of the plotted image. Plotting options aresaved in the "project" options so that when a project is opened another time, the plot will have the same appearance. Eachproject remembers its own individual plot options.
The "Plot" tab shown below allows you to individually turn on and off various network and sideshot objects such as stationnames, markers, descriptors, ellipses and relative ellipses.

Chapter 7: Viewing and Printing Output
- 69 -
The "Sizing" tab allows you to resize text, markers and ellipses. The initial ellipse exaggeration for a plot is automatically set toa show the largest ellipse at some percentage of the plot extents. You can change the exaggeration, or at any time press"Reset" to change back to the automatic value.
The "Special" tab shown below includes options useful when viewing certain types of plots. For example, the "Show OnlyFixed Names and StationMarkers" option shows only your "fixed" control points in a network plot.
The "Save" tab allows you to save the current settings (which plotting objects to show, sizes of names andmarkers, etc.) astypical so that they will be used as starting defaults for any new job created. Note that ellipse exaggeration is not saved as typ-ical; ellipse sizes are handled separately for every project.
Press the "Apply" button any time to see the effects of any setting changes.
Popup "Quick Change" MenuPop up a "Quick Change" menu by right-clicking anywhere on the plot. Click any item on themenu to perform a single function.For example, to quickly turn network "Names" off, first right-click to get the quick changemenu, and then click the "ShowNames" item to uncheck or disable names.
You can also access all the "Tool Button" functions from this popupmenu as well as bring up the full the Plot Options dialog dis-cussed on the previous page.
Use this quick changemenu for an easy way to access the Plot Page Setup dialog for setting up the printer before previewingor printing a network plot. Printing of your plot is described later in this section.
Other basic mouse operations in the plot window include the following:
l Drag a box around any area of the plot to quickly zoom in. Drag a zoom-box by holding down the left mouse button anddragging a rectangular enclosure.
l Double-click any point or line to get its adjusted information including error ellipse values if error propagation was per-formed. The information box can bemoved off to one side, out of the way. Double-click another point or line and the infor-mation box will refresh.
The example shown is adjusted information for station 5 including coordinates, elevation and error propagated ellipsevalues.
l As youmove themouse around the plot window, North and East coordinates displayed in the status line are con-tinuously updated with the project coordinates at themouse pointer. The width of the window is shown in project unitsso that any time you zoom in, or resize the window, you always have a good sense of the plot scale.
Just like with the ListingWindow, the Plot Window also has amemory. Once you size and locate the window, the next time theprogram is run and a plot is displayed, the plot window automatically appears the same size and in the same location.
7.7 PRINT / PRINT PREVIEWYou can Preview or Print any of your input or output files or the network plot by running the File | Print or File | Print Previewcommands. The two commands are identical, they are both provided tomake it easier for users to find the desired command.
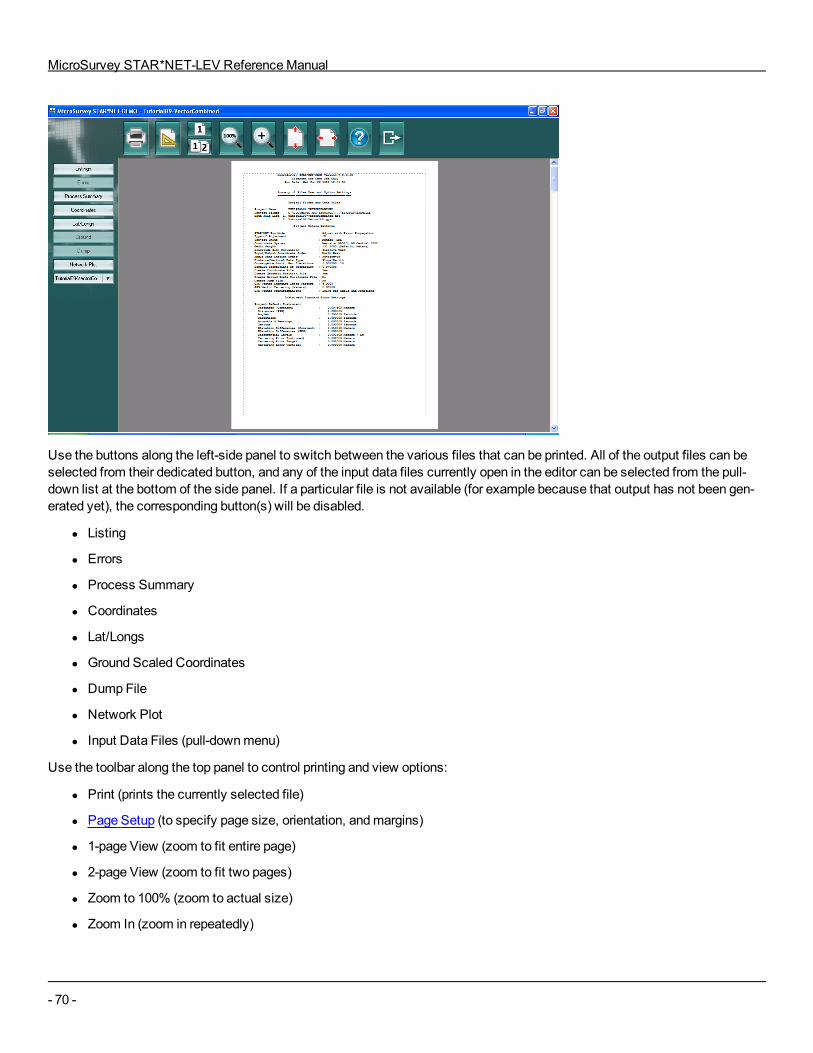
MicroSurvey STAR*NET-LEV ReferenceManual
- 70 -
Use the buttons along the left-side panel to switch between the various files that can be printed. All of the output files can beselected from their dedicated button, and any of the input data files currently open in the editor can be selected from the pull-down list at the bottom of the side panel. If a particular file is not available (for example because that output has not been gen-erated yet), the corresponding button(s) will be disabled.
l Listing
l Errors
l Process Summary
l Coordinates
l Lat/Longs
l Ground Scaled Coordinates
l Dump File
l Network Plot
l Input Data Files (pull-downmenu)
Use the toolbar along the top panel to control printing and view options:
l Print (prints the currently selected file)
l Page Setup (to specify page size, orientation, andmargins)
l 1-page View (zoom to fit entire page)
l 2-page View (zoom to fit two pages)
l Zoom to 100% (zoom to actual size)
l Zoom In (zoom in repeatedly)

Chapter 7: Viewing and Printing Output
- 71 -
l Zoom to Page Height
l Zoom to PageWidth
l Help
l Close Preview
To exit from the Print/Print Preview screen and return to the editor, youmust use the Close Preview button on the top toolbarpanel. Clicking the X button in the top-right corner will exit the entire application after a confirmation prompt.
A few words should be said about composing your network plot on the sheet. Plotting in this program is simply printing a dia-gram. There is no precise control of plotting scale or sizing of point names or markers. However, the general appearance of thediagram can be easily controlled by resizing the plot window to the approximate shape and orientation of the target sheet. Place(by zooming or panning) the network image within the plot window exactly how you want it to appear on your final sheet.Resize the point names andmarkers larger or smaller, resize the ellipses (or turn them off), etc. What you see will be what youget. Preview the plot, and then if necessary, make any changes before printing. You will need to experiment with this.

MicroSurvey STAR*NET-LEV ReferenceManual
- 72 -
Chapter 8: ANALYSIS OF ADJUSTMENT OUTPUT
- 73 -
CHAPTER 8: ANALYSIS OF ADJUSTMENT OUTPUT8.1 OVERVIEWYour objectives in performing a Least Squares Survey Adjustment are to eliminate blunders from your data, compute the bestfit adjustment for all survey observations simultaneously, and to evaluate the accuracies of the adjusted survey points.
This chapter is designed to help you interpret a STAR*NET adjustment output listing. You can use the output listing to :
n Review all of your input field observations
n Locate and correct gross blunders in your input data
n Analyze the strength of your survey observations
n Determine the positional accuracies of computed elevations
STAR*NET stores the output from an adjustment in a file called “PROJECT.LST”, where “PROJECT” is the name of your cur-rent project. You can view this file within the program by choosing Output>Listing, or by pressing the Listing tool button.
You control the sections that STAR*NET places in the output listing file by settings in the Project Options/Listing dialog. Dur-ing the data checking phase, youmay want to produce aminimally detailed listing, and then later, turn on additional sections ofthe report you now want included. Depending on the type of adjustment, some of the output listing sections shown below willnot be available.
8.2 SECTIONS OF THE OUTPUT LISTINGn Summary of Files Used andOptions Settings
n Listing of Input Data Files (optional)
n Summary of Unadjusted Input Observations (optional)
n Adjustment Statistical Summary
n Coordinate Changes from Entered Provisionals (optional)
n Adjusted Elevations and Error Propagation (optional)
n Adjusted Observations and Residuals (optional)
The remainder of this chapter discusses each section of the output listing file, providing hints on adjustment analysis. It con-cludes with a section of procedures that you can follow to locate and correct errors in your survey data.
8.3 SUMMARY OF FILES USED AND OPTIONS SETTINGSThe first few lines of the listing file identify the version of STAR*NET that you are using, and your licensing information. Theexact time and date of the run is shown, so that you can keep track of multiple runs of the same project.
The project name, project folder and names of all input data files used in the adjustment are listed next.
Last comes a summary of the option settings that were in effect at run time.
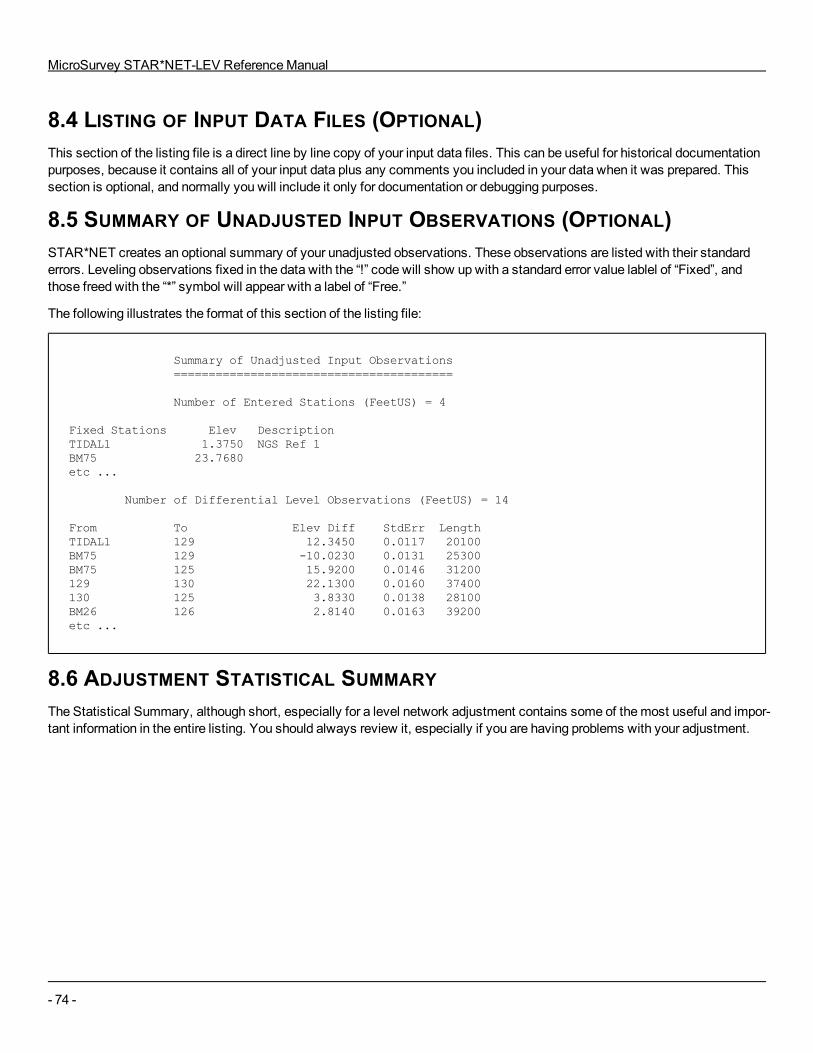
MicroSurvey STAR*NET-LEV ReferenceManual
- 74 -
8.4 LISTING OF INPUT DATA FILES (OPTIONAL)This section of the listing file is a direct line by line copy of your input data files. This can be useful for historical documentationpurposes, because it contains all of your input data plus any comments you included in your data when it was prepared. Thissection is optional, and normally you will include it only for documentation or debugging purposes.
8.5 SUMMARY OF UNADJUSTED INPUT OBSERVATIONS (OPTIONAL)STAR*NET creates an optional summary of your unadjusted observations. These observations are listed with their standarderrors. Leveling observations fixed in the data with the “!” code will show up with a standard error value lablel of “Fixed”, andthose freed with the “*” symbol will appear with a label of “Free.”
The following illustrates the format of this section of the listing file:
Summary of Unadjusted Input Observations========================================
Number of Entered Stations (FeetUS) = 4
Fixed Stations Elev DescriptionTIDAL1 1.3750 NGS Ref 1BM75 23.7680etc ...
Number of Differential Level Observations (FeetUS) = 14
From To Elev Diff StdErr LengthTIDAL1 129 12.3450 0.0117 20100BM75 129 -10.0230 0.0131 25300BM75 125 15.9200 0.0146 31200129 130 22.1300 0.0160 37400130 125 3.8330 0.0138 28100BM26 126 2.8140 0.0163 39200etc ...
8.6 ADJUSTMENT STATISTICAL SUMMARYThe Statistical Summary, although short, especially for a level network adjustment contains some of themost useful and impor-tant information in the entire listing. You should always review it, especially if you are having problems with your adjustment.
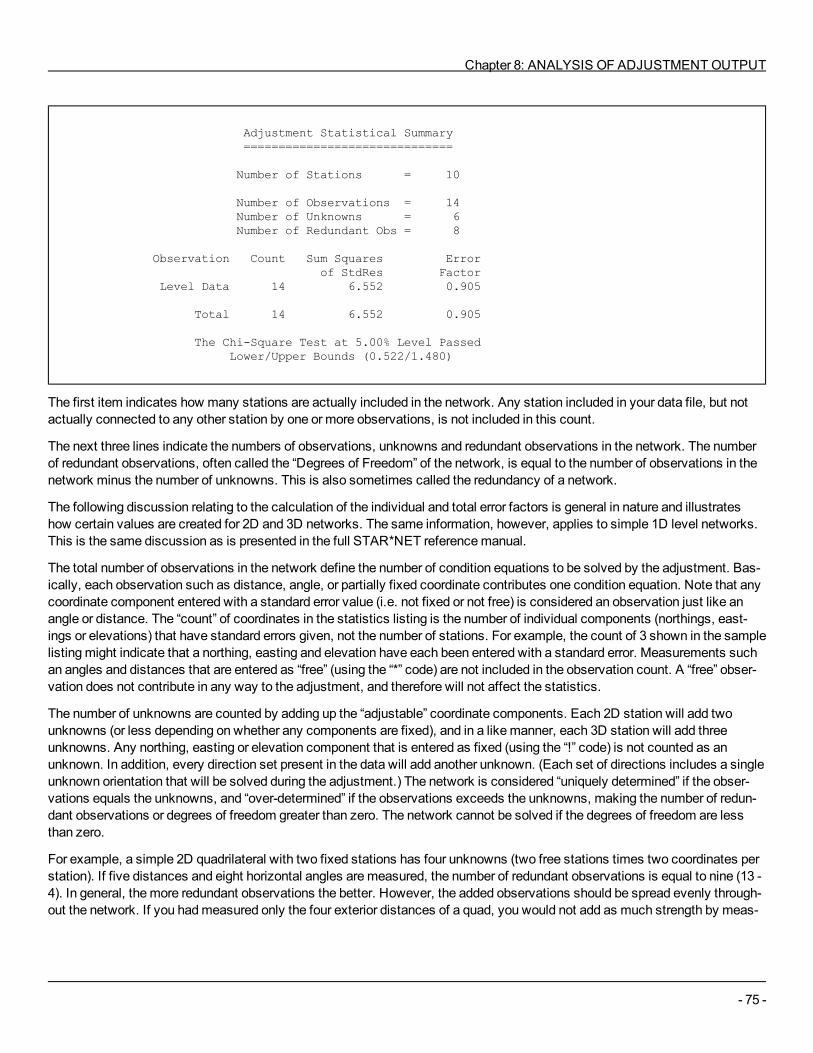
Chapter 8: ANALYSIS OF ADJUSTMENT OUTPUT
- 75 -
Adjustment Statistical Summary==============================
Number of Stations = 10
Number of Observations = 14Number of Unknowns = 6Number of Redundant Obs = 8
Observation Count Sum Squares Errorof StdRes Factor
Level Data 14 6.552 0.905
Total 14 6.552 0.905
The Chi-Square Test at 5.00% Level PassedLower/Upper Bounds (0.522/1.480)
The first item indicates how many stations are actually included in the network. Any station included in your data file, but notactually connected to any other station by one or more observations, is not included in this count.
The next three lines indicate the numbers of observations, unknowns and redundant observations in the network. The numberof redundant observations, often called the “Degrees of Freedom” of the network, is equal to the number of observations in thenetwork minus the number of unknowns. This is also sometimes called the redundancy of a network.
The following discussion relating to the calculation of the individual and total error factors is general in nature and illustrateshow certain values are created for 2D and 3D networks. The same information, however, applies to simple 1D level networks.This is the same discussion as is presented in the full STAR*NET referencemanual.
The total number of observations in the network define the number of condition equations to be solved by the adjustment. Bas-ically, each observation such as distance, angle, or partially fixed coordinate contributes one condition equation. Note that anycoordinate component entered with a standard error value (i.e. not fixed or not free) is considered an observation just like anangle or distance. The “count” of coordinates in the statistics listing is the number of individual components (northings, east-ings or elevations) that have standard errors given, not the number of stations. For example, the count of 3 shown in the samplelistingmight indicate that a northing, easting and elevation have each been entered with a standard error. Measurements suchan angles and distances that are entered as “free” (using the “*” code) are not included in the observation count. A “free” obser-vation does not contribute in any way to the adjustment, and therefore will not affect the statistics.
The number of unknowns are counted by adding up the “adjustable” coordinate components. Each 2D station will add twounknowns (or less depending on whether any components are fixed), and in a likemanner, each 3D station will add threeunknowns. Any northing, easting or elevation component that is entered as fixed (using the “!” code) is not counted as anunknown. In addition, every direction set present in the data will add another unknown. (Each set of directions includes a singleunknown orientation that will be solved during the adjustment.) The network is considered “uniquely determined” if the obser-vations equals the unknowns, and “over-determined” if the observations exceeds the unknowns, making the number of redun-dant observations or degrees of freedom greater than zero. The network cannot be solved if the degrees of freedom are lessthan zero.
For example, a simple 2D quadrilateral with two fixed stations has four unknowns (two free stations times two coordinates perstation). If five distances and eight horizontal angles aremeasured, the number of redundant observations is equal to nine (13 -4). In general, themore redundant observations the better. However, the added observations should be spread evenly through-out the network. If you hadmeasured only the four exterior distances of a quad, you would not add as much strength by meas-
MicroSurvey STAR*NET-LEV ReferenceManual
- 76 -
uring those distance twice, compared tomeasuring the cross-quad distances, even though youmight add the same number ofdegrees of freedom to the solution.
Next, the Statistical Summary contains a line for each data type existing in the network. Each line lists a count of the numberof observations of that type, the sum of the squares of their standardized residuals, and an error factor. A residual is the amountthe adjustment changed your input observation. In other words, the residual is simply the difference between the value youobserved in the field, and the value that fits best into the final adjusted network. The standardized residual is the actual residualdivided by its standard error value. This value is listed in the “StdRes” column for every observation in the “Adjusted Obser-vations and Residuals” section of your output listing file.
To compute each total in the “Sum Squares of StdRes” column, each Standardized Residual is squared and summed. (Thistotal is also often called the sum of the squares of the weighted residuals.) A large total for this summation is not that mean-ingful in itself, because the size of the total is a function of the number of observations of that data type. The totals displayed inthe Error Factor column, however, are adjusted by the number of observations, and are a good indication of how well each datatype fits into the adjustment. Among different data types, these Error Factors should be roughly equal, and should all approx-imately be within a range of 0.5 to 1.5. If for example, the Error Factor for angles is equal to 15.7 and that for distances is equalto 2.3, then there is almost certainly a problem with the angles in the adjustment.
An Error Factor may be large for several reasons. Theremay be one or more large errors in the input data, theremay be a sys-tematic error (i.e. EDM calibration problem), or youmay have assigned standard errors that are unrealistically small. Note alsothat a large angle error can easily inflate the distance Error Factor, due to the interconnection of common stations. The final sec-tion in this chapter provides a number of techniques for locating potential sources of problems in the adjustment.
The “Total Error Factor” is an important item in the Statistical Summary. It is calculated as the square root of the Total Sum ofthe Squares of the Standardized Residuals divided by the Number of Redundancies:
SQRT (Total Sum Squares of StdRes / Number of Redundancies)
The Total Error Factor is also commonly referred to as the Reference Factor, or the Standard Error of Unit Weight. This value isused for statistical testing of the adjustment, as explained in the next section.
Finally, at the end of the Statistical Summary, there is an indication whether on not the adjustment passed the Chi Square test.This test is discussed next.
8.7 CHI SQUARE TESTAfter the iterations of an adjustment solution cease, STAR*NET tests the adjustment to determine whether the resulting resid-uals are likely due to random errors by performing a two-tailed Chi Square statistical test at the significance level specified inthe Project Options General dialog. A 5% significance level is the is the generally accepted level to accept or reject a statisticalhypothesis.
In statistics, a c2 value (a Chi Square statistic) derived from a process having random errors will, on infinite repetition, producea frequency distribution that is a function of the number of degrees of freedom. For example, assuming a 5% significance level,the two-tailed Chi Square test checks whether a particular c2 value falls within themiddle 95% region of all possible c2 valuesin the distribution. If it does, the c2 value is accepted (i.e. the Chi Square test passed) as due to random error influences. If not,the c2 value fell either in the lower 2.5% or upper 2.5% of the distribution (the Chi Square test did not pass), and it is assumeddue to non-random error causes – systematic errors, blunders, incorrect standard errors, etc.
In a least squares adjustment of survey observations, the sum of the squares of the standardized residuals is a c2 statistic.The frequency distribution for this statistic could be determined by repeatingmany times without systematic error or blunderthe same exact survey and adjustment, each time producing a new and likely different sum of the squares of standardizedresiduals. The collection of sums can be represented as a frequency distribution which can then be used to test acceptance ofthe residuals in the first survey. Fortunately, this huge effort isn’t necessary because we know that all c2 statistics, including

Chapter 8: ANALYSIS OF ADJUSTMENT OUTPUT
- 77 -
the sum of the squares of the standardized residuals, conform to themathematical formula for the Chi Square distribution,which is dependent only on the number of degrees of freedom.
In a STAR*NET survey adjustment, the number of degrees of freedom is the difference between the number of observationsand the number of unknowns, i.e. the redundancy in the survey. Observations consist of the usual field measurements that arenot declared free, together with any coordinate values entered with partial fixity. The count of unknowns includes all connectedcoordinates that are not fixed, one internal orientation for each direction set, and the computed transformations applied to GPSvectors.
An alternate view of the Chi Square test is that it compares the Total Error Factor obtained in the adjustment against itsexpected value of 1.0. The total error factor is a function of the sum of the squares of the standardized residuals and thenumber of degrees of freedom in the adjustment. When the sum of the squares of the standardized residuals is exactly in themiddle of its random distribution and as the number of degrees of freedom increases, the total error factor approaches exactly1.0. The assumption that the adjustment residuals are due solely to random influences is rejected when the total error factor issmaller than or larger than 1.0 by somemagnitude dependent on the number of degrees of freedom and the confidence leveldesired.
The Chi Square test can fail by exceeding the upper bound or the lower bound. When the test fails, a warning is printed at theend of the Statistical Summary indicating which bound was exceeded. This example failed by exceeding the upper bound.
Warning: The Chi-Square Test at 5.00% Level Exceeded Upper Bound
Lower/Upper Bounds (0.522/1.480)
When the Chi Square test fails by exceeding the upper bound, this indicates that youmay have excessive residuals and/or youmay havemisstated the observation standard errors by setting them too small. You should always determine the reason a ChiSquare test fails by exceeding the upper boundary andmake necessary corrections.
When the Chi Square test fails by exceeding (being lower than) the lower bound, there is usually no serious problem but youshould still determine the reason why. This usually indicates that the residuals are smaller than what is expected relative to theapplied standard errors. If you feel your standard errors are proper, no changes are necessary.
In summary, the Chi Square test, often called the “goodness-of-fit test,” statistically tests whether your residuals are due to nor-mal random errors. If the adjustment fails the test, first check the standard error values (weighting) you have assigned to yourobservations. And if the Chi Square test failed by exceeding the upper bound, then check for mistakes which can includeblunders in your actual observations, fieldbook recording errors, or data preparation errors such as incorrectly enteredmeas-urements or misnamed stations in the input data file.
8.8 COORDINATE CHANGES FROM ENTERED PROVISIONALS (OPTIONAL)STAR*NET optionally lists differences between hand-entered provisional coordinates and final adjusted coordinates. Thisoption is particularly useful in deformation studies where the purpose is to determine how much certain stations moved sincethe previous survey. To do this, enter the specific adjusted coordinates from your previous survey as provisional (approximate)coordinates for a new survey, and request this optional listing section in the Listing options dialog. Only changes from thesehand-entered provisional coordinates will be shown in this special output listing section.
This example is from a level network adjustment. Station elevations resulting from a previous adjustment were entered as freeprovisional elevations for another adjustment. The listing section below shows the changes to those elevations since the pre-vious adjustment.
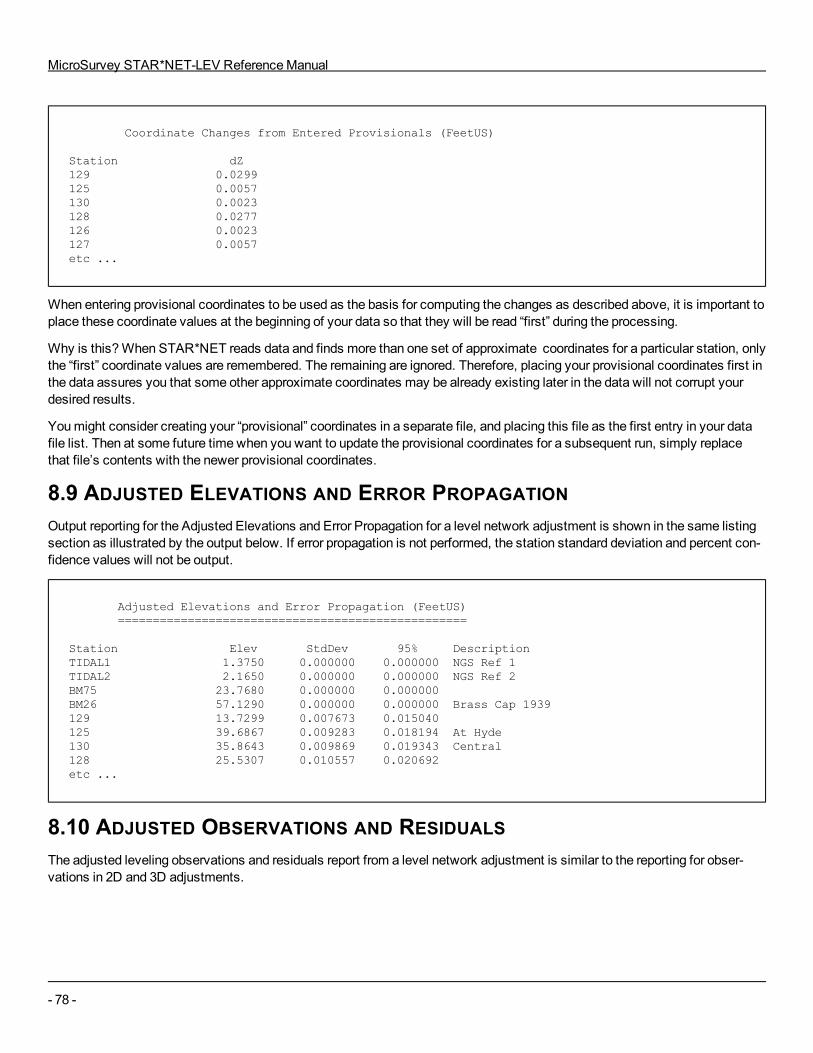
MicroSurvey STAR*NET-LEV ReferenceManual
- 78 -
Coordinate Changes from Entered Provisionals (FeetUS)
Station dZ129 0.0299125 0.0057130 0.0023128 0.0277126 0.0023127 0.0057etc ...
When entering provisional coordinates to be used as the basis for computing the changes as described above, it is important toplace these coordinate values at the beginning of your data so that they will be read “first” during the processing.
Why is this?When STAR*NET reads data and finds more than one set of approximate coordinates for a particular station, onlythe “first” coordinate values are remembered. The remaining are ignored. Therefore, placing your provisional coordinates first inthe data assures you that some other approximate coordinates may be already existing later in the data will not corrupt yourdesired results.
Youmight consider creating your “provisional” coordinates in a separate file, and placing this file as the first entry in your datafile list. Then at some future time when you want to update the provisional coordinates for a subsequent run, simply replacethat file’s contents with the newer provisional coordinates.
8.9 ADJUSTED ELEVATIONS AND ERROR PROPAGATIONOutput reporting for the Adjusted Elevations and Error Propagation for a level network adjustment is shown in the same listingsection as illustrated by the output below. If error propagation is not performed, the station standard deviation and percent con-fidence values will not be output.
Adjusted Elevations and Error Propagation (FeetUS)==================================================
Station Elev StdDev 95% DescriptionTIDAL1 1.3750 0.000000 0.000000 NGS Ref 1TIDAL2 2.1650 0.000000 0.000000 NGS Ref 2BM75 23.7680 0.000000 0.000000BM26 57.1290 0.000000 0.000000 Brass Cap 1939129 13.7299 0.007673 0.015040125 39.6867 0.009283 0.018194 At Hyde130 35.8643 0.009869 0.019343 Central128 25.5307 0.010557 0.020692etc ...
8.10 ADJUSTED OBSERVATIONS AND RESIDUALSThe adjusted leveling observations and residuals report from a level network adjustment is similar to the reporting for obser-vations in 2D and 3D adjustments.
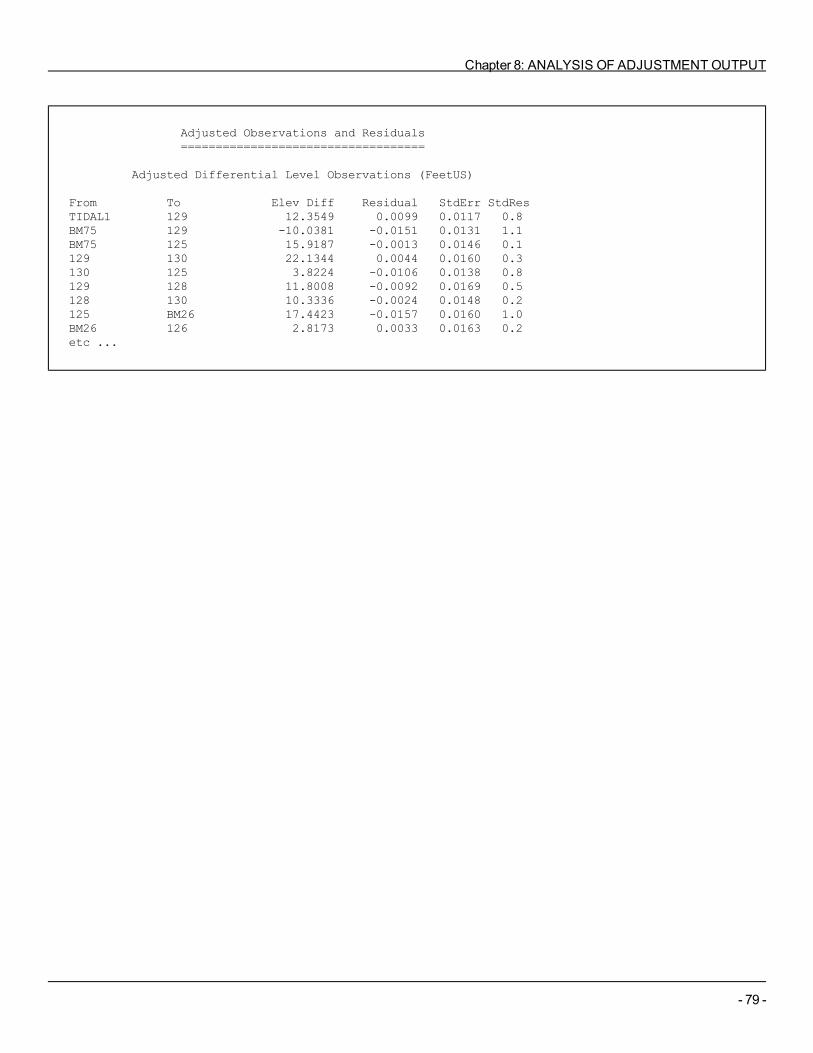
Chapter 8: ANALYSIS OF ADJUSTMENT OUTPUT
- 79 -
Adjusted Observations and Residuals===================================
Adjusted Differential Level Observations (FeetUS)
From To Elev Diff Residual StdErr StdResTIDAL1 129 12.3549 0.0099 0.0117 0.8BM75 129 -10.0381 -0.0151 0.0131 1.1BM75 125 15.9187 -0.0013 0.0146 0.1129 130 22.1344 0.0044 0.0160 0.3130 125 3.8224 -0.0106 0.0138 0.8129 128 11.8008 -0.0092 0.0169 0.5128 130 10.3336 -0.0024 0.0148 0.2125 BM26 17.4423 -0.0157 0.0160 1.0BM26 126 2.8173 0.0033 0.0163 0.2etc ...

MicroSurvey STAR*NET-LEV ReferenceManual
- 80 -
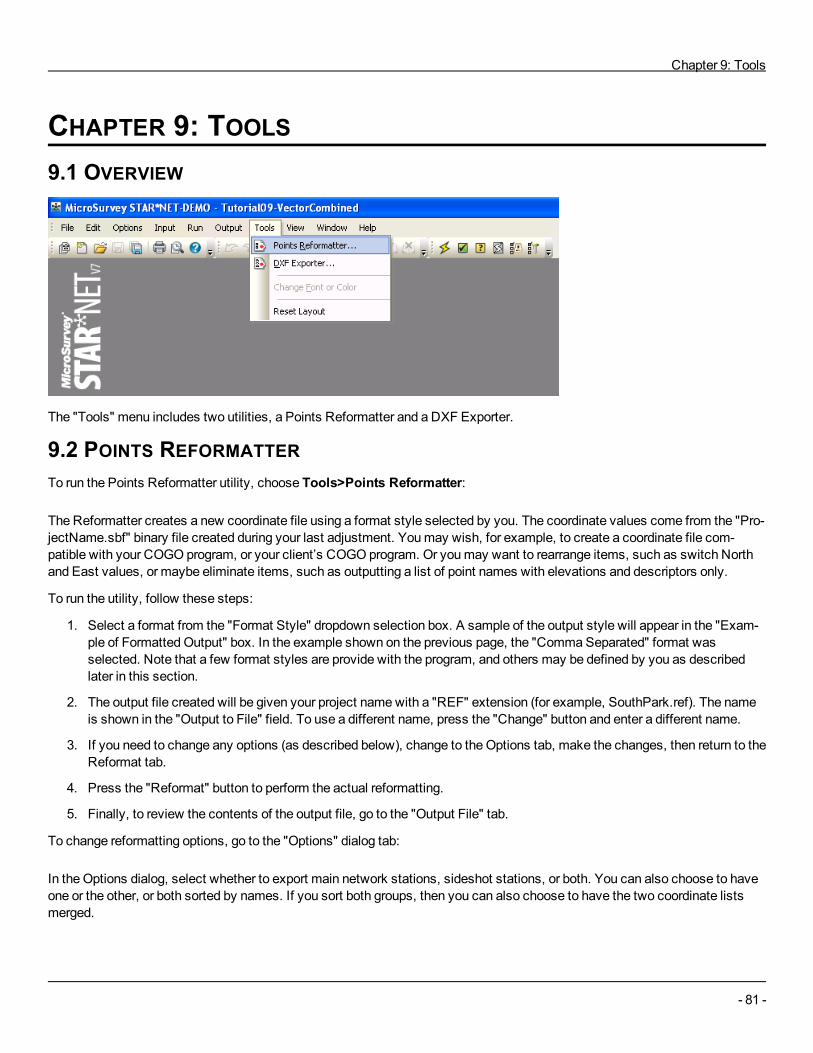
Chapter 9: Tools
- 81 -
CHAPTER 9: TOOLS9.1 OVERVIEW
The "Tools" menu includes two utilities, a Points Reformatter and a DXF Exporter.
9.2 POINTS REFORMATTERTo run the Points Reformatter utility, choose Tools>Points Reformatter:
The Reformatter creates a new coordinate file using a format style selected by you. The coordinate values come from the "Pro-jectName.sbf" binary file created during your last adjustment. Youmay wish, for example, to create a coordinate file com-patible with your COGO program, or your client’s COGO program. Or youmay want to rearrange items, such as switch Northand East values, or maybe eliminate items, such as outputting a list of point names with elevations and descriptors only.
To run the utility, follow these steps:
1. Select a format from the "Format Style" dropdown selection box. A sample of the output style will appear in the "Exam-ple of Formatted Output" box. In the example shown on the previous page, the "CommaSeparated" format wasselected. Note that a few format styles are provide with the program, and others may be defined by you as describedlater in this section.
2. The output file created will be given your project namewith a "REF" extension (for example, SouthPark.ref). The nameis shown in the "Output to File" field. To use a different name, press the "Change" button and enter a different name.
3. If you need to change any options (as described below), change to the Options tab, make the changes, then return to theReformat tab.
4. Press the "Reformat" button to perform the actual reformatting.
5. Finally, to review the contents of the output file, go to the "Output File" tab.
To change reformatting options, go to the "Options" dialog tab:
In the Options dialog, select whether to export main network stations, sideshot stations, or both. You can also choose to haveone or the other, or both sorted by names. If you sort both groups, then you can also choose to have the two coordinate listsmerged.
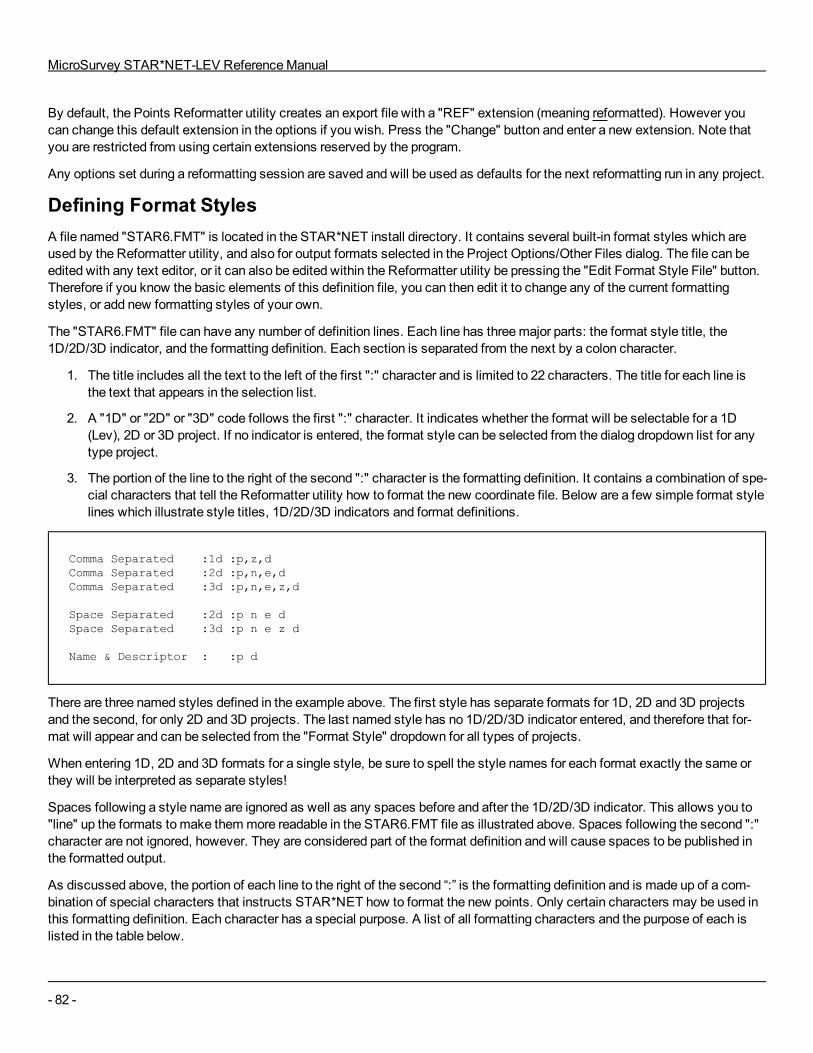
MicroSurvey STAR*NET-LEV ReferenceManual
- 82 -
By default, the Points Reformatter utility creates an export file with a "REF" extension (meaning reformatted). However youcan change this default extension in the options if you wish. Press the "Change" button and enter a new extension. Note thatyou are restricted from using certain extensions reserved by the program.
Any options set during a reformatting session are saved and will be used as defaults for the next reformatting run in any project.
Defining Format StylesA file named "STAR6.FMT" is located in the STAR*NET install directory. It contains several built-in format styles which areused by the Reformatter utility, and also for output formats selected in the Project Options/Other Files dialog. The file can beedited with any text editor, or it can also be edited within the Reformatter utility be pressing the "Edit Format Style File" button.Therefore if you know the basic elements of this definition file, you can then edit it to change any of the current formattingstyles, or add new formatting styles of your own.
The "STAR6.FMT" file can have any number of definition lines. Each line has threemajor parts: the format style title, the1D/2D/3D indicator, and the formatting definition. Each section is separated from the next by a colon character.
1. The title includes all the text to the left of the first ":" character and is limited to 22 characters. The title for each line isthe text that appears in the selection list.
2. A "1D" or "2D" or "3D" code follows the first ":" character. It indicates whether the format will be selectable for a 1D(Lev), 2D or 3D project. If no indicator is entered, the format style can be selected from the dialog dropdown list for anytype project.
3. The portion of the line to the right of the second ":" character is the formatting definition. It contains a combination of spe-cial characters that tell the Reformatter utility how to format the new coordinate file. Below are a few simple format stylelines which illustrate style titles, 1D/2D/3D indicators and format definitions.
Comma Separated :1d :p,z,dComma Separated :2d :p,n,e,dComma Separated :3d :p,n,e,z,d
Space Separated :2d :p n e dSpace Separated :3d :p n e z d
Name & Descriptor : :p d
There are three named styles defined in the example above. The first style has separate formats for 1D, 2D and 3D projectsand the second, for only 2D and 3D projects. The last named style has no 1D/2D/3D indicator entered, and therefore that for-mat will appear and can be selected from the "Format Style" dropdown for all types of projects.
When entering 1D, 2D and 3D formats for a single style, be sure to spell the style names for each format exactly the same orthey will be interpreted as separate styles!
Spaces following a style name are ignored as well as any spaces before and after the 1D/2D/3D indicator. This allows you to"line" up the formats tomake themmore readable in the STAR6.FMT file as illustrated above. Spaces following the second ":"character are not ignored, however. They are considered part of the format definition and will cause spaces to be published inthe formatted output.
As discussed above, the portion of each line to the right of the second “:” is the formatting definition and is made up of a com-bination of special characters that instructs STAR*NET how to format the new points. Only certain characters may be used inthis formatting definition. Each character has a special purpose. A list of all formatting characters and the purpose of each islisted in the table below.
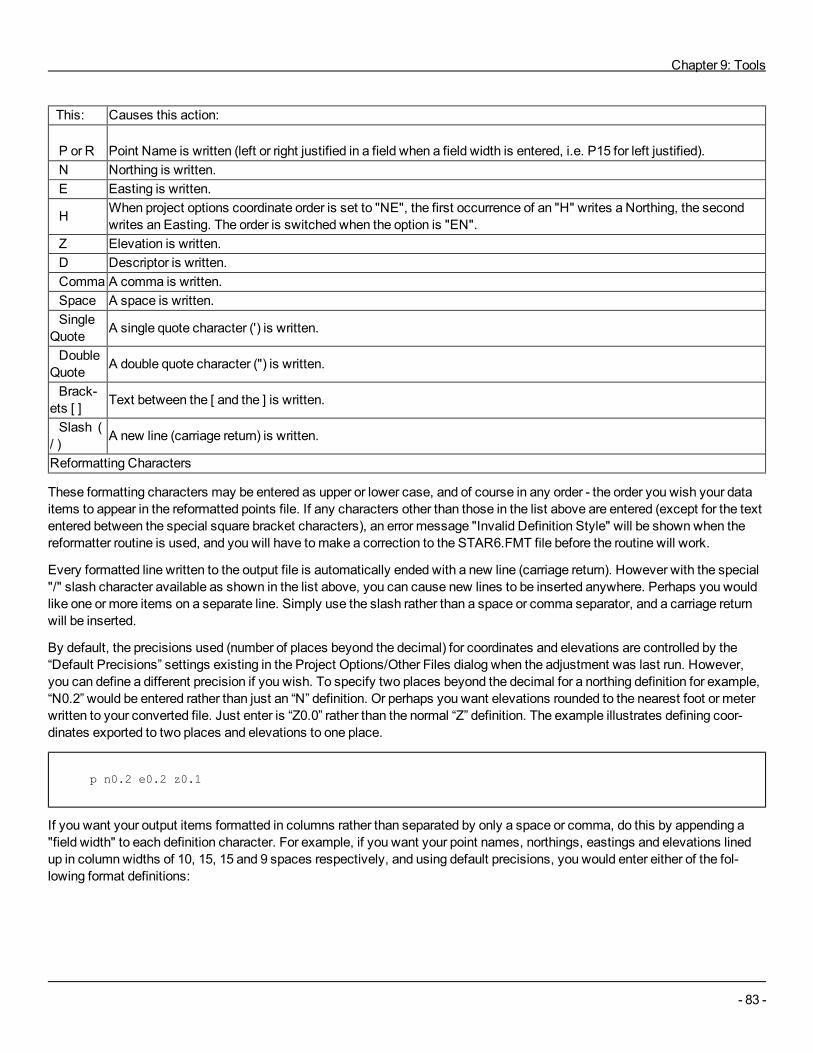
Chapter 9: Tools
- 83 -
This: Causes this action:
P or R Point Name is written (left or right justified in a field when a field width is entered, i.e. P15 for left justified).N Northing is written.E Easting is written.
H When project options coordinate order is set to "NE", the first occurrence of an "H" writes a Northing, the second writes an Easting. The order is switched when the option is "EN".
Z Elevation is written.D Descriptor is written.Comma A comma is written.Space A space is written.Single
Quote A single quote character (') is written.
DoubleQuote A double quote character (") is written.
Brack-ets [ ] Text between the [ and the ] is written.
Slash (/ ) A new line (carriage return) is written.
Reformatting Characters
These formatting characters may be entered as upper or lower case, and of course in any order - the order you wish your dataitems to appear in the reformatted points file. If any characters other than those in the list above are entered (except for the textentered between the special square bracket characters), an error message "Invalid Definition Style" will be shownwhen thereformatter routine is used, and you will have tomake a correction to the STAR6.FMT file before the routine will work.
Every formatted line written to the output file is automatically ended with a new line (carriage return). However with the special"/" slash character available as shown in the list above, you can cause new lines to be inserted anywhere. Perhaps you wouldlike one or more items on a separate line. Simply use the slash rather than a space or comma separator, and a carriage returnwill be inserted.
By default, the precisions used (number of places beyond the decimal) for coordinates and elevations are controlled by the“Default Precisions” settings existing in the Project Options/Other Files dialog when the adjustment was last run. However,you can define a different precision if you wish. To specify two places beyond the decimal for a northing definition for example,“N0.2” would be entered rather than just an “N” definition. Or perhaps you want elevations rounded to the nearest foot or meterwritten to your converted file. Just enter is “Z0.0” rather than the normal “Z” definition. The example illustrates defining coor-dinates exported to two places and elevations to one place.
p n0.2 e0.2 z0.1
If you want your output items formatted in columns rather than separated by only a space or comma, do this by appending a"field width" to each definition character. For example, if you want your point names, northings, eastings and elevations linedup in columnwidths of 10, 15, 15 and 9 spaces respectively, and using default precisions, you would enter either of the fol-lowing format definitions:
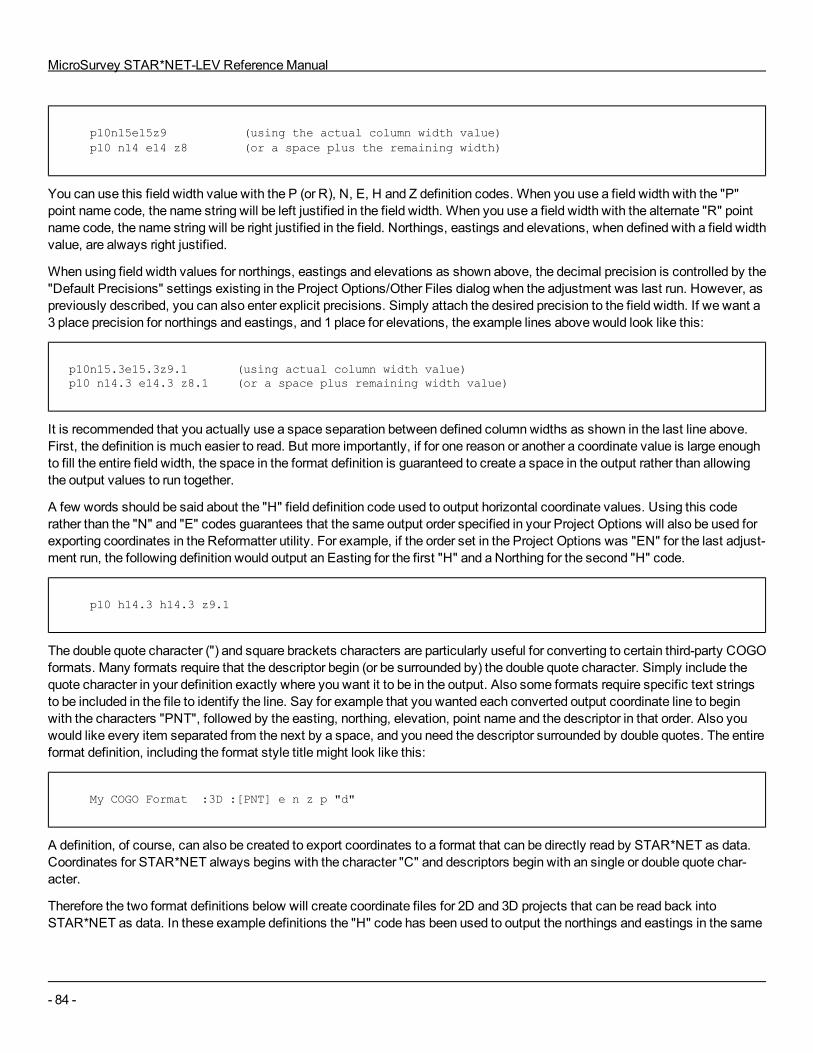
MicroSurvey STAR*NET-LEV ReferenceManual
- 84 -
p10n15e15z9 (using the actual column width value)p10 n14 e14 z8 (or a space plus the remaining width)
You can use this field width value with the P (or R), N, E, H and Z definition codes. When you use a field width with the "P"point name code, the name string will be left justified in the field width. When you use a field width with the alternate "R" pointname code, the name string will be right justified in the field. Northings, eastings and elevations, when defined with a field widthvalue, are always right justified.
When using field width values for northings, eastings and elevations as shown above, the decimal precision is controlled by the"Default Precisions" settings existing in the Project Options/Other Files dialog when the adjustment was last run. However, aspreviously described, you can also enter explicit precisions. Simply attach the desired precision to the field width. If we want a3 place precision for northings and eastings, and 1 place for elevations, the example lines above would look like this:
p10n15.3e15.3z9.1 (using actual column width value)p10 n14.3 e14.3 z8.1 (or a space plus remaining width value)
It is recommended that you actually use a space separation between defined columnwidths as shown in the last line above.First, the definition is much easier to read. But more importantly, if for one reason or another a coordinate value is large enoughto fill the entire field width, the space in the format definition is guaranteed to create a space in the output rather than allowingthe output values to run together.
A few words should be said about the "H" field definition code used to output horizontal coordinate values. Using this coderather than the "N" and "E" codes guarantees that the same output order specified in your Project Options will also be used forexporting coordinates in the Reformatter utility. For example, if the order set in the Project Options was "EN" for the last adjust-ment run, the following definition would output an Easting for the first "H" and a Northing for the second "H" code.
p10 h14.3 h14.3 z9.1
The double quote character (") and square brackets characters are particularly useful for converting to certain third-party COGOformats. Many formats require that the descriptor begin (or be surrounded by) the double quote character. Simply include thequote character in your definition exactly where you want it to be in the output. Also some formats require specific text stringsto be included in the file to identify the line. Say for example that you wanted each converted output coordinate line to beginwith the characters "PNT", followed by the easting, northing, elevation, point name and the descriptor in that order. Also youwould like every item separated from the next by a space, and you need the descriptor surrounded by double quotes. The entireformat definition, including the format style title might look like this:
My COGO Format :3D :[PNT] e n z p "d"
A definition, of course, can also be created to export coordinates to a format that can be directly read by STAR*NET as data.Coordinates for STAR*NET always begins with the character "C" and descriptors begin with an single or double quote char-acter.
Therefore the two format definitions below will create coordinate files for 2D and 3D projects that can be read back intoSTAR*NET as data. In these example definitions the "H" code has been used to output the northings and eastings in the same
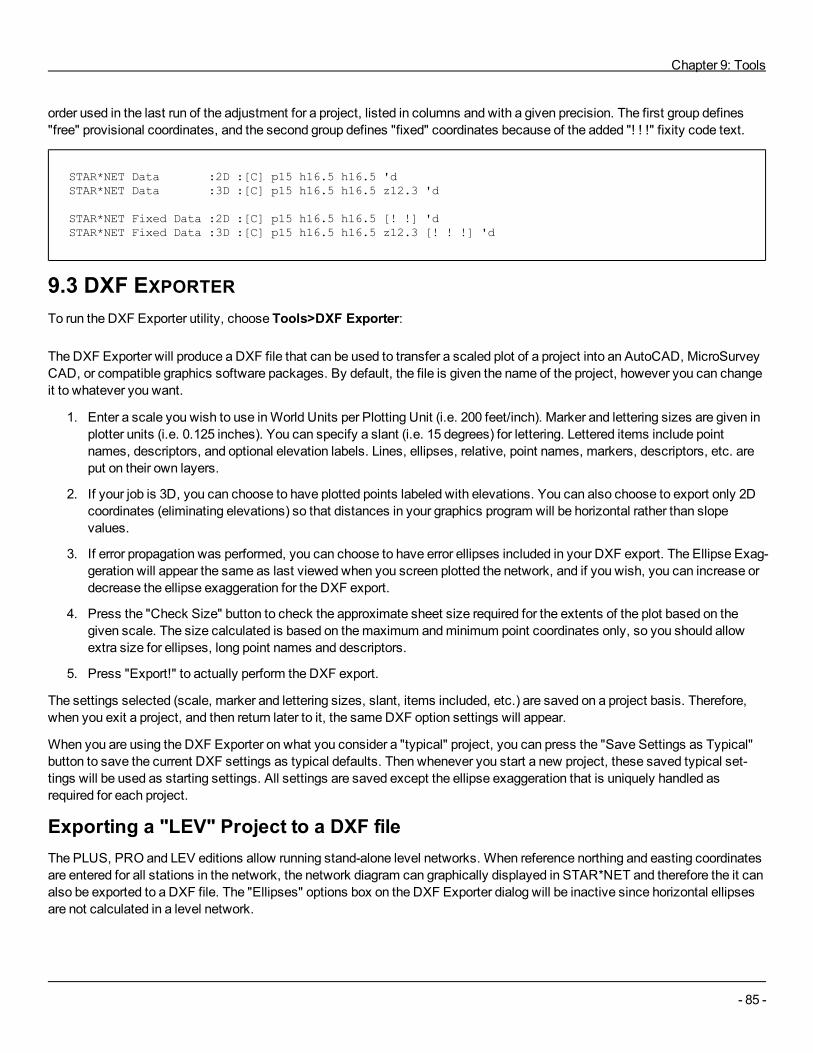
Chapter 9: Tools
- 85 -
order used in the last run of the adjustment for a project, listed in columns and with a given precision. The first group defines"free" provisional coordinates, and the second group defines "fixed" coordinates because of the added "! ! !" fixity code text.
STAR*NET Data :2D :[C] p15 h16.5 h16.5 'dSTAR*NET Data :3D :[C] p15 h16.5 h16.5 z12.3 'd
STAR*NET Fixed Data :2D :[C] p15 h16.5 h16.5 [! !] 'dSTAR*NET Fixed Data :3D :[C] p15 h16.5 h16.5 z12.3 [! ! !] 'd
9.3 DXF EXPORTERTo run the DXF Exporter utility, choose Tools>DXF Exporter:
The DXF Exporter will produce a DXF file that can be used to transfer a scaled plot of a project into an AutoCAD, MicroSurveyCAD, or compatible graphics software packages. By default, the file is given the name of the project, however you can changeit to whatever you want.
1. Enter a scale you wish to use inWorld Units per Plotting Unit (i.e. 200 feet/inch). Marker and lettering sizes are given inplotter units (i.e. 0.125 inches). You can specify a slant (i.e. 15 degrees) for lettering. Lettered items include pointnames, descriptors, and optional elevation labels. Lines, ellipses, relative, point names, markers, descriptors, etc. areput on their own layers.
2. If your job is 3D, you can choose to have plotted points labeled with elevations. You can also choose to export only 2Dcoordinates (eliminating elevations) so that distances in your graphics program will be horizontal rather than slopevalues.
3. If error propagation was performed, you can choose to have error ellipses included in your DXF export. The Ellipse Exag-geration will appear the same as last viewed when you screen plotted the network, and if you wish, you can increase ordecrease the ellipse exaggeration for the DXF export.
4. Press the "Check Size" button to check the approximate sheet size required for the extents of the plot based on thegiven scale. The size calculated is based on themaximum andminimum point coordinates only, so you should allowextra size for ellipses, long point names and descriptors.
5. Press "Export!" to actually perform the DXF export.
The settings selected (scale, marker and lettering sizes, slant, items included, etc.) are saved on a project basis. Therefore,when you exit a project, and then return later to it, the sameDXF option settings will appear.
When you are using the DXF Exporter on what you consider a "typical" project, you can press the "Save Settings as Typical"button to save the current DXF settings as typical defaults. Then whenever you start a new project, these saved typical set-tings will be used as starting settings. All settings are saved except the ellipse exaggeration that is uniquely handled asrequired for each project.
Exporting a "LEV" Project to a DXF fileThe PLUS, PRO and LEV editions allow running stand-alone level networks. When reference northing and easting coordinatesare entered for all stations in the network, the network diagram can graphically displayed in STAR*NET and therefore the it canalso be exported to a DXF file. The "Ellipses" options box on the DXF Exporter dialog will be inactive since horizontal ellipsesare not calculated in a level network.
MicroSurvey STAR*NET-LEV ReferenceManual
- 86 -
Loading the DXF File into AutoCADThe DXF file exported from STAR*NET can be directly imported into a new drawing by AutoCAD andmost other graphics pro-grams supporting the DXF file format.
If you want to import STAR*NET DXF files into an AutoCAD drawing environment that already has an established drawing pro-totype with defined entities (i.e. some third party COGO packages), here are two ways to accomplish this:
1. Themost straight-forward way is to import the DXF into AutoCAD as a new drawing that has no prototype drawingalready set, and then immediately save it to a standard DWGdrawing file. This file can then be read into another draw-ings that already has defined entities.
2. Another way is to first insert the STAR6.DWG prototype file, supplied with your installation, into your existing drawingto define the entities in the DXF file, and then you can read the DXF directly into your existing drawing. TheSTAR6.DWG file is located in the same directory that STAR*NET was installed. This file contains all the entity def-initions and layer names used by the DXF export, but no actual drawing items.
Many versions of AutoCAD exist as well as numerous other graphics programs capable of importing DXF files, and it is impos-sible to provide detailed instructions for each in this manual. Refer to instructions supplied with your particular graphics pro-gram for the its particular methods of importing DXF files.
9.4 EDITOR OPTIONSThe look and feel of the integrated editor can be customized using the Tools | Change Font and Color command. This com-mand is only available if a data file is currently open in the editor, otherwise it will be temporarily disabled.
EditorOn the Editor tab, you can specify various display and behavior options.
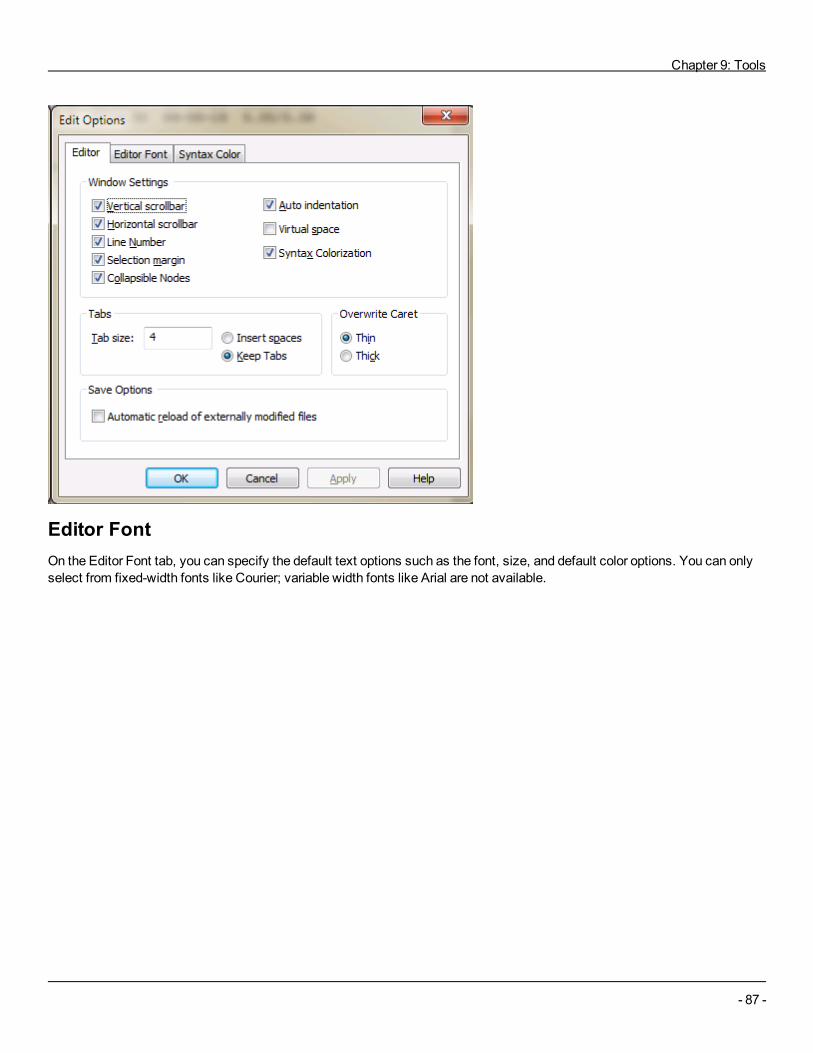
Chapter 9: Tools
- 87 -
Editor FontOn the Editor Font tab, you can specify the default text options such as the font, size, and default color options. You can onlyselect from fixed-width fonts like Courier; variable width fonts like Arial are not available.
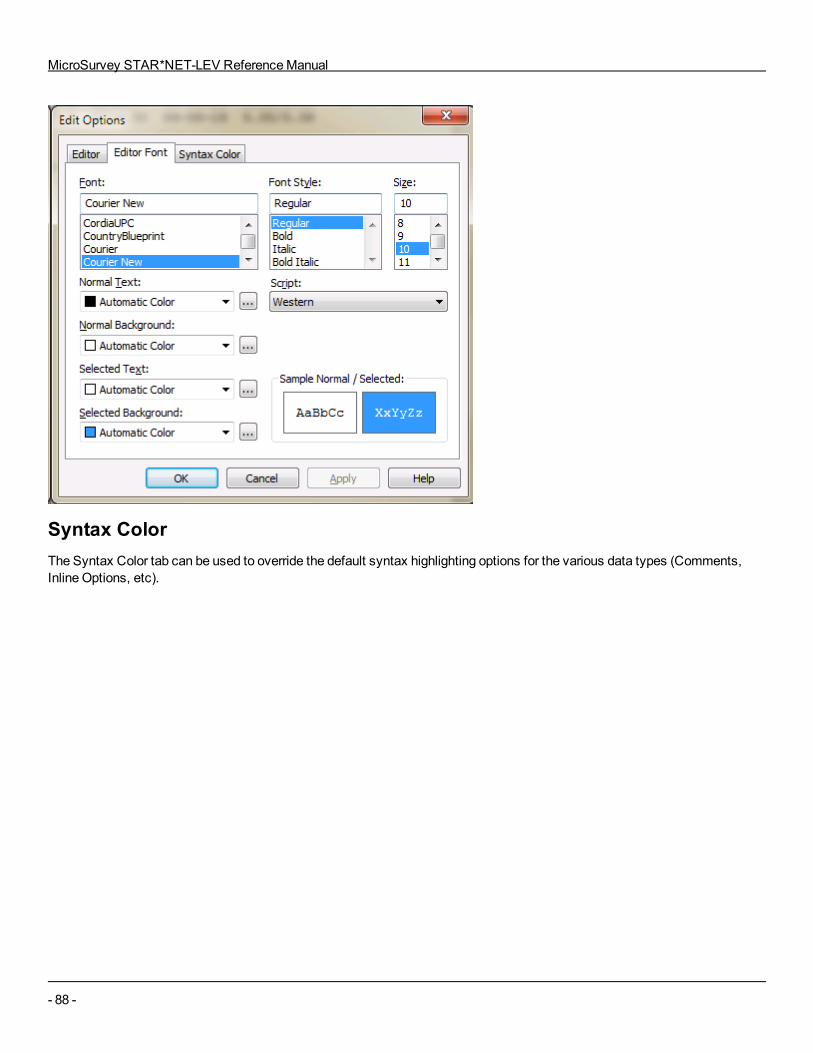
MicroSurvey STAR*NET-LEV ReferenceManual
- 88 -
Syntax ColorThe Syntax Color tab can be used to override the default syntax highlighting options for the various data types (Comments,Inline Options, etc).

Chapter 9: Tools
- 89 -
You can change the Text Color, Background Color, Selected Color, and Selected Background Color for the following prede-fined Attribute types used in STAR*NET data files (*.dat and *.gps). Other file extensions can be used in the editor but will notbe colored using the Syntax Color options.
Comment (Multi-Line): All lines within a .DATA OFF / .DATA ON block.Comment (Single-Line): Any text following a # character.Constant: Any predefined inline option constants (for example, "OFF" or "ON" in a .DATA inline option.)Description: Any text following a ' character.Fixity: Any predefined fixity codes, including * ! & and ?Inline: Any predefined inline option (for example ".DATA")Keywork: Any predefined STAR*NET data code (for example C, DV, M, L, etc)Normal Text: Everything else.
Reset Font and Color OptionsTo reset the Font and Color Options to factory default settings, you can exit from STAR*NET, delete the following three files,and restart STAR*NET:
1. My Documents\MicroSurvey\StarNet\_dat.schclass
2. My Documents\MicroSurvey\StarNet\colorSchema0.ini
3. My Documents\MicroSurvey\StarNet\SyntaxEdit.ini
If these files are not present, STAR*NET will recreate them with default settings.

MicroSurvey STAR*NET-LEV ReferenceManual
- 90 -
9.5 RESET LAYOUTYou can Reset the customizable screen layout to factory defaults by running the Tools | Reset Layout command. The ResetLayout commandwill prompt you to exit from STAR*NET, and when you restart the program any customizations you hadmade will be reverted to factory defaults.
This can be useful if you have lost any of the panels and cannot reopen something.
The default layouts may not be appropriate for all display sizes and resolutions, and we do recommend that you experimentwith customizing the interface to best suit your specific needs and workflow habits.

Chapter 10: APPENDIX A - TOUR OF THE STAR*NET-LEV PACKAGE
- 91 -
CHAPTER 10: APPENDIX A - TOUR OF THESTAR*NET-LEV PACKAGE10.1 OVERVIEWSTAR*NET is a program package that performs least squares adjustments of two and three dimensional survey networks andlevel networks. It is menu driven for ease of use, and allows you to edit your input data, run your adjustment and view theadjustment results all from within the program. STAR*NET also includes graphics display routines that allow you to view yournetwork, including the error ellipses from your adjustment.
Although STAR*NET is easy to use, it is also very powerful, and utilizes the latest rigorous adjustment and analysis tech-niques. In three dimensional mode, it performs a simultaneous adjustment of three dimensional data, not simply an adjustmentof horizontal followed by an adjustment of vertical. This makes STAR*NET well suited to the processing of total station data,and the analysis of data sets for establishing control for close-range photogrammetry and structural deformationmonitoring.However, it is equally suitable for the adjustment of traditional horizontal traverses.
This tutorial is designed to be used with the STAR*NET-LEV program edition. The supplied sample project will acquaint youwith some of the capabilities of the package.
Example Project:Differential Leveling Network
In the tutorial, we will go through the same sequence of operations that you would normally follow when creating and adjustinga survey network.
The normal sequence of operations one goes through in adjusting a project is: set project options, create input data, run anadjustment, review results including viewing both an adjusted network plot and an output listing report. But in these example,we will be just reviewing options and data, not setting options and creating new data.
Note!
This tutorial illustrates only a differential leveling network. Your CD, however, contains manuals with tutorials for other edi-tions. The standard STAR*NETmanual tutorial illustrates running 2D and 3D network adjustments. The STAR*NET-PRO sup-plement tutorial illustrates importing GPS vectors and including them in network adjustments. When the security key for yourSTAR*NET-LEV license is removed, the program will run as a full STAR*NET-PRO demo program and you can run any of thetutorial projects located in the examples directory shown on the next page.
n If you installed your STAR*NET program in “C:\Program Files\MicroSurvey\StarNet\”, then
n Your example projects are in “C:\Program Files\MicroSurvey\StarNet\Examples.”
Each sample project consists of a “Project” file (a file with a “PRJ” extension) and at least one “Data” file (a file with a “DAT”extension). An existing project is opened by selecting its “PRJ” file from theOpen Project dialog.
The “Project” file contains all the option settings for a project such as whether it is a 2D or 3D job, a local or grid job, all instru-ment standard error settings, andmuchmore information. The project file also includes a list of all data files that are consideredpart of the project. All settings are preset for these sample projects, so you can simply review them and not be concerned aboutsetting any yourself.
All “Data” files used in STAR*NET are simple text files that may be prepared within the program or external to the programusing any text editor. All of the input data files for the sample projects are provided, with full comments, to help you get an ideaof how to apply STAR*NET to your adjustment problems. It is not required that you edit any of these sample data files whenrunning the sample projects.
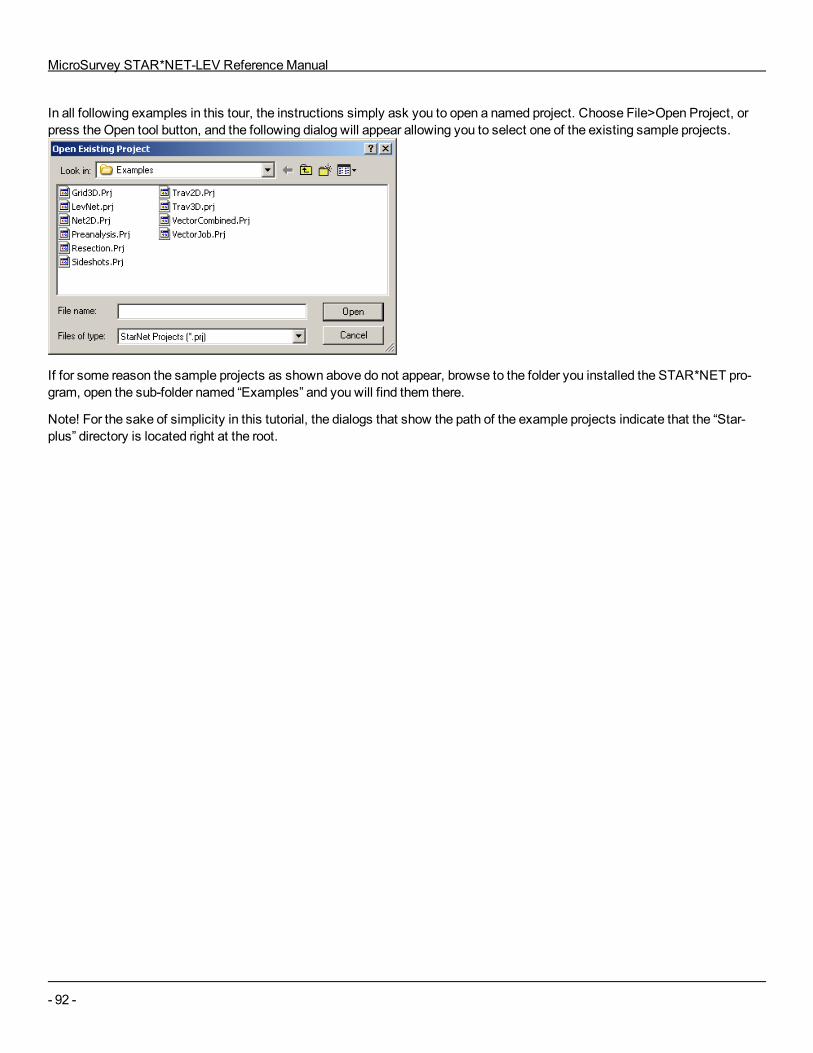
MicroSurvey STAR*NET-LEV ReferenceManual
- 92 -
In all following examples in this tour, the instructions simply ask you to open a named project. Choose File>Open Project, orpress the Open tool button, and the following dialog will appear allowing you to select one of the existing sample projects.
If for some reason the sample projects as shown above do not appear, browse to the folder you installed the STAR*NET pro-gram, open the sub-folder named “Examples” and you will find them there.
Note! For the sake of simplicity in this tutorial, the dialogs that show the path of the example projects indicate that the “Star-plus” directory is located right at the root.
Appendix A: A Tour of STAR*NET
- 93 -
APPENDIX A: A TOUR OF STAR*NETA.1 OVERVIEWSTAR*NET is a program package that performs least squares adjustments of two and three dimensional survey networks. It ismenu driven for ease of use, and allows you to edit your input data, run your adjustment and view the adjustment results allfrom within the program. STAR*NET also includes graphics display routines that allow you to view your network, including theerror ellipses from your adjustment.
Although STAR*NET is easy to use, it is also very powerful, and utilizes the latest rigorous adjustment and analysis tech-niques. In three dimensional mode, it performs a simultaneous adjustment of three dimensional data, not simply an adjustmentof horizontal followed by an adjustment of vertical. This makes STAR*NET well suited to the processing of total station data,and the analysis of data sets for establishing control for close-range photogrammetry and structural deformationmonitoring.However, it is equally suitable for the adjustment of traditional horizontal traverses.
This tutorial is designed to be used with the STAR*NET Program. The supplied sample data files will acquaint you with someof the capabilities of the package:
Example 10: Differential Level Network
In the tutorial, we will go through the same sequence of operations that you would normally follow when creating and adjustinga survey network. The normal sequence of operations one goes through in adjusting a project is: set project options, createinput data, run an adjustment, review results including viewing both an adjusted network plot and an output listing report. But inthese examples, we will be just reviewing options and data, not setting options and creating new data.
The example projects are in "My Documents\MicroSurvey\StarNet\Examples\".
Each sample project consists of a "Project" file (a file with a ".SNPROJ" extension) and at least one "Data" file (a file with a".DAT" extension). An existing project is opened by selecting its "SNPROJ" file from theOpen Project dialog.
The "Project" file contains all the option settings for a project such as whether it is a 2D or 3D job, a local or grid job, all instru-ment standard error settings, andmuchmore information. The project file also includes a list of all data files that are consideredpart of the project. All settings are preset for these sample projects, so you can simply review them and not be concerned aboutsetting any yourself.
All "Data" files used in STAR*NET are simple text files that may be prepared within the program or external to the programusing any text editor. All of the input data files for the sample projects are provided, with full comments, to help you get an ideaof how to apply STAR*NET to your adjustment problems. It is not required that you edit any of these sample data files whenrunning the sample projects.
In all following examples in this tour, the instructions simply ask you to open a named project. Choose File>Open Project, orpress the Open tool button, and the following dialog will appear allowing you to select one of the existing sample projects.
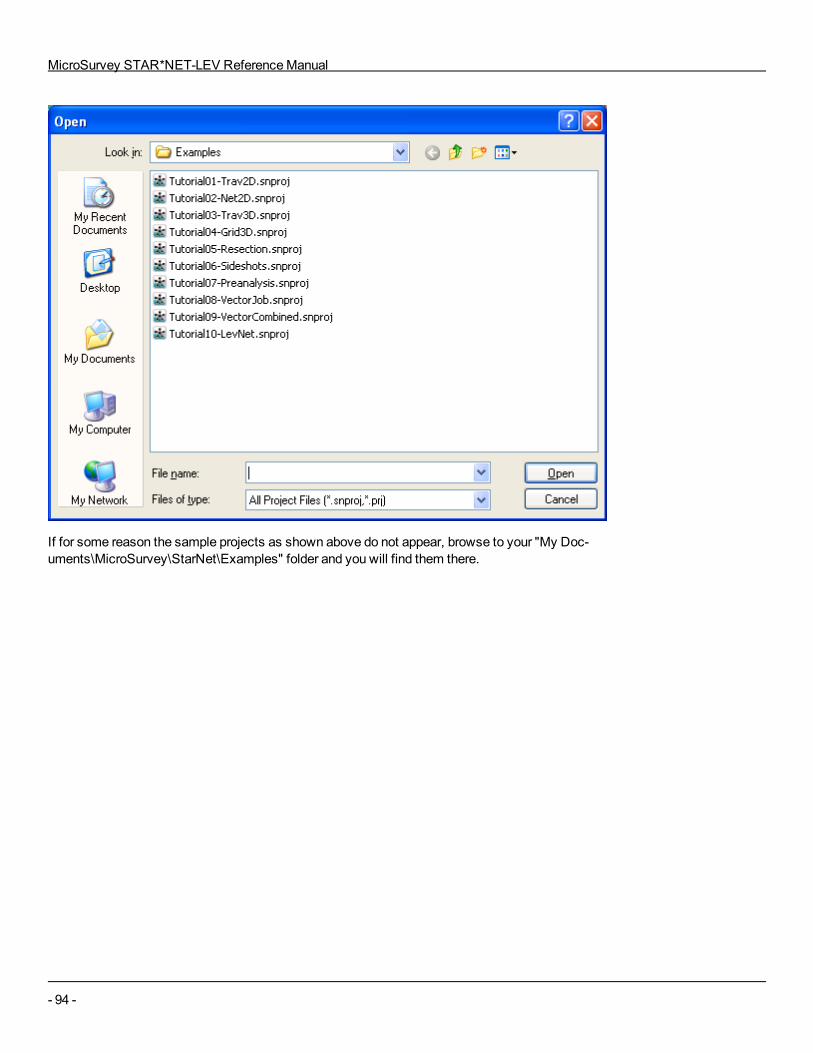
MicroSurvey STAR*NET-LEV ReferenceManual
- 94 -
If for some reason the sample projects as shown above do not appear, browse to your "My Doc-uments\MicroSurvey\StarNet\Examples" folder and you will find them there.
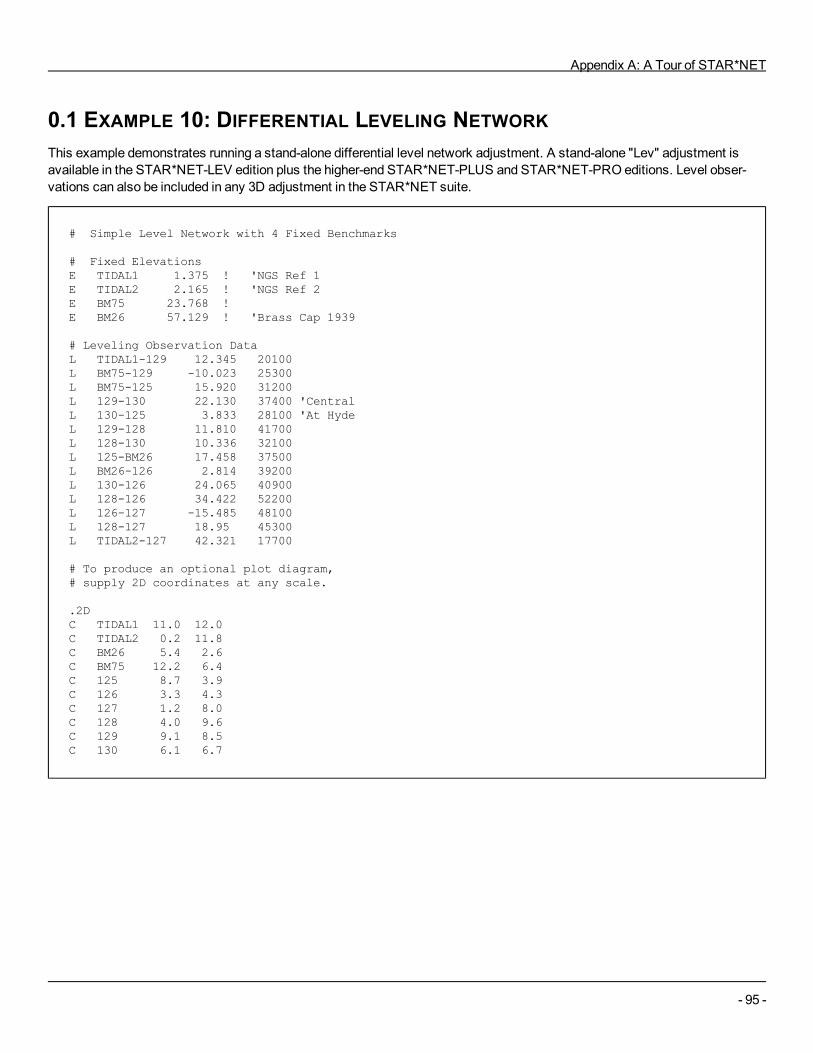
Appendix A: A Tour of STAR*NET
- 95 -
0.1 EXAMPLE 10: DIFFERENTIAL LEVELING NETWORKThis example demonstrates running a stand-alone differential level network adjustment. A stand-alone "Lev" adjustment isavailable in the STAR*NET-LEV edition plus the higher-end STAR*NET-PLUS and STAR*NET-PRO editions. Level obser-vations can also be included in any 3D adjustment in the STAR*NET suite.
# Simple Level Network with 4 Fixed Benchmarks
# Fixed ElevationsE TIDAL1 1.375 ! 'NGS Ref 1E TIDAL2 2.165 ! 'NGS Ref 2E BM75 23.768 ! E BM26 57.129 ! 'Brass Cap 1939
# Leveling Observation DataL TIDAL1-129 12.345 20100L BM75-129 -10.023 25300L BM75-125 15.920 31200L 129-130 22.130 37400 'CentralL 130-125 3.833 28100 'At HydeL 129-128 11.810 41700 L 128-130 10.336 32100 L 125-BM26 17.458 37500 L BM26-126 2.814 39200 L 130-126 24.065 40900 L 128-126 34.422 52200L 126-127 -15.485 48100L 128-127 18.95 45300L TIDAL2-127 42.321 17700
# To produce an optional plot diagram, # supply 2D coordinates at any scale.
.2DC TIDAL1 11.0 12.0 C TIDAL2 0.2 11.8 C BM26 5.4 2.6C BM75 12.2 6.4 C 125 8.7 3.9 C 126 3.3 4.3 C 127 1.2 8.0 C 128 4.0 9.6 C 129 9.1 8.5 C 130 6.1 6.7
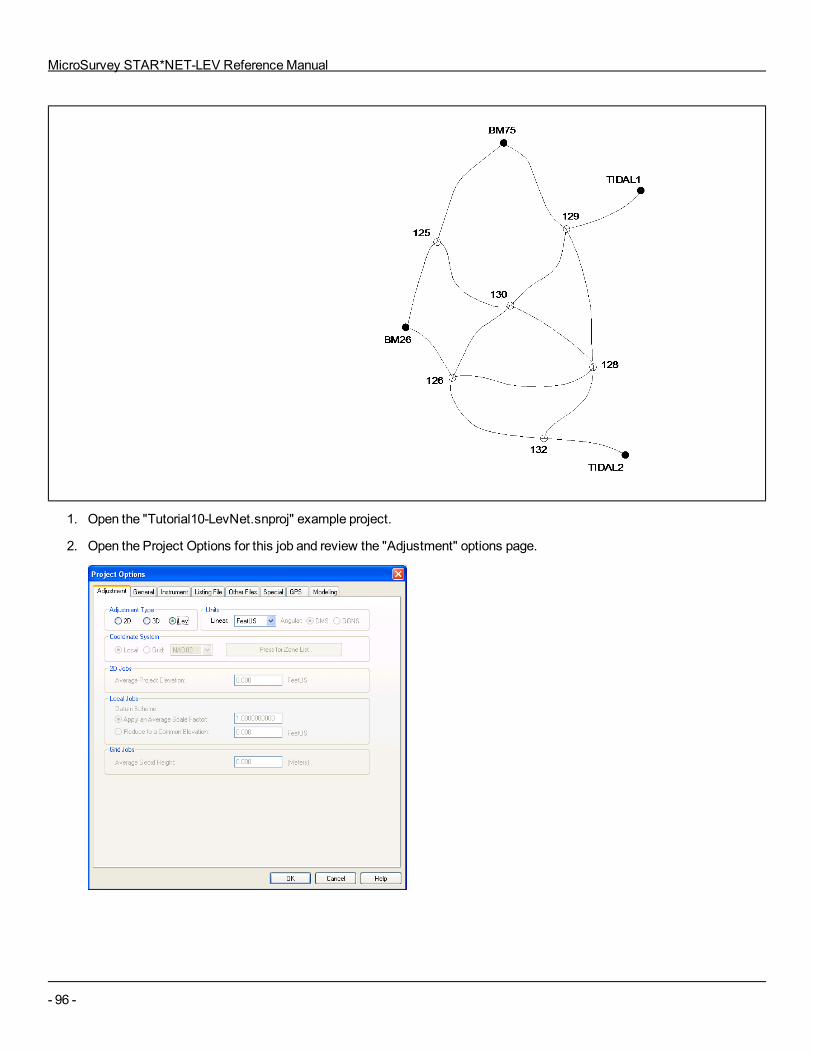
MicroSurvey STAR*NET-LEV ReferenceManual
- 96 -
1. Open the "Tutorial10-LevNet.snproj" example project.
2. Open the Project Options for this job and review the "Adjustment" options page.
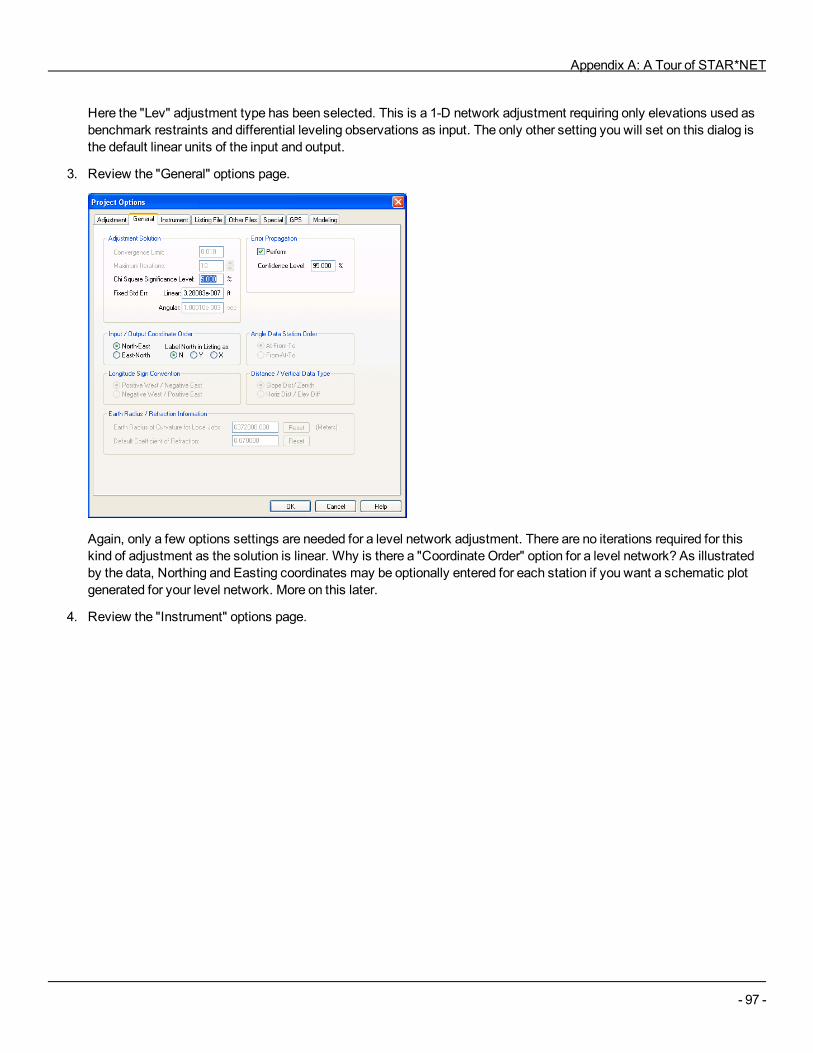
Appendix A: A Tour of STAR*NET
- 97 -
Here the "Lev" adjustment type has been selected. This is a 1-D network adjustment requiring only elevations used asbenchmark restraints and differential leveling observations as input. The only other setting you will set on this dialog isthe default linear units of the input and output.
3. Review the "General" options page.
Again, only a few options settings are needed for a level network adjustment. There are no iterations required for thiskind of adjustment as the solution is linear. Why is there a "Coordinate Order" option for a level network? As illustratedby the data, Northing and Easting coordinates may be optionally entered for each station if you want a schematic plotgenerated for your level network. More on this later.
4. Review the "Instrument" options page.
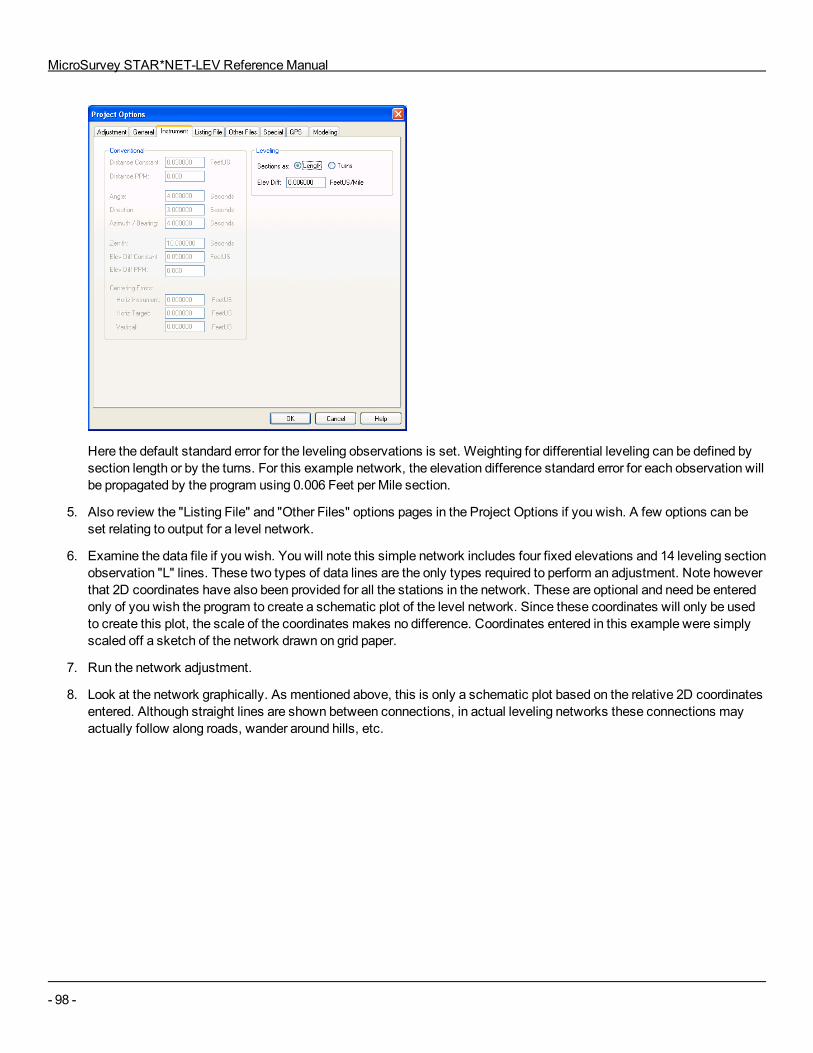
MicroSurvey STAR*NET-LEV ReferenceManual
- 98 -
Here the default standard error for the leveling observations is set. Weighting for differential leveling can be defined bysection length or by the turns. For this example network, the elevation difference standard error for each observation willbe propagated by the program using 0.006 Feet per Mile section.
5. Also review the "Listing File" and "Other Files" options pages in the Project Options if you wish. A few options can beset relating to output for a level network.
6. Examine the data file if you wish. You will note this simple network includes four fixed elevations and 14 leveling sectionobservation "L" lines. These two types of data lines are the only types required to perform an adjustment. Note howeverthat 2D coordinates have also been provided for all the stations in the network. These are optional and need be enteredonly of you wish the program to create a schematic plot of the level network. Since these coordinates will only be usedto create this plot, the scale of the coordinates makes no difference. Coordinates entered in this example were simplyscaled off a sketch of the network drawn on grid paper.
7. Run the network adjustment.
8. Look at the network graphically. As mentioned above, this is only a schematic plot based on the relative 2D coordinatesentered. Although straight lines are shown between connections, in actual leveling networks these connections mayactually follow along roads, wander around hills, etc.
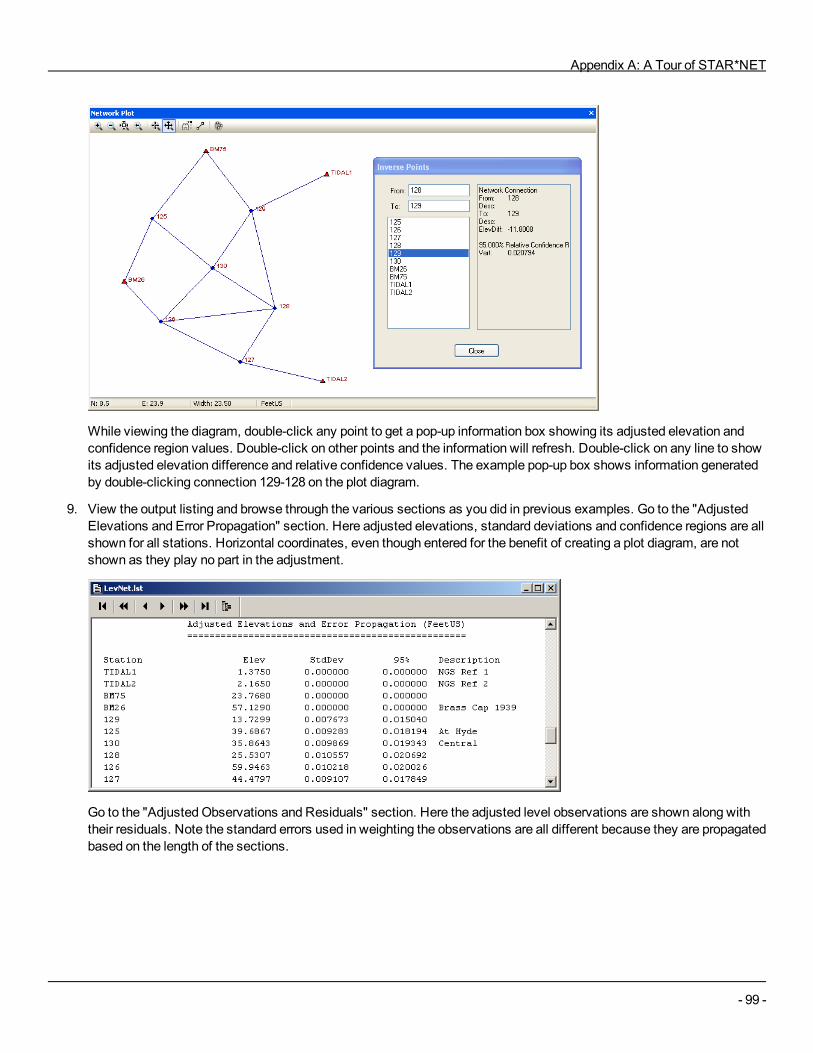
Appendix A: A Tour of STAR*NET
- 99 -
While viewing the diagram, double-click any point to get a pop-up information box showing its adjusted elevation andconfidence region values. Double-click on other points and the information will refresh. Double-click on any line to showits adjusted elevation difference and relative confidence values. The example pop-up box shows information generatedby double-clicking connection 129-128 on the plot diagram.
9. View the output listing and browse through the various sections as you did in previous examples. Go to the "AdjustedElevations and Error Propagation" section. Here adjusted elevations, standard deviations and confidence regions are allshown for all stations. Horizontal coordinates, even though entered for the benefit of creating a plot diagram, are notshown as they play no part in the adjustment.
Go to the "Adjusted Observations and Residuals" section. Here the adjusted level observations are shown along withtheir residuals. Note the standard errors used in weighting the observations are all different because they are propagatedbased on the length of the sections.
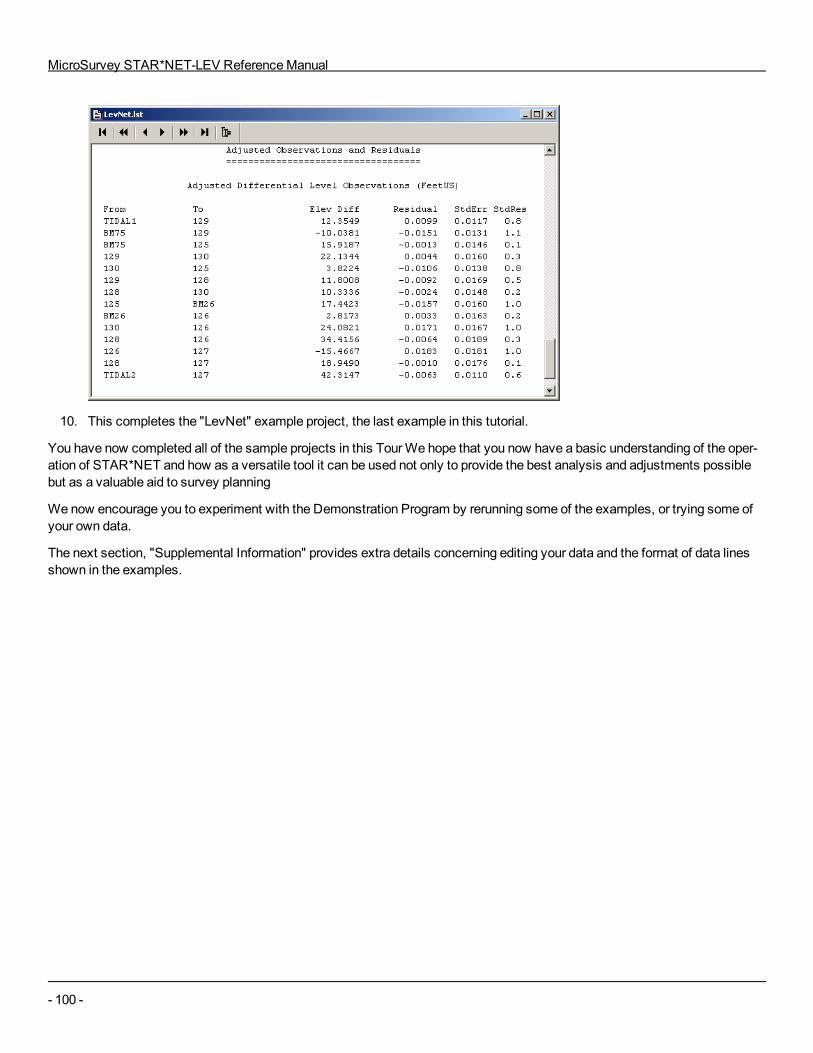
MicroSurvey STAR*NET-LEV ReferenceManual
- 100 -
10. This completes the "LevNet" example project, the last example in this tutorial.
You have now completed all of the sample projects in this TourWe hope that you now have a basic understanding of the oper-ation of STAR*NET and how as a versatile tool it can be used not only to provide the best analysis and adjustments possiblebut as a valuable aid to survey planning
We now encourage you to experiment with the Demonstration Program by rerunning some of the examples, or trying some ofyour own data.
The next section, "Supplemental Information" provides extra details concerning editing your data and the format of data linesshown in the examples.

Appendix B: References
- 101 -
APPENDIX B: REFERENCESThe following list of referencematerials is provided for STAR*NET users who wish to study the practical and theoreticalaspects of survey adjustments in more detail.
1. Wolf, Paul R., andGhilani, Charles D., Adjustment Computations, Statistics and Least Squares in Surveying andGIS,JohnWiley & Sons, Inc., New York, 1997.
An excellent discussion of the theory of survey errors and the use of least squares adjustments of survey networks. Avaluable addition to your library.
2. Buckner, R.B., SurveyingMeasurements and Their Analysis, Landmark Enterprises, Rancho Cordova, California,1984.
An important reference text for the student and professional introducing the theory of measurements, instrument use,propagation of errors in observations, andmuchmore. This easy-to-read book will develop your appreciation of meas-urements as an art and a science, and it is highly recommended.
3. Anderson, J.M., andMikhail, E.M., Introduction to Surveying, McGraw-Hill, New York, 1985.
This text provides a good introduction to surveying practice. Mathematical concepts are kept as simple as possible, butthe book still treats them rigorously. Survey adjustments and error propagation are not covered in depth.
4. Davis, R.E., Foote, F.S., Anderson, J.M, andMikhail, E.M., Surveying - Theory and Practice, McGraw-Hill, New York,1981.
The basic mathematical theory of STAR*NET is based on the appendices in this text, although three-dimensional adjust-ment theory is not developed in the book. The text provides a detailed and rigorous treatment of surveying andmapping.Several chapters and appendices are devoted to survey adjustment, error propagation, and statistical analysis. Thisbook is recommended for those requiring an in-depth theoretical and practical treatment of surveying andmapping.
5. Mikhail, E.M., andGracie, G., Analysis and Adjustment of Survey Measurements, Van Nostrand Reinhold Company,1981.
This book introduces the basic concepts of obtaining and adjusting survey measurements. It is systematic, rigorous,and practical in its approach. It covers the basics of Least Squares Adjustment and statistical analysis, with manyexample problems. It uses matrix algebra throughout, and is recommended for those STAR*NET users requiring a solidintroduction to survey adjustment.
6. Observations and Least Squares, IEP, New York, 1976.
This text provides a complete development of Least Squares analysis techniques. It concentrates on Least SquaresAdjustments, error propagation, and statistical analysis. It is theoretical in orientation, but does include some solvedproblems.
7. Richardus, P., Project Surveying, North-Holland Publishing Company, Amsterdam, 1966.
Yet another treatment of survey adjustments and optimization, with more of an emphasis on engineering applications.
8. Krakiwsky, E.J, ed., Papers for the CISM Adjustment and Analysis Seminars, Canadian Institute of Surveying andMap-ping, Ottawa, 1987.
A useful collection of papers covering adjustment theory at an elementary and an advanced level.
9. Press, W.H., Flannery, B.P., Teukolsky, S.A., and Vetterling, W.T., Numerical Recipes - The Art of Scientific

MicroSurvey STAR*NET-LEV ReferenceManual
- 102 -
Computing, Cambridge University Press, Cambridge, 1986.
This work is a valuable reference book on the art of scientific computing. It contains algorithms for matrix manipulations,statistical tests, eigenvector determination, etc.

Appendix C: Additional Technical Information
- 103 -
APPENDIX C: ADDITIONAL TECHNICAL INFORMATIONFor reference, some general information and formulas used are listed here.
C.1 PROGRAM LIMITSLimits for input data used in the program:
Number of stations in a network:10,000 (plus "SS" sideshot points)Length of an input data line:500 CharactersLength of station names:15Length of station descriptors:48Length of instrument library names:15
Limits for data in the STAR6.CUS custom grid and linear units definitions file:
Length of a data line:128 CharactersLength of an ellipsoid name:18Length of a zone name:18Length of a linear "units" name:8
Limits for data in the STAR6.FMT format definitions file:
Length of data line:154 CharactersLength of format style name:22Length of format script definition:128
10.2 ERROR MESSAGES AND WARNINGSError and warningmessages published by STAR*NET are designed to help you diagnose errors detected in your data or prob-lems found while adjusting. Most of thesemessages are written to the “PROJECT.ERR” file where “PROJECT” is the name ofyour job. To view the errors, select Output>Errors, or press the Errors tool button.
For level network adjustments, the type of data that you enter is very simple and thereforemost error or warningmessages thatmay be reported will be easy to understand. In addition, many error messages such as “Input Data File Does Not Exist” or“Invalid File Name” are very generic in nature and need no explanation.
If you get an error or warning that you do not understand, please call or email technical support at MicroSurvey Software Inc. forassistance.

MicroSurvey STAR*NET-LEV ReferenceManual
- 104 -

Index
- 105 -
INDEX
_
_dat.schclass 32, 89
A
Adjust Network 59
Adjustment Output Listing
Coordinate Changes form Entered Provisionals 77
Listing of Input Data File 74
Output from Level Network Adjustments 78
Statistical Summary 74
Summary of Files Used andOptions Settings 73
Summary of Unadjusted Input Observations 74
The Chi Square Test 76
Auto-Hiding Panels 25
B
Block Commenting 28
Bookmarks 29
C
Change Font and Color 30, 86
Chi Square Test 76
Colors 28
colorSchema0.ini 32, 89
Commands 33
Comment 28
Company Options
Setting 45
The STAR6.DEF File 45
Contact Information vii
Coordinates
Data 51
Customiz 33
Customizable Screen Layout 24
D
Data Check Only 60
Data Files
AnOverview of STAR*NET Data Files 48
Creating Input Data Files 47
Naming Input Data Files 48
Overview 47
Using the Input Data Files Dialogue 47
Data Lines, General Content
Data Type Codes 49
Point Descriptors 50
Standard Errors 50
Station Names 49
Data Types
Coordinates 51
Elevations 51
Leveling Data 52
Differential Level Loop Check Closures 62
Differential Level Loop Check Connection Averages 62
Disclaimer and LimitedWarranty iii
Docking Panels 24
DXF Exporter 85
E
Editor 28, 30, 86
Editor Font 31, 87
Editor Options 30, 86

MicroSurvey STAR*NET-LEV ReferenceManual
- 106 -
Elevations Data 51
End-User License Agreement iii
Example
Differential Leveling Network 95
F
File Reference 17
Files
Configuration Files 18
Program Files 17
Project Files 18
Font 30, 86
G
Gutter 29
I
IDE 28
Inline Options
.2D or .3D or .3REDUCE 56
.DATA ON/OFF 55
.LWEIGHT Value [Turns] 56
.SEPARATOR Character 55
.UNITS 55
.VLEVEL SectionLengthUnits/None/Off 57
Table of Codes 53
INSTALLATION 17
Installation
The License Key (Dongle) 17
Installing STAR*NET 17
Integrated Data Editor 28
K
Keyboard Shortcuts 35
L
Level Loop Check 60
Line Numbers 29
Listing 65
Loop Closure 60
M
Menus 36
MicroSurvey Software Inc. vii
N
New Project 27
O
Open Project 27
Options 37
Company Options” \t “See Company Options 45
Setting Project Options” \t “See Project Options 39
Using Inlines” \t “See Inline Options” 53
Output Files 65
Output Menu
Error File 67
Lat/Longs File 67
Listing File 65
Network Plot 67
Points File 67
Overview
Output Windows 23
TheMenu System 25

Index
- 107 -
P
Plot 67
Points Reformatter 81
Print 69
Print Preview 69
Program Limits 103
Project Manager 27
Project Options
Adjustment Settings 40
Changing Options using Inline Options 39
Changing Options using Options Dialog 39
General Settings 41
Instrument Settings 42
Listing File Settings 43
Other File Settings 44
Coordinate File 45
Overview 39
Setting Project Options 40
R
References 101
Registry 19
Reset Font and Color Options 32, 89
Reset Layout 25, 90
Resizing Panels 25
RunMenu 59
Adjust Network 59
Data Check Only 60
Level Loop Check 60
S
Set Editor 30
Set External Editor 30
Standard Errors
Codes Available 50
Setting in Instrument Options 42
STAR6.CUS 103
STAR6.FMT 82, 103
Statistical Summary 74
Syntax Color 31, 88
Syntax Highlighting 28
SyntaxEdit.ini 32, 89
System Registry 19
T
Technical Support vi
Template 28
Toolbars 34
Tools Menu 81
U
Uncomment 28
Using STAR*NET 21
W
Workflow 21

MicroSurvey STAR*NET-LEV ReferenceManual
- 108 -