Embed Size (px)
Citation preview
j m a t e r r e s t e c h n o l . 2 0 1 3;2(4):376–385
Available online at www.sciencedirect.com
www. jmrt .com.br
Original Article
Microstructures and properties of solid and reticulated meshcomponents of pure iron fabricated by electron beammelting
Lawrence E. Murra,∗, Edwin Martineza, Xuemin Panb, Chuanmin Mengc, Jialin Yangd,Shujun Li e, Fei Yange, Qinsi Xue, Jennifer Hernandeza, Wenjun Zhuc, Sara M. Gaytanf,Frank Medinaf, Ryan B. Wicker f
a Department of Metallurgical and Materials Engineering, University of Texas at El Paso, El Paso, TX, United Statesb School of Materials Science and Engineering, Dalian University of Technology, Dalian, Liaoning Province, Chinac National Key Laboratory of Shock Wave and Detonation Physics, Institute of Fluid Physics, Chinese Academy of Engineering Physics,Mianyang, Chinad Institute of Machinery Manufacturing Technology, Chinese Academy of Engineering Physics, Mianyang, Chinae Institute of Metal Research, Shenyang National Laboratory for Materials Science, Shenyang, Liaoning Province, Chinaf W.M. Keck Center for 3D Innovation, University of Texas at El Paso, El Paso, TX, United States
a r t i c l e i n f o
Article history:
Received 5 June 2013
Accepted 10 October 2013
Available online 6 November 2013
Keywords:
�-Fe phase
�-Fe
Electron beam melting
Dynamic stiffness
Light and electron microscopy
a b s t r a c t
This research examines rapidly solidified, atomized pure iron powder and solid and retic-
ulated mesh components fabricated by electron beam melting (EBM) from this powder
precursor. Especially significant was the characterization of associated microstructures
and corresponding mechanical properties. Atomized Fe powder was used to fabricate
solid and reticulated mesh components by EBM. Powder and component microstructures
and phase structures were examined by light (optical) metallography, scanning electron
microscopy, X-ray diffractometry, and transmission electron microscopy. Corresponding
Vickers microindentation hardness measurements were also made and compared to tensile
data along with measurements of dynamic stiffness for mesh components having varying
densities. The atomized Fe powder was observed to contain �-Fe which was retained in
the solid, EBM-fabricated components where it was observed to be homogeneously dis-
tributed in equiaxed �-Fe grains as �-phase platelets measuring ∼0.5 �m to 2 �m in length
and ∼40 nm thick; coincident with the �-Fe matrix {1 0 0} or {1 1 0} planes. A log–log plot of
E/Es versus �/�s resulted in (E/Es) = (�/�s)2.8. Novel, �-Fe phase platelets have been observed
in �-Fe components fabricated by EMB.
© 2013 Brazilian Metallurgical, Materials and Mining Association. Published by Elsevier
Editora Ltda. All rights reserved.
∗ Corresponding author.E-mail: [email protected] (L.E. Murr).
2238-7854/$ – see front matter © 2013 Brazilian Metallurgical, Materials and Mhttp://dx.doi.org/10.1016/j.jmrt.2013.10.002
ining Association. Published by Elsevier Editora Ltda. All rights reserved.
o l . 2 0 1 3;2(4):376–385 377
1
Ioai[pl(
aart
m∼t2tp
owepub
adimwltcf
2
RsFbFmsaetiipc
e
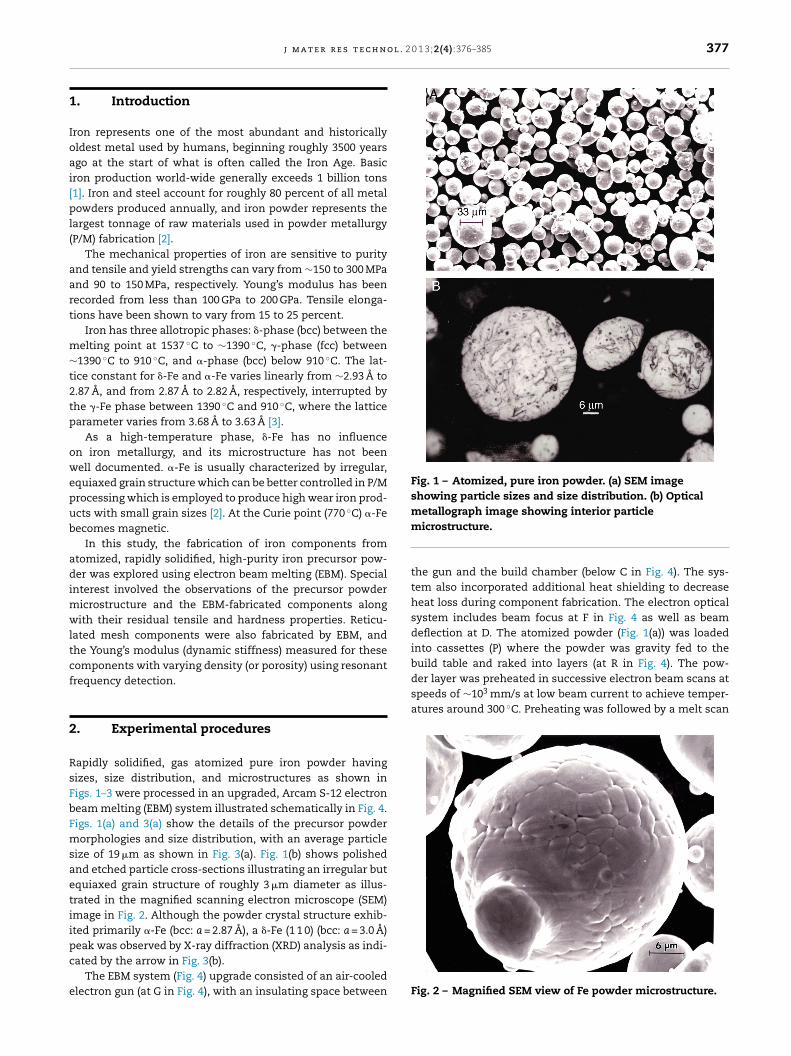
Fig. 1 – Atomized, pure iron powder. (a) SEM imageshowing particle sizes and size distribution. (b) Opticalmetallograph image showing interior particle
der layer was preheated in successive electron beam scans atspeeds of ∼103 mm/s at low beam current to achieve temper-atures around 300 ◦C. Preheating was followed by a melt scan
j m a t e r r e s t e c h n
. Introduction
ron represents one of the most abundant and historicallyldest metal used by humans, beginning roughly 3500 yearsgo at the start of what is often called the Iron Age. Basicron production world-wide generally exceeds 1 billion tons1]. Iron and steel account for roughly 80 percent of all metalowders produced annually, and iron powder represents the
argest tonnage of raw materials used in powder metallurgyP/M) fabrication [2].
The mechanical properties of iron are sensitive to puritynd tensile and yield strengths can vary from ∼150 to 300 MPand 90 to 150 MPa, respectively. Young’s modulus has beenecorded from less than 100 GPa to 200 GPa. Tensile elonga-ions have been shown to vary from 15 to 25 percent.
Iron has three allotropic phases: �-phase (bcc) between theelting point at 1537 ◦C to ∼1390 ◦C, �-phase (fcc) between1390 ◦C to 910 ◦C, and �-phase (bcc) below 910 ◦C. The lat-
ice constant for �-Fe and �-Fe varies linearly from ∼2.93 A to.87 A, and from 2.87 A to 2.82 A, respectively, interrupted byhe �-Fe phase between 1390 ◦C and 910 ◦C, where the latticearameter varies from 3.68 A to 3.63 A [3].
As a high-temperature phase, �-Fe has no influencen iron metallurgy, and its microstructure has not beenell documented. �-Fe is usually characterized by irregular,
quiaxed grain structure which can be better controlled in P/Mrocessing which is employed to produce high wear iron prod-cts with small grain sizes [2]. At the Curie point (770 ◦C) �-Feecomes magnetic.
In this study, the fabrication of iron components fromtomized, rapidly solidified, high-purity iron precursor pow-er was explored using electron beam melting (EBM). Special
nterest involved the observations of the precursor powdericrostructure and the EBM-fabricated components alongith their residual tensile and hardness properties. Reticu-
ated mesh components were also fabricated by EBM, andhe Young’s modulus (dynamic stiffness) measured for theseomponents with varying density (or porosity) using resonantrequency detection.
. Experimental procedures
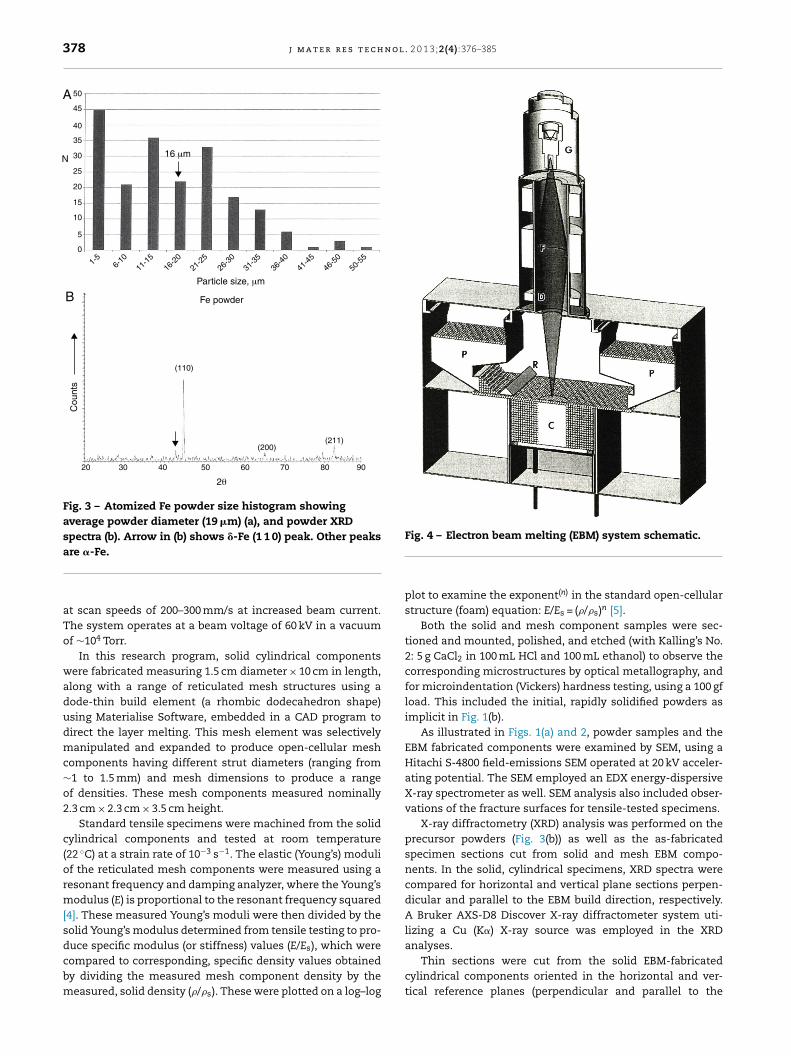
apidly solidified, gas atomized pure iron powder havingizes, size distribution, and microstructures as shown inigs. 1–3 were processed in an upgraded, Arcam S-12 electroneam melting (EBM) system illustrated schematically in Fig. 4.igs. 1(a) and 3(a) show the details of the precursor powderorphologies and size distribution, with an average particle
ize of 19 �m as shown in Fig. 3(a). Fig. 1(b) shows polishednd etched particle cross-sections illustrating an irregular butquiaxed grain structure of roughly 3 �m diameter as illus-rated in the magnified scanning electron microscope (SEM)mage in Fig. 2. Although the powder crystal structure exhib-ted primarily �-Fe (bcc: a = 2.87 A), a �-Fe (1 1 0) (bcc: a = 3.0 A)
eak was observed by X-ray diffraction (XRD) analysis as indi-ated by the arrow in Fig. 3(b).The EBM system (Fig. 4) upgrade consisted of an air-cooledlectron gun (at G in Fig. 4), with an insulating space between
microstructure.
the gun and the build chamber (below C in Fig. 4). The sys-tem also incorporated additional heat shielding to decreaseheat loss during component fabrication. The electron opticalsystem includes beam focus at F in Fig. 4 as well as beamdeflection at D. The atomized powder (Fig. 1(a)) was loadedinto cassettes (P) where the powder was gravity fed to thebuild table and raked into layers (at R in Fig. 4). The pow-
Fig. 2 – Magnified SEM view of Fe powder microstructure.
378 j m a t e r r e s t e c h n o l . 2 0 1 3;2(4):376–385
50
45
35
25
15
5
10
0
1-5
6-10
11-1
516
-20
21-2
526
-30
31-3
536
-40
41-4
546
-50
50-5
5
N
A
BParticle size, μm
16 μm
Fe powder
Cou
nts
2θ
20 30 40 50 60 70 80 90
(211)(200)
(110)
20
30
40
Fig. 3 – Atomized Fe powder size histogram showingaverage powder diameter (19 �m) (a), and powder XRDspectra (b). Arrow in (b) shows �-Fe (1 1 0) peak. Other peaksare �-Fe.
Fig. 4 – Electron beam melting (EBM) system schematic.
at scan speeds of 200–300 mm/s at increased beam current.The system operates at a beam voltage of 60 kV in a vacuumof ∼104 Torr.
In this research program, solid cylindrical componentswere fabricated measuring 1.5 cm diameter × 10 cm in length,along with a range of reticulated mesh structures using adode-thin build element (a rhombic dodecahedron shape)using Materialise Software, embedded in a CAD program todirect the layer melting. This mesh element was selectivelymanipulated and expanded to produce open-cellular meshcomponents having different strut diameters (ranging from∼1 to 1.5 mm) and mesh dimensions to produce a rangeof densities. These mesh components measured nominally2.3 cm × 2.3 cm × 3.5 cm height.
Standard tensile specimens were machined from the solidcylindrical components and tested at room temperature(22 ◦C) at a strain rate of 10−3 s−1. The elastic (Young’s) moduliof the reticulated mesh components were measured using aresonant frequency and damping analyzer, where the Young’smodulus (E) is proportional to the resonant frequency squared[4]. These measured Young’s moduli were then divided by thesolid Young’s modulus determined from tensile testing to pro-duce specific modulus (or stiffness) values (E/Es), which were
compared to corresponding, specific density values obtainedby dividing the measured mesh component density by themeasured, solid density (�/�s). These were plotted on a log–logplot to examine the exponent(n) in the standard open-cellularstructure (foam) equation: E/Es = (�/�s)n [5].
Both the solid and mesh component samples were sec-tioned and mounted, polished, and etched (with Kalling’s No.2: 5 g CaCl2 in 100 mL HCl and 100 mL ethanol) to observe thecorresponding microstructures by optical metallography, andfor microindentation (Vickers) hardness testing, using a 100 gfload. This included the initial, rapidly solidified powders asimplicit in Fig. 1(b).
As illustrated in Figs. 1(a) and 2, powder samples and theEBM fabricated components were examined by SEM, using aHitachi S-4800 field-emissions SEM operated at 20 kV acceler-ating potential. The SEM employed an EDX energy-dispersiveX-ray spectrometer as well. SEM analysis also included obser-vations of the fracture surfaces for tensile-tested specimens.
X-ray diffractometry (XRD) analysis was performed on theprecursor powders (Fig. 3(b)) as well as the as-fabricatedspecimen sections cut from solid and mesh EBM compo-nents. In the solid, cylindrical specimens, XRD spectra werecompared for horizontal and vertical plane sections perpen-dicular and parallel to the EBM build direction, respectively.A Bruker AXS-D8 Discover X-ray diffractometer system uti-lizing a Cu (K�) X-ray source was employed in the XRDanalyses.
Thin sections were cut from the solid EBM-fabricatedcylindrical components oriented in the horizontal and ver-tical reference planes (perpendicular and parallel to the
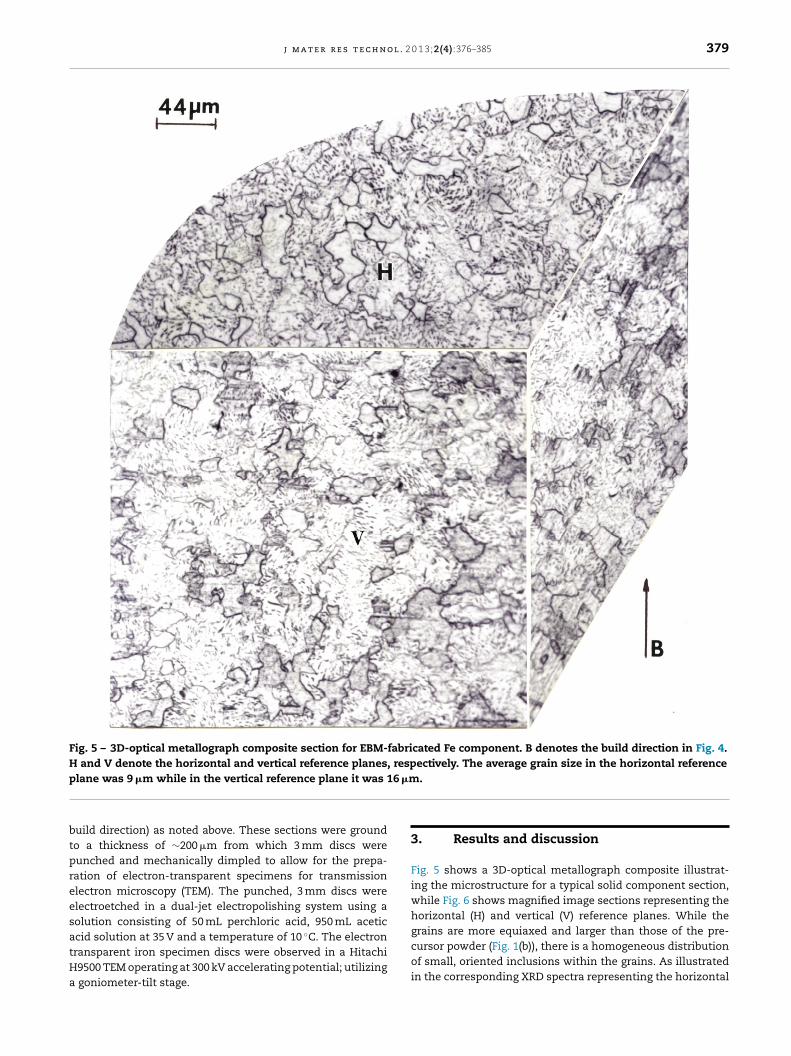
j m a t e r r e s t e c h n o l . 2 0 1 3;2(4):376–385 379
Fig. 5 – 3D-optical metallograph composite section for EBM-fabricated Fe component. B denotes the build direction in Fig. 4.H and V denote the horizontal and vertical reference planes, respectively. The average grain size in the horizontal referencep 6 �m
btpreesatHa
lane was 9 �m while in the vertical reference plane it was 1
uild direction) as noted above. These sections were groundo a thickness of ∼200 �m from which 3 mm discs wereunched and mechanically dimpled to allow for the prepa-ation of electron-transparent specimens for transmissionlectron microscopy (TEM). The punched, 3 mm discs werelectroetched in a dual-jet electropolishing system using aolution consisting of 50 mL perchloric acid, 950 mL aceticcid solution at 35 V and a temperature of 10 ◦C. The electron
ransparent iron specimen discs were observed in a Hitachi9500 TEM operating at 300 kV accelerating potential; utilizinggoniometer-tilt stage.
.
3. Results and discussion
Fig. 5 shows a 3D-optical metallograph composite illustrat-ing the microstructure for a typical solid component section,while Fig. 6 shows magnified image sections representing thehorizontal (H) and vertical (V) reference planes. While thegrains are more equiaxed and larger than those of the pre-
cursor powder (Fig. 1(b)), there is a homogeneous distributionof small, oriented inclusions within the grains. As illustratedin the corresponding XRD spectra representing the horizontal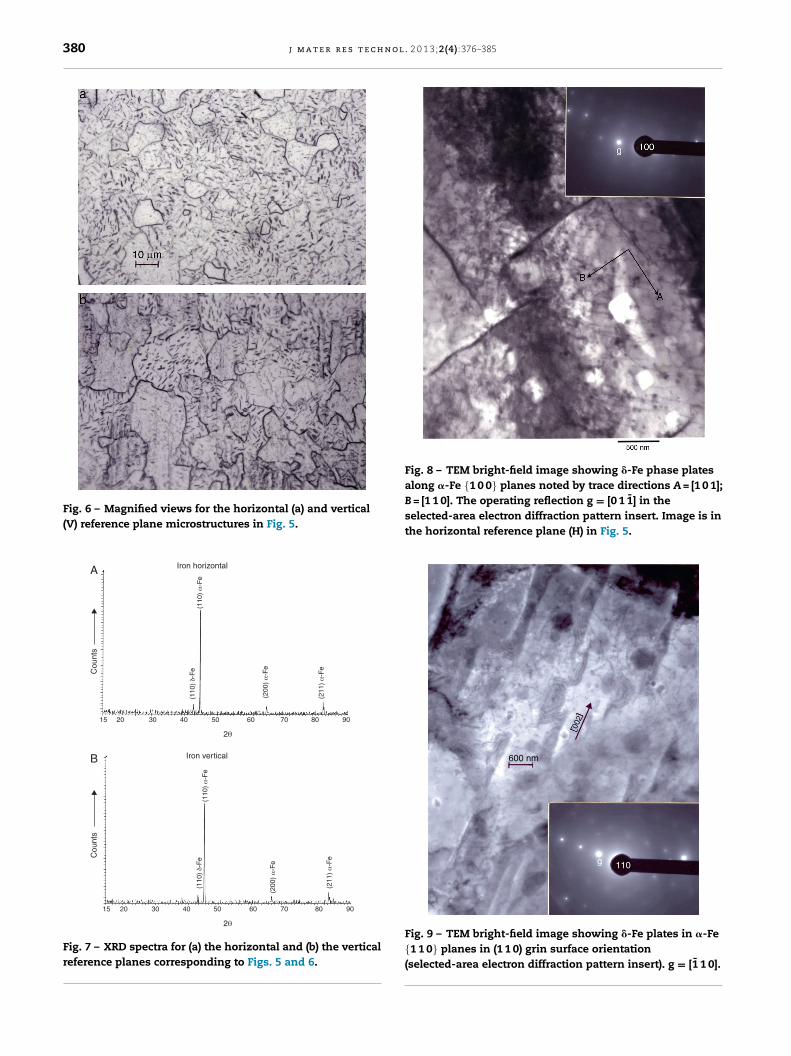
380 j m a t e r r e s t e c h n o l . 2 0 1 3;2(4):376–385
Fig. 6 – Magnified views for the horizontal (a) and vertical(V) reference plane microstructures in Fig. 5.
(110
) δ-
Fe
(110
) α
-Fe
(110
) α
-Fe
(200
) α
-Fe
(211
) α
-Fe
(110
) δ-
Fe
(200
) α
-Fe
(211
) α
-Fe
Iron horizontal
Iron vertical
A
B
Cou
nts
Cou
nts
2θ
2015 30 40 50 60 70 80 90
2θ
2015 30 40 50 60 70 80 90
Fig. 7 – XRD spectra for (a) the horizontal and (b) the verticalreference planes corresponding to Figs. 5 and 6.
Fig. 8 – TEM bright-field image showing �-Fe phase platesalong �-Fe {1 0 0} planes noted by trace directions A = [1 0 1];B = [1 1 0]. The operating reflection g = [0 1 1] in theselected-area electron diffraction pattern insert. Image is inthe horizontal reference plane (H) in Fig. 5.
600 nm
g 110
002
Fig. 9 – TEM bright-field image showing �-Fe plates in �-Fe{1 1 0} planes in (1 1 0) grin surface orientation(selected-area electron diffraction pattern insert). g = [1 1 0].
j m a t e r r e s t e c h n o l . 2 0 1 3;2(4):376–385 381
A
A
g
11
B
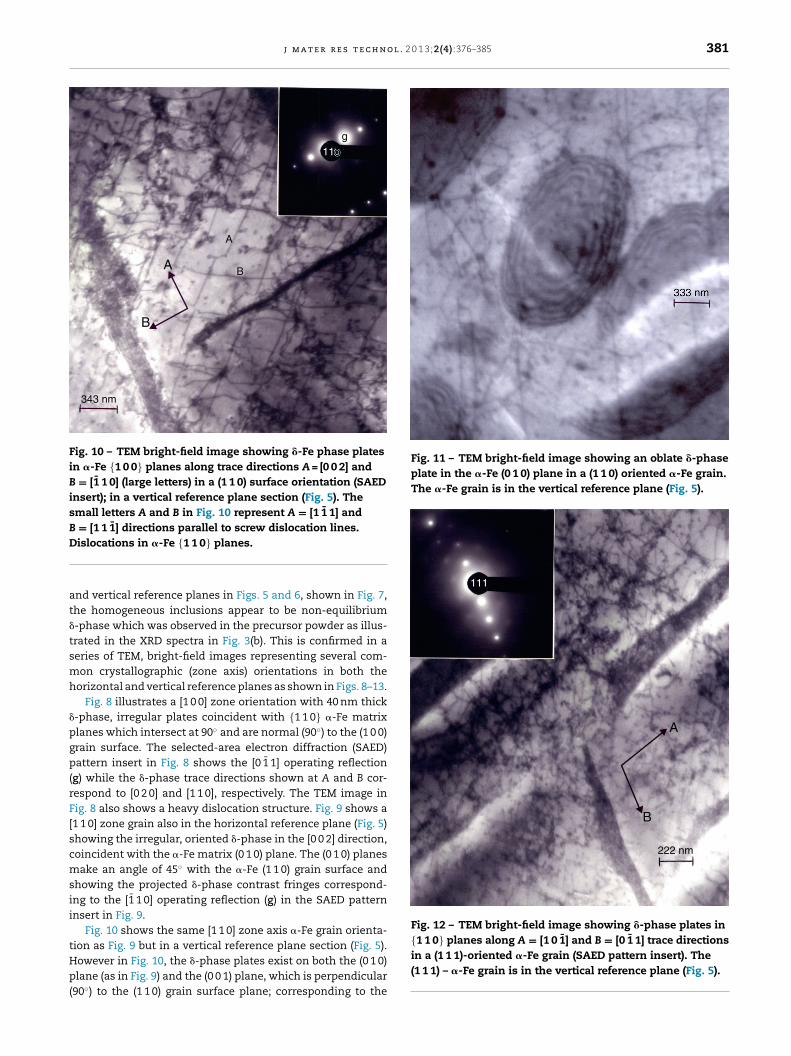
343 nm
B
Fig. 10 – TEM bright-field image showing �-Fe phase platesin �-Fe {1 0 0} planes along trace directions A = [0 0 2] andB = [1 1 0] (large letters) in a (1 1 0) surface orientation (SAEDinsert); in a vertical reference plane section (Fig. 5). Thesmall letters A and B in Fig. 10 represent A = [1 1 1] andB = [1 1 1] directions parallel to screw dislocation lines.D
at�
tsmh
�
pgp(rF[scmsii
tHp(
Fig. 11 – TEM bright-field image showing an oblate �-phaseplate in the �-Fe (0 1 0) plane in a (1 1 0) oriented �-Fe grain.The �-Fe grain is in the vertical reference plane (Fig. 5).
A
222 nm
B
111
Fig. 12 – TEM bright-field image showing �-phase plates in{1 1 0} planes along A = [1 0 1] and B = [0 1 1] trace directions
islocations in �-Fe {1 1 0} planes.
nd vertical reference planes in Figs. 5 and 6, shown in Fig. 7,he homogeneous inclusions appear to be non-equilibrium-phase which was observed in the precursor powder as illus-rated in the XRD spectra in Fig. 3(b). This is confirmed in aeries of TEM, bright-field images representing several com-on crystallographic (zone axis) orientations in both the
orizontal and vertical reference planes as shown in Figs. 8–13.Fig. 8 illustrates a [1 0 0] zone orientation with 40 nm thick
-phase, irregular plates coincident with {1 1 0} �-Fe matrixlanes which intersect at 90◦ and are normal (90◦) to the (1 0 0)rain surface. The selected-area electron diffraction (SAED)attern insert in Fig. 8 shows the [0 1 1] operating reflection
g) while the �-phase trace directions shown at A and B cor-espond to [0 2 0] and [1 1 0], respectively. The TEM image inig. 8 also shows a heavy dislocation structure. Fig. 9 shows a1 1 0] zone grain also in the horizontal reference plane (Fig. 5)howing the irregular, oriented �-phase in the [0 0 2] direction,oincident with the �-Fe matrix (0 1 0) plane. The (0 1 0) planesake an angle of 45◦ with the �-Fe (1 1 0) grain surface and
howing the projected �-phase contrast fringes correspond-ng to the [1 1 0] operating reflection (g) in the SAED patternnsert in Fig. 9.
Fig. 10 shows the same [1 1 0] zone axis �-Fe grain orienta-ion as Fig. 9 but in a vertical reference plane section (Fig. 5).
owever in Fig. 10, the �-phase plates exist on both the (0 1 0)lane (as in Fig. 9) and the (0 0 1) plane, which is perpendicular90◦) to the (1 1 0) grain surface plane; corresponding to the
in a (1 1 1)-oriented �-Fe grain (SAED pattern insert). The(1 1 1) – �-Fe grain is in the vertical reference plane (Fig. 5).
382 j m a t e r r e s t e c h n o l . 2 0 1 3;2(4):376–385
a
b
c
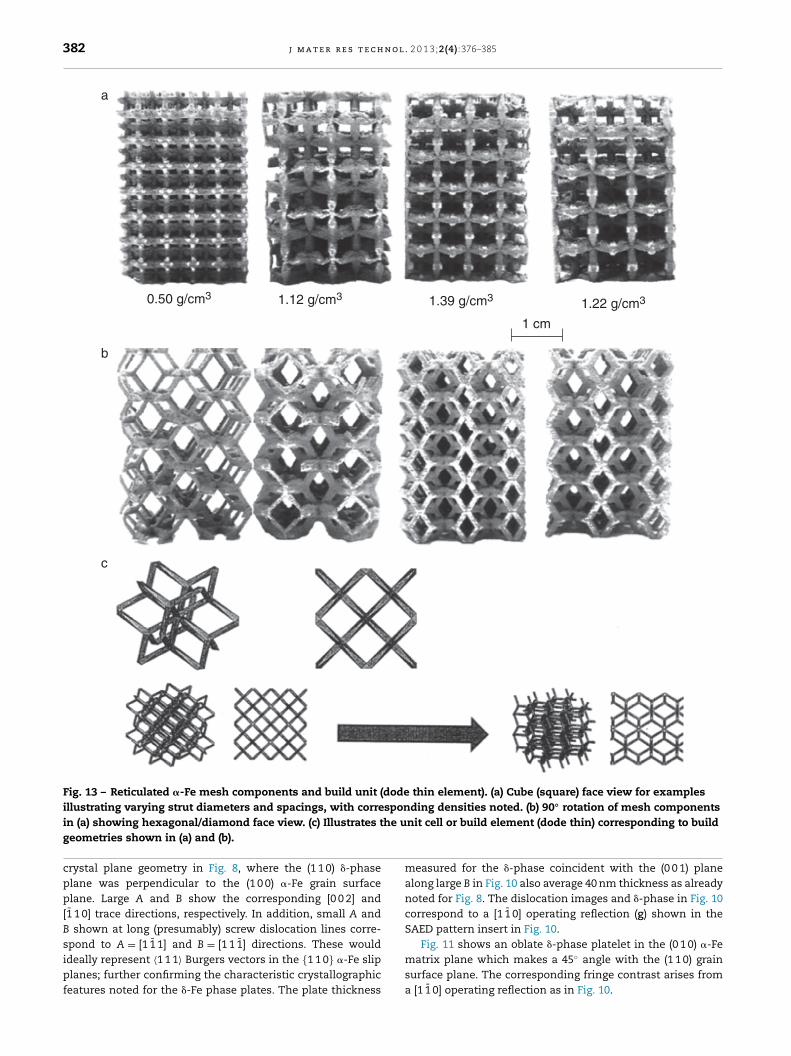
0.50 g/cm3 1.12 g/cm3 1.39 g/cm3 1.22 g/cm3
1 cm
Fig. 13 – Reticulated �-Fe mesh components and build unit (dode thin element). (a) Cube (square) face view for examplesillustrating varying strut diameters and spacings, with corresponding densities noted. (b) 90◦ rotation of mesh components
he u
in (a) showing hexagonal/diamond face view. (c) Illustrates tgeometries shown in (a) and (b).crystal plane geometry in Fig. 8, where the (1 1 0) �-phaseplane was perpendicular to the (1 0 0) �-Fe grain surfaceplane. Large A and B show the corresponding [0 0 2] and[1 1 0] trace directions, respectively. In addition, small A andB shown at long (presumably) screw dislocation lines corre-
¯ ¯
spond to A = [1 1 1] and B = [1 1 1] directions. These wouldideally represent 〈1 1 1〉 Burgers vectors in the {1 1 0} �-Fe slipplanes; further confirming the characteristic crystallographicfeatures noted for the �-Fe phase plates. The plate thicknessnit cell or build element (dode thin) corresponding to build
measured for the �-phase coincident with the (0 0 1) planealong large B in Fig. 10 also average 40 nm thickness as alreadynoted for Fig. 8. The dislocation images and �-phase in Fig. 10correspond to a [1 1 0] operating reflection (g) shown in theSAED pattern insert in Fig. 10.
Fig. 11 shows an oblate �-phase platelet in the (0 1 0) �-Fematrix plane which makes a 45◦ angle with the (1 1 0) grainsurface plane. The corresponding fringe contrast arises froma [1 1 0] operating reflection as in Fig. 10.
j m a t e r r e s t e c h n o l . 2 0 1 3;2(4):376–385 383
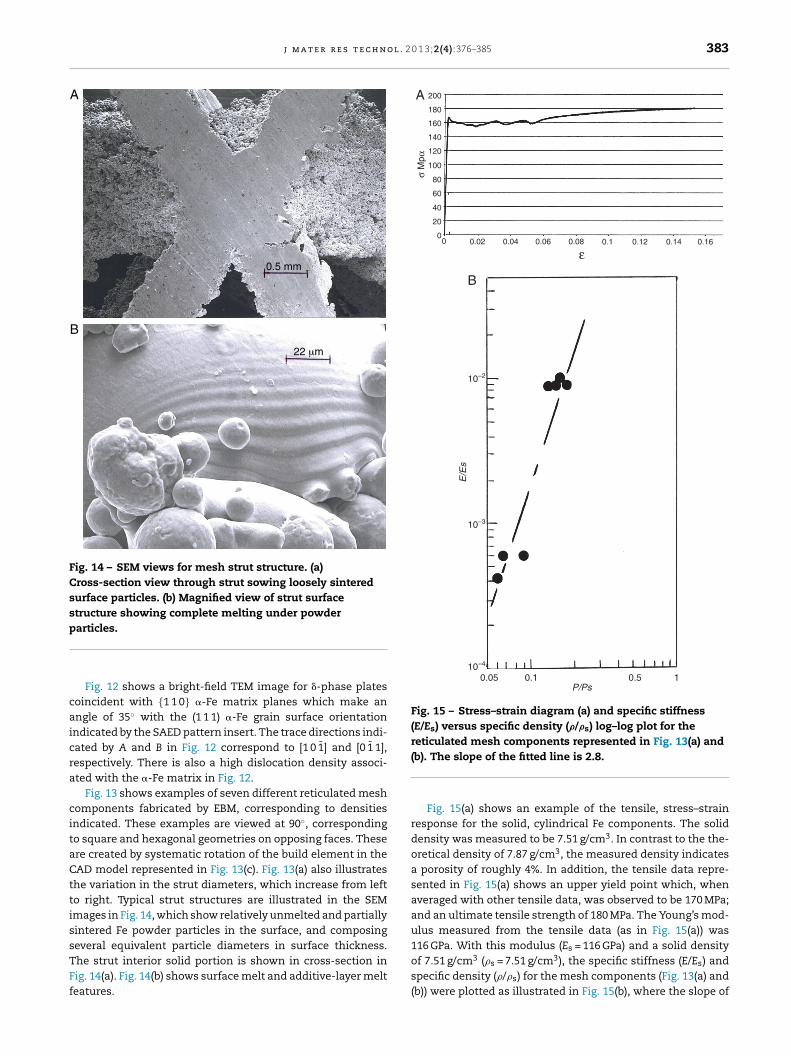
0.5 mm
A
B
22 μm
Fig. 14 – SEM views for mesh strut structure. (a)Cross-section view through strut sowing loosely sinteredsurface particles. (b) Magnified view of strut surfacestructure showing complete melting under powderparticles.
caicra
citaCttissTFf
200
180
160
140
120
100
80
60
40
20
0
10–2
10–3
10–4
0.05 0.1 0.5P/Ps
E/E
s
1
0 0.02
B
A
0.04 0.06 0.08 0.1
σ M
pα
ε0.12 0.14 0.16
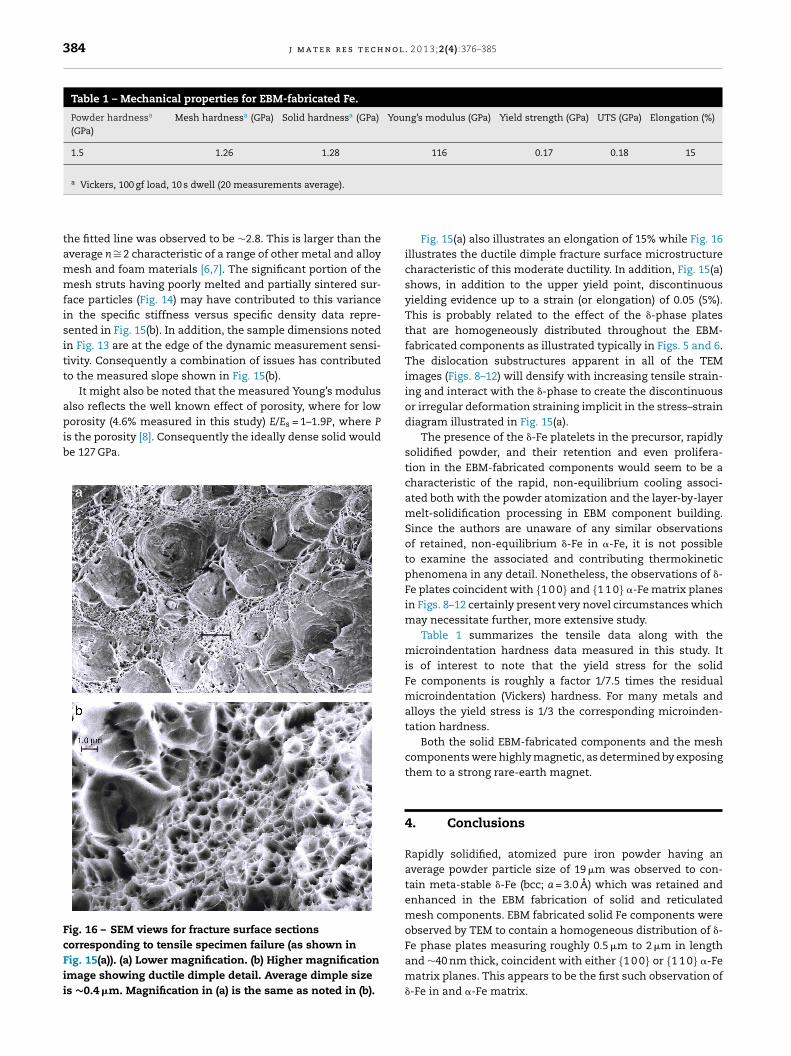
Fig. 15 – Stress–strain diagram (a) and specific stiffness(E/Es) versus specific density (�/�s) log–log plot for thereticulated mesh components represented in Fig. 13(a) and
of 7.51 g/cm3 (�s = 7.51 g/cm3), the specific stiffness (E/Es) and
Fig. 12 shows a bright-field TEM image for �-phase platesoincident with {1 1 0} �-Fe matrix planes which make anngle of 35◦ with the (1 1 1) �-Fe grain surface orientationndicated by the SAED pattern insert. The trace directions indi-ated by A and B in Fig. 12 correspond to [1 0 1] and [0 1 1],espectively. There is also a high dislocation density associ-ted with the �-Fe matrix in Fig. 12.
Fig. 13 shows examples of seven different reticulated meshomponents fabricated by EBM, corresponding to densitiesndicated. These examples are viewed at 90◦, correspondingo square and hexagonal geometries on opposing faces. Thesere created by systematic rotation of the build element in theAD model represented in Fig. 13(c). Fig. 13(a) also illustrateshe variation in the strut diameters, which increase from lefto right. Typical strut structures are illustrated in the SEMmages in Fig. 14, which show relatively unmelted and partiallyintered Fe powder particles in the surface, and composingeveral equivalent particle diameters in surface thickness.he strut interior solid portion is shown in cross-section in
ig. 14(a). Fig. 14(b) shows surface melt and additive-layer melteatures.(b). The slope of the fitted line is 2.8.
Fig. 15(a) shows an example of the tensile, stress–strainresponse for the solid, cylindrical Fe components. The soliddensity was measured to be 7.51 g/cm3. In contrast to the the-oretical density of 7.87 g/cm3, the measured density indicatesa porosity of roughly 4%. In addition, the tensile data repre-sented in Fig. 15(a) shows an upper yield point which, whenaveraged with other tensile data, was observed to be 170 MPa;and an ultimate tensile strength of 180 MPa. The Young’s mod-ulus measured from the tensile data (as in Fig. 15(a)) was116 GPa. With this modulus (Es = 116 GPa) and a solid density
specific density (�/�s) for the mesh components (Fig. 13(a) and(b)) were plotted as illustrated in Fig. 15(b), where the slope of
384 j m a t e r r e s t e c h n o l . 2 0 1 3;2(4):376–385
Table 1 – Mechanical properties for EBM-fabricated Fe.
Powder hardnessa
(GPa)Mesh hardnessa (GPa) Solid hardnessa (GPa) Young’s modulus (GPa) Yield strength (GPa) UTS (GPa) Elongation (%)
1.5 1.26 1.28 116 0.17 0.18 15
a
Vickers, 100 gf load, 10 s dwell (20 measurements average).the fitted line was observed to be ∼2.8. This is larger than theaverage n ∼= 2 characteristic of a range of other metal and alloymesh and foam materials [6,7]. The significant portion of themesh struts having poorly melted and partially sintered sur-face particles (Fig. 14) may have contributed to this variancein the specific stiffness versus specific density data repre-sented in Fig. 15(b). In addition, the sample dimensions notedin Fig. 13 are at the edge of the dynamic measurement sensi-tivity. Consequently a combination of issues has contributedto the measured slope shown in Fig. 15(b).
It might also be noted that the measured Young’s modulusalso reflects the well known effect of porosity, where for lowporosity (4.6% measured in this study) E/Es = 1–1.9P, where P
is the porosity [8]. Consequently the ideally dense solid wouldbe 127 GPa.Fig. 16 – SEM views for fracture surface sectionscorresponding to tensile specimen failure (as shown inFig. 15(a)). (a) Lower magnification. (b) Higher magnificationimage showing ductile dimple detail. Average dimple sizeis ∼0.4 �m. Magnification in (a) is the same as noted in (b).
Fig. 15(a) also illustrates an elongation of 15% while Fig. 16illustrates the ductile dimple fracture surface microstructurecharacteristic of this moderate ductility. In addition, Fig. 15(a)shows, in addition to the upper yield point, discontinuousyielding evidence up to a strain (or elongation) of 0.05 (5%).This is probably related to the effect of the �-phase platesthat are homogeneously distributed throughout the EBM-fabricated components as illustrated typically in Figs. 5 and 6.The dislocation substructures apparent in all of the TEMimages (Figs. 8–12) will densify with increasing tensile strain-ing and interact with the �-phase to create the discontinuousor irregular deformation straining implicit in the stress–straindiagram illustrated in Fig. 15(a).
The presence of the �-Fe platelets in the precursor, rapidlysolidified powder, and their retention and even prolifera-tion in the EBM-fabricated components would seem to be acharacteristic of the rapid, non-equilibrium cooling associ-ated both with the powder atomization and the layer-by-layermelt-solidification processing in EBM component building.Since the authors are unaware of any similar observationsof retained, non-equilibrium �-Fe in �-Fe, it is not possibleto examine the associated and contributing thermokineticphenomena in any detail. Nonetheless, the observations of �-Fe plates coincident with {1 0 0} and {1 1 0} �-Fe matrix planesin Figs. 8–12 certainly present very novel circumstances whichmay necessitate further, more extensive study.
Table 1 summarizes the tensile data along with themicroindentation hardness data measured in this study. Itis of interest to note that the yield stress for the solidFe components is roughly a factor 1/7.5 times the residualmicroindentation (Vickers) hardness. For many metals andalloys the yield stress is 1/3 the corresponding microinden-tation hardness.
Both the solid EBM-fabricated components and the meshcomponents were highly magnetic, as determined by exposingthem to a strong rare-earth magnet.
4. Conclusions
Rapidly solidified, atomized pure iron powder having anaverage powder particle size of 19 �m was observed to con-tain meta-stable �-Fe (bcc; a = 3.0 A) which was retained andenhanced in the EBM fabrication of solid and reticulatedmesh components. EBM fabricated solid Fe components wereobserved by TEM to contain a homogeneous distribution of �-
Fe phase plates measuring roughly 0.5 �m to 2 �m in lengthand ∼40 nm thick, coincident with either {1 0 0} or {1 1 0} �-Fematrix planes. This appears to be the first such observation of�-Fe in and �-Fe matrix.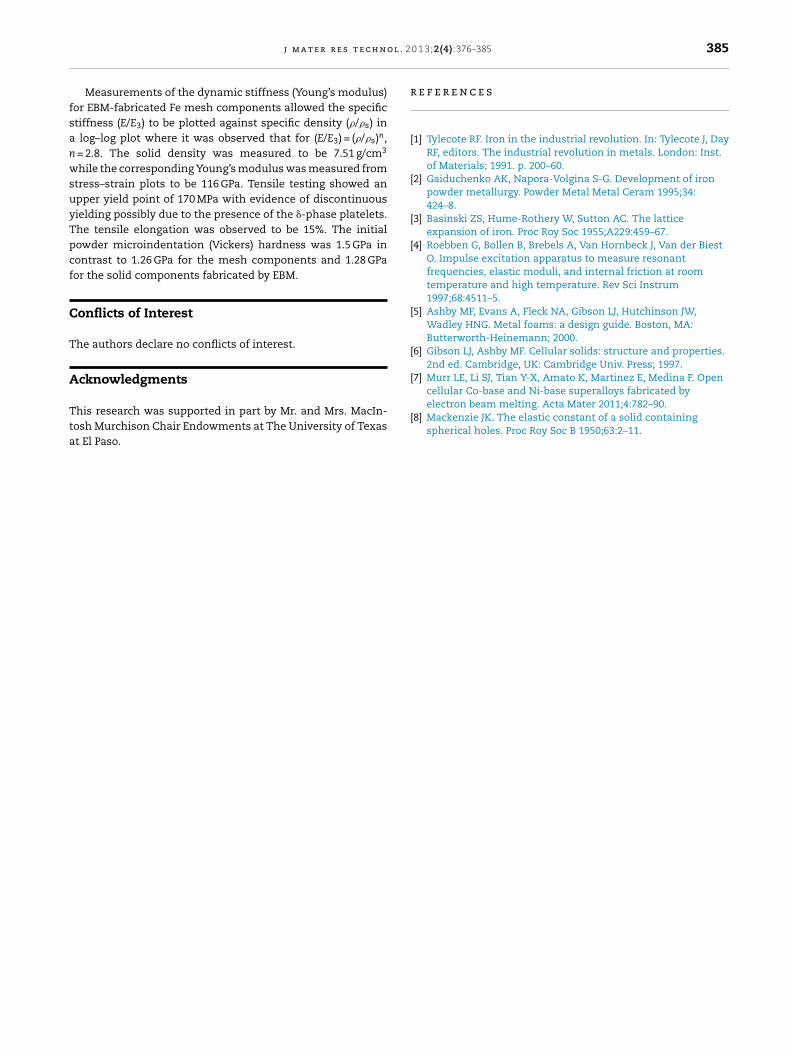
o l . 2
fsanwsuyTpcf
C
T
A
Tta
r
[
[
[
[
[
[
[cellular Co-base and Ni-base superalloys fabricated by
j m a t e r r e s t e c h n
Measurements of the dynamic stiffness (Young’s modulus)or EBM-fabricated Fe mesh components allowed the specifictiffness (E/E3) to be plotted against specific density (�/�s) in
log–log plot where it was observed that for (E/E3) = (�/�s)n, = 2.8. The solid density was measured to be 7.51 g/cm3
hile the corresponding Young’s modulus was measured fromtress–strain plots to be 116 GPa. Tensile testing showed anpper yield point of 170 MPa with evidence of discontinuousielding possibly due to the presence of the �-phase platelets.he tensile elongation was observed to be 15%. The initialowder microindentation (Vickers) hardness was 1.5 GPa inontrast to 1.26 GPa for the mesh components and 1.28 GPaor the solid components fabricated by EBM.
onflicts of Interest
he authors declare no conflicts of interest.
cknowledgments
his research was supported in part by Mr. and Mrs. MacIn-osh Murchison Chair Endowments at The University of Texast El Paso.
[
0 1 3;2(4):376–385 385
e f e r e n c e s
1] Tylecote RF. Iron in the industrial revolution. In: Tylecote J, DayRF, editors. The industrial revolution in metals. London: Inst.of Materials; 1991. p. 200–60.
2] Gaiduchenko AK, Napora-Volgina S-G. Development of ironpowder metallurgy. Powder Metal Metal Ceram 1995;34:424–8.
3] Basinski ZS, Hume-Rothery W, Sutton AC. The latticeexpansion of iron. Proc Roy Soc 1955;A229:459–67.
4] Roebben G, Bollen B, Brebels A, Van Hornbeck J, Van der BiestO. Impulse excitation apparatus to measure resonantfrequencies, elastic moduli, and internal friction at roomtemperature and high temperature. Rev Sci Instrum1997;68:4511–5.
5] Ashby MF, Evans A, Fleck NA, Gibson LJ, Hutchinson JW,Wadley HNG. Metal foams: a design guide. Boston, MA:Butterworth-Heinemann; 2000.
6] Gibson LJ, Ashby MF. Cellular solids: structure and properties.2nd ed. Cambridge, UK: Cambridge Univ. Press; 1997.
7] Murr LE, Li SJ, Tian Y-X, Amato K, Martinez E, Medina F. Open
electron beam melting. Acta Mater 2011;4:782–90.8] Mackenzie JK. The elastic constant of a solid containing
spherical holes. Proc Roy Soc B 1950;63:2–11.