Embed Size (px)
Citation preview

Science of Sintering 51 (2019) 327-338 ________________________________________________________________________
_____________________________
) Corresponding author mehmetakkaskastamonuedutr
doihttpsdoiorg102298SOS1903327A
UDK 620193 6925331 539375 Microstructure Wear and Corrosion Properties of NiB-TiC Composite Materials Produced By Powder Metallurgy Method Mehmet Akkaş) Serkan Islak
Department of Mechanical Engineering Faculty of Engineering and Architecture Kastamonu University 37150 Kastamonu Turkey Abstract In this study NiB-TiC composite materials were produced using powder metallurgy In the Ni-TiC-B powder mixture TiC was fixed at a rate of 5 5 10 and 15 boron was added and mechanical alloying was carried out The prepared powder mixtures were cold pressed under pressure of 400 MPa and sintered in an argon atmosphere at 800 oC for 2 hours Microstructure phase formation hardness wear and corrosion properties of the samples were investigated in detail Scanning electron microscopy (SEM) was used for microstructure analysis and X-ray diffractogram (XRD) was used for phase formation detection The hardness measurements of the samples were measured by a microhardness measuring device Densities of the samples were determined by Archimedes principle The corrosion tests were performed potentiodynamic polarization curves of the composite materials in 35 NaCl solution Wear tests were carried out the composite materials under a load of 10 N Results showed that by increasing the amount of B the wear and corrosion resistance increased Keywords NiB-TiC composites Powder metallurgy Sintering Mechanical alloying Corrosion 1 Introduction Nickel is an element capable of alloying with various elements such as high-resolution iron chrome and cobalt It is used in various industrial applications such as Ni-based alloys gas turbine parts medical applications and nuclear systems [1] These alloys can solve wear resistance corrosion and thermal fatigue problems These properties lead to the development of new Ni-based alloys It is vital to develop machine parts such as bearings gears and cam that are in contact with each other and are subject to wear Nowadays there is a need to develop new materials to reduce wear rates On the other hand tribology studies focus on different ways to reduce friction and wear of machine parts by analyzing and investigating events involving friction events lubrication and wear [2-6] Ni-B alloys have several advantages including hydrogenation processes and catalytic activities Furthermore Nickel 1455 oC and Boron have a melting temperature of 2076 oC In addition electrolytic Ni-B coatings have been used to reduce wear and friction in a wide range of applications in corrosive environments Ni2B intermetallic phases are well known for their high hardness high chemical and thermal stability [7-9] Big differences have between the melting temperatures of nickel and boron therefore it is difficult to produce Ni-B based alloys by melting-based methods Mechanical alloying can be used to overcome this difficulty In this way Ni-B intermetallics can be produced
M Akkas et alScience of Sintering 51(2019) 327-338 ___________________________________________________________________________
328
which have lower melting degrees than nickel and melting degrees of the pipe [10 11] Among the nickel and boron there are many intermetallic phases such as Ni3B Ni2B Ni4B3 and NiB These are hard and wear resistant phases Production of nickel-based alloys by powder metallurgy methods is common Powder metallurgy involves the production of powders mixing and converting into a final product the is more suiTab for the production of materials with weakness and machinability This method has been replaced by powder metallurgy because the high strength alloys used in the construction of gas turbine discs are difficult to be forged Further advantages of this method are the ease of dust particle size control and minimization of errors such as gas gap [12] Mechanical alloying of powder metallurgy methods production of nano-sized powders and melting temperature are the methods that are applied as an economical and versatile production technique for obtaining various metallic alloys The alloying process in the alloying process the alloying time the powder-grinding ball ratio affect the final microstructure particle size average surface area In addition the elemental powder mixtures can be produced as solid intermetallic and amorphous phases Mechanical alloying is often used in manufacturing processes with powder metallurgy [13 14] In this study NiB-TiC alloys were prepared by adding TiC and B into the Ni matrix in different ratios using a cold pressing and sintering method (powder metallurgy) The microstructure corrosion wear and hardness properties of these composites were investigated 2 Materials and Experimental Procedures NiB-TiC alloys with powder metallurgy method and NiB-TiC alloys were used for experimental production Nickel powder with 995 purity and 45 micron size range was purchased from Sigma-Aldrich Company TiC powder with 98 purity and 44 micron size range was purchased from Sigma-Aldrich Company Boron powder with 99-97 purity and 04 micron size range was purchased from Pavezyum Chemical Industry Company In the Tab I results of chemical analysis (composition) are given Tab I Production parameters of samples
Sample No Ni (wt) B (wt) TiC (wt) 1 100 0 0 2 95 0 5 3 90 5 5 4 85 10 5 5 80 15 5
In the NiB-TiC powder mixture 5 10 and 15 boron were added to keep the TiC content at 5 and mechanical alloying was performed by stirring at 350 rpm for 5 hours The prepared powders were placed in the cold pressing mold In the cold pressing process a pressure of 400 MPa was applied as the pressing pressure Sintering process was carried out at argon atmosphere at 800 oC for 2 hours After pressing and sintering metallographic sample preparation methods were applied to the materials produced in 10 mm diameter and 6 mm height SEM EDS XRD microhardness density wear and corrosion analyzes were performed for the obtained samples The SEM images and EDS analyzes of the materials were obtained from the ldquoFEIrdquo brand ldquoQuanta FEG 250rdquo in model device at Kastamonu University Central Research Laboratories The XRD analyzes of the samples were taken from ldquoBrukerrdquo brand ldquoD8
M Akkas et alScience of Sintering 51(2019) 327-338 ___________________________________________________________________________
329
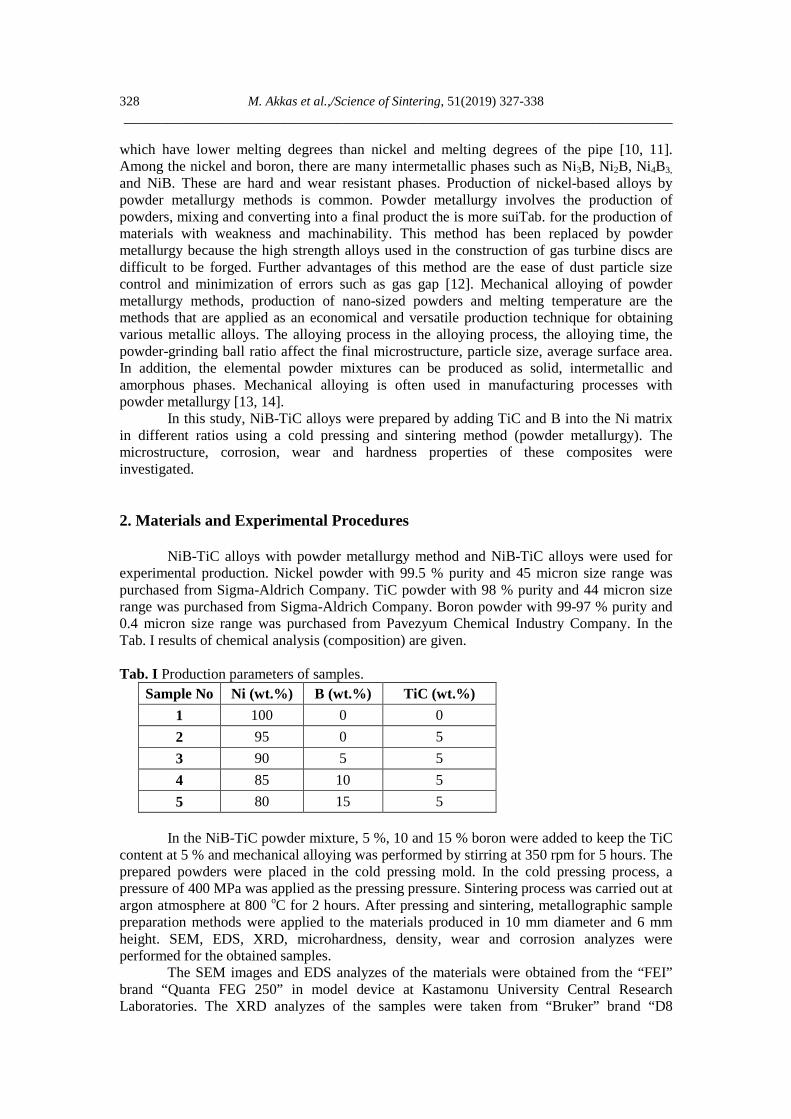
Advancerdquo model device at Kastamonu University Central Research Laboratories The hardness measurements of the materials were done by using ldquoSHIMADZUrdquo brand ldquoHMV-G21rdquo model microhardness measurement device under 15 g waiting time and 200 g load The densities of the samples were calculated by using the Archimedes principle Corrosion tests of the produced materials were made by ldquoGamryrdquo brand PotentiostatGalvanostat device The wear tests of the produced samples were carried out in accordance with ASTM G133 standard with ldquoUTS Tribometer T10 Test Devicerdquo in Karabuumlk University Iron and Steel Institute 3 Results and Discussion The SEM images of the NiB-TiC composites produced by the powder metallurgy method (Fig 1) were taken and evaluations were made according to the obtained images When the SEM images are examined the Ni structure of the sample containing 100 Ni is clearly seen In addition it is seen that TiC particles are distributed homogeneously in the interior of the sample containing Ni+5 TiC Samples produced are non-cracked and partially porous As the addition of B increases the pore amount decreases and it is seen from SEM photographs It is observed that the boron is distributed homogeneously in the given SEM images The homogeneous dispersion may be sufficient due to the mechanical alloying process and the sintering temperature [15]
Fig 1 SEM images of Ni-B-TiC alloys produced by powder metallurgy method
M Akkas et alScience of Sintering 51(2019) 327-338 ___________________________________________________________________________
330
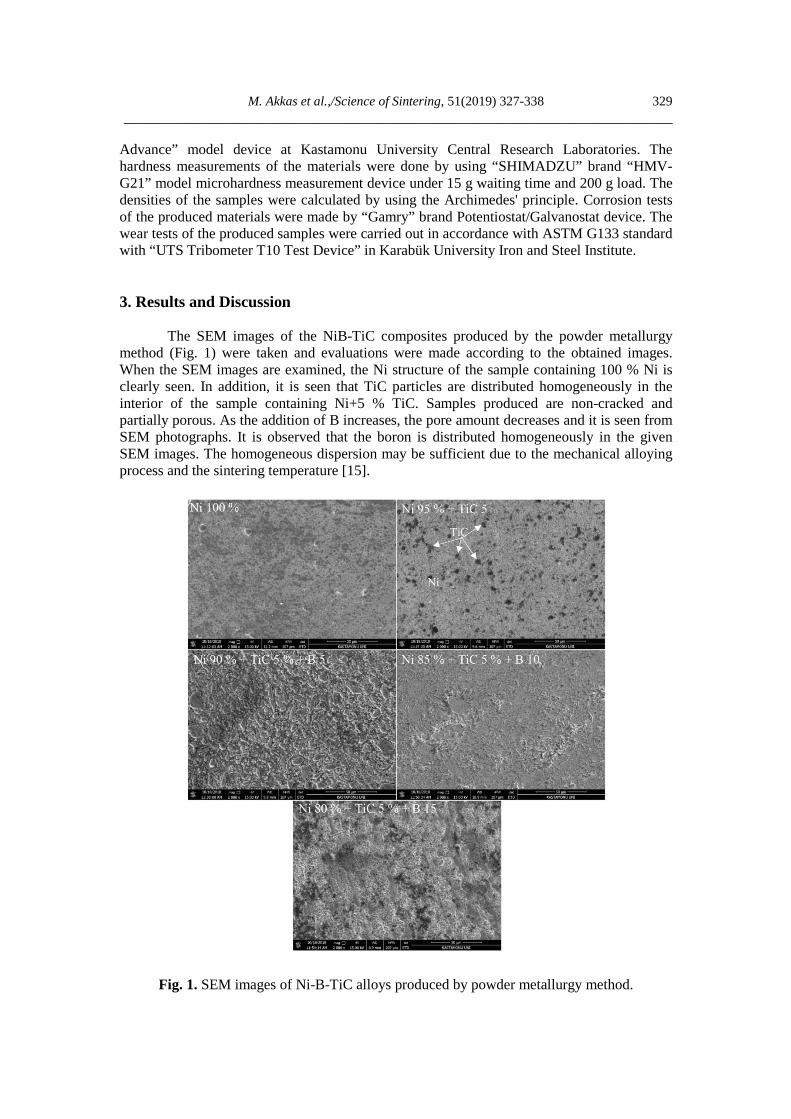
EDS analyzes of the samples produced are shown in Fig 2 The EDS analysis given in Fig 2a shows that the structure is 100 Ni The EDS analysis given in Fig 2b is the result of EDS analysis of Ni + 5 TiC alloy and supports the produced sample Fig 2c is the result of EDS analysis of the NiB-TiC composite and contains 6631 Ni 557 Ti 668 B 1043 C and 11 O in the structure
Fig 2 EDS analysis of samples produced (a) Ni (b) Ni + 5 TiC and (c) Ni + 5 TiC +
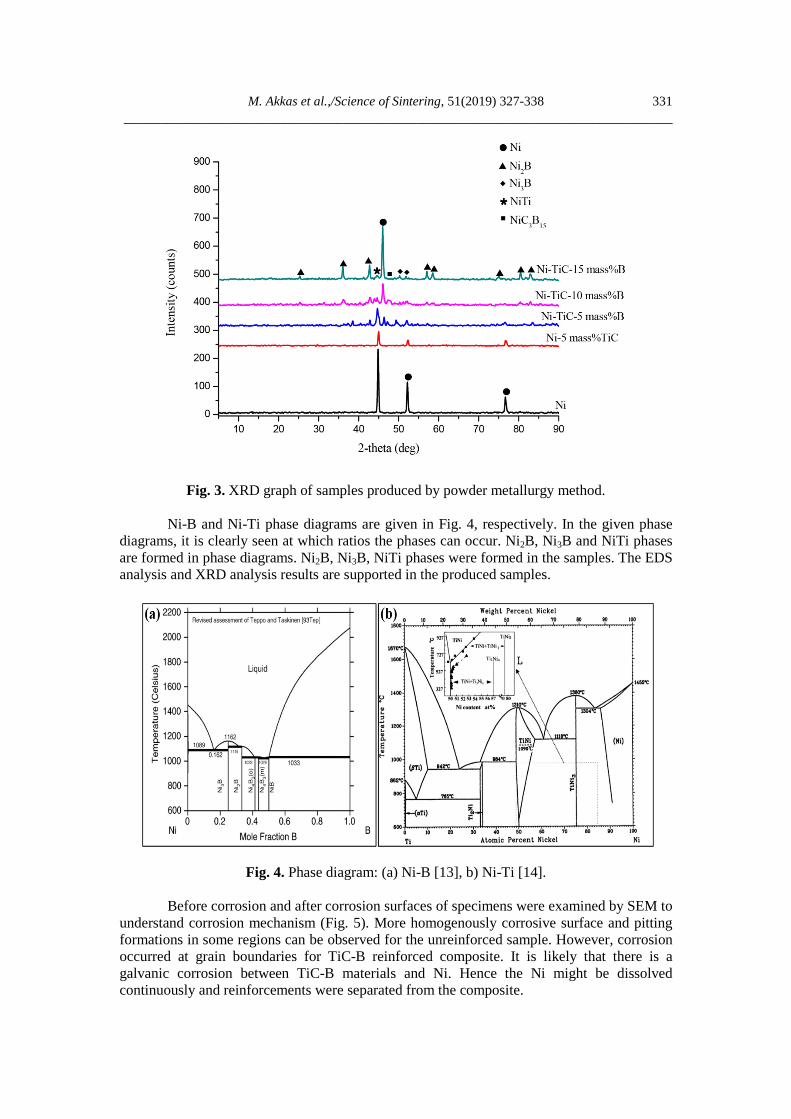
10 B The XRD graph of NiB-TiC composites produced by powder metallurgy is given in Fig 3 Ni Ni2B Ni3B NiTi and NiC3B15 phases were formed in the samples When the graph is analyzed it is clear that Ni and Ni2B phases are dominant During the sintering process Ni2B and Ni3B phases occurred between the Ni and B elements Very little amount of NiC3B15 triple phase occurred As the addition amount B increased the intensity of Ni2B and Ni3B phases increased [16]
M Akkas et alScience of Sintering 51(2019) 327-338 ___________________________________________________________________________
331
Fig 3 XRD graph of samples produced by powder metallurgy method Ni-B and Ni-Ti phase diagrams are given in Fig 4 respectively In the given phase diagrams it is clearly seen at which ratios the phases can occur Ni2B Ni3B and NiTi phases are formed in phase diagrams Ni2B Ni3B NiTi phases were formed in the samples The EDS analysis and XRD analysis results are supported in the produced samples
Fig 4 Phase diagram (a) Ni-B [13] b) Ni-Ti [14] Before corrosion and after corrosion surfaces of specimens were examined by SEM to understand corrosion mechanism (Fig 5) More homogenously corrosive surface and pitting formations in some regions can be observed for the unreinforced sample However corrosion occurred at grain boundaries for TiC-B reinforced composite It is likely that there is a galvanic corrosion between TiC-B materials and Ni Hence the Ni might be dissolved continuously and reinforcements were separated from the composite
M Akkas et alScience of Sintering 51(2019) 327-338 ___________________________________________________________________________
332
Fig 5 SEM-EDS images and analysis results of the NiB-TiC alloys produced before and after
corrosion
The potentiodynamic polarization curves of composites determined in 35 NaCl solution are shown in Fig 6 Potential was applied between -05 mV and 05 mV (with a scanning rate of 5 mVs) versus open circuit potentials (OCP) which were determined after 15 min of immersion periods The Ecorr values of the TiC and B reinforced composites shifted to anodic region This is a strong indication for degraded corrosion performance of reinforced
M Akkas et alScience of Sintering 51(2019) 327-338 ___________________________________________________________________________
333
composites Yet the relation between corrosion performance TiC and B contents of reinforced samples is not clear from the figure This is mostly because of very different potentiodynamic behavior in the cathodic and anodic portions of scanning for different TiC and B contents
Fig 6 Potentiodynamic polarization curves of composites All curves exhibit activepassive behavior The results of the corrosion measurements are summarized in Tab II Among the samples the largest corrosion potential has unreinforced Ni+TiC sample (-188 mV) The lowest corrosion potential among the other samples was measured as -347 mV for Ni+TiC+B (10 ) Among the measured corrosion current values the smallest value belongs to Ni+TiC sample (125 μAcm-2) In corrosion science the general approach to corrosion is that low corrosion current and high corrosion potential means low corrosion rate or high corrosion resistance [18 19] According to this approach it is the Ni+TiC sample which is the most resistant to corrosion among the composites Corrosion rate and corrosion resistance values in Tab II also support this approach As the amount of TiC increased the resistance of the composite to corrosion decreased The presence of the TiC and B particle in the Ni matrix caused a second passivation peak to occur In addition with the increase in the amount of TiC and B the amount of porosity increases Total and number surface of pores expands the corrosion area and reduce corrosion resistance [17-18] Therefore explicit calculation of corrosion current density (icorr) which can be applied through Tafel extrapolation to corrosion data is required Icorr values determined from extrapolations can also be used to calculate corrosion rates of the samples according to following equation [19] Corrosion Rate (mmyear)= λ Icorr(EW)d where λ=327 x 10-3(mm g)(mA cm year) is a metric conversion factor EW = Equivalent Weight d = Density (gcm3)
M Akkas et alScience of Sintering 51(2019) 327-338 ___________________________________________________________________________
334
Tab II Electrochemical results of Materials
Materials Ecorr (mV)
Icorr (microAcm-2)
Βa (mV)
Βc (mV)
Corrosion rate (mpy)
Corrosion resistance (kΩcm2)
Ni -251 666 8760 7320 1802 2793 Ni+TiC -188 125 303 1216 3393 1156
Ni+TiC+B (5 ) -254 136 3812 2286 3692 4178 Ni+TiC+B (10 ) -347 102 2016 1644 2765 1578 Ni+TiC+B (15 ) -345 4720 1489 1784 1276 3016
The results derived from individual fittings have been presented in Tab III It seems that very low concentration (Ni+TiC) of TiC leads to a large gradation increase of corrosion performance This is much clearer from the data shown in the inset of Fig 6 as one can deduce an exponentially stabilized behavior of corrosion rate with extra additions of TiC+B Therefore larger addition of TiC+B into these composites will not degrade overall corrosion performance This is important information which will be very useful in case for larger addition of TiC+B is mandatory in improving mechanical properties As a result there is a reaction between Ni and TiC+B TiC+B acts as effective anodes to accelerate corrosions So corrosion rate is decreased for NiB-TiC composites Same results are taken for TiC-B reinforced nickel composite in literature [17 18] The microhardness graph of the samples produced in Fig 7 is given Hardness measurements were taken from the sample surface along a line at 50 μm intervals The hardness of the sample with 100 Ni is about 117 HV002 The hardness value of the sample containing Ni + 5 TiC changed to 120 HV002 The hardness of the samples with 5 10 and 15 addition according to addition B is 157 171 and 188 HV002 respectively The hardness of the B doped samples is higher than the 100 Ni sample This increase is associated with the presence of carbide and hard phases formed Addition of B caused the formation of the Ni2B and Ni3B phase and consequently contributed to the increase in hardness [20 21]
Fig 7 Microhardness graph of produced samples
The change in the density values of the produced samples is given in Tab III When Tab III is examined it was determined that the relative density values of the samples decreased according to the amount of B [21 22] In addition the increase in the amount of B with decreasing density ratios of the samples are supported on the SEM images
117 120
157171
188
100120140160180200220
Ni Ni-TiC Ni-TiC-B (5)
Ni-TiC-B (10)
Ni-TiC-B (15)M
icro
hard
ness
(HV
002
)
Produced Samples
M Akkas et alScience of Sintering 51(2019) 327-338 ___________________________________________________________________________
335
Tab III Density values of samples produced
Theoretical Density (grcm3)
Experimental Density (grcm3)
Relative Density ()
Ni 89 67021 75 Ni+TiC 87015 58339 67
Ni+TiC+B (5 ) 83795 51638 61 Ni+TiC+B (10
) 80575 45401 56
Ni+TiC+B (15 ) 77355 41476 53
Wear depth values belonging to the composites under load of 10 N Wear depth values are calculated each 100 m sliding distance up to 100 m for all samples As expected wear depth is increased with applied load There is a great difference between pure nickel and Ni+TiC+B composites Wear depth decreases with the addition of B First 100 m the rise of wear depth is too much especially for Ni+TiC+B 15 under the load of 10N At the end of 100 m sliding distance Ni+TiC+B 15 composite exhibit best wear performance but there is not a significant difference compared then Ni+TiC+B 10 Modest increases can be seen after boron 010 wt Fig 7 shows the variations in coefficient of friction (COF) with loads 10 N for all composites According to the results COF decreases when applied load increases for all samples Nickel displays a lower coefficient of friction compared with other composites under load of 10N Higher weight percentage can be seen clearly for Nickel Ni+TiC and Ni+TiC+B 5 exhibit a similar trend and there is no significance change in COF Wear rates (weight loss) of samples are presented in Fig 7 TiC is apparent that wear rates are smaller at the higher boron On the other hand addition of boron and TiC on nickel improves the wear resistance Pure nickel has highest wear rates under load of 10N Ni+TiC+B 15 composite show better wear resistance and the wear rate is lower than other composites and pure nickel
Fig 8 Wear rate and friction coefficient of investigated composites
As indicated in Fig 5 Ni+TiC+B 15 has the highest hardness value The hardness of material effects the wear behavior [23] It is related in literature that softer materials have
M Akkas et alScience of Sintering 51(2019) 327-338 ___________________________________________________________________________
336
also higher wear rates than harder materials and according to the Archard wear rate is proportional with applied loads [24] The results of wear loss100 m belonging to the composites used in this study demonstrate the relation between hardness and wear rates The worn surfaces of specimens under load of 10 N are shown in Fig 9 SEM was used to determine wear mechanism Wear mechanisms (oxidation abrasion and adhesion) can be found in worn surfaces either only or combination [24] Fig 8 Scratch marks are parallel to the sliding direction and there are oxidation parts in selected areas Fig 8 present the Ni 95 + TiC 5 and Ni 80 + TiC 5 + B 15 composites It is clearly seen that located on the worn surface Wear rate is lower than other composites and partially scratch marks can be seen in the microstructure When all microstructures of composites are examined it can be concluded that Ni 80 + TiC 5 + B 15 show best wear characteristics
Fig 9 Worn surfaces and EDS analysis results of samples
M Akkas et alScience of Sintering 51(2019) 327-338 ___________________________________________________________________________
337
As a result abrasive wear is a dominant mechanism Scratch marks are generally parallel to the sliding direction Adhesion can be significantly less than abrasive for all samples It is also minimized because of the fact that the wear tests are carried out using low sliding speed 4 Conclusion In this study nanoparticle additive NiB-TiC alloys were produced by powder metallurgy method and SEM-EDS XRD microhardness density wear and corrosion results were investigated 400 MPa pressure 800 oC temperature and 2 hours in argon atmosphere were used as production parameters As a result of the studies The nanoparticle additive NiB-TiC alloys were successfully pressed and sintered As a result of XRD analysis Ni Ni2B Ni3B NiTi and NiC3B15 phases were
determined The highest hardness value was obtained in 15 B additive sample It was determined that the relative density values of the samples decreased due to the
increasing amount of B Corrosion rate is decreased for NiB-TiC composites When all microstructures of composites are examined it can be concluded that Ni 80
+ TiC 5 + B 15 show best wear characteristics 5 References
1 A Ivanović-Šašić T Novaković Z Mojović Ž Čupić D Jovanović Science of Sintering 50(3) (2018) 313
2 M Shahbazi H Cathey N Danilova I Mackinnon Materials 11(7) (2018) 1259 3 X S Xie S Q Zhao J X Dong G D Smith S J Patel In Materials Science
Forum 475 (2005) 613 4 K Wakasa M Yamaki Journal of materials science letters 10(18) (1991) 1093 5 F Li J Cheng S Zhu J Hao J Yang W Liu Materials Science and Engineering
A 682 (2017) 475 6 B Liu S Huang J Van Humbeeck J Vleugels Ceramics International 43(12)
(2017) 9512 7 M Mirak A Akbari Surface and Coatings Technology 349 (2018) 442 8 D Kır S Islak H Ccedilelik E Ccedilelik Science of Sintering 44 (2012) 235 9 W Zhang B Li International Journal of Electrochemical Science 13(4) (2018)
3486 10 R A Yildiz K Genel T Gulmez International Journal of Materials Mechanics and
Manufacturing 5(2) (2017) 83 11 S Islak Ouml Kuumlccediluumlk Ouml Eski C Oumlzorak M Akkaş Science of Sintering 49 (2017)
347 12 R Milinčić M Spasojević M Spasojević A Maričić S Randjić Science of
Sintering 48(3) (2016) 343 13 N Z Tomić M M Dimitrijević B I Međo M P Rakin R J Heinemann V J
Radojević R R Aleksić Science of Sintering 46(2) (2014) 225 14 S R Hashemi M Ardestani A Nemati Science of Sintering 48(1) (2016) 71 15 M A Korchagin D V Dudina B B Bokhonov N V Bulina A V Ukhina I S
Batraev Journal of materials science 53(19) (2018) 13592 16 M Nazarian-Samani A R Kamali R Mobarra Materials Letters 64(3) (2010) 309
M Akkas et alScience of Sintering 51(2019) 327-338 ___________________________________________________________________________
338
17 E Georgiza V Gouda P Vassiliou Surface and Coatings Technology 325 (2017) 46
18 X He R G Song D J Kong Journal of Alloys and Compounds 770 (2019) 771 19 G ASTM G102-89 ASTM International West Conshohocken USA (2004) 20 C E Campbell U R Kattner Journal of phase equilibria 20(5) (1999) 485 21 K Otsuka X Ren Progress in materials science 50(5) (2005) 511 22 H H Sheu Y C Tzeng J H Syu Materials Letters 238 (2019) 275 23 M Karbasi M R Zamanzad Ghavidel A Nekahi Materials and Corrosion 65(5)
(2014) 485 24 G J Arputhavalli S Agilan M Dinesh S J Vijay R Johnson Science of
Sintering 50(3) (2018) 337 Садржај У овом раду NiB-TiC композитни материјали су добијени металургијом праха У Ni-TiC-B смешу TiC је био фиксан са 5 док је 5 10 и 15 бора додавано у смешу Тако припремљене смеше прахова су пресоване под притиском од 400 MPa и синтеровани у атмосфери аргона на 800 oC током 2 сата Детаљно су испитани микроструктура формирање фаза тврдоћа хабање и корозиона својства SEM је коришћен за анализу микроструктуре а XRD за детекцију фаза Мерења тврдоће су рађена уз помоћ уређаја за мерење микро-тврдоће Густине узорака су одређене Архимедесовим принципом Потенционо-динамичке поларизационе криве су урађене за композите у 35 раствору NaCl ради одређивања корозионих својстава Хабање је мерено под силом од 10 N Резултати указују на то да са порастом удела бора хабање и отпорност на корозију расту Кључне речи NiB-TiC композити металургија праха синтеровање легирање корозија copy 2018 Authors Published by the International Institute for the Science of Sintering This article is an open access article distributed under the terms and conditions of the Creative Commons mdash Attribution 40 International license (httpscreativecommonsorglicensesby40)
M Akkas et alScience of Sintering 51(2019) 327-338 ___________________________________________________________________________
328
which have lower melting degrees than nickel and melting degrees of the pipe [10 11] Among the nickel and boron there are many intermetallic phases such as Ni3B Ni2B Ni4B3 and NiB These are hard and wear resistant phases Production of nickel-based alloys by powder metallurgy methods is common Powder metallurgy involves the production of powders mixing and converting into a final product the is more suiTab for the production of materials with weakness and machinability This method has been replaced by powder metallurgy because the high strength alloys used in the construction of gas turbine discs are difficult to be forged Further advantages of this method are the ease of dust particle size control and minimization of errors such as gas gap [12] Mechanical alloying of powder metallurgy methods production of nano-sized powders and melting temperature are the methods that are applied as an economical and versatile production technique for obtaining various metallic alloys The alloying process in the alloying process the alloying time the powder-grinding ball ratio affect the final microstructure particle size average surface area In addition the elemental powder mixtures can be produced as solid intermetallic and amorphous phases Mechanical alloying is often used in manufacturing processes with powder metallurgy [13 14] In this study NiB-TiC alloys were prepared by adding TiC and B into the Ni matrix in different ratios using a cold pressing and sintering method (powder metallurgy) The microstructure corrosion wear and hardness properties of these composites were investigated 2 Materials and Experimental Procedures NiB-TiC alloys with powder metallurgy method and NiB-TiC alloys were used for experimental production Nickel powder with 995 purity and 45 micron size range was purchased from Sigma-Aldrich Company TiC powder with 98 purity and 44 micron size range was purchased from Sigma-Aldrich Company Boron powder with 99-97 purity and 04 micron size range was purchased from Pavezyum Chemical Industry Company In the Tab I results of chemical analysis (composition) are given Tab I Production parameters of samples
Sample No Ni (wt) B (wt) TiC (wt) 1 100 0 0 2 95 0 5 3 90 5 5 4 85 10 5 5 80 15 5
In the NiB-TiC powder mixture 5 10 and 15 boron were added to keep the TiC content at 5 and mechanical alloying was performed by stirring at 350 rpm for 5 hours The prepared powders were placed in the cold pressing mold In the cold pressing process a pressure of 400 MPa was applied as the pressing pressure Sintering process was carried out at argon atmosphere at 800 oC for 2 hours After pressing and sintering metallographic sample preparation methods were applied to the materials produced in 10 mm diameter and 6 mm height SEM EDS XRD microhardness density wear and corrosion analyzes were performed for the obtained samples The SEM images and EDS analyzes of the materials were obtained from the ldquoFEIrdquo brand ldquoQuanta FEG 250rdquo in model device at Kastamonu University Central Research Laboratories The XRD analyzes of the samples were taken from ldquoBrukerrdquo brand ldquoD8
M Akkas et alScience of Sintering 51(2019) 327-338 ___________________________________________________________________________
329
Advancerdquo model device at Kastamonu University Central Research Laboratories The hardness measurements of the materials were done by using ldquoSHIMADZUrdquo brand ldquoHMV-G21rdquo model microhardness measurement device under 15 g waiting time and 200 g load The densities of the samples were calculated by using the Archimedes principle Corrosion tests of the produced materials were made by ldquoGamryrdquo brand PotentiostatGalvanostat device The wear tests of the produced samples were carried out in accordance with ASTM G133 standard with ldquoUTS Tribometer T10 Test Devicerdquo in Karabuumlk University Iron and Steel Institute 3 Results and Discussion The SEM images of the NiB-TiC composites produced by the powder metallurgy method (Fig 1) were taken and evaluations were made according to the obtained images When the SEM images are examined the Ni structure of the sample containing 100 Ni is clearly seen In addition it is seen that TiC particles are distributed homogeneously in the interior of the sample containing Ni+5 TiC Samples produced are non-cracked and partially porous As the addition of B increases the pore amount decreases and it is seen from SEM photographs It is observed that the boron is distributed homogeneously in the given SEM images The homogeneous dispersion may be sufficient due to the mechanical alloying process and the sintering temperature [15]
Fig 1 SEM images of Ni-B-TiC alloys produced by powder metallurgy method
M Akkas et alScience of Sintering 51(2019) 327-338 ___________________________________________________________________________
330
EDS analyzes of the samples produced are shown in Fig 2 The EDS analysis given in Fig 2a shows that the structure is 100 Ni The EDS analysis given in Fig 2b is the result of EDS analysis of Ni + 5 TiC alloy and supports the produced sample Fig 2c is the result of EDS analysis of the NiB-TiC composite and contains 6631 Ni 557 Ti 668 B 1043 C and 11 O in the structure
Fig 2 EDS analysis of samples produced (a) Ni (b) Ni + 5 TiC and (c) Ni + 5 TiC +
10 B The XRD graph of NiB-TiC composites produced by powder metallurgy is given in Fig 3 Ni Ni2B Ni3B NiTi and NiC3B15 phases were formed in the samples When the graph is analyzed it is clear that Ni and Ni2B phases are dominant During the sintering process Ni2B and Ni3B phases occurred between the Ni and B elements Very little amount of NiC3B15 triple phase occurred As the addition amount B increased the intensity of Ni2B and Ni3B phases increased [16]
M Akkas et alScience of Sintering 51(2019) 327-338 ___________________________________________________________________________
331
Fig 3 XRD graph of samples produced by powder metallurgy method Ni-B and Ni-Ti phase diagrams are given in Fig 4 respectively In the given phase diagrams it is clearly seen at which ratios the phases can occur Ni2B Ni3B and NiTi phases are formed in phase diagrams Ni2B Ni3B NiTi phases were formed in the samples The EDS analysis and XRD analysis results are supported in the produced samples
Fig 4 Phase diagram (a) Ni-B [13] b) Ni-Ti [14] Before corrosion and after corrosion surfaces of specimens were examined by SEM to understand corrosion mechanism (Fig 5) More homogenously corrosive surface and pitting formations in some regions can be observed for the unreinforced sample However corrosion occurred at grain boundaries for TiC-B reinforced composite It is likely that there is a galvanic corrosion between TiC-B materials and Ni Hence the Ni might be dissolved continuously and reinforcements were separated from the composite
M Akkas et alScience of Sintering 51(2019) 327-338 ___________________________________________________________________________
332
Fig 5 SEM-EDS images and analysis results of the NiB-TiC alloys produced before and after
corrosion
The potentiodynamic polarization curves of composites determined in 35 NaCl solution are shown in Fig 6 Potential was applied between -05 mV and 05 mV (with a scanning rate of 5 mVs) versus open circuit potentials (OCP) which were determined after 15 min of immersion periods The Ecorr values of the TiC and B reinforced composites shifted to anodic region This is a strong indication for degraded corrosion performance of reinforced
M Akkas et alScience of Sintering 51(2019) 327-338 ___________________________________________________________________________
333
composites Yet the relation between corrosion performance TiC and B contents of reinforced samples is not clear from the figure This is mostly because of very different potentiodynamic behavior in the cathodic and anodic portions of scanning for different TiC and B contents
Fig 6 Potentiodynamic polarization curves of composites All curves exhibit activepassive behavior The results of the corrosion measurements are summarized in Tab II Among the samples the largest corrosion potential has unreinforced Ni+TiC sample (-188 mV) The lowest corrosion potential among the other samples was measured as -347 mV for Ni+TiC+B (10 ) Among the measured corrosion current values the smallest value belongs to Ni+TiC sample (125 μAcm-2) In corrosion science the general approach to corrosion is that low corrosion current and high corrosion potential means low corrosion rate or high corrosion resistance [18 19] According to this approach it is the Ni+TiC sample which is the most resistant to corrosion among the composites Corrosion rate and corrosion resistance values in Tab II also support this approach As the amount of TiC increased the resistance of the composite to corrosion decreased The presence of the TiC and B particle in the Ni matrix caused a second passivation peak to occur In addition with the increase in the amount of TiC and B the amount of porosity increases Total and number surface of pores expands the corrosion area and reduce corrosion resistance [17-18] Therefore explicit calculation of corrosion current density (icorr) which can be applied through Tafel extrapolation to corrosion data is required Icorr values determined from extrapolations can also be used to calculate corrosion rates of the samples according to following equation [19] Corrosion Rate (mmyear)= λ Icorr(EW)d where λ=327 x 10-3(mm g)(mA cm year) is a metric conversion factor EW = Equivalent Weight d = Density (gcm3)
M Akkas et alScience of Sintering 51(2019) 327-338 ___________________________________________________________________________
334
Tab II Electrochemical results of Materials
Materials Ecorr (mV)
Icorr (microAcm-2)
Βa (mV)
Βc (mV)
Corrosion rate (mpy)
Corrosion resistance (kΩcm2)
Ni -251 666 8760 7320 1802 2793 Ni+TiC -188 125 303 1216 3393 1156
Ni+TiC+B (5 ) -254 136 3812 2286 3692 4178 Ni+TiC+B (10 ) -347 102 2016 1644 2765 1578 Ni+TiC+B (15 ) -345 4720 1489 1784 1276 3016
The results derived from individual fittings have been presented in Tab III It seems that very low concentration (Ni+TiC) of TiC leads to a large gradation increase of corrosion performance This is much clearer from the data shown in the inset of Fig 6 as one can deduce an exponentially stabilized behavior of corrosion rate with extra additions of TiC+B Therefore larger addition of TiC+B into these composites will not degrade overall corrosion performance This is important information which will be very useful in case for larger addition of TiC+B is mandatory in improving mechanical properties As a result there is a reaction between Ni and TiC+B TiC+B acts as effective anodes to accelerate corrosions So corrosion rate is decreased for NiB-TiC composites Same results are taken for TiC-B reinforced nickel composite in literature [17 18] The microhardness graph of the samples produced in Fig 7 is given Hardness measurements were taken from the sample surface along a line at 50 μm intervals The hardness of the sample with 100 Ni is about 117 HV002 The hardness value of the sample containing Ni + 5 TiC changed to 120 HV002 The hardness of the samples with 5 10 and 15 addition according to addition B is 157 171 and 188 HV002 respectively The hardness of the B doped samples is higher than the 100 Ni sample This increase is associated with the presence of carbide and hard phases formed Addition of B caused the formation of the Ni2B and Ni3B phase and consequently contributed to the increase in hardness [20 21]
Fig 7 Microhardness graph of produced samples
The change in the density values of the produced samples is given in Tab III When Tab III is examined it was determined that the relative density values of the samples decreased according to the amount of B [21 22] In addition the increase in the amount of B with decreasing density ratios of the samples are supported on the SEM images
117 120
157171
188
100120140160180200220
Ni Ni-TiC Ni-TiC-B (5)
Ni-TiC-B (10)
Ni-TiC-B (15)M
icro
hard
ness
(HV
002
)
Produced Samples
M Akkas et alScience of Sintering 51(2019) 327-338 ___________________________________________________________________________
335
Tab III Density values of samples produced
Theoretical Density (grcm3)
Experimental Density (grcm3)
Relative Density ()
Ni 89 67021 75 Ni+TiC 87015 58339 67
Ni+TiC+B (5 ) 83795 51638 61 Ni+TiC+B (10
) 80575 45401 56
Ni+TiC+B (15 ) 77355 41476 53
Wear depth values belonging to the composites under load of 10 N Wear depth values are calculated each 100 m sliding distance up to 100 m for all samples As expected wear depth is increased with applied load There is a great difference between pure nickel and Ni+TiC+B composites Wear depth decreases with the addition of B First 100 m the rise of wear depth is too much especially for Ni+TiC+B 15 under the load of 10N At the end of 100 m sliding distance Ni+TiC+B 15 composite exhibit best wear performance but there is not a significant difference compared then Ni+TiC+B 10 Modest increases can be seen after boron 010 wt Fig 7 shows the variations in coefficient of friction (COF) with loads 10 N for all composites According to the results COF decreases when applied load increases for all samples Nickel displays a lower coefficient of friction compared with other composites under load of 10N Higher weight percentage can be seen clearly for Nickel Ni+TiC and Ni+TiC+B 5 exhibit a similar trend and there is no significance change in COF Wear rates (weight loss) of samples are presented in Fig 7 TiC is apparent that wear rates are smaller at the higher boron On the other hand addition of boron and TiC on nickel improves the wear resistance Pure nickel has highest wear rates under load of 10N Ni+TiC+B 15 composite show better wear resistance and the wear rate is lower than other composites and pure nickel
Fig 8 Wear rate and friction coefficient of investigated composites
As indicated in Fig 5 Ni+TiC+B 15 has the highest hardness value The hardness of material effects the wear behavior [23] It is related in literature that softer materials have
M Akkas et alScience of Sintering 51(2019) 327-338 ___________________________________________________________________________
336
also higher wear rates than harder materials and according to the Archard wear rate is proportional with applied loads [24] The results of wear loss100 m belonging to the composites used in this study demonstrate the relation between hardness and wear rates The worn surfaces of specimens under load of 10 N are shown in Fig 9 SEM was used to determine wear mechanism Wear mechanisms (oxidation abrasion and adhesion) can be found in worn surfaces either only or combination [24] Fig 8 Scratch marks are parallel to the sliding direction and there are oxidation parts in selected areas Fig 8 present the Ni 95 + TiC 5 and Ni 80 + TiC 5 + B 15 composites It is clearly seen that located on the worn surface Wear rate is lower than other composites and partially scratch marks can be seen in the microstructure When all microstructures of composites are examined it can be concluded that Ni 80 + TiC 5 + B 15 show best wear characteristics
Fig 9 Worn surfaces and EDS analysis results of samples
M Akkas et alScience of Sintering 51(2019) 327-338 ___________________________________________________________________________
337
As a result abrasive wear is a dominant mechanism Scratch marks are generally parallel to the sliding direction Adhesion can be significantly less than abrasive for all samples It is also minimized because of the fact that the wear tests are carried out using low sliding speed 4 Conclusion In this study nanoparticle additive NiB-TiC alloys were produced by powder metallurgy method and SEM-EDS XRD microhardness density wear and corrosion results were investigated 400 MPa pressure 800 oC temperature and 2 hours in argon atmosphere were used as production parameters As a result of the studies The nanoparticle additive NiB-TiC alloys were successfully pressed and sintered As a result of XRD analysis Ni Ni2B Ni3B NiTi and NiC3B15 phases were
determined The highest hardness value was obtained in 15 B additive sample It was determined that the relative density values of the samples decreased due to the
increasing amount of B Corrosion rate is decreased for NiB-TiC composites When all microstructures of composites are examined it can be concluded that Ni 80
+ TiC 5 + B 15 show best wear characteristics 5 References
1 A Ivanović-Šašić T Novaković Z Mojović Ž Čupić D Jovanović Science of Sintering 50(3) (2018) 313
2 M Shahbazi H Cathey N Danilova I Mackinnon Materials 11(7) (2018) 1259 3 X S Xie S Q Zhao J X Dong G D Smith S J Patel In Materials Science
Forum 475 (2005) 613 4 K Wakasa M Yamaki Journal of materials science letters 10(18) (1991) 1093 5 F Li J Cheng S Zhu J Hao J Yang W Liu Materials Science and Engineering
A 682 (2017) 475 6 B Liu S Huang J Van Humbeeck J Vleugels Ceramics International 43(12)
(2017) 9512 7 M Mirak A Akbari Surface and Coatings Technology 349 (2018) 442 8 D Kır S Islak H Ccedilelik E Ccedilelik Science of Sintering 44 (2012) 235 9 W Zhang B Li International Journal of Electrochemical Science 13(4) (2018)
3486 10 R A Yildiz K Genel T Gulmez International Journal of Materials Mechanics and
Manufacturing 5(2) (2017) 83 11 S Islak Ouml Kuumlccediluumlk Ouml Eski C Oumlzorak M Akkaş Science of Sintering 49 (2017)
347 12 R Milinčić M Spasojević M Spasojević A Maričić S Randjić Science of
Sintering 48(3) (2016) 343 13 N Z Tomić M M Dimitrijević B I Međo M P Rakin R J Heinemann V J
Radojević R R Aleksić Science of Sintering 46(2) (2014) 225 14 S R Hashemi M Ardestani A Nemati Science of Sintering 48(1) (2016) 71 15 M A Korchagin D V Dudina B B Bokhonov N V Bulina A V Ukhina I S
Batraev Journal of materials science 53(19) (2018) 13592 16 M Nazarian-Samani A R Kamali R Mobarra Materials Letters 64(3) (2010) 309
M Akkas et alScience of Sintering 51(2019) 327-338 ___________________________________________________________________________
338
17 E Georgiza V Gouda P Vassiliou Surface and Coatings Technology 325 (2017) 46
18 X He R G Song D J Kong Journal of Alloys and Compounds 770 (2019) 771 19 G ASTM G102-89 ASTM International West Conshohocken USA (2004) 20 C E Campbell U R Kattner Journal of phase equilibria 20(5) (1999) 485 21 K Otsuka X Ren Progress in materials science 50(5) (2005) 511 22 H H Sheu Y C Tzeng J H Syu Materials Letters 238 (2019) 275 23 M Karbasi M R Zamanzad Ghavidel A Nekahi Materials and Corrosion 65(5)
(2014) 485 24 G J Arputhavalli S Agilan M Dinesh S J Vijay R Johnson Science of
Sintering 50(3) (2018) 337 Садржај У овом раду NiB-TiC композитни материјали су добијени металургијом праха У Ni-TiC-B смешу TiC је био фиксан са 5 док је 5 10 и 15 бора додавано у смешу Тако припремљене смеше прахова су пресоване под притиском од 400 MPa и синтеровани у атмосфери аргона на 800 oC током 2 сата Детаљно су испитани микроструктура формирање фаза тврдоћа хабање и корозиона својства SEM је коришћен за анализу микроструктуре а XRD за детекцију фаза Мерења тврдоће су рађена уз помоћ уређаја за мерење микро-тврдоће Густине узорака су одређене Архимедесовим принципом Потенционо-динамичке поларизационе криве су урађене за композите у 35 раствору NaCl ради одређивања корозионих својстава Хабање је мерено под силом од 10 N Резултати указују на то да са порастом удела бора хабање и отпорност на корозију расту Кључне речи NiB-TiC композити металургија праха синтеровање легирање корозија copy 2018 Authors Published by the International Institute for the Science of Sintering This article is an open access article distributed under the terms and conditions of the Creative Commons mdash Attribution 40 International license (httpscreativecommonsorglicensesby40)
M Akkas et alScience of Sintering 51(2019) 327-338 ___________________________________________________________________________
331
Fig 3 XRD graph of samples produced by powder metallurgy method Ni-B and Ni-Ti phase diagrams are given in Fig 4 respectively In the given phase diagrams it is clearly seen at which ratios the phases can occur Ni2B Ni3B and NiTi phases are formed in phase diagrams Ni2B Ni3B NiTi phases were formed in the samples The EDS analysis and XRD analysis results are supported in the produced samples
Fig 4 Phase diagram (a) Ni-B [13] b) Ni-Ti [14] Before corrosion and after corrosion surfaces of specimens were examined by SEM to understand corrosion mechanism (Fig 5) More homogenously corrosive surface and pitting formations in some regions can be observed for the unreinforced sample However corrosion occurred at grain boundaries for TiC-B reinforced composite It is likely that there is a galvanic corrosion between TiC-B materials and Ni Hence the Ni might be dissolved continuously and reinforcements were separated from the composite
M Akkas et alScience of Sintering 51(2019) 327-338 ___________________________________________________________________________
332
Fig 5 SEM-EDS images and analysis results of the NiB-TiC alloys produced before and after
corrosion
The potentiodynamic polarization curves of composites determined in 35 NaCl solution are shown in Fig 6 Potential was applied between -05 mV and 05 mV (with a scanning rate of 5 mVs) versus open circuit potentials (OCP) which were determined after 15 min of immersion periods The Ecorr values of the TiC and B reinforced composites shifted to anodic region This is a strong indication for degraded corrosion performance of reinforced
M Akkas et alScience of Sintering 51(2019) 327-338 ___________________________________________________________________________
333
composites Yet the relation between corrosion performance TiC and B contents of reinforced samples is not clear from the figure This is mostly because of very different potentiodynamic behavior in the cathodic and anodic portions of scanning for different TiC and B contents
Fig 6 Potentiodynamic polarization curves of composites All curves exhibit activepassive behavior The results of the corrosion measurements are summarized in Tab II Among the samples the largest corrosion potential has unreinforced Ni+TiC sample (-188 mV) The lowest corrosion potential among the other samples was measured as -347 mV for Ni+TiC+B (10 ) Among the measured corrosion current values the smallest value belongs to Ni+TiC sample (125 μAcm-2) In corrosion science the general approach to corrosion is that low corrosion current and high corrosion potential means low corrosion rate or high corrosion resistance [18 19] According to this approach it is the Ni+TiC sample which is the most resistant to corrosion among the composites Corrosion rate and corrosion resistance values in Tab II also support this approach As the amount of TiC increased the resistance of the composite to corrosion decreased The presence of the TiC and B particle in the Ni matrix caused a second passivation peak to occur In addition with the increase in the amount of TiC and B the amount of porosity increases Total and number surface of pores expands the corrosion area and reduce corrosion resistance [17-18] Therefore explicit calculation of corrosion current density (icorr) which can be applied through Tafel extrapolation to corrosion data is required Icorr values determined from extrapolations can also be used to calculate corrosion rates of the samples according to following equation [19] Corrosion Rate (mmyear)= λ Icorr(EW)d where λ=327 x 10-3(mm g)(mA cm year) is a metric conversion factor EW = Equivalent Weight d = Density (gcm3)
M Akkas et alScience of Sintering 51(2019) 327-338 ___________________________________________________________________________
334
Tab II Electrochemical results of Materials
Materials Ecorr (mV)
Icorr (microAcm-2)
Βa (mV)
Βc (mV)
Corrosion rate (mpy)
Corrosion resistance (kΩcm2)
Ni -251 666 8760 7320 1802 2793 Ni+TiC -188 125 303 1216 3393 1156
Ni+TiC+B (5 ) -254 136 3812 2286 3692 4178 Ni+TiC+B (10 ) -347 102 2016 1644 2765 1578 Ni+TiC+B (15 ) -345 4720 1489 1784 1276 3016
The results derived from individual fittings have been presented in Tab III It seems that very low concentration (Ni+TiC) of TiC leads to a large gradation increase of corrosion performance This is much clearer from the data shown in the inset of Fig 6 as one can deduce an exponentially stabilized behavior of corrosion rate with extra additions of TiC+B Therefore larger addition of TiC+B into these composites will not degrade overall corrosion performance This is important information which will be very useful in case for larger addition of TiC+B is mandatory in improving mechanical properties As a result there is a reaction between Ni and TiC+B TiC+B acts as effective anodes to accelerate corrosions So corrosion rate is decreased for NiB-TiC composites Same results are taken for TiC-B reinforced nickel composite in literature [17 18] The microhardness graph of the samples produced in Fig 7 is given Hardness measurements were taken from the sample surface along a line at 50 μm intervals The hardness of the sample with 100 Ni is about 117 HV002 The hardness value of the sample containing Ni + 5 TiC changed to 120 HV002 The hardness of the samples with 5 10 and 15 addition according to addition B is 157 171 and 188 HV002 respectively The hardness of the B doped samples is higher than the 100 Ni sample This increase is associated with the presence of carbide and hard phases formed Addition of B caused the formation of the Ni2B and Ni3B phase and consequently contributed to the increase in hardness [20 21]
Fig 7 Microhardness graph of produced samples
The change in the density values of the produced samples is given in Tab III When Tab III is examined it was determined that the relative density values of the samples decreased according to the amount of B [21 22] In addition the increase in the amount of B with decreasing density ratios of the samples are supported on the SEM images
117 120
157171
188
100120140160180200220
Ni Ni-TiC Ni-TiC-B (5)
Ni-TiC-B (10)
Ni-TiC-B (15)M
icro
hard
ness
(HV
002
)
Produced Samples
M Akkas et alScience of Sintering 51(2019) 327-338 ___________________________________________________________________________
335
Tab III Density values of samples produced
Theoretical Density (grcm3)
Experimental Density (grcm3)
Relative Density ()
Ni 89 67021 75 Ni+TiC 87015 58339 67
Ni+TiC+B (5 ) 83795 51638 61 Ni+TiC+B (10
) 80575 45401 56
Ni+TiC+B (15 ) 77355 41476 53
Wear depth values belonging to the composites under load of 10 N Wear depth values are calculated each 100 m sliding distance up to 100 m for all samples As expected wear depth is increased with applied load There is a great difference between pure nickel and Ni+TiC+B composites Wear depth decreases with the addition of B First 100 m the rise of wear depth is too much especially for Ni+TiC+B 15 under the load of 10N At the end of 100 m sliding distance Ni+TiC+B 15 composite exhibit best wear performance but there is not a significant difference compared then Ni+TiC+B 10 Modest increases can be seen after boron 010 wt Fig 7 shows the variations in coefficient of friction (COF) with loads 10 N for all composites According to the results COF decreases when applied load increases for all samples Nickel displays a lower coefficient of friction compared with other composites under load of 10N Higher weight percentage can be seen clearly for Nickel Ni+TiC and Ni+TiC+B 5 exhibit a similar trend and there is no significance change in COF Wear rates (weight loss) of samples are presented in Fig 7 TiC is apparent that wear rates are smaller at the higher boron On the other hand addition of boron and TiC on nickel improves the wear resistance Pure nickel has highest wear rates under load of 10N Ni+TiC+B 15 composite show better wear resistance and the wear rate is lower than other composites and pure nickel
Fig 8 Wear rate and friction coefficient of investigated composites
As indicated in Fig 5 Ni+TiC+B 15 has the highest hardness value The hardness of material effects the wear behavior [23] It is related in literature that softer materials have
M Akkas et alScience of Sintering 51(2019) 327-338 ___________________________________________________________________________
336
also higher wear rates than harder materials and according to the Archard wear rate is proportional with applied loads [24] The results of wear loss100 m belonging to the composites used in this study demonstrate the relation between hardness and wear rates The worn surfaces of specimens under load of 10 N are shown in Fig 9 SEM was used to determine wear mechanism Wear mechanisms (oxidation abrasion and adhesion) can be found in worn surfaces either only or combination [24] Fig 8 Scratch marks are parallel to the sliding direction and there are oxidation parts in selected areas Fig 8 present the Ni 95 + TiC 5 and Ni 80 + TiC 5 + B 15 composites It is clearly seen that located on the worn surface Wear rate is lower than other composites and partially scratch marks can be seen in the microstructure When all microstructures of composites are examined it can be concluded that Ni 80 + TiC 5 + B 15 show best wear characteristics
Fig 9 Worn surfaces and EDS analysis results of samples
M Akkas et alScience of Sintering 51(2019) 327-338 ___________________________________________________________________________
337
As a result abrasive wear is a dominant mechanism Scratch marks are generally parallel to the sliding direction Adhesion can be significantly less than abrasive for all samples It is also minimized because of the fact that the wear tests are carried out using low sliding speed 4 Conclusion In this study nanoparticle additive NiB-TiC alloys were produced by powder metallurgy method and SEM-EDS XRD microhardness density wear and corrosion results were investigated 400 MPa pressure 800 oC temperature and 2 hours in argon atmosphere were used as production parameters As a result of the studies The nanoparticle additive NiB-TiC alloys were successfully pressed and sintered As a result of XRD analysis Ni Ni2B Ni3B NiTi and NiC3B15 phases were
determined The highest hardness value was obtained in 15 B additive sample It was determined that the relative density values of the samples decreased due to the
increasing amount of B Corrosion rate is decreased for NiB-TiC composites When all microstructures of composites are examined it can be concluded that Ni 80
+ TiC 5 + B 15 show best wear characteristics 5 References
1 A Ivanović-Šašić T Novaković Z Mojović Ž Čupić D Jovanović Science of Sintering 50(3) (2018) 313
2 M Shahbazi H Cathey N Danilova I Mackinnon Materials 11(7) (2018) 1259 3 X S Xie S Q Zhao J X Dong G D Smith S J Patel In Materials Science
Forum 475 (2005) 613 4 K Wakasa M Yamaki Journal of materials science letters 10(18) (1991) 1093 5 F Li J Cheng S Zhu J Hao J Yang W Liu Materials Science and Engineering
A 682 (2017) 475 6 B Liu S Huang J Van Humbeeck J Vleugels Ceramics International 43(12)
(2017) 9512 7 M Mirak A Akbari Surface and Coatings Technology 349 (2018) 442 8 D Kır S Islak H Ccedilelik E Ccedilelik Science of Sintering 44 (2012) 235 9 W Zhang B Li International Journal of Electrochemical Science 13(4) (2018)
3486 10 R A Yildiz K Genel T Gulmez International Journal of Materials Mechanics and
Manufacturing 5(2) (2017) 83 11 S Islak Ouml Kuumlccediluumlk Ouml Eski C Oumlzorak M Akkaş Science of Sintering 49 (2017)
347 12 R Milinčić M Spasojević M Spasojević A Maričić S Randjić Science of
Sintering 48(3) (2016) 343 13 N Z Tomić M M Dimitrijević B I Međo M P Rakin R J Heinemann V J
Radojević R R Aleksić Science of Sintering 46(2) (2014) 225 14 S R Hashemi M Ardestani A Nemati Science of Sintering 48(1) (2016) 71 15 M A Korchagin D V Dudina B B Bokhonov N V Bulina A V Ukhina I S
Batraev Journal of materials science 53(19) (2018) 13592 16 M Nazarian-Samani A R Kamali R Mobarra Materials Letters 64(3) (2010) 309
M Akkas et alScience of Sintering 51(2019) 327-338 ___________________________________________________________________________
338
17 E Georgiza V Gouda P Vassiliou Surface and Coatings Technology 325 (2017) 46
18 X He R G Song D J Kong Journal of Alloys and Compounds 770 (2019) 771 19 G ASTM G102-89 ASTM International West Conshohocken USA (2004) 20 C E Campbell U R Kattner Journal of phase equilibria 20(5) (1999) 485 21 K Otsuka X Ren Progress in materials science 50(5) (2005) 511 22 H H Sheu Y C Tzeng J H Syu Materials Letters 238 (2019) 275 23 M Karbasi M R Zamanzad Ghavidel A Nekahi Materials and Corrosion 65(5)
(2014) 485 24 G J Arputhavalli S Agilan M Dinesh S J Vijay R Johnson Science of
Sintering 50(3) (2018) 337 Садржај У овом раду NiB-TiC композитни материјали су добијени металургијом праха У Ni-TiC-B смешу TiC је био фиксан са 5 док је 5 10 и 15 бора додавано у смешу Тако припремљене смеше прахова су пресоване под притиском од 400 MPa и синтеровани у атмосфери аргона на 800 oC током 2 сата Детаљно су испитани микроструктура формирање фаза тврдоћа хабање и корозиона својства SEM је коришћен за анализу микроструктуре а XRD за детекцију фаза Мерења тврдоће су рађена уз помоћ уређаја за мерење микро-тврдоће Густине узорака су одређене Архимедесовим принципом Потенционо-динамичке поларизационе криве су урађене за композите у 35 раствору NaCl ради одређивања корозионих својстава Хабање је мерено под силом од 10 N Резултати указују на то да са порастом удела бора хабање и отпорност на корозију расту Кључне речи NiB-TiC композити металургија праха синтеровање легирање корозија copy 2018 Authors Published by the International Institute for the Science of Sintering This article is an open access article distributed under the terms and conditions of the Creative Commons mdash Attribution 40 International license (httpscreativecommonsorglicensesby40)
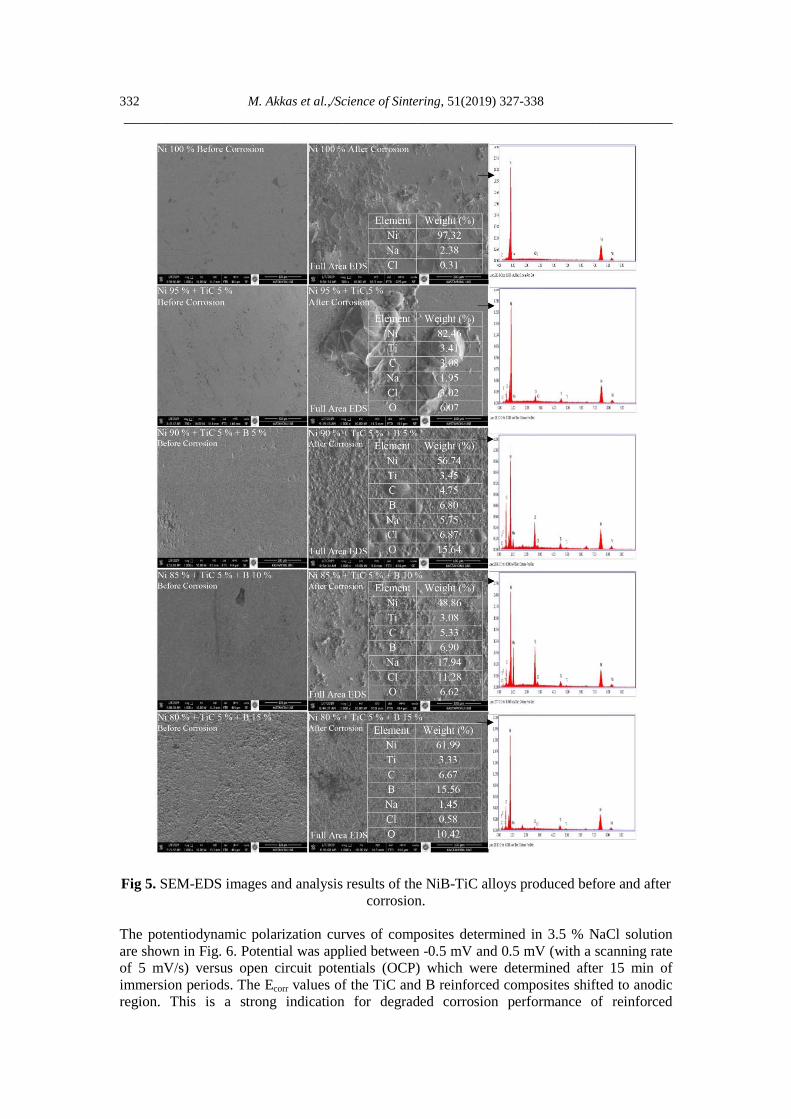
M Akkas et alScience of Sintering 51(2019) 327-338 ___________________________________________________________________________
332
Fig 5 SEM-EDS images and analysis results of the NiB-TiC alloys produced before and after
corrosion
The potentiodynamic polarization curves of composites determined in 35 NaCl solution are shown in Fig 6 Potential was applied between -05 mV and 05 mV (with a scanning rate of 5 mVs) versus open circuit potentials (OCP) which were determined after 15 min of immersion periods The Ecorr values of the TiC and B reinforced composites shifted to anodic region This is a strong indication for degraded corrosion performance of reinforced
M Akkas et alScience of Sintering 51(2019) 327-338 ___________________________________________________________________________
333
composites Yet the relation between corrosion performance TiC and B contents of reinforced samples is not clear from the figure This is mostly because of very different potentiodynamic behavior in the cathodic and anodic portions of scanning for different TiC and B contents
Fig 6 Potentiodynamic polarization curves of composites All curves exhibit activepassive behavior The results of the corrosion measurements are summarized in Tab II Among the samples the largest corrosion potential has unreinforced Ni+TiC sample (-188 mV) The lowest corrosion potential among the other samples was measured as -347 mV for Ni+TiC+B (10 ) Among the measured corrosion current values the smallest value belongs to Ni+TiC sample (125 μAcm-2) In corrosion science the general approach to corrosion is that low corrosion current and high corrosion potential means low corrosion rate or high corrosion resistance [18 19] According to this approach it is the Ni+TiC sample which is the most resistant to corrosion among the composites Corrosion rate and corrosion resistance values in Tab II also support this approach As the amount of TiC increased the resistance of the composite to corrosion decreased The presence of the TiC and B particle in the Ni matrix caused a second passivation peak to occur In addition with the increase in the amount of TiC and B the amount of porosity increases Total and number surface of pores expands the corrosion area and reduce corrosion resistance [17-18] Therefore explicit calculation of corrosion current density (icorr) which can be applied through Tafel extrapolation to corrosion data is required Icorr values determined from extrapolations can also be used to calculate corrosion rates of the samples according to following equation [19] Corrosion Rate (mmyear)= λ Icorr(EW)d where λ=327 x 10-3(mm g)(mA cm year) is a metric conversion factor EW = Equivalent Weight d = Density (gcm3)
M Akkas et alScience of Sintering 51(2019) 327-338 ___________________________________________________________________________
334
Tab II Electrochemical results of Materials
Materials Ecorr (mV)
Icorr (microAcm-2)
Βa (mV)
Βc (mV)
Corrosion rate (mpy)
Corrosion resistance (kΩcm2)
Ni -251 666 8760 7320 1802 2793 Ni+TiC -188 125 303 1216 3393 1156
Ni+TiC+B (5 ) -254 136 3812 2286 3692 4178 Ni+TiC+B (10 ) -347 102 2016 1644 2765 1578 Ni+TiC+B (15 ) -345 4720 1489 1784 1276 3016
The results derived from individual fittings have been presented in Tab III It seems that very low concentration (Ni+TiC) of TiC leads to a large gradation increase of corrosion performance This is much clearer from the data shown in the inset of Fig 6 as one can deduce an exponentially stabilized behavior of corrosion rate with extra additions of TiC+B Therefore larger addition of TiC+B into these composites will not degrade overall corrosion performance This is important information which will be very useful in case for larger addition of TiC+B is mandatory in improving mechanical properties As a result there is a reaction between Ni and TiC+B TiC+B acts as effective anodes to accelerate corrosions So corrosion rate is decreased for NiB-TiC composites Same results are taken for TiC-B reinforced nickel composite in literature [17 18] The microhardness graph of the samples produced in Fig 7 is given Hardness measurements were taken from the sample surface along a line at 50 μm intervals The hardness of the sample with 100 Ni is about 117 HV002 The hardness value of the sample containing Ni + 5 TiC changed to 120 HV002 The hardness of the samples with 5 10 and 15 addition according to addition B is 157 171 and 188 HV002 respectively The hardness of the B doped samples is higher than the 100 Ni sample This increase is associated with the presence of carbide and hard phases formed Addition of B caused the formation of the Ni2B and Ni3B phase and consequently contributed to the increase in hardness [20 21]
Fig 7 Microhardness graph of produced samples
The change in the density values of the produced samples is given in Tab III When Tab III is examined it was determined that the relative density values of the samples decreased according to the amount of B [21 22] In addition the increase in the amount of B with decreasing density ratios of the samples are supported on the SEM images
117 120
157171
188
100120140160180200220
Ni Ni-TiC Ni-TiC-B (5)
Ni-TiC-B (10)
Ni-TiC-B (15)M
icro
hard
ness
(HV
002
)
Produced Samples
M Akkas et alScience of Sintering 51(2019) 327-338 ___________________________________________________________________________
335
Tab III Density values of samples produced
Theoretical Density (grcm3)
Experimental Density (grcm3)
Relative Density ()
Ni 89 67021 75 Ni+TiC 87015 58339 67
Ni+TiC+B (5 ) 83795 51638 61 Ni+TiC+B (10
) 80575 45401 56
Ni+TiC+B (15 ) 77355 41476 53
Wear depth values belonging to the composites under load of 10 N Wear depth values are calculated each 100 m sliding distance up to 100 m for all samples As expected wear depth is increased with applied load There is a great difference between pure nickel and Ni+TiC+B composites Wear depth decreases with the addition of B First 100 m the rise of wear depth is too much especially for Ni+TiC+B 15 under the load of 10N At the end of 100 m sliding distance Ni+TiC+B 15 composite exhibit best wear performance but there is not a significant difference compared then Ni+TiC+B 10 Modest increases can be seen after boron 010 wt Fig 7 shows the variations in coefficient of friction (COF) with loads 10 N for all composites According to the results COF decreases when applied load increases for all samples Nickel displays a lower coefficient of friction compared with other composites under load of 10N Higher weight percentage can be seen clearly for Nickel Ni+TiC and Ni+TiC+B 5 exhibit a similar trend and there is no significance change in COF Wear rates (weight loss) of samples are presented in Fig 7 TiC is apparent that wear rates are smaller at the higher boron On the other hand addition of boron and TiC on nickel improves the wear resistance Pure nickel has highest wear rates under load of 10N Ni+TiC+B 15 composite show better wear resistance and the wear rate is lower than other composites and pure nickel
Fig 8 Wear rate and friction coefficient of investigated composites
As indicated in Fig 5 Ni+TiC+B 15 has the highest hardness value The hardness of material effects the wear behavior [23] It is related in literature that softer materials have
M Akkas et alScience of Sintering 51(2019) 327-338 ___________________________________________________________________________
336
also higher wear rates than harder materials and according to the Archard wear rate is proportional with applied loads [24] The results of wear loss100 m belonging to the composites used in this study demonstrate the relation between hardness and wear rates The worn surfaces of specimens under load of 10 N are shown in Fig 9 SEM was used to determine wear mechanism Wear mechanisms (oxidation abrasion and adhesion) can be found in worn surfaces either only or combination [24] Fig 8 Scratch marks are parallel to the sliding direction and there are oxidation parts in selected areas Fig 8 present the Ni 95 + TiC 5 and Ni 80 + TiC 5 + B 15 composites It is clearly seen that located on the worn surface Wear rate is lower than other composites and partially scratch marks can be seen in the microstructure When all microstructures of composites are examined it can be concluded that Ni 80 + TiC 5 + B 15 show best wear characteristics
Fig 9 Worn surfaces and EDS analysis results of samples
M Akkas et alScience of Sintering 51(2019) 327-338 ___________________________________________________________________________
337
As a result abrasive wear is a dominant mechanism Scratch marks are generally parallel to the sliding direction Adhesion can be significantly less than abrasive for all samples It is also minimized because of the fact that the wear tests are carried out using low sliding speed 4 Conclusion In this study nanoparticle additive NiB-TiC alloys were produced by powder metallurgy method and SEM-EDS XRD microhardness density wear and corrosion results were investigated 400 MPa pressure 800 oC temperature and 2 hours in argon atmosphere were used as production parameters As a result of the studies The nanoparticle additive NiB-TiC alloys were successfully pressed and sintered As a result of XRD analysis Ni Ni2B Ni3B NiTi and NiC3B15 phases were
determined The highest hardness value was obtained in 15 B additive sample It was determined that the relative density values of the samples decreased due to the
increasing amount of B Corrosion rate is decreased for NiB-TiC composites When all microstructures of composites are examined it can be concluded that Ni 80
+ TiC 5 + B 15 show best wear characteristics 5 References
1 A Ivanović-Šašić T Novaković Z Mojović Ž Čupić D Jovanović Science of Sintering 50(3) (2018) 313
2 M Shahbazi H Cathey N Danilova I Mackinnon Materials 11(7) (2018) 1259 3 X S Xie S Q Zhao J X Dong G D Smith S J Patel In Materials Science
Forum 475 (2005) 613 4 K Wakasa M Yamaki Journal of materials science letters 10(18) (1991) 1093 5 F Li J Cheng S Zhu J Hao J Yang W Liu Materials Science and Engineering
A 682 (2017) 475 6 B Liu S Huang J Van Humbeeck J Vleugels Ceramics International 43(12)
(2017) 9512 7 M Mirak A Akbari Surface and Coatings Technology 349 (2018) 442 8 D Kır S Islak H Ccedilelik E Ccedilelik Science of Sintering 44 (2012) 235 9 W Zhang B Li International Journal of Electrochemical Science 13(4) (2018)
3486 10 R A Yildiz K Genel T Gulmez International Journal of Materials Mechanics and
Manufacturing 5(2) (2017) 83 11 S Islak Ouml Kuumlccediluumlk Ouml Eski C Oumlzorak M Akkaş Science of Sintering 49 (2017)
347 12 R Milinčić M Spasojević M Spasojević A Maričić S Randjić Science of
Sintering 48(3) (2016) 343 13 N Z Tomić M M Dimitrijević B I Međo M P Rakin R J Heinemann V J
Radojević R R Aleksić Science of Sintering 46(2) (2014) 225 14 S R Hashemi M Ardestani A Nemati Science of Sintering 48(1) (2016) 71 15 M A Korchagin D V Dudina B B Bokhonov N V Bulina A V Ukhina I S
Batraev Journal of materials science 53(19) (2018) 13592 16 M Nazarian-Samani A R Kamali R Mobarra Materials Letters 64(3) (2010) 309
M Akkas et alScience of Sintering 51(2019) 327-338 ___________________________________________________________________________
338
17 E Georgiza V Gouda P Vassiliou Surface and Coatings Technology 325 (2017) 46
18 X He R G Song D J Kong Journal of Alloys and Compounds 770 (2019) 771 19 G ASTM G102-89 ASTM International West Conshohocken USA (2004) 20 C E Campbell U R Kattner Journal of phase equilibria 20(5) (1999) 485 21 K Otsuka X Ren Progress in materials science 50(5) (2005) 511 22 H H Sheu Y C Tzeng J H Syu Materials Letters 238 (2019) 275 23 M Karbasi M R Zamanzad Ghavidel A Nekahi Materials and Corrosion 65(5)
(2014) 485 24 G J Arputhavalli S Agilan M Dinesh S J Vijay R Johnson Science of
Sintering 50(3) (2018) 337 Садржај У овом раду NiB-TiC композитни материјали су добијени металургијом праха У Ni-TiC-B смешу TiC је био фиксан са 5 док је 5 10 и 15 бора додавано у смешу Тако припремљене смеше прахова су пресоване под притиском од 400 MPa и синтеровани у атмосфери аргона на 800 oC током 2 сата Детаљно су испитани микроструктура формирање фаза тврдоћа хабање и корозиона својства SEM је коришћен за анализу микроструктуре а XRD за детекцију фаза Мерења тврдоће су рађена уз помоћ уређаја за мерење микро-тврдоће Густине узорака су одређене Архимедесовим принципом Потенционо-динамичке поларизационе криве су урађене за композите у 35 раствору NaCl ради одређивања корозионих својстава Хабање је мерено под силом од 10 N Резултати указују на то да са порастом удела бора хабање и отпорност на корозију расту Кључне речи NiB-TiC композити металургија праха синтеровање легирање корозија copy 2018 Authors Published by the International Institute for the Science of Sintering This article is an open access article distributed under the terms and conditions of the Creative Commons mdash Attribution 40 International license (httpscreativecommonsorglicensesby40)
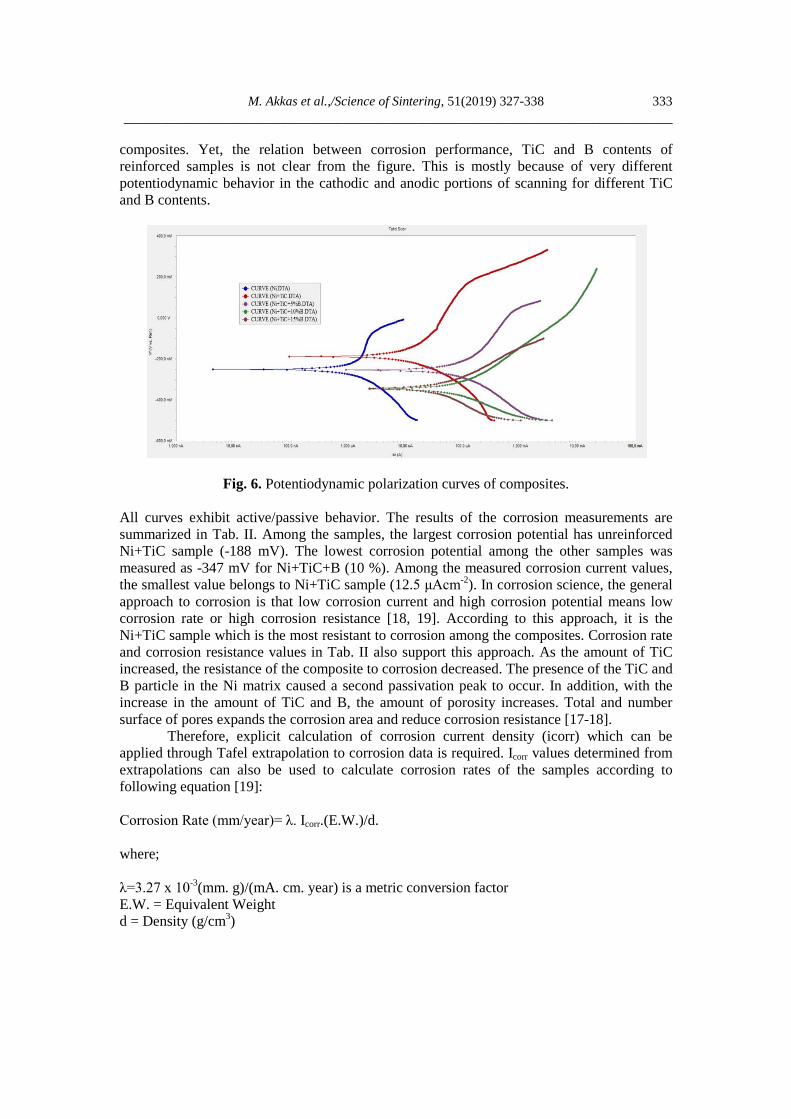
M Akkas et alScience of Sintering 51(2019) 327-338 ___________________________________________________________________________
333
composites Yet the relation between corrosion performance TiC and B contents of reinforced samples is not clear from the figure This is mostly because of very different potentiodynamic behavior in the cathodic and anodic portions of scanning for different TiC and B contents
Fig 6 Potentiodynamic polarization curves of composites All curves exhibit activepassive behavior The results of the corrosion measurements are summarized in Tab II Among the samples the largest corrosion potential has unreinforced Ni+TiC sample (-188 mV) The lowest corrosion potential among the other samples was measured as -347 mV for Ni+TiC+B (10 ) Among the measured corrosion current values the smallest value belongs to Ni+TiC sample (125 μAcm-2) In corrosion science the general approach to corrosion is that low corrosion current and high corrosion potential means low corrosion rate or high corrosion resistance [18 19] According to this approach it is the Ni+TiC sample which is the most resistant to corrosion among the composites Corrosion rate and corrosion resistance values in Tab II also support this approach As the amount of TiC increased the resistance of the composite to corrosion decreased The presence of the TiC and B particle in the Ni matrix caused a second passivation peak to occur In addition with the increase in the amount of TiC and B the amount of porosity increases Total and number surface of pores expands the corrosion area and reduce corrosion resistance [17-18] Therefore explicit calculation of corrosion current density (icorr) which can be applied through Tafel extrapolation to corrosion data is required Icorr values determined from extrapolations can also be used to calculate corrosion rates of the samples according to following equation [19] Corrosion Rate (mmyear)= λ Icorr(EW)d where λ=327 x 10-3(mm g)(mA cm year) is a metric conversion factor EW = Equivalent Weight d = Density (gcm3)
M Akkas et alScience of Sintering 51(2019) 327-338 ___________________________________________________________________________
334
Tab II Electrochemical results of Materials
Materials Ecorr (mV)
Icorr (microAcm-2)
Βa (mV)
Βc (mV)
Corrosion rate (mpy)
Corrosion resistance (kΩcm2)
Ni -251 666 8760 7320 1802 2793 Ni+TiC -188 125 303 1216 3393 1156
Ni+TiC+B (5 ) -254 136 3812 2286 3692 4178 Ni+TiC+B (10 ) -347 102 2016 1644 2765 1578 Ni+TiC+B (15 ) -345 4720 1489 1784 1276 3016
The results derived from individual fittings have been presented in Tab III It seems that very low concentration (Ni+TiC) of TiC leads to a large gradation increase of corrosion performance This is much clearer from the data shown in the inset of Fig 6 as one can deduce an exponentially stabilized behavior of corrosion rate with extra additions of TiC+B Therefore larger addition of TiC+B into these composites will not degrade overall corrosion performance This is important information which will be very useful in case for larger addition of TiC+B is mandatory in improving mechanical properties As a result there is a reaction between Ni and TiC+B TiC+B acts as effective anodes to accelerate corrosions So corrosion rate is decreased for NiB-TiC composites Same results are taken for TiC-B reinforced nickel composite in literature [17 18] The microhardness graph of the samples produced in Fig 7 is given Hardness measurements were taken from the sample surface along a line at 50 μm intervals The hardness of the sample with 100 Ni is about 117 HV002 The hardness value of the sample containing Ni + 5 TiC changed to 120 HV002 The hardness of the samples with 5 10 and 15 addition according to addition B is 157 171 and 188 HV002 respectively The hardness of the B doped samples is higher than the 100 Ni sample This increase is associated with the presence of carbide and hard phases formed Addition of B caused the formation of the Ni2B and Ni3B phase and consequently contributed to the increase in hardness [20 21]
Fig 7 Microhardness graph of produced samples
The change in the density values of the produced samples is given in Tab III When Tab III is examined it was determined that the relative density values of the samples decreased according to the amount of B [21 22] In addition the increase in the amount of B with decreasing density ratios of the samples are supported on the SEM images
117 120
157171
188
100120140160180200220
Ni Ni-TiC Ni-TiC-B (5)
Ni-TiC-B (10)
Ni-TiC-B (15)M
icro
hard
ness
(HV
002
)
Produced Samples
M Akkas et alScience of Sintering 51(2019) 327-338 ___________________________________________________________________________
335
Tab III Density values of samples produced
Theoretical Density (grcm3)
Experimental Density (grcm3)
Relative Density ()
Ni 89 67021 75 Ni+TiC 87015 58339 67
Ni+TiC+B (5 ) 83795 51638 61 Ni+TiC+B (10
) 80575 45401 56
Ni+TiC+B (15 ) 77355 41476 53
Wear depth values belonging to the composites under load of 10 N Wear depth values are calculated each 100 m sliding distance up to 100 m for all samples As expected wear depth is increased with applied load There is a great difference between pure nickel and Ni+TiC+B composites Wear depth decreases with the addition of B First 100 m the rise of wear depth is too much especially for Ni+TiC+B 15 under the load of 10N At the end of 100 m sliding distance Ni+TiC+B 15 composite exhibit best wear performance but there is not a significant difference compared then Ni+TiC+B 10 Modest increases can be seen after boron 010 wt Fig 7 shows the variations in coefficient of friction (COF) with loads 10 N for all composites According to the results COF decreases when applied load increases for all samples Nickel displays a lower coefficient of friction compared with other composites under load of 10N Higher weight percentage can be seen clearly for Nickel Ni+TiC and Ni+TiC+B 5 exhibit a similar trend and there is no significance change in COF Wear rates (weight loss) of samples are presented in Fig 7 TiC is apparent that wear rates are smaller at the higher boron On the other hand addition of boron and TiC on nickel improves the wear resistance Pure nickel has highest wear rates under load of 10N Ni+TiC+B 15 composite show better wear resistance and the wear rate is lower than other composites and pure nickel
Fig 8 Wear rate and friction coefficient of investigated composites
As indicated in Fig 5 Ni+TiC+B 15 has the highest hardness value The hardness of material effects the wear behavior [23] It is related in literature that softer materials have
M Akkas et alScience of Sintering 51(2019) 327-338 ___________________________________________________________________________
336
also higher wear rates than harder materials and according to the Archard wear rate is proportional with applied loads [24] The results of wear loss100 m belonging to the composites used in this study demonstrate the relation between hardness and wear rates The worn surfaces of specimens under load of 10 N are shown in Fig 9 SEM was used to determine wear mechanism Wear mechanisms (oxidation abrasion and adhesion) can be found in worn surfaces either only or combination [24] Fig 8 Scratch marks are parallel to the sliding direction and there are oxidation parts in selected areas Fig 8 present the Ni 95 + TiC 5 and Ni 80 + TiC 5 + B 15 composites It is clearly seen that located on the worn surface Wear rate is lower than other composites and partially scratch marks can be seen in the microstructure When all microstructures of composites are examined it can be concluded that Ni 80 + TiC 5 + B 15 show best wear characteristics
Fig 9 Worn surfaces and EDS analysis results of samples
M Akkas et alScience of Sintering 51(2019) 327-338 ___________________________________________________________________________
337
As a result abrasive wear is a dominant mechanism Scratch marks are generally parallel to the sliding direction Adhesion can be significantly less than abrasive for all samples It is also minimized because of the fact that the wear tests are carried out using low sliding speed 4 Conclusion In this study nanoparticle additive NiB-TiC alloys were produced by powder metallurgy method and SEM-EDS XRD microhardness density wear and corrosion results were investigated 400 MPa pressure 800 oC temperature and 2 hours in argon atmosphere were used as production parameters As a result of the studies The nanoparticle additive NiB-TiC alloys were successfully pressed and sintered As a result of XRD analysis Ni Ni2B Ni3B NiTi and NiC3B15 phases were
determined The highest hardness value was obtained in 15 B additive sample It was determined that the relative density values of the samples decreased due to the
increasing amount of B Corrosion rate is decreased for NiB-TiC composites When all microstructures of composites are examined it can be concluded that Ni 80
+ TiC 5 + B 15 show best wear characteristics 5 References
1 A Ivanović-Šašić T Novaković Z Mojović Ž Čupić D Jovanović Science of Sintering 50(3) (2018) 313
2 M Shahbazi H Cathey N Danilova I Mackinnon Materials 11(7) (2018) 1259 3 X S Xie S Q Zhao J X Dong G D Smith S J Patel In Materials Science
Forum 475 (2005) 613 4 K Wakasa M Yamaki Journal of materials science letters 10(18) (1991) 1093 5 F Li J Cheng S Zhu J Hao J Yang W Liu Materials Science and Engineering
A 682 (2017) 475 6 B Liu S Huang J Van Humbeeck J Vleugels Ceramics International 43(12)
(2017) 9512 7 M Mirak A Akbari Surface and Coatings Technology 349 (2018) 442 8 D Kır S Islak H Ccedilelik E Ccedilelik Science of Sintering 44 (2012) 235 9 W Zhang B Li International Journal of Electrochemical Science 13(4) (2018)
3486 10 R A Yildiz K Genel T Gulmez International Journal of Materials Mechanics and
Manufacturing 5(2) (2017) 83 11 S Islak Ouml Kuumlccediluumlk Ouml Eski C Oumlzorak M Akkaş Science of Sintering 49 (2017)
347 12 R Milinčić M Spasojević M Spasojević A Maričić S Randjić Science of
Sintering 48(3) (2016) 343 13 N Z Tomić M M Dimitrijević B I Međo M P Rakin R J Heinemann V J
Radojević R R Aleksić Science of Sintering 46(2) (2014) 225 14 S R Hashemi M Ardestani A Nemati Science of Sintering 48(1) (2016) 71 15 M A Korchagin D V Dudina B B Bokhonov N V Bulina A V Ukhina I S
Batraev Journal of materials science 53(19) (2018) 13592 16 M Nazarian-Samani A R Kamali R Mobarra Materials Letters 64(3) (2010) 309
M Akkas et alScience of Sintering 51(2019) 327-338 ___________________________________________________________________________
338
17 E Georgiza V Gouda P Vassiliou Surface and Coatings Technology 325 (2017) 46
18 X He R G Song D J Kong Journal of Alloys and Compounds 770 (2019) 771 19 G ASTM G102-89 ASTM International West Conshohocken USA (2004) 20 C E Campbell U R Kattner Journal of phase equilibria 20(5) (1999) 485 21 K Otsuka X Ren Progress in materials science 50(5) (2005) 511 22 H H Sheu Y C Tzeng J H Syu Materials Letters 238 (2019) 275 23 M Karbasi M R Zamanzad Ghavidel A Nekahi Materials and Corrosion 65(5)
(2014) 485 24 G J Arputhavalli S Agilan M Dinesh S J Vijay R Johnson Science of
Sintering 50(3) (2018) 337 Садржај У овом раду NiB-TiC композитни материјали су добијени металургијом праха У Ni-TiC-B смешу TiC је био фиксан са 5 док је 5 10 и 15 бора додавано у смешу Тако припремљене смеше прахова су пресоване под притиском од 400 MPa и синтеровани у атмосфери аргона на 800 oC током 2 сата Детаљно су испитани микроструктура формирање фаза тврдоћа хабање и корозиона својства SEM је коришћен за анализу микроструктуре а XRD за детекцију фаза Мерења тврдоће су рађена уз помоћ уређаја за мерење микро-тврдоће Густине узорака су одређене Архимедесовим принципом Потенционо-динамичке поларизационе криве су урађене за композите у 35 раствору NaCl ради одређивања корозионих својстава Хабање је мерено под силом од 10 N Резултати указују на то да са порастом удела бора хабање и отпорност на корозију расту Кључне речи NiB-TiC композити металургија праха синтеровање легирање корозија copy 2018 Authors Published by the International Institute for the Science of Sintering This article is an open access article distributed under the terms and conditions of the Creative Commons mdash Attribution 40 International license (httpscreativecommonsorglicensesby40)
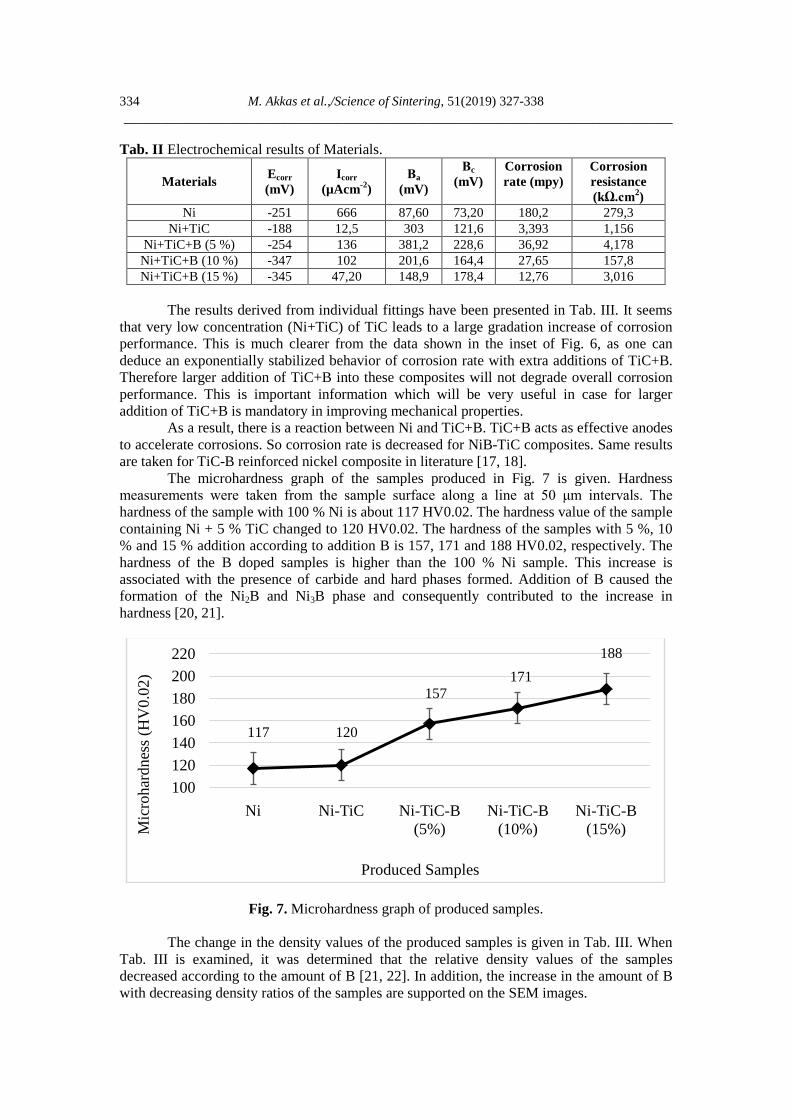
M Akkas et alScience of Sintering 51(2019) 327-338 ___________________________________________________________________________
334
Tab II Electrochemical results of Materials
Materials Ecorr (mV)
Icorr (microAcm-2)
Βa (mV)
Βc (mV)
Corrosion rate (mpy)
Corrosion resistance (kΩcm2)
Ni -251 666 8760 7320 1802 2793 Ni+TiC -188 125 303 1216 3393 1156
Ni+TiC+B (5 ) -254 136 3812 2286 3692 4178 Ni+TiC+B (10 ) -347 102 2016 1644 2765 1578 Ni+TiC+B (15 ) -345 4720 1489 1784 1276 3016
The results derived from individual fittings have been presented in Tab III It seems that very low concentration (Ni+TiC) of TiC leads to a large gradation increase of corrosion performance This is much clearer from the data shown in the inset of Fig 6 as one can deduce an exponentially stabilized behavior of corrosion rate with extra additions of TiC+B Therefore larger addition of TiC+B into these composites will not degrade overall corrosion performance This is important information which will be very useful in case for larger addition of TiC+B is mandatory in improving mechanical properties As a result there is a reaction between Ni and TiC+B TiC+B acts as effective anodes to accelerate corrosions So corrosion rate is decreased for NiB-TiC composites Same results are taken for TiC-B reinforced nickel composite in literature [17 18] The microhardness graph of the samples produced in Fig 7 is given Hardness measurements were taken from the sample surface along a line at 50 μm intervals The hardness of the sample with 100 Ni is about 117 HV002 The hardness value of the sample containing Ni + 5 TiC changed to 120 HV002 The hardness of the samples with 5 10 and 15 addition according to addition B is 157 171 and 188 HV002 respectively The hardness of the B doped samples is higher than the 100 Ni sample This increase is associated with the presence of carbide and hard phases formed Addition of B caused the formation of the Ni2B and Ni3B phase and consequently contributed to the increase in hardness [20 21]
Fig 7 Microhardness graph of produced samples
The change in the density values of the produced samples is given in Tab III When Tab III is examined it was determined that the relative density values of the samples decreased according to the amount of B [21 22] In addition the increase in the amount of B with decreasing density ratios of the samples are supported on the SEM images
117 120
157171
188
100120140160180200220
Ni Ni-TiC Ni-TiC-B (5)
Ni-TiC-B (10)
Ni-TiC-B (15)M
icro
hard
ness
(HV
002
)
Produced Samples
M Akkas et alScience of Sintering 51(2019) 327-338 ___________________________________________________________________________
335
Tab III Density values of samples produced
Theoretical Density (grcm3)
Experimental Density (grcm3)
Relative Density ()
Ni 89 67021 75 Ni+TiC 87015 58339 67
Ni+TiC+B (5 ) 83795 51638 61 Ni+TiC+B (10
) 80575 45401 56
Ni+TiC+B (15 ) 77355 41476 53
Wear depth values belonging to the composites under load of 10 N Wear depth values are calculated each 100 m sliding distance up to 100 m for all samples As expected wear depth is increased with applied load There is a great difference between pure nickel and Ni+TiC+B composites Wear depth decreases with the addition of B First 100 m the rise of wear depth is too much especially for Ni+TiC+B 15 under the load of 10N At the end of 100 m sliding distance Ni+TiC+B 15 composite exhibit best wear performance but there is not a significant difference compared then Ni+TiC+B 10 Modest increases can be seen after boron 010 wt Fig 7 shows the variations in coefficient of friction (COF) with loads 10 N for all composites According to the results COF decreases when applied load increases for all samples Nickel displays a lower coefficient of friction compared with other composites under load of 10N Higher weight percentage can be seen clearly for Nickel Ni+TiC and Ni+TiC+B 5 exhibit a similar trend and there is no significance change in COF Wear rates (weight loss) of samples are presented in Fig 7 TiC is apparent that wear rates are smaller at the higher boron On the other hand addition of boron and TiC on nickel improves the wear resistance Pure nickel has highest wear rates under load of 10N Ni+TiC+B 15 composite show better wear resistance and the wear rate is lower than other composites and pure nickel
Fig 8 Wear rate and friction coefficient of investigated composites
As indicated in Fig 5 Ni+TiC+B 15 has the highest hardness value The hardness of material effects the wear behavior [23] It is related in literature that softer materials have
M Akkas et alScience of Sintering 51(2019) 327-338 ___________________________________________________________________________
336
also higher wear rates than harder materials and according to the Archard wear rate is proportional with applied loads [24] The results of wear loss100 m belonging to the composites used in this study demonstrate the relation between hardness and wear rates The worn surfaces of specimens under load of 10 N are shown in Fig 9 SEM was used to determine wear mechanism Wear mechanisms (oxidation abrasion and adhesion) can be found in worn surfaces either only or combination [24] Fig 8 Scratch marks are parallel to the sliding direction and there are oxidation parts in selected areas Fig 8 present the Ni 95 + TiC 5 and Ni 80 + TiC 5 + B 15 composites It is clearly seen that located on the worn surface Wear rate is lower than other composites and partially scratch marks can be seen in the microstructure When all microstructures of composites are examined it can be concluded that Ni 80 + TiC 5 + B 15 show best wear characteristics
Fig 9 Worn surfaces and EDS analysis results of samples
M Akkas et alScience of Sintering 51(2019) 327-338 ___________________________________________________________________________
337
As a result abrasive wear is a dominant mechanism Scratch marks are generally parallel to the sliding direction Adhesion can be significantly less than abrasive for all samples It is also minimized because of the fact that the wear tests are carried out using low sliding speed 4 Conclusion In this study nanoparticle additive NiB-TiC alloys were produced by powder metallurgy method and SEM-EDS XRD microhardness density wear and corrosion results were investigated 400 MPa pressure 800 oC temperature and 2 hours in argon atmosphere were used as production parameters As a result of the studies The nanoparticle additive NiB-TiC alloys were successfully pressed and sintered As a result of XRD analysis Ni Ni2B Ni3B NiTi and NiC3B15 phases were
determined The highest hardness value was obtained in 15 B additive sample It was determined that the relative density values of the samples decreased due to the
increasing amount of B Corrosion rate is decreased for NiB-TiC composites When all microstructures of composites are examined it can be concluded that Ni 80
+ TiC 5 + B 15 show best wear characteristics 5 References
1 A Ivanović-Šašić T Novaković Z Mojović Ž Čupić D Jovanović Science of Sintering 50(3) (2018) 313
2 M Shahbazi H Cathey N Danilova I Mackinnon Materials 11(7) (2018) 1259 3 X S Xie S Q Zhao J X Dong G D Smith S J Patel In Materials Science
Forum 475 (2005) 613 4 K Wakasa M Yamaki Journal of materials science letters 10(18) (1991) 1093 5 F Li J Cheng S Zhu J Hao J Yang W Liu Materials Science and Engineering
A 682 (2017) 475 6 B Liu S Huang J Van Humbeeck J Vleugels Ceramics International 43(12)
(2017) 9512 7 M Mirak A Akbari Surface and Coatings Technology 349 (2018) 442 8 D Kır S Islak H Ccedilelik E Ccedilelik Science of Sintering 44 (2012) 235 9 W Zhang B Li International Journal of Electrochemical Science 13(4) (2018)
3486 10 R A Yildiz K Genel T Gulmez International Journal of Materials Mechanics and
Manufacturing 5(2) (2017) 83 11 S Islak Ouml Kuumlccediluumlk Ouml Eski C Oumlzorak M Akkaş Science of Sintering 49 (2017)
347 12 R Milinčić M Spasojević M Spasojević A Maričić S Randjić Science of
Sintering 48(3) (2016) 343 13 N Z Tomić M M Dimitrijević B I Međo M P Rakin R J Heinemann V J
Radojević R R Aleksić Science of Sintering 46(2) (2014) 225 14 S R Hashemi M Ardestani A Nemati Science of Sintering 48(1) (2016) 71 15 M A Korchagin D V Dudina B B Bokhonov N V Bulina A V Ukhina I S
Batraev Journal of materials science 53(19) (2018) 13592 16 M Nazarian-Samani A R Kamali R Mobarra Materials Letters 64(3) (2010) 309
M Akkas et alScience of Sintering 51(2019) 327-338 ___________________________________________________________________________
338
17 E Georgiza V Gouda P Vassiliou Surface and Coatings Technology 325 (2017) 46
18 X He R G Song D J Kong Journal of Alloys and Compounds 770 (2019) 771 19 G ASTM G102-89 ASTM International West Conshohocken USA (2004) 20 C E Campbell U R Kattner Journal of phase equilibria 20(5) (1999) 485 21 K Otsuka X Ren Progress in materials science 50(5) (2005) 511 22 H H Sheu Y C Tzeng J H Syu Materials Letters 238 (2019) 275 23 M Karbasi M R Zamanzad Ghavidel A Nekahi Materials and Corrosion 65(5)
(2014) 485 24 G J Arputhavalli S Agilan M Dinesh S J Vijay R Johnson Science of
Sintering 50(3) (2018) 337 Садржај У овом раду NiB-TiC композитни материјали су добијени металургијом праха У Ni-TiC-B смешу TiC је био фиксан са 5 док је 5 10 и 15 бора додавано у смешу Тако припремљене смеше прахова су пресоване под притиском од 400 MPa и синтеровани у атмосфери аргона на 800 oC током 2 сата Детаљно су испитани микроструктура формирање фаза тврдоћа хабање и корозиона својства SEM је коришћен за анализу микроструктуре а XRD за детекцију фаза Мерења тврдоће су рађена уз помоћ уређаја за мерење микро-тврдоће Густине узорака су одређене Архимедесовим принципом Потенционо-динамичке поларизационе криве су урађене за композите у 35 раствору NaCl ради одређивања корозионих својстава Хабање је мерено под силом од 10 N Резултати указују на то да са порастом удела бора хабање и отпорност на корозију расту Кључне речи NiB-TiC композити металургија праха синтеровање легирање корозија copy 2018 Authors Published by the International Institute for the Science of Sintering This article is an open access article distributed under the terms and conditions of the Creative Commons mdash Attribution 40 International license (httpscreativecommonsorglicensesby40)
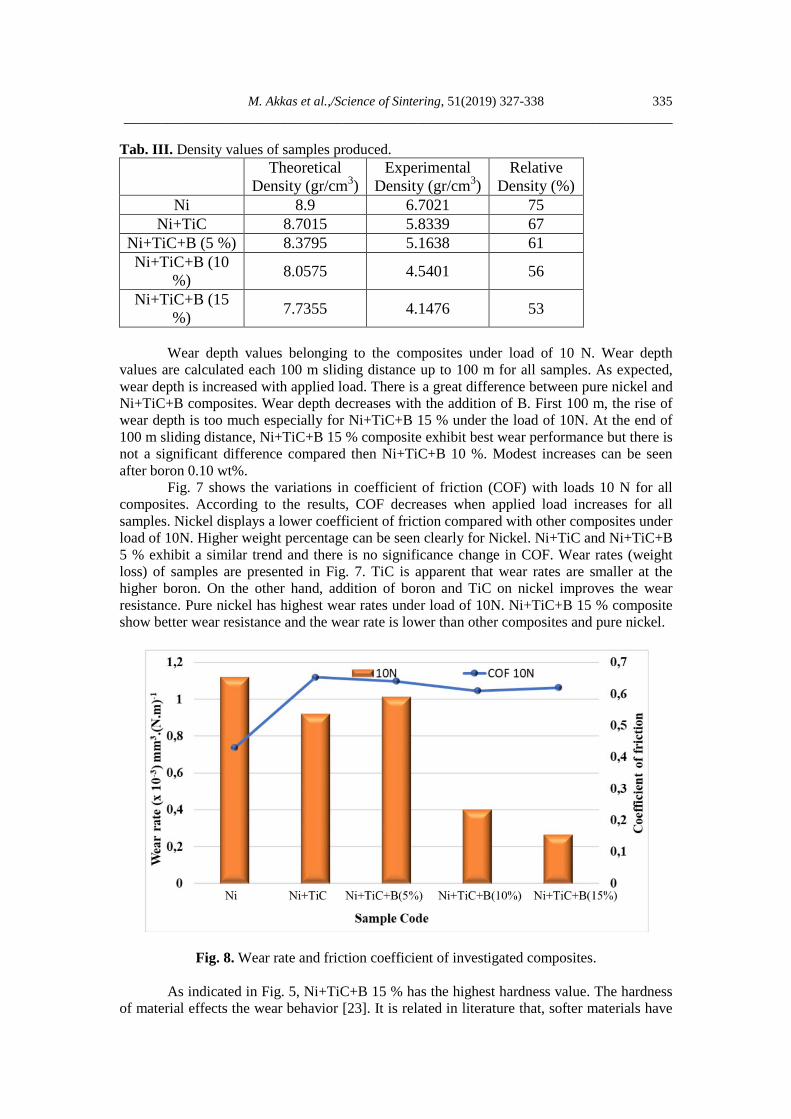
M Akkas et alScience of Sintering 51(2019) 327-338 ___________________________________________________________________________
335
Tab III Density values of samples produced
Theoretical Density (grcm3)
Experimental Density (grcm3)
Relative Density ()
Ni 89 67021 75 Ni+TiC 87015 58339 67
Ni+TiC+B (5 ) 83795 51638 61 Ni+TiC+B (10
) 80575 45401 56
Ni+TiC+B (15 ) 77355 41476 53
Wear depth values belonging to the composites under load of 10 N Wear depth values are calculated each 100 m sliding distance up to 100 m for all samples As expected wear depth is increased with applied load There is a great difference between pure nickel and Ni+TiC+B composites Wear depth decreases with the addition of B First 100 m the rise of wear depth is too much especially for Ni+TiC+B 15 under the load of 10N At the end of 100 m sliding distance Ni+TiC+B 15 composite exhibit best wear performance but there is not a significant difference compared then Ni+TiC+B 10 Modest increases can be seen after boron 010 wt Fig 7 shows the variations in coefficient of friction (COF) with loads 10 N for all composites According to the results COF decreases when applied load increases for all samples Nickel displays a lower coefficient of friction compared with other composites under load of 10N Higher weight percentage can be seen clearly for Nickel Ni+TiC and Ni+TiC+B 5 exhibit a similar trend and there is no significance change in COF Wear rates (weight loss) of samples are presented in Fig 7 TiC is apparent that wear rates are smaller at the higher boron On the other hand addition of boron and TiC on nickel improves the wear resistance Pure nickel has highest wear rates under load of 10N Ni+TiC+B 15 composite show better wear resistance and the wear rate is lower than other composites and pure nickel
Fig 8 Wear rate and friction coefficient of investigated composites
As indicated in Fig 5 Ni+TiC+B 15 has the highest hardness value The hardness of material effects the wear behavior [23] It is related in literature that softer materials have
M Akkas et alScience of Sintering 51(2019) 327-338 ___________________________________________________________________________
336
also higher wear rates than harder materials and according to the Archard wear rate is proportional with applied loads [24] The results of wear loss100 m belonging to the composites used in this study demonstrate the relation between hardness and wear rates The worn surfaces of specimens under load of 10 N are shown in Fig 9 SEM was used to determine wear mechanism Wear mechanisms (oxidation abrasion and adhesion) can be found in worn surfaces either only or combination [24] Fig 8 Scratch marks are parallel to the sliding direction and there are oxidation parts in selected areas Fig 8 present the Ni 95 + TiC 5 and Ni 80 + TiC 5 + B 15 composites It is clearly seen that located on the worn surface Wear rate is lower than other composites and partially scratch marks can be seen in the microstructure When all microstructures of composites are examined it can be concluded that Ni 80 + TiC 5 + B 15 show best wear characteristics
Fig 9 Worn surfaces and EDS analysis results of samples
M Akkas et alScience of Sintering 51(2019) 327-338 ___________________________________________________________________________
337
As a result abrasive wear is a dominant mechanism Scratch marks are generally parallel to the sliding direction Adhesion can be significantly less than abrasive for all samples It is also minimized because of the fact that the wear tests are carried out using low sliding speed 4 Conclusion In this study nanoparticle additive NiB-TiC alloys were produced by powder metallurgy method and SEM-EDS XRD microhardness density wear and corrosion results were investigated 400 MPa pressure 800 oC temperature and 2 hours in argon atmosphere were used as production parameters As a result of the studies The nanoparticle additive NiB-TiC alloys were successfully pressed and sintered As a result of XRD analysis Ni Ni2B Ni3B NiTi and NiC3B15 phases were
determined The highest hardness value was obtained in 15 B additive sample It was determined that the relative density values of the samples decreased due to the
increasing amount of B Corrosion rate is decreased for NiB-TiC composites When all microstructures of composites are examined it can be concluded that Ni 80
+ TiC 5 + B 15 show best wear characteristics 5 References
1 A Ivanović-Šašić T Novaković Z Mojović Ž Čupić D Jovanović Science of Sintering 50(3) (2018) 313
2 M Shahbazi H Cathey N Danilova I Mackinnon Materials 11(7) (2018) 1259 3 X S Xie S Q Zhao J X Dong G D Smith S J Patel In Materials Science
Forum 475 (2005) 613 4 K Wakasa M Yamaki Journal of materials science letters 10(18) (1991) 1093 5 F Li J Cheng S Zhu J Hao J Yang W Liu Materials Science and Engineering
A 682 (2017) 475 6 B Liu S Huang J Van Humbeeck J Vleugels Ceramics International 43(12)
(2017) 9512 7 M Mirak A Akbari Surface and Coatings Technology 349 (2018) 442 8 D Kır S Islak H Ccedilelik E Ccedilelik Science of Sintering 44 (2012) 235 9 W Zhang B Li International Journal of Electrochemical Science 13(4) (2018)
3486 10 R A Yildiz K Genel T Gulmez International Journal of Materials Mechanics and
Manufacturing 5(2) (2017) 83 11 S Islak Ouml Kuumlccediluumlk Ouml Eski C Oumlzorak M Akkaş Science of Sintering 49 (2017)
347 12 R Milinčić M Spasojević M Spasojević A Maričić S Randjić Science of
Sintering 48(3) (2016) 343 13 N Z Tomić M M Dimitrijević B I Međo M P Rakin R J Heinemann V J
Radojević R R Aleksić Science of Sintering 46(2) (2014) 225 14 S R Hashemi M Ardestani A Nemati Science of Sintering 48(1) (2016) 71 15 M A Korchagin D V Dudina B B Bokhonov N V Bulina A V Ukhina I S
Batraev Journal of materials science 53(19) (2018) 13592 16 M Nazarian-Samani A R Kamali R Mobarra Materials Letters 64(3) (2010) 309
M Akkas et alScience of Sintering 51(2019) 327-338 ___________________________________________________________________________
338
17 E Georgiza V Gouda P Vassiliou Surface and Coatings Technology 325 (2017) 46
18 X He R G Song D J Kong Journal of Alloys and Compounds 770 (2019) 771 19 G ASTM G102-89 ASTM International West Conshohocken USA (2004) 20 C E Campbell U R Kattner Journal of phase equilibria 20(5) (1999) 485 21 K Otsuka X Ren Progress in materials science 50(5) (2005) 511 22 H H Sheu Y C Tzeng J H Syu Materials Letters 238 (2019) 275 23 M Karbasi M R Zamanzad Ghavidel A Nekahi Materials and Corrosion 65(5)
(2014) 485 24 G J Arputhavalli S Agilan M Dinesh S J Vijay R Johnson Science of
Sintering 50(3) (2018) 337 Садржај У овом раду NiB-TiC композитни материјали су добијени металургијом праха У Ni-TiC-B смешу TiC је био фиксан са 5 док је 5 10 и 15 бора додавано у смешу Тако припремљене смеше прахова су пресоване под притиском од 400 MPa и синтеровани у атмосфери аргона на 800 oC током 2 сата Детаљно су испитани микроструктура формирање фаза тврдоћа хабање и корозиона својства SEM је коришћен за анализу микроструктуре а XRD за детекцију фаза Мерења тврдоће су рађена уз помоћ уређаја за мерење микро-тврдоће Густине узорака су одређене Архимедесовим принципом Потенционо-динамичке поларизационе криве су урађене за композите у 35 раствору NaCl ради одређивања корозионих својстава Хабање је мерено под силом од 10 N Резултати указују на то да са порастом удела бора хабање и отпорност на корозију расту Кључне речи NiB-TiC композити металургија праха синтеровање легирање корозија copy 2018 Authors Published by the International Institute for the Science of Sintering This article is an open access article distributed under the terms and conditions of the Creative Commons mdash Attribution 40 International license (httpscreativecommonsorglicensesby40)
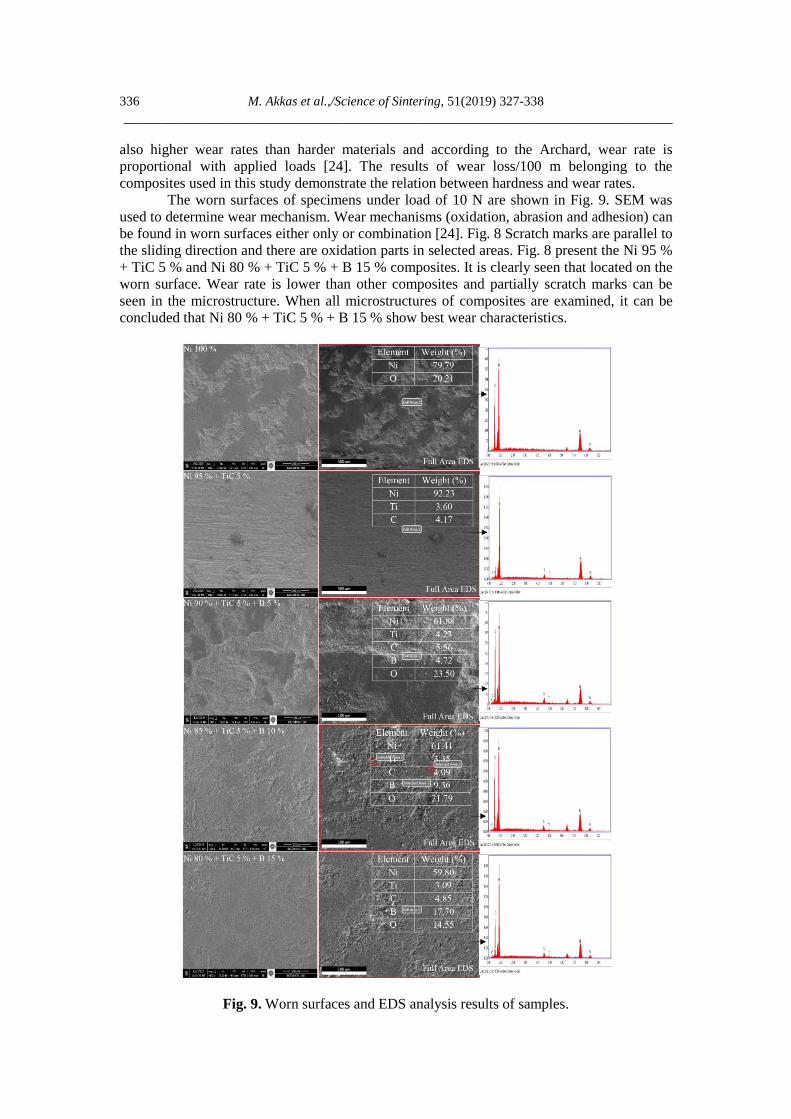
M Akkas et alScience of Sintering 51(2019) 327-338 ___________________________________________________________________________
336
also higher wear rates than harder materials and according to the Archard wear rate is proportional with applied loads [24] The results of wear loss100 m belonging to the composites used in this study demonstrate the relation between hardness and wear rates The worn surfaces of specimens under load of 10 N are shown in Fig 9 SEM was used to determine wear mechanism Wear mechanisms (oxidation abrasion and adhesion) can be found in worn surfaces either only or combination [24] Fig 8 Scratch marks are parallel to the sliding direction and there are oxidation parts in selected areas Fig 8 present the Ni 95 + TiC 5 and Ni 80 + TiC 5 + B 15 composites It is clearly seen that located on the worn surface Wear rate is lower than other composites and partially scratch marks can be seen in the microstructure When all microstructures of composites are examined it can be concluded that Ni 80 + TiC 5 + B 15 show best wear characteristics
Fig 9 Worn surfaces and EDS analysis results of samples
M Akkas et alScience of Sintering 51(2019) 327-338 ___________________________________________________________________________
337
As a result abrasive wear is a dominant mechanism Scratch marks are generally parallel to the sliding direction Adhesion can be significantly less than abrasive for all samples It is also minimized because of the fact that the wear tests are carried out using low sliding speed 4 Conclusion In this study nanoparticle additive NiB-TiC alloys were produced by powder metallurgy method and SEM-EDS XRD microhardness density wear and corrosion results were investigated 400 MPa pressure 800 oC temperature and 2 hours in argon atmosphere were used as production parameters As a result of the studies The nanoparticle additive NiB-TiC alloys were successfully pressed and sintered As a result of XRD analysis Ni Ni2B Ni3B NiTi and NiC3B15 phases were
determined The highest hardness value was obtained in 15 B additive sample It was determined that the relative density values of the samples decreased due to the
increasing amount of B Corrosion rate is decreased for NiB-TiC composites When all microstructures of composites are examined it can be concluded that Ni 80
+ TiC 5 + B 15 show best wear characteristics 5 References
1 A Ivanović-Šašić T Novaković Z Mojović Ž Čupić D Jovanović Science of Sintering 50(3) (2018) 313
2 M Shahbazi H Cathey N Danilova I Mackinnon Materials 11(7) (2018) 1259 3 X S Xie S Q Zhao J X Dong G D Smith S J Patel In Materials Science
Forum 475 (2005) 613 4 K Wakasa M Yamaki Journal of materials science letters 10(18) (1991) 1093 5 F Li J Cheng S Zhu J Hao J Yang W Liu Materials Science and Engineering
A 682 (2017) 475 6 B Liu S Huang J Van Humbeeck J Vleugels Ceramics International 43(12)
(2017) 9512 7 M Mirak A Akbari Surface and Coatings Technology 349 (2018) 442 8 D Kır S Islak H Ccedilelik E Ccedilelik Science of Sintering 44 (2012) 235 9 W Zhang B Li International Journal of Electrochemical Science 13(4) (2018)
3486 10 R A Yildiz K Genel T Gulmez International Journal of Materials Mechanics and
Manufacturing 5(2) (2017) 83 11 S Islak Ouml Kuumlccediluumlk Ouml Eski C Oumlzorak M Akkaş Science of Sintering 49 (2017)
347 12 R Milinčić M Spasojević M Spasojević A Maričić S Randjić Science of
Sintering 48(3) (2016) 343 13 N Z Tomić M M Dimitrijević B I Međo M P Rakin R J Heinemann V J
Radojević R R Aleksić Science of Sintering 46(2) (2014) 225 14 S R Hashemi M Ardestani A Nemati Science of Sintering 48(1) (2016) 71 15 M A Korchagin D V Dudina B B Bokhonov N V Bulina A V Ukhina I S
Batraev Journal of materials science 53(19) (2018) 13592 16 M Nazarian-Samani A R Kamali R Mobarra Materials Letters 64(3) (2010) 309
M Akkas et alScience of Sintering 51(2019) 327-338 ___________________________________________________________________________
338
17 E Georgiza V Gouda P Vassiliou Surface and Coatings Technology 325 (2017) 46
18 X He R G Song D J Kong Journal of Alloys and Compounds 770 (2019) 771 19 G ASTM G102-89 ASTM International West Conshohocken USA (2004) 20 C E Campbell U R Kattner Journal of phase equilibria 20(5) (1999) 485 21 K Otsuka X Ren Progress in materials science 50(5) (2005) 511 22 H H Sheu Y C Tzeng J H Syu Materials Letters 238 (2019) 275 23 M Karbasi M R Zamanzad Ghavidel A Nekahi Materials and Corrosion 65(5)
(2014) 485 24 G J Arputhavalli S Agilan M Dinesh S J Vijay R Johnson Science of
Sintering 50(3) (2018) 337 Садржај У овом раду NiB-TiC композитни материјали су добијени металургијом праха У Ni-TiC-B смешу TiC је био фиксан са 5 док је 5 10 и 15 бора додавано у смешу Тако припремљене смеше прахова су пресоване под притиском од 400 MPa и синтеровани у атмосфери аргона на 800 oC током 2 сата Детаљно су испитани микроструктура формирање фаза тврдоћа хабање и корозиона својства SEM је коришћен за анализу микроструктуре а XRD за детекцију фаза Мерења тврдоће су рађена уз помоћ уређаја за мерење микро-тврдоће Густине узорака су одређене Архимедесовим принципом Потенционо-динамичке поларизационе криве су урађене за композите у 35 раствору NaCl ради одређивања корозионих својстава Хабање је мерено под силом од 10 N Резултати указују на то да са порастом удела бора хабање и отпорност на корозију расту Кључне речи NiB-TiC композити металургија праха синтеровање легирање корозија copy 2018 Authors Published by the International Institute for the Science of Sintering This article is an open access article distributed under the terms and conditions of the Creative Commons mdash Attribution 40 International license (httpscreativecommonsorglicensesby40)
M Akkas et alScience of Sintering 51(2019) 327-338 ___________________________________________________________________________
338
17 E Georgiza V Gouda P Vassiliou Surface and Coatings Technology 325 (2017) 46
18 X He R G Song D J Kong Journal of Alloys and Compounds 770 (2019) 771 19 G ASTM G102-89 ASTM International West Conshohocken USA (2004) 20 C E Campbell U R Kattner Journal of phase equilibria 20(5) (1999) 485 21 K Otsuka X Ren Progress in materials science 50(5) (2005) 511 22 H H Sheu Y C Tzeng J H Syu Materials Letters 238 (2019) 275 23 M Karbasi M R Zamanzad Ghavidel A Nekahi Materials and Corrosion 65(5)
(2014) 485 24 G J Arputhavalli S Agilan M Dinesh S J Vijay R Johnson Science of
Sintering 50(3) (2018) 337 Садржај У овом раду NiB-TiC композитни материјали су добијени металургијом праха У Ni-TiC-B смешу TiC је био фиксан са 5 док је 5 10 и 15 бора додавано у смешу Тако припремљене смеше прахова су пресоване под притиском од 400 MPa и синтеровани у атмосфери аргона на 800 oC током 2 сата Детаљно су испитани микроструктура формирање фаза тврдоћа хабање и корозиона својства SEM је коришћен за анализу микроструктуре а XRD за детекцију фаза Мерења тврдоће су рађена уз помоћ уређаја за мерење микро-тврдоће Густине узорака су одређене Архимедесовим принципом Потенционо-динамичке поларизационе криве су урађене за композите у 35 раствору NaCl ради одређивања корозионих својстава Хабање је мерено под силом од 10 N Резултати указују на то да са порастом удела бора хабање и отпорност на корозију расту Кључне речи NiB-TiC композити металургија праха синтеровање легирање корозија copy 2018 Authors Published by the International Institute for the Science of Sintering This article is an open access article distributed under the terms and conditions of the Creative Commons mdash Attribution 40 International license (httpscreativecommonsorglicensesby40)


![NIB Neg UPS [ MBA ]](https://img.pdfslide.us/doc/110x75/55721454497959fc0b9446d8/nib-neg-ups-mba-.jpg)