Embed Size (px)
Citation preview
HAL Id: hal-00895619https://hal.archives-ouvertes.fr/hal-00895619
Submitted on 1 Jan 2006
HAL is a multi-disciplinary open accessarchive for the deposit and dissemination of sci-entific research documents, whether they are pub-lished or not. The documents may come fromteaching and research institutions in France orabroad, or from public or private research centers.
L’archive ouverte pluridisciplinaire HAL, estdestinée au dépôt et à la diffusion de documentsscientifiques de niveau recherche, publiés ou non,émanant des établissements d’enseignement et derecherche français ou étrangers, des laboratoirespublics ou privés.
Microstructure of pasteurized process cheesemanufactured from vacuum condensed and ultrafiltered
milkVikram V. Mistry, Ashraf N. Hassan, Mayur R. Acharya
To cite this version:Vikram V. Mistry, Ashraf N. Hassan, Mayur R. Acharya. Microstructure of pasteurized process cheesemanufactured from vacuum condensed and ultrafiltered milk. Le Lait, INRA Editions, 2006, 86 (6),pp.453-459. <hal-00895619>
453Lait 86 (2006) 453–459© INRA, EDP Sciences, 2006DOI: 10.1051/lait:2006018
Note
Microstructure of pasteurized process cheese manufactured from vacuum condensed
and ultrafiltered milk1
Vikram V. MISTRY*, Ashraf N. HASSAN, Mayur R. ACHARYA**
Midwest Dairy Foods Research Center, Dairy Science Department, South Dakota State University, Brookings SD 57007, USA
Received 28 March 2006 – Accepted 19 September 2006
Abstract – Milk standardized to 45 g·kg–1 protein (UF1 and CM1) and 60 g·kg–1 protein (UF2 andCM2) using ultrafiltered milk (150 g·kg–1 protein) or vacuum condensed milk (120 g·kg–1 protein)was used for manufacturing Cheddar cheese. Pasteurized Process cheeses were manufactured usinga 1:1 blend of 18-week and 30-week Cheddar cheese. The moisture content of the Process cheesesranged from 393 to 402 g·kg–1. Fat content was the highest in the control cheese (350 g·kg–1) andthe lowest in UF2 (316 g·kg–1). Microstructure of cheeses was observed using cryo-scanning elec-tron microscopy. Fat globules of different sizes embedded in the continuous protein network wereobserved. Whereas, a porous structure with relatively large pores was noted in the control cheese,more compact protein masses were observed in cheeses made from concentrated milk. Fat globulesin all cheeses were surrounded by cavities. Firmness of cheese was associated with less porous(compact) protein network. Large areas of dense highly fused protein were observed in UF2 chee-ses, which showed the highest resistance to compression (highest firmness). Fractures in the proteinnetwork were observed as the firmness of cheese increased. Such fractures reduced the ability ofprotein network to entrap fat and increased the level of free oil. Appendages connecting fat globulesto protein network were seen in cheese containing low amounts of free oil which indicated goodemulsifying properties. The continuous less rigid protein structure with good emulsifying properties(the presence of appendages connecting protein network to fat globules) produced cheese withincreased meltability. This study shows that the application of concentrated milks for Cheddarcheese-making influences Process cheese functionality and structure.
ultrafiltration / condensing / Process cheese / microstructure
摘要 – 真空和超滤浓缩牛乳生产的巴氏杀菌熔化干酪的微观结构。采用 5 组不同处理的原料奶生产切达干酪,实验组为超滤浓缩 (150 g·kg–1 蛋白质)和真空浓缩 (120 g·kg–1 蛋白质)的牛乳分别标准化到蛋白质含量为 45 g·kg–1 (UF1 和 CM1)和 60 g·kg–1(UF2 和 CM2),对照组为普通鲜牛奶。将成熟 18 周和 30 周的切达干酪 1:1 混合后加工成巴氏杀菌熔化干酪。熔化干酪的水分含量为 393 ~ 402 g·kg–1。对照组的脂肪含量最高 (350 g·kg–1),UF2 组的脂肪含量最低 (316 g·kg–1 )。通过低温扫描电子显微镜可以观察到不同形状的脂肪球被包裹在连续的蛋白质网络中,而且发现对照组和实验组干酪样品在微观结构上存在着显著地差异。对照组样品呈现着较大孔径的多孔结构,而由浓缩奶生产的干酪中蛋白质结合的非常
* Corresponding author (通讯作者) : [email protected]** Current address: Wells’ Dairy, 1 1st Street S.W., Le Mars, IA 51031, USA.1 Published with the approval of director of the South Dakota Agricultural Experiment Station as Publi-cation Number 3497 of the Journal Series. This research was sponsored, in part, by the Midwest DairyFoods Research Center, Brookings, SD and Midwest Dairy Association, St. Paul, MN.
Article published by EDP Sciences and available at http://www.edpsciences.org/lait or http://dx.doi.org/10.1051/lait:2006018
454 V.V. Mistry et al.
紧密。在所有的干酪样品中脂肪球的周围都出了现窄的孔隙。蛋白质网络的孔洞越小,干酪的质地越紧密。在硬度最高的 UF2 干酪中可以观察到大面积的、密集的、高度融合的蛋白质结构, UF2 干酪的抗压缩性最高。当干酪硬度增加到一定程度时出现了蛋白质网络断裂的现象,这种断裂现象会导致蛋白质网络对脂肪球包裹能力下降进而增加游离脂肪的含量。在游离脂肪含量低的干酪样品中,可以观察到脂肪和蛋白质网络融为一体,这种干酪的乳化性能非常好,具有这种蛋白质结构的干酪其熔融性非常好。实验证明由浓缩乳生产的切达干酪会影响其熔化干酪特性和微观结构。
超滤 / 浓缩 / 熔化干酪 / 微观结构
Résumé – Microstructure de fromage fondu pasteurisé fabriqué à partir de lait concentré sousvide ou ultrafiltré. Du lait standardisé en protéines à 45 g·kg–1 (UF1 et CM1) et à 60 g·kg–1 (UF2et CM2) à l’aide de lait ultrafiltré (150 g·kg–1 de protéines) ou concentré sous vide (120 g·kg–1 deprotéines) a été utilisé pour fabriquer du cheddar. Des fromages fondus pasteurisés ont été fabriquésà partir d’un mélange 1 : 1 de cheddar de 18 semaines et de 30 semaines d’affinage. La teneur eneau des fromages allait de 393 à 402 g·kg–1. La teneur en matière grasse la plus élevée a été obtenuedans le fromage témoin (350 g·kg–1) et la plus faible dans le fromage UF2 (316 g·kg–1). La micros-tructure des fromages a été observée par cryo-microscopie électronique à balayage (cryo-SEM).Des globules gras de différentes tailles, imbriqués dans le réseau protéique continu, ont été observés.Alors qu’une structure poreuse, avec des pores relativement larges, a été observée dans les fromagestémoins, des masses protéiques plus compactes sont apparues dans les fromages obtenus avec le laitconcentré. Dans tous les fromages, les globules gras étaient entourés de cavités. La fermeté du fro-mage était associée à un réseau protéique moins poreux (compact). De larges zones de protéinesdenses très fusionnées ont été observées dans les fromages UF2 présentant la plus grande résistanceà la compression (fermeté maximale). Avec l’augmentation de la fermeté des fromages, des fractu-res sont apparues dans le réseau protéique, réduisant sa capacité à inclure la matière grasse et aug-mentant le taux de matière grasse libre. Des joints de connexion reliant les globules gras au réseauprotéique ont été observés dans le fromage ayant le moins de matière grasse libre, et donc de bonnespropriétés émulsifiantes. La structure protéique continue la moins rigide, avec de bonnes propriétésémulsifiantes (présence de joints de connexion reliant réseau protéique et globules gras), a conduità un fromage présentant une aptitude à la fonte accrue. Cette étude montre que l’utilisation de laitconcentré pour la fabrication de cheddar affecte les propriétés fonctionnelles et la structure du fro-mage fondu.
ultrafiltration / concentration / fromage fondu / microstructure
Abbreviation key: CM = condensed milk, UF = ultrafiltered milk.
1. INTRODUCTION
Ultrafiltration and vacuum condensingare common concentration techniques usedin cheese making. These techniques pro-duce milks of distinctly different propertiesthat also influence the characteristics ofcheese from such milks [1]. The qualityattributes of Process cheese are greatlyinfluenced by the composition and nature ofbase cheeses. Therefore, the use of concen-trated milk in making the base cheese wouldaffect the characteristics of Process cheese[2]. Electron microscopic studies offeropportunities for studying the structuralcharacteristics of cheese as they relate to
other physico-chemical properties [3, 8]. Inconventional scanning electron micros-copy, sample preparation techniquesinduce artifacts and make it difficult torelate the microstructure to physical andfunctional properties of the product. Withthis technique, fat is extracted prior tomicroscopic observation. Hence, fat incheese is represented only by cavitiescaused by the removal of fat. This does notallow direct observation of fat globules orthe study of the interaction between fatglobules and the protein matrix. Cryo-scan-ning electron microscopy allows observa-tion of fully hydrated specimen without theneed for fat extraction [4]. This technique
Microstructure of process cheese 455
is suitable for studying specimen with highmoisture levels [7]. The objective of thisstudy was to relate the physical and func-tional properties of pasteurized Processcheese manufactured from milk concen-trated by vacuum condensation or ultrafil-tration to its microstructure as observedwith cryo-scanning electron microscopy.
2. MATERIALS AND METHODS
2.1. Pasteurized Process cheese manufacture
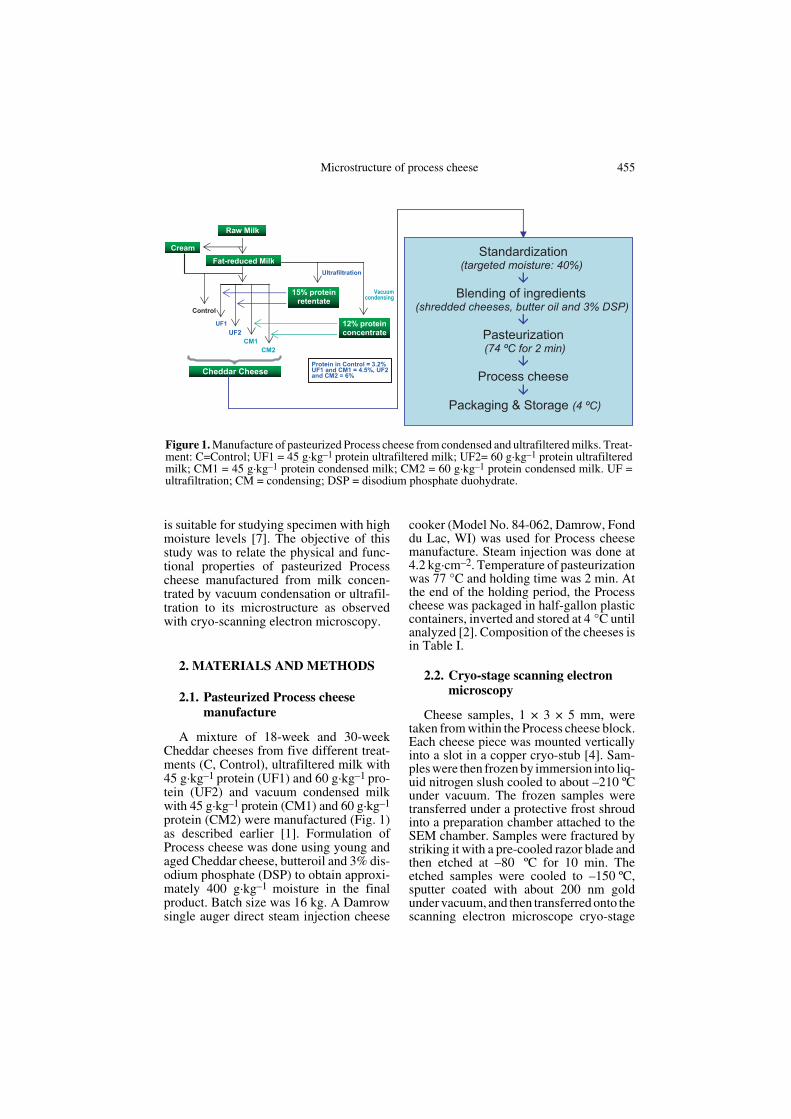
A mixture of 18-week and 30-weekCheddar cheeses from five different treat-ments (C, Control), ultrafiltered milk with45 g·kg–1 protein (UF1) and 60 g·kg–1 pro-tein (UF2) and vacuum condensed milkwith 45 g·kg–1 protein (CM1) and 60 g·kg–1
protein (CM2) were manufactured (Fig. 1)as described earlier [1]. Formulation ofProcess cheese was done using young andaged Cheddar cheese, butteroil and 3% dis-odium phosphate (DSP) to obtain approxi-mately 400 g·kg–1 moisture in the finalproduct. Batch size was 16 kg. A Damrowsingle auger direct steam injection cheese
cooker (Model No. 84-062, Damrow, Fonddu Lac, WI) was used for Process cheesemanufacture. Steam injection was done at4.2 kg·cm–2. Temperature of pasteurizationwas 77 °C and holding time was 2 min. Atthe end of the holding period, the Processcheese was packaged in half-gallon plasticcontainers, inverted and stored at 4 °C untilanalyzed [2]. Composition of the cheeses isin Table I.
2.2. Cryo-stage scanning electron microscopy
Cheese samples, 1 × 3 × 5 mm, weretaken from within the Process cheese block.Each cheese piece was mounted verticallyinto a slot in a copper cryo-stub [4]. Sam-ples were then frozen by immersion into liq-uid nitrogen slush cooled to about –210 ºCunder vacuum. The frozen samples weretransferred under a protective frost shroudinto a preparation chamber attached to theSEM chamber. Samples were fractured bystriking it with a pre-cooled razor blade andthen etched at –80 ºC for 10 min. Theetched samples were cooled to –150 ºC,sputter coated with about 200 nm goldunder vacuum, and then transferred onto thescanning electron microscope cryo-stage
Standardization (targeted moisture: 40%)
Blending of ingredients (shredded cheeses, butter oil and 3% DSP)
Pasteurization (74 ºC for 2 min)
Process cheese
Packaging & Storage (4 ºC)
UF2UF1
Raw Milk
Protein in Control = 3.2% UF1 and CM1 = 4.5%, UF2 and CM2 = 6% Cheddar Cheese
Fat-reduced MilkCream
15% protein retentate
Ultrafiltration
12% protein concentrate
Vacuum condensing
Control
CM1CM2
Figure 1. Manufacture of pasteurized Process cheese from condensed and ultrafiltered milks. Treat-ment: C=Control; UF1 = 45 g·kg–1 protein ultrafiltered milk; UF2= 60 g·kg–1 protein ultrafilteredmilk; CM1 = 45 g·kg–1 protein condensed milk; CM2 = 60 g·kg–1 protein condensed milk. UF =ultrafiltration; CM = condensing; DSP = disodium phosphate duohydrate.
456 V.V. Mistry et al.
for observation at 5 kV accelerating voltageusing a Hitachi S3500N scanning electronmicroscope (Nissei Sangyo America, Ltd,Gaithersburg, MD, USA) equipped with anEmitech K1150 Cryogenic PreparationSystem (Houston, TX, USA).
3. RESULTS AND DISCUSSION
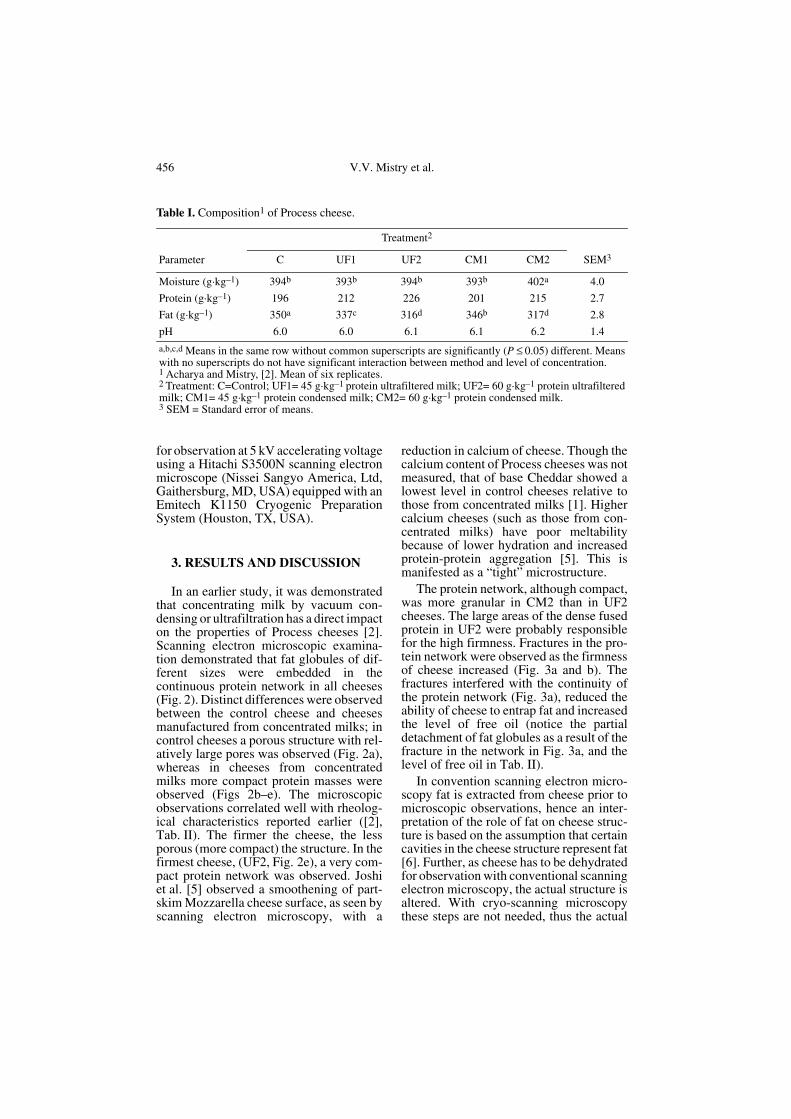
In an earlier study, it was demonstratedthat concentrating milk by vacuum con-densing or ultrafiltration has a direct impacton the properties of Process cheeses [2].Scanning electron microscopic examina-tion demonstrated that fat globules of dif-ferent sizes were embedded in thecontinuous protein network in all cheeses(Fig. 2). Distinct differences were observedbetween the control cheese and cheesesmanufactured from concentrated milks; incontrol cheeses a porous structure with rel-atively large pores was observed (Fig. 2a),whereas in cheeses from concentratedmilks more compact protein masses wereobserved (Figs 2b–e). The microscopicobservations correlated well with rheolog-ical characteristics reported earlier ([2],Tab. II). The firmer the cheese, the lessporous (more compact) the structure. In thefirmest cheese, (UF2, Fig. 2e), a very com-pact protein network was observed. Joshiet al. [5] observed a smoothening of part-skim Mozzarella cheese surface, as seen byscanning electron microscopy, with a
reduction in calcium of cheese. Though thecalcium content of Process cheeses was notmeasured, that of base Cheddar showed alowest level in control cheeses relative tothose from concentrated milks [1]. Highercalcium cheeses (such as those from con-centrated milks) have poor meltabilitybecause of lower hydration and increasedprotein-protein aggregation [5]. This ismanifested as a “tight” microstructure.
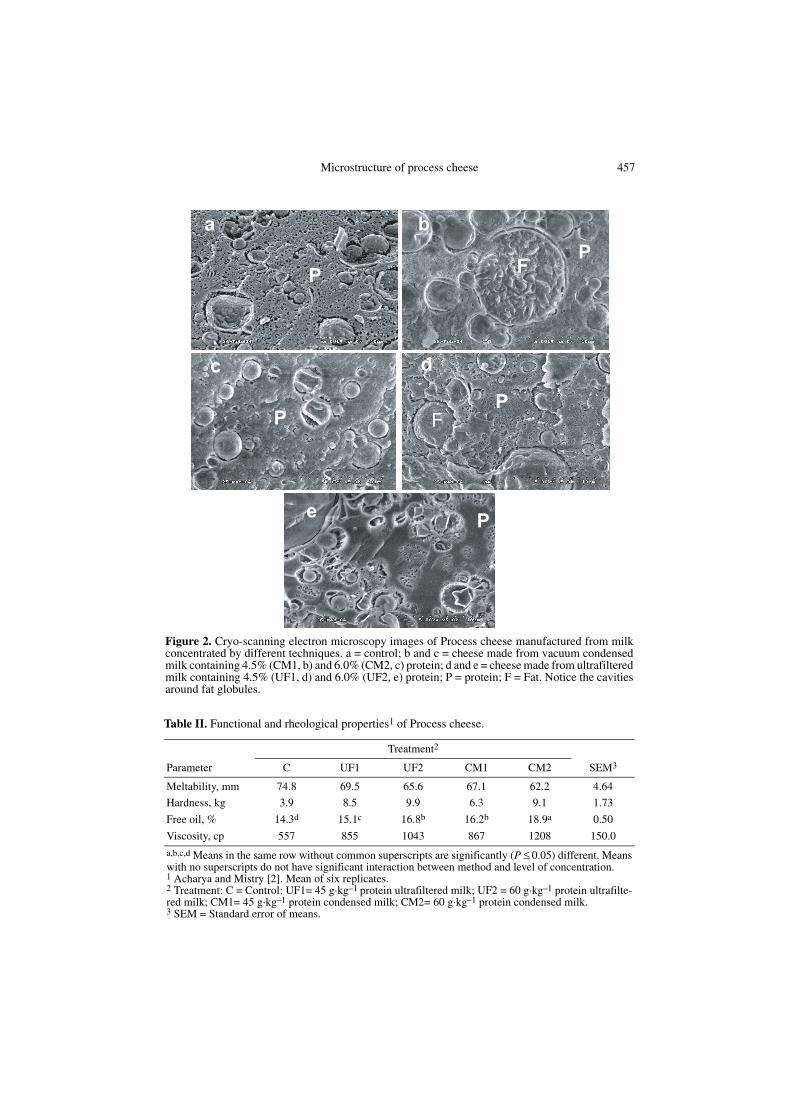
The protein network, although compact,was more granular in CM2 than in UF2cheeses. The large areas of the dense fusedprotein in UF2 were probably responsiblefor the high firmness. Fractures in the pro-tein network were observed as the firmnessof cheese increased (Fig. 3a and b). Thefractures interfered with the continuity ofthe protein network (Fig. 3a), reduced theability of cheese to entrap fat and increasedthe level of free oil (notice the partialdetachment of fat globules as a result of thefracture in the network in Fig. 3a, and thelevel of free oil in Tab. II).
In convention scanning electron micro-scopy fat is extracted from cheese prior tomicroscopic observations, hence an inter-pretation of the role of fat on cheese struc-ture is based on the assumption that certaincavities in the cheese structure represent fat[6]. Further, as cheese has to be dehydratedfor observation with conventional scanningelectron microscopy, the actual structure isaltered. With cryo-scanning microscopythese steps are not needed, thus the actual
Table I. Composition1 of Process cheese.
Treatment2
Parameter C UF1 UF2 CM1 CM2 SEM3
Moisture (g·kg–1) 394b 393b 394b 393b 402a 4.0
Protein (g·kg–1) 196 212 226 201 215 2.7
Fat (g·kg–1) 350a 337c 316d 346b 317d 2.8
pH 6.0 6.0 6.1 6.1 6.2 1.4
a,b,c,d Means in the same row without common superscripts are significantly (P ≤ 0.05) different. Meanswith no superscripts do not have significant interaction between method and level of concentration.1 Acharya and Mistry, [2]. Mean of six replicates.2 Treatment: C=Control; UF1= 45 g·kg–1 protein ultrafiltered milk; UF2= 60 g·kg–1 protein ultrafilteredmilk; CM1= 45 g·kg–1 protein condensed milk; CM2= 60 g·kg–1 protein condensed milk.3 SEM = Standard error of means.
Microstructure of process cheese 457
Figure 2. Cryo-scanning electron microscopy images of Process cheese manufactured from milkconcentrated by different techniques. a = control; b and c = cheese made from vacuum condensedmilk containing 4.5% (CM1, b) and 6.0% (CM2, c) protein; d and e = cheese made from ultrafilteredmilk containing 4.5% (UF1, d) and 6.0% (UF2, e) protein; P = protein; F = Fat. Notice the cavitiesaround fat globules.
Table II. Functional and rheological properties1 of Process cheese.
Treatment2
Parameter C UF1 UF2 CM1 CM2 SEM3
Meltability, mm 74.8 69.5 65.6 67.1 62.2 4.64
Hardness, kg 3.9 8.5 9.9 6.3 9.1 1.73
Free oil, % 14.3d 15.1c 16.8b 16.2b 18.9a 0.50
Viscosity, cp 557 855 1043 867 1208 150.0
a,b,c,d Means in the same row without common superscripts are significantly (P ≤ 0.05) different. Meanswith no superscripts do not have significant interaction between method and level of concentration.1 Acharya and Mistry [2]. Mean of six replicates.2 Treatment: C = Control; UF1= 45 g·kg–1 protein ultrafiltered milk; UF2 = 60 g·kg–1 protein ultrafilte-red milk; CM1= 45 g·kg–1 protein condensed milk; CM2= 60 g·kg–1 protein condensed milk.3 SEM = Standard error of means.
458 V.V. Mistry et al.
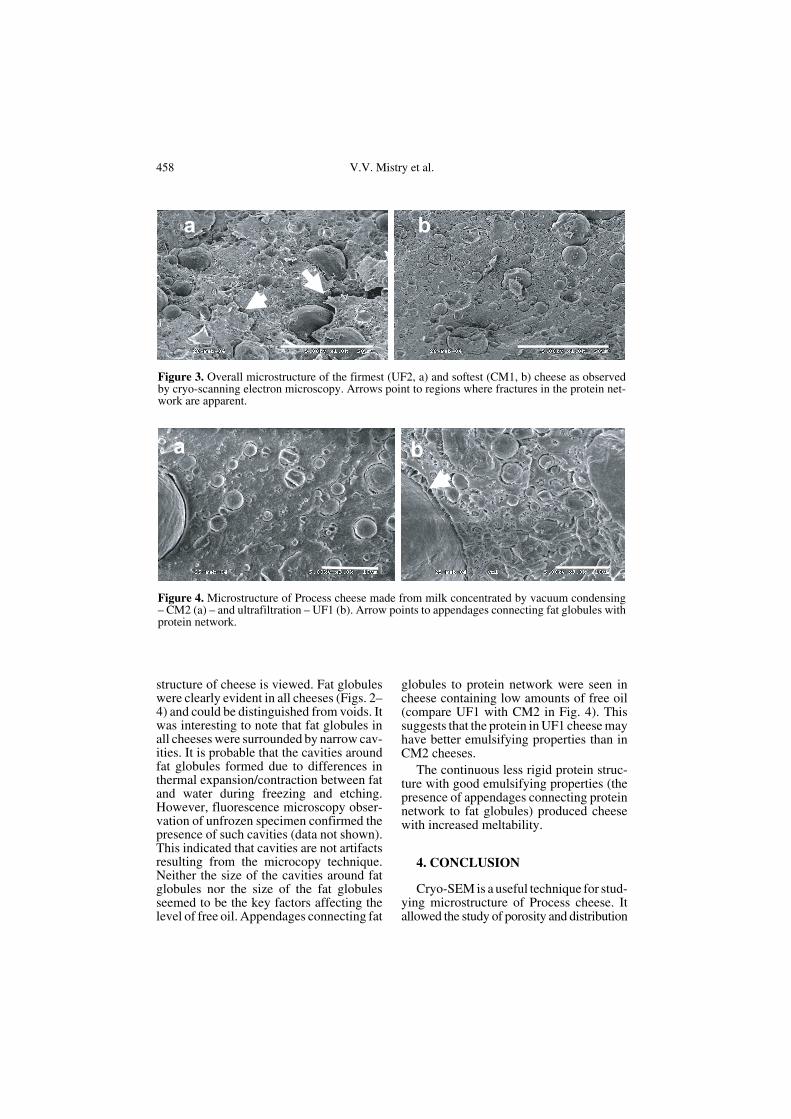
structure of cheese is viewed. Fat globuleswere clearly evident in all cheeses (Figs. 2–4) and could be distinguished from voids. Itwas interesting to note that fat globules inall cheeses were surrounded by narrow cav-ities. It is probable that the cavities aroundfat globules formed due to differences inthermal expansion/contraction between fatand water during freezing and etching.However, fluorescence microscopy obser-vation of unfrozen specimen confirmed thepresence of such cavities (data not shown).This indicated that cavities are not artifactsresulting from the microcopy technique.Neither the size of the cavities around fatglobules nor the size of the fat globulesseemed to be the key factors affecting thelevel of free oil. Appendages connecting fat
globules to protein network were seen incheese containing low amounts of free oil(compare UF1 with CM2 in Fig. 4). Thissuggests that the protein in UF1 cheese mayhave better emulsifying properties than inCM2 cheeses.
The continuous less rigid protein struc-ture with good emulsifying properties (thepresence of appendages connecting proteinnetwork to fat globules) produced cheesewith increased meltability.
4. CONCLUSION
Cryo-SEM is a useful technique for stud-ying microstructure of Process cheese. Itallowed the study of porosity and distribution
Figure 3. Overall microstructure of the firmest (UF2, a) and softest (CM1, b) cheese as observedby cryo-scanning electron microscopy. Arrows point to regions where fractures in the protein net-work are apparent.
Figure 4. Microstructure of Process cheese made from milk concentrated by vacuum condensing– CM2 (a) – and ultrafiltration – UF1 (b). Arrow points to appendages connecting fat globules withprotein network.
Microstructure of process cheese 459
of fat globules within the protein networkin cheese. Because of the fully hydratedstate of cheese specimens observed withcryo-SEM, the microstructure data couldexplain the physical and functional proper-ties previously reported. This study demon-strated that the microstructure ofpasteurized Process cheese is clearly affectedby the micro-environment of cheese, whichin turn, is affected by the use of vacuumcondensing and ultrafiltration for manufac-turing the base Cheddar cheese.
Acknowledgement: The authors gratefullyacknowledge the assistance of Gib Ahlstrand ofthe University of Minnesota and CBS ImagingCenter for assistance with cryo-scanning elec-tron microscopy.
REFERENCES
[1] Acharya M.R., Mistry V.V., Comparison ofeffect of vacuum condensed and ultrafilteredmilk on Cheddar cheese, J. Dairy Sci. 87(2004) 4004–4012.
[2] Acharya M.R., Mistry V.V., Effect ofvacuum-condensed or ultrafiltered milk on
pasteurized Process cheese, J. Dairy Sci. 88(2005) 3037–3043.
[3] Caric M., Gantar M., Kalab M., Effect ofemulsifying agents on the microstructure andother characteristics of process cheese – areview, Food Microstruct. 4 (1985) 297–312.
[4] Hassan A.N., Frank J.F., El Soda M., Obser-vation of bacterial exopolysaccharides indairy products using cryo-scanning electronmicroscopy, Int. Dairy J. 13 (2003) 755–762.
[5] Joshi N.S., Muthukumarappan K., Dave R.I.,Effect of calcium on microstructure and mel-tability of part skim mozzarella cheese, J.Dairy Sci. 87 (2004) 1975–1985.
[6] Raval D.M., Mistry V.V., Application ofultrafiltered sweet buttermilk in the manufac-ture of reduced fat Process cheese, J. DairySci. 82 (1999) 2334–2343.
[7] Serp D., Mueller M., von Stockar U., MarisonI.W., Low-temperature electron microscopyfor the study of polysaccharide ultrastructu-res in hydrogels. I. Theoretical and technicalconsideration, Biotechnol. Bioeng. 79 (2002)243–252.
[8] Sutheerawattanonanonda M., Fulcher R.G.,Martin F.B., Bastian E.D., Fluorescenceimage analysis of Process cheese manufactu-red with trisodium citrate and sodium chlo-ride, J. Dairy Sci. 80 (1997) 620–627.
To access this journal online:www.edpsciences.org