Embed Size (px)
Citation preview
ABSTRACT
M I C R O S T R U C T U R E I N T E G R A T E D MODELING OF MULTISCAN L A S E R FORMING
Jin Cheng and Y. Lawrence Yao Department of Mechanical Engineering, Columbia University
New York, NY 10027
Proceedings of 2001 ASME International Mechanical Engineering Congress and Exposition
November 11-16, 2001, New York, NY
IMECE2001/MED-23346
primary softening mechanism determining the stress-strain
Laser forming of steel is a hot forming process with highheating and cooling rate, during which strain hardening, dynamic recrystallization, and phase transformation take place. Numerical models considering strain rate and temperature effects only usually give unsatisfactory results when applied to multiscan laser forming operations. This is mainly due to the inadequate constitutive models employed to describe the hot flow behavior. In this work, this limitation is overcome by considering the effects of microstructure change on the flow stress in laser forming processes of low carbon steel. The incorporation of such flow stress models with thermal mechanical FEM simulation increases numerical model accuracy in predicting geometry change and mechanical properties.
1. INTRODUCTION Laser forming is a hot working process, during which thermal
distortion induced by a laser beam is made use of to shape material without hard tooling or external forces. Numerical and experimental investigations of laser forming processes were carried out to better understand process mechanisms and the effects of key process parameters on dimension and mechanical properties of the formed parts [8,18,4]. Temperature and strain- rate dependent material properties were compiled and considered in the numerical models developed for concave, convex, and tube laser-forming processes, and nonlinear relationships including appropriate flow rule and yield criterion were specified for plastic deformation [13,14,16]. Experimental observations, however, have shown that the laser forming processes of metals are often accompanied by recovery, recrystallization and phase transformation [22,19,13,6]. To enhance modeling accuracy and prediction capability, variations in material properties, such as in flow stress, caused by microstructure changes need to be considered in numerical simulation of the laser forming process.
It is important to consider the microstructure changes in modeling the laser forming process because, first of all, for the high temperature experienced in the process, flow stress is more significantly influenced by the microstructure changes. Secondly, laser forming like other hot working processes, is characterized by work hardening simultaneously relieved by dynamic softening processes. Apart from recovery, dynamic recrystallization is the
1
relationship of a material and, hence its flow behavior. This is especially true for metals such as steels, which exhibit relatively low stacking fault energy. In particular, the simultaneous hardening and softening process repeats and its effects accumulate in multi-scan laser forming, during which repeated heating and deforming take place to achieve the magnitude of deformation required for practical 3-D laser forming.
The fundamental of physical metallurgy of hot working of steel is well established. Various research groups [9,23,24] have developed material models for the mathematical description of recovery and recrystallization behavior based on semi-empirical equations. The incorporation of such models with finite element method (FEM) based simulation to predict local microstructure has led to more accurate results. For instance, Karhausen and Kopp [10] presented a model offering improved implementation of material behavior in plastomechanical simulations of hot-forming processes. The developed model was validated to increase the accuracy in terms of structural description and flow stress determination. Pauskar and Shivpuri [21] considered recovery and dynamic recrystallization in the flow stress model for hot rolling.
Laser forming differs from other hot working processes in that significantly higher heating and cooling rate is involved. This is generally true for processes using a laser beam but laser forming also involves fairly high strain and strain rate. Ashby and Easterling [3] investigated the transformation of steel surface treatment by laser beams. They presented a kinetic model that considers the rapid heating and cooling rate effects on metallurgy of steel. They combined the solutions to the heat flow and the kinetic models to predict the near surface structure and hardness after laser treatment. But the deformation involved is small. Chen, et al. [5] considered the eutectic temperature change due to the superheating during laser surface hardening. They applied the transformation temperature change to FEM simulation, and the results showed that considering microstructure dependent physical properties are important. In this paper, the effects of microstructure change on the flow stress in laser forming processes of steels are examined in the context of higher heating and cooling rate. Appropriate models of microstructure
Copyright © 2001 by ASME
changes are incorporated into thermal-mechanical FEM simulation in order to better predict the mechanical properties and geometry change of the formed parts.
2. MICROSTRUCTURE DEPENDENT FLOW STRESS MODELING FOR LASER FORMING
2.1 Modeling scheme A typical laser forming process of low carbon steels
undergoes the stages listed in Table 1, where A1ne is the non- equilibrium lower transformation (eutectic) temperature, A3ne the non-equilibrium upper transformation temperature, and 700K is approximately the starting temperature for martensite formation of low carbon steels. The determination of the non-equilibrium transformation temperature due to superheating will be discussed in Sections 2.4 and 4.1.
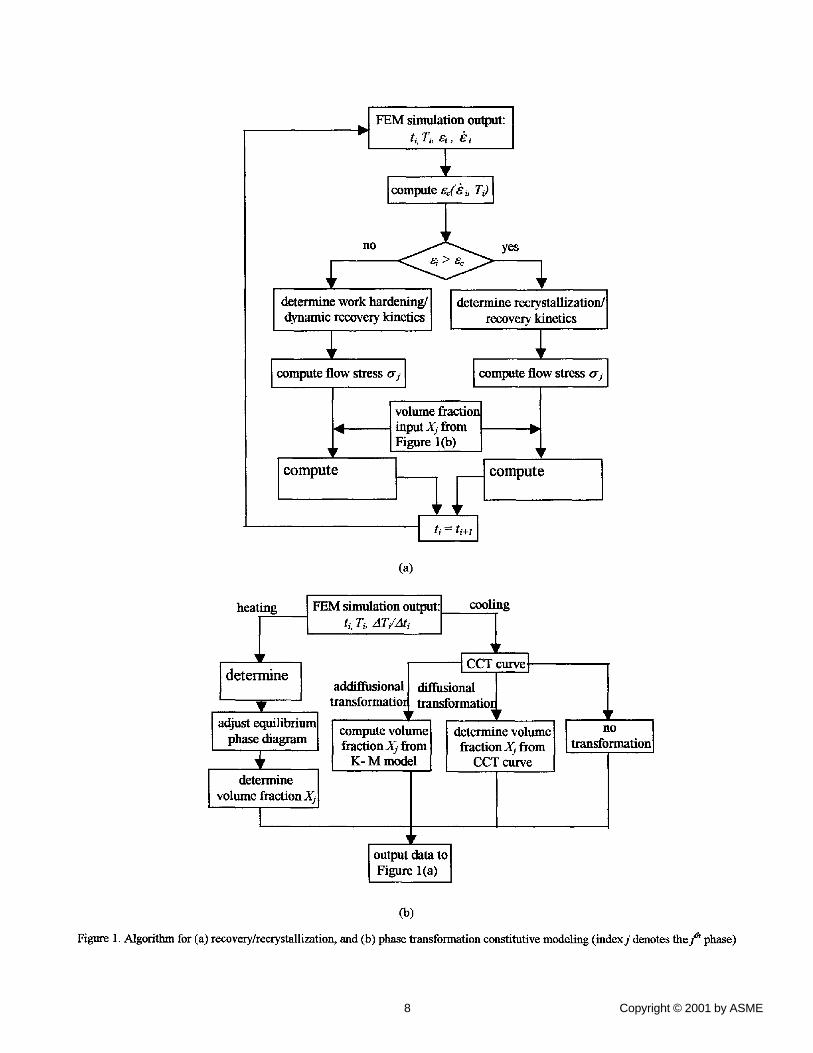
The overall strategy is to develop a module on recovery/recrystallization and a module on phase transformation, and to interface them with an existing FEM thermal/mechanical model of laser forming (Fig. 1). The FEM model, which has been reported previously [4,14,6], computes thermal and mechanical variables (e.g., temperature, strain, and strain rate). Given these values, the phase transformation module determines volume fractions X~ of different phases depending on whether it is heating or cooling. For a heating stage, an equilibrium phase diagram adjusted for the high heating rate involved is used to determine X~. For a cooling stage, a continuous cooling transformation (CCT) diagram together with semi-empirical models is used to determine Xj (Fig. l(b)). With all these as inputs, the recovery and recrystallization module balances between work hardening and the softening processes of dynamic recovery and dynamic recrystallization, and subsequently determines the flow stress ~r by the additive principle (Eq. (1)) of multi phases (Fig. l(a)). Appropriate constitutive relationships used in these modules will be described below.
Isotropic material is considered. It is assumed that no texture will be formed in laser forming induced microstructure change. It is assumed the stress induced by volume change accompanying phase transformations is small and therefore negligible. Grain size effect on flow stress is assumed to be negligible. This assumption is base on the previous observations. Shigenobu, et al. [26] and Senuma, et al. [25] found that peak strain ~p of a low carbon steel in torsion can be successfully predicted without considering grain size and its change. Some other studies have removed the grain size term [2] in low carbon steel material models. It is assumed that the material concerned is an aggregated structure of several phases and the contributions of each phase are independent of each other. Therefore, the properties of the multiphase alloy will be a weighted average of the individual phases. In this paper, it is assumed that the phases are subject to equal strain and the material stress is obtained from the weighted average of phase stresses.
IV
o" = ~_, (X j .c r j ) (1) l
/=1
where ¢r is the total stress. Xj and ~ are the volume fraction and stress of thejth phase of the material, respectively. Finally, it is assume that deformation and microstructure induced heat is negligible. The temperature dependence of the material
2
properties such as the modulus of elasticity, heat transfer properties, thermal conductivity, and specific heat follow Bao & Yao [6] and Li & Yao [14].
2.2 Recoverylrecrystallization modeling The relationship between the stress-strain curve
configuration and corresponding structural event is known from numerous experimental studies covering a brood spectrum of metals. Following the approach of Laasraoui and Jonas [12], the stress strain curve is divided into two regions: the region before the critical strain ~ where work hardening and dynamic recovery is the predominant mechanism, and the region after the critical strain where dynamic recovery and dynamic recrystallization act together with recrystallization more dominant.
Work hardening and dynamic recovery (~ < ~=). The classical approach to modeling the flow stress in this regime consists of the following expression [7], which considers work hardening and dynamic recovery.
where ~ represents the flow stress in this regime when dynamic recove,ry was the only softening mechanism, o-0 is the initial stress, Gss is the imaged steady state stress when strain is infinite, and / 2 represents the ease of dynamic recovery, o-0 and o-ss are determined by the modified hyperbolic sine law (Jonas, et. al., 1969) given T and ~ values from the FEM model.
where material dependent coefficients A, u, Qda and n are determined by means of regression analysis of experimental data. For AISI 1012 steel used in this paper, values of these coefficients based on experimental data by Anderson and Evans [2] are listed in Appendix for both ferrite and austenite phases. /2 is expressed in form of
f2 = K . ~ ' d ~ exp(~T ) (4)
where K, nl, n2 and O are material constants. Since it is assumed that the effect of grain size do is negligible, n2 is taken to be zero. Values of these constants for AISI 1012 steel are determined based on the experimental result from Anderson and Evans [2] by means of the least square method and are listed in Appendix.
Recrystallization (~ > ~.|. The fraction of completeness of recrystallization is represented by
X d - , = 1-exp - K d c - ~ c (5) t, )] G s s - - O - s s
which is arranged to obtain flow stress
Copyright © 2001 by ASME
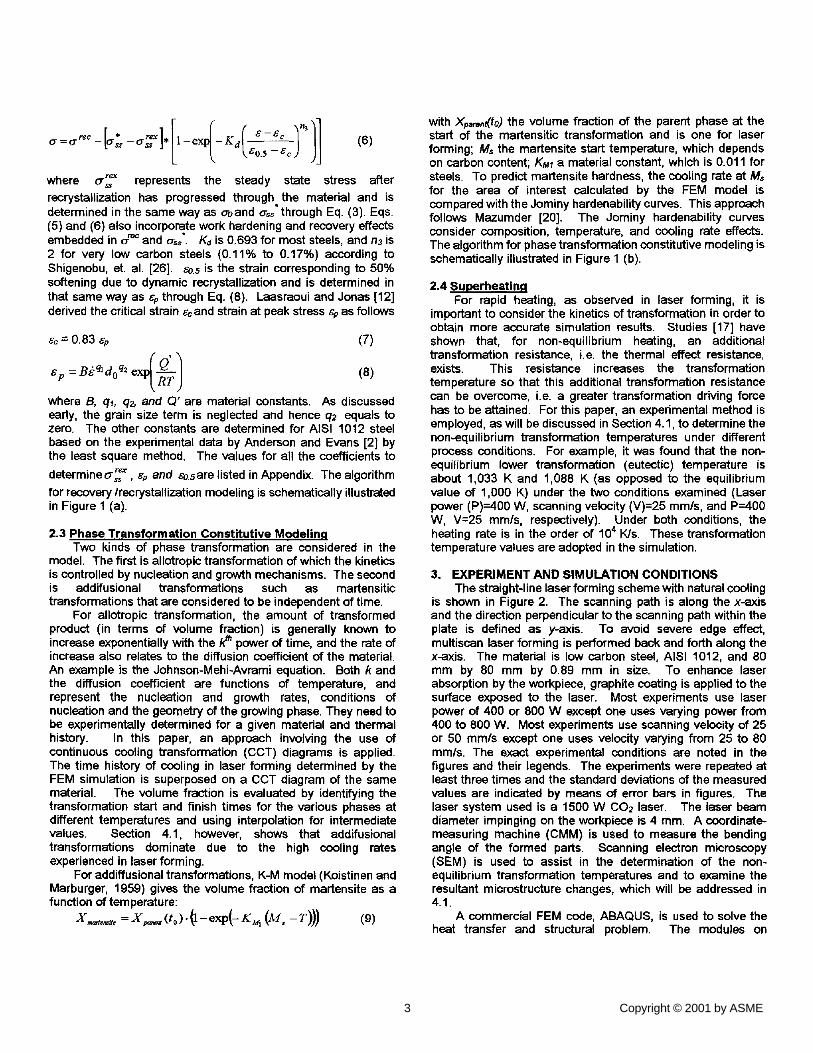
rex represents the steady state stress after where o-ss recrystallization has progressed through, the material and is determined in the same way as o-oand ~r,s through Eq. (3). Eqs. (5) and (6) also incorporate work hardening and recovery effects embedded in o/~ and ~rs,*. Ka is 0.693 for most steels, and n3 is 2 for very low carbon steels (0.11% to 0.17%) according to Shigenobu, et. al. [26]. 60.5 is the strain corresponding to 50% softening due to dynamic recrystallization and is determined in that same way as sp through Eq. (8). Laasraoui and Jonas [12] derived the critical strain 6cand strain at peak stress 6p as follows
= 0.83 6-p (7)
O~p = B,~ q~ do q~ exp (8)
where B, q~, q2, and Q" are material constants. As discussed early, the grain size term is neglected and hence q2 equals to zero. The other constants are determined for AISI 1012 steel based on the experimental data by Anderson and Evans [2] by the least square method. The values for all the coefficients to
• r e x determme~ss , 6p and so.5are listed in Appendix. The algorithm for recovery/recrystallization modeling is schematically illustrated in Figure 1 (a).
2.3 Phase Transformation Constitutive Modelin,q Two kinds of phase transformation are considered in the
model. The first is allotropic transformation of which the kinetics is controlled by nucleation and growth mechanisms. The second is addifusional transformations such as martensitic transformations that are considered to be independent of time•
For allotropic transformation, the amount of transformed product (in terms of volume fraction) is generally known to increase exponentially with the k th power of time, and the rate of increase also relates to the diffusion coefficient of the material. An example is the Johnson-Mehi-Avrami equation. Both k and the diffusion coefficient are functions of temperature, and represent the nucleation and growth rates, conditions of nucleation and the geometry of the growing phase• They need to be experimentally determined for a given material and thermal history. In this paper, an approach involving the use of continuous cooling transformation (CCT) diagrams is applied. The time history of cooling in laser forming determined by the FEM simulation is superposed on a CCT diagram of the same material. The volume fraction is evaluated by identifying the transformation start and finish times for the various phases at different temperatures and using interpolation for intermediate values. Section 4.1, however, shows that addifusional transformations dominate due to the high cooling rates experienced in laser forming.
For addiffusional transformations, K-M model (Koistinen and Marburger, 1959) gives the volume fraction of martensite as a function of temperature:
-r))) (9)
3
with Xp,~,nKto) the volume fraction of the parent phase at the start of the martensitic transformation and is one for laser forming; Ms the martensite start temperature, which depends on carbon content; KM~ a material constant, which is 0.011 for steels. To predict martensite hardness, the cooling rate at Ms for the area of interest calculated by the FEM model is compared with the Jominy hardenability curves. This approach follows Mazumder [20]. The Jominy hardenability curves consider composition, temperature, and cooling rate effects. The algorithm for phase transformation constitutive modeling is schematically illustrated in Figure 1 (b).
2.4 ,Superheatina For rapid heating, as observed in laser forming, it is
important to consider the kinetics of transformation in order to obtain more accurate simulation results. Studies [17] have shown that, for non-equilibrium heating, an additional transformation resistance, i.e. the thermal effect resistance, exists. This resistance increases the transformation temperature so that this additional transformation resistance can be overcome, i.e. a greater transformation driving force has to be attained. For this paper, an experimental method is employed, as will be discussed in Section 4.1, to determine the non-equilibrium transformation temperatures under different process conditions. For example, it was found that the non- equilibrium lower transformation (eutectic) temperature is about 1,033 K and 1,088 K (as opposed to the equilibrium value of 1,000 K) under the two conditions examined (Laser power (P)=400 W, scanning velocity (V)=25 mm/s, and P=400 W, V=25 minis, respectively). Under both conditions, the heating rate is in the order of 104 K/s. These transformation temperature values are adopted in the simulation.
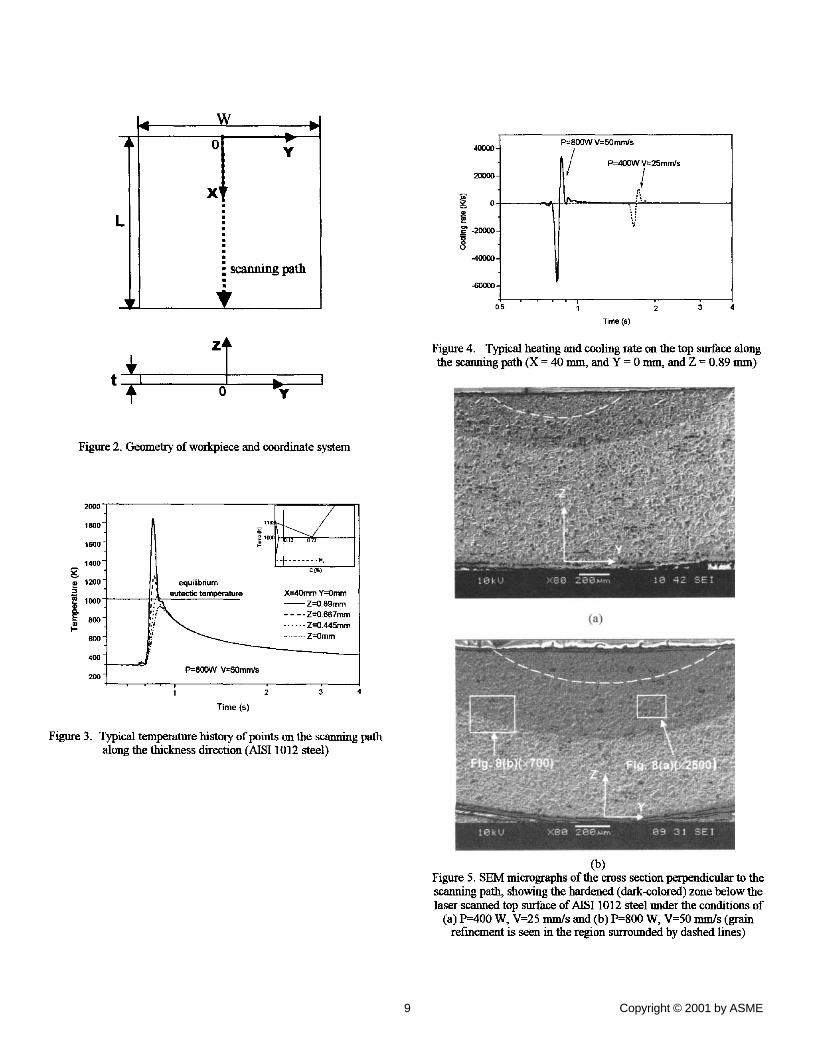
3. EXPERIMENT AND SIMULATION CONDITIONS The straight-line laser forming scheme with natural cooling
is shown in Figure 2. The scanning path is along the x-axis and the direction perpendicular to the scanning path within the plate is defined as y-axis. To avoid severe edge effect, multiscan laser forming is performed back and forth along the x-axis. The material is low carbon steel, AISI 1012, and 80 mm by 80 mm by 0.89 mm in size. To enhance laser absorption by the workpiece, graphite coating is applied to the surface exposed to the laser. Most experiments use laser power of 400 or 800 W except one uses varying power from 400 to 800 W. Most experiments use scanning velocity of 25 or 50 mm/s except one uses velocity varying from 25 to 80 mm/s. The exact experimental conditions are noted in the figures and their legends. The experiments were repeated at least three times and the standard deviations of the measured values are indicated by means of error bars in figures. The laser system used is a 1500 W CO2 laser. The laser beam diameter impinging on the workpiece is 4 mm. A coordinate- measuring machine (CMM) is used to measure the bending angle of the formed parts. Scanning electron microscopy (SEM) is used to assist in the determination of the non- equilibrium transformation temperatures and to examine the resultant microstructure changes, which will be addressed in 4.1.
A commercial FEM code, ABAQUS, is used to solve the heat transfer and structural problem. The modules on
Copyright © 2001 by ASME
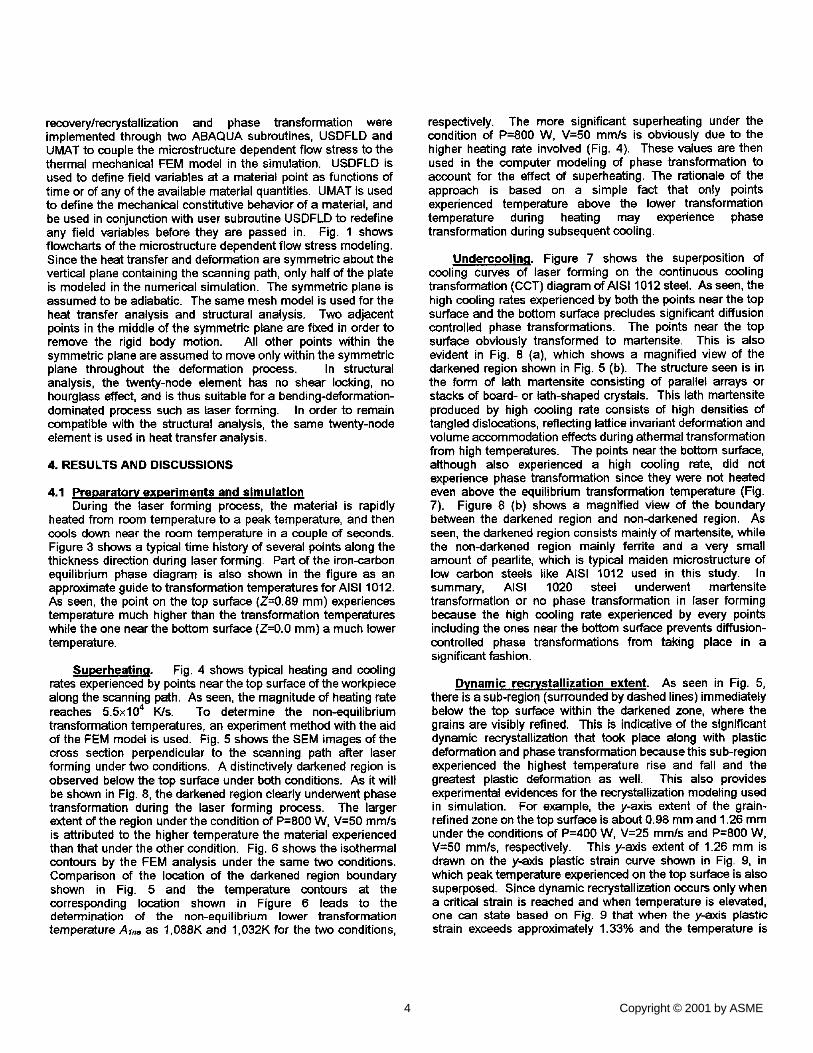
recovery/recrystallization and phase transformation were implemented through two ABAQUA subroutines, USDFLD and UMAT to couple the microstructure dependent flow stress to the thermal mechanical FEM model in the simulation. USDFLD is used to define field variables at a material point as functions of time or of any of the available material quantities. UMAT is used to define the mechanical constitutive behavior of a material, and be used in conjunction with user subroutine USDFLD to redefine any field variables before they are passed in. Fig. 1 shows flowcharts of the microstructure dependent flow stress modeling. Since the heat transfer and deformation are symmetric about the vertical plane containing the scanning path, only half of the plate is modeled in the numerical simulation. The symmetric plane is assumed to be adiabatic. The same mesh model is used for the heat transfer analysis and structural analysis. Two adjacent points in the middle of the symmetric plane are fixed in order to remove the rigid body motion. All other points within the symmetric plane are assumed to move only within the symmetric plane throughout the deformation process. In structural analysis, the twenty-node element has no shear locking, no hourglass effect, and is thus suitable for a bending-deformation- dominated process such as laser forming. In order to remain compatible with the structural analysis, the same twenty-node element is used in heat transfer analysis.
4. RESULTS AND DISCUSSIONS
4.1 Preparatory experiments and simulation During the laser forming process, the material is rapidly
heated from room temperature to a peak temperature, and then cools down near the room temperature in a couple of seconds. Figure 3 shows a typical time history of several points along the thickness direction during laser forming. Part of the iron-carbon equilibrium phase diagram is also shown in the figure as an approximate guide to transformation temperatures for AISI 1012. As seen, the point on the top surface (Z=0.89 ram) experiences temperature much higher than the transformation temperatures while the one near the bottom surface (Z=0.0 mm) a much lower temperature.
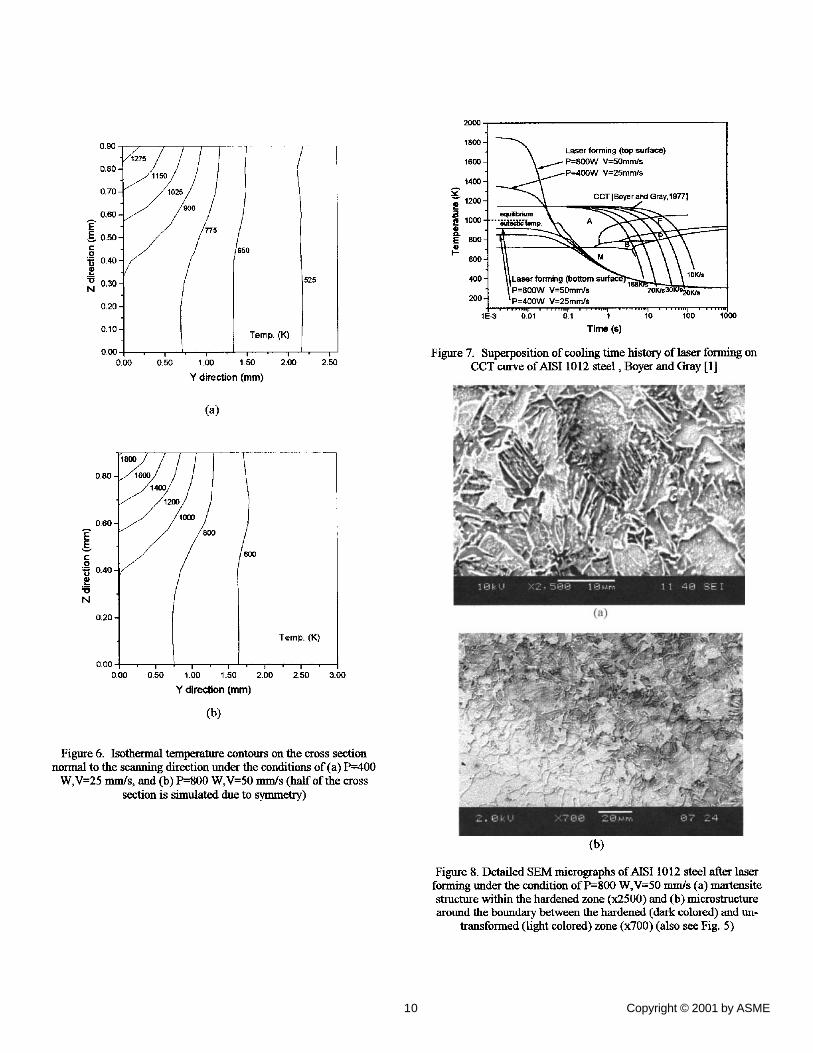
Superheatin,q. Fig. 4 shows typical heating and cooling rates experienced by points near the top surface of the workpiece along the scanning path. As seen, the magnitude of heating rate reaches 5.5x10⁴ Yds. To determine the non-equilibrium transformation temperatures, an experiment method with the aid of the FEM model is used. Fig. 5 shows the SEM images of the cross section perpendicular to the scanning path after laser forming under two conditions. A distinctively darkened region is observed below the top surface under both conditions. As it will be shown in Fig. 8, the darkened region clearly underwent phase transformation during the laser forming process. The larger extent of the region under the condition of P=800 W, V=50 mm/s is attributed to the higher temperature the material experienced than that under the other condition. Fig. 6 shows the isothermal contours by the FEM analysis under the same two conditions. Comparison of the location of the darkened region boundary shown in Fig. 5 and the temperature contours at the corresponding location shown in Figure 6 leads to the determination of the non-equilibrium lower transformation temperature Alne as 1,088K and 1,032K for the two conditions,
4
respectively. The more significant superheating under the condition of P=800 W, V=50 mm/s is obviously due to the higher heating rate involved (Fig. 4). These values are then used in the computer modeling of phase transformation to account for the effect of superheating. The rationale of the approach is based on a simple fact that only points experienced temperature above the lower transformation temperature during heating may experience phase transformation during subsequent cooling.
Undercooling. Figure 7 shows the superposition of cooling curves of laser forming on the continuous cooling transformation (CCT) diagram of AIS11012 steel. As seen, the high cooling rates experienced by both the points near the top surface and the bottom surface precludes significant diffusion controlled phase transformations. The points near the top surface obviously transformed to martensite. This is also evident in Fig. 8 (a), which shows a magnified view of the darkened region shown in Fig. 5 (b). The structure seen is in the form of lath martensite consisting of parallel arrays or stacks of board- or lath-shaped crystals. This lath martensite produced by high cooling rate consists of high densities of tangled dislocations, reflecting lattice invariant deformation and volume accommodation effects during athermal transformation from high temperatures. The points near the bottom surface, although also experienced a high cooling rate, did not experience phase transformation since they were not heated even above the equilibrium transformation temperature (Fig. 7). Figure 8 (b) shows a magnified view of the boundary between the darkened region and non-darkened region. As seen, the darkened region consists mainly of martensite, while the non-darkened region mainly ferrite and a very small amount of pearlite, which is typical maiden microstructure of low carbon steels like AISI 1012 used in this study. In summary, AISI 1020 steel underwent martensite transformation or no phase transformation in laser forming because the high cooling rate experienced by every points including the ones near the bottom surface prevents diffusion- controlled phase transformations from taking place in a significant fashion.
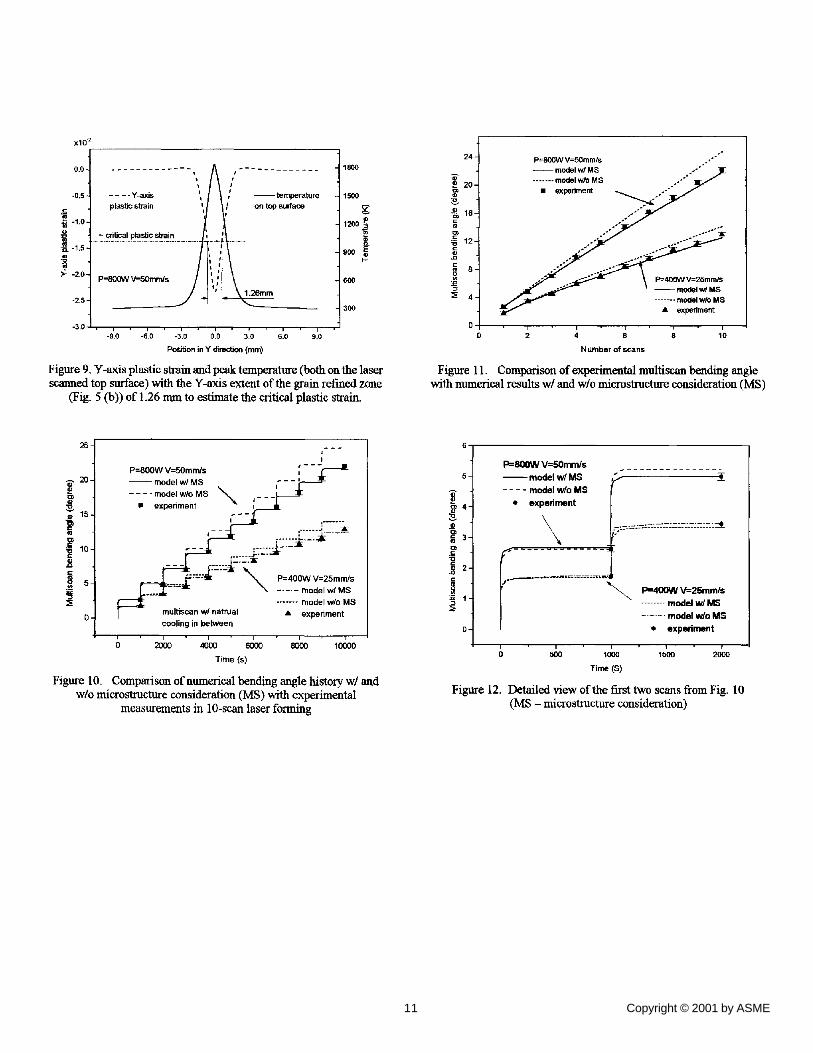
Dynamic recrystallization extent. As seen in Fig. 5, there is a sub-region (surrounded by dashed lines) immediately below the top surface within the darkened zone, where the grains are visibly refined. This is indicative of the significant dynamic recrystallization that took place along with plastic deformation and phase transformation because this sub-region experienced the highest temperature rise and fall and the greatest plastic deformation as well. This also provides experimental evidences for the recrystallization modeling used in simulation. For example, the y-axis extent of the grain- refined zone on the top surface is about 0.98 mm and 1.26 mm under the conditions of P=400 W, V=25 mm/s and P=800 W, V=50 mm/s, respectively. This y-axis extent of 1.26 mm is drawn on the y-axis plastic strain curve shown in Fig. 9, in which peak temperature experienced on the top surface is also superposed. Since dynamic recrystallization occurs only when a critical strain is reached and when temperature is elevated, one can state based on Fig. 9 that when the y-axis plastic strain exceeds approximately 1.33% and the temperature is
Copyright © 2001 by ASME

approximately above 1,400K, dynamic recrystallization is significant. Note that note this statement is valid because the y- axis plastic strain is typically several orders of magnitude higher than the plastic strains along other directions.
4.2 Prediction of geometry change with microstructure consideration
Multiscan. Figure 10 shows the comparison of experimentally measured bending angles with simulation results based on models with and without microstructure consideration for a 10- scan laser forming process under two conditions (P=800 W, V=50 mm/s, and P=400 W, V=25 mm/s). The scans were carried out along the same scanning path with alternate directions in order to minimize the edge effect. Enough time was allowed between scans in both experiments and simulation in order for material to cool down near the room temperature. In practice, forced cooling is normally used to speed up the multiscan process (Cheng and Yao, 2000). The model without microstructure changes considers only the effects of temperature, strain rate and work hardening on flow stress, while the model with microstructure change considers softening mechanisms of dynamic recovery and recrystallization, as well as the effect of phase transformation on the flow stress, in addition to the effects already considered above. The details of the model with microstructure change are discussed in Section 2, and the values of the coefficients used in the modeling are listed in Appendix.
It is seen from Fig. 10 that there is not much difference between the predicated angles by the two models for the first scan. However, with increasing number of scans, the difference widens. The bending angle predicted by the model with microstructure consideration matches experimental measurements better. The model without microstructure consideration underestimates the flow stress and thus overestimates the bending angle. This is because the model does not consider the effects of microstructure change on the flow stress. More revealing is that the softening effects due to recovery and recrystallization are out-weighted by the hardening effects due to martensite transformation near the top surface. The net effect of microstructure change in laser forming of steels, therefore, is hardening and thus increase of the flow stress. This is consistent with what will be discussed in Section 4.3. Another observation is that the discrepancy between the models with and without microstructure consideration is larger under the condition of P=800 W and V---50 mm/s than that under the other condition. This is primarily due to the much higher cooling rate experienced under the former condition (Fig. 4), which favors more martensite transformation and thus makes the net effect of hardening greater as compared with that under the other condition. More detailed analysis follows in the next paragraph in which the first two scans are closely examined. The steady-state bending angle values predicted by the models with and without microstructure consideration shown in Fig. 10 are extracted and compared with experimental results in Fig. 11 for greater clarity.
First scans. The first two scans shown in Figure 10 are magnified in Figure 12 for more detailed analysis. It is seen that under the condition of P=800 W and V=50 mm/s, the hardening effect due to martensite transformation was not as significant as
5
the softening effect due to dynamic recovery and recrystallization in the first scan but quickly surpassed the latter in the second scan. Contrary to that, the net hardening effect under the condition of P=400 W and V=25 mm/s accumulated in a more graduate fashion. This is because that martensite did not exit at the beginning of the first scan but already exited at the beginning of the second and subsequent scans. This made the softening effect due to dynamic recovery /recrystallization more dominant in the first scan, especially under the condition of P=800 W and V=50 mm/s where the recrystallization zone was larger, the recrystallization more complete, and the hardened zone larger too (Fig. 5 (b)). As a result, the model without microstructure consideration even slightly underestimated the bending angle in the first scan under this condition. Under the condition of P=400 W and V=25 mm/s, both the hardened and recrystallization zones were smaller (Fig. 5 (a)), and thus the absence of martensite at the beginning of the first scan did not make the net hardening effect in the first scan much different from that in the subsequent scans. As a result, the model without microstructure consideration slightly overestimated the bending angle in the first scan under this condition and the overestimate increased moderately in the second scan.
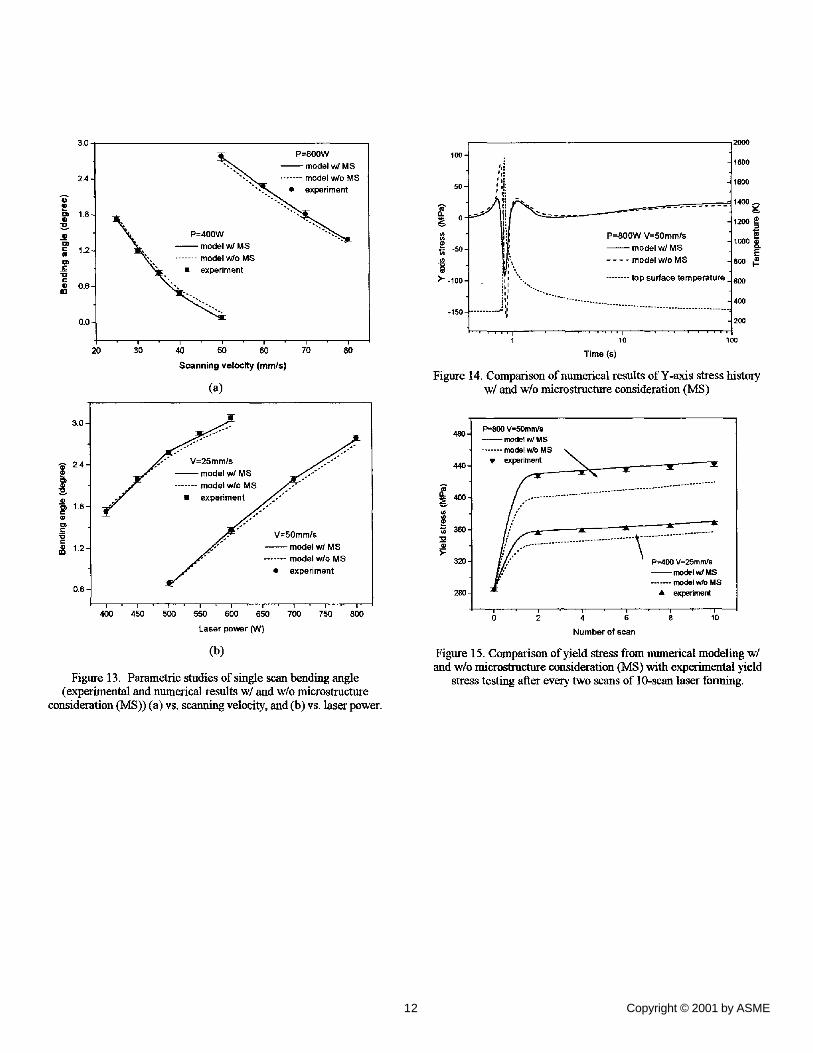
Parametric studies. Fig. 13 compare numerical results of the two models with experimental measurements under a wide range of conditions for a single scan. The experimental results agree with the one with microstructure consideration better. As seen, the difference between the predicted values by the two models is not great for single scan forming processes. In general, the bending angle with microstructure consideration is slightly smaller than that without microstructure consideration at laser power of 400W, while the bending angle with microstructure consideration is slightly larger than that without microstructure consideration at high laser power levels. The reason for that has been explained in the last paragraph.
4.3 Effect of microstructure consideration on mechanical property predict ion
Figure 14 shows a typical y-axis stress history experienced by a point on the top surface along the scanning path in a single scan laser forming process as predicted by the two models. The pattern of being tensile first and then significantly compressive before returning to slightly tensile has been well understood and explained in great details in previous literatures. It is pointed out here that the stress with microstructure consideration shoots significantly less in both tensile and compressive directions than that without microstructure consideration. This is because the model with microstructure consideration takes dynamic recrystallization into account, which has a softening effect. When the laser beam passes the point and the material starts cooling down, the model with microstructure consideration takes into account the material transformation into martensite. As a result, the compressive stress reverses its direction at about -100 MPa as opposed to about -150MPa predicted by the model without microstructure consideration. Figure 15 compares the yield stress after every two scans from experiment with the prediction from modeling result with and without microstructure
Copyright © 2001 by ASME
consideration. The experimental results agree with the one with microstructure consideration better. This further demonstrates why the model with microstructure consideration can predict the bending angle better.
5. CONCLUSION A fundamentally based and empirically calibrated flow stress
model for the laser forming process of a low carbon steel has been presented in this article. The effects of strain hardening, dynamic recovery and recrystallization, superheating, and phase transformation have been considered. Application of the present model in the prediction of geometry and mechanical properties in multiscan laser forming has demonstrated significant improvement in accuracy over the model without microstructure considerations. Incorporated with FEM, the present model serves as an enabler for the analysis and design of practical three-dimensional laser forming, where multiscan is necessary.
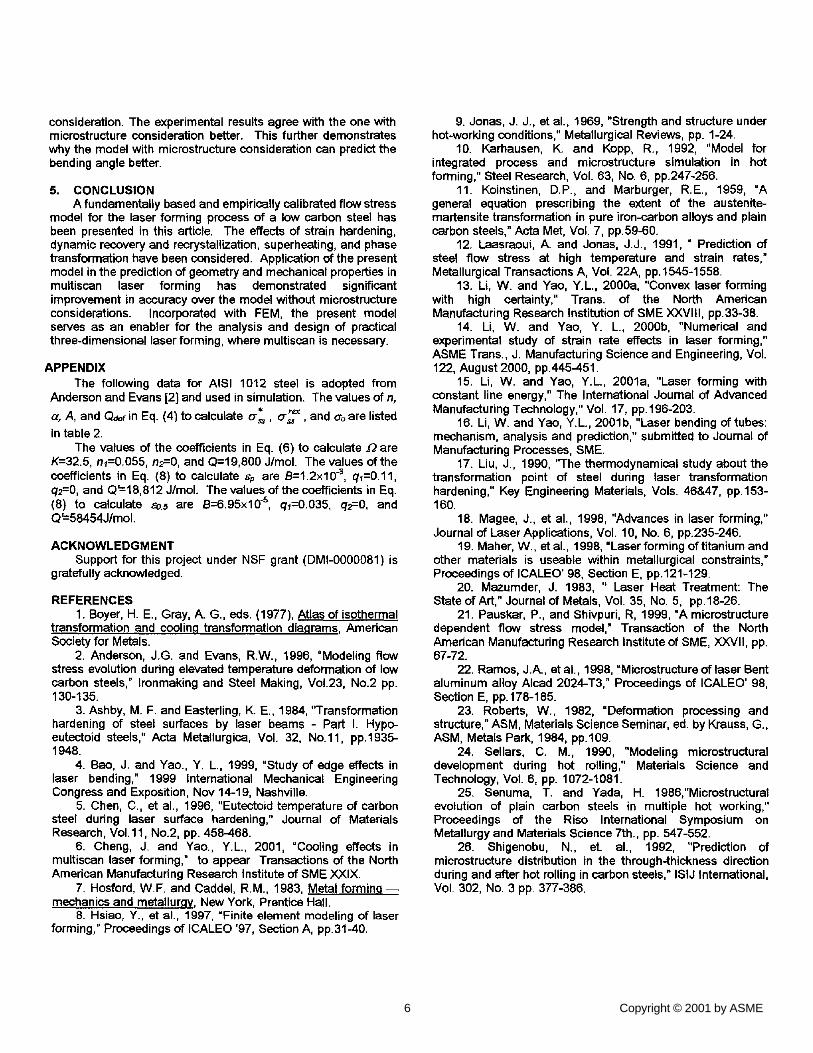
APPENDIX The following data for AISI 1012 steel is adopted from
Anderson and Evans [2] and used in simulation. The values of n, r e x a, A, and Qdef in Eq. (4) to calculate o-s~, ¢rss , and o'o are listed
in table 2. The values of the coefficients in Eq. (6) to calculate ~ are
K=32.5, n1=0.055, n2=0, and Q=19,800 J/mol. The values of the coefficients in Eq. (8) to calculate 6p are B=1.2×10 "3, q1=0.11, q2=0, and Q~-18,812 J/mol. The values of the coefficients in Eq. (8) to calculate ~o.5 are B=6.95×10 ~s, q1=0.035, q2=0, and Q~-58454J/mol.
ACKNOWLEDGMENT Support for this project under NSF grant (DMI-0000081) is
gratefully acknowledged.
REFERENCES 1. Boyer, H. E., Gray, A. G., eds. (1977), Atlas of isothermal
transformation and cooling transformation diagrams, American Society for Metals.
2. Anderson, J.G. and Evans, R.W., 1996, =Modeling flow stress evolution during elevated temperature deformation of low carbon steels," Ironmaking and Steel Making, Vol.23, No.2 pp. 130-135.
3. Ashby, M. F. and Easterling, I~ E., 1984, "Transformation hardening of steel surfaces by laser beams - Part I. Hypo- eutectoid steels," Acta Metallurgica, Vol. 32, No.11, pp.1935- 1948.
4. Bao, J. and Yao., Y. L., 1999, "Study of edge effects in laser bending," 1999 International Mechanical Engineering Congress and Exposition, Nov 14-19, Nashville.
5. Chen, C., et al., 1996, "Eutectoid temperature of carbon steel during laser surface hardening," Journal of Materials Research, Vol. 11, No.2, pp. 458-468.
6. Cheng, J. and Yao., Y.L., 2001, "Cooling effects in multiscan laser forming," to appear Transactions of the North American Manufacturing Research Institute of SME XXIX.
7. Hosford, W.F. and Caddel, R.M, 1983, M.etal forming-- mechanics and metallurgy, New York, Prentice Hall.
8. Hsiao, Y., et al., 1997, "Finite element modeling of laser forming," Proceedings of ICALEO '97, Section A, pp.31-40.
6
9. Jonas, J. J., et al., 1969, "Strength and structure under hot-working conditions," Metallurgical Reviews, pp. 1-24.
10. Karhausen, K. and Kopp, R., 1992, "Model for integrated process and microstructure simulation in hot forming," Steel Research, Vol. 63, No. 6, pp.247-256.
11. Koinstinen, D.P., and Marburger, R.E., 1959, =A general equation prescribing the extent of the austenite- martensite transformation in pure iron-carbon alloys and plain carbon steels," Acta Met, Vol. 7, pp.59-60.
12. Laasraoui, A. and Jonas, J.J., 1991, " Prediction of steel flow stress at high temperature and strain rates," Metallurgical Transactions A, Vol. 22A, pp.1545-1558.
13. Li, W. and Yao, Y.L., 2000a, "Convex laser forming with high certainty," Trans. of the North American Manufacturing Research Institution of SME XXVIII, pp.33-38.
14. Li, W. and Yao, Y. L., 2000b, "Numerical and experimental study of strain rate effects in laser forming," ASME Trans., J. Manufacturing Science and Engineering, Vol. 122, August 2000, pp.445-451.
15. Li, W. and Yao, Y.L., 2001a, "Laser forming with constant line energy," The International Journal of Advanced Manufacturing Technology," Vol. 17, pp. 196-203.
16. Li, W. and Yao, Y.L., 2001b, "Laser bending of tubes: mechanism, analysis and prediction," submitted to Journal of Manufacturing Processes, SME.
17. Liu, J., 1990, "The thermodynamical study about the transformation point of steel during laser transformation hardening," Key Engineering Materials, Vols. 46&47, pp.153- 160.
18. Magee, J., et al., 1998, "Advances in laser forming," Journal of Laser Applications, Vol. 10, No. 6, pp.235-246.
19. Maher, W., et al., 1998, "Laser forming of titanium and other materials is useable within metallurgical constraints," Proceedings of ICALEO' 98, Section E, pp.121-129.
20. Mazumder, J. 1983, " Laser Heat Treatment: The State of Art," Journal of Metals, Vol. 35, No. 5, pp.18-26.
21. Pauskar, P., and Shivpuri, R, 1999, "A microstructure dependent flow stress model," Transaction of the North American Manufacturing Research Institute of SME, XXVII, pp. 67-72.
22. Ramos, J.A., et al., 1998, =Microstructure of laser Bent aluminum alloy Alcad 2024-T3," Proceedings of ICALEO' 98, Section E, pp.178-185.
23. Roberts, W., 1982, "Deformation processing and structure," ASM, Materials Science Seminar, ed. by Krauss, G., ASM, Metals Park, 1984, pp.109.
24. Sellars, C. M., 1990, "Modeling microstructural development during hot rolling," Materials Science and Technology, Vol. 6, pp. 1072-1081.
25. Senuma, T. and Yada, H. 1986,"Microstructural evolution of plain carbon steels in multiple hot working," Proceedings of the Riso International Symposium on Metallurgy and Materials Science 7th., pp. 547-552.
26. Shigenobu, N., et. al., 1992, "Prediction of microstructure distribution in the through-thickness direction during and after hot rolling in carbon steels," ISIJ International, VoI. 302, No. 3 pp. 377-386.
Copyright © 2001 by ASME
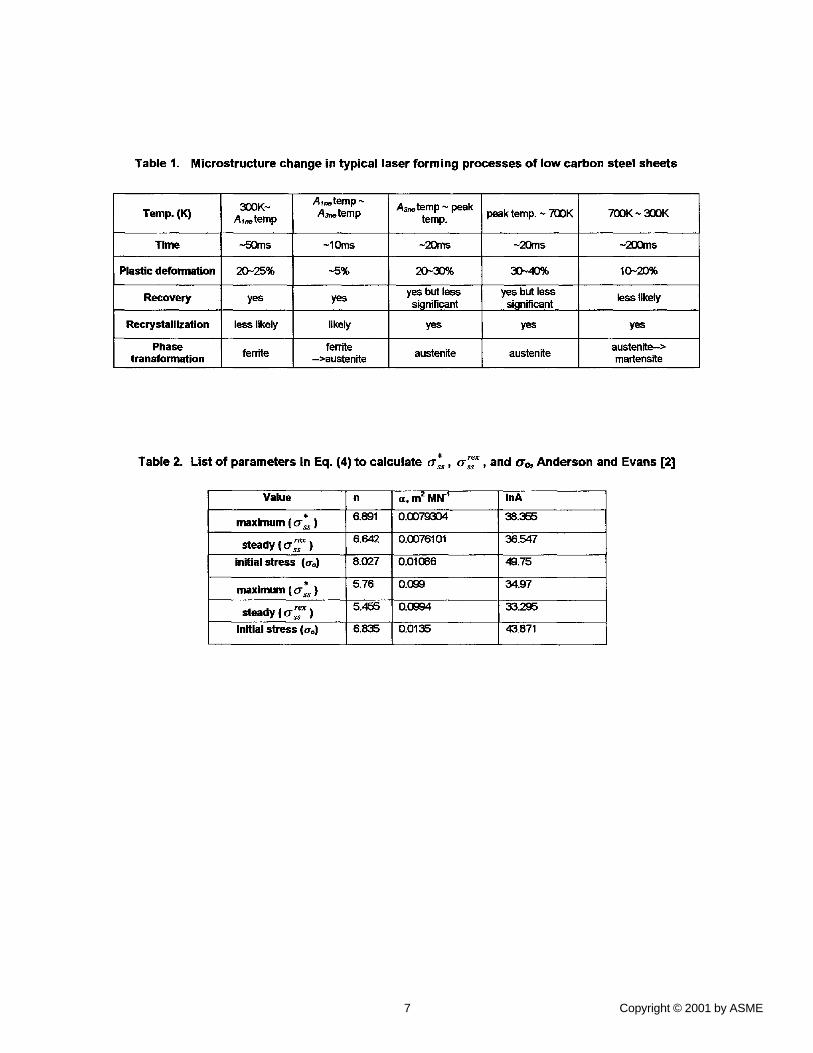
Table 1. M ic ros t ruc tu re change in typ ica l laser f o rm ing processes o f l ow carbon steel sheets
300K~ A,~temp ~ A3,~temp ~ peak Temp. (K) Al,~,temp A3~temp temp. peak temp. ~ 700K 700K ~ 300K
Time ~-J~ms ~lOres ~20ms ~20rns ~200ms
Plastic deformation 20-25% -5% 20--30% 30~40% 10--20%
Recovery yes yes less likely
Recrystallization
Phase t ransformat ion
less likely
ferrite
likely
ferrite ->aus~enite
yes but less significant
yes
austenite
yes but less significant
yes
austenite
yes
austenite-> martensite
Table 2. L is t o f parameters in Eq. (4) t o ca lcu la te o-~s, < T ~ , and O'o, Ande rson and Evans [2]
Value n
* 6.891 maximum ( O'ss )
6.642 steady ( 0 " ~ )
a , m z MN "1 InA
0.0079304 38.355
0.0076101 36.547
initial stress ((To) 8.027
* 5.76 maximum ( O'ss ) steady ( o'~ ~ ) 5.455
initial stress ((To) 6.835
0.01086 49.75
0.099 34.97
0.0994 33.295
0.0135 43.871
7 Copyright © 2001 by ASME
~l FEM simulation output: [ "l ti, Ti, ~ , ~i I
I compute ¢c(~ T~ I
determine work hardening/ dynamic recovery kinetics
n o
I ~omp~te now ~tress ~j I
volume fraction input Xj from Figure l(b)
I I
determine recrystallization/ recovery kinetics
compute
(a)
heating
1 determine I
T adjust equilibrium
phase diagram I ~ I I computevolmne[ ["cleterrn [ fractionXj from I I fracti,
• I K- M model I I CC determine [
volume fraction Xj]
I
FEM simulation output: I cooling t,, T~, ATJAti [ J_
I ICCT curvel addittusional I diffusional /
"cletermine voh fraction Xj fro
CCT curve ~from I
curve I
output data to Figure l(a)
(b) Figure 1. Algorithm for (a) recovery/recrystallization, and (b) ~h phase transformation constitutive modeling (indexj denotes thej phase)
8 Copyright © 2001 by ASME
L
< W
:1 Y
: scanning path
¢
t ~" ZT ¢ o =v
Figure 2. Geometry ofworkpiece and coordinate system
20O0
1800"
1600"
1400"
o 1200"
1000"
Q 8 0 0 "
41111"
2 0 0 "
equilibrium i eutectic temperature X--4Omm Y=Omm
- - Z=O.Sgmm
. . . . Z=O.667mm
. . . . . . Z=O.445mm
. . . . . . . Z=Omm
P=8OOW V=5Omm/s
i 1 2 3
Time {s)
Figure 3. Typical temperature history of points on the scanning path along the thickness direction (AISI 1012 steel)
9
• r,'. ~'X . . . . . : : ' " " . " ~ : ' = " ":" ~ : / ' : " ~i--'~ ~ ~
.~ - - • - . . . . . . : . . . . . . . . . . , i ~ . ~ ,
IEI~ ' • ,3E" 2E'r~.r. I,-~ 4Z £EI
• 0 • - . . . 41
P=8OOW V=5Omm/s
p=_400Wi=25mrrY s
_ f.... " . . ,
I : -j
0.~ ; ~ Time (s)
Figure 4. Typical heating and cooling rate on the top surface along the scanning path (X = 40 mm, and Y = 0 mm, and Z = 0.89 mm)
(a)
(b) Figure 5. SEM micrographs of the cross section perimndicular to the scanning path, showing the hardened (dark-colored) zone below the laser scanned top surface of AISI 1012 steel under the conditions of
(a) P--400 W, V=25 mm/s and (b) P=-800 W, V=50 mm/s (grain refinement is seen in the region surrounded by dashed lines)
Copyright © 2001 by ASME
0.90
I 0"60" ~ 1 ' 1 ~ / / o.,o.. /,025/ /
o.oo_ . / :o/ ~,~ 0.50 - / / 7 " / 5
" 150 "- 0.40- I .
=o 0.30- 525
0.20
0"10 1 Temp. (K) 0 .00 | I , t I
0.00 0.50 1.00 1.50 2.00 2.50
Y direction (ram)
(a)
0.80.
0.60.
c- O ~'~ 0.40' f" O
N 0.20
OmO0 / 0.00
' I ' I ' I I
0.50 1.00 1.50 2.00 3.00
600
Y direction (mm)
(b)
Temp. (K)
, i 2,50
Figure 6. Isothermal temperature contours on the cross section normal to the scanning direction under the conditions of (a) P=400
W,V=25 ram/s, and (b) P=-800 W,V=50 mm/s (half of the cross section is simulated due to symmetry)
2000 -
1800 - - - ~ Laser forming (top surface)
1600- \ / P = 8 0 0 W V=50mrn/s _ ~ , . . ~ . ~ P=400W V=25mmls
1400-
~ t CCT [Boyer and Gray,1977]
1000-- equl ibdum
800- Q
400- Laser forming
200- P=400W V=25mm/s
1E-3 . . . . . . . . 0.011 . . . . . . . . 0.11 . . . . . . . . ~ . . . . . . . . . . . . . . . . 110 1001 . . . . . . . 1000
T i m e (s)
Figure 7. Superposition of cooling time history of laser forming on CCT curve of AISI 1012 steel, Boyer and Gray [1]
(a)
¢o)
Figure 8. Detailed SEM micrographs of AISI 1012 steel after laser forming under the condition of P=-800 W,V=50 mm/s (a) martensite structure within the hardened zone (x2500) and (b) microstructure around the boundary between the hardened (dark colored) and tin-
transformed (light colored) zone (x700) (also see Fig. 5)
10 Copyright © 2001 by ASME
xlO "~
0.0 . . . . . . . . . . . . . . ~ / / . . . . . . . . . . . . . 1800
-0.5 . . . . . Y-axis tt ~ t e m p e r a t u r e 1500 --=_ . plastic strain I / on top surface v ,
¢u -1.0- ~ 1200
._~ ~ ~ .1.5-. / , 'i)'! ~ ~ ' ' 900 ; -2.o- P--~OOWV=~On~ " :
-2.5 - - 31111
-3.0 " , -9~.0 -dO -3~.0 0'.0 310 610 910
Position in Y direction (mm)
Figure 9. Y-axis plastic slrain and peak temperature (b~th on the laser sca~ed top surface) with the Y-axis extent of the grain refined zone
(Fig. 5 (b)) of 1.26 mm to estimate the critical plastic strain.
2 5 - i - - -
P=8OOW V=5Omm/s ~, 20- - - model wl MS , ,,,, . . . . model w/o MS ~ _ _ _~
• experiment , ~r _~ is ---~t
-~ - - q r r _ " ~ - - - 11° . _ _ _ ,.2__~-'2-
:"-: '~ N P=4OOW V=25mm/s 5 - . ~ ' ~ = = ~ k ~ . . . . . model w / M S
" ~ . . . . . . . model w/o MS 0 - l multiscan wl natrual • e x p e r i m e n t
c o o l i n g in b e t w e e n
' ~ 0 o ' ' ~ o ' 0 4000 6000 10000
Time (s)
2 4
1 6 -
12-
"5
0 0
Figure 1 l.
P=8OOW V=5Omm/s , • °" model wl MS , - " " . , ~
. . . . . . . model w/o MS .-" ~ , ~ • experiment , o-"
• exper iment
i i i i I 0 2 4 6 8 1
N umber of s c a n s
Comparison of experimental multiscan bending angle with numerical results w/and w/o microstructttre consideration (MS)
J
P=8OOW V=5Omm/s . . . . . . . . . . . . . . . . 5 - - - model w / M S , f "
. . . . mode l w lo MS i
4 . • experiment |
3. _~___ ~.:~::"-':=:='-:':-:---:-':-'::""-~- •
Y F~-,tI~W V=25mm/s 1 - / ~ ' ~ ........ model w / M S /
" | . . . . . . mode l w/o MS 0 - | • e x p e r i m e n t
i i i I f 0 5OO IOO0 1500 2OOO
Time ($)
Figure lO. Comparison of numerical bending angle history w/and w/o microstructure consideration (MS) with experimental
measurements in lO-scan laser forming Figure 12. Detailed view of the first two scans from Fig. 10
(MS - microstructure consideration)
11 Copyright © 2001 by ASME
3.0
2.4
A o o m 1.8-
e
1.2- m
0.6-
20
3.0 "t
P=800W - - model wl MS
....... model W/eOMS
%'...
~, . - - model w/MS
J ~ , . - ...... model W/eOtMS
10 I I I I I
40 50 60 70 80
S c a n n i n g ve loc i t y (ram/s)
(a)
2.4]
==
1.8-
==
n~ 1.2-
0.6-
°*'°'"°"'''"°" S ' " " ] ~ - - model W/MS ~K~-'""
. ~ - . . . . . . . model wlo MS • e x p e d ~ . "
. ~ . " V=50mm/s .~.-" - - model w/MS
/ " - . . . . . mode! w/o MS • experiment
I I I • ' l • I I I • I • I
400 450 500 550 600 650 700 750 800
Laser power ON)
(b)
0"
==
-50. .-
>" -100-
-150"
I 1 O0 "1
JL:. Jl: I I:
50- i
, - " (i
'i P=8OOW V=5Omm/s
model w/MS . . . . model w/o MS
"'. - ....... top surface temperature
. . . . . I . . . . . . . . 1 1=0
Time (s)
!000
800
1600
1400
1200 ~
111110 ~ E
600
400
2O0
t00
Figure 14. Comparison of numerical results of Y-axis stress history w/and w/o microstructure consideration (MS)
P=-800 V=50mm/s 480- model w/MS
....... mode!w~.s \ 440. . e x ~
~ 400-
36O-
320
....... model w/o MS 280- • experiment
Number of scan
Figure 15. Comparison of yield stress from numerical modeling w/
Figure 13. Parametric studies of single scan bending angle (experimental and numerical results w/and w/o microstructure
consideration (MS)) (a) vs. scanning velocity, and (b) vs. laser power•
and w/o microstructure consideration (MS) with experimental yield stress testing after every two scans of lO-scan laser forming.
12 Copyright © 2001 by ASME