Embed Size (px)
Citation preview
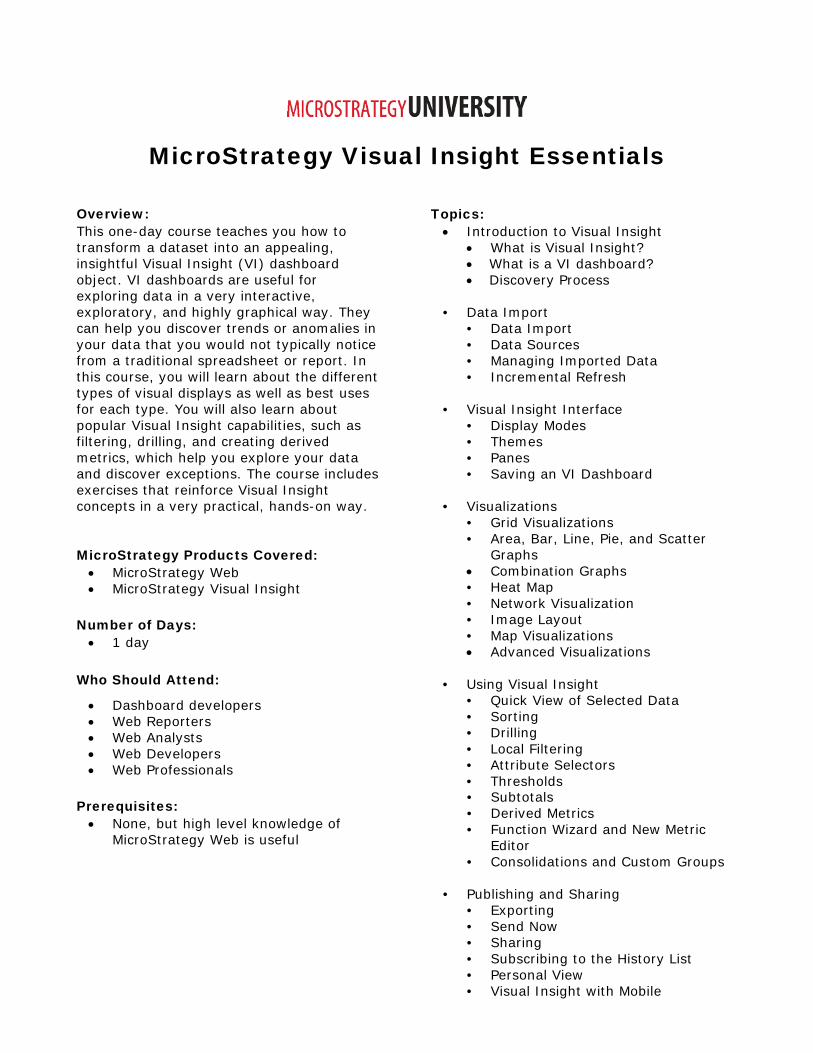
MicroStrategy Visual Insight Essentials Overview: This one-day course teaches you how to transform a dataset into an appealing, insightful Visual Insight (VI) dashboard object. VI dashboards are useful for exploring data in a very interactive, exploratory, and highly graphical way. They can help you discover trends or anomalies in your data that you would not typically notice from a traditional spreadsheet or report. In this course, you will learn about the different types of visual displays as well as best uses for each type. You will also learn about popular Visual Insight capabilities, such as filtering, drilling, and creating derived metrics, which help you explore your data and discover exceptions. The course includes exercises that reinforce Visual Insight concepts in a very practical, hands-on way. MicroStrategy Products Covered: • MicroStrategy Web • MicroStrategy Visual Insight
Number of Days: • 1 day
Who Should Attend:
• Dashboard developers • Web Reporters • Web Analysts • Web Developers • Web Professionals
Prerequisites: • None, but high level knowledge of
MicroStrategy Web is useful
Topics: • Introduction to Visual Insight
• What is Visual Insight? • What is a VI dashboard? • Discovery Process
• Data Import
• Data Import • Data Sources • Managing Imported Data • Incremental Refresh
• Visual Insight Interface
• Display Modes • Themes • Panes • Saving an VI Dashboard
• Visualizations
• Grid Visualizations • Area, Bar, Line, Pie, and Scatter
Graphs • Combination Graphs • Heat Map • Network Visualization • Image Layout • Map Visualizations • Advanced Visualizations
• Using Visual Insight
• Quick View of Selected Data • Sorting • Drilling • Local Filtering • Attribute Selectors • Thresholds • Subtotals • Derived Metrics • Function Wizard and New Metric
Editor • Consolidations and Custom Groups
• Publishing and Sharing
• Exporting • Send Now • Sharing • Subscribing to the History List • Personal View • Visual Insight with Mobile