Embed Size (px)
Citation preview
MicroStrategy v 9.3 upgrade for IDIS Reporting
November 2013
Agenda • Overview of new interface • Execution of reports and common functionality
– Export – Page-by – Totals & Sort – History List and Subscriptions
• New features – Live search / Quick search – Creating Personal View – Dynamic Visual Thresholds – Export individual grids/graphs from within your
dashboards
2
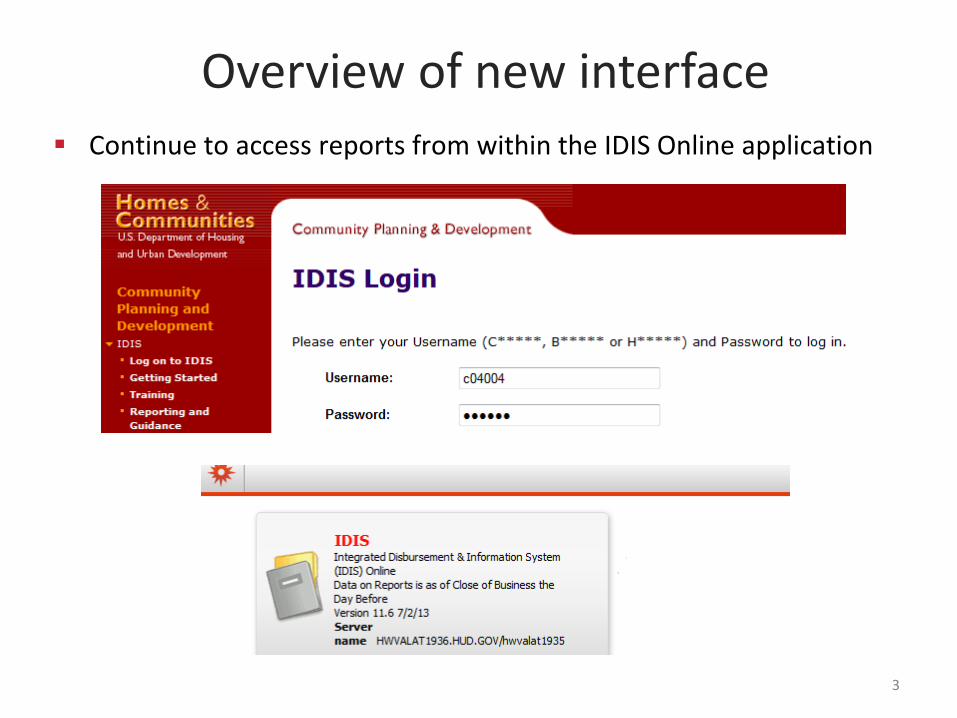
Overview of new interface Continue to access reports from within the IDIS Online application
3
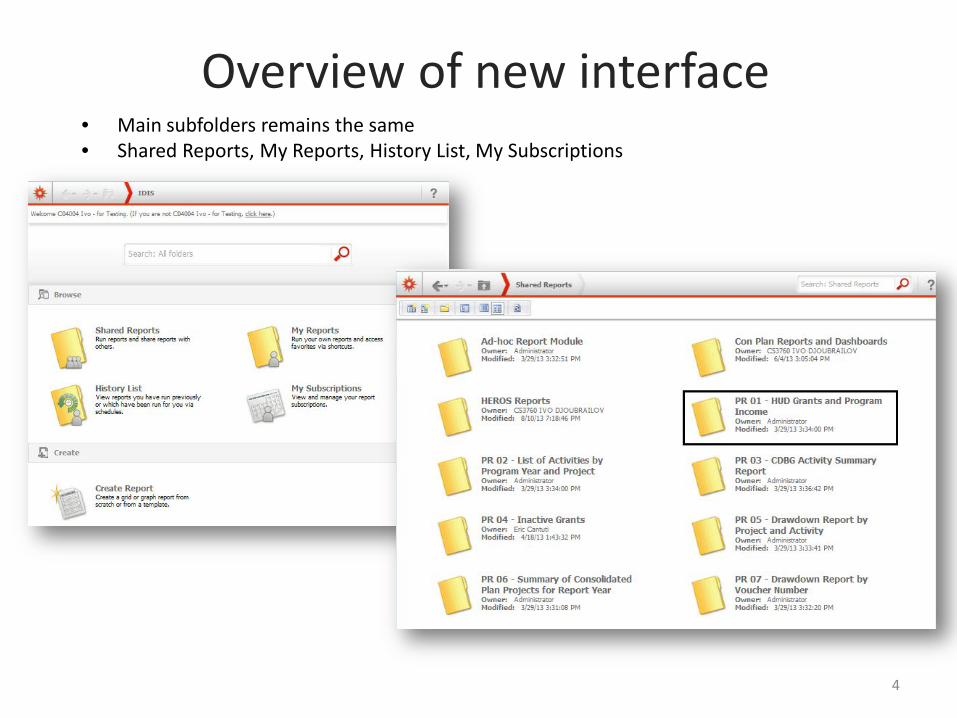
• Main subfolders remains the same • Shared Reports, My Reports, History List, My Subscriptions
Overview of new interface
4

Hover mouse over report icon to see additional run options:
Subscription, Export and PDF
Click report icon to directly execute the report
Overview of new interface
Streamlined ‘Office-like’ interface requires hover over to reveal options
5
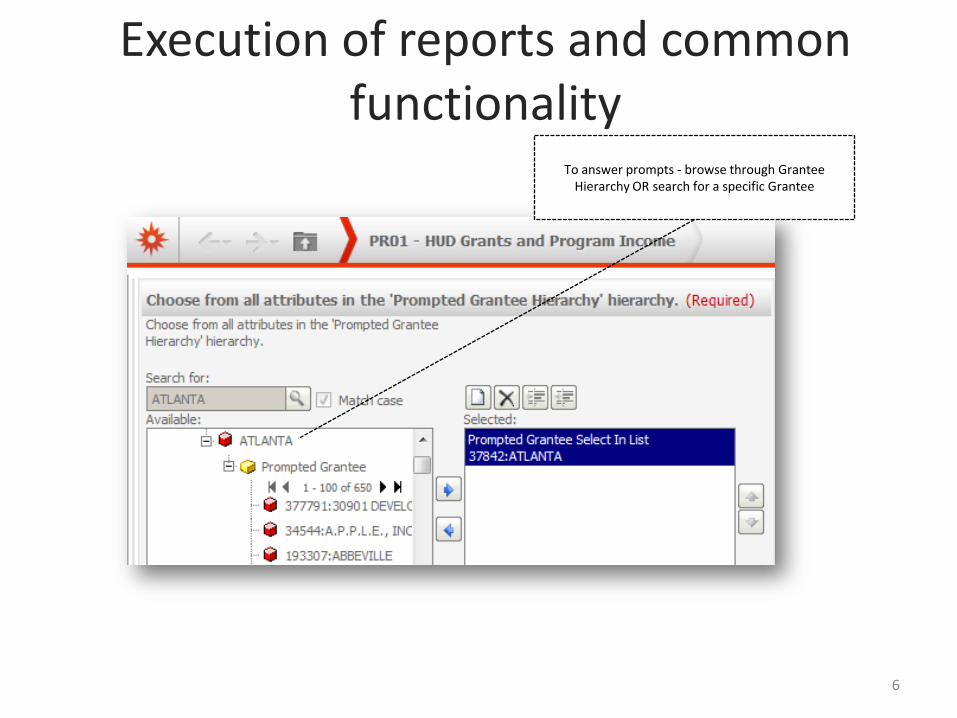
To answer prompts - browse through Grantee Hierarchy OR search for a specific Grantee
Execution of reports and common functionality
6
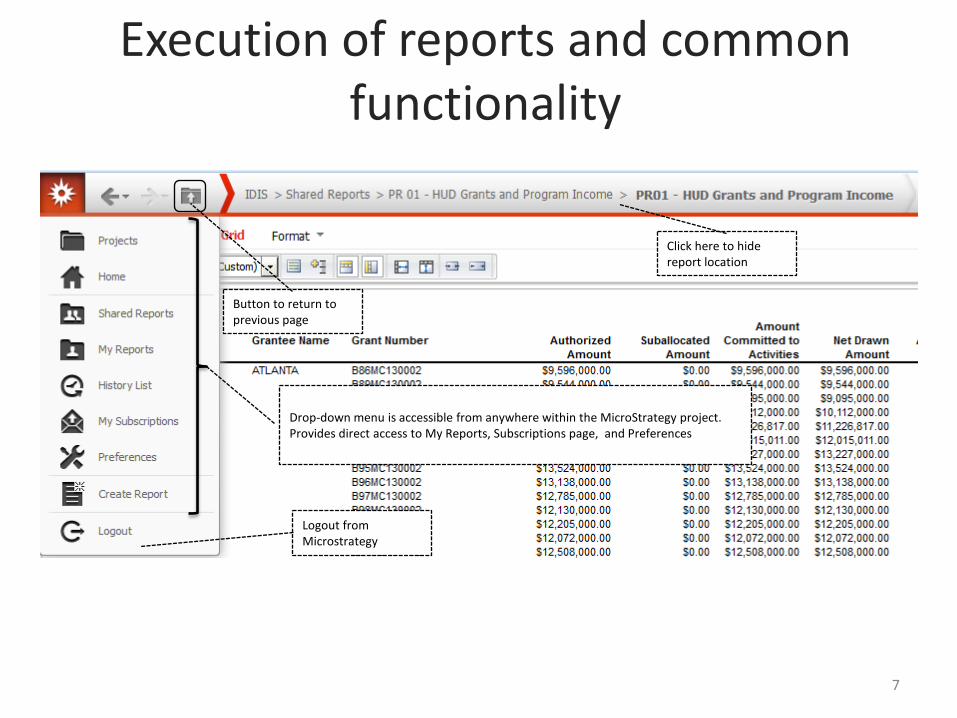
Click here to hide report location
Button to return to previous page
Drop-down menu is accessible from anywhere within the MicroStrategy project. Provides direct access to My Reports, Subscriptions page, and Preferences
Logout from Microstrategy
Execution of reports and common functionality
7
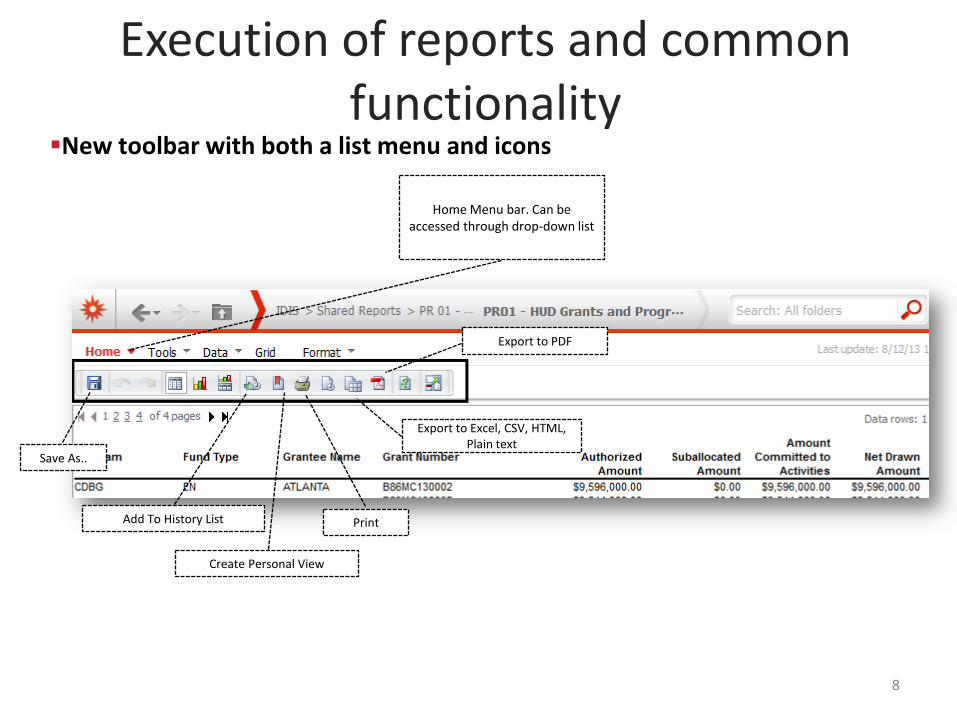
New toolbar with both a list menu and icons
Home Menu bar. Can be accessed through drop-down list
Save As..
Add To History List
Create Personal View
Export to Excel, CSV, HTML, Plain text
Export to PDF
Execution of reports and common functionality
8
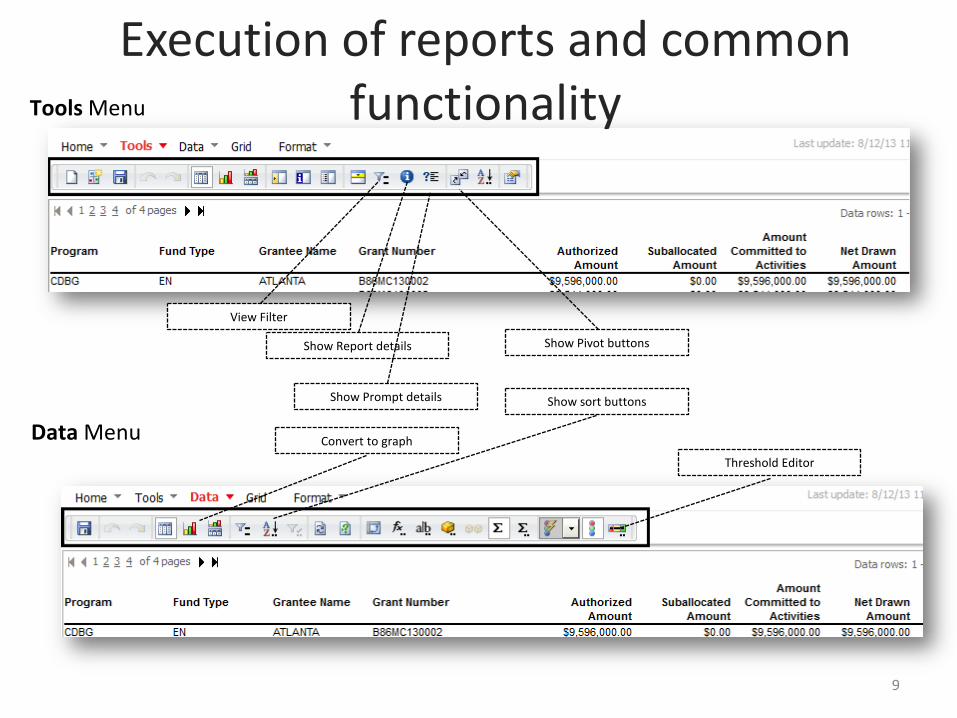
Tools Menu
Data Menu
View Filter
Show Report details
Show Prompt details
Show Pivot buttons
Show sort buttons
Threshold Editor
Execution of reports and common functionality
Convert to graph
9
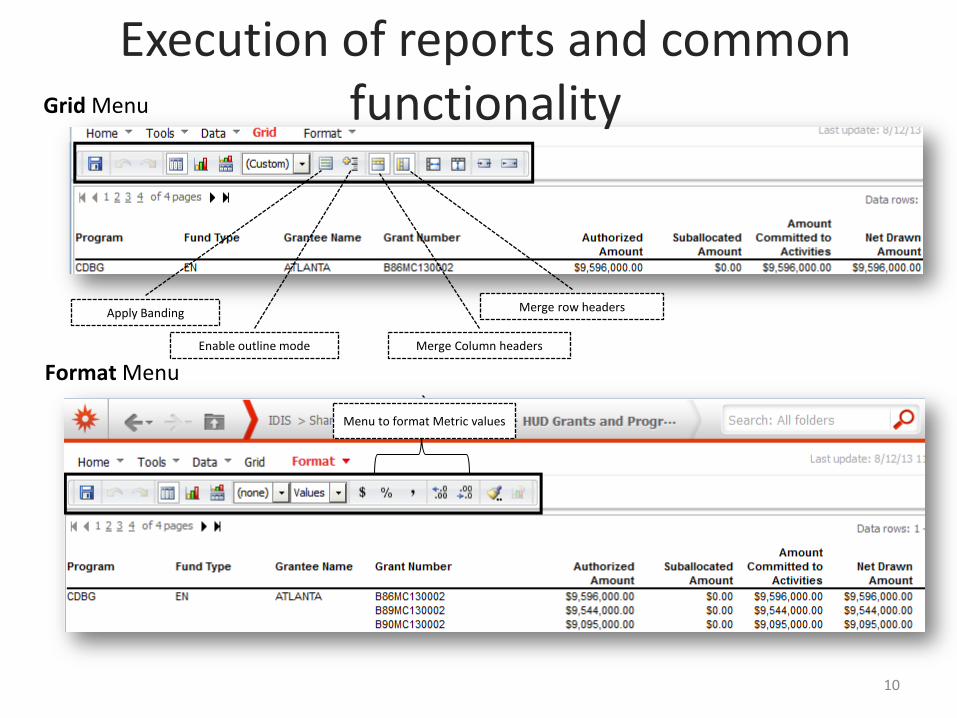
Format Menu
Grid Menu
Apply Banding
Enable outline mode
Merge row headers
Merge Column headers
Menu to format Metric values
Execution of reports and common functionality
10

Page-by & Export
Page-by filter
Export into Excel or PDF
Page-by filter Page-by list makes viewing a report easier, users do not have to scroll through long list of data and can quickly
filter by the selected element
11
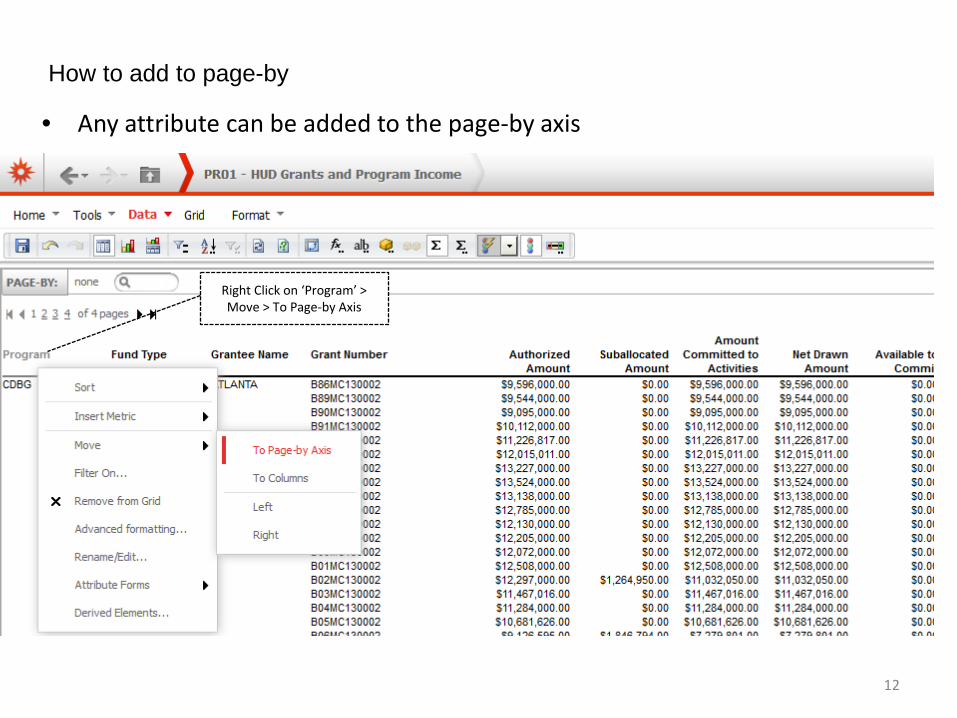
• Any attribute can be added to the page-by axis
Right Click on ‘Program’ > Move > To Page-by Axis
How to add to page-by
12

PDF Options
Excel & other options
Export
Export all 4 pages or portion displayed
only(Page 1)
13
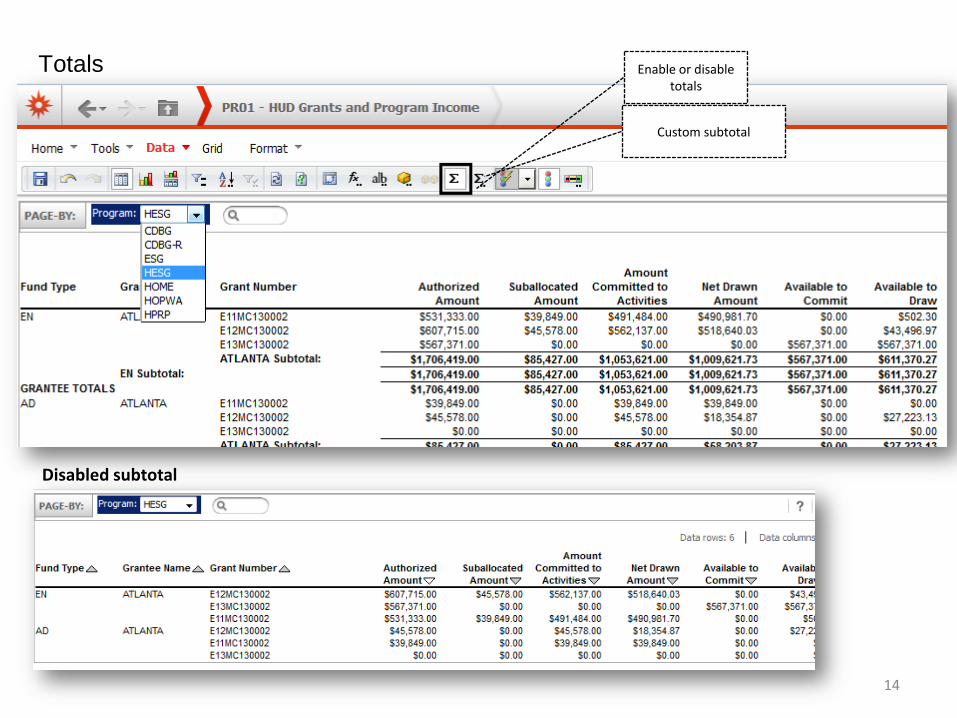
Totals Enable or disable totals
Custom subtotal
Disabled subtotal
14
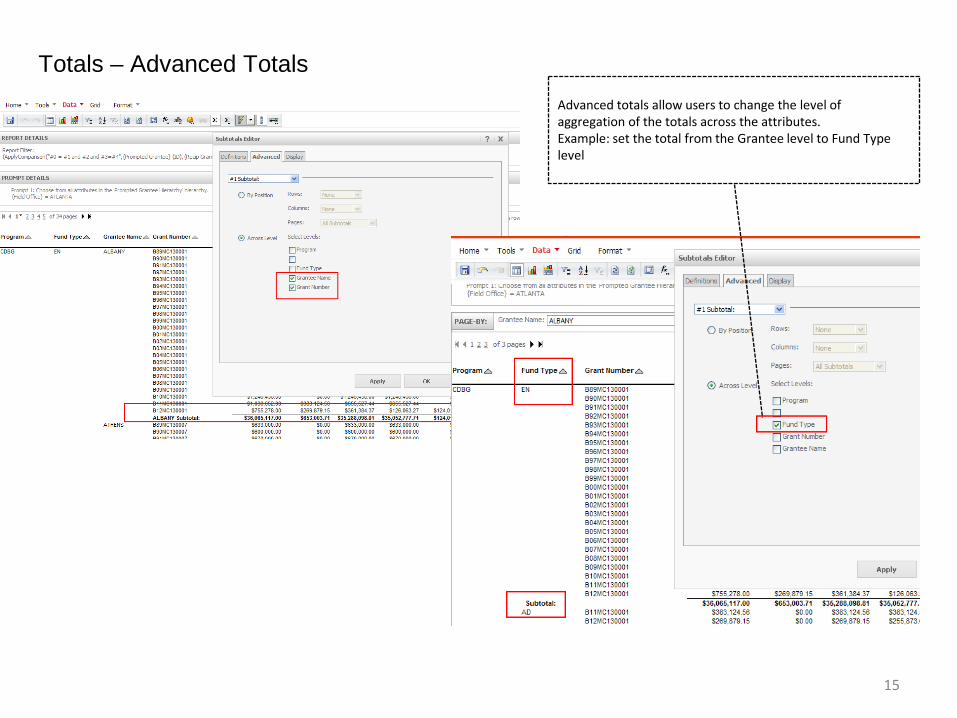
Totals – Advanced Totals Advanced totals allow users to change the level of aggregation of the totals across the attributes. Example: set the total from the Grantee level to Fund Type level
15
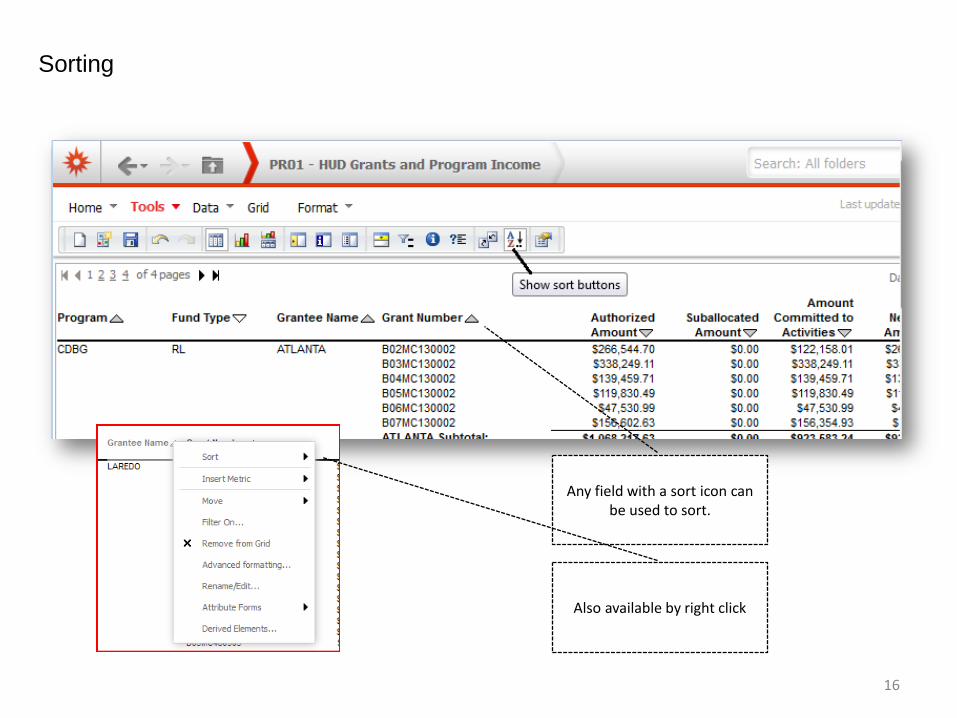
Sorting
Any field with a sort icon can be used to sort.
Also available by right click
16
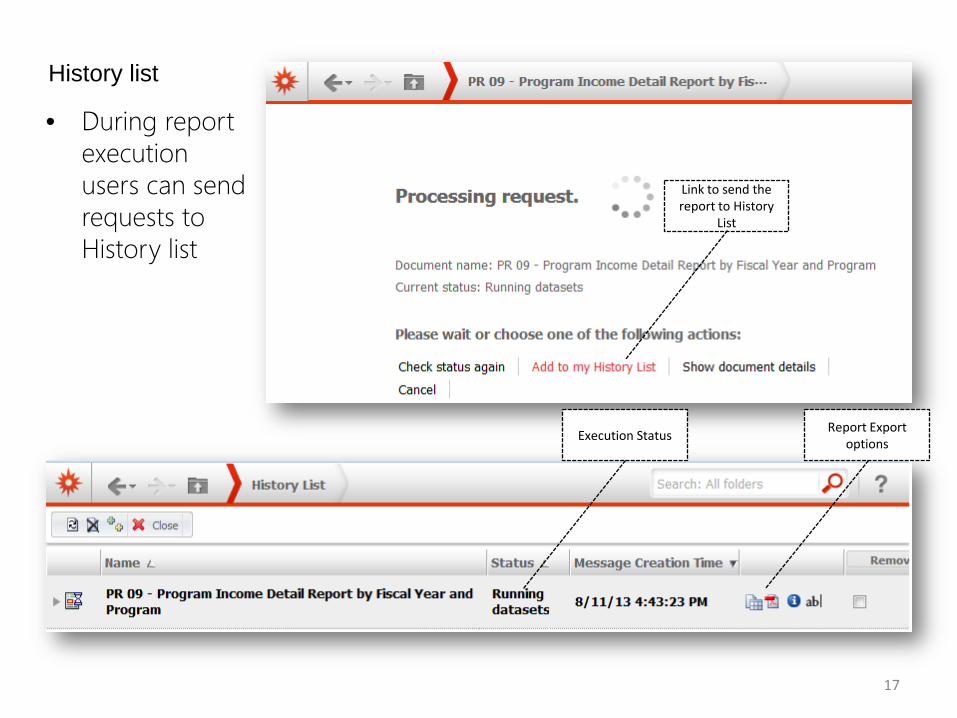
History list
• During report execution users can send requests to History list
Report Export options Execution Status
Link to send the report to History
List
17
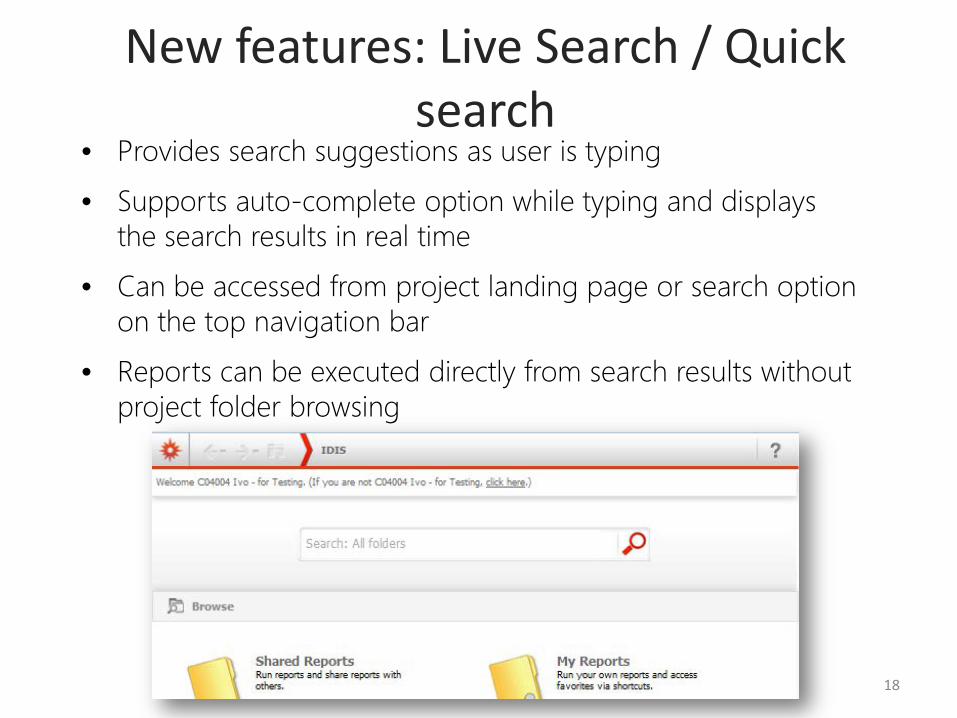
New features: Live Search / Quick search
• Provides search suggestions as user is typing
• Supports auto-complete option while typing and displays the search results in real time
• Can be accessed from project landing page or search option on the top navigation bar
• Reports can be executed directly from search results without project folder browsing
18
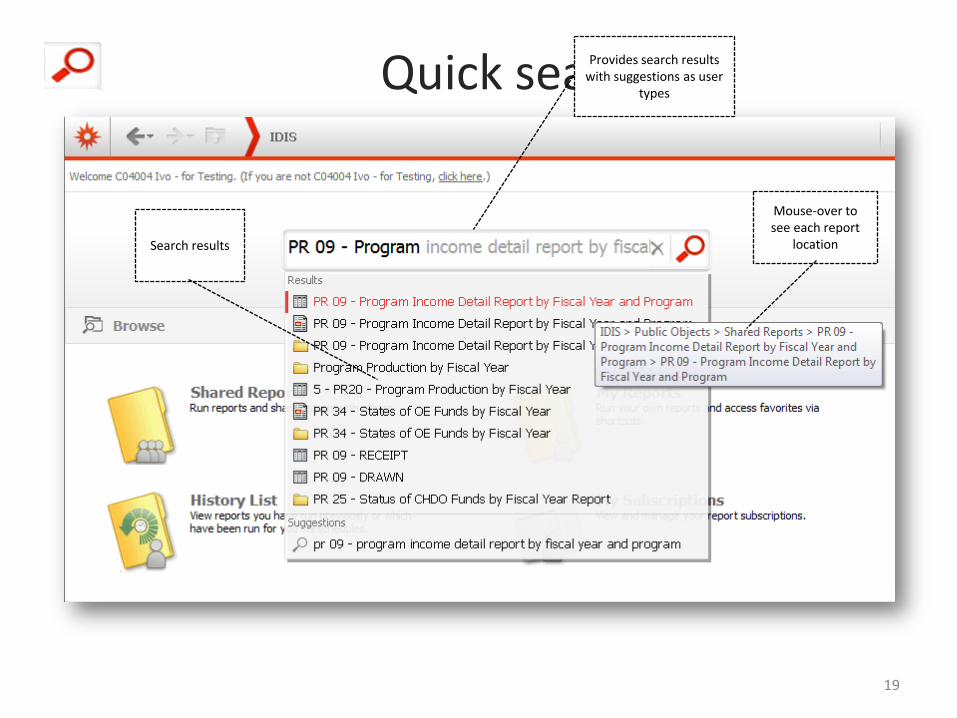
Quick search Provides search results with suggestions as user
types
Mouse-over to see each report
location Search results
19

Personal View • Allows user to customize a report or a document and save the customized report display
in their personal view. Using personal views allows different users to display the report using their preferred report layout.
• Personal View menu is located under Home Menu bar
20
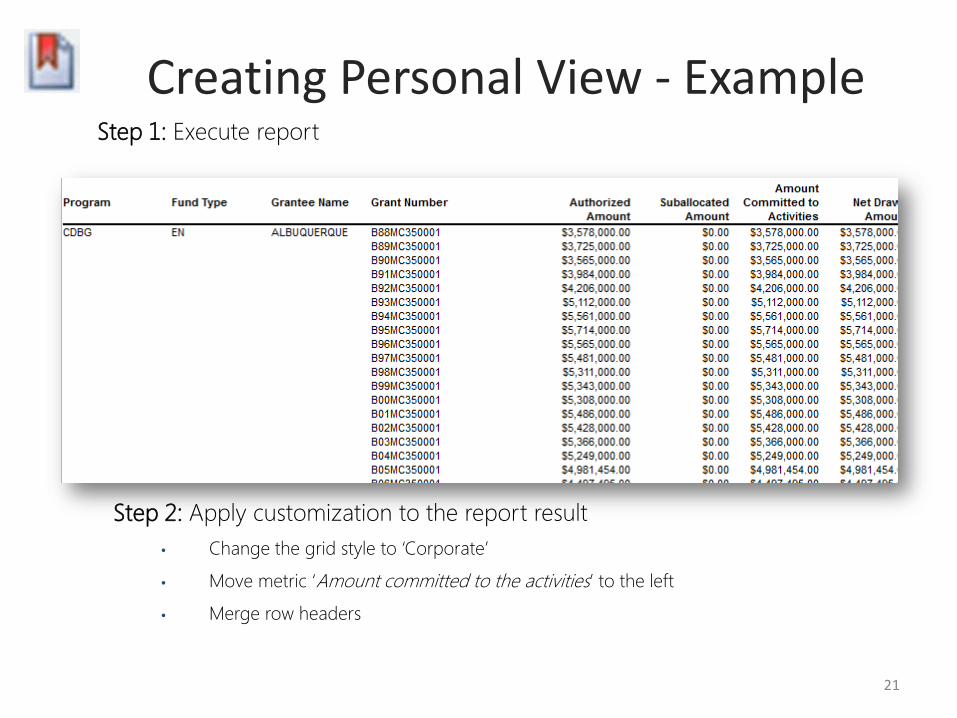
Creating Personal View - Example Step 1: Execute report
Step 2: Apply customization to the report result • Change the grid style to ‘Corporate’
• Move metric ‘Amount committed to the activities’ to the left
• Merge row headers
21
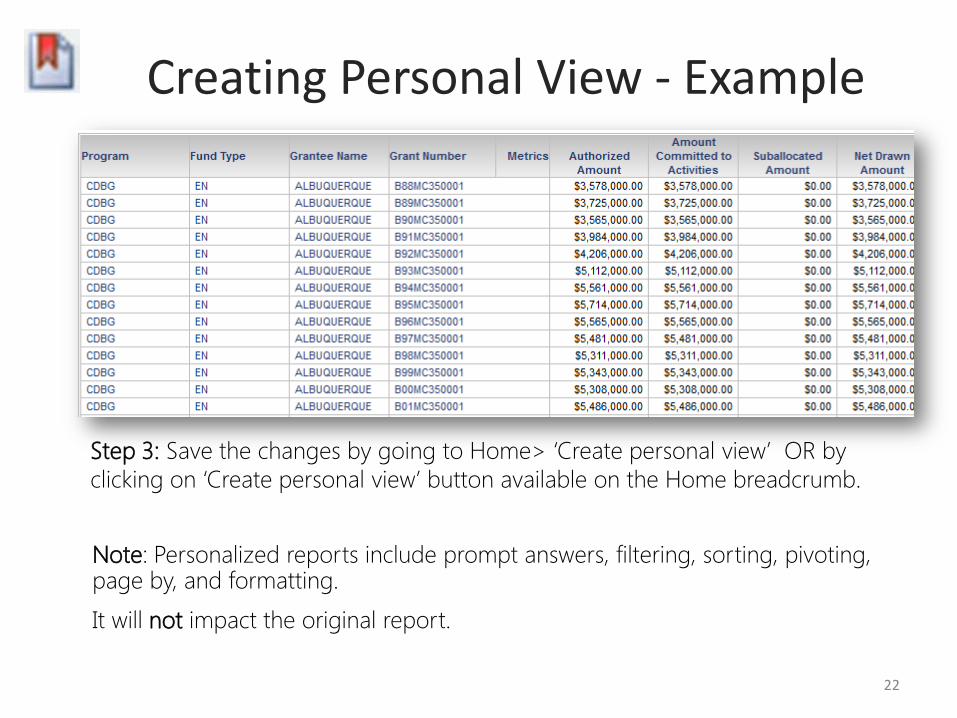
Creating Personal View - Example
Step 3: Save the changes by going to Home> ‘Create personal view’ OR by clicking on ‘Create personal view’ button available on the Home breadcrumb.
Note: Personalized reports include prompt answers, filtering, sorting, pivoting, page by, and formatting.
It will not impact the original report.
22

Creating Personal View - Example Step 4: Give a name to your personalized view
Step 5: Saved personalized views are accessible under My Subscription page under Personal View Subscriptions
23
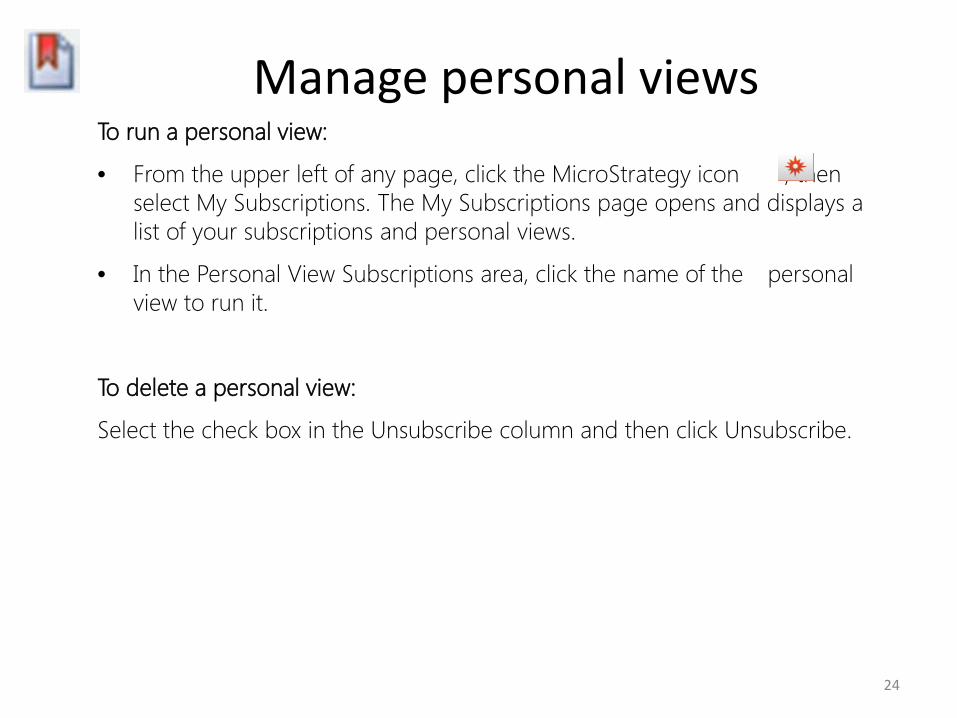
Manage personal views To run a personal view:
• From the upper left of any page, click the MicroStrategy icon , then select My Subscriptions. The My Subscriptions page opens and displays a list of your subscriptions and personal views.
• In the Personal View Subscriptions area, click the name of the personal view to run it.
To delete a personal view:
Select the check box in the Unsubscribe column and then click Unsubscribe.
24
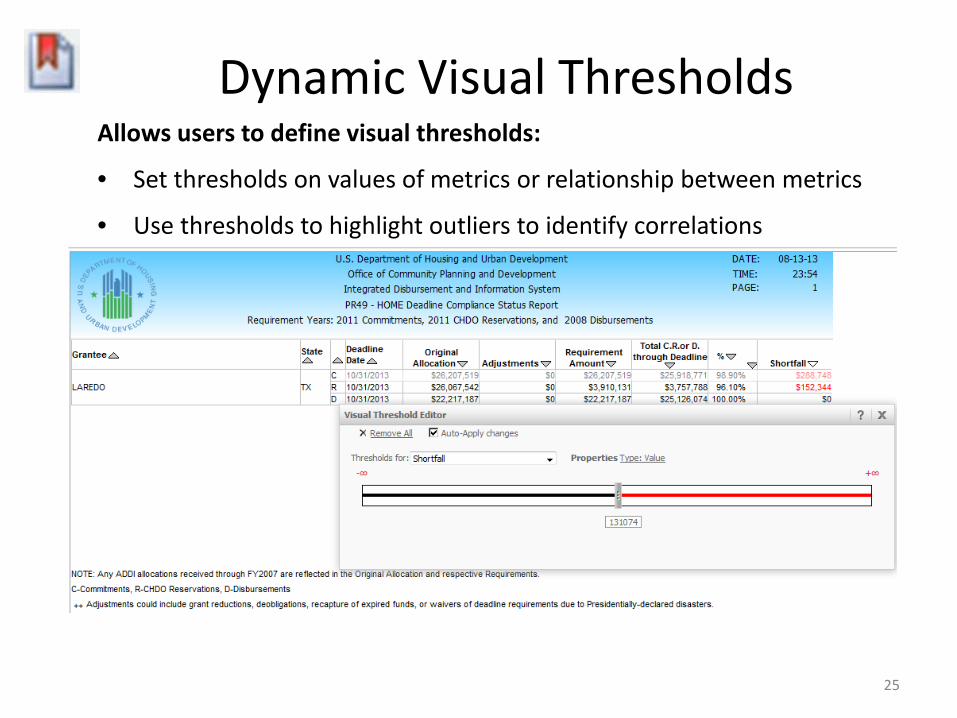
Dynamic Visual Thresholds Allows users to define visual thresholds:
• Set thresholds on values of metrics or relationship between metrics
• Use thresholds to highlight outliers to identify correlations
25
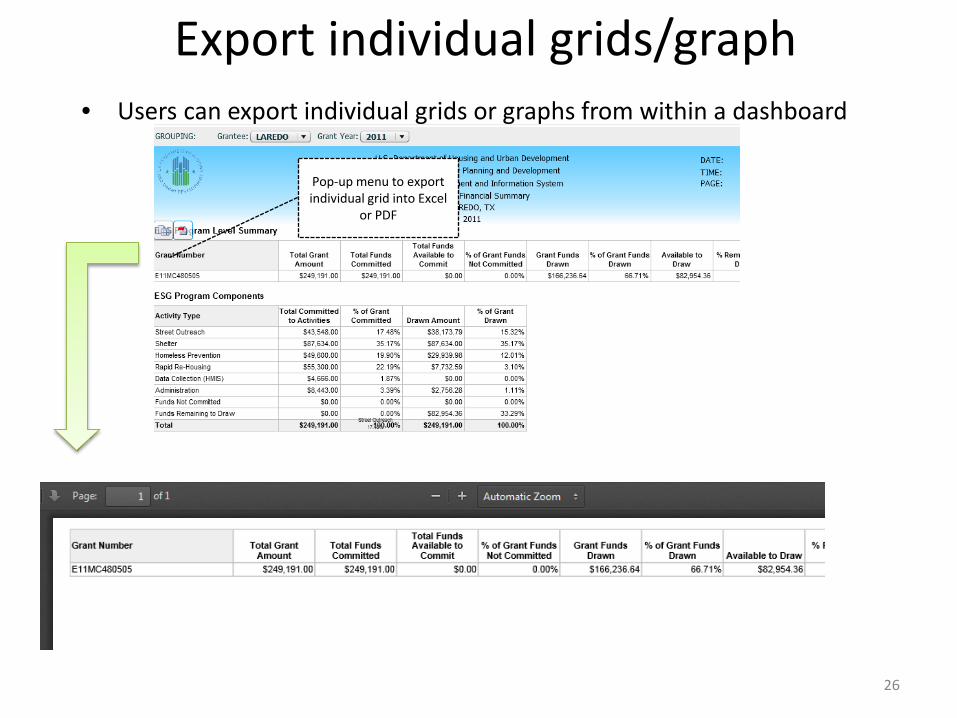
Export individual grids/graph • Users can export individual grids or graphs from within a dashboard
Pop-up menu to export individual grid into Excel
or PDF
26
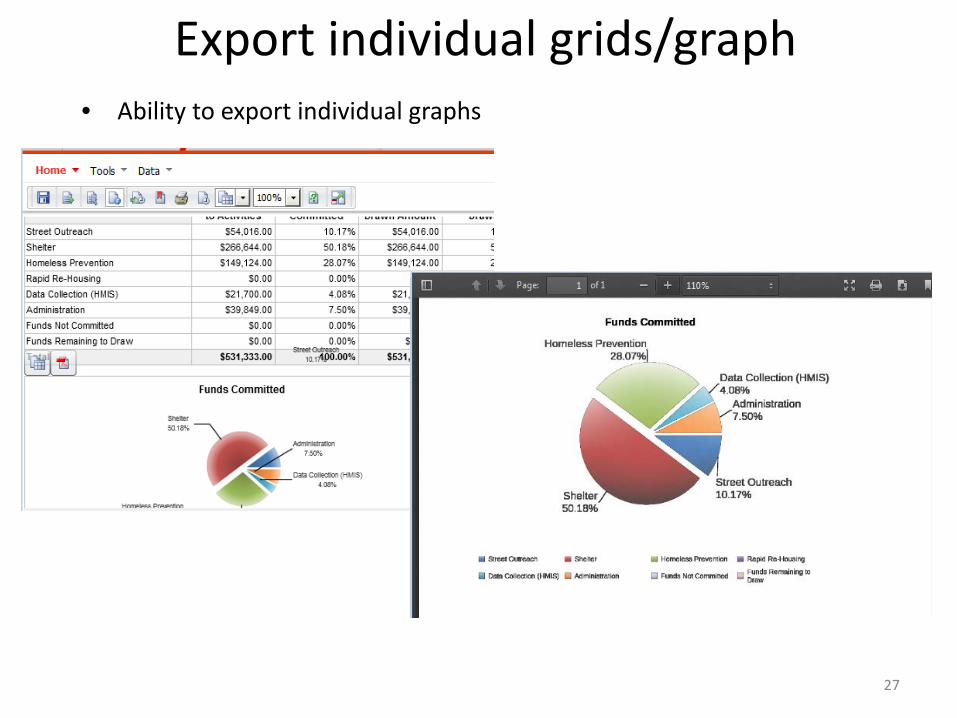
Export individual grids/graph • Ability to export individual graphs
27