Embed Size (px)
Citation preview
1
MicroStrategy: User Manual
October 2016
Table of Contents Administration .............................................................................................................................................. 2
Uploading Data ............................................................................................................................................. 3
Dashboard 1 .................................................................................................................................................. 6
Dashboard 2 .................................................................................................................................................. 9
Dashboard 3 ................................................................................................................................................ 11
Dashboard 4 ................................................................................................................................................ 12
2
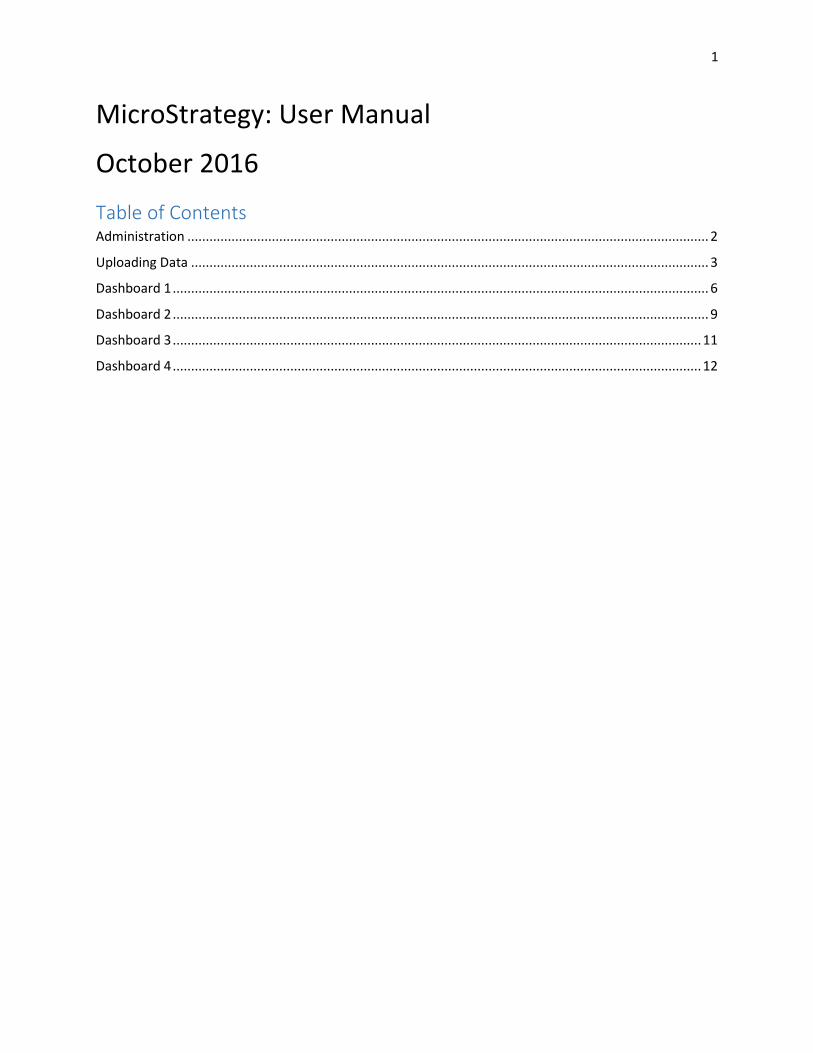
Administration Downloading MicroStrategy software on your computer
1. Go to https://www.microstrategy.com/us/go/microstrategy-for-academics
2. Fill out your information on the right side of the screen
3. You will be prompted to choose what system you have (Mac or Windows 64-bit)
4. Open up the downloaded zip file and open the .exe file in it. Allow the program to make changes
to your device.
5. Follow the instructions provided by MicroStrategy Desktop application.
3
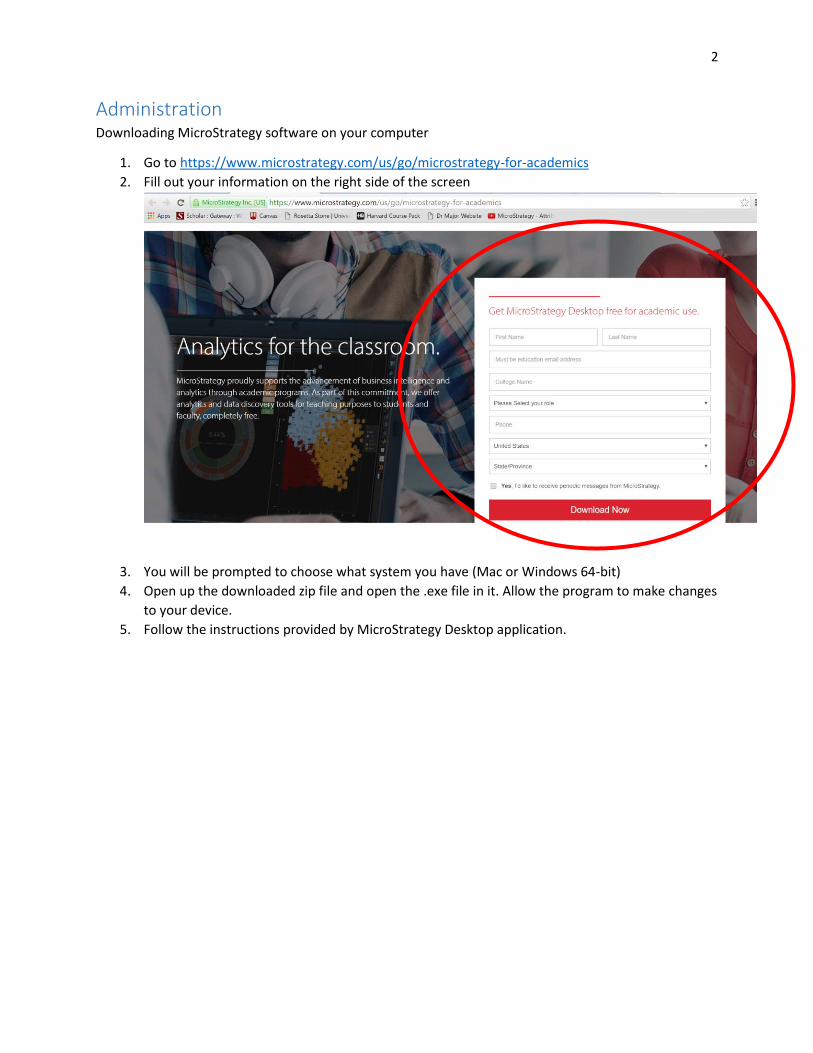
Uploading Data **Note: Make sure your Computations.xml file is saved on your computer.
1. Click on Add Data icon in the left hand upper corner. Choose New Data option.
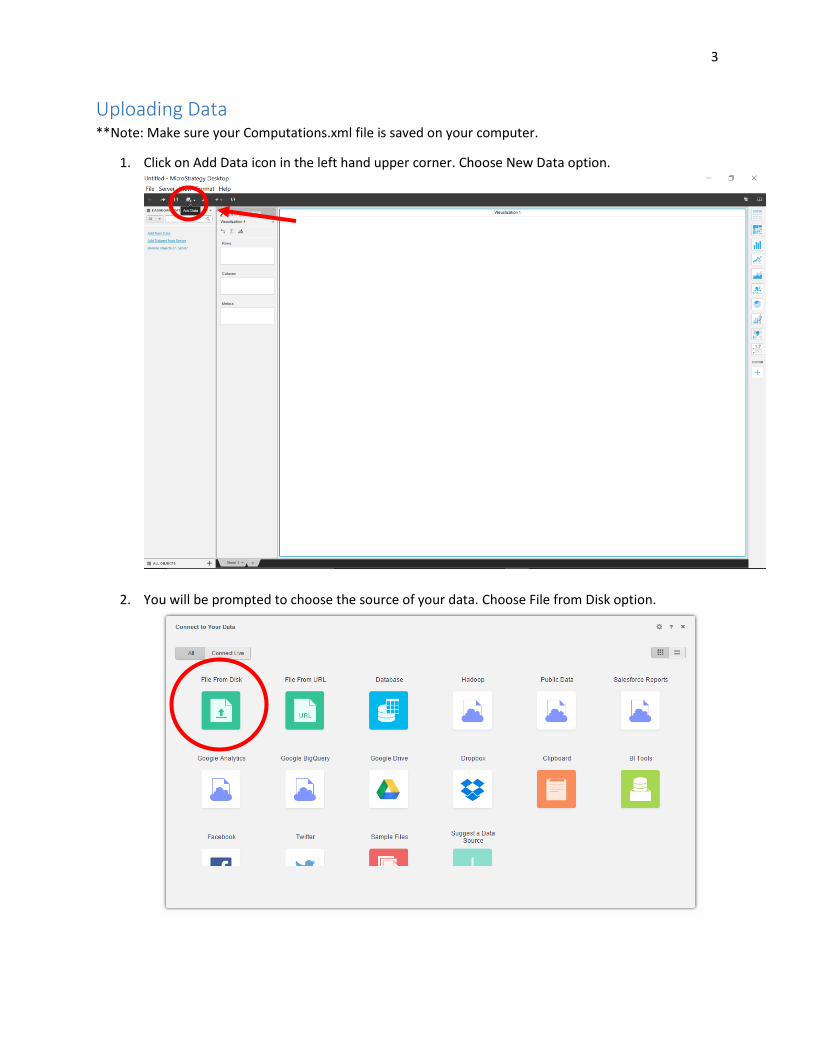
2. You will be prompted to choose the source of your data. Choose File from Disk option.
4
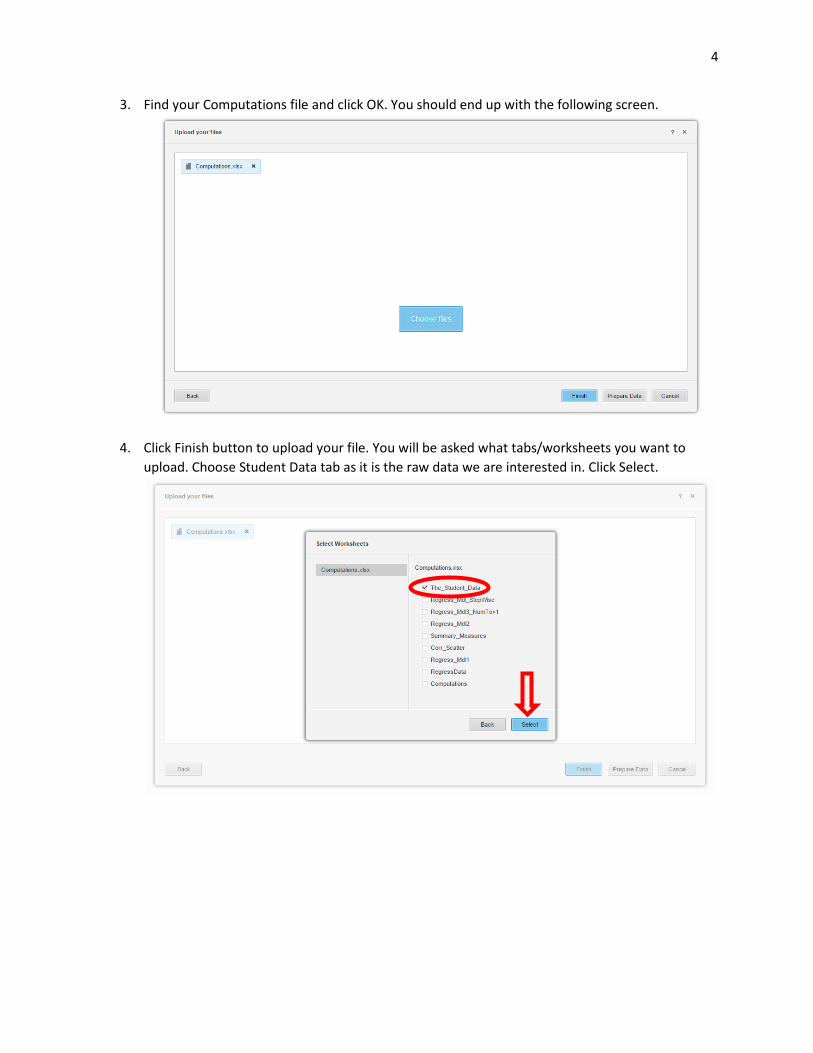
3. Find your Computations file and click OK. You should end up with the following screen.
4. Click Finish button to upload your file. You will be asked what tabs/worksheets you want to
upload. Choose Student Data tab as it is the raw data we are interested in. Click Select.
5
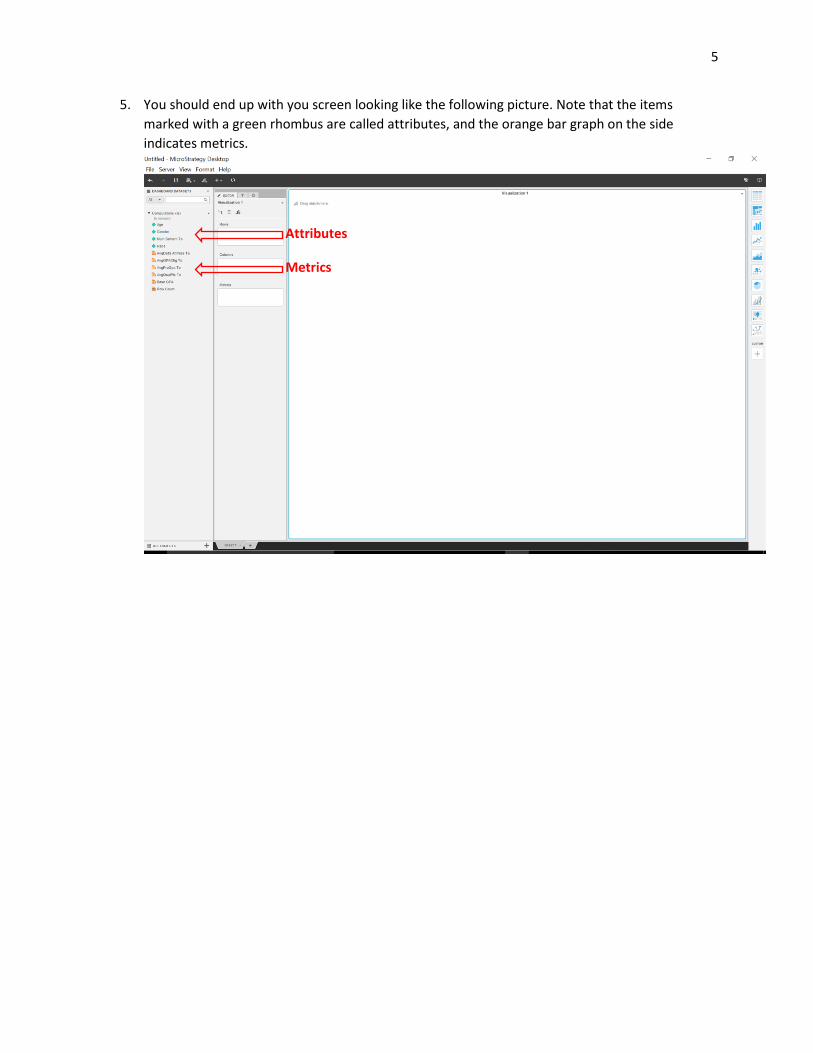
5. You should end up with you screen looking like the following picture. Note that the items
marked with a green rhombus are called attributes, and the orange bar graph on the side
indicates metrics.
Attributes
Metrics
6
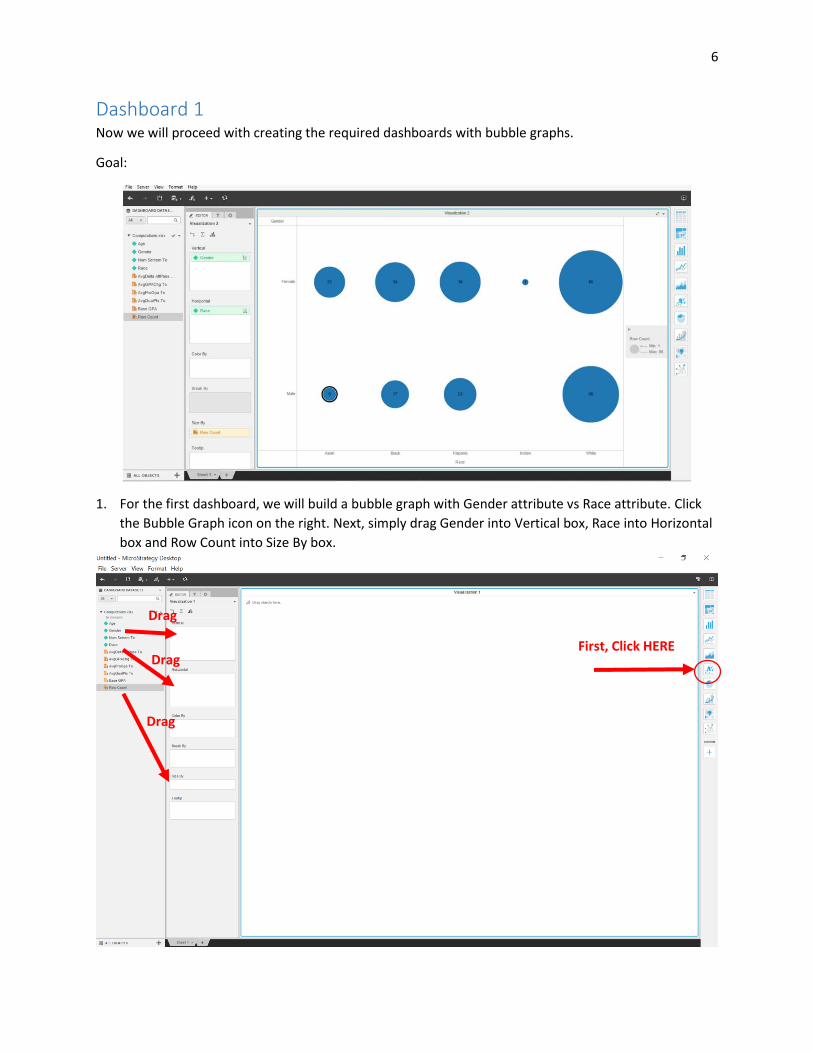
Dashboard 1 Now we will proceed with creating the required dashboards with bubble graphs.
Goal:
1. For the first dashboard, we will build a bubble graph with Gender attribute vs Race attribute. Click
the Bubble Graph icon on the right. Next, simply drag Gender into Vertical box, Race into Horizontal
box and Row Count into Size By box.
Drag
Drag
Drag
First, Click HERE
7
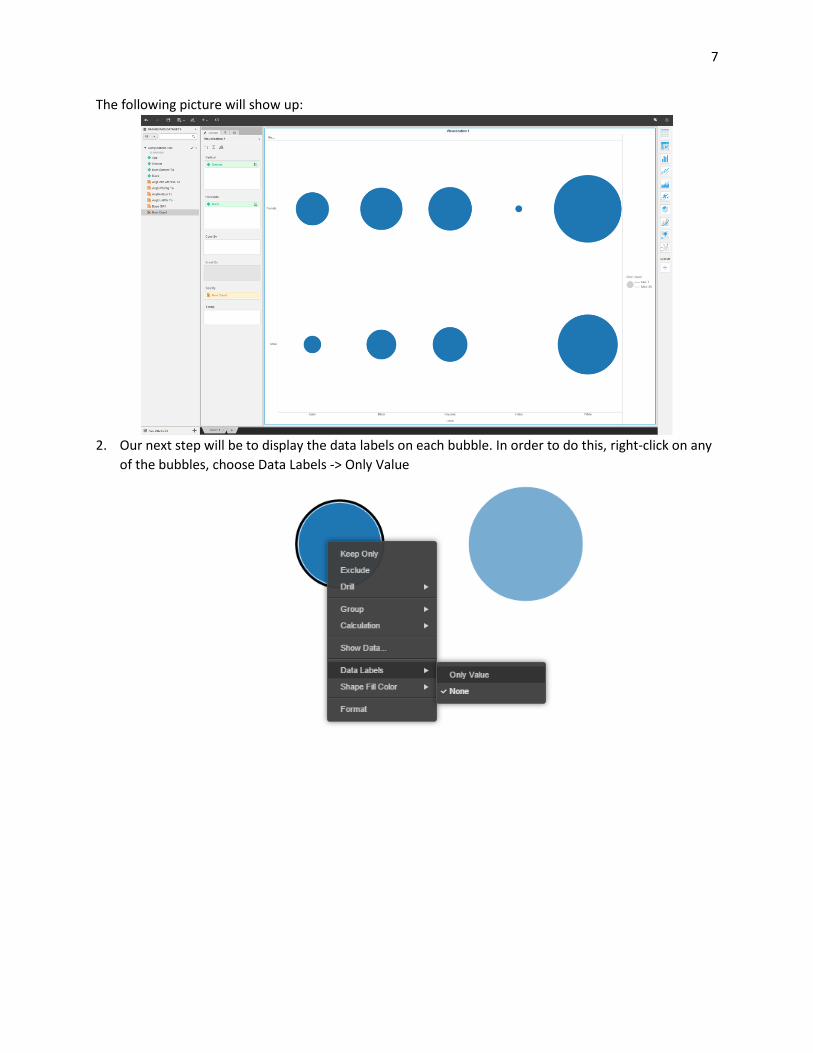
The following picture will show up:
2. Our next step will be to display the data labels on each bubble. In order to do this, right-click on any
of the bubbles, choose Data Labels -> Only Value
8
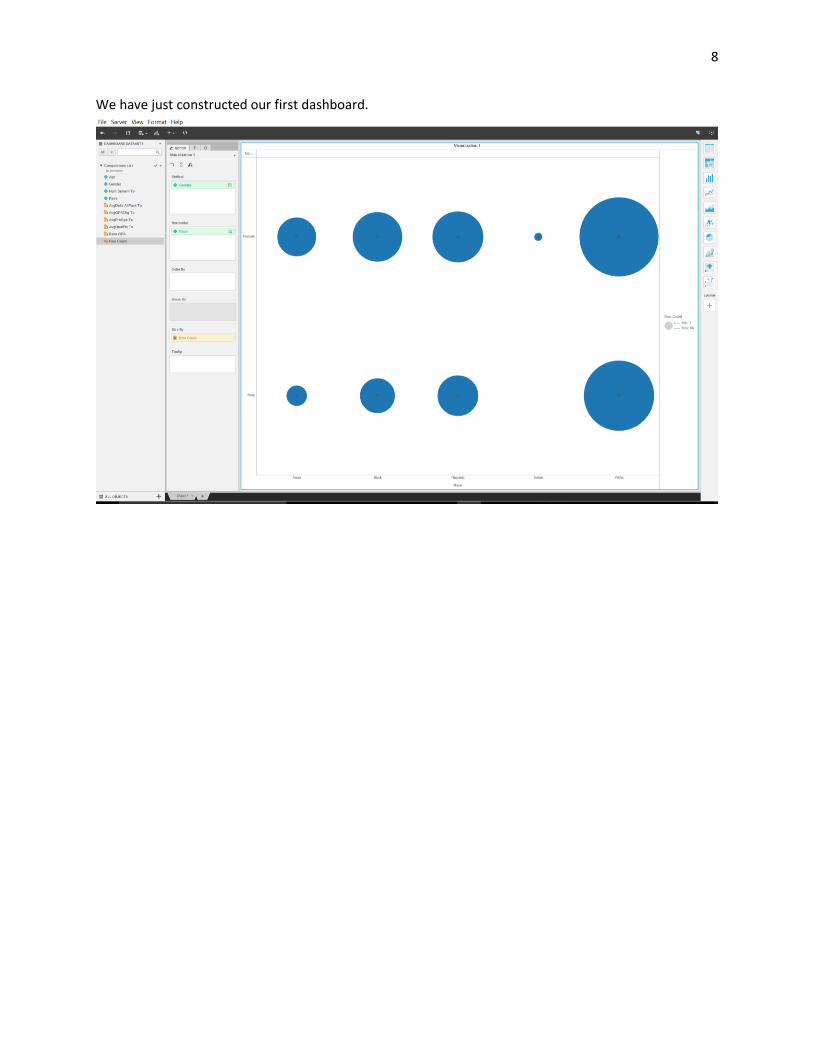
We have just constructed our first dashboard.
9
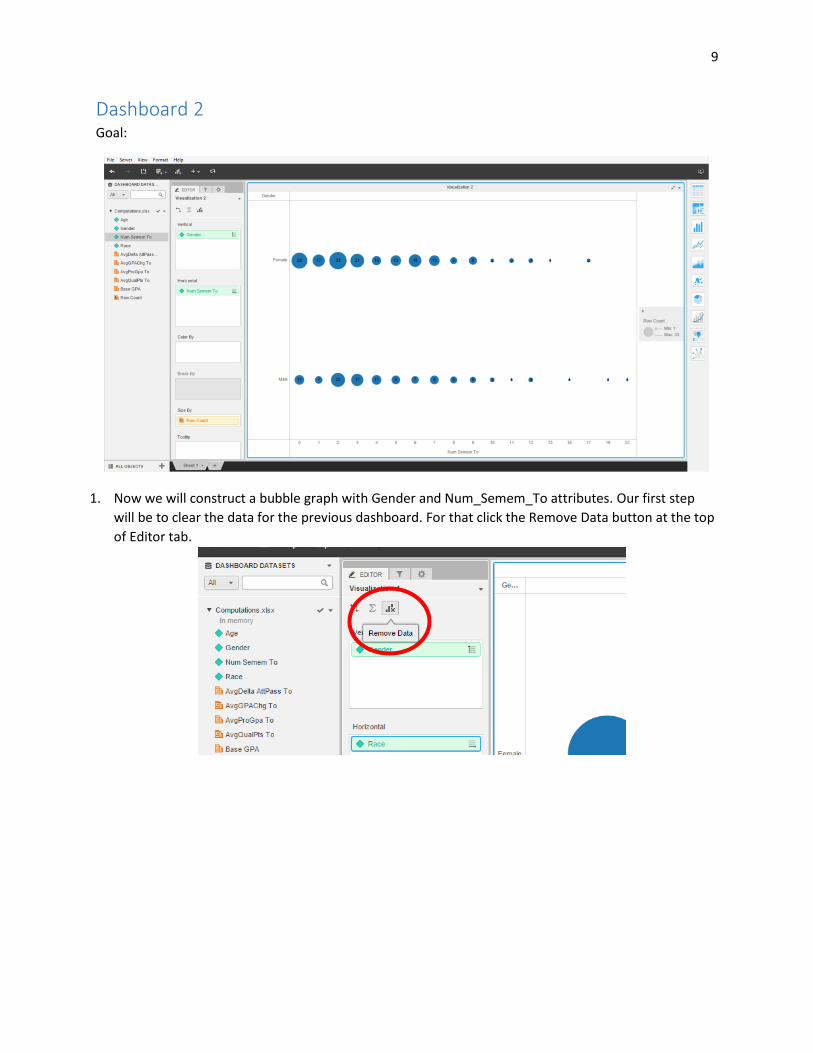
Dashboard 2 Goal:
1. Now we will construct a bubble graph with Gender and Num_Semem_To attributes. Our first step
will be to clear the data for the previous dashboard. For that click the Remove Data button at the top
of Editor tab.
10
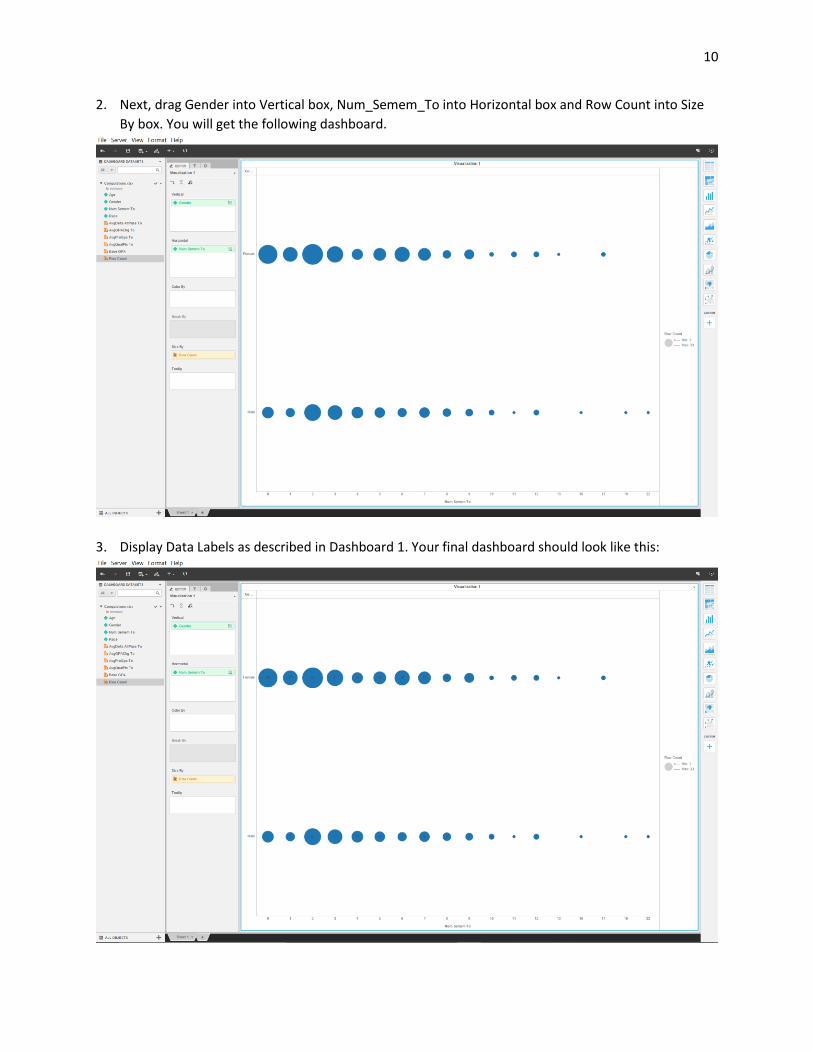
2. Next, drag Gender into Vertical box, Num_Semem_To into Horizontal box and Row Count into Size
By box. You will get the following dashboard.
3. Display Data Labels as described in Dashboard 1. Your final dashboard should look like this:
11
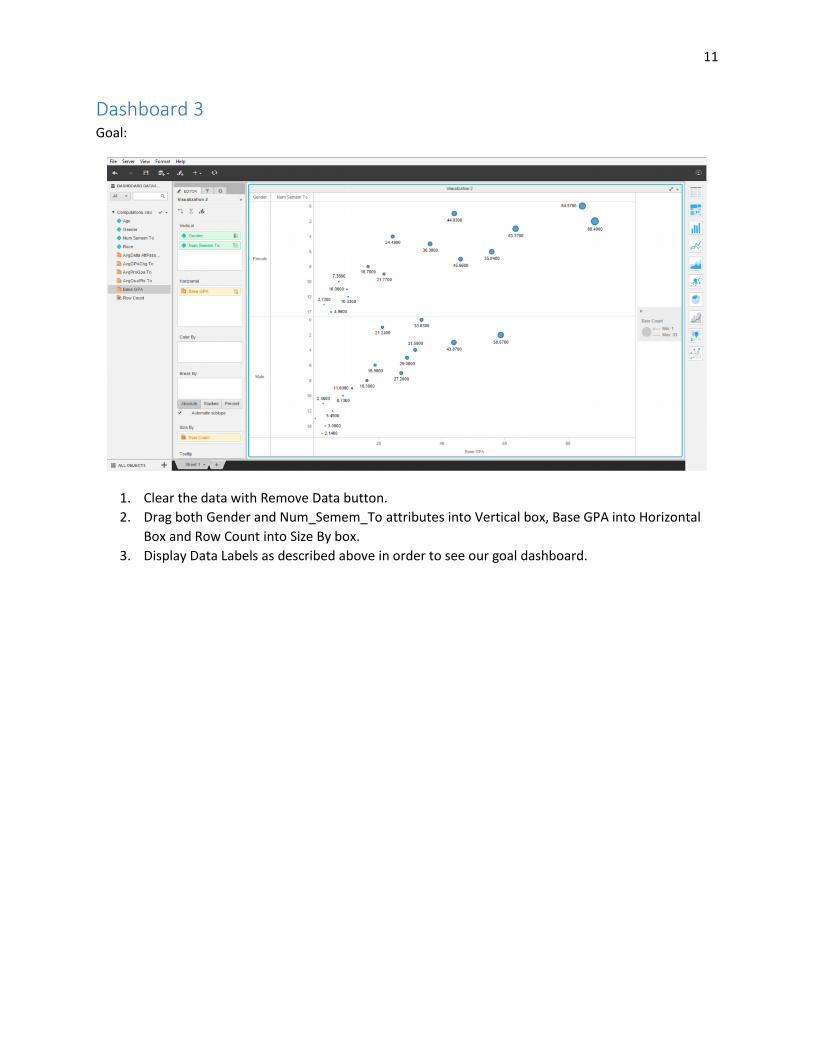
Dashboard 3 Goal:
1. Clear the data with Remove Data button.
2. Drag both Gender and Num_Semem_To attributes into Vertical box, Base GPA into Horizontal
Box and Row Count into Size By box.
3. Display Data Labels as described above in order to see our goal dashboard.
12
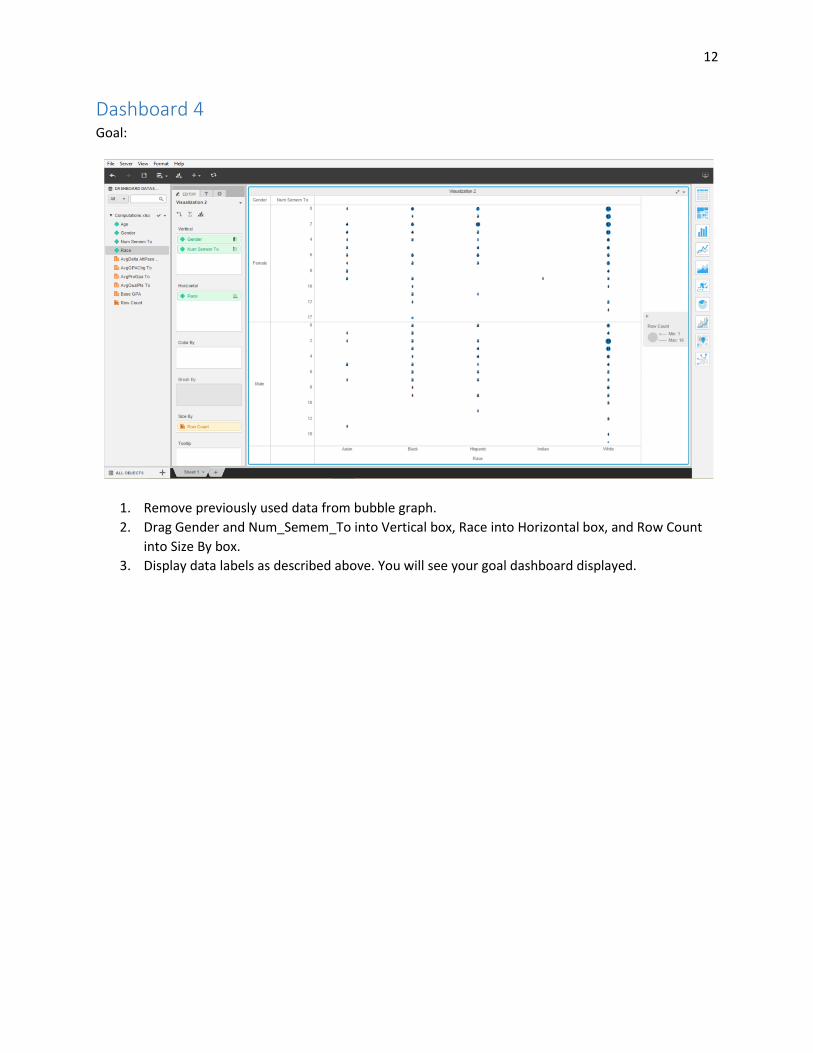
Dashboard 4 Goal:
1. Remove previously used data from bubble graph.
2. Drag Gender and Num_Semem_To into Vertical box, Race into Horizontal box, and Row Count
into Size By box.
3. Display data labels as described above. You will see your goal dashboard displayed.