Embed Size (px)
Citation preview
Available online at www.sciencedirect.com
Nuclear Physics A 884–885 (2012) 1–20
www.elsevier.com/locate/nuclphysa
Microscopic insight into the structure of galliumisotopes
Preeti Verma, Chetan Sharma, Suram Singh, Arun Bharti ∗, S.K. Khosa
Department of Physics and Electronics, University of Jammu, Jammu-180006, India
Received 6 March 2012; received in revised form 25 April 2012; accepted 30 April 2012
Available online 2 May 2012
Abstract
Projected Shell Model technique has been applied to odd-A 71–81Ga nuclei with the deformed single-particle states generated by the standard Nilsson potential. Various nuclear structure quantities have beencalculated with this technique and compared with the available experimental data in the present work.The known experimental data of the yrast bands in these nuclei are persuasively described and the banddiagrams obtained for these nuclei show that the yrast bands in these odd-A Ga isotopes don’t belong to thesingle intrinsic state only but also have multi-particle states. The back-bending in moment of inertia and theelectric quadrupole transitions are also calculated.© 2012 Elsevier B.V. All rights reserved.
Keywords: Projected shell model; Multi-quasiparticle states; Yrast spectra; Band diagram; Back-bending; B(E2) values
1. Introduction
One of the fundamental tenets of nuclear structure is its evolution with proton and neutronnumber. Experimental evidence of evolution of nuclear structure along an isotopic chain is anessential ingredient to have a better understanding of nucleon–nucleon interaction. The actualmechanism which causes the change in the nuclear structure as neutron number increases in anuclear system is still an open question. In recent years, the transformation of shell-structure forneutron-rich fp shell nuclei near proton number Z = 28 has been at the focus of experimentaland theoretical studies [1–11]. Apart from this, the systematic studies of level schemes in thesefp-shell nuclei of the elements table have shown some strange results among which is a relatively
* Corresponding author.E-mail address: [email protected] (A. Bharti).
0375-9474/$ – see front matter © 2012 Elsevier B.V. All rights reserved.http://dx.doi.org/10.1016/j.nuclphysa.2012.04.008
2 P. Verma et al. / Nuclear Physics A 884–885 (2012) 1–20
regular and anomalous variation of the energy of the first Iπ = 9/2+ level in the odd-Z isotopes[12]. In this interesting region, where such irregularities have been observed but are not yet reallyunderstood, it appears very worthwhile to improve our knowledge of the level schemes and othertransfer properties of the odd-Z isotopes.
Recent studies of the structure of odd-mass Cu nuclei made it possible to follow the evolutionof single-particle state around Z = 28 closed shell and also to study the onset of collective effectsfor a single proton coupled to the changing Ni core structure [4]. With three protons beyondthe Z = 28 closed shell, the structure of odd-mass Ga isotopes is expected to be even morecomplex, owing to the inclusion of a broken pair in collective effects. Low-energy levels in theseGa nuclei have been determined in both proton stripping and pickup reactions [13–16] as well asthrough radioactive decay studies [17–19]. The neutron-rich odd-A gallium isotopes have alsobeen studied by means of single- and multi-particle transfer reactions [20–22] and more recently,by deep inelastic reactions [8]. The data gained in such pursuits has provided a rich testing groundfor present day nuclear model.
As the gallium isotopes have three protons outside the Z = 28 shell gap, in a normal shell-model ordering, the three protons would occupy the πp3/2 level, leading to a ground state spinI = 3/2− for all odd-A Ga isotopes. A recent collinear laser spectroscopy measurement by Chealet al. [7] has confirmed the assumption of a 3/2− ground state in all odd-A gallium isotopes,except for 73Ga42 and 81Ga50 where the spin and parity of the ground state were found to be1/2− and 5/2− respectively. Basically, a nuclear spin of I = 3/2− was assigned to the groundstate of 73Ga by Vergnes et al. [21] and also, in a recent coincidence analysis using deep-inelasticreactions by Stefanescu et al. [8] but Cheal et al. [7] observed a ground state spin I = 1/2−for 73Ga, being near degenerate with a 3/2− isomer (75 eV � Eex � 1 keV). A more recentCoulomb excitation experiment performed by Diriken et al. [23] also provides the evidence forthe existence of a 1/2−, 3/2− doublet near the ground state in 73Ga differing by at most 0.8 keVin energy. Apart from this, the excited levels were attributed to 81Ga for the first time by Verneyet al. [24] with the ground state spin of 5/2− using the β-decay of the neutron-rich 81Zn51 whichwas confirmed by Cheal et al. [7]. Now, if we talk about the positive-parity levels in these odd-Agallium isotopes, the 9/2+ level at about 2.0 MeV excitation energy, with all the probability,originating from the promotion of the unpaired proton into the g9/2 orbital, mark the band-headof the positive-parity cascade in the respective nucleus [25]. Higher spin values in these bandsare then obtained by the alignment of one g9/2 neutron pair.
The systematics of the ground state spin and nuclear moments (magnetic and electricalquadrupole) for 71,73,75,77,79,81Ga reveals the sudden structural change between N = 40 andN = 50 [7]. The extracted B(E2↓) values also indicate a shape transition between 71Ga and73Ga, as a shift of the collectivity towards lower excitation energy is observed [23]. In order tounderstand these interesting developments, a great deal of synergistic efforts is occurring on boththe experimental and theoretical fronts.
The odd-mass gallium isotopes have also been approached with theoretical models and aconsistent picture about their shape has emerged out. Very recently, P.C. Srivastava [26] hasperformed large scale shell model calculations for 71–78Ga including high-spin states with threedifferent effective interactions which added more information to the earlier work by Cheal etal. [7] for odd–even Ga isotopes and Mane et al. [27] for odd–odd Ga isotopes. Because of theavailable experimental and theoretical information on the low-spin states, as well as on theircomplexity at higher spins, the Ga nuclei can serve as test bed for the theoretical models.
A real challenge for the nuclear models is a description of a nucleus, where the collectivestructures are already developed, but they are competing with the single-particle degrees of free-
P. Verma et al. / Nuclear Physics A 884–885 (2012) 1–20 3
dom. Thus, a more stringent test of the model where its strength and possible weak points canbe revealed would be an attempt to interpret both the excitation energies and the transition prob-abilities in a transitional nucleus. In recent years, the Projected Shell Model (PSM) has beenextensively applied to study superdeformed as well as normal deformed bands in different mass-regions [28–46]. Since, this framework has been proven successful to interpret the experimentaldata when applied to even–even [42–44], odd–odd [31] and even(Z)–odd(N ) [32,33] nuclei inthe A ∼ 80 region, so it would be interesting to see whether it is feasible to reproduce the experi-mental data with PSM in an isotopic mass chain of odd(Z)–even(N ) nuclei also. This motivatedus to carry out a systematic study of Projected Shell Model (PSM) to analyze the structure ofodd-Z gallium isotopes with 40 � N � 50. The purpose of the work is to test the efficacy ofPSM by carrying out the systematic study of yrast bands in these isotopes and by obtaining theelectromagnetic properties.
Results are presented according to the following plan. The introduction briefly describes whythe Ga nuclei are chosen for this theoretical study. In Section 2, we have very briefly describedthe theory of the Projected Shell Model. Section 3 is devoted to the results obtained from thisframework and their comparison with the experimental data. Finally, Section 4 comprises of ashort summary and concluding remarks.
2. Outline of the theory
In this section, we shall concisely adumbrate the basic philosophy of the Projected ShellModel. Readers, who are interested in details of PSM, are referred to the review article [47].The PSM is built over a deformed mean field, which incorporates pairing effects through a Bo-golyubov transformation to quasiparticle states. What one gains by starting from a deformedbasis is not only that shell model calculations for heavy nuclei become feasible but also physicalinterpretation for the complex systems becomes easier and clearer. In the present work, we haveassumed that the deformed single-particle states have axial symmetry. Thus, the basis states, |φκ 〉,have K as a good quantum number, i.e., the intrinsic states are the eigenstates of the K-quantumnumber.
Quasiparticles defined in the deformed Nilsson + BCS calculations are the starting point ofthe PSM. The chosen qp subspace is spanned by the basis set
|φκ 〉 = {a†π |0〉, a†
πa†υ1
a†υ2
|0〉} (1)
where a†’s are the quasiparticle (qp) creation operators, ν’s (π ’s) denote the neutron (proton)Nilsson quantum numbers which run over low-lying orbitals and |0〉 is the Nilsson + BCS vac-uum (0-qp state). In Eq. (1), the low-lying 3-qp states selected for the many-body basis are thoseconsisting of 1-qp plus a pair of qp’s from nucleons of another kind. This selection is based onphysical considerations. In general, 3-qp states made by three nucleons of the same kind are alsoallowed, but such states usually lie higher in energy. The inclusion of the 3-qp configurationsis important for odd-mass nuclei for a description of the band-crossing phenomenon which iscaused by a rotation alignment of a pair of quasineutrons. Configurations of more than three qp’sare not included because these correspond to highly excited states. The PSM wave function canbe written as∣∣Ψ σ
IM
⟩ = ∑Kκ
f σκ P I
MK |φκ 〉,
with P IMK = 2I + 1
2
∫dΩ DI
MK(Ω)R(Ω). (2)
8π
4 P. Verma et al. / Nuclear Physics A 884–885 (2012) 1–20
The index σ labels the states with same angular momentum and κ the basis states. P IMK is the
angular momentum projection operator and f σκ are the weights of the basis state κ . The energies
and wave functions (given in terms of the coefficients f σκ in Eq. (2)) are obtained by solving the
following eigen-value equation:∑κ ′
{HI
κκ ′ − EσI NI
κκ ′}f σ
κ ′ = 0 (3)
where, HIκκ ′ and NI
κκ ′ are respectively the matrix elements of the Hamiltonian and the norm andare given as
HIκκ ′ = 〈φκ |H PKκK ′κ ′ |φκ ′ 〉,
NIκκ ′ = 〈φκ |P I
KκK ′κ ′ |φκ ′ 〉. (4)
The projection of an intrinsic state |φk〉 on a good angular momentum will generate a rota-tional energy
Eκ(I) = 〈φκ |H P IKK |φκ 〉
〈φκ |P IKK |φκ 〉 = HI
κκ
NIκκ
(5)
which can be plotted as a function of spin for various bands and important physics can be drawnfrom these plots. The Hamiltonian in the present study consists of following separable forces
H = H0 + HQP (6)
which represent different kinds of characteristic correlations between valence particles.The single-particle term, H0, contains a set of properly adjusted single-particle energies in the
Nilsson scheme and is given by
H0 =∑α
c†αEαcα (7)
where c†α and cα are the single-particle creation and annihilation operators respectively, and Eα
is the single-particle energy given by
Eα = hω[N − 2κl.s − κμ
(l2 − 〈l〉2)]. (8)
The second force HQP in Eq. (6) is of the quadrupole–quadrupole plus (monopole andquadrupole) pairing type, and contains three terms
HQP = −1
2χ
∑μ
Q†μQμ − GMP †P − GQ
∑μ
P †μPμ (9)
where, χ represents the strength of the quadrupole–quadrupole force and its value is adjusted in aself-consistent manner that it would give the empirical deformation ε2 as predicted in mean-fieldcalculations. The monopole-pairing force constant GM is adjusted to give the known energy gapsand is of the form
GM =(
G1 ∓ G2N − Z
A
)1
A(MeV). (10)
Here, “+” (“−”) is for protons (neutrons), and G1 and G2 are the coupling constants adjustedto yield the known odd–even mass differences. The remaining parameter, GQ, is the one associ-ated with the quadrupole pairing interaction, and it is set as 1/5 of the monopole pairing constant,
P. Verma et al. / Nuclear Physics A 884–885 (2012) 1–20 5
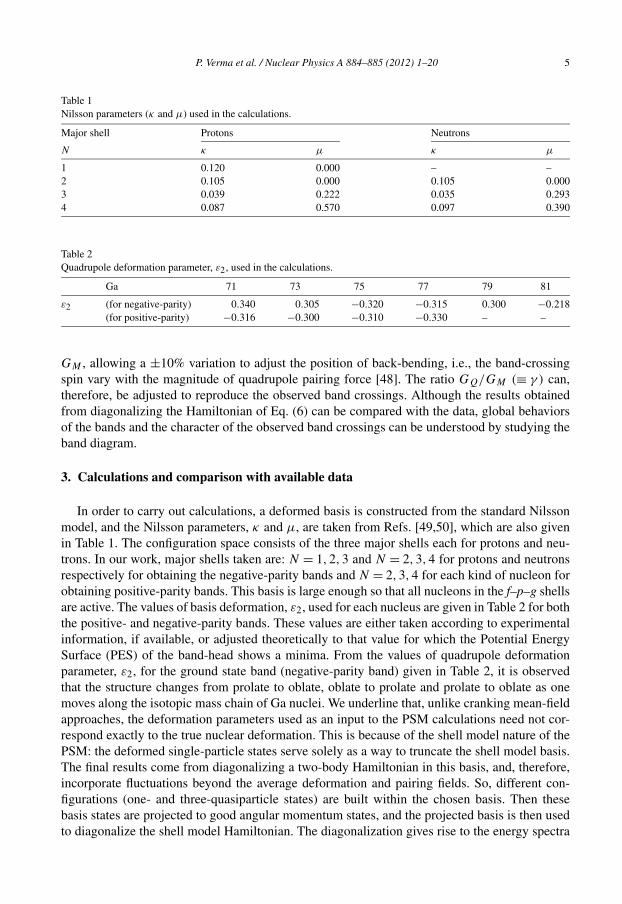
Table 1Nilsson parameters (κ and μ) used in the calculations.
Major shell Protons Neutrons
N κ μ κ μ
1 0.120 0.000 – –2 0.105 0.000 0.105 0.0003 0.039 0.222 0.035 0.2934 0.087 0.570 0.097 0.390
Table 2Quadrupole deformation parameter, ε2, used in the calculations.
Ga 71 73 75 77 79 81
ε2 (for negative-parity) 0.340 0.305 −0.320 −0.315 0.300 −0.218(for positive-parity) −0.316 −0.300 −0.310 −0.330 – –
GM , allowing a ±10% variation to adjust the position of back-bending, i.e., the band-crossingspin vary with the magnitude of quadrupole pairing force [48]. The ratio GQ/GM (≡ γ ) can,therefore, be adjusted to reproduce the observed band crossings. Although the results obtainedfrom diagonalizing the Hamiltonian of Eq. (6) can be compared with the data, global behaviorsof the bands and the character of the observed band crossings can be understood by studying theband diagram.
3. Calculations and comparison with available data
In order to carry out calculations, a deformed basis is constructed from the standard Nilssonmodel, and the Nilsson parameters, κ and μ, are taken from Refs. [49,50], which are also givenin Table 1. The configuration space consists of the three major shells each for protons and neu-trons. In our work, major shells taken are: N = 1,2,3 and N = 2,3,4 for protons and neutronsrespectively for obtaining the negative-parity bands and N = 2,3,4 for each kind of nucleon forobtaining positive-parity bands. This basis is large enough so that all nucleons in the f–p–g shellsare active. The values of basis deformation, ε2, used for each nucleus are given in Table 2 for boththe positive- and negative-parity bands. These values are either taken according to experimentalinformation, if available, or adjusted theoretically to that value for which the Potential EnergySurface (PES) of the band-head shows a minima. From the values of quadrupole deformationparameter, ε2, for the ground state band (negative-parity band) given in Table 2, it is observedthat the structure changes from prolate to oblate, oblate to prolate and prolate to oblate as onemoves along the isotopic mass chain of Ga nuclei. We underline that, unlike cranking mean-fieldapproaches, the deformation parameters used as an input to the PSM calculations need not cor-respond exactly to the true nuclear deformation. This is because of the shell model nature of thePSM: the deformed single-particle states serve solely as a way to truncate the shell model basis.The final results come from diagonalizing a two-body Hamiltonian in this basis, and, therefore,incorporate fluctuations beyond the average deformation and pairing fields. So, different con-figurations (one- and three-quasiparticle states) are built within the chosen basis. Then thesebasis states are projected to good angular momentum states, and the projected basis is then usedto diagonalize the shell model Hamiltonian. The diagonalization gives rise to the energy spectra
6 P. Verma et al. / Nuclear Physics A 884–885 (2012) 1–20
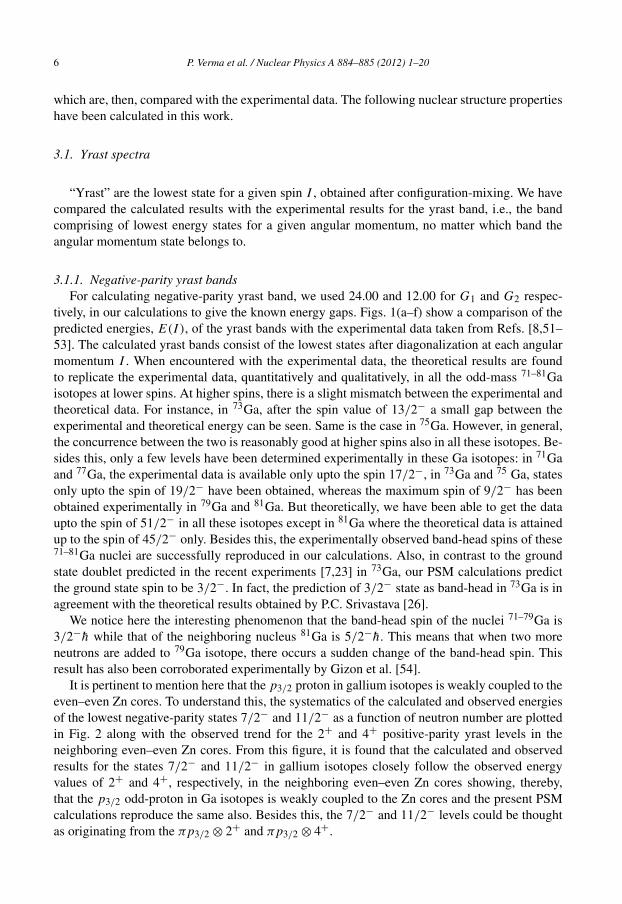
which are, then, compared with the experimental data. The following nuclear structure propertieshave been calculated in this work.
3.1. Yrast spectra
“Yrast” are the lowest state for a given spin I , obtained after configuration-mixing. We havecompared the calculated results with the experimental results for the yrast band, i.e., the bandcomprising of lowest energy states for a given angular momentum, no matter which band theangular momentum state belongs to.
3.1.1. Negative-parity yrast bandsFor calculating negative-parity yrast band, we used 24.00 and 12.00 for G1 and G2 respec-
tively, in our calculations to give the known energy gaps. Figs. 1(a–f) show a comparison of thepredicted energies, E(I), of the yrast bands with the experimental data taken from Refs. [8,51–53]. The calculated yrast bands consist of the lowest states after diagonalization at each angularmomentum I . When encountered with the experimental data, the theoretical results are foundto replicate the experimental data, quantitatively and qualitatively, in all the odd-mass 71–81Gaisotopes at lower spins. At higher spins, there is a slight mismatch between the experimental andtheoretical data. For instance, in 73Ga, after the spin value of 13/2− a small gap between theexperimental and theoretical energy can be seen. Same is the case in 75Ga. However, in general,the concurrence between the two is reasonably good at higher spins also in all these isotopes. Be-sides this, only a few levels have been determined experimentally in these Ga isotopes: in 71Gaand 77Ga, the experimental data is available only upto the spin 17/2−, in 73Ga and 75 Ga, statesonly upto the spin of 19/2− have been obtained, whereas the maximum spin of 9/2− has beenobtained experimentally in 79Ga and 81Ga. But theoretically, we have been able to get the dataupto the spin of 51/2− in all these isotopes except in 81Ga where the theoretical data is attainedup to the spin of 45/2− only. Besides this, the experimentally observed band-head spins of these71–81Ga nuclei are successfully reproduced in our calculations. Also, in contrast to the groundstate doublet predicted in the recent experiments [7,23] in 73Ga, our PSM calculations predictthe ground state spin to be 3/2−. In fact, the prediction of 3/2− state as band-head in 73Ga is inagreement with the theoretical results obtained by P.C. Srivastava [26].
We notice here the interesting phenomenon that the band-head spin of the nuclei 71–79Ga is3/2−h while that of the neighboring nucleus 81Ga is 5/2−h. This means that when two moreneutrons are added to 79Ga isotope, there occurs a sudden change of the band-head spin. Thisresult has also been corroborated experimentally by Gizon et al. [54].
It is pertinent to mention here that the p3/2 proton in gallium isotopes is weakly coupled to theeven–even Zn cores. To understand this, the systematics of the calculated and observed energiesof the lowest negative-parity states 7/2− and 11/2− as a function of neutron number are plottedin Fig. 2 along with the observed trend for the 2+ and 4+ positive-parity yrast levels in theneighboring even–even Zn cores. From this figure, it is found that the calculated and observedresults for the states 7/2− and 11/2− in gallium isotopes closely follow the observed energyvalues of 2+ and 4+, respectively, in the neighboring even–even Zn cores showing, thereby,that the p3/2 odd-proton in Ga isotopes is weakly coupled to the Zn cores and the present PSMcalculations reproduce the same also. Besides this, the 7/2− and 11/2− levels could be thoughtas originating from the πp3/2 ⊗ 2+ and πp3/2 ⊗ 4+.
P. Verma et al. / Nuclear Physics A 884–885 (2012) 1–20 7
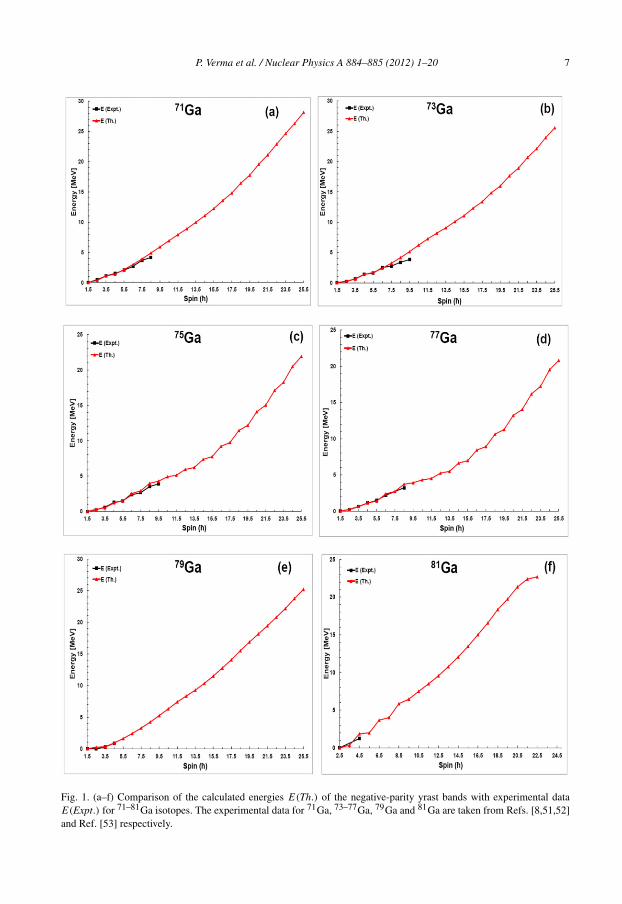
Fig. 1. (a–f) Comparison of the calculated energies E(Th.) of the negative-parity yrast bands with experimental dataE(Expt.) for 71–81Ga isotopes. The experimental data for 71Ga, 73–77Ga, 79Ga and 81Ga are taken from Refs. [8,51,52]and Ref. [53] respectively.

8 P. Verma et al. / Nuclear Physics A 884–885 (2012) 1–20
Fig. 2. Neutron-number dependence for the observed and calculated 7/2− and 11/2− states relative to yrast 3/2− levelsidentified in the odd-A Ga isotopes. The observed 2+ and 4+ excitation energies in the respective even–even Zn coresare shown for comparison.
3.1.2. Positive-parity bandsWe have also calculated the positive-parity yrast spectra for 71–77Ga and weighed the results
against the experimentally observed data which are shown in Figs. 3(a–d). The yrast spectra for79,81Ga with positive parity has not been calculated as the related experimental data for these nu-clei is not available. Though the positive-parity levels don’t form the ground state band in theseisotopes but the lowest positive-parity level (in energy) can be considered as the band-head ofthe positive-parity band. The 9/2+ level mark the band-head of the positive-parity cascade inthese 71–77Ga isotopes. The theoretical data obtained in all these isotopes is in satisfactory agree-ment with the experimental one over the entire range of available spin. Note that for obtainingthe positive-parity bands, we considered the three major shells: N = 2,3,4 for each kind of nu-cleon and the interactions G1 and G2 are taken as 20.20 and 10.00 respectively and the ratio ofGQ/GM as 0.35, which are same as used by Guo et al. [44] for mass 60 region. The quadrupoledeformation parameters, ε2, used in this case are listed in Table 2.
3.2. Structure of Yrast states from band diagrams
The energy of a theoretical band κ is defined by
Eκ(I) = 〈φκ |H P IKK |φκ 〉
〈φκ |P IKK |φκ 〉 = HI
κκ
NIκκ
(5)
which is the projected energy of a multi-quasiparticle configuration in Eq. (1) as a function ofspin I . An ensemble of projected configurations all plotted in one figure is called a band diagram[47]. In a band diagram, rotational behavior of each configuration as well as its relative energycompared to other configurations is easily visualized. Thus a band diagram serves as a very usefultool for analyzing the PSM results. Note that in the calculations, our configuration space is builtby many more quasiparticle (qp) bands, but we only plot a few most important ones to illustratethe physics. Moreover, we have marked each band with the corresponding qp configuration.
P. Verma et al. / Nuclear Physics A 884–885 (2012) 1–20 9
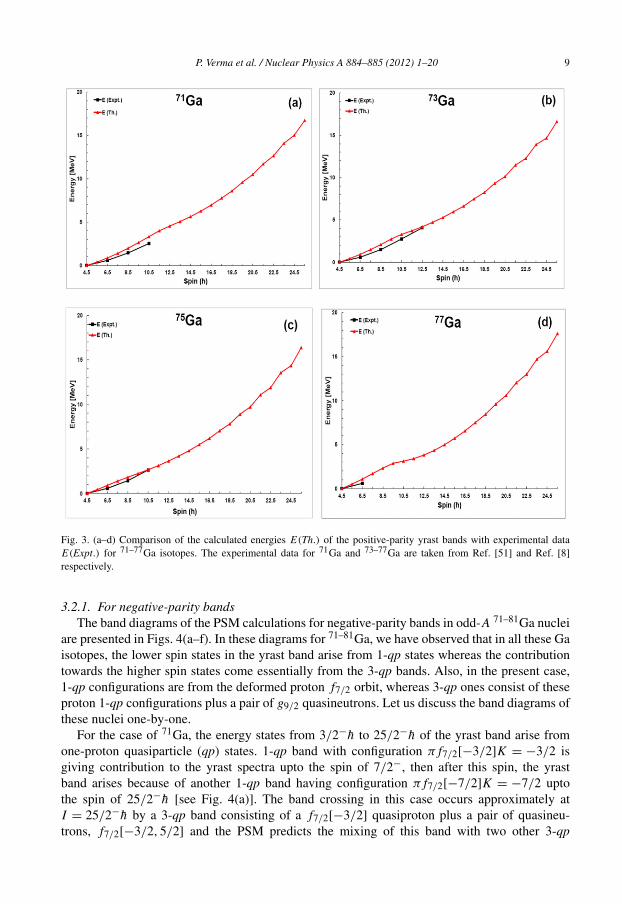
Fig. 3. (a–d) Comparison of the calculated energies E(Th.) of the positive-parity yrast bands with experimental dataE(Expt.) for 71–77Ga isotopes. The experimental data for 71Ga and 73–77Ga are taken from Ref. [51] and Ref. [8]respectively.
3.2.1. For negative-parity bandsThe band diagrams of the PSM calculations for negative-parity bands in odd-A 71–81Ga nuclei
are presented in Figs. 4(a–f). In these diagrams for 71–81Ga, we have observed that in all these Gaisotopes, the lower spin states in the yrast band arise from 1-qp states whereas the contributiontowards the higher spin states come essentially from the 3-qp bands. Also, in the present case,1-qp configurations are from the deformed proton f7/2 orbit, whereas 3-qp ones consist of theseproton 1-qp configurations plus a pair of g9/2 quasineutrons. Let us discuss the band diagrams ofthese nuclei one-by-one.
For the case of 71Ga, the energy states from 3/2−h to 25/2−h of the yrast band arise fromone-proton quasiparticle (qp) states. 1-qp band with configuration πf7/2[−3/2]K = −3/2 isgiving contribution to the yrast spectra upto the spin of 7/2−, then after this spin, the yrastband arises because of another 1-qp band having configuration πf7/2[−7/2]K = −7/2 uptothe spin of 25/2−h [see Fig. 4(a)]. The band crossing in this case occurs approximately atI = 25/2−h by a 3-qp band consisting of a f7/2[−3/2] quasiproton plus a pair of quasineu-trons, f7/2[−3/2,5/2] and the PSM predicts the mixing of this band with two other 3-qp
10 P. Verma et al. / Nuclear Physics A 884–885 (2012) 1–20
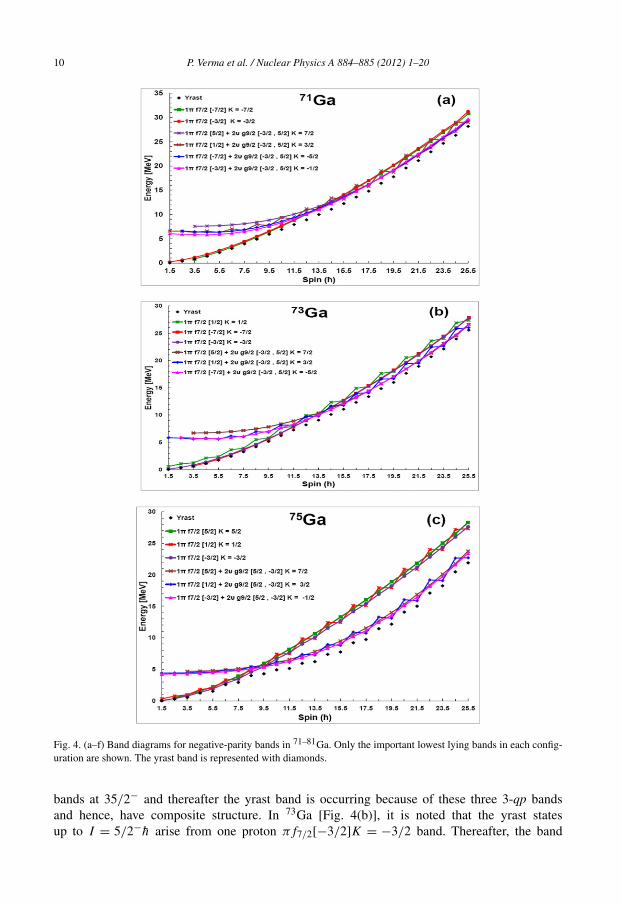
Fig. 4. (a–f) Band diagrams for negative-parity bands in 71–81Ga. Only the important lowest lying bands in each config-uration are shown. The yrast band is represented with diamonds.
bands at 35/2− and thereafter the yrast band is occurring because of these three 3-qp bandsand hence, have composite structure. In 73Ga [Fig. 4(b)], it is noted that the yrast statesup to I = 5/2−h arise from one proton πf7/2[−3/2]K = −3/2 band. Thereafter, the band
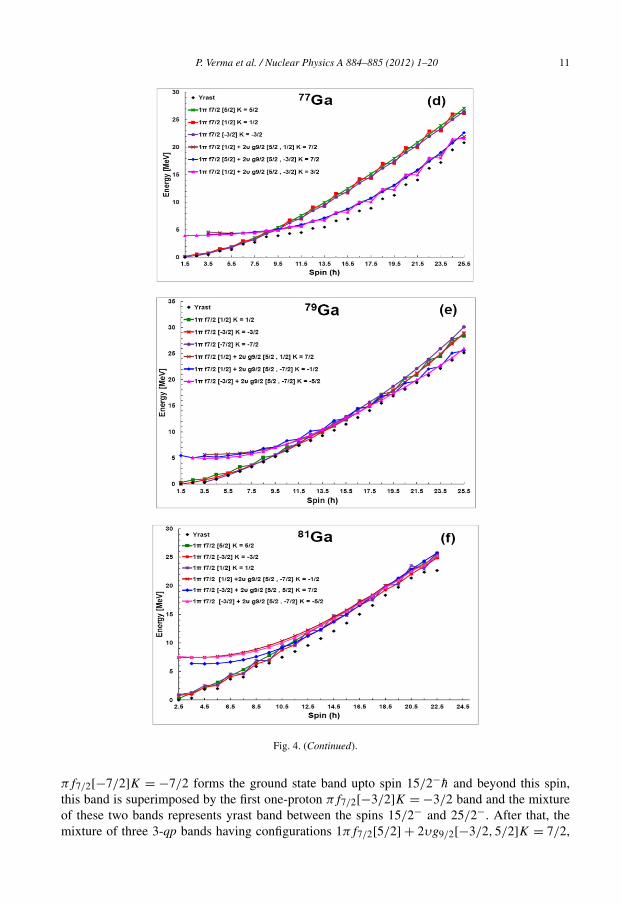
P. Verma et al. / Nuclear Physics A 884–885 (2012) 1–20 11
Fig. 4. (Continued).
πf7/2[−7/2]K = −7/2 forms the ground state band upto spin 15/2−h and beyond this spin,this band is superimposed by the first one-proton πf7/2[−3/2]K = −3/2 band and the mixtureof these two bands represents yrast band between the spins 15/2− and 25/2−. After that, themixture of three 3-qp bands having configurations 1πf7/2[5/2] + 2υg9/2[−3/2,5/2]K = 7/2,
12 P. Verma et al. / Nuclear Physics A 884–885 (2012) 1–20
1πf7/2[1/2] + 2υg9/2[−3/2,5/2]K = 3/2, and 1πf7/2[−7/2] + 2υg9/2[−3/2,5/2]K = −5/2are giving rise to the yrast band. Fig. 4(c) shows the band diagram for 75Ga. In this case, the 1-qpbands (πf7/2[5/2]K = 5/2, πf7/2[1/2]K = 1/2 and πf7/2[−3/2]K = −3/2) are contributingtowards the yrast spectra up to the spin value of 17/2−h which are, then, crossed by the three 3-qpbands (1πf7/2[5/2] + 2υg9/2[5/2,−3/2]K = 7/2, 1πf7/2[1/2] + 2υg9/2[5/2,−3/2]K = 3/2and 1πf7/2[−3/2] + 2υg9/2[5/2,−3/2]K = −1/2) at the spin of 19/2−h, which indicates thatthis nucleus has a composite structure at this spin. After spin of 19/2−, the yrast band is formedby these three 3-qp bands. For 77Ga, the crossing between the 1-qp and 3-qp bands occur at thespin of 19/2−h where, before this spin, the contribution towards the yrast band is entirely due to1-qp bands and after this spin, it is due to 3-qp bands only as shown in Fig. 4(d). The three 3-qpbands that contribute towards the yrast band in 77Ga after spin 19/2− are having the configura-tions; 1πf7/2[1/2] + 2υg9/2[5/2,1/2]K = 7/2, 1πf7/2[5/2] + 2υg9/2[5/2,−3/2]K = 7/2 and1πf7/2[1/2]+2υg9/2[5/2,−3/2]K = 3/2. Coming onto 79Ga, the spin states 3/2−h and 5/2−h
in the yrast band arise from the one-proton qp band πf7/2[−3/2]K = −3/2 whereas the states7/2−h to 13/2−h are due to another 1-qp band with configuration πf7/2[−7/2]K = −7/2. AtI = 15/2−h, these two bands merge together with another one-proton qp band πf7/2[1/2]K =1/2 and, subsequently, the yrast spectra is arising because of mixing of these three 1-qp bandsup to 19/2−h and hence, has multi-particle structure. From spin 21/2−h to 31/2−h, yrast spec-tra is due to two 1-qp bands, πf7/2[−3/2]K = −3/2 and πf7/2[1/2]K = 1/2. In this case,band crossing occurs at the spin of 33/2− and afterwards, two 3-qp bands (1πf7/2[1/2] +2υg9/2[5/2,−7/2]K = −1/2 and 1πf7/2[−3/2] + 2υg9/2[5/2,−7/2]K = −5/2) dominate thecontribution towards the yrast band [see Fig. 4(e)]. The interaction of three one-proton qp bandsare responsible for the yrast spectra upto the spin of 23/2−h in 81Ga which are, then, crossedby one 3-qp band that has a configuration of a quasiproton state f7/2[−3/2] plus a pair ofquasineutrons, g9/2[5/2,5/2] at the spin of 25/2−h. Up to the spin 33/2−h, this 3-qp bandis contributing towards the yrast band while from 35/2−h onwards, again, the one-qp bands,πf7/2[1/2]K = 1/2 and πf7/2[−3/2]K = −3/2 are causing the yrast spectra in this nucleus asshown in Fig. 4(f).
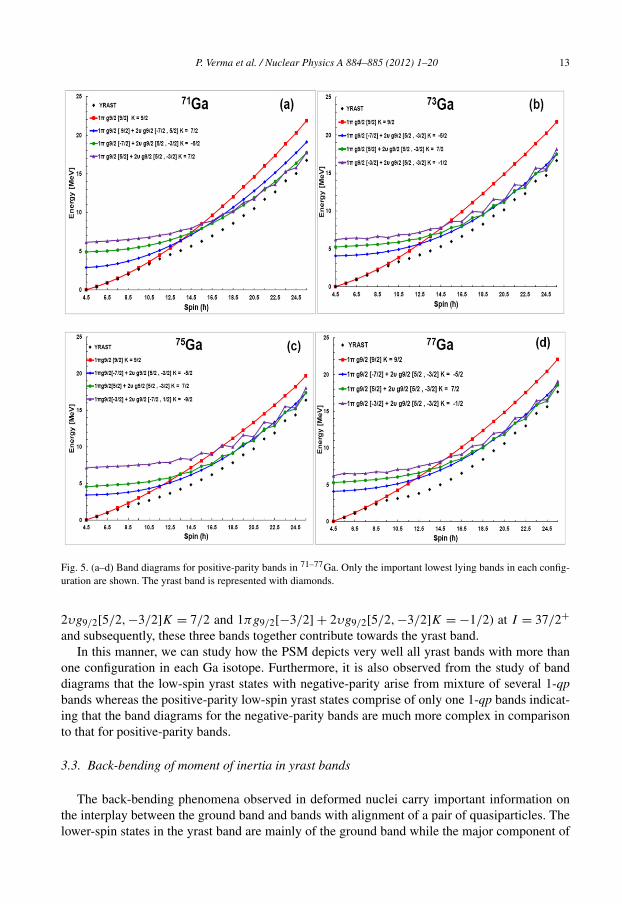
3.2.2. For positive-parity bandsFrom the band diagrams for positive-parity bands in 71,73,75,77Ga, shown in Figs. 5(a–d), one
can make out that the low-spin states in the yrast bands in these isotopes are represented by aquasiproton K = 9/2 state from πg9/2. This configuration implies that the low-spin states inthese nuclei are based on the decoupled g9/2 protons. For 71Ga, the yrast band at low spins isarising because of this 1-quasiproton band, πg9/2[9/2], which is crossed by a 3-qp (one protonplus a pair of quasineutron) 1πg9/2[9/2] + 2υg9/2[−7/2,5/2]K = 7/2 band at the spin valueof 27/2+h. There is another band crossing at I = 31/2-, which is caused by a 3-qp state of ag9/2[−7/2] quasiproton plus a pair of quasineutrons, g9/2[5/2,−3/2] [see Fig. 5(a)]. In 73Ga, theband crossing in the yrast band occurs approximately at I = 25/2+. The band which generatesthis crossing is a 3-qp state consisting of a g9/2[−7/2] quasiproton plus a pair of quasineutrons,g9/2[5/2,−3/2]. The PSM, further, predicts a mixing of 3-qp bands in this isotope at I = 37/2+and onwards as shown in Fig. 5(b). In 75Ga, the band crossing is observed at I = 25/2+ by a3-qp band having configuration of a quasiproton state g9/2[−7/2] plus a pair of quasineutrons,g9/2[5/2,−3/2] [see Fig. 5(c)]. For 77Ga, we can see from Fig. 5(d) that the band crossingoccurs at I = 25/2+. The crossing band is identified as a 3-qp band. This band is generated bya quasiproton state g9/2[−7/2] plus a pair state of quasineutrons, g9/2[5/2,−3/2] with band-head −5/2. A mixing of this band occur with two more 3-quasiparticle bands (1πg9/2[5/2] +
P. Verma et al. / Nuclear Physics A 884–885 (2012) 1–20 13
Fig. 5. (a–d) Band diagrams for positive-parity bands in 71–77Ga. Only the important lowest lying bands in each config-uration are shown. The yrast band is represented with diamonds.
2υg9/2[5/2,−3/2]K = 7/2 and 1πg9/2[−3/2] + 2υg9/2[5/2,−3/2]K = −1/2) at I = 37/2+and subsequently, these three bands together contribute towards the yrast band.
In this manner, we can study how the PSM depicts very well all yrast bands with more thanone configuration in each Ga isotope. Furthermore, it is also observed from the study of banddiagrams that the low-spin yrast states with negative-parity arise from mixture of several 1-qpbands whereas the positive-parity low-spin yrast states comprise of only one 1-qp bands indicat-ing that the band diagrams for the negative-parity bands are much more complex in comparisonto that for positive-parity bands.
3.3. Back-bending of moment of inertia in yrast bands
The back-bending phenomena observed in deformed nuclei carry important information onthe interplay between the ground band and bands with alignment of a pair of quasiparticles. Thelower-spin states in the yrast band are mainly of the ground band while the major component of
14 P. Verma et al. / Nuclear Physics A 884–885 (2012) 1–20
the higher-spin states belongs to the bands with aligned quasiparticles. The mechanism of back-bending can be explained as a result of the crossing of the ground band with another rotationalband with a larger moment of inertia.
3.3.1. For negative-parity bandsIn Figs. 6(a–f), we present the comparison of the PSM results on back-bending in moment of
inertia of negative-parity yrast bands with the experimental data, where we have plotted twicethe kinetic moment of inertia, �(1), as a function of rotational frequency squared (h2ω2). Thesequantities are defined as in [45]
2�(1) = (2I − 1)
ω(11)
and
hω = Eγ√(I + 1)(I + 2) − K2 − √
(I − 1)I − K2(12)
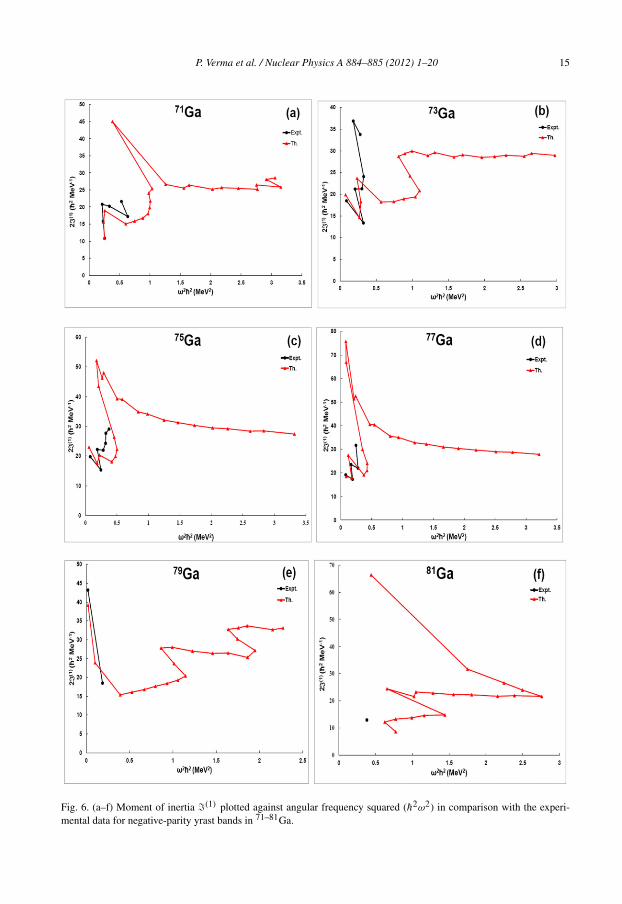
where, Eγ = E(I) − E(I − 2).From the results presented in Figs. 6(a–f), following inferences can be drawn:For 71Ga, the experimental back-bending occurs at the rotational frequency 0.635 MeV2
whereas theoretically, the back-bending in moment of inertia is observed at 1.036 MeV2 which isnot in very good agreement but at the same time, it is also observed from the results on band dia-grams for 71Ga that there occurs a band crossing at 25/2− which is supported by the theoreticallyobtained back-bending at this spin in this nucleus.
On the other hand, for 73Ga, theoretically, back-bending in moment of inertia is observedat the rotational frequency of 0.287 MeV2 which corresponds to the spin of 11/2− which is,somewhat, in agreement with the experimental value of 0.323 MeV2 corresponding to the spinvalue of 9/2−.
For 75Ga, the experimental and theoretical back-bendings are observed at the rotational fre-quencies (h2ω2) of 0.245 MeV2 and 0.456 MeV2 respectively.
Next talking about 77Ga, both the experimental and theoretical back-bendings are observedat the same spin of 9/2− with the corresponding rotational frequencies 0.192 MeV2 and0.179 MeV2 respectively.
Not much experimental data is available on 79Ga and 81Ga, though we have obtained the back-bending theoretically in these isotopes at h2ω2 = 1.147 MeV2 and 0.773 MeV2 respectively.
To conclude, in some of the Ga isotopes, back-bending is predicted theoretically approxi-mately at the same rotational frequencies as observed experimentally.
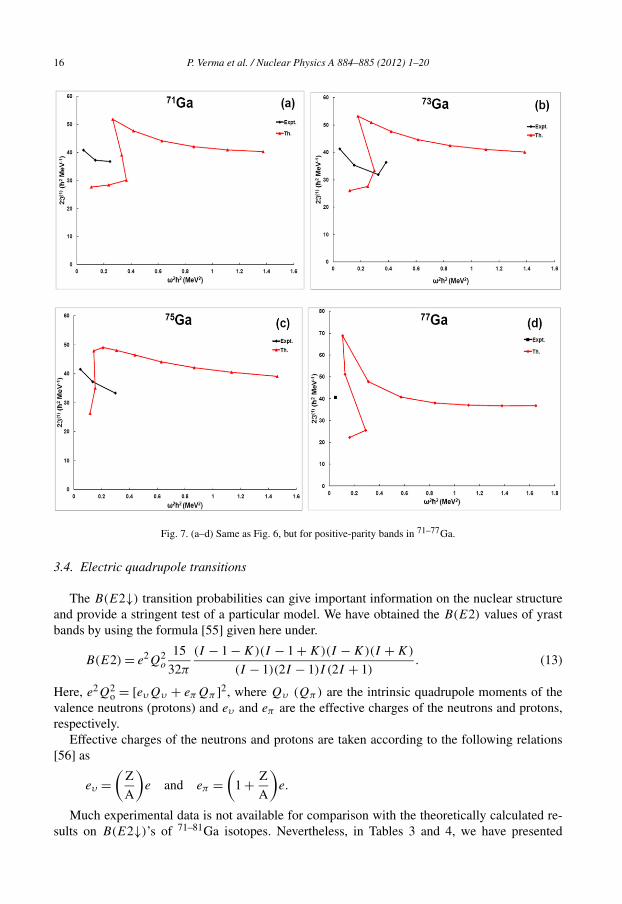
3.3.2. For positive-parity bandsFor the positive-parity bands, back-bending plots are presented in Figs. 7(a–d). Theoretically,
back-bending has been predicted in 71Ga, 73Ga and 77Ga isotopes, however, experimentally,no back-bending has been observed in these isotopes. For 71Ga and 73Ga, PSM predicts back-bendings at the same spin of 21/2+ corresponding to the values of rotational frequency of0.366 MeV2 and 0.298 MeV2 respectively, whereas for 77Ga, back-bending is predicted the-oretically at I = 17/2+ corresponding to the rotational frequency of 0.291 MeV2. In 75Ga, anup-bending is predicted theoretically at the spin 17/2+ with corresponding rotational frequency,h2ω2, of 0.154 MeV2 whereas experimentally, no back-bending or up-bending is observed inthis isotope. Moreover, our results show somewhat lower values of moment of inertia than theexperimental values.
P. Verma et al. / Nuclear Physics A 884–885 (2012) 1–20 15
Fig. 6. (a–f) Moment of inertia �(1) plotted against angular frequency squared (h2ω2) in comparison with the experi-mental data for negative-parity yrast bands in 71–81Ga.
16 P. Verma et al. / Nuclear Physics A 884–885 (2012) 1–20
Fig. 7. (a–d) Same as Fig. 6, but for positive-parity bands in 71–77Ga.
3.4. Electric quadrupole transitions
The B(E2↓) transition probabilities can give important information on the nuclear structureand provide a stringent test of a particular model. We have obtained the B(E2) values of yrastbands by using the formula [55] given here under.
B(E2) = e2Q2o
15
32π
(I − 1 − K)(I − 1 + K)(I − K)(I + K)
(I − 1)(2I − 1)I (2I + 1). (13)
Here, e2Q2o = [eυQυ + eπQπ ]2, where Qυ (Qπ) are the intrinsic quadrupole moments of the
valence neutrons (protons) and eυ and eπ are the effective charges of the neutrons and protons,respectively.
Effective charges of the neutrons and protons are taken according to the following relations[56] as
eυ =(
Z
A
)e and eπ =
(1 + Z
A
)e.
Much experimental data is not available for comparison with the theoretically calculated re-sults on B(E2↓)’s of 71–81Ga isotopes. Nevertheless, in Tables 3 and 4, we have presented
P. Verma et al. / Nuclear Physics A 884–885 (2012) 1–20 17
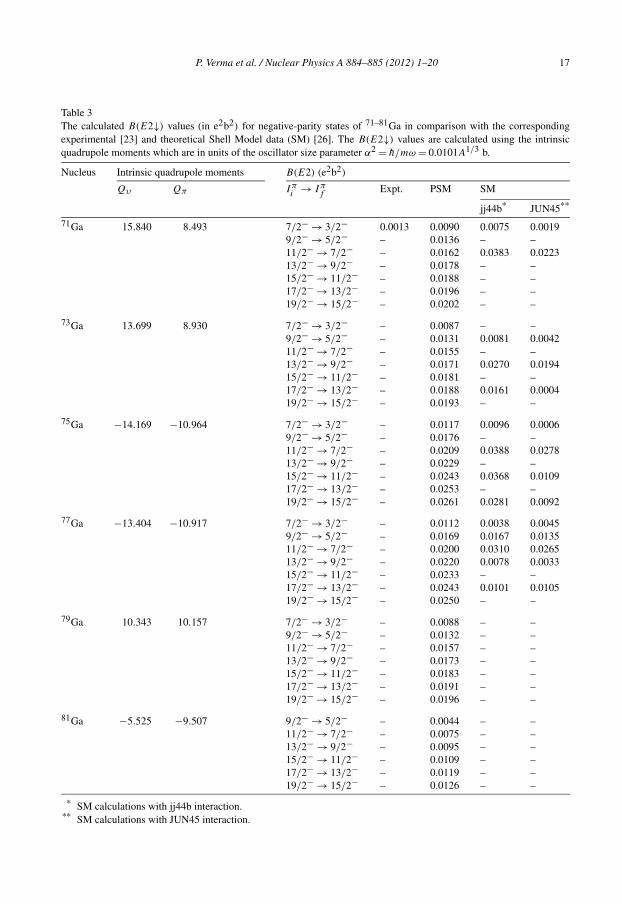
Table 3The calculated B(E2↓) values (in e2b2) for negative-parity states of 71–81Ga in comparison with the correspondingexperimental [23] and theoretical Shell Model data (SM) [26]. The B(E2↓) values are calculated using the intrinsicquadrupole moments which are in units of the oscillator size parameter α2 = h/mω = 0.0101A1/3 b.
Nucleus Intrinsic quadrupole moments B(E2) (e2b2)
Qυ Qπ Iπi
→ Iπf
Expt. PSM SM
jj44b* JUN45**
71Ga 15.840 8.493 7/2− → 3/2− 0.0013 0.0090 0.0075 0.00199/2− → 5/2− – 0.0136 – –11/2− → 7/2− – 0.0162 0.0383 0.022313/2− → 9/2− – 0.0178 – –15/2− → 11/2− – 0.0188 – –17/2− → 13/2− – 0.0196 – –19/2− → 15/2− – 0.0202 – –
73Ga 13.699 8.930 7/2− → 3/2− – 0.0087 – –9/2− → 5/2− – 0.0131 0.0081 0.004211/2− → 7/2− – 0.0155 – –13/2− → 9/2− – 0.0171 0.0270 0.019415/2− → 11/2− – 0.0181 – –17/2− → 13/2− – 0.0188 0.0161 0.000419/2− → 15/2− – 0.0193 – –
75Ga −14.169 −10.964 7/2− → 3/2− – 0.0117 0.0096 0.00069/2− → 5/2− – 0.0176 – –11/2− → 7/2− – 0.0209 0.0388 0.027813/2− → 9/2− – 0.0229 – –15/2− → 11/2− – 0.0243 0.0368 0.010917/2− → 13/2− – 0.0253 – –19/2− → 15/2− – 0.0261 0.0281 0.0092
77Ga −13.404 −10.917 7/2− → 3/2− – 0.0112 0.0038 0.00459/2− → 5/2− – 0.0169 0.0167 0.013511/2− → 7/2− – 0.0200 0.0310 0.026513/2− → 9/2− – 0.0220 0.0078 0.003315/2− → 11/2− – 0.0233 – –17/2− → 13/2− – 0.0243 0.0101 0.010519/2− → 15/2− – 0.0250 – –
79Ga 10.343 10.157 7/2− → 3/2− – 0.0088 – –9/2− → 5/2− – 0.0132 – –11/2− → 7/2− – 0.0157 – –13/2− → 9/2− – 0.0173 – –15/2− → 11/2− – 0.0183 – –17/2− → 13/2− – 0.0191 – –19/2− → 15/2− – 0.0196 – –
81Ga −5.525 −9.507 9/2− → 5/2− – 0.0044 – –11/2− → 7/2− – 0.0075 – –13/2− → 9/2− – 0.0095 – –15/2− → 11/2− – 0.0109 – –17/2− → 13/2− – 0.0119 – –19/2− → 15/2− – 0.0126 – –
* SM calculations with jj44b interaction.** SM calculations with JUN45 interaction.
18 P. Verma et al. / Nuclear Physics A 884–885 (2012) 1–20
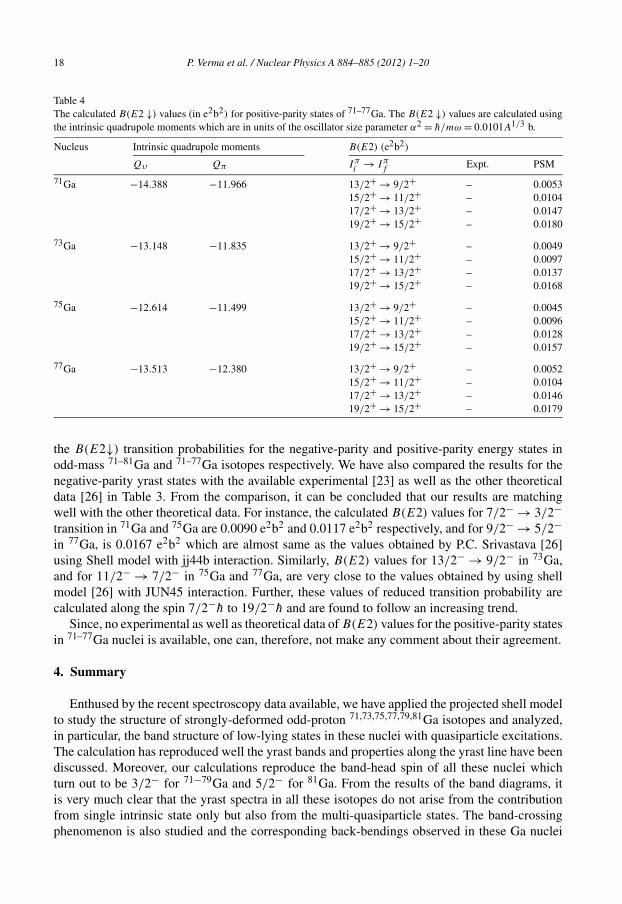
Table 4The calculated B(E2 ↓) values (in e2b2) for positive-parity states of 71–77Ga. The B(E2 ↓) values are calculated usingthe intrinsic quadrupole moments which are in units of the oscillator size parameter α2 = h/mω = 0.0101A1/3 b.
Nucleus Intrinsic quadrupole moments B(E2) (e2b2)
Qυ Qπ Iπi
→ Iπf
Expt. PSM
71Ga −14.388 −11.966 13/2+ → 9/2+ – 0.005315/2+ → 11/2+ – 0.010417/2+ → 13/2+ – 0.014719/2+ → 15/2+ – 0.0180
73Ga −13.148 −11.835 13/2+ → 9/2+ – 0.004915/2+ → 11/2+ – 0.009717/2+ → 13/2+ – 0.013719/2+ → 15/2+ – 0.0168
75Ga −12.614 −11.499 13/2+ → 9/2+ – 0.004515/2+ → 11/2+ – 0.009617/2+ → 13/2+ – 0.012819/2+ → 15/2+ – 0.0157
77Ga −13.513 −12.380 13/2+ → 9/2+ – 0.005215/2+ → 11/2+ – 0.010417/2+ → 13/2+ – 0.014619/2+ → 15/2+ – 0.0179
the B(E2↓) transition probabilities for the negative-parity and positive-parity energy states inodd-mass 71–81Ga and 71–77Ga isotopes respectively. We have also compared the results for thenegative-parity yrast states with the available experimental [23] as well as the other theoreticaldata [26] in Table 3. From the comparison, it can be concluded that our results are matchingwell with the other theoretical data. For instance, the calculated B(E2) values for 7/2− → 3/2−transition in 71Ga and 75Ga are 0.0090 e2b2 and 0.0117 e2b2 respectively, and for 9/2− → 5/2−in 77Ga, is 0.0167 e2b2 which are almost same as the values obtained by P.C. Srivastava [26]using Shell model with jj44b interaction. Similarly, B(E2) values for 13/2− → 9/2− in 73Ga,and for 11/2− → 7/2− in 75Ga and 77Ga, are very close to the values obtained by using shellmodel [26] with JUN45 interaction. Further, these values of reduced transition probability arecalculated along the spin 7/2−h to 19/2−h and are found to follow an increasing trend.
Since, no experimental as well as theoretical data of B(E2) values for the positive-parity statesin 71–77Ga nuclei is available, one can, therefore, not make any comment about their agreement.
4. Summary
Enthused by the recent spectroscopy data available, we have applied the projected shell modelto study the structure of strongly-deformed odd-proton 71,73,75,77,79,81Ga isotopes and analyzed,in particular, the band structure of low-lying states in these nuclei with quasiparticle excitations.The calculation has reproduced well the yrast bands and properties along the yrast line have beendiscussed. Moreover, our calculations reproduce the band-head spin of all these nuclei whichturn out to be 3/2− for 71−79Ga and 5/2− for 81Ga. From the results of the band diagrams, itis very much clear that the yrast spectra in all these isotopes do not arise from the contributionfrom single intrinsic state only but also from the multi-quasiparticle states. The band-crossingphenomenon is also studied and the corresponding back-bendings observed in these Ga nuclei
P. Verma et al. / Nuclear Physics A 884–885 (2012) 1–20 19
have been discussed. Despite recent experimental efforts, high-spin data on these odd-proton nu-clei are still sparse, making it difficult for a detailed comparison with the theoretical predictionfor the band-crossing region. Further, experimental B(E2) values for these nuclei are not avail-able at present but we have calculated these values for both negative- and positive-parity energystates. Future experimental confirmation for the present predictions of excited bands and B(E2)
values will help one to understand the collective evolution along the yrast line and quasiparticlestructure in these nuclei. Apart from this, the experimental indication of shape transition in Ganuclei with 40 � N � 50 has also been established in our calculations.
Acknowledgements
The authors would like to thank Prof. J.A. Sheikh and Prof. Y. Sun for providing us the codeof PSM.
References
[1] O. Perru, et al., Phys. Rev. Lett. 96 (2006) 232501.[2] J. Hakala, et al., Phys. Rev. Lett. 101 (2008) 052502.[3] I. Stefanescu, et al., Phys. Rev. C 79 (2009) 034319.[4] I. Stefanescu, et al., Phys. Rev. Lett. 100 (2008) 112502.[5] J. Van de Walle, et al., Phys. Rev. C 79 (2009) 014309.[6] J. Van de Walle, et al., Phys. Rev. Lett. 99 (2007) 142501.[7] B. Cheal, et al., Phys. Rev. Lett. 104 (2010) 252502.[8] I. Stefanescu, et al., Phys. Rev. C 79 (2009) 064302.[9] N. Yoshinaga, K. Higashiyama, P.H. Regan, Phys. Rev. C 78 (2008) 044320.
[10] M. Honma, T. Otsuka, T. Mizusaki, M. Hjorth-Jensen, Phys. Rev. C 80 (2009) 064323.[11] H. Iwasaki, et al., Phys. Rev. C 78 (2008) 021304(R).[12] M. Behar, A. Filevich, G. Garcia-Bermudez, M.A.J. Mariscotti, Phys. Rev. C 17 (1978) 516.[13] B. Zeidman, R.H. Siemssen, G.C. Morrison, L.L. Lee Jr., Phys. Rev. C 9 (1974) 409.[14] G. Rotbard, G. LaRana, M. Vergnes, G. Berrier, J. Kalifa, F. Guilbault, R. Tamisier, Phys. Rev. C 18 (1978) 86.[15] G. Rotbard, M. Vergnes, G. Berrier-Ronsin, J. Vernotte, Phys. Rev. C 21 (1980) 2293.[16] B.P. Kay, et al., Phys. Rev. C 79 (2009) 021301(R), XUNDL, http://www.nndc.bnl.gov.[17] W.H. Zoller, W.B. Walters, G.E. Gordon, Nucl. Phys. A 142 (1970) 177.[18] E. Runte, et al., Nucl. Phys. A 399 (1983) 163.[19] B. Ekstrom, B. Fogelberg, P. Hoff, E. Lund, A. Sangariyavanish, Phys. Scr. 34 (1986) 614.[20] A. Riccato, P. David, Nucl. Phys. A 228 (1974) 461.[21] M.N. Vergnes, G. Rotbard, E.R. Flynn, D.L. Hanson, S.D. Orbesen, F. Guilbault, D. Ardouin, C. Lebrun, Phys. Rev.
C 19 (1979) 1276.[22] R.G. Couch, J.A. Biggerstaff, F.G. Perey, S. Raman, K.K. Seth, Phys. Rev. C 2 (1970) 149.[23] J. Diriken, et al., Phys. Rev. C 82 (2010) 064309.[24] D. Verney, et al., Phys. Rev. C 76 (2007) 054312.[25] M. Weiszflog, et al., Eur. Phys. J. A 11 (2001) 25.[26] P.C. Srivastava, J. Phys. G 39 (2012) 015102.[27] E. Mané, et al., Phys. Rev. C 84 (2011) 024303.[28] Y. Sun, M. Guidry, Phys. Rev. C 52 (1995) R2844.[29] Y. Sun, J.-Y. Zhang, M. Guidry, Phys. Rev. Lett. 78 (1997) 2321.[30] Y. Sun, J.-Y. Zhang, M. Guidry, C.-L. Wu, Phys. Rev. Lett. 83 (1999) 686.[31] R. Palit, J.A. Sheikh, Y. Sun, H.C. Jain, Phys. Rev. C 67 (2003) 014321.[32] N. Marginean, et al., Phys. Rev. C 69 (2004) 054301.[33] R.A. Kaye, et al., Phys. Rev. C 75 (2007) 034311.[34] V. Velazquez, J. Hirsch, Y. Sun, M. Guidry, Nucl. Phys. A 653 (1999) 355.[35] V. Velazquez, J. Hirsch, Y. Sun, Nucl. Phys. A 686 (2001) 129.[36] R. Devi, B.D. Sehgal, S.K. Khosa, J.A. Sheikh, Phys. Rev. C 72 (2005) 064304.
20 P. Verma et al. / Nuclear Physics A 884–885 (2012) 1–20
[37] B.D. Sehgal, R. Devi, S.K. Khosa, J. Phys. G 32 (2006) 1211.[38] S. Verma, P.A. Dar, R. Devi, Phys. Rev. C 77 (2008) 024308.[39] F. Al-Khudair, G.-L. Long, Y. Sun, Phys. Rev. C 79 (2009) 034320.[40] Y. Sun, Y.-C. Yang, H.-L. Liu, K. Kaneko, M. Hasegawa, T. Mizusaki, Phys. Rev. C 80 (2009) 054306.[41] Y.-X. Liu, Y. Sun, X.-H. Zhou, Y.-H. Zhang, S.-Y. Yu, Y.-C. Yang, H. Jin, Nucl. Phys. A 658 (2011) 11.[42] R. Palit, J.A. Sheikh, Y. Sun, H.C. Jain, Nucl. Phys. A 686 (2001) 141.[43] Y. Sun, Eur. Phys. J. A 20 (2004) 133.[44] D. Bucurescu, et al., Phys. Rev. C 69 (2004) 064319.[45] A. Ibáñnez-Sandoval, M.E. Ortiz, V. Velázquez, A. Galindo-Uribarri, P.O. Hess, Y. Sun, Phys. Rev. C 83 (2011)
034308.[46] R.S. Guo, L.M. Chen, Chinese J. Phys. 41 (2003) 1.[47] K. Hara, Y. Sun, Int. J. Mod. Phys. E 4 (1995) 637.[48] Y. Sun, S.X. Wen, D.H. Feng, Phys. Rev. Lett. 72 (1994) 3483.[49] J.-Y. Zhang, et al., J. Phys. G 13 (1987) L75.[50] Yang Sun, Jing-ye Zhang, Mike Guidry, Jie Meng, Soojae Im, Phys. Rev. C 62 (2000) 021601(R).[51] Khalifeh Abusaleem, Balraj Singh, Nucl. Data Sheets 112 (2011) 133.[52] Balraj Singh, Nucl. Data Sheets 96 (2002) 1.[53] Coral M. Baglin, Nucl. Data Sheets 109 (2008) 2257.[54] A. Gizon, et al., Nucl. Phys. A 605 (1996) 301.[55] A. Bohr, B.R. Mottelson, Nuclear Structure, vol. II, W.A. Benjamin, Reading, MA, 1975.[56] S. Raman, C.W. Nestor Jr., P. Tikkanen, At. Data Nucl. Data Tables 78 (2001) 1.