Embed Size (px)
Citation preview
Solid Earth, 5, 1319–1327, 2014
www.solid-earth.net/5/1319/2014/
doi:10.5194/se-5-1319-2014
© Author(s) 2014. CC Attribution 3.0 License.
Microscale strain partitioning? Differential quartz crystallographic
fabric development in Phyllite, Hindu Kush, Northwestern Pakistan
K. P. Larson1, J. L. Lamming2,1, and S. Faisal1
1Earth and Environmental Sciences, University of British Columbia, Okanagan, 3247 University Way,
Kelowna, BC V1V 1V7, Canada2Department of Geological Sciences, University of Saskatchewan, 114 Science Place, Saskatoon,
SK S7N 5E2, Canada
Correspondence to: K. P. Larson ([email protected])
Received: 12 August 2014 – Published in Solid Earth Discuss.: 3 September 2014
Revised: 10 November 2014 – Accepted: 19 November 2014 – Published: 16 December 2014
Abstract. Spatially referenced quartz c axis fabrics demon-
strate the preservation of multiple, distinct fabrics in a spec-
imen collected from northwestern Pakistan. The overall fab-
ric yielded by the specimen is dominated by a single pop-
ulation of quartz grains, while the fabric signatures of two
other unique, spatially distinct populations are overwhelmed.
It is these minor fabrics, however, that provide informa-
tion on temperature of deformation (403± 50 ◦C), differ-
ential stress (8.6+ 2.6/−1.5 MPa to 15.0 +3.8/−2.5 MPa),
strain rate (10−16 s−1 to 10−15 s−1), and strain partitioning
recorded by the specimen.
1 Introduction
Crystallographic analysis has been long employed to study
the strain histories recorded by rock forming minerals (e.g.
Turner, 1942; Sander, 1950; Bouchez and Pêcher, 1976;
Zhang and Karato, 1995). While investigation of crystal-
lographic fabrics have been successfully carried out on a
wide variety of mineral phases, quartz has been one of the
most common targets to elucidate strain within continental
crust due to its near ubiquity in such rocks. The develop-
ment of crystallographic fabrics in quartz has been actively
investigated (e.g. Lister and Williams, 1979; Schmid and
Casey, 1986) and utilized in studies of geologic material (e.g.
Bouchez and Pêcher, 1976; Blumenfeld et al., 1986; Law
et al., 1990, 2004, 2011, 2013; Xypolias and Koukouvelas,
2001; Larson and Cottle, 2014) during the past 5 decades.
While advances in our understanding and implications of the
fabrics have advanced, so too have the methods available
to extract lattice orientation data. Universal stages are still
employed to generate quartz c axis crystallographic fabrics
(e.g. Kile, 2009); however, more technical methods such as
x-ray goniometry (e.g. Wenk, 1985) and electron backscat-
tered diffraction (EBSD) (e.g. Prior et al., 1999) can poten-
tially provide a higher density of information and orienta-
tion data for secondary axes. In addition, techniques utilizing
EBSD and automated optical fabric analysers (e.g. Heilbron-
ner and Pauli, 1993; Feuten and Goodchild, 2001; Wilson
et al., 2003, 2007; Pajdzik and Glazer, 2006) have the ad-
vantage of producing spatially referenced data with the abil-
ity to automatically generate achsenverteilungsanalyse (AVA
or axial distribution diagrams) (e.g. Sander, 1950). Such a
diagram, essentially a map of crystallographic orientation
within the specimen analysed, can help facilitate the investi-
gation and comparison of spatially distinct grains, groups of
grains, or zones within a specimen. Spatially referenced crys-
tallographic fabrics also allow for the investigation of strain
recorded in grains of various sizes, the potential effects of
matrix phases, and the spatial positioning of grains adjacent
to local features such as porphyroclasts.
One significant application of spatially referenced crys-
tallographic fabric data is to examine within-specimen fab-
ric orientation heterogeneities. This type of analysis has
been employed to distinguish between preferred orientations
in new, recrystallized grains vs. relict porphyroclasts (e.g.
Law et al., 2010) and to identify variable dissolution in
quartz veins (Wilson et al., 2009). Such studies highlight the
potentially significant differences in crystallographic fabric
Published by Copernicus Publications on behalf of the European Geosciences Union.
1320 K. P. Larson et al.: Differential quartz crystallographic fabric development in Phyllite
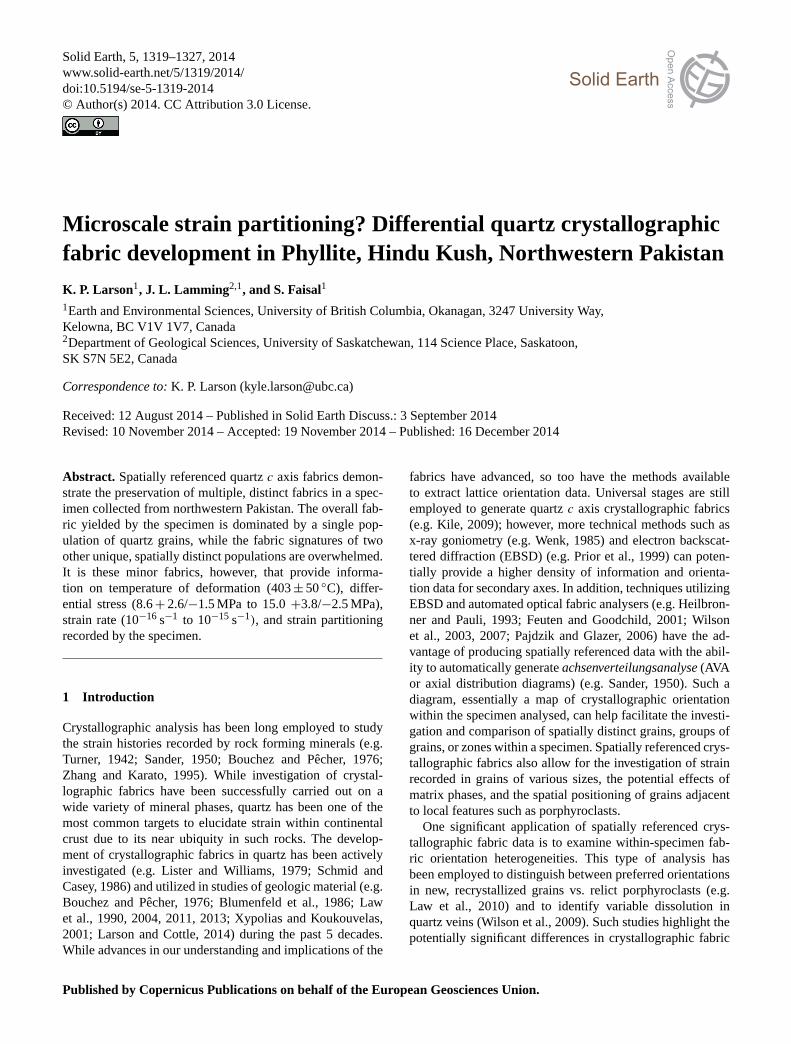
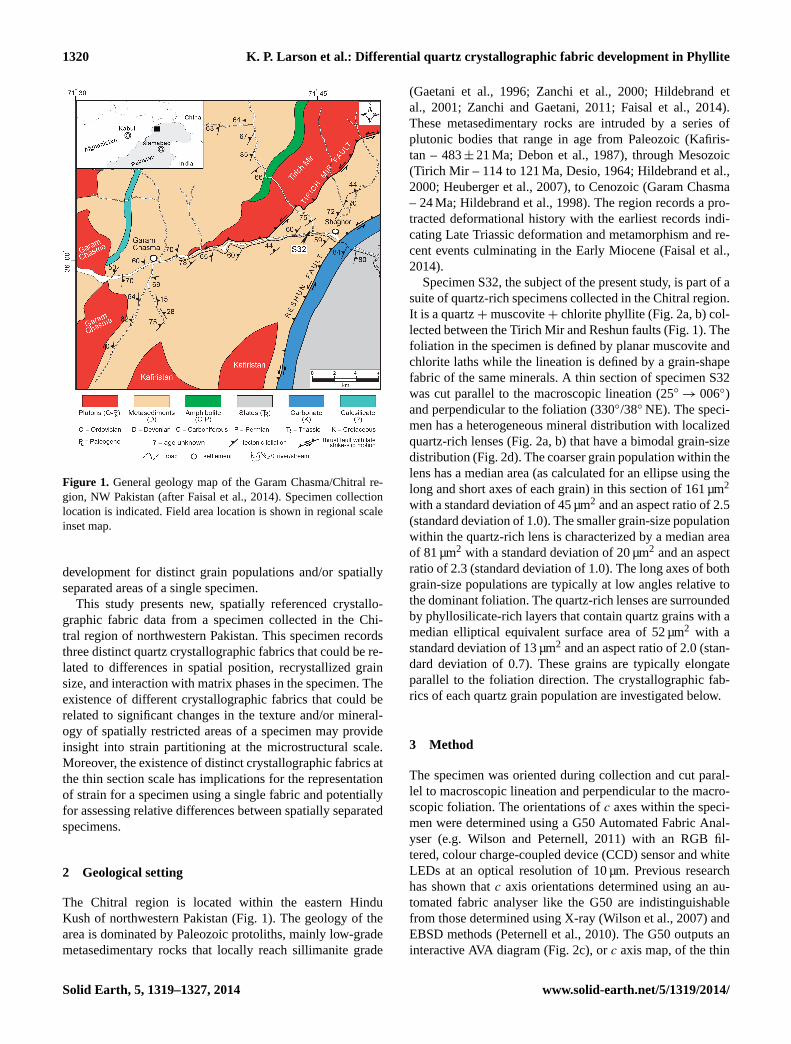
Figure 1. General geology map of the Garam Chasma/Chitral re-
gion, NW Pakistan (after Faisal et al., 2014). Specimen collection
location is indicated. Field area location is shown in regional scale
inset map.
development for distinct grain populations and/or spatially
separated areas of a single specimen.
This study presents new, spatially referenced crystallo-
graphic fabric data from a specimen collected in the Chi-
tral region of northwestern Pakistan. This specimen records
three distinct quartz crystallographic fabrics that could be re-
lated to differences in spatial position, recrystallized grain
size, and interaction with matrix phases in the specimen. The
existence of different crystallographic fabrics that could be
related to significant changes in the texture and/or mineral-
ogy of spatially restricted areas of a specimen may provide
insight into strain partitioning at the microstructural scale.
Moreover, the existence of distinct crystallographic fabrics at
the thin section scale has implications for the representation
of strain for a specimen using a single fabric and potentially
for assessing relative differences between spatially separated
specimens.
2 Geological setting
The Chitral region is located within the eastern Hindu
Kush of northwestern Pakistan (Fig. 1). The geology of the
area is dominated by Paleozoic protoliths, mainly low-grade
metasedimentary rocks that locally reach sillimanite grade
(Gaetani et al., 1996; Zanchi et al., 2000; Hildebrand et
al., 2001; Zanchi and Gaetani, 2011; Faisal et al., 2014).
These metasedimentary rocks are intruded by a series of
plutonic bodies that range in age from Paleozoic (Kafiris-
tan – 483± 21 Ma; Debon et al., 1987), through Mesozoic
(Tirich Mir – 114 to 121 Ma, Desio, 1964; Hildebrand et al.,
2000; Heuberger et al., 2007), to Cenozoic (Garam Chasma
– 24 Ma; Hildebrand et al., 1998). The region records a pro-
tracted deformational history with the earliest records indi-
cating Late Triassic deformation and metamorphism and re-
cent events culminating in the Early Miocene (Faisal et al.,
2014).
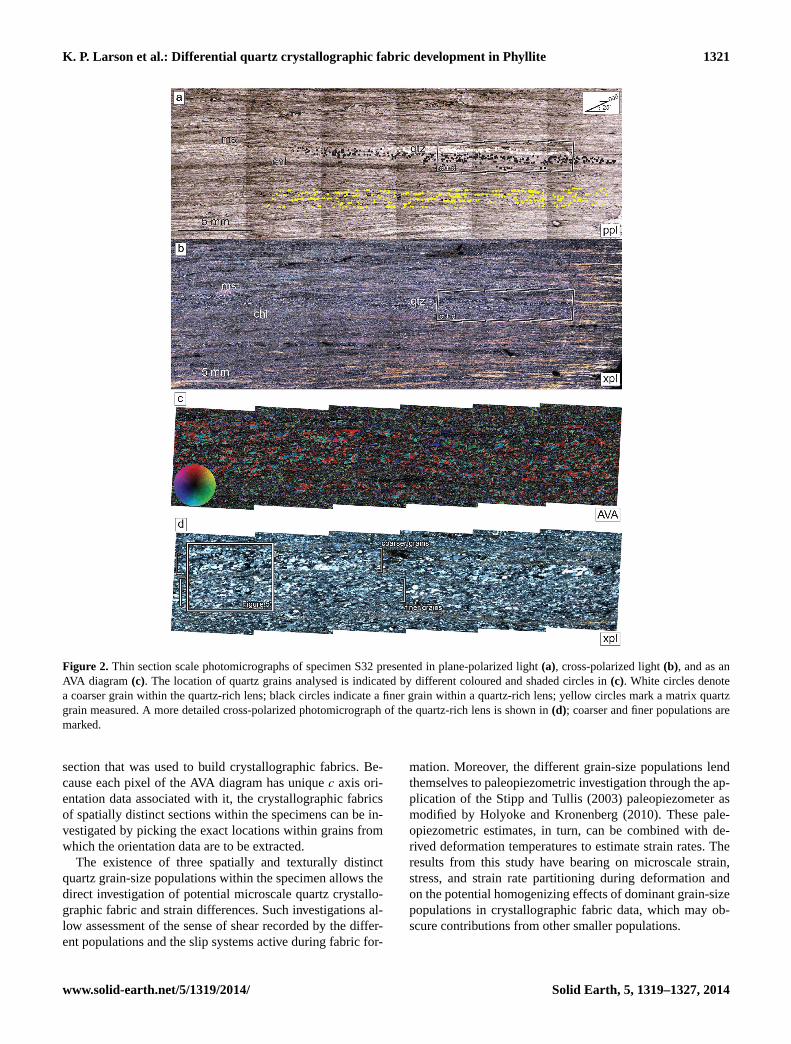
Specimen S32, the subject of the present study, is part of a
suite of quartz-rich specimens collected in the Chitral region.
It is a quartz+muscovite+ chlorite phyllite (Fig. 2a, b) col-
lected between the Tirich Mir and Reshun faults (Fig. 1). The
foliation in the specimen is defined by planar muscovite and
chlorite laths while the lineation is defined by a grain-shape
fabric of the same minerals. A thin section of specimen S32
was cut parallel to the macroscopic lineation (25◦→ 006◦)
and perpendicular to the foliation (330◦/38◦ NE). The speci-
men has a heterogeneous mineral distribution with localized
quartz-rich lenses (Fig. 2a, b) that have a bimodal grain-size
distribution (Fig. 2d). The coarser grain population within the
lens has a median area (as calculated for an ellipse using the
long and short axes of each grain) in this section of 161 µm2
with a standard deviation of 45 µm2 and an aspect ratio of 2.5
(standard deviation of 1.0). The smaller grain-size population
within the quartz-rich lens is characterized by a median area
of 81 µm2 with a standard deviation of 20 µm2 and an aspect
ratio of 2.3 (standard deviation of 1.0). The long axes of both
grain-size populations are typically at low angles relative to
the dominant foliation. The quartz-rich lenses are surrounded
by phyllosilicate-rich layers that contain quartz grains with a
median elliptical equivalent surface area of 52 µm2 with a
standard deviation of 13 µm2 and an aspect ratio of 2.0 (stan-
dard deviation of 0.7). These grains are typically elongate
parallel to the foliation direction. The crystallographic fab-
rics of each quartz grain population are investigated below.
3 Method
The specimen was oriented during collection and cut paral-
lel to macroscopic lineation and perpendicular to the macro-
scopic foliation. The orientations of c axes within the speci-
men were determined using a G50 Automated Fabric Anal-
yser (e.g. Wilson and Peternell, 2011) with an RGB fil-
tered, colour charge-coupled device (CCD) sensor and white
LEDs at an optical resolution of 10 µm. Previous research
has shown that c axis orientations determined using an au-
tomated fabric analyser like the G50 are indistinguishable
from those determined using X-ray (Wilson et al., 2007) and
EBSD methods (Peternell et al., 2010). The G50 outputs an
interactive AVA diagram (Fig. 2c), or c axis map, of the thin
Solid Earth, 5, 1319–1327, 2014 www.solid-earth.net/5/1319/2014/
K. P. Larson et al.: Differential quartz crystallographic fabric development in Phyllite 1321
Figure 2. Thin section scale photomicrographs of specimen S32 presented in plane-polarized light (a), cross-polarized light (b), and as an
AVA diagram (c). The location of quartz grains analysed is indicated by different coloured and shaded circles in (c). White circles denote
a coarser grain within the quartz-rich lens; black circles indicate a finer grain within a quartz-rich lens; yellow circles mark a matrix quartz
grain measured. A more detailed cross-polarized photomicrograph of the quartz-rich lens is shown in (d); coarser and finer populations are
marked.
section that was used to build crystallographic fabrics. Be-
cause each pixel of the AVA diagram has unique c axis ori-
entation data associated with it, the crystallographic fabrics
of spatially distinct sections within the specimens can be in-
vestigated by picking the exact locations within grains from
which the orientation data are to be extracted.
The existence of three spatially and texturally distinct
quartz grain-size populations within the specimen allows the
direct investigation of potential microscale quartz crystallo-
graphic fabric and strain differences. Such investigations al-
low assessment of the sense of shear recorded by the differ-
ent populations and the slip systems active during fabric for-
mation. Moreover, the different grain-size populations lend
themselves to paleopiezometric investigation through the ap-
plication of the Stipp and Tullis (2003) paleopiezometer as
modified by Holyoke and Kronenberg (2010). These pale-
opiezometric estimates, in turn, can be combined with de-
rived deformation temperatures to estimate strain rates. The
results from this study have bearing on microscale strain,
stress, and strain rate partitioning during deformation and
on the potential homogenizing effects of dominant grain-size
populations in crystallographic fabric data, which may ob-
scure contributions from other smaller populations.
www.solid-earth.net/5/1319/2014/ Solid Earth, 5, 1319–1327, 2014
1322 K. P. Larson et al.: Differential quartz crystallographic fabric development in Phyllite
4 Quartz microstructures
In the equal area stereonets used to present the c axis data,
the lineation lies horizontally across the equator, while the
foliation is a vertical plane cutting through the equator. The
stereonets are oriented such that a dextral asymmetry indi-
cates top-to-the-east-southeast shear.
4.1 Quartz microstructures
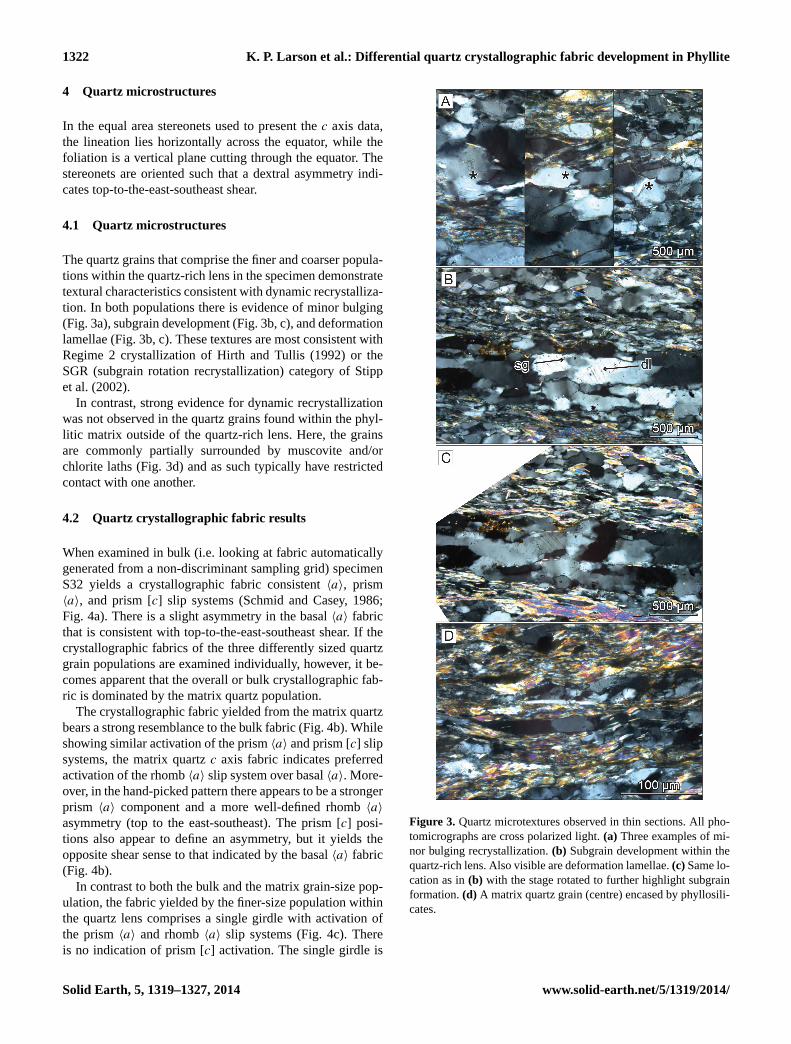
The quartz grains that comprise the finer and coarser popula-
tions within the quartz-rich lens in the specimen demonstrate
textural characteristics consistent with dynamic recrystalliza-
tion. In both populations there is evidence of minor bulging
(Fig. 3a), subgrain development (Fig. 3b, c), and deformation
lamellae (Fig. 3b, c). These textures are most consistent with
Regime 2 crystallization of Hirth and Tullis (1992) or the
SGR (subgrain rotation recrystallization) category of Stipp
et al. (2002).
In contrast, strong evidence for dynamic recrystallization
was not observed in the quartz grains found within the phyl-
litic matrix outside of the quartz-rich lens. Here, the grains
are commonly partially surrounded by muscovite and/or
chlorite laths (Fig. 3d) and as such typically have restricted
contact with one another.
4.2 Quartz crystallographic fabric results
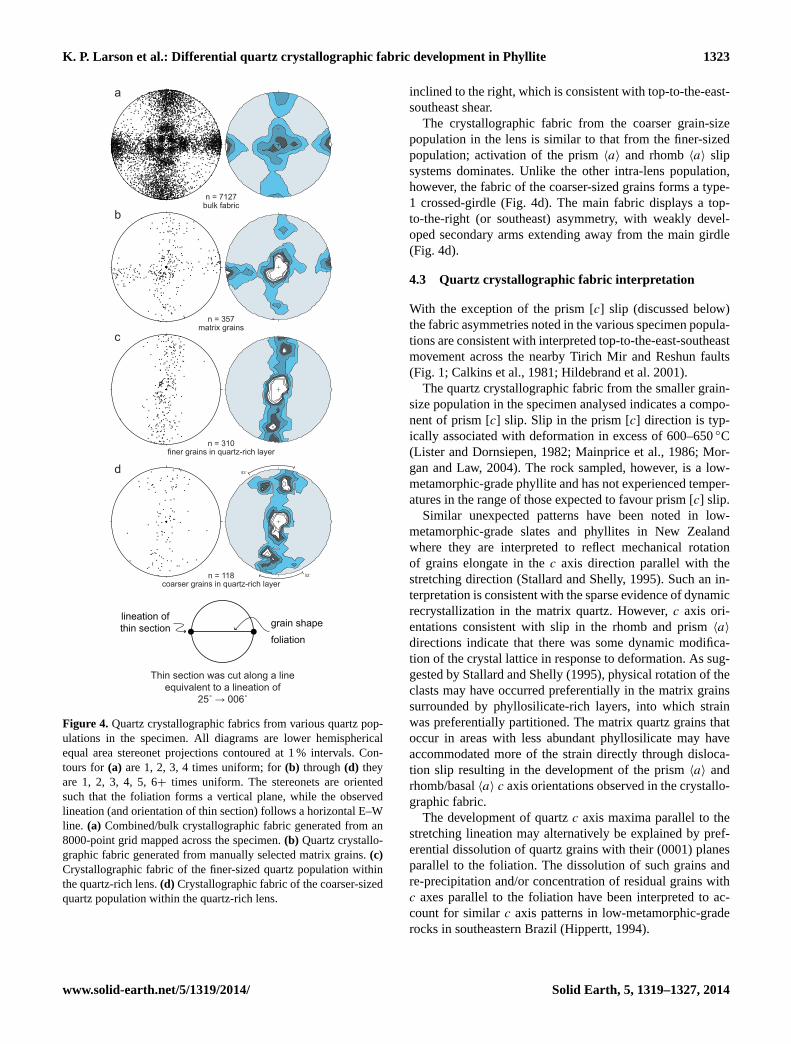
When examined in bulk (i.e. looking at fabric automatically
generated from a non-discriminant sampling grid) specimen
S32 yields a crystallographic fabric consistent 〈a〉, prism
〈a〉, and prism [c] slip systems (Schmid and Casey, 1986;
Fig. 4a). There is a slight asymmetry in the basal 〈a〉 fabric
that is consistent with top-to-the-east-southeast shear. If the
crystallographic fabrics of the three differently sized quartz
grain populations are examined individually, however, it be-
comes apparent that the overall or bulk crystallographic fab-
ric is dominated by the matrix quartz population.
The crystallographic fabric yielded from the matrix quartz
bears a strong resemblance to the bulk fabric (Fig. 4b). While
showing similar activation of the prism 〈a〉 and prism [c] slip
systems, the matrix quartz c axis fabric indicates preferred
activation of the rhomb 〈a〉 slip system over basal 〈a〉. More-
over, in the hand-picked pattern there appears to be a stronger
prism 〈a〉 component and a more well-defined rhomb 〈a〉
asymmetry (top to the east-southeast). The prism [c] posi-
tions also appear to define an asymmetry, but it yields the
opposite shear sense to that indicated by the basal 〈a〉 fabric
(Fig. 4b).
In contrast to both the bulk and the matrix grain-size pop-
ulation, the fabric yielded by the finer-size population within
the quartz lens comprises a single girdle with activation of
the prism 〈a〉 and rhomb 〈a〉 slip systems (Fig. 4c). There
is no indication of prism [c] activation. The single girdle is
Figure 3. Quartz microtextures observed in thin sections. All pho-
tomicrographs are cross polarized light. (a) Three examples of mi-
nor bulging recrystallization. (b) Subgrain development within the
quartz-rich lens. Also visible are deformation lamellae. (c) Same lo-
cation as in (b) with the stage rotated to further highlight subgrain
formation. (d) A matrix quartz grain (centre) encased by phyllosili-
cates.
Solid Earth, 5, 1319–1327, 2014 www.solid-earth.net/5/1319/2014/
K. P. Larson et al.: Differential quartz crystallographic fabric development in Phyllite 1323
Thin section was cut along a lineequivalent to a lineation of
25˚ → 006˚
grain shape
foliation
lineation ofthin section
n = 7127
n = 118
n = 357
n = 310
53˚
52˚
a
d
c
bbulk fabric
matrix grains
finer grains in quartz-rich layer
coarser grains in quartz-rich layer
Figure 4. Quartz crystallographic fabrics from various quartz pop-
ulations in the specimen. All diagrams are lower hemispherical
equal area stereonet projections contoured at 1 % intervals. Con-
tours for (a) are 1, 2, 3, 4 times uniform; for (b) through (d) they
are 1, 2, 3, 4, 5, 6+ times uniform. The stereonets are oriented
such that the foliation forms a vertical plane, while the observed
lineation (and orientation of thin section) follows a horizontal E–W
line. (a) Combined/bulk crystallographic fabric generated from an
8000-point grid mapped across the specimen. (b) Quartz crystallo-
graphic fabric generated from manually selected matrix grains. (c)
Crystallographic fabric of the finer-sized quartz population within
the quartz-rich lens. (d) Crystallographic fabric of the coarser-sized
quartz population within the quartz-rich lens.
inclined to the right, which is consistent with top-to-the-east-
southeast shear.
The crystallographic fabric from the coarser grain-size
population in the lens is similar to that from the finer-sized
population; activation of the prism 〈a〉 and rhomb 〈a〉 slip
systems dominates. Unlike the other intra-lens population,
however, the fabric of the coarser-sized grains forms a type-
1 crossed-girdle (Fig. 4d). The main fabric displays a top-
to-the-right (or southeast) asymmetry, with weakly devel-
oped secondary arms extending away from the main girdle
(Fig. 4d).
4.3 Quartz crystallographic fabric interpretation
With the exception of the prism [c] slip (discussed below)
the fabric asymmetries noted in the various specimen popula-
tions are consistent with interpreted top-to-the-east-southeast
movement across the nearby Tirich Mir and Reshun faults
(Fig. 1; Calkins et al., 1981; Hildebrand et al. 2001).
The quartz crystallographic fabric from the smaller grain-
size population in the specimen analysed indicates a compo-
nent of prism [c] slip. Slip in the prism [c] direction is typ-
ically associated with deformation in excess of 600–650 ◦C
(Lister and Dornsiepen, 1982; Mainprice et al., 1986; Mor-
gan and Law, 2004). The rock sampled, however, is a low-
metamorphic-grade phyllite and has not experienced temper-
atures in the range of those expected to favour prism [c] slip.
Similar unexpected patterns have been noted in low-
metamorphic-grade slates and phyllites in New Zealand
where they are interpreted to reflect mechanical rotation
of grains elongate in the c axis direction parallel with the
stretching direction (Stallard and Shelly, 1995). Such an in-
terpretation is consistent with the sparse evidence of dynamic
recrystallization in the matrix quartz. However, c axis ori-
entations consistent with slip in the rhomb and prism 〈a〉
directions indicate that there was some dynamic modifica-
tion of the crystal lattice in response to deformation. As sug-
gested by Stallard and Shelly (1995), physical rotation of the
clasts may have occurred preferentially in the matrix grains
surrounded by phyllosilicate-rich layers, into which strain
was preferentially partitioned. The matrix quartz grains that
occur in areas with less abundant phyllosilicate may have
accommodated more of the strain directly through disloca-
tion slip resulting in the development of the prism 〈a〉 and
rhomb/basal 〈a〉 c axis orientations observed in the crystallo-
graphic fabric.
The development of quartz c axis maxima parallel to the
stretching lineation may alternatively be explained by pref-
erential dissolution of quartz grains with their (0001) planes
parallel to the foliation. The dissolution of such grains and
re-precipitation and/or concentration of residual grains with
c axes parallel to the foliation have been interpreted to ac-
count for similar c axis patterns in low-metamorphic-grade
rocks in southeastern Brazil (Hippertt, 1994).
www.solid-earth.net/5/1319/2014/ Solid Earth, 5, 1319–1327, 2014
1324 K. P. Larson et al.: Differential quartz crystallographic fabric development in Phyllite
The orientations of c axes in grains that comprise the
quartz-rich lens in the specimen appear to have been con-
trolled by dynamic recrystallization (Fig. 3a–c) as part of
their deformational response to imposed stresses. Because
the quartz records evidence of dynamic recrystallization, the
crystallographic fabrics measured from it are interpreted to
reflect the modification of its crystal lattice orientation in re-
sponse to deformation.
4.4 Deformation temperature, grain-size piezometry,
and strain rate estimates
The crystallographic fabric from the coarser grains in the
quartz lens forms a weakly developed crossed-girdle fabric
(Fig. 4d). The opening angle of such fabrics, that is the an-
gle between the arms of the fabric as measured about the
perpendicular to the flow plane, has been empirically related
to the estimated temperatures at which the fabrics developed
(Kruhl, 1998; Morgan and Law, 2004; Law, 2014). Convert-
ing a fabric opening angle into a temperature of deforma-
tion requires a number of assumptions to be made, includ-
ing temperature being the primary control on critically re-
solved shear stress, as opposed to strain rate or hydrolytic
weakening. See Law (2014) for an in depth review of the
considerations in using quartz crystallographic fabric open-
ing angles as geothermometers. In reflection of the uncer-
tainty in the data used for the empirical calibration and the
precision of the opening angle determined, quartz crystallo-
graphic fabric-derived deformation temperatures are quoted
at ±50 ◦C (Kruhl, 1998).
The crossed girdle fabric in the specimen analysed has an
opening angle of∼ 53 ◦(Fig. 4d), which corresponds to a de-
formation temperature of∼ 403± 50 ◦C. Although the c axis
fabric is weakly developed, the temperature estimate is con-
sistent with the interpreted metamorphic grade of the rock
and with the observed microstructures, which are dominated
by subgrain development with minor bulging. The transition
from bulging to subgrain formation processes in the eastern
Tonale fault zone of the Italian Alps is associated with tem-
peratures near 400 ◦C (Fig. 9 of Stipp et al., 2002). Similar
textures from the Himalaya may occur at slightly higher tem-
peratures, closer to 450 ◦C (Law, 2014). It should be noted,
however, that, as with c axis opening angles, strain rate and
hydrolytic weakening can also play an important role in the
development of quartz textures (e.g. Law, 2014).
Recrystallized grain-size piezometry as proposed by Stipp
and Tullis (2003) and recalibrated by Holyoke and Kronen-
burg (2010) may be used to estimate potential differences in
differential flow stresses recorded in different dynamically
recrystallized grain-size populations. Experimental calibra-
tion of the quartz grain-size piezometer applies to bulging
recrystallization mechanisms and extends to a maximum
grain size of ∼ 50 µm (Stipp and Tullis, 2003; Stipp et al.,
2006). Stipp et al. (2010) suggest that the piezometer may be
reasonably applied to grains formed through subgrain rota-
200 µm200 µm
200 µm200 µm
xpl
ppl
coarser grainscoarser grains
finer grainsfiner grains
finer grainsfiner grains
coarser grainscoarser grains
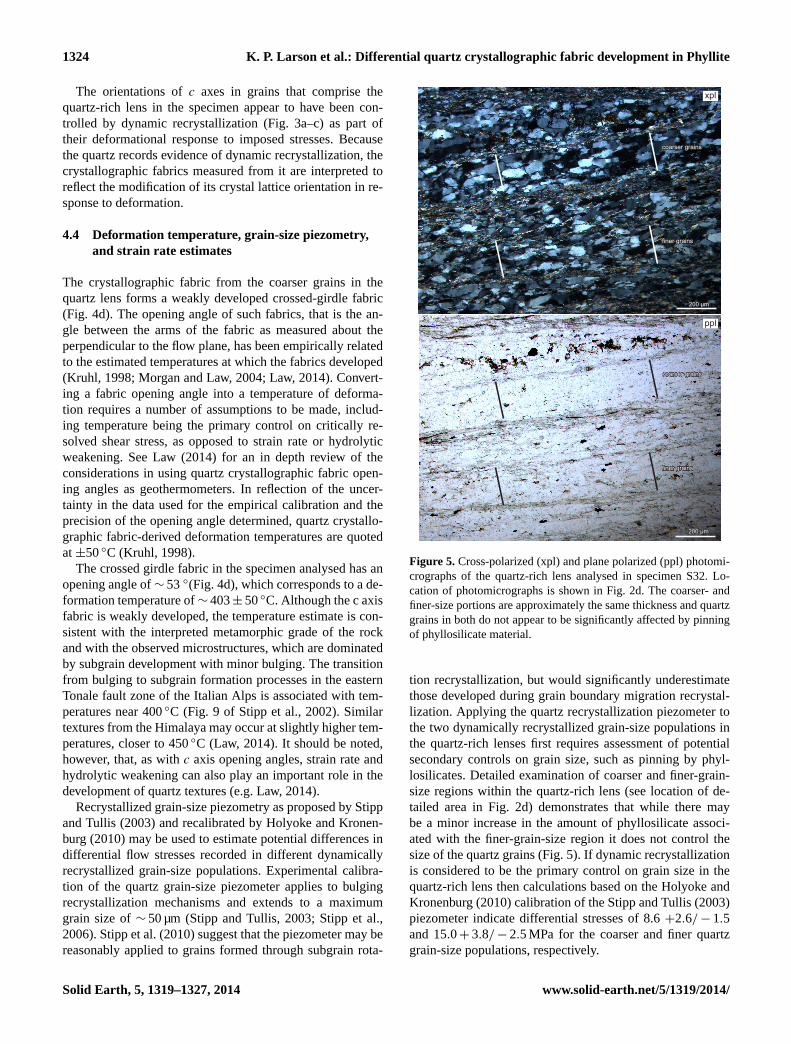
Figure 5. Cross-polarized (xpl) and plane polarized (ppl) photomi-
crographs of the quartz-rich lens analysed in specimen S32. Lo-
cation of photomicrographs is shown in Fig. 2d. The coarser- and
finer-size portions are approximately the same thickness and quartz
grains in both do not appear to be significantly affected by pinning
of phyllosilicate material.
tion recrystallization, but would significantly underestimate
those developed during grain boundary migration recrystal-
lization. Applying the quartz recrystallization piezometer to
the two dynamically recrystallized grain-size populations in
the quartz-rich lenses first requires assessment of potential
secondary controls on grain size, such as pinning by phyl-
losilicates. Detailed examination of coarser and finer-grain-
size regions within the quartz-rich lens (see location of de-
tailed area in Fig. 2d) demonstrates that while there may
be a minor increase in the amount of phyllosilicate associ-
ated with the finer-grain-size region it does not control the
size of the quartz grains (Fig. 5). If dynamic recrystallization
is considered to be the primary control on grain size in the
quartz-rich lens then calculations based on the Holyoke and
Kronenburg (2010) calibration of the Stipp and Tullis (2003)
piezometer indicate differential stresses of 8.6 +2.6/− 1.5
and 15.0+ 3.8/− 2.5 MPa for the coarser and finer quartz
grain-size populations, respectively.
Solid Earth, 5, 1319–1327, 2014 www.solid-earth.net/5/1319/2014/
K. P. Larson et al.: Differential quartz crystallographic fabric development in Phyllite 1325
30 60 MPa
400
500 (˚C)
600600coarser grain size finer grain size
10-16
10-15
10-14
10-13
Rutter and Brodie, 2004
30
400
60 MPa
500 (˚C)
600
60 MPa
500 (˚C)
600coarser grain size finer grain size
10-16 10-15
10-14
10-13
10-12
Hirth et al., 2001
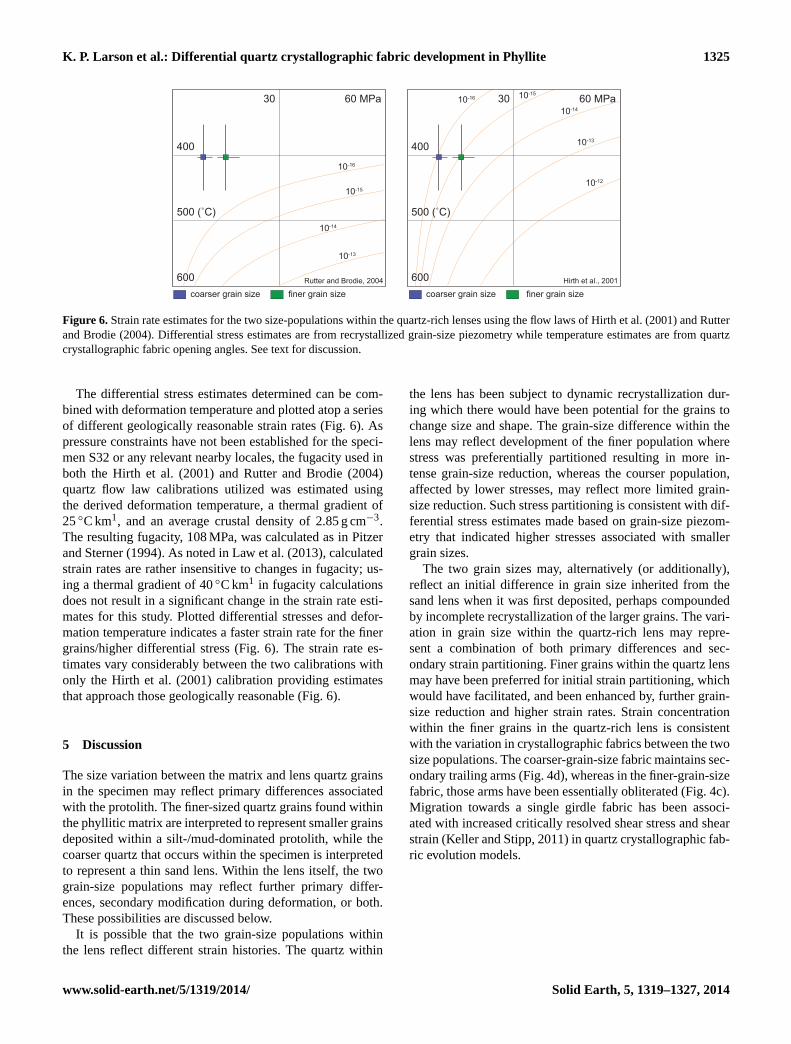
Figure 6. Strain rate estimates for the two size-populations within the quartz-rich lenses using the flow laws of Hirth et al. (2001) and Rutter
and Brodie (2004). Differential stress estimates are from recrystallized grain-size piezometry while temperature estimates are from quartz
crystallographic fabric opening angles. See text for discussion.
The differential stress estimates determined can be com-
bined with deformation temperature and plotted atop a series
of different geologically reasonable strain rates (Fig. 6). As
pressure constraints have not been established for the speci-
men S32 or any relevant nearby locales, the fugacity used in
both the Hirth et al. (2001) and Rutter and Brodie (2004)
quartz flow law calibrations utilized was estimated using
the derived deformation temperature, a thermal gradient of
25 ◦C km1, and an average crustal density of 2.85 g cm−3.
The resulting fugacity, 108 MPa, was calculated as in Pitzer
and Sterner (1994). As noted in Law et al. (2013), calculated
strain rates are rather insensitive to changes in fugacity; us-
ing a thermal gradient of 40 ◦C km1 in fugacity calculations
does not result in a significant change in the strain rate esti-
mates for this study. Plotted differential stresses and defor-
mation temperature indicates a faster strain rate for the finer
grains/higher differential stress (Fig. 6). The strain rate es-
timates vary considerably between the two calibrations with
only the Hirth et al. (2001) calibration providing estimates
that approach those geologically reasonable (Fig. 6).
5 Discussion
The size variation between the matrix and lens quartz grains
in the specimen may reflect primary differences associated
with the protolith. The finer-sized quartz grains found within
the phyllitic matrix are interpreted to represent smaller grains
deposited within a silt-/mud-dominated protolith, while the
coarser quartz that occurs within the specimen is interpreted
to represent a thin sand lens. Within the lens itself, the two
grain-size populations may reflect further primary differ-
ences, secondary modification during deformation, or both.
These possibilities are discussed below.
It is possible that the two grain-size populations within
the lens reflect different strain histories. The quartz within
the lens has been subject to dynamic recrystallization dur-
ing which there would have been potential for the grains to
change size and shape. The grain-size difference within the
lens may reflect development of the finer population where
stress was preferentially partitioned resulting in more in-
tense grain-size reduction, whereas the courser population,
affected by lower stresses, may reflect more limited grain-
size reduction. Such stress partitioning is consistent with dif-
ferential stress estimates made based on grain-size piezom-
etry that indicated higher stresses associated with smaller
grain sizes.
The two grain sizes may, alternatively (or additionally),
reflect an initial difference in grain size inherited from the
sand lens when it was first deposited, perhaps compounded
by incomplete recrystallization of the larger grains. The vari-
ation in grain size within the quartz-rich lens may repre-
sent a combination of both primary differences and sec-
ondary strain partitioning. Finer grains within the quartz lens
may have been preferred for initial strain partitioning, which
would have facilitated, and been enhanced by, further grain-
size reduction and higher strain rates. Strain concentration
within the finer grains in the quartz-rich lens is consistent
with the variation in crystallographic fabrics between the two
size populations. The coarser-grain-size fabric maintains sec-
ondary trailing arms (Fig. 4d), whereas in the finer-grain-size
fabric, those arms have been essentially obliterated (Fig. 4c).
Migration towards a single girdle fabric has been associ-
ated with increased critically resolved shear stress and shear
strain (Keller and Stipp, 2011) in quartz crystallographic fab-
ric evolution models.
www.solid-earth.net/5/1319/2014/ Solid Earth, 5, 1319–1327, 2014
1326 K. P. Larson et al.: Differential quartz crystallographic fabric development in Phyllite
6 Conclusions
This study demonstrates the importance of spatial resolution
and registration in specimens analysed for crystallographic
fabric analyses. In this metapelite example, the bulk crystal-
lographic fabric overwhelmed two spatially restricted fabrics
recorded in a quartz lens. Yet it was the secondary, spatially
distinct fabrics that yielded information on deformation tem-
perature, paleopiezometry, and strain rate. This has important
implications for increasingly common studies that examine
large numbers of specimens utilizing automated methods;
care must be taken to investigate the spatial distribution of
fabric symmetry within specimens as the bulk pattern may
average and mask important information. The spatially con-
trolled crystallographic fabric patterns documented in this
study may reflect the fundamental initial properties of the
specimen, byproducts of differential strain partitioning at the
microscale, or some combination of the two.
Acknowledgements. This project was supported by NSERC
Discovery and CFI Leaders Opportunity Fund grants to K. Larson.
A. Khan and the NCEG at the University of Peshawar are thanked
for their logistical assistance during fieldwork. Discussions with
D. Kellett, reviews by C. Wilson and N. Mancktelow, and editorial
handling and initial review by R. Law have helped improve the
clarity of the manuscript.
Edited by: R. Law
References
Blumenfeld, P., Mainprice, D., and Bouchez, J.-L.: C-slip in quartz
from subsolidus deformed granite, Tectonophysics, 127, 97–115,
1986.
Bouchez, J.-L. and Pêcher, A.: Plasticite du quartz et sens de ci-
saillement dans des quartzites du Grand Chevaughement Cen-
tral himalayen, Bulletin du societie geologique, France, 7, 1377–
1385, 1976.
Calkins, J. A., Jamiluddin, S., Bhuyan, K., and Hussain, A.: Geol-
ogy and Mineral Resources of the Chitral-Parstan Area, Hindu
Kush Range, Northern Pakistan. Geological Survey (USA) Pro-
fessional Paper 716-G, 1981.
Debon, F., Afzali, H., LeFort, P., and Sonet, J.: Major intrusive
stages in Afghanistan: typology, age, and geodynamic setting,
Geologische Rundschau, 76, 245–264, 1987.
Desio, A.: On the geological age of some granites of the Karakoram,
Hindu Kush and Badakhshan (central Asia), in: Proceeding of the
22nd International Geological Congress, Delhi, Part II, 11, 479–
496, 1964.
Faisal, S., Larson, K. P., Cottle, J. M., and Lamming, J.: Building
the Hindu Kush: Monazite Records of Terrane Accretion, Pluton-
ism, and the Evolution of the Himalaya-Karakoram-Tibet Oro-
gen, Terra Nova, 26, 395–401, 2014.
Feuten, F. and Goodchild, J. S.: Quartz c axes orientation determi-
nation using the rotating polarizer microscope, J. Struct. Geol.,
23, 896–902, 2001.
Gaetani, M., Le Fort, P., Tanoli, S., Angiolini, L., Nicora, A., Sci-
unnach, D., and Asif, K.: Reconnaissance geology in Chitral,
Baroghil and Karambar districts (N Pakistan), Geol. Rundsch.,
85, 683–704, 1996.
Heilbronner, R. P. and Pauli, C.: Integrated spatial and orienta-
tion analysis of quartz c axes by computer-aided microscopy, J.
Struct. Geol., 15, 369–382, 1993.
Heuberger, S., Schaltegger, U., Burgi, J.P., RG1, Villa, I.M., Frank,
M., Dawood, H., Hussain, S., and Zanchi, A.: Age and isotopic
constraints on magmatism along the Karakoram-Kohistan Suture
Zone, NW Pakistan: evidence for subduction and continued con-
vergence after India-Asia collision, Swiss J. Geosci., 100, 85–
107, 2007.
Hildebrand, P. R., Noble, S. R., Searle, M. P., Parrish, R. R., and
Shakirullah: Tectonic significance of 24 Ma crustal melting in the
eastern Hindu Kush, Pakistan, Geology, 26, 871–874, 1998.
Hildebrand, P. R., Searle, M. P., Shakirullah, Khan, Z., and Van
Heijst, H.: Geological evolution of the Hindu Kush, NW Fron-
tier Pakistan: active margin to continent-continent collision zone,
Geol. Soc. London Spec. Publicat., 170, 277–293, 2000.
Hildebrand, P. R., Noble, S. R., Searle, M. P., Waters, D. J., and
Parrish, R. R.: Old origin for an active mountain range: Geology
and geochronology of the eastern Hindu Kush, Pakistan, Geol.
Soc. Am. Bull., 113, 625–639, 2001.
Hippertt, J. F.: Microstructures and c axis fabrics indicative of
quartz dissolution in sheared quartzites and phyllonites, Tectono-
physics, 229, 141–163, 1994.
Hirth, G. and Tullis, J.: Dislocation creep regimes in quartz aggre-
gates, J. Struct. Geol., 14, 145–160, 1992.
Hirth, G., Teyssier, C., and Dunlap, J.: An evaluation of quartzite
flow laws based on comparisons between experimentally and nat-
urally deformed rocks, Internat. J. Earth Sci., 90, 77–87, 2001.
Holyoke III, C. W. and Kronenberg, A. K.: Accurate differential
stress measurement using the molten salt cell and solid salt as-
semblies in the Griggs apparatus with applications to strength,
piezometers and rheology, Tectonophysics, 494, 17–31, 2010.
Keller, L. M. and Stipp, M.: The single-slip hypothesis revisited:
Crystal-preferred orientations of sheared quartz aggregates with
increasing strain in nature and numerical simulation, J. Struct.
Geol., 33, 1491–1500, 2011.
Kile, D. E.: The universal stage: The past, present, and future of a
mineralogical research instrument, Geochemical News, p. 140,
2009.
Kruhl, J. H.: Reply: Prism- and basal plane parallel subgrain bound-
aries in quartz: a microstructural geothermobarometer, J. Meta-
mor. Geol., 16, 142–146, 1998.
Larson, K. P. and Cottle, J. M.: Midcrustal discontinuities
and the assembly of the Himalayan midcrust, Tectonics, 33,
doi:10.1002/(ISSN)1944-9194, 2014.
Law, R. D.: Deformation thermometry based on quartz c axis fabrics
and recrystallization microstructures: A review, J. Struct. Geol.,
66, 129–161, 2014.
Law, R. D., Schmid, S., and Wheeler, J.: Simple Shear Deformation
and Quartz Crystallographic Fabrics – a Possible Natural Exam-
ple From the Torridon Area of Nw Scotland, J. Struct. Geol., 12,
29–45, 1990.
Law, R. D., Searle, M. P., and Simpson, R. L.: Strain, deforma-
tion temperatures and vorticity of flow at the top of the Greater
Solid Earth, 5, 1319–1327, 2014 www.solid-earth.net/5/1319/2014/
K. P. Larson et al.: Differential quartz crystallographic fabric development in Phyllite 1327
Himalayan Slab, Everest Massif, Tibet, J. Geol. Soc., 161, 305–
320, 2004.
Law, R. D., Mainprice, D., Casey, M., Lloyd, G., Knipe, R., Cook,
B., and Thigpen, J.: Moine Thrust zone mylonites at the Stack
of Glencoul: I-microstructures, strain and influence of recrystal-
lization on quartz crystal fabric development, Geol. Soc. London
Spec. Publicat., 335, 543 pp., 2010.
Law, R. D., Jessup, M. J., Searle, M. P., Francsis, M. K., Waters, D.
J., and Cottle, J. M.: Telescoping of isotherms beneath the South
Tibetan Detachment System, Mount Everest Massif, J. Struct.
Geol., 33, 1–26, 2011.
Law, R. D., Stahr, D. W., Francsis, M. K., Ashley, K. T., Grasemann,
B., and Ahmad, T.: Deformation temperatures and flow vortici-
ties near the base of the Greater Himalayan Series, Sutlej Valley
and Shimla Klippe, NW India, J. Struct. Geol., 54, 1–93, 2013.
Lister, G. S. and Dornsiepen, U. F.: Fabric transitions in the Saxony
granulite terrain, J. Struct. Geol., 4, 81–92, 1982.
Lister, G. S. and Williams, P. F.: Fabric development in shear zones:
theoretical controls and observed phenomena, J. Struct. Geol., 1,
283–297, 1979.
Mainprice, D. Bouchez, J. L., Blumenfeld, P., and Tubia, J. M:
Dominant c slip in naturally deformed quartz: implications for
dramatic plastic softening at high temperature, Geology, 14, 819–
822, 1986.
Morgan, S. S. and Law, R. D.: Unusual transition in quartzite dis-
location creep regimes and crystal slip systems in the aureole
of the Eureka Valley-Joshua Flat-Beer Creek pluton, California:
a case for anhydrous conditions created by decarbonation reac-
tions, Tectonophysics, 384, 209–231, 2004.
Pajdzik, L. A. and Glazer, A. M.: Three-dimensional birefringence
imaging with a microscope tilting-stage. I. Uniaxial Crystals, J.
Appl. Crystall., 39, 326–337, 2006.
Peternell, M., Hasalová, P., Wilson, C. J. L., Piazolo, S., and Schul-
mann, K.: Evaluating quartz crystallographic preferred orienta-
tions and the role of deformation partitioning using EBSD and
fabric analyser techniques, J. Struct. Geol., 32, 803–817, 2010.
Pitzer, K. S. and Sterner, S. M.: Equations of state valid continu-
ously from zero to extreme pressures for H2O and CO2, J. Chem.
Phys., 101, 3111–3116, 1994.
Prior, D. J., Boyle, A. P., Brenker, F., Cheadle, M. C., Day, A.,
Lopez, G., Peruzzo, L., Potts, G. J., Reddy, S., Speiss, R., Timms,
N. E., Trimby, P., Wheeler, J., and Zetterström, L.: The applica-
tion of electron backscatter diffraction and orientation contrast
imaging in the SEM to textural problems in rocks, Am. Mineral.,
84, 1741–1759, 1999.
Rutter, E. and Brodie, K.: Experimental intracrystalline plastic flow
in hot-pressed synthetic quartzite prepared from Brazilian quartz
crystals, J. Struct. Geol., 26, 259–270, 2004.
Sander, B.: Einführung in die Gefügekunde der Geologischen
Körper, Zweiter Teil, Die Korngefuege, Springer-Verlag, Wein-
Inssbruck, 1950.
Schmid, S. M. and Casey, M.: Complete fabric analysis of some
commonly observed quartz [c] axis patterns. In: Hobbs, B.E.,
Heard, H.C. (Eds.), Mineral and Rock Deformation: Laboratory
Studies, Geophys. Monogr., 36, 263–286, 1986.
Stallard, A. and Shelly, D.: Quartz c-axes parallel to stretching di-
rections in very low-grade metamorphic rocks, Tectonophysics,
249, 31–40, 1995.
Stipp, M. and Tullis, J.: The recrystallized grain size
piezometer for quartz, Geophys. Res. Lett., 30, 2088,
doi:10.1029/2003GL018444, 2003.
Stipp, M., Stunitz, H., Heilbronner, R., and Schmid, S. M.: The east-
ern Tonale fault zone: a natural laboratory for crystal plastic de-
formation of quartz over a temperature range from 250 to 700 ◦C,
J. Struct. Geol., 24, 1861–1884, 2002.
Stipp, M., Tullis, J., and Behrens, H.: Effect of water on the dislo-
cation creep microstructure and flow stress of quartz and impli-
cations for the recrystallized grain size piezometer, J. Geophys.
Res., 111, B042201, doi:10.1029/2005JB003852, 2006.
Stipp, M., Tullis, J., Scherwath, M., and Behrmann, J. H.: A
new perspective on paleopiezometry: Dynamically recrystallized
grain size distributions indicate mechanism changes, Geology,
38, 759–762, 2010.
Turner, F. J.: Preferred orientation of olivine crystals in peridotite,
Trans. Proc. Roy. Soc. New Zealand, 72, 280–300, 1942
Wenk, H.-R. (Ed.): Preferred Orientaiton in Deformed Metals and
Rocks: An introduction to Modern Texture Analysis. Academic
Press, London, p. 610, 1985.
Wilson, C. J. L., Russell-Head, D. S., and Sim, H. M.: The applica-
tion of an automated fabric analyser system to the textural evolu-
tion of folded ice layers in shear zones, Ann. Glaciol., 37, 7–17,
2003.
Wilson, C. J. L., Russell-Head, D. S., Kunze, K., and Viola, G.: The
analysis of quartz c-axis fabrics using a modified optical micro-
scope, J. Micros., 227, 30–41, 2007.
Wilson, C. J. L., Robinson, J., and Dugdale, A.: Quartz vein fabrics
coupled to elevated fluid pressures in the Stawell gold deposit,
south-eastern Australia, Mineral. Deposita, 44, 245–263, 2009.
Wilson, C. J. L. and Peternell, M. A.: Evaluating ice fabrics using
fabric analyser techniques in Sørsdal Glacier, East Antarctica, J.
Glaciol., 57, 881–894, 2011.
Xypolias, P. and Koukouvelas, I. K.: Kinematic vorticity and strain
rate patterns associated with ductile extrusion in the Chelmos
Shear Zone (External Hellenides, Greece), Tectonophysics, 338,
59–77, 2001.
Zanchi, A. and Gaetani, M.: The geology of the Karakoram range,
Pakistan: the new 1 : 100 000 geological map of Central-Western
Karakoram. Italian J. Geosci., 130, 161–262, 2011.
Zanchi, A., Poli, S., Fumagalli, P., and Gaetani, M.: Mantle ex-
humation along the Tirich Mir Fault Zone, NW Pakistan: pre-
mid-Cretaceous accretion of the Karakoram terrane to the Asian
margin, in: Tectonics of the Nanga Parbat Syntaxis and the West-
ern Himalaya, edited by: Khan, M. A., Treloar, P. J., Searle, M.
P., and Jan, M. Q., Geol. Soc. London, Special. Publication, 170,
237–252, 2000.
Zhang, S. and Karato, S. I.: Lattice preferred orientation of olivine
aggregates deformed in simple shear, Nature, 375, 774–777,
1995.
www.solid-earth.net/5/1319/2014/ Solid Earth, 5, 1319–1327, 2014