Embed Size (px)
Citation preview
©FUNPEC-RP www.funpecrp.com.brGenetics and Molecular Research 13 (1): 1015-1029 (2014)
MicroRNAs function primarily in the pathogenesis of human anencephaly via the mitogen-activated protein kinase signaling pathway
W.D. Zhang1, X. Yu1, X. Fu1, S. Huang1, S.J. Jin1, Q. Ning2 and X.P. Luo1
1Department of Pediatrics, Tongji Hospital, Tongji Medical College, Huazhong University of Science and Technology, Wuhan, China2Department of Infectious Diseases, Tongji Hospital, Tongji Medical College, Huazhong University of Science and Technology, Wuhan, China
Corresponding author: X.P. LuoE-mail: [email protected]
Genet. Mol. Res. 13 (1): 1015-1029 (2014)Received January 11, 2013Accepted July 22, 2013Published February 20, 2014DOI http://dx.doi.org/10.4238/2014.February.20.3
ABSTRACT. Anencephaly is one of the most serious forms of neural tube defects (NTDs), a group of congenital central nervous system (CNS) malformations. MicroRNAs (miRNAs) are involved in diverse biological processes via the post-transcriptional regulation of target mRNAs. Although miRNAs play important roles in the development of mammalian CNS, their function in human NTDs remains unknown. Using a miRNA microarray, we identified a unique expression profile in fetal anencephalic brain tissues, characterized by 70 upregulated miRNAs (ratio ≥2) and 7 downregulated miRNAs (ratio ≤0.5) compared with healthy human samples. Ten miRNAs with altered expression were selected from the microarray findings for validation with real-time quantitative reverse transcription-polymerase chain reaction. We found that in anencephalic tissues, miR-22, miR-23a, miR-34a, miR-103, miR-125a, miR-132, miR-134, miR-138,
1016
©FUNPEC-RP www.funpecrp.com.brGenetics and Molecular Research 13 (1): 1015-1029 (2014)
W.D. Zhang et al.
and miR-185 were significantly upregulated, while miR-149 was significantly downregulated. Furthermore, 459 potential target genes within the validated miRNAs were revealed using combined four target prediction algorithms in the human genome, and subsequently analyzed with the Molecule Annotation System 3.0. A total of 119 target genes were ultimately identified, including those involved in 22 singular annotations (i.e., transcription, signal transduction, and cell cycle) and 55 functional pathways [i.e., mitogen-activated protein kinase (MAPK) signaling pathway, and actin cytoskeleton regulation]. Six target genes (HNRPU, JAG1, FMR1, EGR3, RUNX1T1, and NDEL1) were chosen as candidate genes and associated with congenital birth abnormalities of the brain structure. Our results, therefore, suggest that miRNA maladjustment mainly contributes to the etiopathogenesis of anencephaly via the MAPK signaling pathway.
Key words: MicroRNA; Neural tube defect; Anencephaly; Microarray; Bioinformatics; MAPK signaling pathway
INTRODUCTION
Neural tube defects (NTDs), a common group of congenital malformations of the cen-tral nervous system (CNS), occur when the neural tube (NT) fails to close during neurulation at 21 to 28 days post-conception. The most common forms of NTDs are open NTDs, which include myelomeningocele (open spina bifida) and anencephaly that result from the absence of NT closure in spinal and cranial regions, respectively, and lead to the exposure of nervous tissues to the body’s surface. Worldwide, NTDs occur in approximately 0.5 to 2 births per 1000 (Greene et al., 2009). NTDs are important causes of fetal mortality and morbidity that consequently result in high annual social expenditures. Anencephaly, one of the most severe forms of NTDs, is caused by the failure of the cranial neuropore to close between the third and fourth weeks of gestation (at 23-26 embryonic days), resulting in the absence of a major portion of the brain, skull, and scalp (Dudar, 2010). Anencephalic newborns are either not viable or cannot be treated. Anencephaly is, therefore, classified as a lethal NTD. Although stillbirth is a common outcome of fetal anencephaly, many affected fetuses are born alive with a rudimentary brain.
The precise etiology of anencephaly and other NTDs is unknown. Genetic and en-vironmental factors, however, can contribute to these aberrations. Since the presence of the cystathionine beta synthase gene mutation 852Ins68 is likely responsible for abnormal dif-ferentiation of nervous tissue during the ontogenic development of a fetus, leading to NTDs, a single genetic factor could be an independent risk factor for birth defects (Saxena et al., 2011). In humans, genetic conditions, such as chromosomal abnormalities, single-gene dis-orders, Fraser syndrome, and Waardenburg syndrome, are associated with the onset of NTDs (Padmanabhan, 2006). Geographical and temporal variations as well as physical and chemical agents, such as X-rays, hyperthermia, anti-epileptic drugs, thalidomide, and folate deficiency, are examples of environmental factors that can contribute to NTDs (Erdogan et al., 2010). Fur-thermore, microRNAs (miRNAs), as post-transcriptional regulators, are involved in diverse
1017
©FUNPEC-RP www.funpecrp.com.brGenetics and Molecular Research 13 (1): 1015-1029 (2014)
MicroRNA dysregulation potentially leads to anencephaly
biological processes, including those possibly related to CNS development (Berezikov et al., 2006). miRNA dysregulation, therefore, is probably involved in the pathogenesis of anenceph-aly (Zhang et al., 2010).
miRNAs, composed of 20 to 25 nucleotides of endogenous non-coding RNAs, are in-volved in diverse biological processes and regulate various gene expression profiles (Hu et al., 2012). Within mammalian cells, miRNAs associate with the RNA-induced silencing complex to hybridize 8-mer ‘‘seed’’ sequences in the 3'-untranslated regions of target mRNAs (Tatro et al., 2010). These regions are partially complementary to miRNAs that are directed for deg-radation and/or suppressed translation (Zhang et al., 2010). Emerging evidence suggests that miRNA dysregulation has an important function in human disease development (Nelson and Weiss, 2008). For instance, the altered expression of a subset of discrete miRNAs is involved in NTD generation in p532/2 embryos, which subsequently exhibit exencephaly (Hosako et al., 2009). Several miRNAs are expressed during the murine NT development and directly target genes that are important for NT ontogenesis (Hoesel et al., 2010). These studies, therefore, suggest that miRNAs are involved in CNS development, including in NT development. Con-versely, miRNA dysregulation likely results in the occurrence of NTDs, including anencephaly.
In the present study, miRNA microarray analysis and real-time quantitative reverse transcription-polymerase chain reaction (qRT-PCR) were performed to identify the specific miRNA expression profile of anencephalic fetal residual brain tissues, as compared with healthy human fetal brain tissues. Observed significant miRNA expression alterations were further investigated and validated. To better understand the function of the validated miRNAs, we predicted their target genes within the human genome and performed molecular biology analysis with the Molecule Annotation System 3.0 (MAS 3.0). We found 70 upregulated miRNAs and 7 downregulated miRNAs, and identified 459 potential target genes for 10 validated miRNAs. Among these 10 miRNAs, miR-22, miR-23a, miR-34a, miR-103, miR-125a, miR-132, miR-134, miR-138, and miR-185 were upregulated, whereas miR-149 was downregulated. MAS 3.0 analysis of the molecular functions and biological processes of these target genes suggested that miRNA maladjustment, which may be involved in human anencephaly via the mitogen-activated protein kinase (MAPK) signaling pathway, has a primary function in cellular biological processes.
MATERIAL AND METHODS
Tissue samples and total RNA isolation
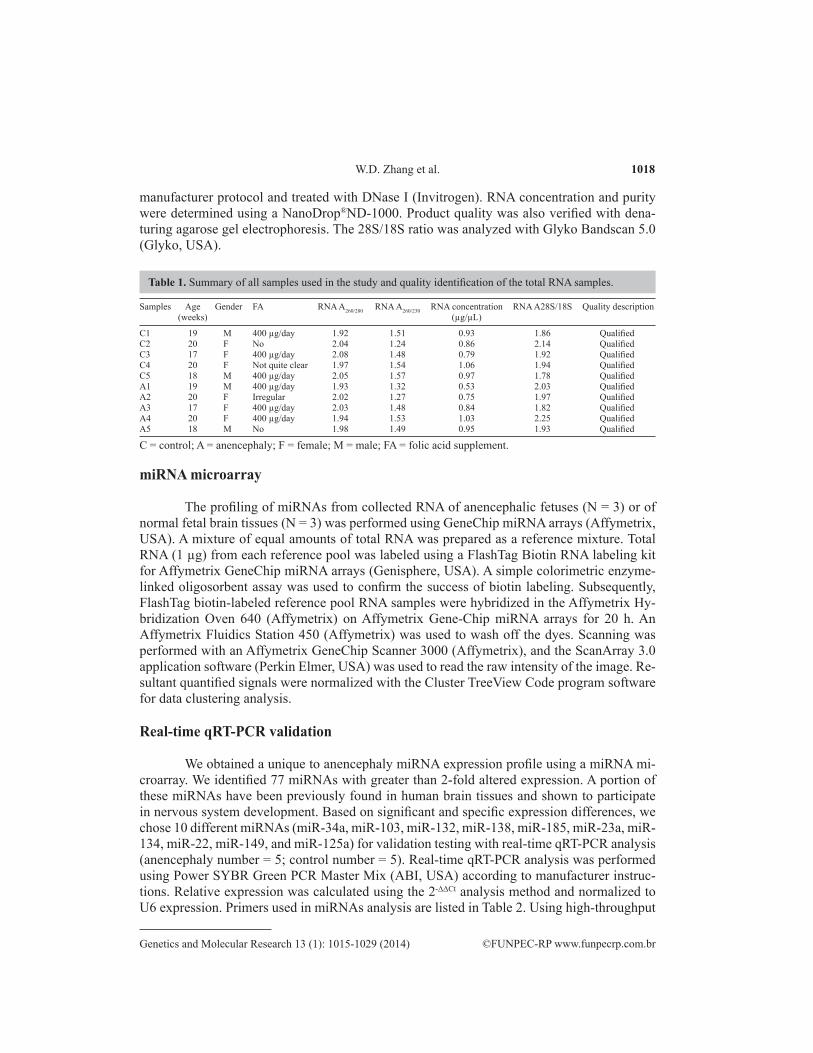
Ten tissue samples (five from normal brains and five from residual brains of anen-cephalic fetuses) were obtained from aborted fetuses within the Department of Gynecology and Obstetrics (Tongji Medical College, Huazhong University of Science and Technology) at Tongji Hospital in China. All parents of the participants provided written informed consent for sampling. The protocol and provisions in the written consent of pregnant women, and the written survey were all reviewed and approved by the Medical Ethics Committee of Tongji Hospital, Tongji Medical College, and Huazhong University of Science and Technology. The samples of gestational age between 17 to 20 weeks were paired for comparison based on age and gender. Characteristics of each specimen are listed in Table 1. Total RNA was ob-tained from the snap-frozen tissues using Trizol reagent (Invitrogen, USA) according to the
1018
©FUNPEC-RP www.funpecrp.com.brGenetics and Molecular Research 13 (1): 1015-1029 (2014)
W.D. Zhang et al.
manufacturer protocol and treated with DNase I (Invitrogen). RNA concentration and purity were determined using a NanoDrop®ND-1000. Product quality was also verified with dena-turing agarose gel electrophoresis. The 28S/18S ratio was analyzed with Glyko Bandscan 5.0 (Glyko, USA).
Samples Age Gender FA RNA A260/280 RNA A260/230 RNA concentration RNA A28S/18S Quality description (weeks) (µg/µL)
C1 19 M 400 µg/day 1.92 1.51 0.93 1.86 Qualified C2 20 F No 2.04 1.24 0.86 2.14 QualifiedC3 17 F 400 µg/day 2.08 1.48 0.79 1.92 QualifiedC4 20 F Not quite clear 1.97 1.54 1.06 1.94 QualifiedC5 18 M 400 µg/day 2.05 1.57 0.97 1.78 QualifiedA1 19 M 400 µg/day 1.93 1.32 0.53 2.03 Qualified A2 20 F Irregular 2.02 1.27 0.75 1.97 Qualified A3 17 F 400 µg/day 2.03 1.48 0.84 1.82 QualifiedA4 20 F 400 µg/day 1.94 1.53 1.03 2.25 QualifiedA5 18 M No 1.98 1.49 0.95 1.93 Qualified
C = control; A = anencephaly; F = female; M = male; FA = folic acid supplement.
Table 1. Summary of all samples used in the study and quality identification of the total RNA samples.
miRNA microarray
The profiling of miRNAs from collected RNA of anencephalic fetuses (N = 3) or of normal fetal brain tissues (N = 3) was performed using GeneChip miRNA arrays (Affymetrix, USA). A mixture of equal amounts of total RNA was prepared as a reference mixture. Total RNA (1 µg) from each reference pool was labeled using a FlashTag Biotin RNA labeling kit for Affymetrix GeneChip miRNA arrays (Genisphere, USA). A simple colorimetric enzyme-linked oligosorbent assay was used to confirm the success of biotin labeling. Subsequently, FlashTag biotin-labeled reference pool RNA samples were hybridized in the Affymetrix Hy-bridization Oven 640 (Affymetrix) on Affymetrix Gene-Chip miRNA arrays for 20 h. An Affymetrix Fluidics Station 450 (Affymetrix) was used to wash off the dyes. Scanning was performed with an Affymetrix GeneChip Scanner 3000 (Affymetrix), and the ScanArray 3.0 application software (Perkin Elmer, USA) was used to read the raw intensity of the image. Re-sultant quantified signals were normalized with the Cluster TreeView Code program software for data clustering analysis.
Real-time qRT-PCR validation
We obtained a unique to anencephaly miRNA expression profile using a miRNA mi-croarray. We identified 77 miRNAs with greater than 2-fold altered expression. A portion of these miRNAs have been previously found in human brain tissues and shown to participate in nervous system development. Based on significant and specific expression differences, we chose 10 different miRNAs (miR-34a, miR-103, miR-132, miR-138, miR-185, miR-23a, miR-134, miR-22, miR-149, and miR-125a) for validation testing with real-time qRT-PCR analysis (anencephaly number = 5; control number = 5). Real-time qRT-PCR analysis was performed using Power SYBR Green PCR Master Mix (ABI, USA) according to manufacturer instruc-tions. Relative expression was calculated using the 2-ΔΔCt analysis method and normalized to U6 expression. Primers used in miRNAs analysis are listed in Table 2. Using high-throughput
1019
©FUNPEC-RP www.funpecrp.com.brGenetics and Molecular Research 13 (1): 1015-1029 (2014)
MicroRNA dysregulation potentially leads to anencephaly
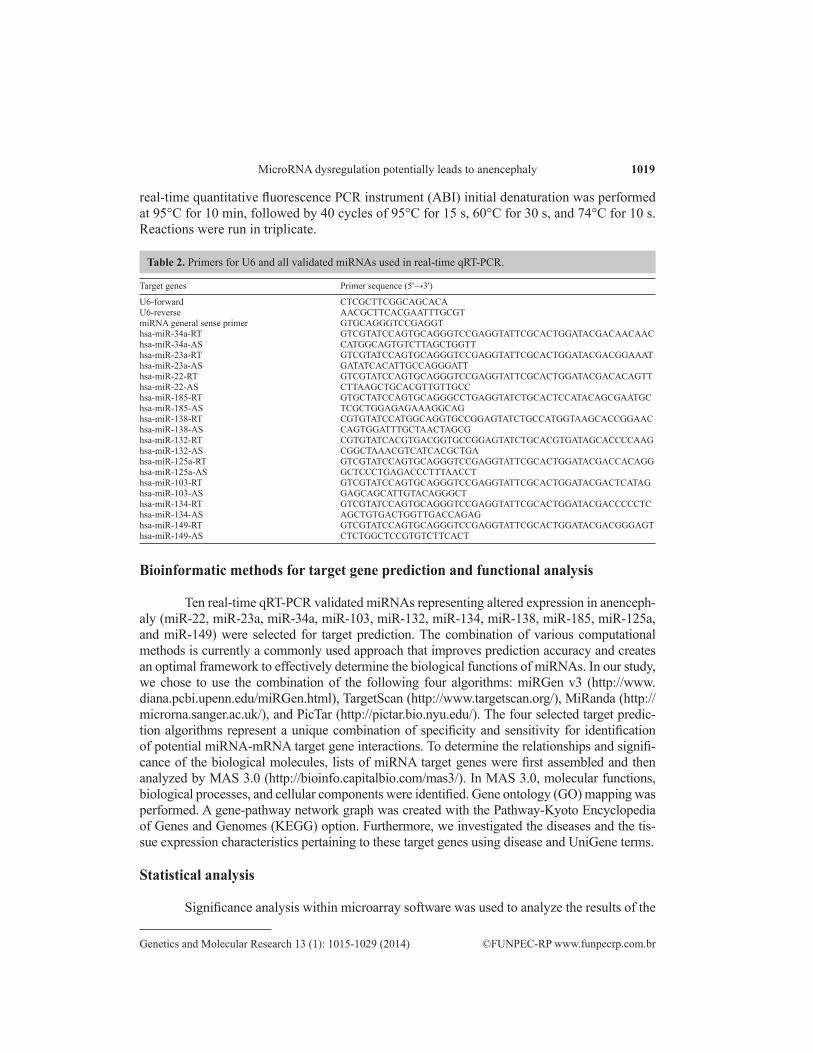
real-time quantitative fluorescence PCR instrument (ABI) initial denaturation was performed at 95°C for 10 min, followed by 40 cycles of 95°C for 15 s, 60°C for 30 s, and 74°C for 10 s. Reactions were run in triplicate.
Target genes Primer sequence (5'→3')
U6-forward CTCGCTTCGGCAGCACAU6-reverse AACGCTTCACGAATTTGCGTmiRNA general sense primer GTGCAGGGTCCGAGGThsa-miR-34a-RT GTCGTATCCAGTGCAGGGTCCGAGGTATTCGCACTGGATACGACAACAAChsa-miR-34a-AS CATGGCAGTGTCTTAGCTGGTThsa-miR-23a-RT GTCGTATCCAGTGCAGGGTCCGAGGTATTCGCACTGGATACGACGGAAAThsa-miR-23a-AS GATATCACATTGCCAGGGATThsa-miR-22-RT GTCGTATCCAGTGCAGGGTCCGAGGTATTCGCACTGGATACGACACAGTThsa-miR-22-AS CTTAAGCTGCACGTTGTTGCChsa-miR-185-RT GTGCTATCCAGTGCAGGGCCTGAGGTATCTGCACTCCATACAGCGAATGChsa-miR-185-AS TCGCTGGAGAGAAAGGCAGhsa-miR-138-RT CGTGTATCCATGGCAGGTGCCGGAGTATCTGCCATGGTAAGCACCGGAAChsa-miR-138-AS CAGTGGATTTGCTAACTAGCGhsa-miR-132-RT CGTGTATCACGTGACGGTGCCGGAGTATCTGCACGTGATAGCACCCCAAGhsa-miR-132-AS CGGCTAAACGTCATCACGCTGAhsa-miR-125a-RT GTCGTATCCAGTGCAGGGTCCGAGGTATTCGCACTGGATACGACCACAGGhsa-miR-125a-AS GCTCCCTGAGACCCTTTAACCThsa-miR-103-RT GTCGTATCCAGTGCAGGGTCCGAGGTATTCGCACTGGATACGACTCATAGhsa-miR-103-AS GAGCAGCATTGTACAGGGCThsa-miR-134-RT GTCGTATCCAGTGCAGGGTCCGAGGTATTCGCACTGGATACGACCCCCTChsa-miR-134-AS AGCTGTGACTGGTTGACCAGAGhsa-miR-149-RT GTCGTATCCAGTGCAGGGTCCGAGGTATTCGCACTGGATACGACGGGAGThsa-miR-149-AS CTCTGGCTCCGTGTCTTCACT
Table 2. Primers for U6 and all validated miRNAs used in real-time qRT-PCR.
Bioinformatic methods for target gene prediction and functional analysis
Ten real-time qRT-PCR validated miRNAs representing altered expression in anenceph-aly (miR-22, miR-23a, miR-34a, miR-103, miR-132, miR-134, miR-138, miR-185, miR-125a, and miR-149) were selected for target prediction. The combination of various computational methods is currently a commonly used approach that improves prediction accuracy and creates an optimal framework to effectively determine the biological functions of miRNAs. In our study, we chose to use the combination of the following four algorithms: miRGen v3 (http://www.diana.pcbi.upenn.edu/miRGen.html), TargetScan (http://www.targetscan.org/), MiRanda (http://microrna.sanger.ac.uk/), and PicTar (http://pictar.bio.nyu.edu/). The four selected target predic-tion algorithms represent a unique combination of specificity and sensitivity for identification of potential miRNA-mRNA target gene interactions. To determine the relationships and signifi-cance of the biological molecules, lists of miRNA target genes were first assembled and then analyzed by MAS 3.0 (http://bioinfo.capitalbio.com/mas3/). In MAS 3.0, molecular functions, biological processes, and cellular components were identified. Gene ontology (GO) mapping was performed. A gene-pathway network graph was created with the Pathway-Kyoto Encyclopedia of Genes and Genomes (KEGG) option. Furthermore, we investigated the diseases and the tis-sue expression characteristics pertaining to these target genes using disease and UniGene terms.
Statistical analysis
Significance analysis within microarray software was used to analyze the results of the
1020
©FUNPEC-RP www.funpecrp.com.brGenetics and Molecular Research 13 (1): 1015-1029 (2014)
W.D. Zhang et al.
miRNA microarray, which were compared with those of the normal fetal brain tissues. miRNAs determined to have equal to or greater than 2-fold altered expression in human anencephaly were considered to be significantly different. Real-time qRT-PCR data were analyzed using the 2-∆∆Ct method and a sample-paired t-test to determine the overall significance between experi-mental groups. Results with P values <0.05 were considered to be significantly different.
RESULTS
Total RNA isolation and quality identification
For the miRNA microarray, we extracted total RNA using TRIzol reagent. The ratio of A260/280 was approximately 2.0 and stripes in the lanes for 28S and 18S were visible (28S/18S ≈2; Table 1) for all collected RNA samples. According to these findings, the RNA samples are consistent with miRNA microarray requirements.
Microarray expression
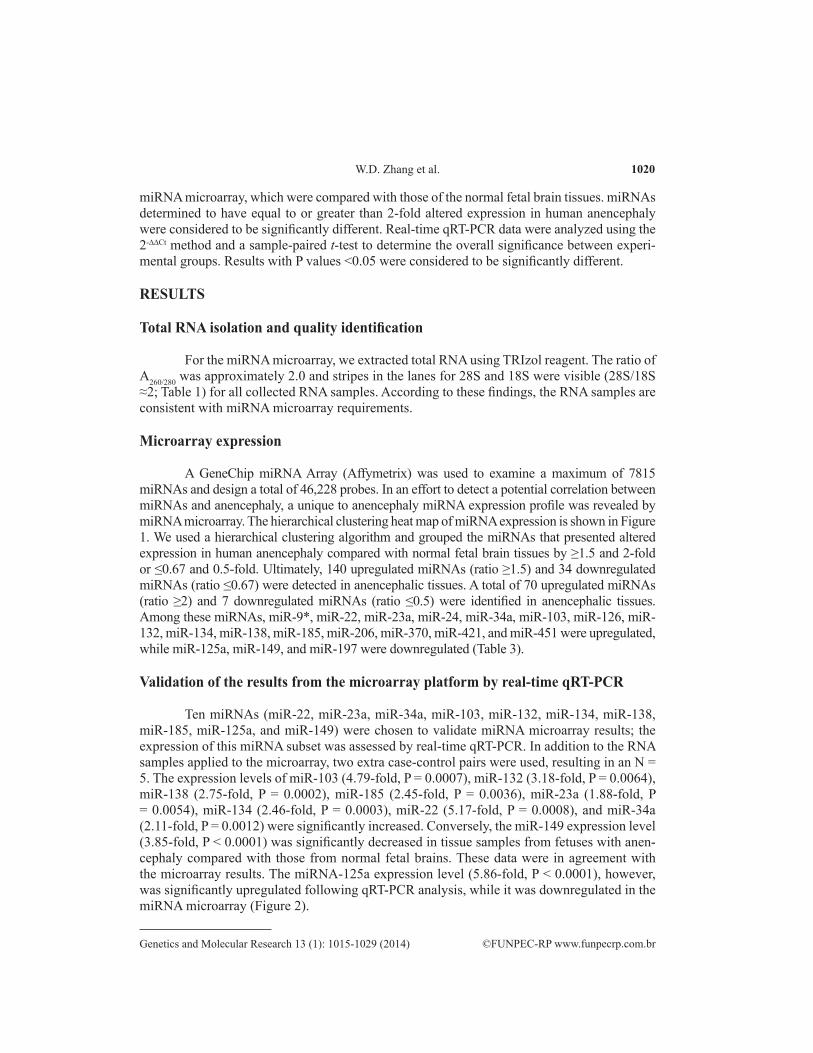
A GeneChip miRNA Array (Affymetrix) was used to examine a maximum of 7815 miRNAs and design a total of 46,228 probes. In an effort to detect a potential correlation between miRNAs and anencephaly, a unique to anencephaly miRNA expression profile was revealed by miRNA microarray. The hierarchical clustering heat map of miRNA expression is shown in Figure 1. We used a hierarchical clustering algorithm and grouped the miRNAs that presented altered expression in human anencephaly compared with normal fetal brain tissues by ≥1.5 and 2-fold or ≤0.67 and 0.5-fold. Ultimately, 140 upregulated miRNAs (ratio ≥1.5) and 34 downregulated miRNAs (ratio ≤0.67) were detected in anencephalic tissues. A total of 70 upregulated miRNAs (ratio ≥2) and 7 downregulated miRNAs (ratio ≤0.5) were identified in anencephalic tissues. Among these miRNAs, miR-9*, miR-22, miR-23a, miR-24, miR-34a, miR-103, miR-126, miR-132, miR-134, miR-138, miR-185, miR-206, miR-370, miR-421, and miR-451 were upregulated, while miR-125a, miR-149, and miR-197 were downregulated (Table 3).
Validation of the results from the microarray platform by real-time qRT-PCR
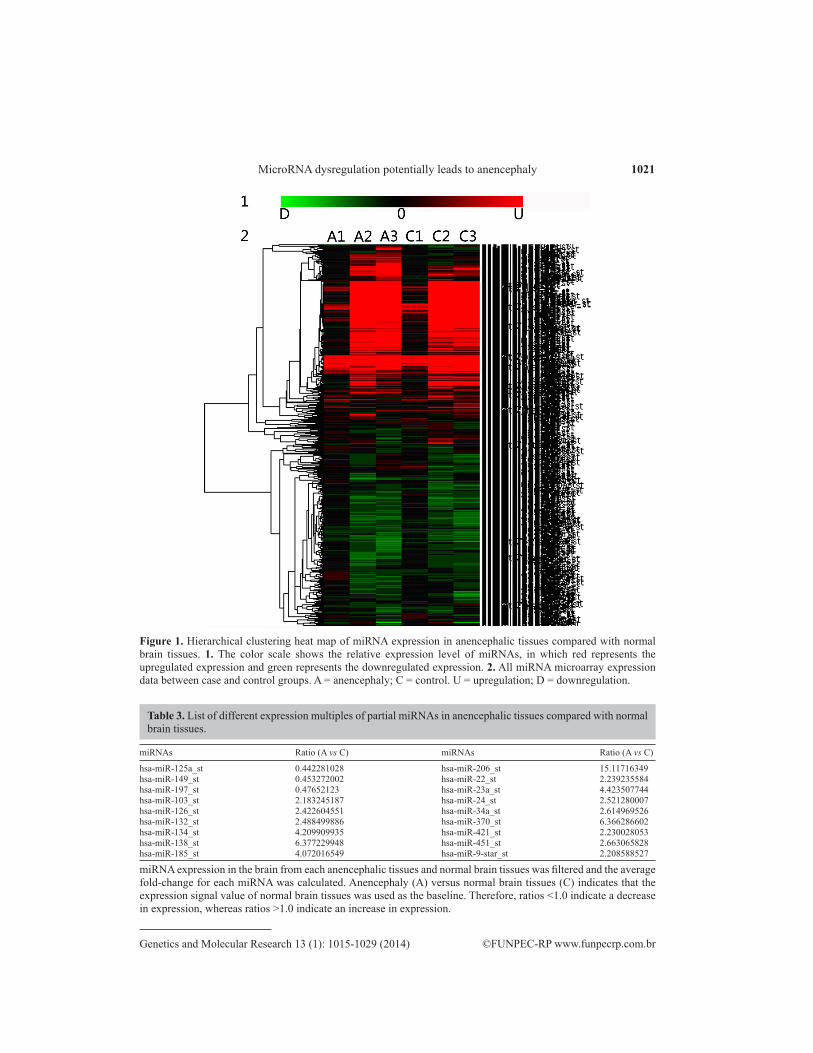
Ten miRNAs (miR-22, miR-23a, miR-34a, miR-103, miR-132, miR-134, miR-138, miR-185, miR-125a, and miR-149) were chosen to validate miRNA microarray results; the expression of this miRNA subset was assessed by real-time qRT-PCR. In addition to the RNA samples applied to the microarray, two extra case-control pairs were used, resulting in an N = 5. The expression levels of miR-103 (4.79-fold, P = 0.0007), miR-132 (3.18-fold, P = 0.0064), miR-138 (2.75-fold, P = 0.0002), miR-185 (2.45-fold, P = 0.0036), miR-23a (1.88-fold, P = 0.0054), miR-134 (2.46-fold, P = 0.0003), miR-22 (5.17-fold, P = 0.0008), and miR-34a (2.11-fold, P = 0.0012) were significantly increased. Conversely, the miR-149 expression level (3.85-fold, P < 0.0001) was significantly decreased in tissue samples from fetuses with anen-cephaly compared with those from normal fetal brains. These data were in agreement with the microarray results. The miRNA-125a expression level (5.86-fold, P < 0.0001), however, was significantly upregulated following qRT-PCR analysis, while it was downregulated in the miRNA microarray (Figure 2).
1021
©FUNPEC-RP www.funpecrp.com.brGenetics and Molecular Research 13 (1): 1015-1029 (2014)
MicroRNA dysregulation potentially leads to anencephaly
miRNAs Ratio (A vs C) miRNAs Ratio (A vs C)
hsa-miR-125a_st 0.442281028 hsa-miR-206_st 15.11716349hsa-miR-149_st 0.453272002 hsa-miR-22_st 2.239235584hsa-miR-197_st 0.47652123 hsa-miR-23a_st 4.423507744hsa-miR-103_st 2.183245187 hsa-miR-24_st 2.521280007hsa-miR-126_st 2.422604551 hsa-miR-34a_st 2.614969526hsa-miR-132_st 2.488499886 hsa-miR-370_st 6.366286602hsa-miR-134_st 4.209909935 hsa-miR-421_st 2.230028053hsa-miR-138_st 6.377229948 hsa-miR-451_st 2.663065828hsa-miR-185_st 4.072016549 hsa-miR-9-star_st 2.208588527
miRNA expression in the brain from each anencephalic tissues and normal brain tissues was filtered and the average fold-change for each miRNA was calculated. Anencephaly (A) versus normal brain tissues (C) indicates that the expression signal value of normal brain tissues was used as the baseline. Therefore, ratios <1.0 indicate a decrease in expression, whereas ratios >1.0 indicate an increase in expression.
Table 3. List of different expression multiples of partial miRNAs in anencephalic tissues compared with normal brain tissues.
Figure 1. Hierarchical clustering heat map of miRNA expression in anencephalic tissues compared with normal brain tissues. 1. The color scale shows the relative expression level of miRNAs, in which red represents the upregulated expression and green represents the downregulated expression. 2. All miRNA microarray expression data between case and control groups. A = anencephaly; C = control. U = upregulation; D = downregulation.
1022
©FUNPEC-RP www.funpecrp.com.brGenetics and Molecular Research 13 (1): 1015-1029 (2014)
W.D. Zhang et al.
Figure 2. Validation of 10 miRNAs from microarray results by using real-time qRT-PCR. **P < 0.01 and ***P < 0.001.
Target gene prediction and molecular functional analysis
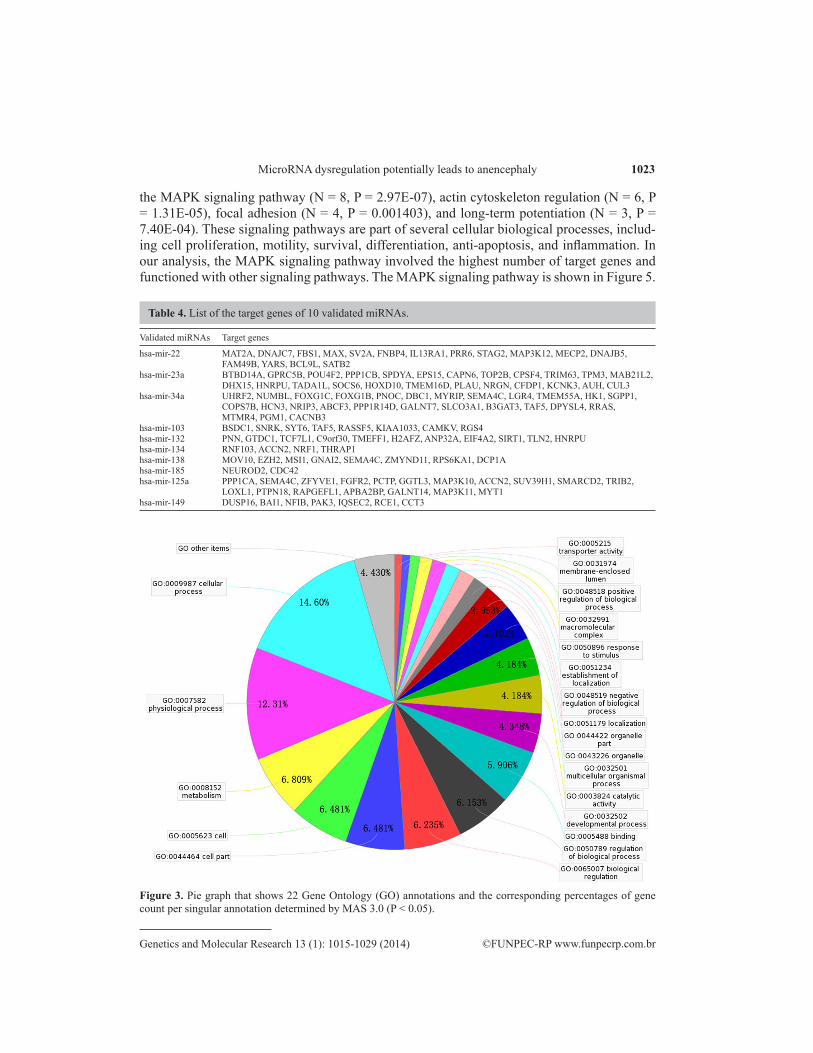
Four prediction algorithms were used to generate a combined set of 459 target genes that may be regulated by the 10 validated miRNAs. Of this data set, 119 target genes per-tained to 10 validated miRNAs following MAS 3.0 analysis according to miRNA terms (Table 4). To classify these 119 target genes according to their molecular functions, biological pro-cesses, and cellular components, we conducted GO mapping at the second level (Figure 3). We showed 22 GO annotations and the corresponding percentage of target genes count per singular annotation. Versus the total number of target genes of all GO annotations, “Cellular process” encompassed the highest proportion (14.60%), whereas “cell” and “cell part” had 12.962%. In addition, “developmental process” shared 4.348%, including “anatomical struc-ture development” (1.952%) and “embryonic development” (0.2711%), which were obtained at the third level. The gene products identified within the nucleus (N = 50, P = 6.03E-57) and the cytoplasm (N = 39, P = 1.77E-34) were found to participate in regulation of transcription (N = 19, P = 6.09E-20), transcription (N = 15, P = 6.74E-14), development (N = 13, P = 9.49E-12), signal transduction (N = 12, P = 1.28E-08), and nervous system development (N = 10, P = 9.46E-13), mainly through protein binding (N = 58, P = 1.72E-61), nucleotide binding (N = 23, P = 2.78E-27), ATP binding (N = 20, P = 2.90E-26), metal ion binding (N = 15, P = 4.50E-11), and transferase activity (N = 14, P = 3.20E-15).
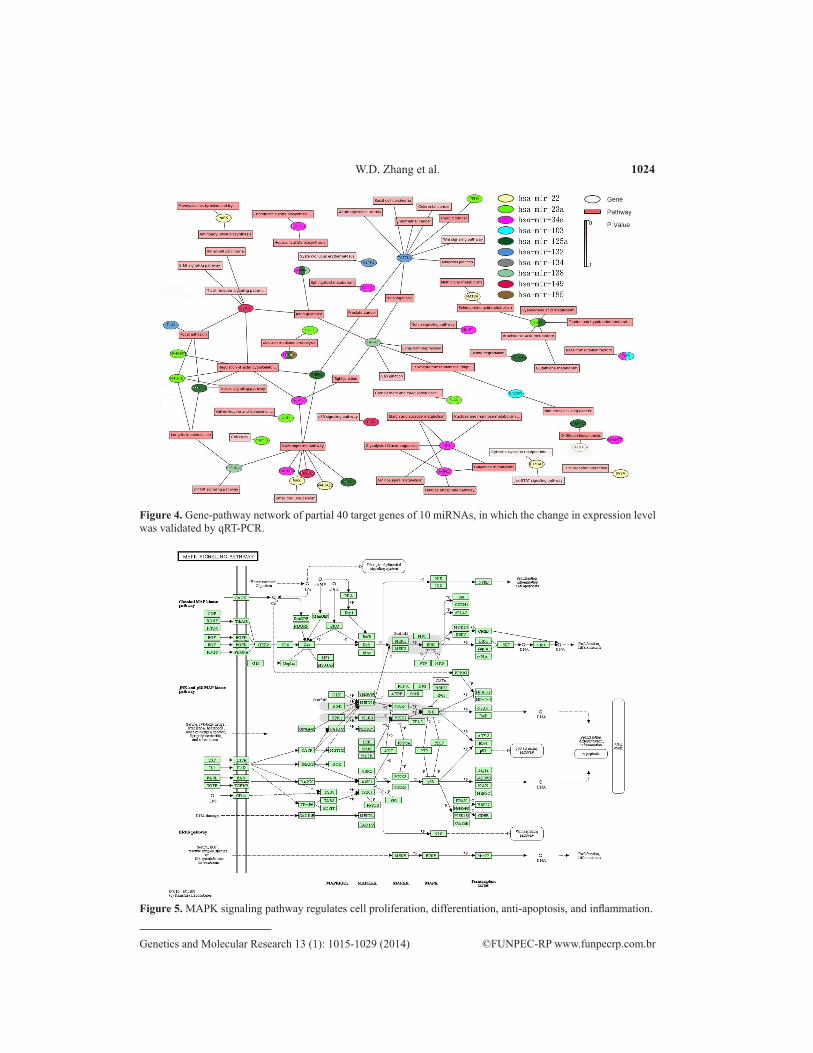
KEGG was used to generate a gene-pathway network graph based on the 119 target genes identified by MAS 3.0. We found that 55 functional pathways were involved with 40 target genes (Figure 4). The target genes of miR-34a, miR-125a, miR-23a, miR-132, miR-138, and miR-22 participated in several biological systems. Specifically, miR-34a, miR-125a, and miR-23a were shown to have functions in 17, 15, and 14 gene pathways, respectively. A number of the gene pathways indentified were closely related to NTD development, including
1023
©FUNPEC-RP www.funpecrp.com.brGenetics and Molecular Research 13 (1): 1015-1029 (2014)
MicroRNA dysregulation potentially leads to anencephaly
Validated miRNAs Target genes
hsa-mir-22 MAT2A, DNAJC7, FBS1, MAX, SV2A, FNBP4, IL13RA1, PRR6, STAG2, MAP3K12, MECP2, DNAJB5, FAM49B, YARS, BCL9L, SATB2hsa-mir-23a BTBD14A, GPRC5B, POU4F2, PPP1CB, SPDYA, EPS15, CAPN6, TOP2B, CPSF4, TRIM63, TPM3, MAB21L2, DHX15, HNRPU, TADA1L, SOCS6, HOXD10, TMEM16D, PLAU, NRGN, CFDP1, KCNK3, AUH, CUL3hsa-mir-34a UHRF2, NUMBL, FOXG1C, FOXG1B, PNOC, DBC1, MYRIP, SEMA4C, LGR4, TMEM55A, HK1, SGPP1, COPS7B, HCN3, NRIP3, ABCF3, PPP1R14D, GALNT7, SLCO3A1, B3GAT3, TAF5, DPYSL4, RRAS, MTMR4, PGM1, CACNB3hsa-mir-103 BSDC1, SNRK, SYT6, TAF5, RASSF5, KIAA1033, CAMKV, RGS4hsa-mir-132 PNN, GTDC1, TCF7L1, C9orf30, TMEFF1, H2AFZ, ANP32A, EIF4A2, SIRT1, TLN2, HNRPUhsa-mir-134 RNF103, ACCN2, NRF1, THRAP1hsa-mir-138 MOV10, EZH2, MSI1, GNAI2, SEMA4C, ZMYND11, RPS6KA1, DCP1Ahsa-mir-185 NEUROD2, CDC42hsa-mir-125a PPP1CA, SEMA4C, ZFYVE1, FGFR2, PCTP, GGTL3, MAP3K10, ACCN2, SUV39H1, SMARCD2, TRIB2, LOXL1, PTPN18, RAPGEFL1, APBA2BP, GALNT14, MAP3K11, MYT1hsa-mir-149 DUSP16, BAI1, NFIB, PAK3, IQSEC2, RCE1, CCT3
Table 4. List of the target genes of 10 validated miRNAs.
Figure 3. Pie graph that shows 22 Gene Ontology (GO) annotations and the corresponding percentages of gene count per singular annotation determined by MAS 3.0 (P < 0.05).
the MAPK signaling pathway (N = 8, P = 2.97E-07), actin cytoskeleton regulation (N = 6, P = 1.31E-05), focal adhesion (N = 4, P = 0.001403), and long-term potentiation (N = 3, P = 7.40E-04). These signaling pathways are part of several cellular biological processes, includ-ing cell proliferation, motility, survival, differentiation, anti-apoptosis, and inflammation. In our analysis, the MAPK signaling pathway involved the highest number of target genes and functioned with other signaling pathways. The MAPK signaling pathway is shown in Figure 5.
1024
©FUNPEC-RP www.funpecrp.com.brGenetics and Molecular Research 13 (1): 1015-1029 (2014)
W.D. Zhang et al.
Figure 4. Gene-pathway network of partial 40 target genes of 10 miRNAs, in which the change in expression level was validated by qRT-PCR.
Figure 5. MAPK signaling pathway regulates cell proliferation, differentiation, anti-apoptosis, and inflammation.
1025
©FUNPEC-RP www.funpecrp.com.brGenetics and Molecular Research 13 (1): 1015-1029 (2014)
MicroRNA dysregulation potentially leads to anencephaly
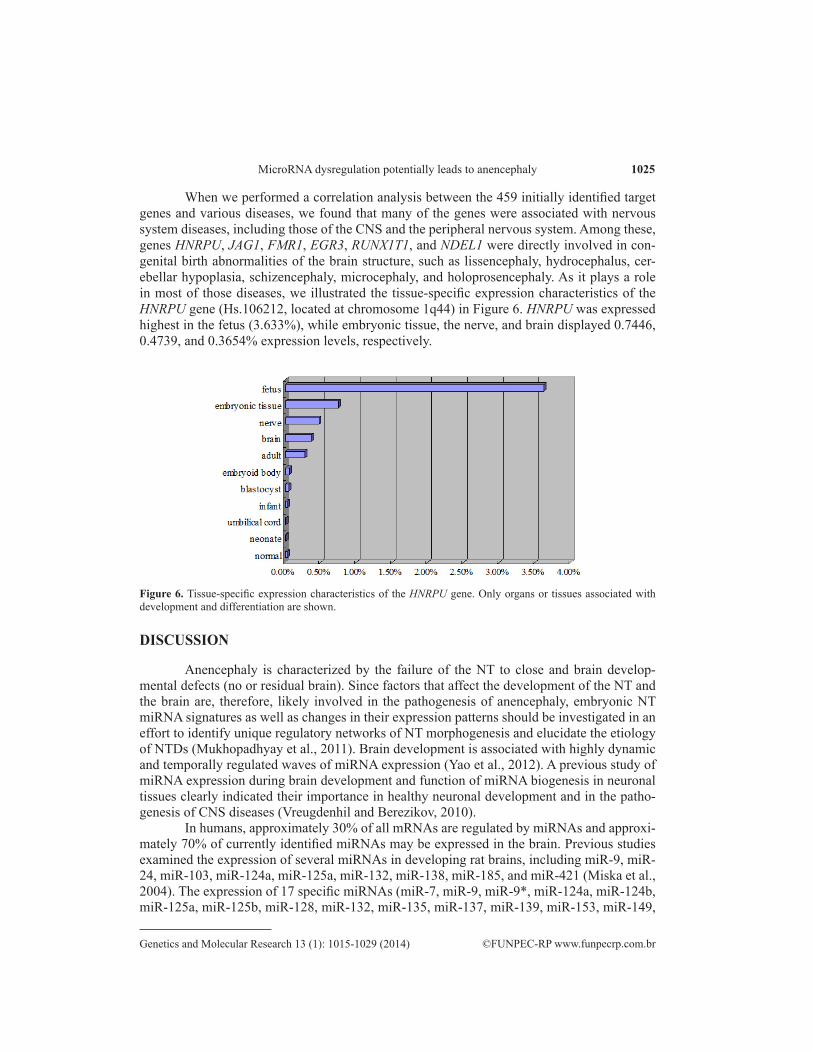
When we performed a correlation analysis between the 459 initially identified target genes and various diseases, we found that many of the genes were associated with nervous system diseases, including those of the CNS and the peripheral nervous system. Among these, genes HNRPU, JAG1, FMR1, EGR3, RUNX1T1, and NDEL1 were directly involved in con-genital birth abnormalities of the brain structure, such as lissencephaly, hydrocephalus, cer-ebellar hypoplasia, schizencephaly, microcephaly, and holoprosencephaly. As it plays a role in most of those diseases, we illustrated the tissue-specific expression characteristics of the HNRPU gene (Hs.106212, located at chromosome 1q44) in Figure 6. HNRPU was expressed highest in the fetus (3.633%), while embryonic tissue, the nerve, and brain displayed 0.7446, 0.4739, and 0.3654% expression levels, respectively.
Figure 6. Tissue-specific expression characteristics of the HNRPU gene. Only organs or tissues associated with development and differentiation are shown.
DISCUSSION
Anencephaly is characterized by the failure of the NT to close and brain develop-mental defects (no or residual brain). Since factors that affect the development of the NT and the brain are, therefore, likely involved in the pathogenesis of anencephaly, embryonic NT miRNA signatures as well as changes in their expression patterns should be investigated in an effort to identify unique regulatory networks of NT morphogenesis and elucidate the etiology of NTDs (Mukhopadhyay et al., 2011). Brain development is associated with highly dynamic and temporally regulated waves of miRNA expression (Yao et al., 2012). A previous study of miRNA expression during brain development and function of miRNA biogenesis in neuronal tissues clearly indicated their importance in healthy neuronal development and in the patho-genesis of CNS diseases (Vreugdenhil and Berezikov, 2010).
In humans, approximately 30% of all mRNAs are regulated by miRNAs and approxi-mately 70% of currently identified miRNAs may be expressed in the brain. Previous studies examined the expression of several miRNAs in developing rat brains, including miR-9, miR-24, miR-103, miR-124a, miR-125a, miR-132, miR-138, miR-185, and miR-421 (Miska et al., 2004). The expression of 17 specific miRNAs (miR-7, miR-9, miR-9*, miR-124a, miR-124b, miR-125a, miR-125b, miR-128, miR-132, miR-135, miR-137, miR-139, miR-153, miR-149,
1026
©FUNPEC-RP www.funpecrp.com.brGenetics and Molecular Research 13 (1): 1015-1029 (2014)
W.D. Zhang et al.
miR-183, miR-190, and miR-219) was also investigated in mouse and human brain (Sempere et al., 2004). The NT and brain development, however, require the precise, spatio-temporal expression of a number of genes as well as the coordinated interaction of signal transduction and gene-regulatory networks. Disrupted miRNA expression and interactions may contribute to the etiology of NTDs. Anencephalic residual brain tissues revealed that miR-126, miR-198, miR-451, miR-103, and miR-107 are upregulated in the illness, whereas miR-9, miR-212, miR-124, and miR-138 are downregulated (Zhang et al., 2010), as compared with healthy human fetal brain tissues. In the present study, 70 upregulated miRNAs and 7 downregulated miRNAs were detected in anencephalic tissues. The microarray identified altered expressions of miR-22, miR-23a, miR-34a, miR-103, miR-132, miR-134, miR-138, miR-185, and miR-149 were validated by real-time qRT-PCR, while miR-125a had discordant results. Our results, therefore, revealed a unique miRNA expression profile specific to anencephaly and elucidated the pathogenic effect of miRNA disruption.
A single miRNA can potentially regulate a large set of genes. For instance, miR-22 is predicted to target one-carbon metabolic genes (MTHFR, TCblR, TCN2, SLC19A1, MAT2A, and MTHFD2) that are important in folate and vitamin B12 transport as well as folate cofactor distribution and methylation; miR-22 is significantly upregulated in cells that are grown in low folate concentrations (Stone et al., 2011). Although miR-22, miR-23a, miR-103, and miR-107 are expressed at low levels in normal brain development (Sempere et al., 2004), they were upregulated in cases of anencephaly (Table 3). The overexpression of the miR-23a-27a-24-2 cluster can induce apoptosis by creating stress on the endoplasmic reticulum (Chhabra et al., 2011). miR-34a, miR-103, miR-107, miR-130a, miR-130b, miR-449a, and miR-449c are partially complementary to the 3'-untranslated regions of gene Dll1, and participate in the regulation of Dll1 expression in the paraxial and the limb mesoderm, the NT and the hindbrain region, and in the cranial ganglia (Hoesel et al., 2010). The overexpression of miR-34a dur-ing NT development can result in an NTD by inducing Dll1 downregulation, which leads to a prolonged state of ventral progenitor expression instead of appropriately timed differentiation (Shookhoff and Gallicano, 2010).
miR-132 (Luikart et al., 2011) and miR-134 (Christensen et al., 2010) positively regu-late the development of dendrites and spines as well as synaptic integration. The overexpres-sion of miR-132, however, significantly suppresses dopamine neuron differentiation without altering the total number of neurons by directly suppressing Nurr1 gene expression (Yang et al., 2012), while miR-134 upregulation can reduce cell migration in neural progenitors (Gaughwin et al., 2011), the latter a process that is crucial for NT closure. Due to the observed upregulation of miR-134 in anencephaly within our study, miR-134 overexpression may be considered a high risk factor for NTDs. miR-138, miR-219, miR-9, miR-23, and miR-19b participate in oligodendrocyte differentiation and play important roles in brain development and neuron function (Li and Yao, 2012). Since cells from open caudal NTs of Splotch embryos (Sp-/-) exhibit folic acid deficiency leading to upregulation of miR-138, miR-148a, miR-185, and miR-339-5p, these miRNAs reduce KDM6B expression and promote the methylation of H3K27 by targeting KDM6B, to ultimately decrease stem cell proliferation and premature neurogenesis (Ichi et al., 2010).
The target gene of miR-125a, LIN28, is expressed in a number of developing tissues, including the mouse NT, and co-localizes with SOX2 (Balzer et al., 2010). In mouse embryon-ic stem (ES) cells, specific suppression of LIN28 results in decreased cell proliferation, while
1027
©FUNPEC-RP www.funpecrp.com.brGenetics and Molecular Research 13 (1): 1015-1029 (2014)
MicroRNA dysregulation potentially leads to anencephaly
overexpression of LIN28 accelerates cell proliferation (Xu et al., 2009). Moreover, the overex-pression of miR-125a impairs differentiation by downregulating Dies1 and decreasing BMP4 signaling, to arrests cell development in epiblast stem cell status (Parisi et al., 2012). Here, we demonstrated that miR-149 is likely associated with human anencephaly. Even though our re-sults indicated that downregulated miR-149 expression is responsible for anencephaly, a more in-depth analysis should be performed to confirm this conclusion.
Although the dysregulation of miRNA expression has been described for various hu-man CNS diseases, including NTDs, the molecular pathological mechanism for the develop-ment of anencephaly in terms of altered miRNA expression has not yet been fully elucidated. CNS formation relies on the normal development of the neural plate. In general, the neural plate is composed of a single layer of highly polarized neuroepithelial cells. At the onset of neurogenesis, these neuroepithelial cells act in an asymmetrical mode to create radial glial cells and intermediate progenitor cells (Lau and Hudson, 2010). In this study, we found that the target genes of validated miRNAs were mainly located within the nucleus and functioned in transcription, signal transduction, cell cycle, cell proliferation, cell migration, cell differ-entiation, cell inflammation, cell apoptosis, and cell-to-cell signaling. These interactions were determined to be performed by protein binding, nucleotide binding, ATP binding, metal ion binding, and transferase activity. miRNA dysregulation could, therefore, affect the physiologi-cal processes of neuroepithelial cells by regulating their target genes and consequently partici-pating in the pathogenesis of anencephaly.
KEGG is a database resource that is used as reference for the understanding of high-level biological system functions at the molecular level, particularly in analysis of large-scale molecular datasets generated by high-throughput experimental technologies. In this study, a gene-pathway network graph was established with KEGG, revealing the involvement of 55 gene-functional pathways with 40 target genes. MAPK signaling pathways, the key regula-tors of cell apoptosis and proliferation, play highly important roles in hyperglycemia-induced NTDs (Chen et al., 2004). Analyses of the neuroepithelium in MEKK4-deficient embryos revealed significantly increased apoptosis levels before and during NT closure (Chi et al., 2005). MEKK4-regulated p38 activity is important in neurulation, while embryos that are homozygous for an MEKK4 mutation die at birth owing to skeletal malformations and NTDs (Abell et al., 2005). FGFR1 has pleiotropic functions during embryonic development. Bio-chemical studies have shown that FGF receptor-specific substrates (Frs2 and Frs3) function as the principal mediators of FGFR1 signal transduction towards MAPK and PI3K pathways. FGFR1(Delta)Frs/DeltaFrs embryos, that generally die during late embryogenesis, display defects in NT closure as well as in the development of the tail bud and pharyngeal arches (Hoch and Soriano, 2006). The PA6 stromal cell line secretes soluble factors that promote the survival of ES cell-derived early neural stem/progenitor cells (NS/PCs) through their activa-tion of MAPK and PI3K-Akt pathways. When added to ES cell-derived NS/PCs, inhibitors of MAPK and PI3K-Akt signaling pathways, U0126 and LY294002, significantly increase the number of apoptotic cells to decrease the number of viable cells (Ishii et al., 2010). In our study, the MAPK signaling pathway (N = 8, P = 2.97E-07) involved the highest number of target genes and associated functions, compared with other signaling pathways.
Actin cytoskeleton regulation (N = 6, P = 1.31E-05) involved the second highest num-ber of target genes and included the MAPK signaling pathway, additionally suggesting its im-portance role in nervous system development. Palladin may be involved in actin cytoskeleton regulation, nervous system development, actin stress fiber formation, cell adhesion, and mi-
1028
©FUNPEC-RP www.funpecrp.com.brGenetics and Molecular Research 13 (1): 1015-1029 (2014)
W.D. Zhang et al.
gration. Palladin is also necessary for the initiation of NT closure and, thus, may be involved in the etiology of human NTDs (Luo et al., 2005). Cdc42 controls polarized cellular morphol-ogy through its regulation of the actin and microtubule cytoskeleton architecture, a function that is essential in various processes, including NT morphogenesis and brain development (Peng et al., 2013). Histological analysis revealed that DLC-1-/- embryos have defects in NT, brain, heart, and placenta formation, owing to alterations on the organization of actin filaments and focal adhesions (Durkin et al., 2005). We also identified target genes related to congenital birth abnormalities of the brain structure in our study, namely JAG1 (Fernandez-Valdivia et al., 2011) and FMR1 (Junaid et al., 2011), which have been previously shown to be related to NTDs, unlike HNRPU, EGR3, RUNX1T1, and NDEL1. These target genes would make good candidates for further investigations examining the etiology of anencephaly.
The present study provided valuable, additional insights on the function of altered miRNA expression in the etiopathogenesis of anencephaly. We also described the biological functions of the target genes of miRNAs, which will form the basis of future investigations of other NTDs. Although the functions of most human miRNAs are not yet fully understood, our results strongly suggested that target mRNAs that are regulated by miRNAs through MAPK signaling pathway are involved in the primary mechanism of human anencephaly.
ACKNOWLEDGMENTS
Research supported by grants from the National Key Basic Research and Develop-ment Project (“973” Project, Grant #2005CB5225007), the Key Clinic Programs of Ministry of Health (2010-2012), and the Twelfth Five Year Plan of the National Science and Technol-ogy Supporting Project (Grant #2012BAI 09B04).
REFERENCES
Abell AN, Rivera-Perez JA, Cuevas BD, Uhlik MT, et al. (2005). Ablation of MEKK4 kinase activity causes neurulation and skeletal patterning defects in the mouse embryo. Mol. Cell Biol. 25: 8948-8959.
Balzer E, Heine C, Jiang Q, Lee VM, et al. (2010). LIN28 alters cell fate succession and acts independently of the let-7 microRNA during neurogliogenesis in vitro. Development 137: 891-900.
Berezikov E, Thuemmler F, van Laake LW, Kondova I, et al. (2006). Diversity of microRNAs in human and chimpanzee brain. Nat. Genet. 38: 1375-1377.
Chen BL, Ma XD, Xin XY, Wang DT, et al. (2004). MAP kinase signal pathway in hyperglycemia-induced congenital neural tube defects. Yi Chuan 26: 615-619.
Chhabra R, Dubey R and Saini N (2011). Gene expression profiling indicate role of ER stress in miR-23a~27a~24-2 cluster induced apoptosis in HEK293T cells. RNA Biol. 8: 648-664.
Chi H, Sarkisian MR, Rakic P and Flavell RA (2005). Loss of mitogen-activated protein kinase kinase kinase 4 (MEKK4) results in enhanced apoptosis and defective neural tube development. Proc. Natl. Acad. Sci. U. S. A. 102: 3846-3851.
Christensen M, Larsen LA, Kauppinen S and Schratt G (2010). Recombinant adeno-associated virus-mediated microRNA delivery into the postnatal mouse brain reveals a role for miR-134 in dendritogenesis in vivo. Front Neural Circuits 3: 16.
Dudar JC (2010). Qualitative and quantitative diagnosis of lethal cranial neural tube defects from the fetal and neonatal human skeleton, with a case study involving taphonomically altered remains. J. Forensic Sci. 55: 877-883.
Durkin ME, Avner MR, Huh CG, Yuan BZ, et al. (2005). DLC-1, a Rho GTPase-activating protein with tumor suppressor function, is essential for embryonic development. FEBS Lett. 579: 1191-1196.
Erdogan MO, Yildiz SH, Solak M, Eser O, et al. (2010). C677T polymorphism of the methylenetetrahydrofolate reductase gene does not affect folic acid, vitamin B12, and homocysteine serum levels in Turkish children with neural tube defects. Genet. Mol. Res. 9: 1197-1203.
Fernandez-Valdivia R, Takeuchi H, Samarghandi A, Lopez M, et al. (2011). Regulation of mammalian Notch signaling and embryonic development by the protein O-glucosyltransferase Rumi. Development 138: 1925-1934.
1029
©FUNPEC-RP www.funpecrp.com.brGenetics and Molecular Research 13 (1): 1015-1029 (2014)
MicroRNA dysregulation potentially leads to anencephaly
Gaughwin P, Ciesla M, Yang H, Lim B, et al. (2011). Stage-specific modulation of cortical neuronal development by Mmu-miR-134. Cereb. Cortex 21: 1857-1869.
Greene ND, Stanier P and Copp AJ (2009). Genetics of human neural tube defects. Hum. Mol. Genet. 18: R113-R129.Hoch RV and Soriano P (2006). Context-specific requirements for Fgfr1 signaling through Frs2 and Frs3 during mouse
development. Development 133: 663-673.Hoesel B, Bhujabal Z, Przemeck GK, Kurz-Drexler A, et al. (2010). Combination of in silico and in situ hybridisation
approaches to identify potential Dll1 associated miRNAs during mouse embryogenesis. Gene Expr. Patterns 10: 265-273.
Hosako H, Martin GS, Barrier M, Chen YA, et al. (2009). Gene and microRNA expression in p53-deficient day 8.5 mouse embryos. Birth Defects Res. A Clin. Mol. Teratol. 85: 546-555.
Hu H, Li S, Liu J and Ni B (2012). MicroRNA-193b modulates proliferation, migration, and invasion of non-small cell lung cancer cells. Acta Biochim. Biophys. Sin. 44: 424-430.
Ichi S, Costa FF, Bischof JM, Nakazaki H, et al. (2010). Folic acid remodels chromatin on Hes1 and Neurog2 promoters during caudal neural tube development. J. Biol. Chem. 285: 36922-36932.
Ishii S, Okada Y, Kadoya T, Matsuzaki Y, et al. (2010). Stromal cell-secreted factors promote the survival of embryonic stem cell-derived early neural stem/progenitor cells via the activation of MAPK and PI3K-Akt pathways. J. Neurosci. Res. 88: 722-734.
Junaid MA, Kuizon S, Cardona J, Azher T, et al. (2011). Folic acid supplementation dysregulates gene expression in lymphoblastoid cells - implications in nutrition. Biochem. Biophys. Res. Commun. 412: 688-692.
Lau P and Hudson LD (2010). MicroRNAs in neural cell differentiation. Brain Res. 1338: 14-19.Li JS and Yao ZX (2012). MicroRNAs: novel regulators of oligodendrocyte differentiation and potential therapeutic
targets in demyelination-related diseases. Mol. Neurobiol. 45: 200-212.Luikart BW, Bensen AL, Washburn EK, Perederiy JV, et al. (2011). miR-132 mediates the integration of newborn neurons
into the adult dentate gyrus. PLoS One 6: e19077.Luo H, Liu X, Wang F, Huang Q, et al. (2005). Disruption of palladin results in neural tube closure defects in mice. Mol.
Cell Neurosci. 29: 507-515.Miska EA, Alvarez-Saavedra E, Townsend M, Yoshii A, et al. (2004). Microarray analysis of microRNA expression in the
developing mammalian brain. Genome Biol. 5: R68.Mukhopadhyay P, Brock G, Appana S, Webb C, et al. (2011). MicroRNA gene expression signatures in the developing
neural tube. Birth Defects Res. A Clin. Mol. Teratol. 91: 744-762.Nelson KM and Weiss GJ (2008). MicroRNAs and cancer: past, present, and potential future. Mol. Cancer Ther. 7: 3655-3660.Padmanabhan R (2006). Etiology, pathogenesis and prevention of neural tube defects. Congenit. Anom. 46: 55-67.Parisi S, Battista M, Musto A, Navarra A, et al. (2012). A regulatory loop involving Dies1 and miR-125a controls BMP4
signaling in mouse embryonic stem cells. FASEB J. 26: 3957-3968.Peng X, Lin Q, Liu Y, Jin Y, et al. (2013). Inactivation of Cdc42 in embryonic brain results in hydrocephalus with
ependymal cell defects in mice. Protein Cell 4: 231-242.Saxena AK, Gupta J, Pandey S, Gangopadhaya AN, et al. (2011). Prevalence of cystathionine beta synthase gene mutation
852Ins68 as a possible risk for neural tube defects in eastern India. Genet. Mol. Res. 10: 2424-2429.Sempere LF, Freemantle S, Pitha-Rowe I, Moss E, et al. (2004). Expression profiling of mammalian microRNAs uncovers
a subset of brain-expressed microRNAs with possible roles in murine and human neuronal differentiation. Genome Biol. 5: R13.
Shookhoff JM and Gallicano GI (2010). A new perspective on neural tube defects: folic acid and microRNA misexpression. Genesis 48: 282-294.
Stone N, Pangilinan F, Molloy AM, Shane B, et al. (2011). Bioinformatic and genetic association analysis of microRNA target sites in one-carbon metabolism genes. PLoS One 6: e21851.
Tatro ET, Scott ER, Nguyen TB, Salaria S, et al. (2010). Evidence for alteration of gene regulatory networks through microRNAs of the HIV-infected brain: novel analysis of retrospective cases. PLoS One 5: e10337.
Vreugdenhil E and Berezikov E (2010). Fine-tuning the brain: microRNAs. Front Neuroendocrinol. 31: 128-133.Xu B, Zhang K and Huang Y (2009). Lin28 modulates cell growth and associates with a subset of cell cycle regulator
mRNAs in mouse embryonic stem cells. RNA 15: 357-361.Yang D, Li T, Wang Y, Tang Y, et al. (2012). miR-132 regulates the differentiation of dopamine neurons by directly
targeting Nurr1 expression. J. Cell Sci. 125: 1673-1682.Yao MJ, Chen G, Zhao PP, Lu MH, et al. (2012). Transcriptome analysis of microRNAs in developing cerebral cortex of
rat. BMC Genomics 13: 232.Zhang Z, Chang H, Li Y, Zhang T, et al. (2010). MicroRNAs: potential regulators involved in human anencephaly. Int. J.
Biochem. Cell Biol. 42: 367-374.


![[Micro] pathogenesis](https://img.pdfslide.us/doc/110x75/55d6fc34bb61eb0d2b8b47a6/micro-pathogenesis-55d98896d0eb8.jpg)
