Embed Size (px)
Citation preview
GENETICS OF IMMUNITY
MicroRNA Regulation of Bovine MonocyteInflammatory and Metabolic Networksin an In Vivo Infection ModelNathan Lawless,*,† Timothy A. Reinhardt,‡ Kenneth Bryan,* Mike Baker,§ Bruce Pesch,‡
Duane Zimmerman,‡ Kurt Zuelke,** Tad Sonstegard,†† Cliona O’Farrelly,† John D. Lippolis,‡,1
and David J. Lynn*,1
*Animal and Bioscience Research Department, Animal and Grassland Research and Innovation Centre, Teagasc, Grange,Dunsany, County Meath, Ireland, †School of Biochemistry and Immunology, Trinity College, Dublin 2, Ireland, ‡UnitedStates Department of Agriculture, Agricultural Research Services, National Animal Disease Center, Ames, Iowa 50010,§Iowa State University, DNA Facility, Molecular Biology Building, Ames, Iowa 50010, **Australian Animal HealthLaboratory, Commonwealth Scientific and Industrial Research Organisation, East Geelong Victoria 3219, Australia,††United States Department of Agriculture, Agricultural Research Services, Beltsville, Maryland 20705-1350
ABSTRACT Bovine mastitis is an inflammation-driven disease of the bovine mammary gland that costs theglobal dairy industry several billion dollars per year. Because disease susceptibility is a multifactorial complexphenotype, an integrative biology approach is required to dissect the molecular networks involved. Here, wereport such an approach using next-generation sequencing combined with advanced network and pathwaybiology methods to simultaneously profile mRNA andmiRNA expression at multiple time points (0, 12, 24, 36 and48 hr) in milk and blood FACS-isolated CD14+ monocytes from animals infected in vivowith Streptococcus uberis.More than 3700 differentially expressed (DE) genes were identified in milk-isolated monocytes (MIMs), a keyimmune cell recruited to the site of infection during mastitis. Upregulated genes were significantly enriched forinflammatory pathways, whereas downregulated genes were enriched for nonglycolytic metabolic pathways.Monocyte transcriptional changes in the blood, however, were more subtle but highlighted the impact of thisinfection systemically. Genes upregulated in blood-isolated monocytes (BIMs) showed a significant associationwith interferon and chemokine signaling. Furthermore, 26 miRNAs were DE in MIMs and three were DE in BIMs.Pathway analysis revealed that predicted targets of downregulated miRNAs were highly enriched for roles ininnate immunity (FDR, 3.4E28), particularly TLR signaling, whereas upregulated miRNAs preferentially targetedgenes involved in metabolism. We conclude that during S. uberis infection miRNAs are key amplifiers of mono-cyte inflammatory response networks and repressors of several metabolic pathways.
KEYWORDS
infectioninnate immunityRNAseqmicroRNAtranscriptionalnetworks
complex geneticstolerancecompleximmunity
resistance
Bovine mastitis is an inflammation-driven disease of the bovine mam-mary gland that is associated with significant costs to the global dairyindustry. In Europe this cost is estimated to be approximately €2billion euro per year (Wells et al. 1998), with similar figures availablein theUnited States (Jones and Bailey 2009). Causative agents ofmastitisinfection include, but are not limited to, coliforms (Escherichia coli),Streptococci (Streptococcus uberis) and Staphylococci (Staphylococcusaureus). S. uberis is now ranked among the most prevalent mastitis-causing pathogens throughout Europe and North America (Reinosoet al. 2011; Ward et al. 2009).
Mastitis develops as bacteria entering the udder via the teat canalstimulate a pathological form of inflammation. Bacteria encounterepithelial cells lining themammaryglandstimulatinga local inflammatory
Copyright © 2014 Lawless et al.doi: 10.1534/g3.113.009936Manuscript received December 12, 2013; accepted for publication January 20,2014; published Early Online January 23, 2014.This is an open-access article distributed under the terms of the CreativeCommons Attribution Unported License (http://creativecommons.org/licenses/by/3.0/), which permits unrestricted use, distribution, and reproduction in anymedium, provided the original work is properly cited.Supporting information is available online at http://www.g3journal.org/lookup/suppl/doi:10.1534/g3.113.009936/-/DC11Corresponding authors: Animal and Bioscience Research Department, Animal andGrassland Research and Innovation Centre, Teagasc, Grange, Dunsany, Co.Meath, Ireland. E-mail: [email protected]; and United States Department ofAgriculture, Agricultural Research Services, National Animal Disease Center, Ames,IA 50010. E-mail: [email protected]
Volume 4 | June 2014 | 957
response that facilitates their transport across the epithelial barrier,where they are detected by resident immune cells, such as monocytes.Both cell types constitutively express surface pathogen recognitionmolecules such as Toll-like receptors (TLRs), enabling them tofunction in a sentinel capacity. Invasive S. uberis triggers TLR2 andTLR4 mobilizing local and systemic inflammatory mediators(Bannerman et al. 2004; Moyes et al. 2009). Typically, chemokines,interleukins (ILs), and tumor necrosis factor (TNF)-a initiate localphysiological changes in vascular permeability, cell differentiation,and apoptosis. Concurrently, systemic innate immune changesprovoke acute phase protein (APP) production, which is distributedsystemically to suppress the spread of bacteria locally (Mitterhuemeret al. 2010). During this phase, immune cells are recruited to the pointof infection (Rinaldi et al. 2010).Monocytes are released from the bonemarrow into the circulatory system and eventually reach themammary gland via chemokine ligand–mediated cell migration.There they differentiate into macrophage and dendritic cell popula-tions (Dong et al. 2013; Shi and Pamer 2011). Neutrophils comprisethe majority of immune cells in an infected gland during an infection.Neutrophils are tasked with directly clearing invasive bacteria viaphagocytosis or neutrophil extracellular traps (NETS) and subse-quently aid in resolution of inflammation (Lippolis et al. 2006;Reinhardt et al. 2013). Once recruited to the site of infection, mono-cytes and neutrophils orchestrate antimicrobial activity to controlbacterial spread and resolve the infection (Dong et al. 2013; Serbinaet al. 2008). Immune cells and other somatic cells can be detected in themilk of infected animals, and the counts of the number of such somaticcells per ml, called the somatic cell count, is an indicator of mastitis(Jones and Bailey 2009).
The local immune response in mammary tissues has beenexamined by several approaches both in vivo and in vitro. Candidategene-based approaches and microarray technology have determinedthat more than 2000 genes spanning immunity, metabolism, andtissue remodeling are active during mastitis (Mitterhuemer et al.2010; Moyes et al. 2009; Swanson et al. 2009). However, modest dataare available examining transcriptional activity in either milk or bloodmonocytes from infected animals (Prgomet et al. 2005), and little isknown regarding the role microRNAs (miRNAs) play in regulatingthese responses.
The miRNAs are small, noncoding RNAs that play a key role inthe regulation of innate and adaptive immunity as posttranscriptionalregulators of gene expression (O’Connell et al. 2010). They have beenshown to regulate immune function in several cell types. Neutrophilsenescence, for example, is regulated by a discrete miRNA repertoire(Ward et al. 2011). Naïve mouse B cells are indirectly regulated bymiR-155 via histone deacetylase 4 repression, whereas naive CD4+ T-cell differentiation and function are regulated by global changes inmiRNAs (Bronevetsky et al. 2013; Sandhu et al. 2012). In a recentstudy, we concluded that miRNAs likely play a key role in regulatingthe innate immune response in mammary epithelial cells to a bovinemastitis pathogen in vitro (Lawless et al. 2013).
Although miRNA expression is abundant in numerous bovinetissues, genome-wide studies elucidating the regulatory roles ofmiRNAs in bovine immunity are limited (Coutinho et al. 2007; Jinet al. 2009; Xu et al. 2009). Furthermore, no bovine studies to datehave applied next-generation sequencing (NGS) to examine globalmiRNA expression in immunity and infection in vivo. In this study,we report a NGS approach to profile the expression of bovinemiRNAs and mRNAs at multiple time points in milk and bloodCD14+ monocyte cells isolated from Holstein Friesians infectedin vivo with S. uberis, a causative agent of bovine mastitis.
MATERIALS AND METHODS
AnimalsTen female Holstein Friesians in the middle of their first lactationperiod, aged between 26 and 30 months and between 3 and 5 monthspostpartum, were selected for this study. The trial was conducted atthe USDA National Animal Disease Center (NADC) in Ames, Iowa.All animals had a medical history that was free from mastitis. TheNational Animal Disease Center’s Animal Care and Use Committeeapproved all procedures used in this study.
Infection protocolFive animals were infected via the teat canal of the right front quarterwith approximately 500 colony-forming units (CFU) of a mastitis-causing pathogen, S. uberis 0140, in 10 ml saline. Five control animalswere inoculated with saline only. Milk and blood samples wereobtained from each animal at 0, 12, 24, 36, and 48 hr after infection(or mock infection) as described below. At each time point, rectaltemperature, total volume of milk, somatic cell count, bacterial counts,ambient temperature, humidity, and additional observations wererecorded for each animal. Bacterial counts were determined from5-ml milk samples collected aseptically from the infected quarter. Milkwas serially diluted in sterile phosphate-buffered saline and spread onblood agar plates and then incubated for 24 hr at 37�. After incuba-tion, plates were examined for bacterial growth and CFUs per ml weredetermined.
Cell extraction from milkMilk was collected using a sterilized quarter milker from infected andcontrol animals at each time point. The total volume of milk wasnoted; 5 ml milk was isolated for milk bacteriology. The remainingmilk was then diluted into Hanks’ Balanced Salt Solution (HBSS)without Phenol red, Mg, and Ca... plus 10 mM EDTA. The mixturewas inverted several times, transferred to a 1-liter centrifuge bottle,and centrifuged in a fixed angle rotor at 10,000 · g for 30 min. Aftercentrifugation, the supernatant was poured off and the pellets wereresuspended in 150 ml HBSS plus 5 mM EDTA. The resuspendedpellets were then transferred to fresh centrifuge tubes and spun at2500 · g for 30 min. After the second spin, the supernatant waspoured off and the pellet from each sample was resuspended in 20ml RPMI 1640 plus 1 mM sodium pyruvate plus 2 mM L-glutamineplus 50 ug/ml gentamycin plus 10% FBS (cRPMI) (Sigma-Aldrich,Steinheim, Germany). The 20-ml cell suspension was divided into2 · 10 ml aliquots in 15 ml conical centrifuge tubes. The cells werepelleted by centrifuge at 650 · g. After this spin, the pellets werepooled into 4 ml cRPMI and were labeled for cell sorting. The cellswere counted by trypsin blue exclusion (Careforde, Chicago, IL) todetermine the cell count.
Cell extraction from bloodAt each time point, animals were led into a crush, and 2·60 mlsyringes of blood were extracted by venipuncture and immediatelyplaced on ice. The total volume of blood and total number of cellsin blood were determined using a hemocytometer. Blood was spun for20 min at 1200 · g. The buffy coat was observed between serum andred blood cell phase and was removed. Contaminating red blood cellswere lysed by adding 1 volume lysis solution (10.6 mM Na2HPO4 and2.7 mM NaH2PO4) and inverting the tubes several times, immediatelyfollowed by adding half volume restore solution (10.6 mM Na2HPO4,2.7 mM NaH2PO4, and 460 mM NaCl) and inverting the tubes. Thebuffy coat was then spun for 10 min at 650 · g, and the red
958 | N. Lawless et al.
supernatant was poured off. Cells were resuspended in red blood celllysis solution and then restore solution again as described above. Cellwere spun for another 5 min at 650 · g and resuspended in 5–10 mlmedia.
Isolation of CD14+ monocytes by flow cytometryMilk-derived and blood-derived CD14+ monocytes were isolated byfluorescence-activated cell sorting (FACS). Briefly, cells were labeledwithmonoclonal anti-bovineCD14 (CloneCAM36A;VMRD, Pullman,WA) and a PE-conjugated anti-mouse IgG1 antibody (SouthernBiotechnology, Birmingham, AL). Labeled cells were separated basedon fluorescence intensity using the BD FACS Aria Cell Sorting System(BD Biosciences, San Jose, CA). Cells with more than 95% purity wereisolated from the milk and peripheral blood of each animal.
mRNA extractionThe mirVana RNA Isolation Kit (Ambion, Austin, TX) was used toextract total RNA from FACS-isolated cell populations. Procedureswere performed according to the manufacturer’s protocol (SupportingInformation, File S1). RNA was quantified and integrity was con-firmed using an Agilent RNA Kit on a 2100 Bioanalyzer platform(Agilent Technologies, Loveland, CO) (File S1).
miRNA extractionMicroRNA was extracted using mirPremier microRNA Isolation Kits(Sigma-Aldrich, Steinheim, Germany). Procedures were performedaccording to the manufacturer’s protocol (File S1). Small RNA wasquantified using an Agilent small RNA Kit on a 2100 Bioanalyzerplatform (File S1).
mRNA library generationOne hundred indexed mRNA libraries (50 blood monocyte librariesand 50 milk monocyte libraries) were prepared for cluster generationusing TruSeq v2 RNA sample preparation kits (Illumina, San Diego,CA). Procedures were performed according to the manufacturer’sprotocol (File S1). The finished libraries were validated on an AgilentBioanalyzer 2100 using an Agilent DNA-1000 chip (Agilent, Loveland,CO), at which point they were loaded for cluster generation. Thesamples were sequenced on an Illumina HiSequation 2000 at the IowaState Sequencing Center (50-bp single-end). Infected and control sam-ples (n = 100) were randomized across four flow cells (i.e., three orfour samples multiplexed per lane) to avoid confounding flow cell/lane effects (Auer and Doerge 2010). The barcode compatibility chartprovided with the TruSeq RNA sample preparation kit was adhered towhen pooling libraries. Fastq files were produced using the CASAVA1.8 pipeline.
mRNAseq analysisOne hundred fastq files were generated containing the sequencingdata for each of the 100 mRNAseq libraries. The quality and numberof the reads for each sample were then assessed using FASTQCv0.10.0 (http://www.bioinformatics.bbsrc.ac.uk/projects/fastqc/). Eachsample was then put through a number of quality-control filters. First,reads were filtered using the fastq Illumina filter v0.1 (http://cancan.cshl.edu/labmembers/gordon/fastq_illumina_filter/), which removesreads from the fastq files that were flagged as not passing the IlluminaCASAVA pipeline filters. Cutadapt v1.2 (http://code.google.com/p/cutadapt/) was used to trim the adaptors from reads when necessary.The remaining reads were then further filtered using the fastq qual-ity filter package (http://hannonlab.cshl.edu/fastx_toolkit/) v0.0.13.2.
When at least 70% of the bases had a Phred score ,20, reads wereremoved. Reads passing all the aforementioned filters were alsotrimmed at their ends to remove low-quality bases (Phred score,20). Reads that were ,20 nt after trimming were discarded. Readsthat passed all quality-control steps were then aligned to the bovinegenome (UMD3.1 assembly) (Zimin et al. 2009) using TopHat v2.0.8(Trapnell et al. 2009), allowing one mismatch. Reads that did notuniquely align to the genome were discarded. HTSeq-count version0.5.3p3 (http://wwwhuber.embl.de/users/anders/HTSeq/doc/overview.html) using the union model was used to assign uniquely alignedreads to Ensembl (v69) annotated bovine genes.
Differential gene expression analysisData were normalized across libraries using the trimmed mean of M-values (TMM) normalization method (Bullard et al. 2010). The R(version 2.15.2) Bioconductor package EdgeR (v2.4.6) (Robinsonet al. 2010), which uses a negative binomial distribution model toaccount for both biological and technical variability, was applied toidentify statistically significant differentially expressed (DE) genes.Any samples that had less than five million uniquely aligning readswere removed from further analysis. Only genes that had at least onecount per million in at least three samples were analyzed for evidenceof differential gene expression. The analysis was undertaken usingmoderated tagwise dispersions. DE genes were defined as having a foldchange in gene expression .1.5 and a Benjamini and Hochberg cor-rected FDR of ,0.05 (Benjamini and Hochberg 1995).
Hierarchical clusteringHierarchical clustering of milk and blood mRNA normalized readcounts were performed in the R (version 2.15.2) hclust package. Heat-maps were generated using the R heatmap package.
Gene ontology and pathway analysisThe R (version 2.15.2) Bioconductor package GOseq (version 1.10.0),which corrects for gene length bias (Young et al. 2010), was used toidentify overrepresented pathways using pathway annotation importedfrom theKyotoEncyclopedia ofGenes andGenomes (KEGG) (Kanehisaet al. 2007) database. KEGGdisease pathways were excluded to focus theanalysis on primary signaling pathways. Pathways were consideredsignificantly overrepresented with an FDR ,0.05. Pathway analysiswas undertaken using Ensembl predicted human 1:1 orthologs of thebovine DE genes.
Additionally, we manually generated two pathway annotationsthat were of interest but not annotated in detail in KEGG: the “inflam-masome” and “interferon” pathways. Gene IDs for these pathwayswere sourced from SA Biosciences (Qiagen) RT2 Profiler PCR ArrayHuman Interferon and Receptors (PAHS-064A) and RT2 ProfilerPCR Array Human Inflammasome (PAHS-097A) annotations. Theinterferon pathway consisted of 84 genes (Table S1) with expressioncontrolled by or involved in cell signaling mediated by interferonligands and receptors, whereas the inflammasome pathway consistedof 95 key genes (Table S1) involved in the function of inflammasomes,protein complexes involved in innate immunity, and general NOD-like receptor (NLR) signaling.
Network analysis methodsTo generate molecular interaction networks, the human 1:1 orthologsof bovine genes that were DE during at least one of the four timepoints in milk-isolated monocytes (MIMs) from S. uberis–infectedanimals were uploaded to InnateDB (www.innatedb.com) (Lynn
Volume 4 June 2014 | mRNA and miRNA Expression in Bovine Monocytes | 959
et al. 2008). InnateDB is one of the most comprehensive databases ofall human and mouse experimentally supported molecular interac-tions (.300,000 interactions in July 2013) but also specificallyincludes annotation on more than 19,000 manually curated humanand mouse innate immunity relevant interactions, many of which arenot present in any other database (Lynn et al. 2010). Networks werevisualized using Cytoscape 2.8.2 (Shannon et al. 2003).
The network was analyzed using the cytoHubba plugin (Lin et al.2008) for Cytoscape 2.8.2 (Shannon et al. 2003) to identify networkhubs and bottlenecks using default parameters. The jActiveModulesplugin (Ideker et al. 2002) in Cytoscape 2.8.2 (Shannon et al. 2003)was also used to identify high-scoring DE subnetworks (overlapthreshold = 0.3; search depth = 3; number of modules = 5; “regionalscoring” and “adjust score for size” were both enabled). The InnateDBpathway analysis tool was used to identify overrepresented pathwaysamong module genes.
miRNA library generationOne hundred indexed miRNA libraries (50 blood and 50 milkmonocyte libraries) were also prepared for cluster generation andsequencing using the TruSeq Small RNA sample preparation kit.These miRNA libraries were prepared from the same samples that themRNAseq libraries were prepared. Procedures were performedaccording to the manufacturer’s protocol (File S1). The finished li-braries were validated on an Agilent Bioanalyzer 2100 using an AgilentDNA high-sensitivity chip (Agilent), at which point they were loadedfor cluster generation. The samples were sequenced on an IlluminaHiSequation 2000 (50-bp single-end). Infected and control samples(n =100) were randomized across three flow cells (i.e., seven or eightsamples multiplexed per lane) to avoid confounding flow cell/lane effects(Auer and Doerge 2010). Fastq files were produced using the CASAVA1.8 pipeline. In a few cases, the sequenced miRNA libraries were foundto be adaptor-contaminated. These libraries were repurified and rese-quenced. The list of resequenced samples can be found in Table S2.
miRNAseq AnalysisPreliminary quality-control analysis of the 100 miRNAseq fastq fileswas again performed with FASTQC software v0.10.0 (http://www.bioinformatics.babraham.ac.uk/projects/fastqc/). Cutadapt v1.2(code.google.com/p/cutadapt/) was then used to trim 39 adaptorsequences. Reads that were shorter than 18 nucleotides after trim-ming were discarded. Trimmed reads were then further filtered usingthe fastq quality filter (http://hannonlab.cshl.edu/fastx_toolkit/)v0.0.13.2. Reads with at least 70% of the bases with a Phred score,20 were removed (Cock et al. 2010). Finally, reads passing all thesefilters were also trimmed at their ends to remove low-quality bases(Phred score ,20). Reads that successfully passed filtering werealigned to the bovine genome (UMD3.1) using novoalign v2.08.03in miRNA mode (http://www.novocraft.com) allowing one mismatch.Nonuniquely aligning reads were discarded. HTSeq version 0.5.3p3(http://www-huber.embl.de/users/anders/HTSeq/doc/overview.html)using the union model was used to assign uniquely aligned reads tomiRBase v19 miRNA annotation (Kozomara and Griffiths-Jones2011). The sequencing data from this publication have been sub-mitted to the NCBI GEO database and assigned the identifier(GSE51858).
Differential miRNA expression analysisBefore assessing differential expression, miRNAseq count data werefirst normalized across libraries using either the trimmed mean of
M-values (TMM) normalization method (Robinson et al. 2010) or theupper-quantile normalization (Bullard et al. 2010). Differential expres-sion analysis of miRNAseq data has been shown to be sensitive to thenormalization approach implemented (Garmire and Subramaniam2012). To address this issue, we identified DE miRNAs in two alter-natively normalized datasets: TMM-normalized (Robinson et al.2010), upper-quantile normalized, and with no normalization. OnlymiRNAs that were identified as DE across all three datasets wereconsidered further, i.e., the differential expression of these miRNAswas robust to the normalization procedure (Lawless et al. 2013). Anysamples that had less than two million uniquely aligning reads wereremoved from further analysis. The R (version 2.15.2) Bioconductorpackage EdgeR (v2.4.6) (Robinson et al. 2010) was applied to identifystatistically significant DE miRNAs. The analysis was undertaken us-ing moderated tagwise dispersions. DE miRNAs were defined as hav-ing a Benjamini and Hochberg corrected P value of, 0.05 (Benjaminiand Hochberg 1995).
Coexpression and target analysis of miRNA andmRNA dataTo identify mRNAs that were potentially regulated by DE miRNAs inMIMs, we first sought to calculate Pearson correlations using theApache commons Java statistics library between all DE miRNAexpression in reads per million (rpm) and all mRNA expression(TMM normalized read counts) over the time course. A correlationmatrix was constructed consisting of 26 (DE miRNAs) · 24,616 (allmRNAs) correlation coefficients. The resulting correlation matrix wasthen filtered to remove nonsignificant correlations (critical value forPearson correlation for this matrix is r = 20.3116) and those inversecorrelations that were not supported by miRanda-predicted miRNA-target pairs (miRanda v3.3a). The mRNAs predicted to be targeted(i.e., had a significant anticorrelation relationship in the expression ofthe mRNA and the miRNA, plus a predicted seed target) by eitherupregulated or downregulated miRNAs were then selected for path-way analysis. Two-dimensional cluster analysis and visualization, us-ing R version 2.15.3 hclust and heatmap.plus packages, were thenapplied to the filtered correlation matrix.
Pathway analysis of predicted miRNA target genesTarget genes of DE miRNAs were submitted to InnateDB (Lynn et al.2008) for pathway analysis. Genes were submitted in two groups,those that were targets of upregulated miRNAs and those that weretargets of downregulated miRNAs. Significant pathways were calcu-lated based on hypergeometric analysis; pathways of interest weredefined as having a Benjamini and Hochberg corrected P valueof , 0.05 (Benjamini and Hochberg 1995).
Novel miRNA discoveryUsing the software package miRDeep2 v0.0.5 (Mackowiak 2011), weexamined whether milk/blood monocytes encoded for miRNAs notyet annotated in the bovine genome. We further parsed these datausing a number of different parameters to identify those novelmiRNAs that have the highest likelihood of being true positives asdescribed previously (Lawless et al. 2013). Specifically, we identifiedthose predictions when the mature and star stands were expressedwith a minimum of five reads each; when miRDeep2 predicted thatthe miRNA had .90% probability of being a true positive; when thehairpin structure had a significant Randfold P value; and when thenovel miRNA was independently predicted in two or more differentmiRNAseq samples.
960 | N. Lawless et al.
RESULTS
Kinetics of S. uberis infection in vivo
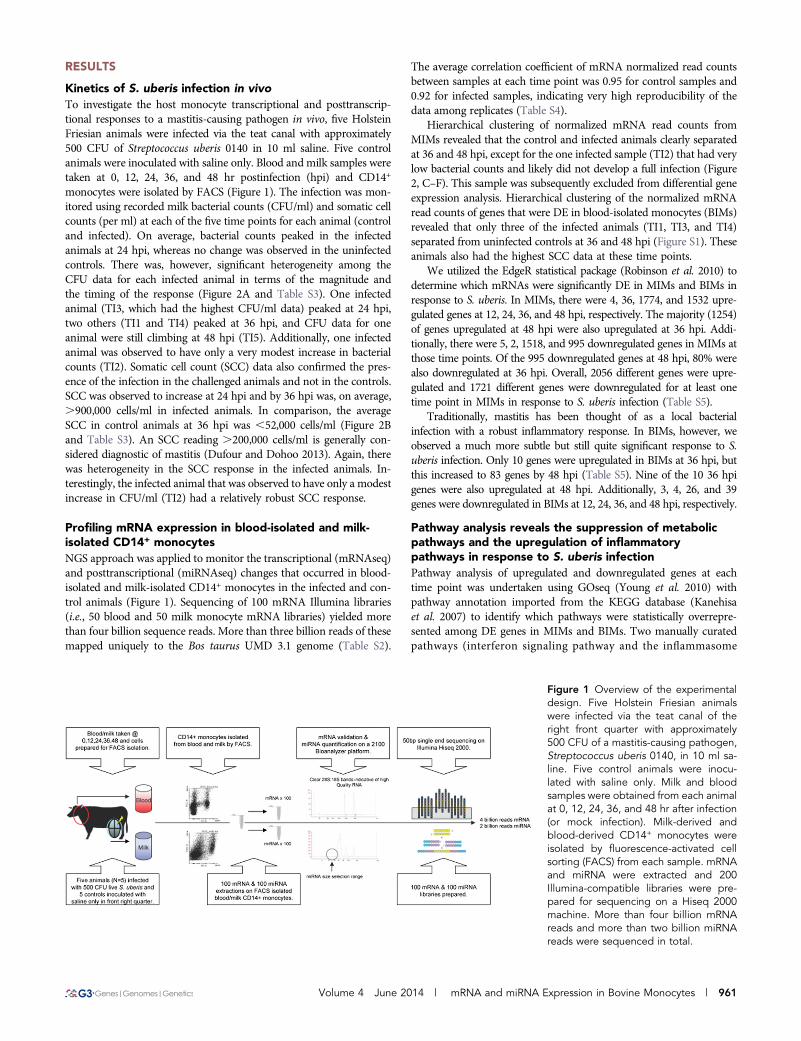
To investigate the host monocyte transcriptional and posttranscrip-tional responses to a mastitis-causing pathogen in vivo, five HolsteinFriesian animals were infected via the teat canal with approximately500 CFU of Streptococcus uberis 0140 in 10 ml saline. Five controlanimals were inoculated with saline only. Blood and milk samples weretaken at 0, 12, 24, 36, and 48 hr postinfection (hpi) and CD14+
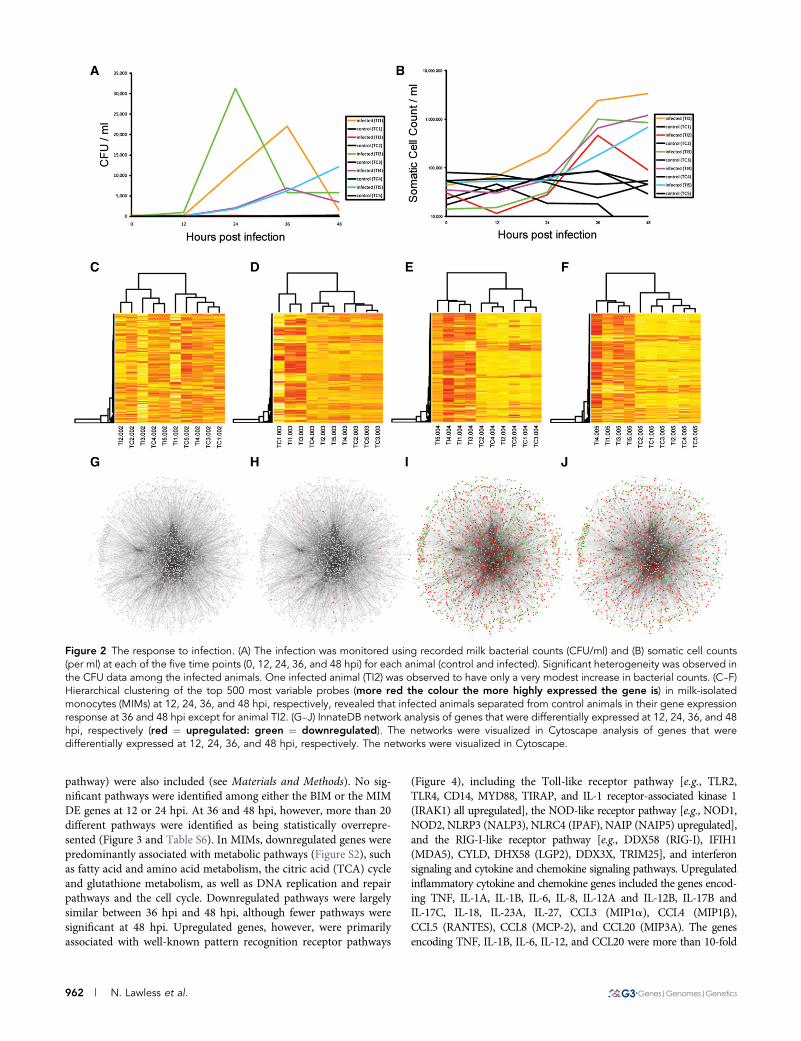
monocytes were isolated by FACS (Figure 1). The infection was mon-itored using recorded milk bacterial counts (CFU/ml) and somatic cellcounts (per ml) at each of the five time points for each animal (controland infected). On average, bacterial counts peaked in the infectedanimals at 24 hpi, whereas no change was observed in the uninfectedcontrols. There was, however, significant heterogeneity among theCFU data for each infected animal in terms of the magnitude andthe timing of the response (Figure 2A and Table S3). One infectedanimal (TI3, which had the highest CFU/ml data) peaked at 24 hpi,two others (TI1 and TI4) peaked at 36 hpi, and CFU data for oneanimal were still climbing at 48 hpi (TI5). Additionally, one infectedanimal was observed to have only a very modest increase in bacterialcounts (TI2). Somatic cell count (SCC) data also confirmed the pres-ence of the infection in the challenged animals and not in the controls.SCC was observed to increase at 24 hpi and by 36 hpi was, on average,.900,000 cells/ml in infected animals. In comparison, the averageSCC in control animals at 36 hpi was ,52,000 cells/ml (Figure 2Band Table S3). An SCC reading .200,000 cells/ml is generally con-sidered diagnostic of mastitis (Dufour and Dohoo 2013). Again, therewas heterogeneity in the SCC response in the infected animals. In-terestingly, the infected animal that was observed to have only a modestincrease in CFU/ml (TI2) had a relatively robust SCC response.
Profiling mRNA expression in blood-isolated and milk-isolated CD14+ monocytesNGS approach was applied to monitor the transcriptional (mRNAseq)and posttranscriptional (miRNAseq) changes that occurred in blood-isolated and milk-isolated CD14+ monocytes in the infected and con-trol animals (Figure 1). Sequencing of 100 mRNA Illumina libraries(i.e., 50 blood and 50 milk monocyte mRNA libraries) yielded morethan four billion sequence reads. More than three billion reads of thesemapped uniquely to the Bos taurus UMD 3.1 genome (Table S2).
The average correlation coefficient of mRNA normalized read countsbetween samples at each time point was 0.95 for control samples and0.92 for infected samples, indicating very high reproducibility of thedata among replicates (Table S4).
Hierarchical clustering of normalized mRNA read counts fromMIMs revealed that the control and infected animals clearly separatedat 36 and 48 hpi, except for the one infected sample (TI2) that had verylow bacterial counts and likely did not develop a full infection (Figure2, C–F). This sample was subsequently excluded from differential geneexpression analysis. Hierarchical clustering of the normalized mRNAread counts of genes that were DE in blood-isolated monocytes (BIMs)revealed that only three of the infected animals (TI1, TI3, and TI4)separated from uninfected controls at 36 and 48 hpi (Figure S1). Theseanimals also had the highest SCC data at these time points.
We utilized the EdgeR statistical package (Robinson et al. 2010) todetermine which mRNAs were significantly DE in MIMs and BIMs inresponse to S. uberis. In MIMs, there were 4, 36, 1774, and 1532 upre-gulated genes at 12, 24, 36, and 48 hpi, respectively. The majority (1254)of genes upregulated at 48 hpi were also upregulated at 36 hpi. Addi-tionally, there were 5, 2, 1518, and 995 downregulated genes in MIMs atthose time points. Of the 995 downregulated genes at 48 hpi, 80% werealso downregulated at 36 hpi. Overall, 2056 different genes were upre-gulated and 1721 different genes were downregulated for at least onetime point in MIMs in response to S. uberis infection (Table S5).
Traditionally, mastitis has been thought of as a local bacterialinfection with a robust inflammatory response. In BIMs, however, weobserved a much more subtle but still quite significant response to S.uberis infection. Only 10 genes were upregulated in BIMs at 36 hpi, butthis increased to 83 genes by 48 hpi (Table S5). Nine of the 10 36 hpigenes were also upregulated at 48 hpi. Additionally, 3, 4, 26, and 39genes were downregulated in BIMs at 12, 24, 36, and 48 hpi, respectively.
Pathway analysis reveals the suppression of metabolicpathways and the upregulation of inflammatorypathways in response to S. uberis infectionPathway analysis of upregulated and downregulated genes at eachtime point was undertaken using GOseq (Young et al. 2010) withpathway annotation imported from the KEGG database (Kanehisaet al. 2007) to identify which pathways were statistically overrepre-sented among DE genes in MIMs and BIMs. Two manually curatedpathways (interferon signaling pathway and the inflammasome
Figure 1 Overview of the experimentaldesign. Five Holstein Friesian animalswere infected via the teat canal of theright front quarter with approximately500 CFU of a mastitis-causing pathogen,Streptococcus uberis 0140, in 10 ml sa-line. Five control animals were inocu-lated with saline only. Milk and bloodsamples were obtained from each animalat 0, 12, 24, 36, and 48 hr after infection(or mock infection). Milk-derived andblood-derived CD14+ monocytes wereisolated by fluorescence-activated cellsorting (FACS) from each sample. mRNAand miRNA were extracted and 200Illumina-compatible libraries were pre-pared for sequencing on a Hiseq 2000machine. More than four billion mRNAreads and more than two billion miRNAreads were sequenced in total.
Volume 4 June 2014 | mRNA and miRNA Expression in Bovine Monocytes | 961
pathway) were also included (see Materials and Methods). No sig-nificant pathways were identified among either the BIM or the MIMDE genes at 12 or 24 hpi. At 36 and 48 hpi, however, more than 20different pathways were identified as being statistically overrepre-sented (Figure 3 and Table S6). In MIMs, downregulated genes werepredominantly associated with metabolic pathways (Figure S2), suchas fatty acid and amino acid metabolism, the citric acid (TCA) cycleand glutathione metabolism, as well as DNA replication and repairpathways and the cell cycle. Downregulated pathways were largelysimilar between 36 hpi and 48 hpi, although fewer pathways weresignificant at 48 hpi. Upregulated genes, however, were primarilyassociated with well-known pattern recognition receptor pathways
(Figure 4), including the Toll-like receptor pathway [e.g., TLR2,TLR4, CD14, MYD88, TIRAP, and IL-1 receptor-associated kinase 1(IRAK1) all upregulated], the NOD-like receptor pathway [e.g., NOD1,NOD2, NLRP3 (NALP3), NLRC4 (IPAF), NAIP (NAIP5) upregulated],and the RIG-I-like receptor pathway [e.g., DDX58 (RIG-I), IFIH1(MDA5), CYLD, DHX58 (LGP2), DDX3X, TRIM25], and interferonsignaling and cytokine and chemokine signaling pathways. Upregulatedinflammatory cytokine and chemokine genes included the genes encod-ing TNF, IL-1A, IL-1B, IL-6, IL-8, IL-12A and IL-12B, IL-17B andIL-17C, IL-18, IL-23A, IL-27, CCL3 (MIP1a), CCL4 (MIP1b),CCL5 (RANTES), CCL8 (MCP-2), and CCL20 (MIP3A). The genesencoding TNF, IL-1B, IL-6, IL-12, and CCL20 were more than 10-fold
Figure 2 The response to infection. (A) The infection was monitored using recorded milk bacterial counts (CFU/ml) and (B) somatic cell counts(per ml) at each of the five time points (0, 12, 24, 36, and 48 hpi) for each animal (control and infected). Significant heterogeneity was observed inthe CFU data among the infected animals. One infected animal (TI2) was observed to have only a very modest increase in bacterial counts. (C–F)Hierarchical clustering of the top 500 most variable probes (more red the colour the more highly expressed the gene is) in milk-isolatedmonocytes (MIMs) at 12, 24, 36, and 48 hpi, respectively, revealed that infected animals separated from control animals in their gene expressionresponse at 36 and 48 hpi except for animal TI2. (G–J) InnateDB network analysis of genes that were differentially expressed at 12, 24, 36, and 48hpi, respectively (red ¼ upregulated: green ¼ downregulated). The networks were visualized in Cytoscape analysis of genes that weredifferentially expressed at 12, 24, 36, and 48 hpi, respectively. The networks were visualized in Cytoscape.
962 | N. Lawless et al.
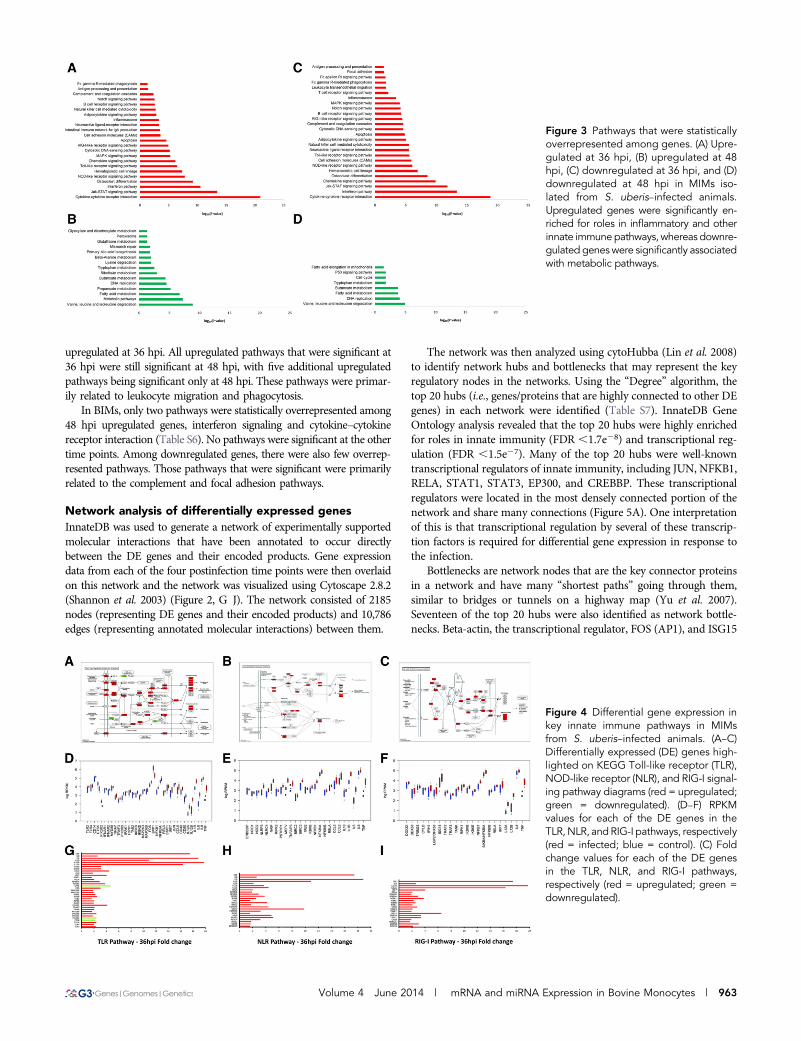
upregulated at 36 hpi. All upregulated pathways that were significant at36 hpi were still significant at 48 hpi, with five additional upregulatedpathways being significant only at 48 hpi. These pathways were primar-ily related to leukocyte migration and phagocytosis.
In BIMs, only two pathways were statistically overrepresented among48 hpi upregulated genes, interferon signaling and cytokine–cytokinereceptor interaction (Table S6). No pathways were significant at the othertime points. Among downregulated genes, there were also few overrep-resented pathways. Those pathways that were significant were primarilyrelated to the complement and focal adhesion pathways.
Network analysis of differentially expressed genesInnateDB was used to generate a network of experimentally supportedmolecular interactions that have been annotated to occur directlybetween the DE genes and their encoded products. Gene expressiondata from each of the four postinfection time points were then overlaidon this network and the network was visualized using Cytoscape 2.8.2(Shannon et al. 2003) (Figure 2, G J). The network consisted of 2185nodes (representing DE genes and their encoded products) and 10,786edges (representing annotated molecular interactions) between them.
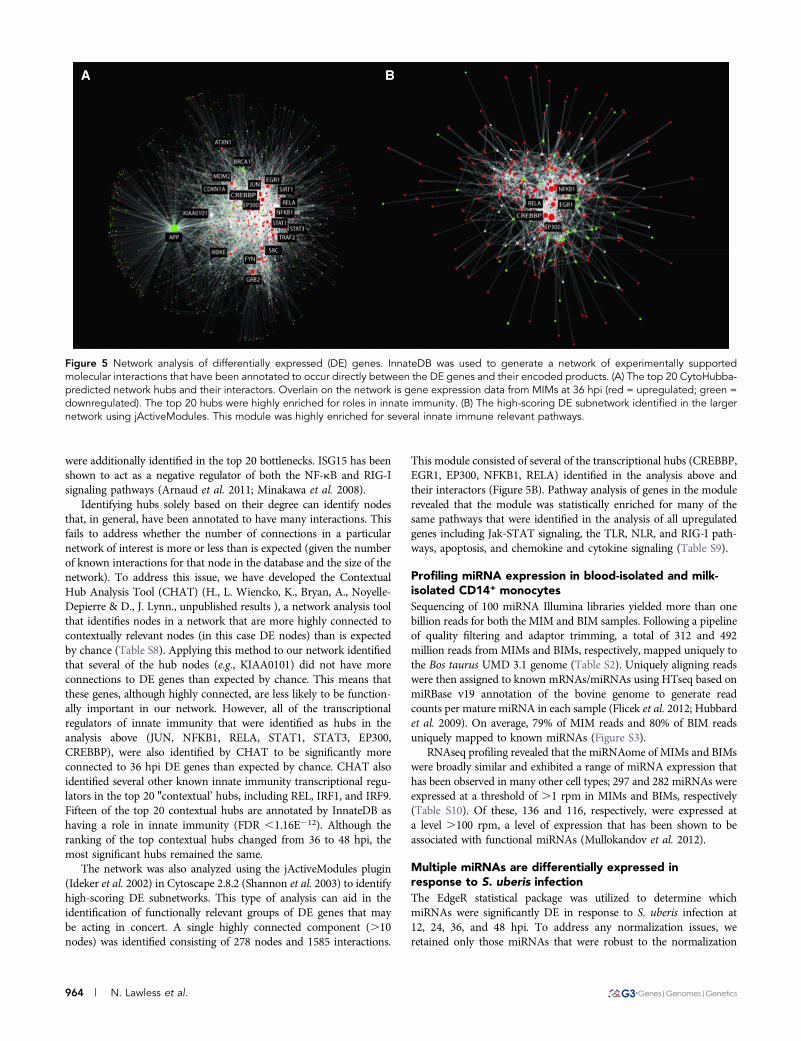
The network was then analyzed using cytoHubba (Lin et al. 2008)to identify network hubs and bottlenecks that may represent the keyregulatory nodes in the networks. Using the “Degree” algorithm, thetop 20 hubs (i.e., genes/proteins that are highly connected to other DEgenes) in each network were identified (Table S7). InnateDB GeneOntology analysis revealed that the top 20 hubs were highly enrichedfor roles in innate immunity (FDR ,1.7e28) and transcriptional reg-ulation (FDR ,1.5e27). Many of the top 20 hubs were well-knowntranscriptional regulators of innate immunity, including JUN, NFKB1,RELA, STAT1, STAT3, EP300, and CREBBP. These transcriptionalregulators were located in the most densely connected portion of thenetwork and share many connections (Figure 5A). One interpretationof this is that transcriptional regulation by several of these transcrip-tion factors is required for differential gene expression in response tothe infection.
Bottlenecks are network nodes that are the key connector proteinsin a network and have many “shortest paths” going through them,similar to bridges or tunnels on a highway map (Yu et al. 2007).Seventeen of the top 20 hubs were also identified as network bottle-necks. Beta-actin, the transcriptional regulator, FOS (AP1), and ISG15
Figure 3 Pathways that were statisticallyoverrepresented among genes. (A) Upre-gulated at 36 hpi, (B) upregulated at 48hpi, (C) downregulated at 36 hpi, and (D)downregulated at 48 hpi in MIMs iso-lated from S. uberis–infected animals.Upregulated genes were significantly en-riched for roles in inflammatory and otherinnate immunepathways, whereas downre-gulated genes were significantly associatedwith metabolic pathways.
Figure 4 Differential gene expression inkey innate immune pathways in MIMsfrom S. uberis–infected animals. (A–C)Differentially expressed (DE) genes high-lighted on KEGG Toll-like receptor (TLR),NOD-like receptor (NLR), and RIG-I signal-ing pathway diagrams (red = upregulated;green = downregulated). (D–F) RPKMvalues for each of the DE genes in theTLR, NLR, and RIG-I pathways, respectively(red = infected; blue = control). (C) Foldchange values for each of the DE genesin the TLR, NLR, and RIG-I pathways,respectively (red = upregulated; green =downregulated).
Volume 4 June 2014 | mRNA and miRNA Expression in Bovine Monocytes | 963
were additionally identified in the top 20 bottlenecks. ISG15 has beenshown to act as a negative regulator of both the NF-kB and RIG-Isignaling pathways (Arnaud et al. 2011; Minakawa et al. 2008).
Identifying hubs solely based on their degree can identify nodesthat, in general, have been annotated to have many interactions. Thisfails to address whether the number of connections in a particularnetwork of interest is more or less than is expected (given the numberof known interactions for that node in the database and the size of thenetwork). To address this issue, we have developed the ContextualHub Analysis Tool (CHAT) (H., L. Wiencko, K., Bryan, A., Noyelle-Depierre & D., J. Lynn., unpublished results ), a network analysis toolthat identifies nodes in a network that are more highly connected tocontextually relevant nodes (in this case DE nodes) than is expectedby chance (Table S8). Applying this method to our network identifiedthat several of the hub nodes (e.g., KIAA0101) did not have moreconnections to DE genes than expected by chance. This means thatthese genes, although highly connected, are less likely to be function-ally important in our network. However, all of the transcriptionalregulators of innate immunity that were identified as hubs in theanalysis above (JUN, NFKB1, RELA, STAT1, STAT3, EP300,CREBBP), were also identified by CHAT to be significantly moreconnected to 36 hpi DE genes than expected by chance. CHAT alsoidentified several other known innate immunity transcriptional regu-lators in the top 20 "contextual’ hubs, including REL, IRF1, and IRF9.Fifteen of the top 20 contextual hubs are annotated by InnateDB ashaving a role in innate immunity (FDR ,1.16E212). Although theranking of the top contextual hubs changed from 36 to 48 hpi, themost significant hubs remained the same.
The network was also analyzed using the jActiveModules plugin(Ideker et al. 2002) in Cytoscape 2.8.2 (Shannon et al. 2003) to identifyhigh-scoring DE subnetworks. This type of analysis can aid in theidentification of functionally relevant groups of DE genes that maybe acting in concert. A single highly connected component (.10nodes) was identified consisting of 278 nodes and 1585 interactions.
This module consisted of several of the transcriptional hubs (CREBBP,EGR1, EP300, NFKB1, RELA) identified in the analysis above andtheir interactors (Figure 5B). Pathway analysis of genes in the modulerevealed that the module was statistically enriched for many of thesame pathways that were identified in the analysis of all upregulatedgenes including Jak-STAT signaling, the TLR, NLR, and RIG-I path-ways, apoptosis, and chemokine and cytokine signaling (Table S9).
Profiling miRNA expression in blood-isolated and milk-isolated CD14+ monocytesSequencing of 100 miRNA Illumina libraries yielded more than onebillion reads for both the MIM and BIM samples. Following a pipelineof quality filtering and adaptor trimming, a total of 312 and 492million reads from MIMs and BIMs, respectively, mapped uniquely tothe Bos taurus UMD 3.1 genome (Table S2). Uniquely aligning readswere then assigned to known mRNAs/miRNAs using HTseq based onmiRBase v19 annotation of the bovine genome to generate readcounts per mature miRNA in each sample (Flicek et al. 2012; Hubbardet al. 2009). On average, 79% of MIM reads and 80% of BIM readsuniquely mapped to known miRNAs (Figure S3).
RNAseq profiling revealed that the miRNAome of MIMs and BIMswere broadly similar and exhibited a range of miRNA expression thathas been observed in many other cell types; 297 and 282 miRNAs wereexpressed at a threshold of .1 rpm in MIMs and BIMs, respectively(Table S10). Of these, 136 and 116, respectively, were expressed ata level .100 rpm, a level of expression that has been shown to beassociated with functional miRNAs (Mullokandov et al. 2012).
Multiple miRNAs are differentially expressed inresponse to S. uberis infectionThe EdgeR statistical package was utilized to determine whichmiRNAs were significantly DE in response to S. uberis infection at12, 24, 36, and 48 hpi. To address any normalization issues, weretained only those miRNAs that were robust to the normalization
Figure 5 Network analysis of differentially expressed (DE) genes. InnateDB was used to generate a network of experimentally supportedmolecular interactions that have been annotated to occur directly between the DE genes and their encoded products. (A) The top 20 CytoHubba-predicted network hubs and their interactors. Overlain on the network is gene expression data from MIMs at 36 hpi (red = upregulated; green =downregulated). The top 20 hubs were highly enriched for roles in innate immunity. (B) The high-scoring DE subnetwork identified in the largernetwork using jActiveModules. This module was highly enriched for several innate immune relevant pathways.
964 | N. Lawless et al.
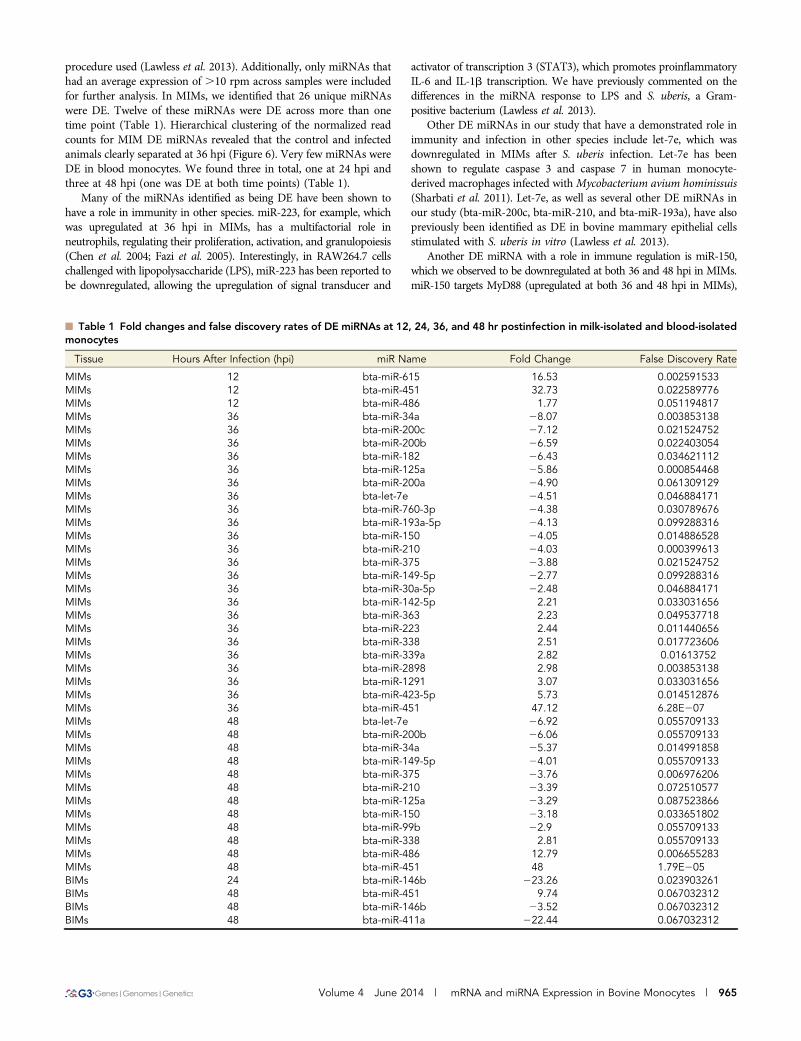
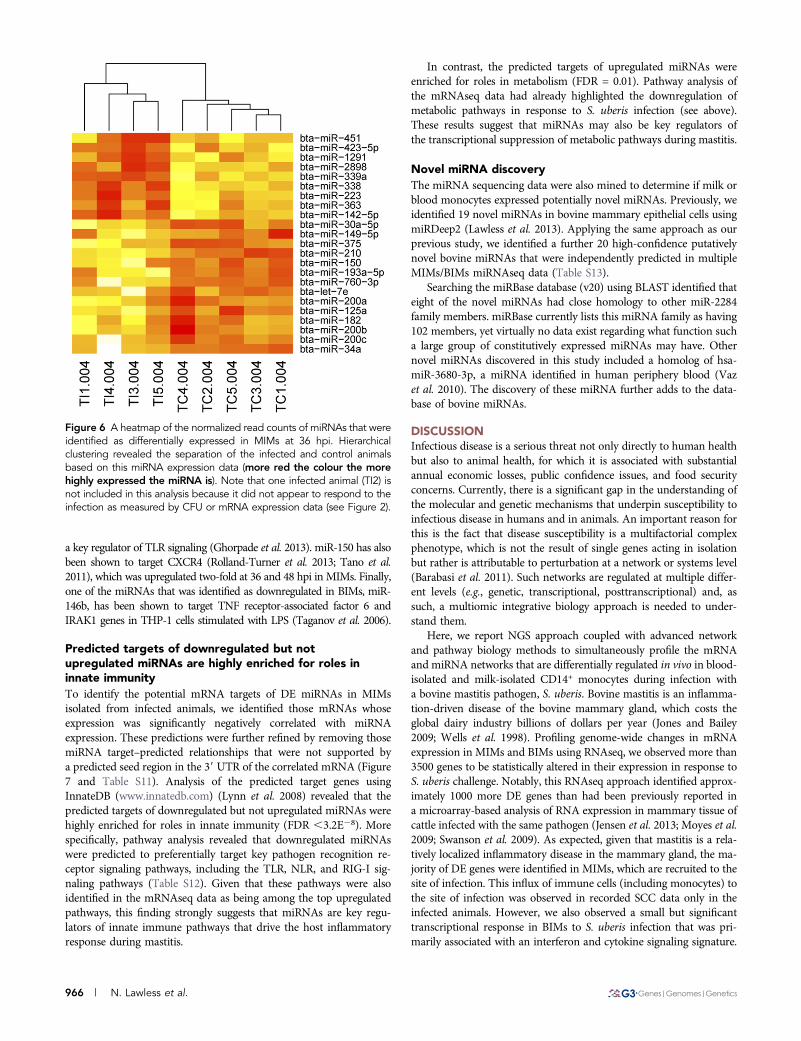
procedure used (Lawless et al. 2013). Additionally, only miRNAs thathad an average expression of .10 rpm across samples were includedfor further analysis. In MIMs, we identified that 26 unique miRNAswere DE. Twelve of these miRNAs were DE across more than onetime point (Table 1). Hierarchical clustering of the normalized readcounts for MIM DE miRNAs revealed that the control and infectedanimals clearly separated at 36 hpi (Figure 6). Very few miRNAs wereDE in blood monocytes. We found three in total, one at 24 hpi andthree at 48 hpi (one was DE at both time points) (Table 1).
Many of the miRNAs identified as being DE have been shown tohave a role in immunity in other species. miR-223, for example, whichwas upregulated at 36 hpi in MIMs, has a multifactorial role inneutrophils, regulating their proliferation, activation, and granulopoiesis(Chen et al. 2004; Fazi et al. 2005). Interestingly, in RAW264.7 cellschallenged with lipopolysaccharide (LPS), miR-223 has been reported tobe downregulated, allowing the upregulation of signal transducer and
activator of transcription 3 (STAT3), which promotes proinflammatoryIL-6 and IL-1b transcription. We have previously commented on thedifferences in the miRNA response to LPS and S. uberis, a Gram-positive bacterium (Lawless et al. 2013).
Other DE miRNAs in our study that have a demonstrated role inimmunity and infection in other species include let-7e, which wasdownregulated in MIMs after S. uberis infection. Let-7e has beenshown to regulate caspase 3 and caspase 7 in human monocyte-derived macrophages infected withMycobacterium avium hominissuis(Sharbati et al. 2011). Let-7e, as well as several other DE miRNAs inour study (bta-miR-200c, bta-miR-210, and bta-miR-193a), have alsopreviously been identified as DE in bovine mammary epithelial cellsstimulated with S. uberis in vitro (Lawless et al. 2013).
Another DE miRNA with a role in immune regulation is miR-150,which we observed to be downregulated at both 36 and 48 hpi in MIMs.miR-150 targets MyD88 (upregulated at both 36 and 48 hpi in MIMs),
n Table 1 Fold changes and false discovery rates of DE miRNAs at 12, 24, 36, and 48 hr postinfection in milk-isolated and blood-isolatedmonocytes
Tissue Hours After Infection (hpi) miR Name Fold Change False Discovery Rate
MIMs 12 bta-miR-615 16.53 0.002591533MIMs 12 bta-miR-451 32.73 0.022589776MIMs 12 bta-miR-486 1.77 0.051194817MIMs 36 bta-miR-34a 28.07 0.003853138MIMs 36 bta-miR-200c 27.12 0.021524752MIMs 36 bta-miR-200b 26.59 0.022403054MIMs 36 bta-miR-182 26.43 0.034621112MIMs 36 bta-miR-125a 25.86 0.000854468MIMs 36 bta-miR-200a 24.90 0.061309129MIMs 36 bta-let-7e 24.51 0.046884171MIMs 36 bta-miR-760-3p 24.38 0.030789676MIMs 36 bta-miR-193a-5p 24.13 0.099288316MIMs 36 bta-miR-150 24.05 0.014886528MIMs 36 bta-miR-210 24.03 0.000399613MIMs 36 bta-miR-375 23.88 0.021524752MIMs 36 bta-miR-149-5p 22.77 0.099288316MIMs 36 bta-miR-30a-5p 22.48 0.046884171MIMs 36 bta-miR-142-5p 2.21 0.033031656MIMs 36 bta-miR-363 2.23 0.049537718MIMs 36 bta-miR-223 2.44 0.011440656MIMs 36 bta-miR-338 2.51 0.017723606MIMs 36 bta-miR-339a 2.82 0.01613752MIMs 36 bta-miR-2898 2.98 0.003853138MIMs 36 bta-miR-1291 3.07 0.033031656MIMs 36 bta-miR-423-5p 5.73 0.014512876MIMs 36 bta-miR-451 47.12 6.28E207MIMs 48 bta-let-7e 26.92 0.055709133MIMs 48 bta-miR-200b 26.06 0.055709133MIMs 48 bta-miR-34a 25.37 0.014991858MIMs 48 bta-miR-149-5p 24.01 0.055709133MIMs 48 bta-miR-375 23.76 0.006976206MIMs 48 bta-miR-210 23.39 0.072510577MIMs 48 bta-miR-125a 23.29 0.087523866MIMs 48 bta-miR-150 23.18 0.033651802MIMs 48 bta-miR-99b 22.9 0.055709133MIMs 48 bta-miR-338 2.81 0.055709133MIMs 48 bta-miR-486 12.79 0.006655283MIMs 48 bta-miR-451 48 1.79E205BIMs 24 bta-miR-146b 223.26 0.023903261BIMs 48 bta-miR-451 9.74 0.067032312BIMs 48 bta-miR-146b 23.52 0.067032312BIMs 48 bta-miR-411a 222.44 0.067032312
Volume 4 June 2014 | mRNA and miRNA Expression in Bovine Monocytes | 965
a key regulator of TLR signaling (Ghorpade et al. 2013). miR-150 has alsobeen shown to target CXCR4 (Rolland-Turner et al. 2013; Tano et al.2011), which was upregulated two-fold at 36 and 48 hpi in MIMs. Finally,one of the miRNAs that was identified as downregulated in BIMs, miR-146b, has been shown to target TNF receptor-associated factor 6 andIRAK1 genes in THP-1 cells stimulated with LPS (Taganov et al. 2006).
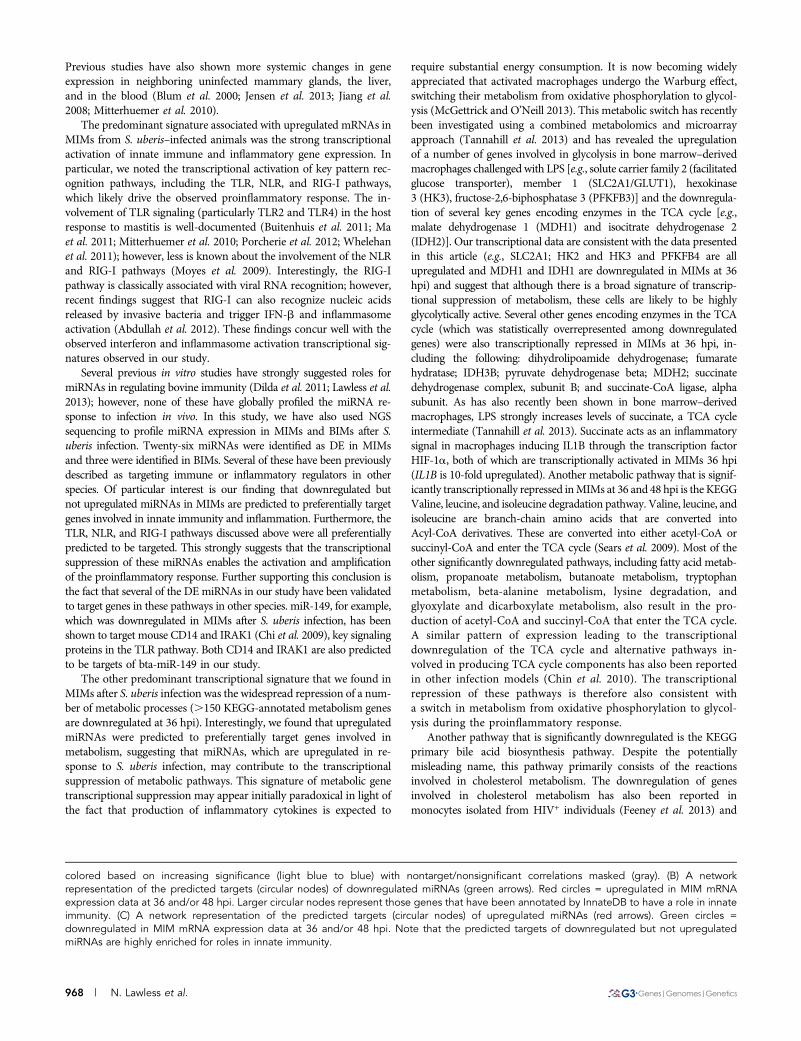
Predicted targets of downregulated but notupregulated miRNAs are highly enriched for roles ininnate immunityTo identify the potential mRNA targets of DE miRNAs in MIMsisolated from infected animals, we identified those mRNAs whoseexpression was significantly negatively correlated with miRNAexpression. These predictions were further refined by removing thosemiRNA target–predicted relationships that were not supported bya predicted seed region in the 39 UTR of the correlated mRNA (Figure7 and Table S11). Analysis of the predicted target genes usingInnateDB (www.innatedb.com) (Lynn et al. 2008) revealed that thepredicted targets of downregulated but not upregulated miRNAs werehighly enriched for roles in innate immunity (FDR ,3.2E28). Morespecifically, pathway analysis revealed that downregulated miRNAswere predicted to preferentially target key pathogen recognition re-ceptor signaling pathways, including the TLR, NLR, and RIG-I sig-naling pathways (Table S12). Given that these pathways were alsoidentified in the mRNAseq data as being among the top upregulatedpathways, this finding strongly suggests that miRNAs are key regu-lators of innate immune pathways that drive the host inflammatoryresponse during mastitis.
In contrast, the predicted targets of upregulated miRNAs wereenriched for roles in metabolism (FDR = 0.01). Pathway analysis ofthe mRNAseq data had already highlighted the downregulation ofmetabolic pathways in response to S. uberis infection (see above).These results suggest that miRNAs may also be key regulators ofthe transcriptional suppression of metabolic pathways during mastitis.
Novel miRNA discoveryThe miRNA sequencing data were also mined to determine if milk orblood monocytes expressed potentially novel miRNAs. Previously, weidentified 19 novel miRNAs in bovine mammary epithelial cells usingmiRDeep2 (Lawless et al. 2013). Applying the same approach as ourprevious study, we identified a further 20 high-confidence putativelynovel bovine miRNAs that were independently predicted in multipleMIMs/BIMs miRNAseq data (Table S13).
Searching the miRBase database (v20) using BLAST identified thateight of the novel miRNAs had close homology to other miR-2284family members. miRBase currently lists this miRNA family as having102 members, yet virtually no data exist regarding what function sucha large group of constitutively expressed miRNAs may have. Othernovel miRNAs discovered in this study included a homolog of hsa-miR-3680-3p, a miRNA identified in human periphery blood (Vazet al. 2010). The discovery of these miRNA further adds to the data-base of bovine miRNAs.
DISCUSSIONInfectious disease is a serious threat not only directly to human healthbut also to animal health, for which it is associated with substantialannual economic losses, public confidence issues, and food securityconcerns. Currently, there is a significant gap in the understanding ofthe molecular and genetic mechanisms that underpin susceptibility toinfectious disease in humans and in animals. An important reason forthis is the fact that disease susceptibility is a multifactorial complexphenotype, which is not the result of single genes acting in isolationbut rather is attributable to perturbation at a network or systems level(Barabasi et al. 2011). Such networks are regulated at multiple differ-ent levels (e.g., genetic, transcriptional, posttranscriptional) and, assuch, a multiomic integrative biology approach is needed to under-stand them.
Here, we report NGS approach coupled with advanced networkand pathway biology methods to simultaneously profile the mRNAand miRNA networks that are differentially regulated in vivo in blood-isolated and milk-isolated CD14+ monocytes during infection witha bovine mastitis pathogen, S. uberis. Bovine mastitis is an inflamma-tion-driven disease of the bovine mammary gland, which costs theglobal dairy industry billions of dollars per year (Jones and Bailey2009; Wells et al. 1998). Profiling genome-wide changes in mRNAexpression in MIMs and BIMs using RNAseq, we observed more than3500 genes to be statistically altered in their expression in response toS. uberis challenge. Notably, this RNAseq approach identified approx-imately 1000 more DE genes than had been previously reported ina microarray-based analysis of RNA expression in mammary tissue ofcattle infected with the same pathogen (Jensen et al. 2013; Moyes et al.2009; Swanson et al. 2009). As expected, given that mastitis is a rela-tively localized inflammatory disease in the mammary gland, the ma-jority of DE genes were identified in MIMs, which are recruited to thesite of infection. This influx of immune cells (including monocytes) tothe site of infection was observed in recorded SCC data only in theinfected animals. However, we also observed a small but significanttranscriptional response in BIMs to S. uberis infection that was pri-marily associated with an interferon and cytokine signaling signature.
Figure 6 A heatmap of the normalized read counts of miRNAs that wereidentified as differentially expressed in MIMs at 36 hpi. Hierarchicalclustering revealed the separation of the infected and control animalsbased on this miRNA expression data (more red the colour the morehighly expressed the miRNA is). Note that one infected animal (TI2) isnot included in this analysis because it did not appear to respond to theinfection as measured by CFU or mRNA expression data (see Figure 2).
966 | N. Lawless et al.
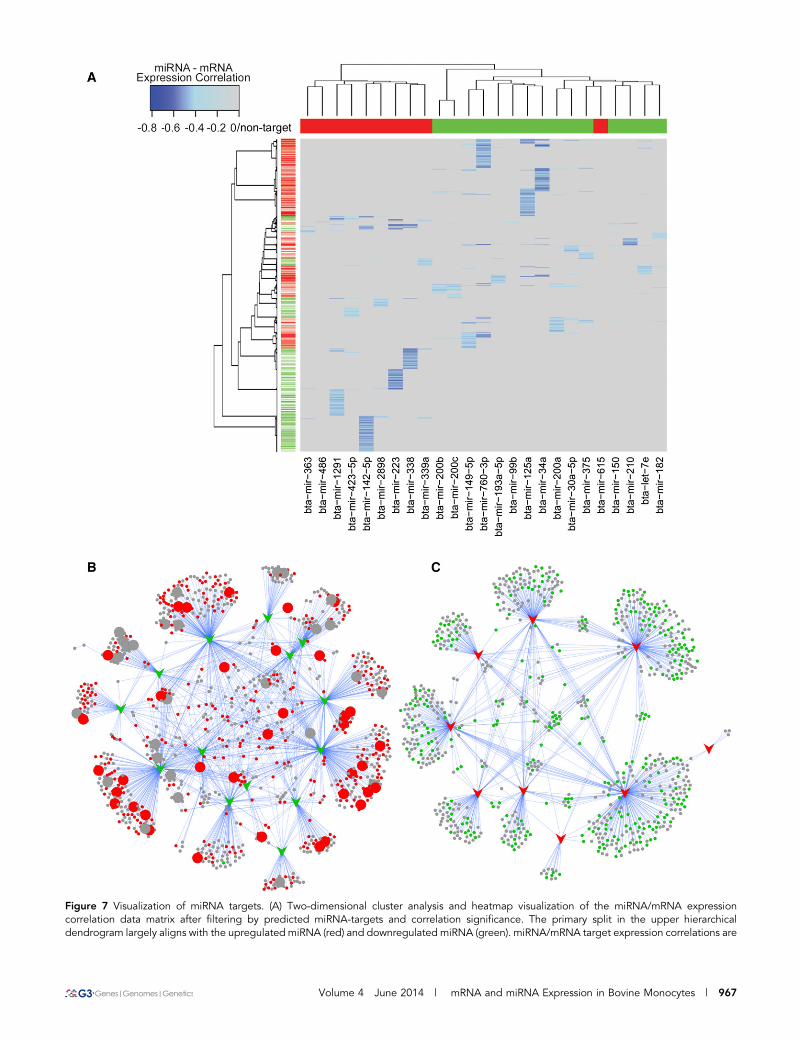
Figure 7 Visualization of miRNA targets. (A) Two-dimensional cluster analysis and heatmap visualization of the miRNA/mRNA expressioncorrelation data matrix after filtering by predicted miRNA-targets and correlation significance. The primary split in the upper hierarchicaldendrogram largely aligns with the upregulated miRNA (red) and downregulated miRNA (green). miRNA/mRNA target expression correlations are
Volume 4 June 2014 | mRNA and miRNA Expression in Bovine Monocytes | 967
Previous studies have also shown more systemic changes in geneexpression in neighboring uninfected mammary glands, the liver,and in the blood (Blum et al. 2000; Jensen et al. 2013; Jiang et al.2008; Mitterhuemer et al. 2010).
The predominant signature associated with upregulated mRNAs inMIMs from S. uberis–infected animals was the strong transcriptionalactivation of innate immune and inflammatory gene expression. Inparticular, we noted the transcriptional activation of key pattern rec-ognition pathways, including the TLR, NLR, and RIG-I pathways,which likely drive the observed proinflammatory response. The in-volvement of TLR signaling (particularly TLR2 and TLR4) in the hostresponse to mastitis is well-documented (Buitenhuis et al. 2011; Maet al. 2011; Mitterhuemer et al. 2010; Porcherie et al. 2012; Whelehanet al. 2011); however, less is known about the involvement of the NLRand RIG-I pathways (Moyes et al. 2009). Interestingly, the RIG-Ipathway is classically associated with viral RNA recognition; however,recent findings suggest that RIG-I can also recognize nucleic acidsreleased by invasive bacteria and trigger IFN-b and inflammasomeactivation (Abdullah et al. 2012). These findings concur well with theobserved interferon and inflammasome activation transcriptional sig-natures observed in our study.
Several previous in vitro studies have strongly suggested roles formiRNAs in regulating bovine immunity (Dilda et al. 2011; Lawless et al.2013); however, none of these have globally profiled the miRNA re-sponse to infection in vivo. In this study, we have also used NGSsequencing to profile miRNA expression in MIMs and BIMs after S.uberis infection. Twenty-six miRNAs were identified as DE in MIMsand three were identified in BIMs. Several of these have been previouslydescribed as targeting immune or inflammatory regulators in otherspecies. Of particular interest is our finding that downregulated butnot upregulated miRNAs in MIMs are predicted to preferentially targetgenes involved in innate immunity and inflammation. Furthermore, theTLR, NLR, and RIG-I pathways discussed above were all preferentiallypredicted to be targeted. This strongly suggests that the transcriptionalsuppression of these miRNAs enables the activation and amplificationof the proinflammatory response. Further supporting this conclusion isthe fact that several of the DE miRNAs in our study have been validatedto target genes in these pathways in other species. miR-149, for example,which was downregulated in MIMs after S. uberis infection, has beenshown to target mouse CD14 and IRAK1 (Chi et al. 2009), key signalingproteins in the TLR pathway. Both CD14 and IRAK1 are also predictedto be targets of bta-miR-149 in our study.
The other predominant transcriptional signature that we found inMIMs after S. uberis infection was the widespread repression of a num-ber of metabolic processes (.150 KEGG-annotated metabolism genesare downregulated at 36 hpi). Interestingly, we found that upregulatedmiRNAs were predicted to preferentially target genes involved inmetabolism, suggesting that miRNAs, which are upregulated in re-sponse to S. uberis infection, may contribute to the transcriptionalsuppression of metabolic pathways. This signature of metabolic genetranscriptional suppression may appear initially paradoxical in light ofthe fact that production of inflammatory cytokines is expected to
require substantial energy consumption. It is now becoming widelyappreciated that activated macrophages undergo the Warburg effect,switching their metabolism from oxidative phosphorylation to glycol-ysis (McGettrick and O’Neill 2013). This metabolic switch has recentlybeen investigated using a combined metabolomics and microarrayapproach (Tannahill et al. 2013) and has revealed the upregulationof a number of genes involved in glycolysis in bone marrow–derivedmacrophages challenged with LPS [e.g., solute carrier family 2 (facilitatedglucose transporter), member 1 (SLC2A1/GLUT1), hexokinase3 (HK3), fructose-2,6-biphosphatase 3 (PFKFB3)] and the downregula-tion of several key genes encoding enzymes in the TCA cycle [e.g.,malate dehydrogenase 1 (MDH1) and isocitrate dehydrogenase 2(IDH2)]. Our transcriptional data are consistent with the data presentedin this article (e.g., SLC2A1; HK2 and HK3 and PFKFB4 are allupregulated and MDH1 and IDH1 are downregulated in MIMs at 36hpi) and suggest that although there is a broad signature of transcrip-tional suppression of metabolism, these cells are likely to be highlyglycolytically active. Several other genes encoding enzymes in the TCAcycle (which was statistically overrepresented among downregulatedgenes) were also transcriptionally repressed in MIMs at 36 hpi, in-cluding the following: dihydrolipoamide dehydrogenase; fumaratehydratase; IDH3B; pyruvate dehydrogenase beta; MDH2; succinatedehydrogenase complex, subunit B; and succinate-CoA ligase, alphasubunit. As has also recently been shown in bone marrow–derivedmacrophages, LPS strongly increases levels of succinate, a TCA cycleintermediate (Tannahill et al. 2013). Succinate acts as an inflammatorysignal in macrophages inducing IL1B through the transcription factorHIF-1a, both of which are transcriptionally activated in MIMs 36 hpi(IL1B is 10-fold upregulated). Another metabolic pathway that is signif-icantly transcriptionally repressed inMIMs at 36 and 48 hpi is the KEGGValine, leucine, and isoleucine degradation pathway. Valine, leucine, andisoleucine are branch-chain amino acids that are converted intoAcyl-CoA derivatives. These are converted into either acetyl-CoA orsuccinyl-CoA and enter the TCA cycle (Sears et al. 2009). Most of theother significantly downregulated pathways, including fatty acid metab-olism, propanoate metabolism, butanoate metabolism, tryptophanmetabolism, beta-alanine metabolism, lysine degradation, andglyoxylate and dicarboxylate metabolism, also result in the pro-duction of acetyl-CoA and succinyl-CoA that enter the TCA cycle.A similar pattern of expression leading to the transcriptionaldownregulation of the TCA cycle and alternative pathways in-volved in producing TCA cycle components has also been reportedin other infection models (Chin et al. 2010). The transcriptionalrepression of these pathways is therefore also consistent witha switch in metabolism from oxidative phosphorylation to glycol-ysis during the proinflammatory response.
Another pathway that is significantly downregulated is the KEGGprimary bile acid biosynthesis pathway. Despite the potentiallymisleading name, this pathway primarily consists of the reactionsinvolved in cholesterol metabolism. The downregulation of genesinvolved in cholesterol metabolism has also been reported inmonocytes isolated from HIV+ individuals (Feeney et al. 2013) and
colored based on increasing significance (light blue to blue) with nontarget/nonsignificant correlations masked (gray). (B) A networkrepresentation of the predicted targets (circular nodes) of downregulated miRNAs (green arrows). Red circles = upregulated in MIM mRNAexpression data at 36 and/or 48 hpi. Larger circular nodes represent those genes that have been annotated by InnateDB to have a role in innateimmunity. (C) A network representation of the predicted targets (circular nodes) of upregulated miRNAs (red arrows). Green circles =downregulated in MIM mRNA expression data at 36 and/or 48 hpi. Note that the predicted targets of downregulated but not upregulatedmiRNAs are highly enriched for roles in innate immunity.
968 | N. Lawless et al.
a number of bacterial infections (Dushkin 2012). The accumulation ofcholesterol in monocytes and macrophages leads to the formation offoam cells, which in humans are associated with the inflammatorydisease, atherosclerosis (Ross 1999). The downregulation of genes in-volved in cholesterol and fatty acid metabolism is likely driven in partby the transcriptional suppression of the PPAR-g transcription factorin MIMs at 36 hpi and the downregulation of PPAR-a at 48 hpi, bothof which are key transcriptional regulators of these pathways(Dushkin 2012). Interestingly, the PPARs also have a role in theregulation of inflammation, in which their suppression is requiredto induce inflammatory gene expression (Bensinger and Tontonoz2008). Of further note is that one of the liver X receptors, LXR-b(NR1H2), which together with the PPARs is a key regulator of in-flammation and lipid metabolism (Bensinger and Tontonoz 2008), isupregulated in MIMs at 36 and 48 hpi. LXRs are also known toantagonize inflammatory gene expression, so it is somewhat surprisingto find LXR-b to be upregulated. This may reflect the fact that balanceis needed to avoid excessive inflammation or that LXRs and PPARs donot completely overlap in the genes that they regulate.
An additional link between metabolism and inflammation that iscurrently undergoing intensive investigation is the role of NAD+,sirtuins (SIRTs), and AMP-dependent protein kinase (AMPK) insuppressing inflammation (McGettrick and O’Neill 2013). The acti-vation of TLR4, which along with TLR2 and TLR9 is transcriptionallyupregulated in MIMs at 36 hpi, has been shown to induce NAMphosphoribosyltransferase (NAMPT; upregulated in MIMs at36hpi), which in turn activates SIRT1 (upregulated in MIMs at 36hpi) via NAD+. SIRT1 limits inflammation by repressing RELAtranscription factor activity, a key transcriptional hub identified inMIMs. SIRT1 also activates AMPK (upregulated in MIMs at 36 hpi),a central regulator of energy metabolism. Activation of AMPK hasbeen shown to decrease NF-kB activity and TNF-a production inmacrophages stimulated with LPS, IL-12 production in DCs, andHIF-1a. These data suggest that at 36 hpi, the brakes are startingto be applied to limit the inflammatory response to S. uberis in-fection via SIRT1 and AMPK. The affect of this break is apparentat 48 hpi, where the genes encoding TNF-a, IL-1B, IL-12, and HIF-1a are all downregulated in comparison to 36 hpi. The limiting ofinflammation at this stage makes sense based on the bacterial countdata, which show that bacterial CFU/ml are declining, suggestingthat the infection is being resolved. Interestingly, AMPK activity alsoinhibits both the cholesterol and fatty acid metabolic pathways that,as discussed above, are downregulated in MIMs after S. uberis in-fection. This suppression of fatty acid metabolism has been shown tobe beneficial to the host during a viral infection (Moser et al. 2012).
Finally, we also observed the statistically significant over-representation of downregulated genes annotated in the KEGGglutathione metabolism pathway. Glutathione has an important rolein innate and adaptive immunity and has been shown to conferprotection against microbial, viral, and parasitic infections (Morriset al. 2013). Glutathione metabolism also plays an important role inmacrophages in the detoxification of reactive oxygen species. Thetranscriptional suppression of this pathway in MIMs after S. uberisinfection may be a consequence of the metabolic switch to glycolysisand may be detrimental to the host, leading to an excess of oxidants inthe cells, which could drive the inflammation and tissue damage thatare characteristic of mastitis. In patients with active tuberculosis,PBMC intracellular glutathione levels declined by 70%; this was cor-related with increased proinflammatory cytokines and enhanced bac-terial growth (Guerra et al. 2012). Supplementation with glutathionehas been demonstrated to lead to the control of mycobacterial growth
(Venketaraman et al. 2003) and also appears to have beneficial effectsin reducing inflammation in HIV+ patients (Morris et al. 2012). Thissuggests that glutathione supplementation is a potential strategy toreduce the effects of inflammation in mastitis.
miRNAs also likely play a key role in regulating the links betweeninflammation and metabolism observed in this study. Human SIRT1,for example, which as discussed above limits inflammation, has beenshown to be a target of miR-34a (Yamakuchi et al. 2008). Our data areconsistent with this relationship also existing in MIMs, where we havefound bta-miR-34a to be downregulated at 36 and 48 hpi and SIRT1to be upregulated. Other examples of miRNAs that likely transcrip-tionally regulate metabolic pathways in MIMs include miR-451, whichis upregulated in MIMs at 36 and 48 hpi and has been shown to targetMO25 in mouse heart tissue altering AMPK signaling (Chen et al.2012). miR-451 has also been shown to regulate the expression ofseveral proinflammatory cytokines in mice in response to influenzainfection (Rosenberger et al. 2012).
Aside from providing new insight into the regulatory rolemiRNAs play in S. uberis infection in vivo, our study also providesthe groundwork for a number of potential practical applications inveterinary medicine. miRNAs, for example, exhibit many proper-ties that have made them of significant interest as noninvasivebiomarkers. miRNAs are abundantly and stably expressed ina range of accessible tissues, including serum, milk, urine, saliva,and semen, where they can be readily measured (Chen et al. 2010;Hata et al. 2010; Kosaka et al. 2010). Importantly, for a potentialbiomarker, miRNAs have high information content, and the ex-pression profile of small numbers of them have been shown to bediagnostic of disease (De Guire et al. 2013). The use of miRNAs asa clinical biomarker is most advanced in human cancer research. In2009, Prometheus Laboratories released an miRNA biomarker toaccurately identify 25 different tumor types (Ajit 2012), andmiRNA biomarkers are now available for early cancer prognosisfrom two other companies, Asuragen and Rosetta Genomics. NGS-based technologies, such as the approach used in this study, areempowering RNA expression profiling, including miRNAs, on a ge-nome-wide scale with unprecedented resolution, accuracy, andspeed and at a relatively low cost (Schuster 2008). There is signif-icant potential to develop these approaches as diagnostics of in-fection in animals and also in humans.
ACKNOWLEDGMENTSWe thank Randy Atchison, Derrel Hoy, Tera Nyholm, Adrienne Staple,Jen Jones, and Paul Amundson for excellent technical help. We alsothank Professor Luke O’Neill for his correspondence. N.L., T.A.R.,J.D.L., and D.J.L. conceived and designed the experiments. N.L., B.P.,D.Z., and J.D.L. performed the experiments. M.B. performed librarypreparation and sequencing. N.L., K.B., C.O.F., and D.J.L. analyzedand interpreted the data. N.L. and D.J.L. wrote the paper (with inputfromC.O.F., T.S., T.A.R., K.Z., and J.D.L.). All authors reviewed the finaldraft of the paper. The authors have declared that no conflicting inter-ests exist. This study was funded in part by Teagasc RMIS 6018 andUnited States Department of Agriculture ARS funding 3625-32000-102-00. N.L. is supported by a Teagasc Walsh Fellowship.
LITERATURE CITEDAbdullah, Z., M. Schlee, S. Roth, M. A. Mraheil, W. Barchet et al. 2012 RIG-
I detects infection with live Listeria by sensing secreted bacterial nucleicacids. EMBO J. 31: 4153–4164.
Ajit, S. K., 2012 Circulating microRNAs as biomarkers, therapeutic targets,and signaling molecules. Sensors (Basel Switzerland) 12: 3359–3369.
Volume 4 June 2014 | mRNA and miRNA Expression in Bovine Monocytes | 969
Arnaud, N., S. Dabo, D. Akazawa, M. Fukasawa, F. Shinkai-Ouchi et al.2011 Hepatitis C virus reveals a novel early control in acute immuneresponse. PLoS Pathog. 7: e1002289.
Auer, P. L., and R. W. Doerge, 2010 Statistical design and analysis of RNAsequencing data. Genetics 185: 405–416.
Bannerman, D. D., M. J. Paape, J. P. Goff, K. Kimura, J. D. Lippolis et al.2004 Innate immune response to intramammary infection with Serratiamarcescens and Streptococcus uberis. Vet. Res. 35: 681–700.
Barabasi, A. L., N. Gulbahce, and J. Loscalzo, 2011 Network medicine:a network-based approach to human disease. Nat. Rev. Genet. 12: 56–68.
Benjamini, Y., and Y. Hochberg, 1995 Controlling the false discovery rate:A practical and powerful approach to multiple testing. J. R. Stat. Soc. Ser.B. Stat. Methodol. 57: 289–300.
Bensinger, S. J., and P. Tontonoz, 2008 Integration of metabolism and in-flammation by lipid-activated nuclear receptors. Nature 454: 470–477.
Blum, J. W., H. Dosogne, D. Hoeben, F. Vangroenweghe, H. M. Hammonet al. 2000 Tumor necrosis factor-alpha and nitrite/nitrate responsesduring acute mastitis induced by Escherichia coli infection and endotoxinin dairy cows. Domest. Anim. Endocrinol. 19: 223–235.
Bronevetsky, Y., A. V. Villarino, C. J. Eisley, R. Barbeau, A. J. Barczak et al.2013 T cell activation induces proteasomal degradation of Argonaute andrapid remodeling of the microRNA repertoire. J. Exp. Med. 210: 417–432.
Buitenhuis, B., C. M. Rontved, S. M. Edwards, K. L. Ingvartsen, and P.Sorensen, 2011 In depth analysis of genes and pathways of the mam-mary gland involved in the pathogenesis of bovine Escherichia coli-mastitis. BMC Genomics 12: 130.
Bullard, J. H., E. Purdom, K. D. Hansen, and S. Dudoit, 2010 Evaluation ofstatistical methods for normalization and differential expression inmRNA-Seq experiments. BMC Bioinformatics 11: 94.
Chen, C. Z., L. Li, H. F. Lodish, and D. P. Bartel, 2004 MicroRNAs mod-ulate hematopoietic lineage differentiation. Science 303: 83–86.
Chen, H., G. M. Untiveros, L. A. McKee, J. Perez, J. Li et al. 2012 Micro-RNA-195 and -451 regulate the LKB1/AMPK signaling axis by targetingMO25. PLoS ONE 7: e41574.
Chen, X., C. Gao, H. Li, L. Huang, Q. Sun et al. 2010 Identification and char-acterization of microRNAs in raw milk during different periods of lactation,commercial fluid, and powdered milk products. Cell Res. 20: 1128–1137.
Chi, S. W., J. B. Zang, A. Mele, and R. B. Darnell, 2009 Argonaute HITS-CLIP decodes microRNA-mRNA interaction maps. Nature 460: 479–486.
Chin, C. Y., D. M. Monack, and S. Nathan, 2010 Genome wide transcrip-tome profiling of a murine acute melioidosis model reveals new insightsinto how Burkholderia pseudomallei overcomes host innate immunity.BMC Genomics 11: 672.
Cock, P. J., C. J. Fields, N. Goto, M. L. Heuer, and P. M. Rice, 2010 TheSanger FASTQ file format for sequences with quality scores, and theSolexa/Illumina FASTQ variants. Nucleic Acids Res. 38: 1767–1771.
Coutinho, L. L., L. K. Matukumalli, T. S. Sonstegard, C. P. Van Tassell, L. C.Gasbarre et al. 2007 Discovery and profiling of bovine microRNAs fromimmune-related and embryonic tissues. Physiol. Genomics 29: 35–43.
De Guire, V., R. Robitaille, N. Tetreault, R. Guerin, C. Menard et al.2013 Circulating miRNAs as sensitive and specific biomarkers for thediagnosis and monitoring of human diseases: promises and challenges.Clin. Biochem. 46: 846–860.
Dilda, F., G. Gioia, L. Pisani, L. Restelli, C. Lecchi et al. 2011 Escherichiacoli lipopolysaccharides and Staphylococcus aureus enterotoxin B dif-ferentially modulate inflammatory microRNAs in bovine monocytes. Vet.J. 192: 514–516.
Dong, C., G. Zhao, M. Zhong, Y. Yue, L. Wu et al. 2013 RNA sequencingand transcriptomal analysis of human monocyte to macrophage differ-entiation. Gene 519: 279–287.
Dufour, S., and I. R. Dohoo, 2013 Monitoring herd incidence of intra-mammary infection in lactating cows using repeated longitudinal somaticcell count measurements. J. Dairy Sci. 96: 1568–1580.
Dushkin, M. I., 2012 Macrophage/foam cell is an attribute of inflammation:mechanisms of formation and functional role. Biochemistry. Biokhimiia77: 327–338.
Fazi, F., A. Rosa, A. Fatica, V. Gelmetti, M. L. De Marchis et al.2005 A minicircuitry comprised of microRNA-223 and transcriptionfactors NFI-A and C/EBPalpha regulates human granulopoiesis. Cell 123:819–831.
Feeney, E. R., N. McAuley, J. A. O’Halloran, C. Rock, J. Low et al. 2013 Theexpression of cholesterol metabolism genes in monocytes from HIV-in-fected subjects suggests intracellular cholesterol accumulation. J. Infect.Dis. 207: 628–637.
Flicek, P., M. R. Amode, D. Barrell, K. Beal, S. Brent et al. 2012 Ensembl2012. Nucleic Acids Res. 40: D84–D90.
Garmire, L. X., and S. Subramaniam, 2012 Evaluation of normalizationmethods in mammalian microRNA-Seq data. RNA 18: 1279–1288.
Ghorpade, D. S., S. Holla, S. V. Kaveri, J. Bayry, S. A. Patil et al. 2013 Sonichedgehog-dependent induction of microRNA 31 and microRNA 150regulates Mycobacterium bovis BCG-driven toll-like receptor 2 signaling.Mol. Cell. Biol. 33: 543–556.
Guerra, C., K. Johal, D. Morris, S. Moreno, O. Alvarado et al. 2012 Controlof Mycobacterium tuberculosis growth by activated natural killer cells.Clin. Exp. Immunol. 168: 142–152.
Hata, T., K. Murakami, H. Nakatani, Y. Yamamoto, T. Matsuda et al.2010 Isolation of bovine milk-derived microvesicles carrying mRNAsand microRNAs. Biochem. Biophys. Res. Commun. 396: 528–533.
Hubbard, T. J., B. L. Aken, S. Ayling, B. Ballester, K. Beal et al.2009 Ensembl 2009. Nucleic Acids Res. 37: D690–D697.
Ideker, T., O. Ozier, B. Schwikowski, and A. F. Siegel, 2002 Discoveringregulatory and signalling circuits in molecular interaction networks. Bi-oinformatics 18(Suppl 1): S233–S240.
Jensen, K., J. Gunther, R. Talbot, W. Petzl, H. Zerbe et al. 2013 Escherichiacoli- and Staphylococcus aureus-induced mastitis differentially modulatetranscriptional responses in neighbouring uninfected bovine mammarygland quarters. BMC Genomics 14: 36.
Jiang, L., P. Sorensen, C. Rontved, L. Vels, and K. L. Ingvartsen, 2008 Geneexpression profiling of liver from dairy cows treated intra-mammary withlipopolysaccharide. BMC Genomics 9: 443.
Jin, W., J. R. Grant, P. Stothard, S. S. Moore, and L. L. Guan,2009 Characterization of bovine miRNAs by sequencing and bioinfor-matics analysis. BMC Mol. Biol. 10: 90.
Jones, G. M., and T. L. Bailey 2009 Understanding the basics of mastitis.Virginia Cooperative Extension Publication No. 404-233. Virginia StateUniversity, USA, 1-7.
Kanehisa, M., M. Araki, S. Goto, M. Hattori, M. Hirakawa et al.2007 KEGG for linking genomes to life and the environment. NucleicAcids Res. 36: D480–D484.
Kosaka, N., H. Izumi, K. Sekine, and T. Ochiya, 2010 microRNA as a newimmune-regulatory agent in breast milk. Silence 1: 7.
Kozomara, A., and S. Griffiths-Jones, 2011 miRBase: integrating microRNAannotation and deep-sequencing data. Nucleic Acids Res. 39: D152–D157.
Lawless, N., A. B. Foroushani, M. S. McCabe, C. O’Farrelly, and D. J. Lynn,2013 Next generation sequencing reveals the expression of a uniquemiRNA profile in response to a Gram-positive bacterial infection. PLoSONE 8: e57543.
Lin, C. Y., C. H. Chin, H. H. Wu, S. H. Chen, C. W. Ho et al. 2008 Hubba:hub objects analyzer—a framework of interactome hubs identification fornetwork biology. Nucleic Acids Res. 36: W438–W443.
Lippolis, J. D., T. A. Reinhardt, J. P. Goff, and R. L. Horst, 2006 Neutrophilextracellular trap formation by bovine neutrophils is not inhibited bymilk. Vet. Immunol. Immunopathol. 113: 248–255.
Lynn, D. J., G. L. Winsor, C. Chan, N. Richard, M. R. Laird et al.2008 InnateDB: facilitating systems-level analyses of the mammalianinnate immune response. Mol. Syst. Biol. 4: 218.
Lynn, D. J., C. Chan, M. Naseer, M. Yau, R. Lo et al. 2010 Curating theinnate immunity interactome. BMC Syst. Biol. 4: 117.
Ma, J. L., Y. H. Zhu, L. Zhang, Z. Y. Zhuge, P. Q. Liu et al. 2011 Serumconcentration and mRNA expression in milk somatic cells of toll-like re-ceptor 2, toll-like receptor 4, and cytokines in dairy cows following intra-mammary inoculation with Escherichia coli. J. Dairy Sci. 94: 5903–5912.
970 | N. Lawless et al.

Mackowiak, S. D., 2011 Identification of novel and known miRNAs indeep-sequencing data with miRDeep2. Curr Protoc BioinformaticsChapter 12, Unit 12 10.
McGettrick, A. F., and L. A. O’Neill, 2013 How metabolism generates sig-nals during innate immunity and inflammation. J. Biol. Chem. 288:22893–22898.
Minakawa, M., T. Sone, T. Takeuchi, and H. Yokosawa, 2008 Regulation ofthe nuclear factor (NF)-kappaB pathway by ISGylation. Biol. Pharm. Bull.31: 2223–2227.
Mitterhuemer, S., W. Petzl, S. Krebs, D. Mehne, A. Klanner et al.2010 Escherichia coli infection induces distinct local and systemictranscriptome responses in the mammary gland. BMC Genomics 11: 138.
Morris, D., C. Guerra, C. Donohue, H. Oh, M. Khurasany et al.2012 Unveiling the mechanisms for decreased glutathione in individ-uals with HIV infection. Clin. Dev. Immunol. 2012: 734125.
Morris, D., M. Khurasany, T. Nguyen, J. Kim, F. Guilford et al.2013 Glutathione and infection. Biochim. Biophys. Acta. 1830: 3329–3349.
Moser, T. S., D. Schieffer, and S. Cherry, 2012 AMP-activated kinase re-stricts Rift Valley fever virus infection by inhibiting fatty acid synthesis.PLoS Pathog. 8: e1002661.
Moyes, K. M., J. K. Drackley, D. E. Morin, M. Bionaz, S. L. Rodriguez-Zaset al. 2009 Gene network and pathway analysis of bovine mammarytissue challenged with Streptococcus uberis reveals induction of cellproliferation and inhibition of PPARgamma signaling as potentialmechanism for the negative relationships between immune response andlipid metabolism. BMC Genomics 10: 542.
Mullokandov, G., A. Baccarini, A. Ruzo, A. D. Jayaprakash, N. Tung et al.2012 High-throughput assessment of microRNA activity and functionusing microRNA sensor and decoy libraries. Nat. Methods 9: 840–846.
O’Connell, R. M., D. S. Rao, A. A. Chaudhuri, and D. Baltimore,2010 Physiological and pathological roles for microRNAs in the im-mune system. Nat. Rev. Immunol. 10: 111–122.
Porcherie, A., P. Cunha, A. Trotereau, P. Roussel, F. B. Gilbert et al.2012 Repertoire of Escherichia coli agonists sensed by innate immunityreceptors of the bovine udder and mammary epithelial cells. Vet. Res. 43:14.
Prgomet, C., H. Sarikaya, R. M. Bruckmaier, and M. W. Pfaffl, 2005 Short-term effects on pro-inflammatory cytokine, lactoferrin and CD14 mRNAexpression levels in bovine immunoseparated milk and blood cells treatedby LPS. J. Vet. Med. A Physiol. Pathol. Clin. Med. 52: 317–324.
Reinhardt, T. A., R. E. Sacco, B. J. Nonnecke, and J. D. Lippolis,2013 Bovine milk proteome: quantitative changes in normal milk exo-somes, milk fat globule membranes and whey proteomes resulting fromStaphylococcus aureus mastitis. J. Proteomics 82: 141–154.
Reinoso, E. B., M. C. Lasagno, S. A. Dieser, and L. M. Odierno,2011 Distribution of virulence-associated genes in Streptococcus uberisisolated from bovine mastitis. FEMS Microbiol. Lett. 318: 183–188.
Rinaldi, M., R. W. Li, and A. V. Capuco, 2010 Mastitis associated tran-scriptomic disruptions in cattle. Vet. Immunol. Immunopathol. 138: 267–279.
Robinson, M. D., D. J. McCarthy, and G. K. Smyth, 2010 edgeR: a Bio-conductor package for differential expression analysis of digital geneexpression data. Bioinformatics 26: 139–140.
Rolland-Turner, M., E. Goretti, M. Bousquenaud, F. Leonard, C. Nicolas et al.2013 Adenosine stimulates the migration of human endothelial pro-genitor cells. Role of CXCR4 and microRNA-150. PLoS ONE 8: e54135.
Rosenberger, C. M., R. L. Podyminogin, G. Navarro, G. W. Zhao, P. S.Askovich et al. 2012 miR-451 regulates dendritic cell cytokine responsesto influenza infection. J. Immunol. 189: 5965–5975.
Ross, R., 1999 Atherosclerosis an inflammatory disease. N. Engl. J. Med.340: 115–126.
Sandhu, S. K., S. Volinia, S. Costinean, M. Galasso, R. Neinast et al.2012 miR-155 targets histone deacetylase 4 (HDAC4) and impairs tran-scriptional activity of B-cell lymphoma 6 (BCL6) in the Emu-miR-155transgenic mouse model. Proc. Natl. Acad. Sci. USA 109: 20047–20052.
Schuster, S. C., 2008 Next-generation sequencing transforms today’s biol-ogy. Nat. Methods 5: 16–18.
Sears, D. D., G. Hsiao, A. Hsiao, J. G. Yu, C. H. Courtney et al.2009 Mechanisms of human insulin resistance and thiazolidinedione-mediated insulin sensitization. Proc. Natl. Acad. Sci. USA 106: 18745–18750.
Serbina, N. V., T. Jia, T. M. Hohl, and E. G. Pamer, 2008 Monocyte-me-diated defense against microbial pathogens. Annu. Rev. Immunol. 26:421–452.
Shannon, P., A. Markiel, O. Ozier, N. S. Baliga, J. T. Wang et al.2003 Cytoscape: a software environment for integrated models of bio-molecular interaction networks. Genome Res. 13: 2498–2504.
Sharbati, J., A. Lewin, B. Kutz-Lohroff, E. Kamal, R. Einspanier et al.2011 Integrated microRNA-mRNA-analysis of human monocyte de-rived macrophages upon Mycobacterium avium subsp. hominissuis in-fection. PLoS ONE 6: e20258.
Shi, C., and E. G. Pamer, 2011 Monocyte recruitment during infection andinflammation. Nat. Rev. Immunol. 11: 762–774.
Swanson, K. M., K. Stelwagen, J. Dobson, H. V. Henderson, S. R. Davis et al.2009 Transcriptome profiling of Streptococcus uberis-induced mastitisreveals fundamental differences between immune gene expression in themammary gland and in a primary cell culture model. J. Dairy Sci. 92:117–129.
Taganov, K. D., M. P. Boldin, K. J. Chang, and D. Baltimore, 2006 NF-kappaB-dependent induction of microRNA miR-146, an inhibitor tar-geted to signaling proteins of innate immune responses. Proc. Natl. Acad.Sci. USA 103: 12481–12486.
Tannahill, G. M., A. M. Curtis, J. Adamik, E. M. Palsson-McDermott, A. F.McGettrick et al. 2013 Succinate is an inflammatory signal that inducesIL-1beta through HIF-1alpha. Nature 496: 238–242.
Tano, N., H. W. Kim, and M. Ashraf, 2011 microRNA-150 regulates mo-bilization and migration of bone marrow-derived mononuclear cells bytargeting Cxcr4. PLoS ONE 6: e23114.
Trapnell, C., L. Pachter, and S. L. Salzberg, 2009 TopHat: discovering splicejunctions with RNA-Seq. Bioinformatics 25: 1105–1111.
Vaz, C., H. M. Ahmad, P. Sharma, R. Gupta, L. Kumar et al. 2010 Analysisof microRNA transcriptome by deep sequencing of small RNA librariesof peripheral blood. BMC Genomics 11: 288.
Venketaraman, V., Y. K. Dayaram, A. G. Amin, R. Ngo, R. M. Green et al.2003 Role of glutathione in macrophage control of mycobacteria. Infect.Immun. 71: 1864–1871.
Ward, J. R., P. R. Heath, J. W. Catto, M. K. Whyte, M. Milo et al.2011 Regulation of neutrophil senescence by microRNAs. PLoS ONE 6:e15810.
Ward, P. N., M. T. Holden, J. A. Leigh, N. Lennard, A. Bignell et al.2009 Evidence for niche adaptation in the genome of the bovinepathogen Streptococcus uberis. BMC Genomics 10: 54.
Wells, S. J., S. L. Ott, and A. H. Seitzinger, 1998 Key health issues for dairycattle–new and old. J. Dairy Sci. 81: 3029–3035.
Whelehan, C. J., K. G. Meade, P. D. Eckersall, F. J. Young, and C. O’Farrelly,2011 Experimental Staphylococcus aureus infection of the mammarygland induces region-specific changes in innate immune gene expression.Vet. Immunol. Immunopathol. 140: 181–189.
Xu, G., Y. Zhang, H. Jia, J. Li, X. Liu et al. 2009 Cloning and identification ofmicroRNAs in bovine alveolar macrophages. Mol. Cell. Biochem. 332: 9–16.
Yamakuchi, M., M. Ferlito, and C. J. Lowenstein, 2008 miR-34a repressionof SIRT1 regulates apoptosis. Proc. Natl. Acad. Sci. USA 105: 13421–13426.
Young, M. D., M. J. Wakefield, G. K. Smyth, and A. Oshlack, 2010 Geneontology analysis for RNA-seq: accounting for selection bias. GenomeBiol. 11: R14.
Yu, H., P. M. Kim, E. Sprecher, V. Trifonov, and M. Gerstein, 2007 Theimportance of bottlenecks in protein networks: correlation with geneessentiality and expression dynamics. PLOS Comput. Biol. 3: e59.
Zimin, A. V., A. L. Delcher, L. Florea, D. R. Kelley, M. C. Schatz et al.2009 A whole-genome assembly of the domestic cow, Bos taurus. Ge-nome Biol. 10: R42.
Communicating editor: D.-J. De Koning
Volume 4 June 2014 | mRNA and miRNA Expression in Bovine Monocytes | 971


![Activation ofMurine Macrophages Bovine Monocyte Cell Line ... · cultured bovine monocytes(BM)andmouseM+. Thein vitro developmentof bothparasites was assessed by incorporation of[3H]uracil](https://img.pdfslide.us/doc/110x75/5d5dc11988c993d6188b5b5a/activation-ofmurine-macrophages-bovine-monocyte-cell-line-cultured-bovine.jpg)