Embed Size (px)
Citation preview

of May 28, 2018.This information is current as
EncephalomyelitisControl of Experimental AutoimmuneProduction by Regulatory T Cells and
92 Regulates IL-10−microRNA-17
Lukas T. JekerRosenthal, Malika M. Morar, Jeffrey A. Bluestone and Dimitri de Kouchkovsky, Jonathan H. Esensten, Wendy L.
http://www.jimmunol.org/content/191/4/1594doi: 10.4049/jimmunol.1203567July 2013;
2013; 191:1594-1605; Prepublished online 15J Immunol
MaterialSupplementary
7.DC1http://www.jimmunol.org/content/suppl/2013/07/15/jimmunol.120356
Referenceshttp://www.jimmunol.org/content/191/4/1594.full#ref-list-1
, 18 of which you can access for free at: cites 59 articlesThis article
average*
4 weeks from acceptance to publicationFast Publication! •
Every submission reviewed by practicing scientistsNo Triage! •
from submission to initial decisionRapid Reviews! 30 days* •
Submit online. ?The JIWhy
Subscriptionhttp://jimmunol.org/subscription
is online at: The Journal of ImmunologyInformation about subscribing to
Permissionshttp://www.aai.org/About/Publications/JI/copyright.htmlSubmit copyright permission requests at:
Email Alertshttp://jimmunol.org/alertsReceive free email-alerts when new articles cite this article. Sign up at:
Print ISSN: 0022-1767 Online ISSN: 1550-6606. Immunologists, Inc. All rights reserved.Copyright © 2013 by The American Association of1451 Rockville Pike, Suite 650, Rockville, MD 20852The American Association of Immunologists, Inc.,
is published twice each month byThe Journal of Immunology
by guest on May 28, 2018
http://ww
w.jim
munol.org/
Dow
nloaded from
by guest on May 28, 2018
http://ww
w.jim
munol.org/
Dow
nloaded from

The Journal of Immunology
microRNA-17–92 Regulates IL-10 Production by RegulatoryT Cells and Control of Experimental AutoimmuneEncephalomyelitis
Dimitri de Kouchkovsky,* Jonathan H. Esensten,* Wendy L. Rosenthal,*
Malika M. Morar,* Jeffrey A. Bluestone,*,†,1 and Lukas T. Jeker*,†,1
microRNAs (miRNA) are essential for regulatory T cell (Treg) function but little is known about the functional relevance of in-
dividual miRNA loci. We identified the miR-17–92 cluster as CD28 costimulation dependent, suggesting that it may be key for Treg
development and function. Although overall immune homeostasis was maintained in mice with miR-17–92–deficient Tregs,
expression of the miR-17–92 miRNA cluster was critical for Treg accumulation and function during an acute organ-specific
autoimmune disease in vivo. Treg-specific loss of miR-17–92 expression resulted in exacerbated experimental autoimmune en-
cephalitis and failure to establish clinical remission. Using peptide-MHC tetramers, we demonstrate that the miR-17–92 cluster
was specifically required for the accumulation of activated Ag-specific Treg and for differentiation into IL-10–producing effector
Treg. The Journal of Immunology, 2013, 191: 1594–1605.
Regulatory T cells (Treg) are essential for systemic immunehomeostasis. However, despite over a decade of intenseresearch, the molecular understanding of Treg function
during active immune and autoimmune responses is still incom-plete. microRNAs (miRNAs) are important posttranscriptionalregulators of gene expression that form an integral component of
cellular biology. Treg-specific ablation of key genes of miRNAbiogenesis including Dicer (1–3), Drosha (2), and Dgcr8 (4) leadsto a scurfy-like syndrome illustrating that global expression ofmiRNAs is essential for Treg-mediated immune homeostasis. Yet,the role of individual miRNAs in Treg function is largely unre-solved (5).The miR-17–92 miRNA cluster is transcribed as a polycis-
tronic primary transcript encoding six miRNAs from four dif-ferent seed families (miR-17, miR-18a, miR-19a, miR-20a, miR-19b, and miR-92). Two paralog miRNA clusters (miR-106a–363and miR-106b–25) differ from the miR-17–92 cluster in theirnumber of miRNAs. Oncogenic properties of miR-17–92 havebeen well documented (6), and more recently, miR-17–92 wasfound to be physiologically relevant for lung, heart, and skeletaldevelopment (7–9). miR-17–92–deficient mice display impairedB cell development but have normal T cell numbers (7). How-ever, miR-17–92 promotes T cell survival and efficient Th1responses, regulates CD8 effector versus memory differentiation,and inhibits TGF-b–induced in vitro differentiation into inducedTregs (10, 11). miR-17–92 is induced upon T cell activation, butthe functional relevance of this upregulation and its inductivesignals have not been addressed (12, 13). Transgenic (Tg) miR-17–92 overexpression in T and B cells was sufficient for thedevelopment of lymphoproliferative disease and autoimmunity,but the underlying mechanisms of the autoimmunity remain ob-scure (14). T cells from miR-17–92 Tg mice displayed mildlyincreased proliferative capacity and survival, possibly throughphosphatase and tensin homolog deleted on chromosome 10 (Pten)and BCL-2–interacting mediator of cell death (Bim) repression (14).Of note, members of the miR-17–92 cluster are dysregulated inperipheral blood specimens from multiple sclerosis (MS) patients(15, 16).T cell activation requires binding of the TCR to its cognate
peptide presented on MHC molecules by APCs. APCs provide asecond signal called costimulation to allow full activation. Theprototypical costimulatory molecule is CD28, which binds to itsreceptors CD80 and CD86. T cell costimulation equips cells withproperties necessary to cope with the specific activation-inducedstress response (17), enabling the cells to survive and undergo
*Diabetes Center and Department of Medicine, University of California San Fran-cisco, San Francisco, CA 94143; and †Department of Pathology, University of Cal-ifornia San Francisco, San Francisco, CA 94117
1J.A.B. and L.T.J. should be considered cosenior authors.
Received for publication January 10, 2013. Accepted for publication June 8, 2013.
This work was supported by National Institutes of Health Grants P01 AI35297 andU19 AI056388 (to J.A.B.) and P30 DK63720 (for core support) and a scholar awardfrom the Juvenile Diabetes Research Foundation (to J.A.B.). J.A.B. is an A.W. andMary Margaret Clausen Distinguished Professor. L.T.J. was supported by the SwissNational Science Foundation (Grant PBBSB-118644) and the Swiss Foundation forGrants in Biology and Medicine/Swiss National Science Foundation (GrantPASMP3-124274/1).
J.H.E., J.A.B., and D.d.K. initiated the study; J.H.E., D.d.K., and L.T.J. designed andperformed experiments; W.L.R. and M.M.M. performed experiments; J.A.B. pro-vided financial resources and infrastructure; J.H.E. and D.d.K. contributed to writingthe manuscript; J.A.B. and L.T.J. designed experiments, oversaw the study, and wrotethe manuscript. All authors had access to primary data and approved the final man-uscript.
The microarray data presented in this article have been submitted to the Gene Ex-pression Omnibus (http://www.ncbi.nlm.nih.gov/geo/) under accession numberGSE36071.
Address correspondence and reprint requests to Drs. Jeffrey A. Bluestone or LukasT. Jeker, Executive Vice Chancellor and Provost, University of California San Fran-cisco, S-115 Box 0400, 513 Parnassus Avenue, San Francisco, CA 94141-0540 (J.A.B.)or Assistant Adjunct Prof., Diabetes Center and Department of Pathology, Universityof California San Francisco, Box 0540, 513 Parnassus Avenue, San Francisco, CA94143-0540 (L.T.J.). E-mail addresses: [email protected] (J.A.B.) or [email protected] (L.T.J.)
The online version of this article contains supplemental material.
Abbreviations used in this article: BIM, BCL-2–interacting mediator of cell death;EAE, experimental autoimmune encephalitis; KO, knockout; LN, lymph node; MFI,mean fluorescence intensity; MGI, Mouse Genome Informatics; miRNA, microRNA;MOG, myelin oligodendrocyte glycoprotein; PTEN, phosphatase and tensin homologdeleted on chromosome 10; Spl, spleen; Tconv, conventional T cell; Teff, effector Tcell; Tg, transgenic; Treg, regulatory T cell; UCSF, University of California SanFrancisco.
Copyright� 2013 by TheAmericanAssociation of Immunologists, Inc. 0022-1767/13/$16.00
www.jimmunol.org/cgi/doi/10.4049/jimmunol.1203567
by guest on May 28, 2018
http://ww
w.jim
munol.org/
Dow
nloaded from

clonal expansion. Thus, triggering of CD28 induces metabolicchanges (18) and enhances survival and proliferation (19).We have previously demonstrated that CD28-mediated co-
stimulation was an intrinsic requirement for Treg development andfunction. CD28 engagement is particularly important for thymicdevelopment and peripheral survival of Tregs. CD28-deficient orCTLA-4Ig–treated mice have a marked reduction of CD4+CD25+
Foxp3+ Tregs (20), and on a susceptible genetic background, thesemice develop accelerated diabetes (21). Because Tregs do notproduce IL-2, the results suggested that the requirement for CD28was related to the metabolic and survival functions of this path-way. It is well established that CD28 triggering induces a specificgene expression signature including upregulation of prosurvivalgenes (Bcl-xL and Bcl-2), downregulation of proapoptotic genes(e.g., Bim), differential expression of transcription factors, andupregulation of cytokine receptors such as the IL-2Ra-chain(CD25) that further enhance survival and proliferation (19). Inpart, this is achieved through enhancement of PI3K signals byCD28-mediated inhibition of the PI3K inhibitor PTEN (22).Finally, a multitude of mechanisms have been postulated to
explain Treg-suppressive activity (23). The emerging view is thatTreg integrate environmental cues leading to phenotypic andfunctional diversification through induction of various transcrip-tion factors. Thus, subsets of Treg may use different cell surfacemolecules and soluble factors to suppress immunity depending ontheir microenvironment. One of the suppressive mechanisms,production of the inhibitory cytokine IL-10 by Foxp3+ Treg, playsa limited physiologic role in systemic homeostasis and mainlyaffects Treg function in mucosal tissues (24). In contrast, solidevidence demonstrates that IL-10 produced by Tregs plays animportant role in controlling experimental autoimmune encephalitis(EAE), a murine model of multiple sclerosis. Importantly, adop-tively transferred IL-10–deficient Tregs cannot prevent EAE (25).In summary, Tregs are highly costimulation dependent, and
miRNAs are essential for Treg function. These two complementaryresearch areas led to the study of CD28-regulated miRNAs in Tregbiology. Using a combination of miRNA microarray, conditionalgene disruption, and tetramer technology, we found that miR-17–92 is upregulated by CD28-mediated costimulation and is requiredfor IL-10 production and the accumulation of Ag-specific Tregsin EAE, a concept with potentially important diagnostic and/ortherapeutic implications.
Materials and MethodsHuman blood
Whole blood was obtained via venipuncture from healthy adult volunteers(males, age range: 19–29). Blood was collected in sodium heparin–con-taining Vacutainer tubes (BD Biosciences). PBMCs were isolated usingFicoll–Paque PLUS (Amersham Biosciences), as described previously (26).
Isolation and activation of human CD4+CD45RA+ T cells
For microarray analysis, CD4+CD45RA+ T cells were isolated on a BDFACSAria II cell sorter (BD Biosciences) using anti-CD4 (clone SK3; BDBiosciences) and CD45RA (clone HI100; BD Biosciences). Cells with.99% purity were seeded at a density of 1 3 106 cells/ml RPMI 1640medium supplemented with 5% human heat-inactivated pooled AB serum(Valley Biomedical). Cells were activated with latex beads conjugated tocontrol Ab (clone MPC-11; BD Biosciences) or Abs specific for anti-CD3(clone OKT3) or to both anti-CD3 and anti-CD28 (clone 9.3). Activationwas confirmed by flow cytometry on a BD Biosciences FACSCalibur usinganti-CD25 (clone 2A3; BD Biosciences) and anti-CD69 (clone L78; BDBiosciences).
Flow cytometry
Flow cytometry and fluorescence activated cell sorting was performed asdescribed previously (1). Live/dead discrimination was done using Live/
Dead Fixable Violet Dead Cell Staining kit, according to the manu-facturer’s recommendations (Invitrogen Life Technologies). For intracel-lular cytokine staining (IFN-g [clone XMG1.2], IL-17A [clone eBio17B7], and IL-10 [clone JES5-16E3]; eBioscience), cells were stimulatedfor 3 h with 10 ng/ml PMA (Sigma-Aldrich), 0.5 mM ionomycin (Sigma-Aldrich), and 3 mM monensin. IL-10 staining: after viability and surfacestaining cells were resuspended in 100 ml BD Cytofix (BD Biosciences)and incubated for 15 min at room temperature. After washing, cells werestained for 1 h at room temperature with intracellular Abs diluted in 100 mlInvitrogen Fix & Perm medium B. Cells were then washed with BD Perm/Wash buffer. Anti-Ki67 (clone B56; BD Biosciences) was costained withthe Foxp3 staining in Foxp3 Perm buffer (eBioscience). Acquisition wasperformed uncompensated on a BD LSR II using BD FACSDiva software.Data were then exported as FCS 3.0 for compensation and analysis inFlowJo for Mac (always latest version up to 9.4.10; Tree Star). Normali-zation for mean fluorescence intensity (MFI) across multiple experiments:the average MFI of control samples was defined as an MFI of 1. All othervalues were normalized as fold difference to this average.
RNA preparation and microarray analysis
RNA samples for microarray were prepared with TRIzol (Invitrogen)according to the manufacturer’s instructions. RNA integrity was confirmedwith a Bioanalyzer 2100 (Agilent); only samples with a RIN $ 7.5 wereprocessed further. RNA samples for quantitative real-time PCR analysiswere extracted using the RNAeasy kit (Qiagen) using the manufacturer’srecommended protocol. The miRNA microarrays were miRCURY LNAmicroRNA arrays (Exiqon). miRNA array labeling, hybridization andscanning were performed at the University of California San Francisco(UCSF) Gladstone Genomics Core. Array data were analyzed usingGeneSpring GX software (Agilent). Raw data are available at Gene Ex-pression Omnibus (http://www.ncbi.nlm.nih.gov/geo/) with accessionnumber GSE36071.
Quantitative real-time PCR
For miRNAs, RNA was reverse transcribed using the TaqMan MicroRNAReverse Transcription Kit (Applied Biosystems) following the manufacturer’sinstructions. The reverse and forward primers as well as the probes used inthis step were designed as previously described (27) and obtained from In-tegrated DNA Technologies. Sequences can be found at http://urology.ucsf.edu/blellochlab/protocols/miRNAqPCRsequences.txt. The controls for thehuman and mouse samples were the small RNAs RNU24 and Sno234, re-spectively (Applied Biosystems).
For mRNAs RNA was reverse transcribed using the High Capacity cDNAReverse Transcription Kit (Applied Biosystems). A Dgcr8 primer/probe kitwas from Applied Biosystems. cDNAs were amplified with TaqMan FastReal-Time PCR Universal Master Mix (23), no AmpErase UNG (AppliedBiosystems) in the cycler system 7500 Fast Real-Time PCR system (Ap-plied Biosystems).
Mice
Conditional miR-17–92lox mice (7) were obtained from The JacksonLaboratory (Bar Harbor, ME). Foxp3-GFP-cre1ahi (Mouse Genome In-formatics [MGI], http://www.informatics.jax.org/: 4430213) (1), Pten lox(MGI: 3819698) (28), and Bim knockout (KO) (MGI: 2156498) (29) micehave been described previously. Mice were on a genetically mixed back-ground crossed to B6.miR-17–92lox to have at least 50% H-2b.
Isolation of mouse T cells
Single-cell suspensions were obtained from the spleen (Spl) and lymphnodes (LNs) of euthanized mice. Cells were washed and filtered beforebeing sorted on a Moflo (DakoCytomation) for CD4+CD62L+ cells andCD4+CD62L+Foxp3-GFP+ cells, as described previously (30). Cells wereactivated with plate-bound anti-mouse CD3 (clone 145-2C11) with orwithout anti-mouse CD28 (clone PV-1).
EAE induction
EAE was induced as described previously (31). Briefly, 200 mg myelinoligodendrocyte glycoprotein (MOG)35–55 peptide (Genemed Synthesis)emulsified in CFA (Sigma-Aldrich) was injected s.c. in each mouse. Micewere injected i.p. with pertussis toxin (400 ng/dose; List Biological Labs)on days 0 and 2 after immunization.
Tetramer staining and pulldown
APC-labeled mouse I-Ab myelin oligodendrocyte glycoprotein peptide 38–49 (GWYRSPFSRVVH) and I-Ab human class II–associated invariant
The Journal of Immunology 1595
by guest on May 28, 2018
http://ww
w.jim
munol.org/
Dow
nloaded from

chain peptide 103–117 (PVSKMRMATPLLMQA) as a negative control toset gates were from the Emory National Institutes of Health TetramerFacility (http://tetramer.yerkes.emory.edu/). MOG Tetramer staining andenrichment were done as described previously (32).
Lymphocyte isolation from CNS
Isolation of lymphocytes from the CNS was performed following a protocolmodified from Ref. 33. Briefly, anesthetized mice were perfused with ice-cold PBS through the left cardiac ventricle until the effluent ran clear.Spinal cord was blown out using hydrostatic pressure, and cerebellum andbrain stem were dissected, cut into pieces, and then digested at 37˚C for 30min with 320 U/ml collagenase D (Roche) and 50 mg/ml DNase I (Roche).Cells were separated from myelin by passing the digestion mix througha 40-mm Nytex strainer followed by a Percoll gradient (30/70%) (Amer-sham Biosciences). Mononuclear cells were removed from the interphase,washed, and resuspended in staining buffer for flow cytometry or cellculture media for restimulation.
Statistics
For statistical analysis Prism 5.0 (GraphPad Software) was used. *p# 0.05,**p # 0.01, ***p # 0.001, and ****p # 0.0001. Differences betweengroups were considered statistically significant if the null hypothesis wasrejected by a p value of #5%. No data points were excluded from theanalysis unless specified otherwise.
Study approval
Human blood. Informed written consent from healthy blood donors wasobtained in accordance with the reviewed and approved policies and pro-cedures at UCSF. Ethics approval was granted by the UCSF InstitutionalReview Board (approval number H7023-22712-08).
Mice. Mice used for all experiments were housed and bred under specificpathogen-free conditions in the Animal Barrier Facility of the UCSFAnimalBarrier Facility. All animal experiments were approved by the InstitutionalAnimal Care and Use Committee of UCSF (approval numbers AN083988-01 and AN082188-02).
ResultsmiR-17–92 is part of the CD28 costimulatory network
CD28 costimulatory signals and miRNAs are both critical for Tregfunction, but their interconnectivity has not been investigated inTregs. To study whether miRNAs are involved in T cell costim-ulation/activation, we generated a miRNA expression signaturefrom purified human naive conventional CD4+ T cells stimulatedwith anti-CD3 alone or anti-CD3 and anti-CD28 (SupplementalFig. 1). As previously reported, miR-155 was strongly upregulatedafter maximal activation with the combination of TCR/CD3 andCD28 stimulus. However, the majority of the upregulated miR-NAs were encoded by only three gene loci, all members of themiR-17–92 cluster and its paralogs. Quantitative PCR analysisconfirmed miR-17 upregulation (data not shown). To investigatethe functional relevance of CD28-mediated miR-17–92 upregu-lation, we turned our attention to murine T cells because of theavailability of a conditional gene ablation mouse model allowinga thorough in vivo analysis (7). miR-17, which is a unique rep-resentative miRNA of the miR-17–92 cluster, was markedly up-regulated in mouse naive CD4+ T cell samples stimulated with thecombination of anti-CD3 and anti-CD28 (Fig. 1A). miR-155 in-duction followed a similar CD28-dependent pattern. We observedlow-level induction of both miR-17–92 and miR-155 in somesamples stimulated with anti-CD3 alone. Kinetic analyses of miR-17 expression showed no change at 6 h poststimulation, but up-regulation was detected by 12 h poststimulation and further in-creased at 24 h when stimulated with the combination of anti-CD3and anti-CD28 (Fig. 1B). In addition, we examined the expressionof miR-17 specifically in the highly CD28 costimulation–depen-dent Treg subset. As in conventional T cells (Tconvs), anti-CD3stimulation alone neither induced miR-17 nor miR-155 (Fig. 1C).In contrast, combined anti-CD3 and CD28 triggering induced
miR-17 as well as miR-155 (Fig. 1C). We note that the relativeinduction of both miRNAs was smaller in Tregs than Tconvs.Because both cell types were activated using the same conditions,this most likely reflects the reduced activation potential of Foxp3expressing Treg in vitro.Mice with a T cell-specific lack of miR-17–92 had normal
numbers of Tconvs and Tregs and remained healthy as reportedpreviously (D. de Kouchkovsky, J.A. Bluestone, and L.T. Jeker,unpublished observations) (10). In contrast to Jiang et al. (10), weonly observed a minor proliferative disadvantage when the anti-CD28 signal was titrated but not with strong activation signals(34). Thus, miR-17–92 miRNAs are part of the costimulatorynetwork and are necessary for optimal CD28 costimulation andmaximal T cell activation under certain conditions.
Treg-specific miR-17–92 deficiency does not affect immunehomeostasis
To investigate the function of miR-17–92 in Treg in vivo, wecrossed the conditional miR-17–92 mice to Foxp3-GFP-hCre Tgmice (1). These mice, designated TregmiR-17–922/2, developed
FIGURE 1. miR-17–92 is part of the CD28 costimulatory network. (A)
Mouse miR-17 and miR-155 expression in purified Tconvs stimulated for
24 h with PBS, anti-CD3 (CD3) or a combination of anti-CD3 and
antiCD28 (CD3/CD28), presented relative to sno234 and normalized to
PBS. (B) Quantitative PCR time-course analysis of murine miR-17 ex-
pression relative to sno234. (C) Quantitative PCR on RNA from naive
murine CD4+CD25+CD62Lhi Tregs activated with the indicated conditions
for 24 h in vitro. Data are pooled from four (A), one (B), and four (C)
experiments with a total of eight individual mice (A), two mice (B), and six
individual mice (C), respectively; individual dots represent cells derived
from individual mice. (A) One-way ANOVA with a post hoc Bonferroni
multiple comparison test: p, 0.0001 (miR-17); p = 0.0001 (miR-155). (C)
Kruskal–Wallis test with post hoc Dunn’s multiple comparison test: p =
0.0045 (miR-17) and p = 0.0022 (miR-155).
1596 miR-17–92 CONTROLS Treg ACCUMULATION AND IL-10
by guest on May 28, 2018
http://ww
w.jim
munol.org/
Dow
nloaded from

normally, bred, and remained healthy up to 12 mo of age (data notshown). Aged TregmiR-17–922/2 mice had Treg frequencies andFoxp3 expression in LNs and Spl comparable to control litter-mates (Fig. 2A) and did not show any increase in activated CD4+
Foxp32CD44+CD62Llo cells (Fig. 2B). Thus, in contrast to ab-lation of all miRNAs, the miR-17–92 cluster is largely dispensablefor Tconvs (D. de Kouchkovsky, J.A. Bluestone, and L.T. Jeker,unpublished observations) and Tregs under homeostatic con-ditions, a finding similar to a previous report (10). This couldreflect redundancy of paralog miRNA clusters that compensate forloss of miR-17–92 expression or that the effects of miR-17–92deletion are only observed under stress conditions with endoge-nous Ags in vivo. This latter concept is supported by the generalagreement that miRNAs are considered fine-tuners of biologicprocesses forming a protective layer of regulatory elements ca-pable of stabilizing genetic networks under stress (35–38).
miR-17–92 expression is essential for Treg function during anautoimmune-mediated stress response
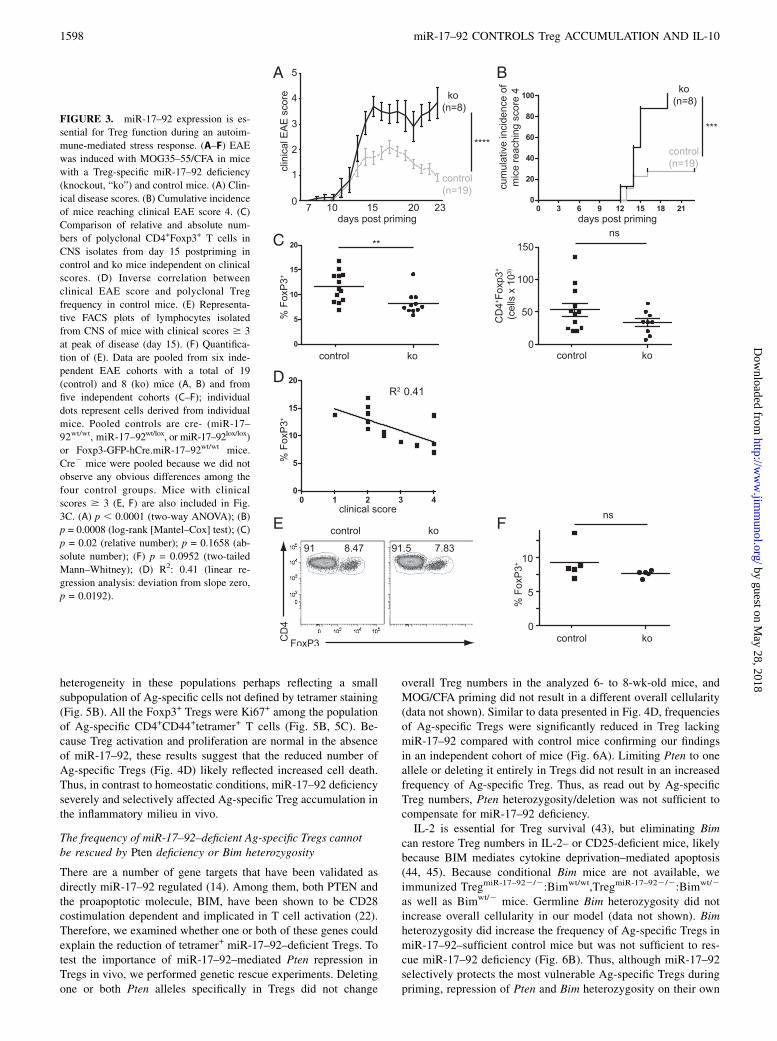
To assess TregmiR-17–922/2 function in a disease model that ishighly dependent on Tregs, we primed mice with MOG emulsifiedin CFA to induce EAE. miR-17–92 proved essential to Tregfunction in this model of acute autoimmune disease becauseTregmiR-17–922/2 mice developed much more severe disease andfailed to go into remission compared with control littermates (Fig.3A, 3B). The clinical disease course strikingly resembled clinicalEAE scores of mice with anti–CD25 Ab-mediated Treg depletion(39), indicating that Tregs may be absent or dysfunctional inTregmiR-17–922/2 mice. However, although polyclonal Treg fre-
quencies at peak of disease (day 15 postpriming) in CNS isolateswere mildly reduced, there was no difference in absolute numbersof Tregs in TregmiR-17–922/2 mice compared with control mice(Fig. 3C). Moreover, polyclonal Treg frequencies in control miceinversely correlated with clinical disease (Fig. 3D). Mice withsevere disease (clinical scores $ 3) showed no difference inpolyclonal Treg frequency between TregmiR-17–922/2 and controlmice (Fig. 3E, 3F). Therefore, we hypothesized that either Tregfunction must have been impaired or that a small subset, perhapsthe neural Ag-specific Tregs, were affected by miR-17–92 defi-ciency.
miR-17–92 preserves Ag-specific Tregs during priming in vivo
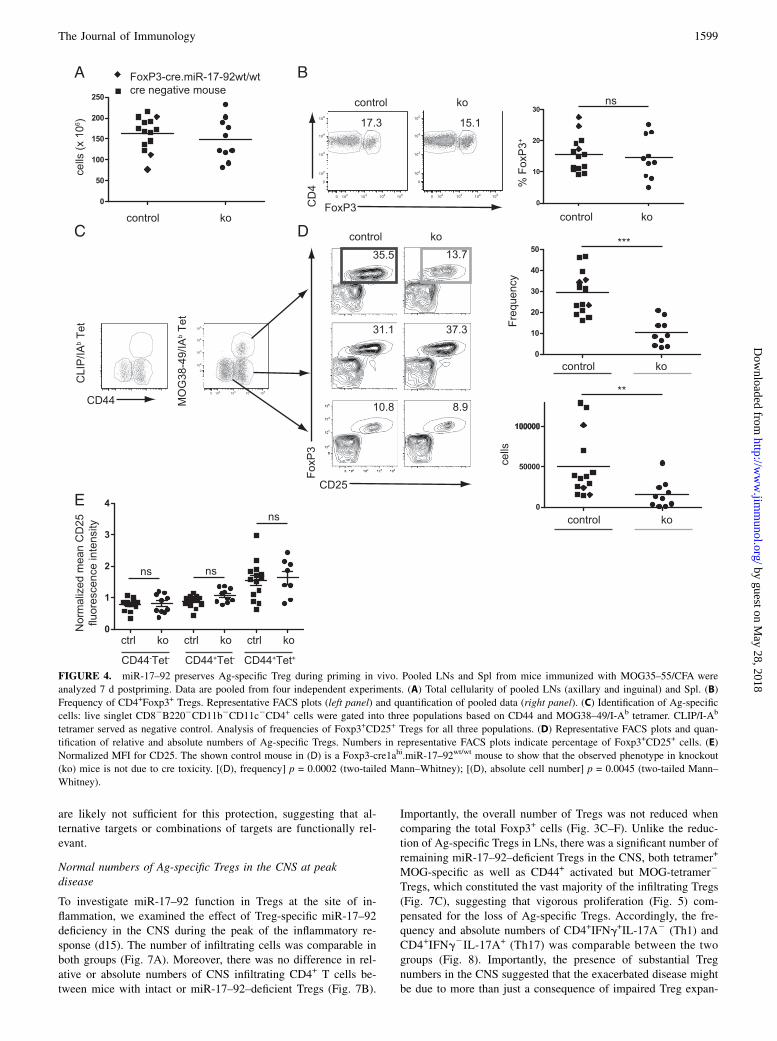
To avoid secondary effects because of inflammation, we studiedTregmiR-17–922/2 mice at day 7 post-MOG/CFA priming (i.e.,before onset of clinical disease) (Fig. 3A). At this time point,pooled LN and Spl cellularity were comparable between controland TregmiR-17–922/2 mice (Fig. 4A). We compared the results tomice that were either heterozygous or homozygous for the con-ditional miR-17–92 allele but lacking the Foxp3-GFP-hCre BAC(designated Cre-) as well as mice carrying the Foxp3-GFP-hCreBAC alone (miR-17–92 wild-type) to exclude artifacts because ofthe applied cre/loxP technology (40). We did not observe anyrelevant differences between the two control groups (Fig. 4A, 4B).The frequencies of Foxp3+ Tregs were comparable in control andTregmiR-17–922/2 mice (Fig. 4B). Thus, relative and absolutenumbers of polyclonal Tregs were comparable at day 7 post-priming (d7) in LNs and Spl and mildly reduced at day 15 in CNS.Next, we investigated whether the increased susceptibility ofTregmiR-17–922/2 mice to EAE could be a consequence of changesin Ag-specific Treg development. MOG38–49/I-Ab tetramers wereused to detect MOG-specific Treg in d7 LN and Spl (Fig. 4C) (32,33). We could not find any difference in the frequencies of Tconvsor Foxp3+CD25+ Tregs in naive CD4+CD442tetramer2 T cells orCD4+CD44+tetramer2 T cells (Fig. 4D). In contrast, TregmiR-17–922/2
mice had markedly reduced Ag-specific CD4+CD44+tetramer+
Treg/Tconv ratios than control mice (Fig. 4D). This was not dueto more conventional T cells (data not shown) but rather reflectedreduced absolute numbers of Ag-specific Tregs. miR-17–92–de-ficient Treg had normal expression of CD127, GITR, CD103, andNeuropilin-1 (Supplemental Fig. 2A–D) but showed a slight re-duction of CTLA-4 (Supplemental Fig. 2E). Ag-specific miR-17–92–deficient Tregs upregulated CD25 to the same degree as con-trol Tregs and greater than tetramer2 Tregs (Fig. 4E). Theseresults suggest that tetramer+ Tregs receive a stronger TCR signaland therefore display stronger activation. In this regard, CD69,another activation marker, was increased as well on miR-17–92–deficient Treg (Supplemental Fig. 2F) as previously observed inDicer-deficient CD8+ T cells (41). Bioinformatic analysis predictsmultiple miR-17–92 binding sites in the CD69 39-untranslatedregion (42), suggesting that the elevated CD69 in Tregs may bedue to direct derepression. Taken together, these results suggestthat the activation of Treg was not affected by the miR-17–92deficiency.
Normal proliferation of miR-17–92–deficient Tregs in vivo
On the basis of previous reports supporting a physiologic role formiR-17–92 in the enhancement of cell proliferation (14), we tookadvantage of Ki67 to measure the proliferation of Tregs at d7postpriming. Naive CD4+CD442tetramer2 Tconvs and Tregswere all nonproliferating Ki672 (Fig. 5B). MOG tetramer2
Tconvs and Tregs, expressing an activated CD44+ phenotype,displayed a bimodal Ki67 distribution (with Ki67+ cells repre-senting about half of the cells). These results suggested cellular
FIGURE 2. Treg-specific miR-17–92 deficiency does not affect immune
homeostasis. Relative numbers of CD4+Foxp3+ Tregs (A) and frequencies
of Ag-experienced CD4+CD44+CD62Llo conventional (Foxp32) T cells
(B) in 6- to 12-mo-old Foxp3cre.miR-17 92lox/lox and control mice. Rep-
resentative FACS plots of lymphocytes isolated from LNs (upper panels);
numbers indicate percentage of cells. Quantification of pooled mice from
two independent experiments for LNs and Spl (SP) (A, B; lower panels).
Two-tailed Mann–Whitney U test (A, B). Relative numbers of Foxp3+
Tregs: p = 0.3602 (LN); p = 0.1775 (SP). Relative numbers of CD44+
CD62Llo: p = 0.2468 (LN); p = 0.9307 (SP). ko, Knockout.
The Journal of Immunology 1597
by guest on May 28, 2018
http://ww
w.jim
munol.org/
Dow
nloaded from
heterogeneity in these populations perhaps reflecting a smallsubpopulation of Ag-specific cells not defined by tetramer staining(Fig. 5B). All the Foxp3+ Tregs were Ki67+ among the populationof Ag-specific CD4+CD44+tetramer+ T cells (Fig. 5B, 5C). Be-cause Treg activation and proliferation are normal in the absenceof miR-17–92, these results suggest that the reduced number ofAg-specific Tregs (Fig. 4D) likely reflected increased cell death.Thus, in contrast to homeostatic conditions, miR-17–92 deficiencyseverely and selectively affected Ag-specific Treg accumulation inthe inflammatory milieu in vivo.
The frequency of miR-17–92–deficient Ag-specific Tregs cannotbe rescued by Pten deficiency or Bim heterozygosity
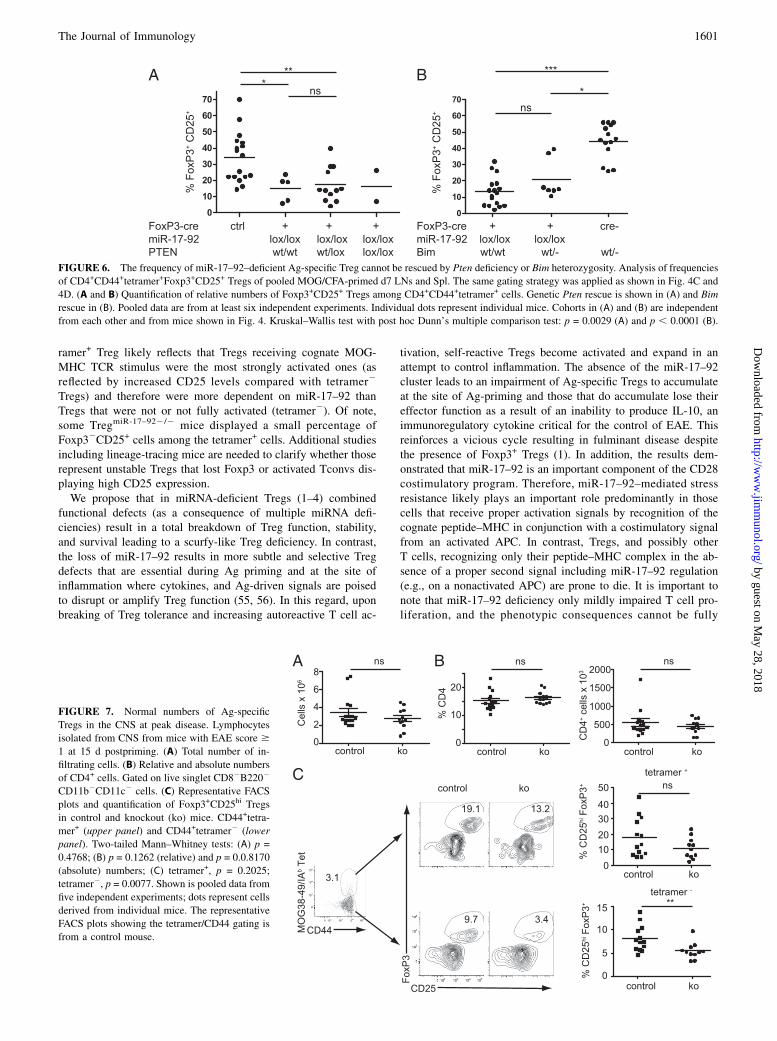
There are a number of gene targets that have been validated asdirectly miR-17–92 regulated (14). Among them, both PTEN andthe proapoptotic molecule, BIM, have been shown to be CD28costimulation dependent and implicated in T cell activation (22).Therefore, we examined whether one or both of these genes couldexplain the reduction of tetramer+ miR-17–92–deficient Tregs. Totest the importance of miR-17–92–mediated Pten repression inTregs in vivo, we performed genetic rescue experiments. Deletingone or both Pten alleles specifically in Tregs did not change
overall Treg numbers in the analyzed 6- to 8-wk-old mice, andMOG/CFA priming did not result in a different overall cellularity(data not shown). Similar to data presented in Fig. 4D, frequenciesof Ag-specific Tregs were significantly reduced in Treg lackingmiR-17–92 compared with control mice confirming our findingsin an independent cohort of mice (Fig. 6A). Limiting Pten to oneallele or deleting it entirely in Tregs did not result in an increasedfrequency of Ag-specific Treg. Thus, as read out by Ag-specificTreg numbers, Pten heterozygosity/deletion was not sufficient tocompensate for miR-17–92 deficiency.IL-2 is essential for Treg survival (43), but eliminating Bim
can restore Treg numbers in IL-2– or CD25-deficient mice, likelybecause BIM mediates cytokine deprivation–mediated apoptosis(44, 45). Because conditional Bim mice are not available, weimmunized TregmiR-17–922/2:Bimwt/wt,TregmiR-17–922/2:Bimwt/2
as well as Bimwt/2 mice. Germline Bim heterozygosity did notincrease overall cellularity in our model (data not shown). Bimheterozygosity did increase the frequency of Ag-specific Tregs inmiR-17–92–sufficient control mice but was not sufficient to res-cue miR-17–92 deficiency (Fig. 6B). Thus, although miR-17–92selectively protects the most vulnerable Ag-specific Tregs duringpriming, repression of Pten and Bim heterozygosity on their own
FIGURE 3. miR-17–92 expression is es-
sential for Treg function during an autoim-
mune-mediated stress response. (A–F) EAE
was induced with MOG35–55/CFA in mice
with a Treg-specific miR-17–92 deficiency
(knockout, “ko”) and control mice. (A) Clin-
ical disease scores. (B) Cumulative incidence
of mice reaching clinical EAE score 4. (C)
Comparison of relative and absolute num-
bers of polyclonal CD4+Foxp3+ T cells in
CNS isolates from day 15 postpriming in
control and ko mice independent on clinical
scores. (D) Inverse correlation between
clinical EAE score and polyclonal Treg
frequency in control mice. (E) Representa-
tive FACS plots of lymphocytes isolated
from CNS of mice with clinical scores $ 3
at peak of disease (day 15). (F) Quantifica-
tion of (E). Data are pooled from six inde-
pendent EAE cohorts with a total of 19
(control) and 8 (ko) mice (A, B) and from
five independent cohorts (C–F); individual
dots represent cells derived from individual
mice. Pooled controls are cre- (miR-17–
92wt/wt, miR-17–92wt/lox, or miR-17–92lox/lox)
or Foxp3-GFP-hCre.miR-17–92wt/wt mice.
Cre2 mice were pooled because we did not
observe any obvious differences among the
four control groups. Mice with clinical
scores $ 3 (E, F) are also included in Fig.
3C. (A) p , 0.0001 (two-way ANOVA); (B)
p = 0.0008 (log-rank [Mantel–Cox] test); (C)
p = 0.02 (relative number); p = 0.1658 (ab-
solute number); (F) p = 0.0952 (two-tailed
Mann–Whitney); (D) R2: 0.41 (linear re-
gression analysis: deviation from slope zero,
p = 0.0192).
1598 miR-17–92 CONTROLS Treg ACCUMULATION AND IL-10
by guest on May 28, 2018
http://ww
w.jim
munol.org/
Dow
nloaded from
are likely not sufficient for this protection, suggesting that al-ternative targets or combinations of targets are functionally rel-evant.
Normal numbers of Ag-specific Tregs in the CNS at peakdisease
To investigate miR-17–92 function in Tregs at the site of in-flammation, we examined the effect of Treg-specific miR-17–92deficiency in the CNS during the peak of the inflammatory re-sponse (d15). The number of infiltrating cells was comparable inboth groups (Fig. 7A). Moreover, there was no difference in rel-ative or absolute numbers of CNS infiltrating CD4+ T cells be-tween mice with intact or miR-17–92–deficient Tregs (Fig. 7B).
Importantly, the overall number of Tregs was not reduced whencomparing the total Foxp3+ cells (Fig. 3C–F). Unlike the reduc-tion of Ag-specific Tregs in LNs, there was a significant number ofremaining miR-17–92–deficient Tregs in the CNS, both tetramer+
MOG-specific as well as CD44+ activated but MOG-tetramer2
Tregs, which constituted the vast majority of the infiltrating Tregs(Fig. 7C), suggesting that vigorous proliferation (Fig. 5) com-pensated for the loss of Ag-specific Tregs. Accordingly, the fre-quency and absolute numbers of CD4+IFNg+IL-17A2 (Th1) andCD4+IFNg2IL-17A+ (Th17) was comparable between the twogroups (Fig. 8). Importantly, the presence of substantial Tregnumbers in the CNS suggested that the exacerbated disease mightbe due to more than just a consequence of impaired Treg expan-
FIGURE 4. miR-17–92 preserves Ag-specific Treg during priming in vivo. Pooled LNs and Spl from mice immunized with MOG35–55/CFA were
analyzed 7 d postpriming. Data are pooled from four independent experiments. (A) Total cellularity of pooled LNs (axillary and inguinal) and Spl. (B)
Frequency of CD4+Foxp3+ Tregs. Representative FACS plots (left panel) and quantification of pooled data (right panel). (C) Identification of Ag-specific
cells: live singlet CD82B2202CD11b2CD11c2CD4+ cells were gated into three populations based on CD44 and MOG38–49/I-Ab tetramer. CLIP/I-Ab
tetramer served as negative control. Analysis of frequencies of Foxp3+CD25+ Tregs for all three populations. (D) Representative FACS plots and quan-
tification of relative and absolute numbers of Ag-specific Tregs. Numbers in representative FACS plots indicate percentage of Foxp3+CD25+ cells. (E)
Normalized MFI for CD25. The shown control mouse in (D) is a Foxp3-cre1ahi.miR-17–92wt/wt mouse to show that the observed phenotype in knockout
(ko) mice is not due to cre toxicity. [(D), frequency] p = 0.0002 (two-tailed Mann–Whitney); [(D), absolute cell number] p = 0.0045 (two-tailed Mann–
Whitney).
The Journal of Immunology 1599
by guest on May 28, 2018
http://ww
w.jim
munol.org/
Dow
nloaded from

sion and accumulation but rather reflected defective Treg differ-entiation or function.
miR-17–92 regulates production of IL-10 by Foxp3+ Tregs
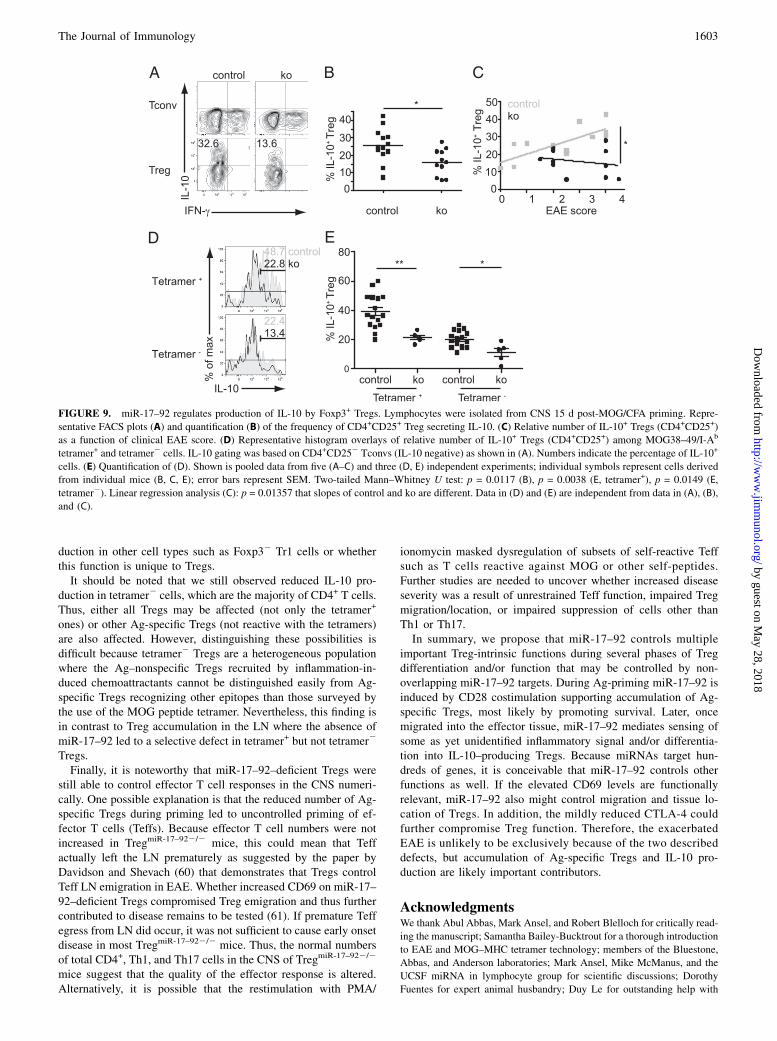
CD28-mediated costimulation is required for the production of theimmunosuppressive cytokine IL-10 in Tregs, an effect that is en-hanced by IL-2 (46). Because Treg-secreted IL-10 is a majormechanism of Treg-mediated control of EAE (25), we examinedthe role of miR-17–92 in IL-10 secretion by Tregs in the CNS atpeak disease. Although IL-10 was readily detected in Tregs (CD4+
CD25+ or CD4+GFP+) isolated from control mice (Fig. 9A),TregmiR-17–922/2 mice had reduced frequencies of IL-10–pro-ducing Tregs (Fig. 9A, 9B). Because the number of Tregs was
comparable in control and TregmiR-17–922/2 mice (Fig. 3C), a re-duced frequency of IL-10–producing Tregs also means a reducedabsolute number of IL-10–producing Tregs. The frequency of IL-10–producing control Tregs positively correlated with diseaseseverity. In contrast, the relative number of IL-10–producing miR-17–92–deficient Tregs, independently of clinical score, was com-parable to that in control mice with mild disease (Fig. 9C). Thereduction of IL-10–producing Tregs was even more apparentin the Ag-specific Tregs (Fig. 9D, 9E), demonstrating that thereduced frequency of IL-10–producing Tregs was not a conse-quence of reduced Ag-specific Treg but rather most likely re-flected defective differentiation into IL-10–producing effectorTregs (47).
DiscussionDespite evidence of the overall importance of miRNAs as regu-latory elements of Treg function and survival, very few individualmiRNAs have been characterized in Tregs in vivo (5). AlthoughDicer, Drosha, and Dgcr8 ablation in Tregs leads to spontaneousloss of tolerance and a scurfy-like disease (1–4), no single miRNAaccounting for an equally dramatic loss of Treg function whenablated specifically in Treg has been found yet. The direct Foxp3target bic/miR-155 facilitates IL-2 signaling and thus promotesTreg survival but is largely dispensable for Treg function (48, 49).miR-146a is required to suppress Th1-type inflammation in ahigh-stress setting, but its function under homeostatic conditionsremains to be determined (50). In this study, we observed that asingle miRNA cluster, miR-17–92, was upregulated during T cellactivation in a CD28 costimulation–dependent manner and had adramatic effect on the development of organ-specific autoimmu-nity. Specifically, miR-17–92 deficiency severely reduced thefrequency of Ag-specific Tregs in LNs during priming as well astheir quality in the effector tissue where miR-17–92 expression inTregs was required for IL-10 production.Like other miRNAs that are highly expressed in Tregs (e.g., miR-
155), we observed that the miR-17–92 cluster is largely dispens-able under homeostatic conditions. miRNAs are often considered“rheostats” or fine-tuners of mammalian gene expression as in-dividual miRNAs only mildly regulate their hundreds of simul-taneously targeted genes (35, 36). Accumulating observationssuggest that miRNA rheostat function may only be revealed aftera cell has to respond to a change in its environment (i.e., a specificstress) (37, 38, 51). In fact, most individual miRNAs (52) and evenmany miRNA families altogether (53) are dispensable under ho-meostatic conditions, indicating that a certain degree of fluctuationor imprecision of gene expression is well tolerated. In contrast, allcomponents of a genetic network need to be optimally regulatedduring stress. Therefore, stress stimuli can reveal underappreci-ated miRNA functions (54).T cell activation induces a specific stress response (17), and
therefore, Ag challenge can serve as a model of a specific, tem-porally controlled stress stimulus in vivo. The prototypical co-stimulatory molecule CD28 promotes proliferation and survivalbut, in addition, induces metabolic changes that are not simplya consequence of T cell activation but are active and excessiveprocesses anticipating increased energy needs ensuring that theactivated cells can cope with the induced stress (18). Therefore,we used peptide–MHC tetramers to track Ag-specific (tetramer+)Tregs arising during a major stress response in vivo (autoimmu-nity) comparing them to tetramer2 cells in the same autoimmunesetting. Of note, although the total Treg population was miR-17–92 deficient, the effect of miR-17–92 disruption was selectivelyobserved in the MOG Ag-specific Tregs where it directly affectedTreg numbers during activation. The selective defect in the tet-
FIGURE 5. Normal proliferation of miR-17–92–deficient Treg in vivo.
Data are from the same experiments as shown in Fig. 4 but analyzing the
proliferation marker, Ki67. (A) Gating strategy to define tetramer+ T cells.
Numbers indicate the frequencies of cells in each gate for the shown
representative graph of the control mouse shown in (B). (B) Representative
FACS plots of the three populations shown in (A). Numbers below FACS
plots indicate frequencies of cells in each quadrant. (C) Quantification of
pooled data of the relative number of Ki67+Foxp3+ Tregs. Gated on CD44+
tetramer+ T cells. Data are representative of four independent experiments;
individual dots represent cells derived from individual mice.
1600 miR-17–92 CONTROLS Treg ACCUMULATION AND IL-10
by guest on May 28, 2018
http://ww
w.jim
munol.org/
Dow
nloaded from
ramer+ Treg likely reflects that Tregs receiving cognate MOG-MHC TCR stimulus were the most strongly activated ones (asreflected by increased CD25 levels compared with tetramer2
Tregs) and therefore were more dependent on miR-17–92 thanTregs that were not or not fully activated (tetramer2). Of note,some TregmiR-17–922/2 mice displayed a small percentage ofFoxp32CD25+ cells among the tetramer+ cells. Additional studiesincluding lineage-tracing mice are needed to clarify whether thoserepresent unstable Tregs that lost Foxp3 or activated Tconvs dis-playing high CD25 expression.We propose that in miRNA-deficient Tregs (1–4) combined
functional defects (as a consequence of multiple miRNA defi-ciencies) result in a total breakdown of Treg function, stability,and survival leading to a scurfy-like Treg deficiency. In contrast,the loss of miR-17–92 results in more subtle and selective Tregdefects that are essential during Ag priming and at the site ofinflammation where cytokines, and Ag-driven signals are poisedto disrupt or amplify Treg function (55, 56). In this regard, uponbreaking of Treg tolerance and increasing autoreactive T cell ac-
tivation, self-reactive Tregs become activated and expand in anattempt to control inflammation. The absence of the miR-17–92cluster leads to an impairment of Ag-specific Tregs to accumulateat the site of Ag-priming and those that do accumulate lose theireffector function as a result of an inability to produce IL-10, animmunoregulatory cytokine critical for the control of EAE. Thisreinforces a vicious cycle resulting in fulminant disease despitethe presence of Foxp3+ Tregs (1). In addition, the results dem-onstrated that miR-17–92 is an important component of the CD28costimulatory program. Therefore, miR-17–92–mediated stressresistance likely plays an important role predominantly in thosecells that receive proper activation signals by recognition of thecognate peptide–MHC in conjunction with a costimulatory signalfrom an activated APC. In contrast, Tregs, and possibly otherT cells, recognizing only their peptide–MHC complex in the ab-sence of a proper second signal including miR-17–92 regulation(e.g., on a nonactivated APC) are prone to die. It is important tonote that miR-17–92 deficiency only mildly impaired T cell pro-liferation, and the phenotypic consequences cannot be fully
FIGURE 6. The frequency of miR-17–92–deficient Ag-specific Treg cannot be rescued by Pten deficiency or Bim heterozygosity. Analysis of frequencies
of CD4+CD44+tetramer+Foxp3+CD25+ Tregs of pooled MOG/CFA-primed d7 LNs and Spl. The same gating strategy was applied as shown in Fig. 4C and
4D. (A and B) Quantification of relative numbers of Foxp3+CD25+ Tregs among CD4+CD44+tetramer+ cells. Genetic Pten rescue is shown in (A) and Bim
rescue in (B). Pooled data are from at least six independent experiments. Individual dots represent individual mice. Cohorts in (A) and (B) are independent
from each other and from mice shown in Fig. 4. Kruskal–Wallis test with post hoc Dunn’s multiple comparison test: p = 0.0029 (A) and p , 0.0001 (B).
FIGURE 7. Normal numbers of Ag-specific
Tregs in the CNS at peak disease. Lymphocytes
isolated from CNS from mice with EAE score $
1 at 15 d postpriming. (A) Total number of in-
filtrating cells. (B) Relative and absolute numbers
of CD4+ cells. Gated on live singlet CD82B2202
CD11b2CD11c2 cells. (C) Representative FACS
plots and quantification of Foxp3+CD25hi Tregs
in control and knockout (ko) mice. CD44+tetra-
mer+ (upper panel) and CD44+tetramer2 (lower
panel). Two-tailed Mann–Whitney tests: (A) p =
0.4768; (B) p = 0.1262 (relative) and p = 0.0.8170
(absolute) numbers; (C) tetramer+, p = 0.2025;
tetramer2, p = 0.0077. Shown is pooled data from
five independent experiments; dots represent cells
derived from individual mice. The representative
FACS plots showing the tetramer/CD44 gating is
from a control mouse.
The Journal of Immunology 1601
by guest on May 28, 2018
http://ww
w.jim
munol.org/
Dow
nloaded from

accounted for by miR-17–92 control of PTEN or BIM pathways.Although normal proliferation but reduced cell numbers suggestcell death, we were not able to define which cell death pathwaywas activated. Despite our findings that neither Pten deficiencynor Bim heterozygosity were sufficient to restore Treg survival inthe absence of miR-17–92, it is possible that their repression isfunctionally relevant in other cell types for other functions such asIL-10 secretion or through cooperation with other targets. As anexample, during follicular Th cell differentiation Pten is a minorfunctionally relevant target (34). Likewise, because the miR-17–92 cluster is redundant, it is possible that the paralog clusters miR-106a–363 and miR-106b–25 compensated to maintain prolifera-tive capacity. However, in our model, the paralog clusters did notcompensate for loss of miR-17–92 to produce IL-10.Requirements for costimulation are cell-type and differentiation
stage dependent, and costimulation can have different or evenopposing roles for an immune response depending on the cell typethat is stimulated (19). In this regard, it is interesting to note thatthe expression of the miR-17–92 cluster opposes TGF-b–medi-ated iTreg induction in vitro (10). In contrast, we observed just theopposite in natural Tregs, namely, that the expression of miR-17–92 is critical in maintaining this subset during an autoimmuneresponse in vivo. This conundrum may be explained by the ob-servation that strong costimulation has distinct effects on naturalversus adaptive Treg induction wherein the former has a criticalrequirement for maximal TCR/costimulation signaling, whereasthe latter subset of Tregs appear to develop and are maintained bya more limited TCR/CD28 signal (57). Absence of miR-17–92,leading to an attenuated CD28 signal, would therefore result inincreased TGF-b–mediated iTreg induction (10). In addition, in-creased sensitivity to TGF-b (10, 58) in combination with reducedcostimulation likely cooperates to promote Foxp3 induction inmiR-17–92–deficient T cells. Future studies will need to addresshow miR-17–92 differentially affects natural versus adaptive Tregsand whether miR-17–92 has further opposing functions in other
cell types or functional states, possibly because of other factorssuch as retinoic acid (57) or cytokines.During the course of EAE, Treg-secreted IL-10 is key to the
control of disease as adoptively transferred IL-10–deficient Tregsfail to suppress EAE (25). The production of IL-10 by Tregs isdynamic, peaking during recovery where almost half of the Tregsin the CNS produce IL-10 (33). Of note, IL-10 production byTregs is tissue dependent because CD4+CD25+ cells in LNs pro-duce much less IL-10 than their CNS Treg counterparts isolatedfrom the same mice (39). Thus, CNS Tregs likely adapt to theirenvironment by sensing a signal such as a cytokine absent in theLN and respond with IL-10 secretion. Supporting this notion, weobserved a positive correlation between clinical score and fre-quency of IL-10–producing Tregs in control mice, suggestinga feed forward loop in response to inflammation. The higherfrequency of IL-10+ Tregs among Ag-specific Tregs comparedwith tetramer2 Tregs most likely represents activation of Ag-specific Tregs (reflected by higher CD25 expression). There aremultiple scenarios that might explain why miR-17–92–deficientTregs produce less IL-10: 1) miR-17–92 might be required for IL-10 production per se; 2) miR-17–92 could regulate the positivefeedback loop and/or; 3) miR-17–92 could be required for thedifferentiation of Tregs into IL-10–producing effector Treg (47).We have recently demonstrated that miR-17–92 plays a minor rolepromoting proliferation but is required for proper follicular Th celldifferentiation. Furthermore, follicular Th cell but not polyclonalTreg numbers correlated strongly with miR-17–92 dose (34).Importantly, follicular regulatory T cells are enriched in IL-10mRNA compared with conventional Tregs (59). In analogy, wehypothesize that the most likely explanation for the IL-10 defect isimpaired differentiation. Because differentiation into IL-10–pro-ducing effector Tregs in tissues is mediated by Blimp-1 and IFNregulatory factor 4, future studies will need to address whethermiR-17–92 regulates these genes directly or indirectly (47). Itremains to be tested whether miR-17–92 regulates IL-10 pro-
FIGURE 8. No detectable differences in Th1 and Th17 effector functions. Lymphocytes isolated from CNS from mice with EAE score $ 1 at 15 d
postpriming. (A) Representative flow cytometry plots. Numbers below graphs represent frequencies of cells in each quadrant. (B) Quantification of relative
and absolute numbers of Th1 (live singlet CD4+IFNg+IL-17A2) and Th17 (live singlet CD4+IFNg2IL-17A+) cells as defined in (A). Pooled data from five
or more experiments; dots represent cells derived from individual mice. Two-tailed Mann–Whitney tests: (B) p = 0.1142 (relative number of Th1); p =
0.0726 (relative number of Th17); p = 0.8590 (absolute number of Th1); p = 0.7894 (absolute number of Th17).
1602 miR-17–92 CONTROLS Treg ACCUMULATION AND IL-10
by guest on May 28, 2018
http://ww
w.jim
munol.org/
Dow
nloaded from
duction in other cell types such as Foxp32 Tr1 cells or whetherthis function is unique to Tregs.It should be noted that we still observed reduced IL-10 pro-
duction in tetramer2 cells, which are the majority of CD4+ T cells.Thus, either all Tregs may be affected (not only the tetramer+
ones) or other Ag-specific Tregs (not reactive with the tetramers)are also affected. However, distinguishing these possibilities isdifficult because tetramer2 Tregs are a heterogeneous populationwhere the Ag–nonspecific Tregs recruited by inflammation-in-duced chemoattractants cannot be distinguished easily from Ag-specific Tregs recognizing other epitopes than those surveyed bythe use of the MOG peptide tetramer. Nevertheless, this finding isin contrast to Treg accumulation in the LN where the absence ofmiR-17–92 led to a selective defect in tetramer+ but not tetramer2
Tregs.Finally, it is noteworthy that miR-17–92–deficient Tregs were
still able to control effector T cell responses in the CNS numeri-cally. One possible explanation is that the reduced number of Ag-specific Tregs during priming led to uncontrolled priming of ef-fector T cells (Teffs). Because effector T cell numbers were notincreased in TregmiR-17–922/2 mice, this could mean that Teffactually left the LN prematurely as suggested by the paper byDavidson and Shevach (60) that demonstrates that Tregs controlTeff LN emigration in EAE. Whether increased CD69 on miR-17–92–deficient Tregs compromised Treg emigration and thus furthercontributed to disease remains to be tested (61). If premature Teffegress from LN did occur, it was not sufficient to cause early onsetdisease in most TregmiR-17–922/2 mice. Thus, the normal numbersof total CD4+, Th1, and Th17 cells in the CNS of TregmiR-17–922/2
mice suggest that the quality of the effector response is altered.Alternatively, it is possible that the restimulation with PMA/
ionomycin masked dysregulation of subsets of self-reactive Teffsuch as T cells reactive against MOG or other self-peptides.Further studies are needed to uncover whether increased diseaseseverity was a result of unrestrained Teff function, impaired Tregmigration/location, or impaired suppression of cells other thanTh1 or Th17.In summary, we propose that miR-17–92 controls multiple
important Treg-intrinsic functions during several phases of Tregdifferentiation and/or function that may be controlled by non-overlapping miR-17–92 targets. During Ag-priming miR-17–92 isinduced by CD28 costimulation supporting accumulation of Ag-specific Tregs, most likely by promoting survival. Later, oncemigrated into the effector tissue, miR-17–92 mediates sensing ofsome as yet unidentified inflammatory signal and/or differentia-tion into IL-10–producing Tregs. Because miRNAs target hun-dreds of genes, it is conceivable that miR-17–92 controls otherfunctions as well. If the elevated CD69 levels are functionallyrelevant, miR-17–92 also might control migration and tissue lo-cation of Tregs. In addition, the mildly reduced CTLA-4 couldfurther compromise Treg function. Therefore, the exacerbatedEAE is unlikely to be exclusively because of the two describeddefects, but accumulation of Ag-specific Tregs and IL-10 pro-duction are likely important contributors.
AcknowledgmentsWe thank Abul Abbas, Mark Ansel, and Robert Blelloch for critically read-
ing the manuscript; Samantha Bailey-Bucktrout for a thorough introduction
to EAE and MOG–MHC tetramer technology; members of the Bluestone,
Abbas, and Anderson laboratories; Mark Ansel, Mike McManus, and the
UCSF miRNA in lymphocyte group for scientific discussions; Dorothy
Fuentes for expert animal husbandry; Duy Le for outstanding help with
FIGURE 9. miR-17–92 regulates production of IL-10 by Foxp3+ Tregs. Lymphocytes were isolated from CNS 15 d post-MOG/CFA priming. Repre-
sentative FACS plots (A) and quantification (B) of the frequency of CD4+CD25+ Treg secreting IL-10. (C) Relative number of IL-10+ Tregs (CD4+CD25+)
as a function of clinical EAE score. (D) Representative histogram overlays of relative number of IL-10+ Tregs (CD4+CD25+) among MOG38–49/I-Ab
tetramer+ and tetramer2 cells. IL-10 gating was based on CD4+CD252 Tconvs (IL-10 negative) as shown in (A). Numbers indicate the percentage of IL-10+
cells. (E) Quantification of (D). Shown is pooled data from five (A–C) and three (D, E) independent experiments; individual symbols represent cells derived
from individual mice (B, C, E); error bars represent SEM. Two-tailed Mann–Whitney U test: p = 0.0117 (B), p = 0.0038 (E, tetramer+), p = 0.0149 (E,
tetramer2). Linear regression analysis (C): p = 0.01357 that slopes of control and ko are different. Data in (D) and (E) are independent from data in (A), (B),
and (C).
The Journal of Immunology 1603
by guest on May 28, 2018
http://ww
w.jim
munol.org/
Dow
nloaded from
genotyping; Navdeep Grewal and Una Fan for help with histology; Shuwei
Jiang and Mike Lee for cell sorting; Haopeng Wang for providing an
optimized IL-10 staining protocol; the Emory National Institutes of Health
Tetramer facility for tetramers (http://tetramer.yerkes.emory.edu/facility/
facility); Chris Barker and Yanxia Hao from the UCSF Gladstone
Genomics Core for miRNA array; and Dr. Tak Mak (University Health
Network, Toronto, ON, Canada) for PTENlox mice.
DisclosuresThe authors have no financial conflicts of interest.
References1. Zhou, X., L. T. Jeker, B. T. Fife, S. Zhu, M. S. Anderson, M. T. McManus, and
J. A. Bluestone. 2008. Selective miRNA disruption in Treg cells leads to un-controlled autoimmunity. J. Exp. Med. 205: 1983–1991.
2. Chong, M. M., J. P. Rasmussen, A. Y. Rudensky, and D. R. Littman. 2008. TheRNAseIII enzyme Drosha is critical in T cells for preventing lethal inflammatorydisease. J. Exp. Med. 205: 2005–2017.
3. Liston, A., L. F. Lu, D. O’Carroll, A. Tarakhovsky, and A. Y. Rudensky. 2008.Dicer-dependent microRNA pathway safeguards regulatory T cell function. J.Exp. Med. 205: 1993–2004.
4. Jeker, L. T., X. Zhou, R. Blelloch, and J. A. Bluestone. 2013. DGCR8-mediatedproduction of canonical micrornas is critical for regulatory T cell function andstability. PLoS One DOI: 10.1371/journal.pone.0066282.
5. Jeker, L. T., and J. A. Bluestone. 2013. MicroRNA regulation of T-cell differ-entiation and function. Immunol. Rev. 253: 65–81.
6. He, L., J. M. Thomson, M. T. Hemann, E. Hernando-Monge, D. Mu, S. Goodson,S. Powers, C. Cordon-Cardo, S. W. Lowe, G. J. Hannon, and S. M. Hammond.2005. A microRNA polycistron as a potential human oncogene. Nature 435:828–833.
7. Ventura, A., A. G. Young, M. M. Winslow, L. Lintault, A. Meissner,S. J. Erkeland, J. Newman, R. T. Bronson, D. Crowley, J. R. Stone, et al. 2008.Targeted deletion reveals essential and overlapping functions of the miR-17through 92 family of miRNA clusters. Cell 132: 875–886.
8. Mendell, J. T. 2008. miRiad roles for the miR-17-92 cluster in development anddisease. Cell 133: 217–222.
9. de Pontual, L., E. Yao, P. Callier, L. Faivre, V. Drouin, S. Cariou, A. Van Haeringen,D. Genevieve, A. Goldenberg, M. Oufadem, et al. 2011. Germline deletion of themiR-17∼92 cluster causes skeletal and growth defects in humans. Nat. Genet. 43:1026–1030.
10. Jiang, S., C. Li, V. Olive, E. Lykken, F. Feng, J. Sevilla, Y. Wan, L. He, andQ. J. Li. 2011. Molecular dissection of the miR-17-92 cluster’s critical dual rolesin promoting Th1 responses and preventing inducible Treg differentiation. Blood118: 5487–5497.
11. Wu, T., A. Wieland, K. Araki, C. W. Davis, L. Ye, J. S. Hale, and R. Ahmed.2012. Temporal expression of microRNA cluster miR-17-92 regulates effectorand memory CD8+ T-cell differentiation. Proc. Natl. Acad. Sci. USA 109: 9965–9970.
12. Barski, A., R. Jothi, S. Cuddapah, K. Cui, T. Y. Roh, D. E. Schones, and K. Zhao.2009. Chromatin poises miRNA- and protein-coding genes for expression. Ge-nome Res. 19: 1742–1751.
13. Sandberg, R., J. R. Neilson, A. Sarma, P. A. Sharp, and C. B. Burge. 2008.Proliferating cells express mRNAs with shortened 39 untranslated regions andfewer microRNA target sites. Science 320: 1643–1647.
14. Xiao, C., L. Srinivasan, D. P. Calado, H. C. Patterson, B. Zhang, J. Wang,J. M. Henderson, J. L. Kutok, and K. Rajewsky. 2008. Lymphoproliferativedisease and autoimmunity in mice with increased miR-17-92 expression inlymphocytes. Nat. Immunol. 9: 405–414.
15. Tufekci, K. U., M. G. Oner, S. Genc, and K. Genc. 2011. MicroRNAs andmultiple sclerosis. Autoimmune Dis. 2011: 807426.
16. Junker, A., R. Hohlfeld, and E. Meinl. 2011. The emerging role of microRNAs inmultiple sclerosis. Nat. Rev. Neurol. 7: 56–59.
17. Scheu, S., D. B. Stetson, R. L. Reinhardt, J. H. Leber, M. Mohrs, andR. M. Locksley. 2006. Activation of the integrated stress response during Thelper cell differentiation. Nat. Immunol. 7: 644–651.
18. Frauwirth, K. A., J. L. Riley, M. H. Harris, R. V. Parry, J. C. Rathmell, D. R. Plas,R. L. Elstrom, C. H. June, and C. B. Thompson. 2002. The CD28 signalingpathway regulates glucose metabolism. Immunity 16: 769–777.
19. Bour-Jordan, H., J. H. Esensten, M. Martinez-Llordella, C. Penaranda,M. Stumpf, and J. A. Bluestone. 2011. Intrinsic and extrinsic control of pe-ripheral T-cell tolerance by costimulatory molecules of the CD28/B7 family.Immunol. Rev. 241: 180–205.
20. Bour-Jordan, H., and J. A. Bluestone. 2009. Regulating the regulators: costim-ulatory signals control the homeostasis and function of regulatory T cells.Immunol. Rev. 229: 41–66.
21. Salomon, B., D. J. Lenschow, L. Rhee, N. Ashourian, B. Singh, A. Sharpe, andJ. A. Bluestone. 2000. B7/CD28 costimulation is essential for the homeostasis ofthe CD4+CD25+ immunoregulatory T cells that control autoimmune diabetes.Immunity 12: 431–440.
22. Buckler, J. L., P. T. Walsh, P. M. Porrett, Y. Choi, and L. A. Turka. 2006. Cuttingedge: T cell requirement for CD28 costimulation is due to negative regulation ofTCR signals by PTEN. J. Immunol. 177: 4262–4266.
23. Tang, Q., and J. A. Bluestone. 2008. The Foxp3+ regulatory T cell: a jack of alltrades, master of regulation. Nat. Immunol. 9: 239–244.
24. Rubtsov, Y. P., J. P. Rasmussen, E. Y. Chi, J. Fontenot, L. Castelli, X. Ye,P. Treuting, L. Siewe, A. Roers, W. R. Henderson, Jr., et al. 2008. RegulatoryT cell-derived interleukin-10 limits inflammation at environmental interfaces.Immunity 28: 546–558.
25. Zhang, X., D. N. Koldzic, L. Izikson, J. Reddy, R. F. Nazareno, S. Sakaguchi,V. K. Kuchroo, and H. L. Weiner. 2004. IL-10 is involved in the suppression ofexperimental autoimmune encephalomyelitis by CD25+CD4+ regulatory T cells.Int. Immunol. 16: 249–256.
26. Putnam, A. L., T. M. Brusko, M. R. Lee, W. Liu, G. L. Szot, T. Ghosh,M. A. Atkinson, and J. A. Bluestone. 2009. Expansion of human regulatory T-cells from patients with type 1 diabetes. Diabetes 58: 652–662.
27. Moltzahn, F., A. B. Olshen, L. Baehner, A. Peek, L. Fong, H. Stoppler, J. Simko,J. F. Hilton, P. Carroll, and R. Blelloch. 2011. Microfluidic-based multiplex qRT-PCR identifies diagnostic and prognostic microRNA signatures in the sera ofprostate cancer patients. Cancer Res. 71: 550–560.
28. Suzuki, A., M. T. Yamaguchi, T. Ohteki, T. Sasaki, T. Kaisho, Y. Kimura,R. Yoshida, A. Wakeham, T. Higuchi, M. Fukumoto, et al. 2001. T cell-specificloss of Pten leads to defects in central and peripheral tolerance. Immunity 14:523–534.
29. Bouillet, P., D. Metcalf, D. C. Huang, D. M. Tarlinton, T. W. Kay, F. Kontgen,J. M. Adams, and A. Strasser. 1999. Proapoptotic Bcl-2 relative Bim required forcertain apoptotic responses, leukocyte homeostasis, and to preclude autoimmu-nity. Science 286: 1735–1738.
30. Tang, Q., K. J. Henriksen, M. Bi, E. B. Finger, G. Szot, J. Ye, E. L. Masteller,H. McDevitt, M. Bonyhadi, and J. A. Bluestone. 2004. In vitro-expandedantigen-specific regulatory T cells suppress autoimmune diabetes. J. Exp. Med.199: 1455–1465.
31. Melton, A. C., S. L. Bailey-Bucktrout, M. A. Travis, B. T. Fife, J. A. Bluestone,and D. Sheppard. 2010. Expression of avb8 integrin on dendritic cells regulatesTh17 cell development and experimental autoimmune encephalomyelitis inmice. J. Clin. Invest. 120: 4436–4444.
32. Moon, J. J., H. H. Chu, M. Pepper, S. J. McSorley, S. C. Jameson, R. M. Kedl,and M. K. Jenkins. 2007. Naive CD4+ T cell frequency varies for differentepitopes and predicts repertoire diversity and response magnitude. Immunity 27:203–213.
33. Korn, T., J. Reddy, W. Gao, E. Bettelli, A. Awasthi, T. R. Petersen,B. T. Backstrom, R. A. Sobel, K. W. Wucherpfennig, T. B. Strom, et al. 2007.Myelin-specific regulatory T cells accumulate in the CNS but fail to controlautoimmune inflammation. Nat. Med. 13: 423–431.
34. Baumjohann, D., R. Kageyama, J. M. Clingan, M. M. Morar, S. Patel,D. de Kouchkovsky, O. Bannard, J. A. Bluestone, M. Matloubian, K. M. Ansel,and L. T. Jeker. 2013. The microRNA cluster miR-17~92 promotes TFH celldifferentiation and represses subset-inappropriate gene expression. Nat. Immu-nol. DOI: 10.1038/ni.2642.
35. Selbach, M., B. Schwanhausser, N. Thierfelder, Z. Fang, R. Khanin, andN. Rajewsky. 2008. Widespread changes in protein synthesis induced bymicroRNAs. Nature 455: 58–63.
36. Baek, D., J. Villen, C. Shin, F. D. Camargo, S. P. Gygi, and D. P. Bartel. 2008.The impact of microRNAs on protein output. Nature 455: 64–71.
37. Leung, A. K., and P. A. Sharp. 2007. microRNAs: a safeguard against turmoil?Cell 130: 581–585.
38. Leung, A. K., and P. A. Sharp. 2010. MicroRNA functions in stress responses.Mol. Cell 40: 205–215.
39. McGeachy, M. J., L. A. Stephens, and S. M. Anderton. 2005. Natural recoveryand protection from autoimmune encephalomyelitis: contribution of CD4+
CD25+ regulatory cells within the central nervous system. J. Immunol. 175:3025–3032.
40. Schmidt-Supprian, M., and K. Rajewsky. 2007. Vagaries of conditional genetargeting. Nat. Immunol. 8: 665–668.
41. Zhang, N., and M. J. Bevan. 2010. Dicer controls CD8+ T-cell activation, mi-gration, and survival. Proc. Natl. Acad. Sci. USA 107: 21629–21634.
42. Friedman, R. C., K. K. Farh, C. B. Burge, and D. P. Bartel. 2009. Most mam-malian mRNAs are conserved targets of microRNAs. Genome Res. 19: 92–105.
43. Malek, T. R., and A. L. Bayer. 2004. Tolerance, not immunity, crucially dependson IL-2. Nat. Rev. Immunol. 4: 665–674.
44. Barron, L., H. Dooms, K. K. Hoyer, W. Kuswanto, J. Hofmann,W. E. O’Gorman, and A. K. Abbas. 2010. Cutting edge: mechanisms of IL-2‑dependent maintenance of functional regulatory T cells. J. Immunol. 185:6426–6430.
45. Strasser, A. 2005. The role of BH3-only proteins in the immune system. Nat.Rev. Immunol. 5: 189–200.
46. Park, S. G., R. Mathur, M. Long, N. Hosh, L. Hao, M. S. Hayden, and S. Ghosh.2010. T regulatory cells maintain intestinal homeostasis by suppressing gdT cells. Immunity 33: 791–803.
47. Cretney, E., A. Xin, W. Shi, M. Minnich, F. Masson, M. Miasari, G. T. Belz,G. K. Smyth, M. Busslinger, S. L. Nutt, and A. Kallies. 2011. The transcriptionfactors Blimp-1 and IRF4 jointly control the differentiation and function of ef-fector regulatory T cells. Nat. Immunol. 12: 304–311.
48. Lu, L. F., T. H. Thai, D. P. Calado, A. Chaudhry, M. Kubo, K. Tanaka,G. B. Loeb, H. Lee, A. Yoshimura, K. Rajewsky, and A. Y. Rudensky. 2009.Foxp3-dependent microRNA155 confers competitive fitness to regulatory T cellsby targeting SOCS1 protein. Immunity 30: 80–91.
49. Kohlhaas, S., O. A. Garden, C. Scudamore, M. Turner, K. Okkenhaug, andE. Vigorito. 2009. Cutting edge: the Foxp3 target miR-155 contributes to thedevelopment of regulatory T cells. J. Immunol. 182: 2578–2582.
1604 miR-17–92 CONTROLS Treg ACCUMULATION AND IL-10
by guest on May 28, 2018
http://ww
w.jim
munol.org/
Dow
nloaded from
50. Lu, L. F., M. P. Boldin, A. Chaudhry, L. L. Lin, K. D. Taganov, T. Hanada,A. Yoshimura, D. Baltimore, and A. Y. Rudensky. 2010. Function of miR-146a incontrolling Treg cell-mediated regulation of Th1 responses. Cell 142: 914–929.
51. Jeker, L. T., and J. A. Bluestone. 2010. Small RNA regulators of T cell-mediatedautoimmunity. J. Clin. Immunol. 30: 347–357.
52. Miska, E. A., E. Alvarez-Saavedra, A. L. Abbott, N. C. Lau, A. B. Hellman,S. M. McGonagle, D. P. Bartel, V. R. Ambros, and H. R. Horvitz. 2007. MostCaenorhabditis elegans microRNAs are individually not essential for develop-ment or viability. PLoS Genet. 3: e215.
53. Alvarez-Saavedra, E., and H. R. Horvitz. 2010. Many families of C. elegansmicroRNAs are not essential for development or viability. Curr. Biol. 20: 367–373.
54. Li, X., J. J. Cassidy, C. A. Reinke, S. Fischboeck, and R. W. Carthew. 2009. AmicroRNA imparts robustness against environmental fluctuation during devel-opment. Cell 137: 273–282.
55. Zhou, X., S. Bailey-Bucktrout, L. T. Jeker, and J. A. Bluestone. 2009. Plasticityof CD4+ FoxP3+ T cells. Curr. Opin. Immunol. 21: 281–285.
56. Chaudhry, A., R. M. Samstein, P. Treuting, Y. Liang, M. C. Pils, J. M. Heinrich,R. S. Jack, F. T. Wunderlich, J. C. Bruning, W. Muller, and A. Y. Rudensky.
2011. Interleukin-10 signaling in regulatory T cells is required for suppression ofTh17 cell-mediated inflammation. Immunity 34: 566–578.
57. Benson, M. J., K. Pino-Lagos, M. Rosemblatt, and R. J. Noelle. 2007. All-transretinoic acid mediates enhanced T reg cell growth, differentiation, and guthoming in the face of high levels of co-stimulation. J. Exp. Med. 204: 1765–1774.
58. Mestdagh, P., A. K. Bostrom, F. Impens, E. Fredlund, G. Van Peer, P. De Antonellis,K. von Stedingk, B. Ghesquiere, S. Schulte, M. Dews, et al. 2010. The miR-17-92microRNA cluster regulates multiple components of the TGF-b pathway in neu-roblastoma. Mol. Cell 40: 762–773.
59. Linterman, M. A., W. Pierson, S. K. Lee, A. Kallies, S. Kawamoto, T. F. Rayner,M. Srivastava, D. P. Divekar, L. Beaton, J. J. Hogan, et al. 2011. Foxp3+ fol-licular regulatory T cells control the germinal center response. Nat. Med. 17:975–982.
60. Davidson, T. S., and E. M. Shevach. 2011. Polyclonal Treg cells modulate Teffector cell trafficking. Eur. J. Immunol. 41: 2862–2870.
61. Shiow, L. R., D. B. Rosen, N. Brdickova, Y. Xu, J. An, L. L. Lanier, J. G. Cyster,and M. Matloubian. 2006. CD69 acts downstream of interferon-a/b to inhibitS1P1 and lymphocyte egress from lymphoid organs. Nature 440: 540–544.
The Journal of Immunology 1605
by guest on May 28, 2018
http://ww
w.jim
munol.org/
Dow
nloaded from