Embed Size (px)
Citation preview
Available online at www.sciencedirect.com
008) 4435–4440www.elsevier.com/locate/tsf
Thin Solid Films 516 (2
Microplasma discharge in ethanol solution: Characterization and itsapplication to the synthesis of carbon microstructures
Qiang Chen a, Takaya Kitamura a, Kenji Saito a, Koji Haruta a, Yasushi Yamano a,Tatsuo Ishikawa b, Hajime Shirai a,⁎
a The Graduate School of Science and Technology, Saitama University, 255 Shimo-Okubo, Sakura, Saitama 338-8570, Japanb Horiba Co. Ltd, Higashi-Kanda, Chiyoda, Tokyo 101-0031, Japan
Available online 16 October 2007
Abstract
Radio-frequency (rf) microplasma discharge of argon was successfully generated within an ethanol (EtOH) solution and applied for thesynthesis of carbon microstructures. The plasma state depends on the flow rate of argon as well as the EtOH concentration. The argon relatedspecies are consumed mostly for dissociating EtOH at concentration of over 10%. The carbon related microstructures such as particle andnanotubes (CNTs) were formed directly on c-Si utilizing a microplasma jet of argon generated within ethanol solution, the average size andnumber density of carbon related products could be controlled by adjusting the ethanol concentration. The determining factor of average size andnumber density of carbon microstructures are discussed in terms of the surface reaction within ethanol solution.© 2007 Elsevier B.V. All rights reserved.
Keywords: Plasma-solution system; Carbon nanotubes; Excitation temperature; Rotational temperature
1. Introduction
Novel generation technique of ultra high electron densityplasma of over 1015 cm−3 at submicro- andmilli-meter sized area,termed “microplasma” has been extensively studied for frontiers ofplasma science as well as for application to the ultra-fast and on-demand material processing technologies [1–3]. These includefilm deposition, etching and surface modification, microelectro-nical mechanical system (MEMS), and micro-total analysissystems (μ-TAS) [4–6]. In addition, to date, most of researcheson the plasma-enhanced chemical vapor deposition (PE-CVD) offunctional materials have been performed with various dischargemethods using reactive and carrier gases under low-pressureconditions. On the other hand, a microplasma source is expectedfor further high decomposition efficiency of not only reactive gasesbut also liquid including supercritical states as the plasma-facingmaterials. To date,we have employed the characterization of radio-frequency (rf) thermal microplasma jet of argon utilizing atungsten carbide (WC) tube and its application to the synthesis of
⁎ Corresponding author. Tel./fax: +81 48 858 3676.E-mail address: [email protected] (H. Shirai).
0040-6090/$ - see front matter © 2007 Elsevier B.V. All rights reserved.doi:10.1016/j.tsf.2007.10.052
silicon and carbon microstructures, i.e., silicon nanocone (SNCs)and carbon nanotubes (CNTs) on metal-coated c-Si wafers [7,8].Their fine structures were determined mostly by the rapid heatingof Fe coated c-Si substrate material, which yields a large thermalgradient in the underlying c-Si substrate. These cause themolten Sito cool rapidly accompanying the volume expansion until solid-phase nucleation, i.e., formation of FeSix nanoclusters andsolidification. Thus, the quench rate of molten Si is a most pos-sible factor for determining the fine structure of materials.Therefore, deeper supercooling and higher quench rate associatedwith transient nucleation are the possible candidates to control theaverage size and number density of carbon microstructures [9].
In this report, themicroplasmadiagnostics of argonwithin EtOHsolution are demonstrated for application to the synthesis of carbonmicrostructures. The understanding of the controllability of size andnumber density of carbon microstructures are major subjects.
2. Experimental
The experimental setup is illustrated in Fig. 1. The tubeelectrode consisting of a tungsten carbide (WC) with a length of4 cm and an inner hole diameter of 700 μm was used as a
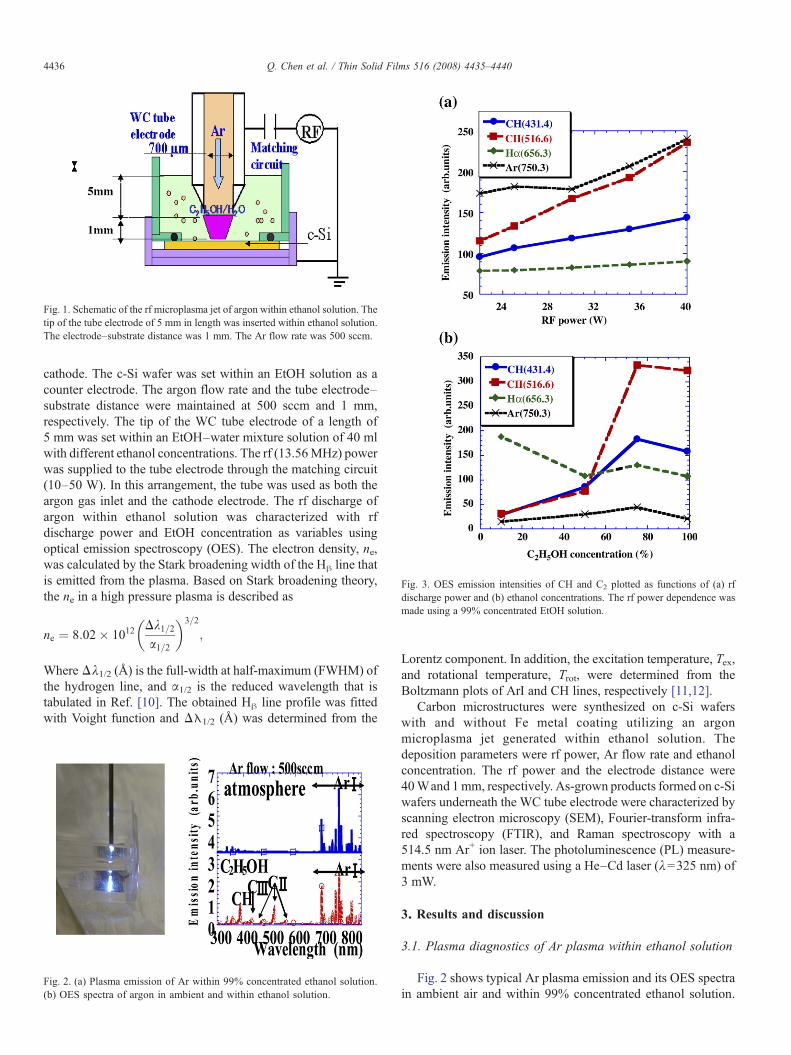
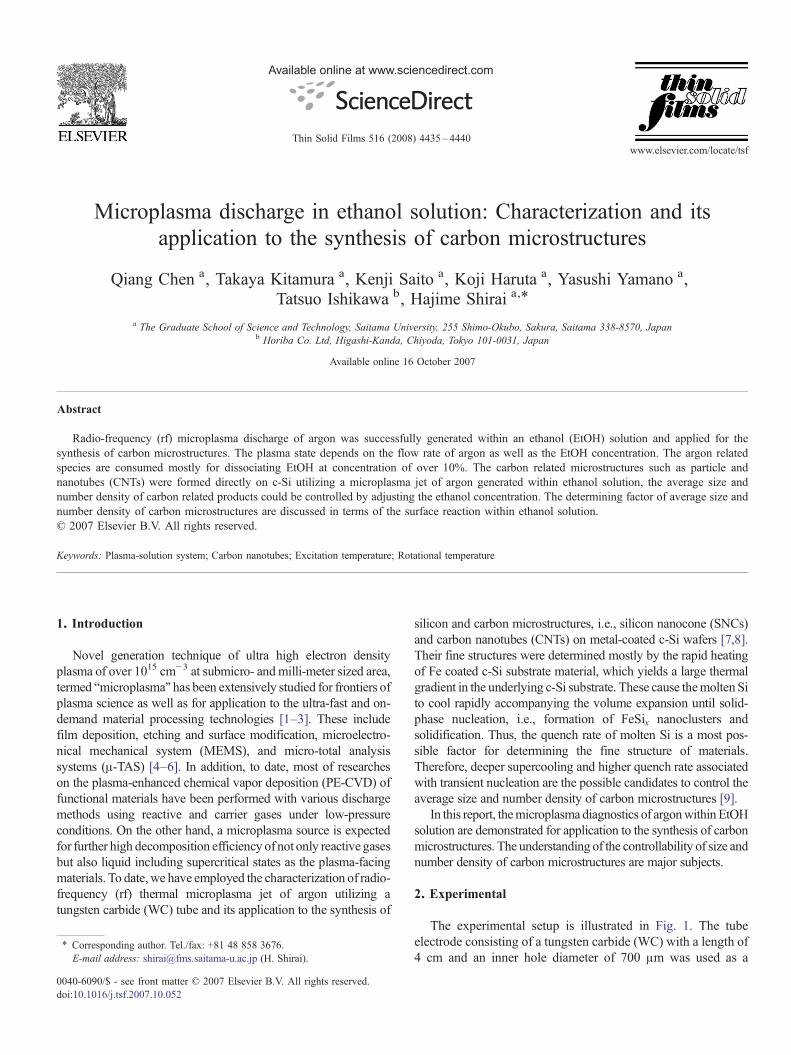
Fig. 1. Schematic of the rf microplasma jet of argon within ethanol solution. Thetip of the tube electrode of 5 mm in length was inserted within ethanol solution.The electrode–substrate distance was 1 mm. The Ar flow rate was 500 sccm.
Fig. 3. OES emission intensities of CH and C2 plotted as functions of (a) rfdischarge power and (b) ethanol concentrations. The rf power dependence wasmade using a 99% concentrated EtOH solution.
4436 Q. Chen et al. / Thin Solid Films 516 (2008) 4435–4440
cathode. The c-Si wafer was set within an EtOH solution as acounter electrode. The argon flow rate and the tube electrode–substrate distance were maintained at 500 sccm and 1 mm,respectively. The tip of the WC tube electrode of a length of5 mm was set within an EtOH–water mixture solution of 40 mlwith different ethanol concentrations. The rf (13.56MHz) powerwas supplied to the tube electrode through the matching circuit(10–50 W). In this arrangement, the tube was used as both theargon gas inlet and the cathode electrode. The rf discharge ofargon within ethanol solution was characterized with rfdischarge power and EtOH concentration as variables usingoptical emission spectroscopy (OES). The electron density, ne,was calculated by the Stark broadening width of the Hβ line thatis emitted from the plasma. Based on Stark broadening theory,the ne in a high pressure plasma is described as
ne ¼ 8:02� 1012Dk1=2a1=2
� �3=2
;
WhereΔλ1/2 (Å) is the full-width at half-maximum (FWHM) ofthe hydrogen line, and α1/2 is the reduced wavelength that istabulated in Ref. [10]. The obtained Hβ line profile was fittedwith Voight function and Δλ1/2 (Å) was determined from the
Fig. 2. (a) Plasma emission of Ar within 99% concentrated ethanol solution.(b) OES spectra of argon in ambient and within ethanol solution.
Lorentz component. In addition, the excitation temperature, Tex,and rotational temperature, Trot, were determined from theBoltzmann plots of ArI and CH lines, respectively [11,12].
Carbon microstructures were synthesized on c-Si waferswith and without Fe metal coating utilizing an argonmicroplasma jet generated within ethanol solution. Thedeposition parameters were rf power, Ar flow rate and ethanolconcentration. The rf power and the electrode distance were40Wand 1mm, respectively. As-grown products formed on c-Siwafers underneath the WC tube electrode were characterized byscanning electron microscopy (SEM), Fourier-transform infra-red spectroscopy (FTIR), and Raman spectroscopy with a514.5 nm Ar+ ion laser. The photoluminescence (PL) measure-ments were also measured using a He–Cd laser (λ=325 nm) of3 mW.
3. Results and discussion
3.1. Plasma diagnostics of Ar plasma within ethanol solution
Fig. 2 shows typical Ar plasma emission and its OES spectrain ambient air and within 99% concentrated ethanol solution.
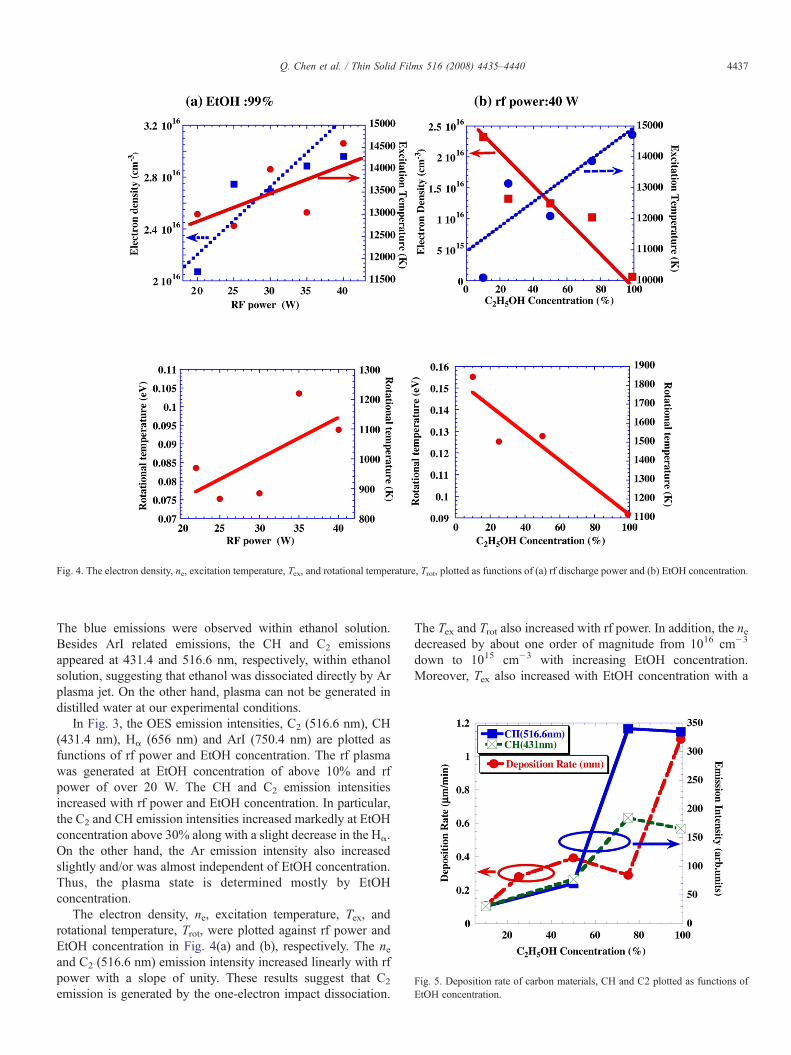
Fig. 4. The electron density, ne, excitation temperature, Tex, and rotational temperature, Trot, plotted as functions of (a) rf discharge power and (b) EtOH concentration.
Fig. 5. Deposition rate of carbon materials, CH and C2 plotted as functions ofEtOH concentration.
4437Q. Chen et al. / Thin Solid Films 516 (2008) 4435–4440
The blue emissions were observed within ethanol solution.Besides ArI related emissions, the CH and C2 emissionsappeared at 431.4 and 516.6 nm, respectively, within ethanolsolution, suggesting that ethanol was dissociated directly by Arplasma jet. On the other hand, plasma can not be generated indistilled water at our experimental conditions.
In Fig. 3, the OES emission intensities, C2 (516.6 nm), CH(431.4 nm), Hα (656 nm) and ArI (750.4 nm) are plotted asfunctions of rf power and EtOH concentration. The rf plasmawas generated at EtOH concentration of above 10% and rfpower of over 20 W. The CH and C2 emission intensitiesincreased with rf power and EtOH concentration. In particular,the C2 and CH emission intensities increased markedly at EtOHconcentration above 30% along with a slight decrease in the Hα.On the other hand, the Ar emission intensity also increasedslightly and/or was almost independent of EtOH concentration.Thus, the plasma state is determined mostly by EtOHconcentration.
The electron density, ne, excitation temperature, Tex, androtational temperature, Trot, were plotted against rf power andEtOH concentration in Fig. 4(a) and (b), respectively. The neand C2 (516.6 nm) emission intensity increased linearly with rfpower with a slope of unity. These results suggest that C2
emission is generated by the one-electron impact dissociation.
The Tex and Trot also increased with rf power. In addition, the nedecreased by about one order of magnitude from 1016 cm−3
down to 1015 cm−3 with increasing EtOH concentration.Moreover, Tex also increased with EtOH concentration with a
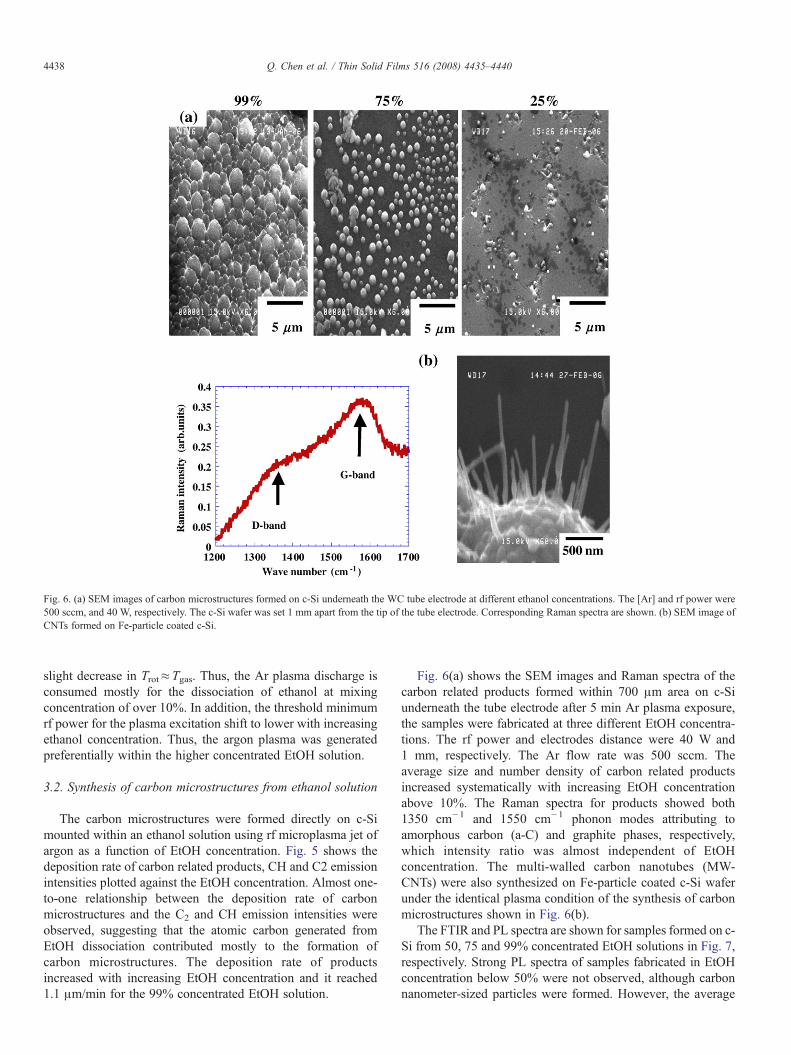
Fig. 6. (a) SEM images of carbon microstructures formed on c-Si underneath the WC tube electrode at different ethanol concentrations. The [Ar] and rf power were500 sccm, and 40 W, respectively. The c-Si wafer was set 1 mm apart from the tip of the tube electrode. Corresponding Raman spectra are shown. (b) SEM image ofCNTs formed on Fe-particle coated c-Si.
4438 Q. Chen et al. / Thin Solid Films 516 (2008) 4435–4440
slight decrease in Trot≈Tgas. Thus, the Ar plasma discharge isconsumed mostly for the dissociation of ethanol at mixingconcentration of over 10%. In addition, the threshold minimumrf power for the plasma excitation shift to lower with increasingethanol concentration. Thus, the argon plasma was generatedpreferentially within the higher concentrated EtOH solution.
3.2. Synthesis of carbon microstructures from ethanol solution
The carbon microstructures were formed directly on c-Simounted within an ethanol solution using rf microplasma jet ofargon as a function of EtOH concentration. Fig. 5 shows thedeposition rate of carbon related products, CH and C2 emissionintensities plotted against the EtOH concentration. Almost one-to-one relationship between the deposition rate of carbonmicrostructures and the C2 and CH emission intensities wereobserved, suggesting that the atomic carbon generated fromEtOH dissociation contributed mostly to the formation ofcarbon microstructures. The deposition rate of productsincreased with increasing EtOH concentration and it reached1.1 μm/min for the 99% concentrated EtOH solution.
Fig. 6(a) shows the SEM images and Raman spectra of thecarbon related products formed within 700 μm area on c-Siunderneath the tube electrode after 5 min Ar plasma exposure,the samples were fabricated at three different EtOH concentra-tions. The rf power and electrodes distance were 40 W and1 mm, respectively. The Ar flow rate was 500 sccm. Theaverage size and number density of carbon related productsincreased systematically with increasing EtOH concentrationabove 10%. The Raman spectra for products showed both1350 cm−1 and 1550 cm−1 phonon modes attributing toamorphous carbon (a-C) and graphite phases, respectively,which intensity ratio was almost independent of EtOHconcentration. The multi-walled carbon nanotubes (MW-CNTs) were also synthesized on Fe-particle coated c-Si waferunder the identical plasma condition of the synthesis of carbonmicrostructures shown in Fig. 6(b).
The FTIR and PL spectra are shown for samples formed on c-Si from 50, 75 and 99% concentrated EtOH solutions in Fig. 7,respectively. Strong PL spectra of samples fabricated in EtOHconcentration below 50% were not observed, although carbonnanometer-sized particles were formed. However, the average
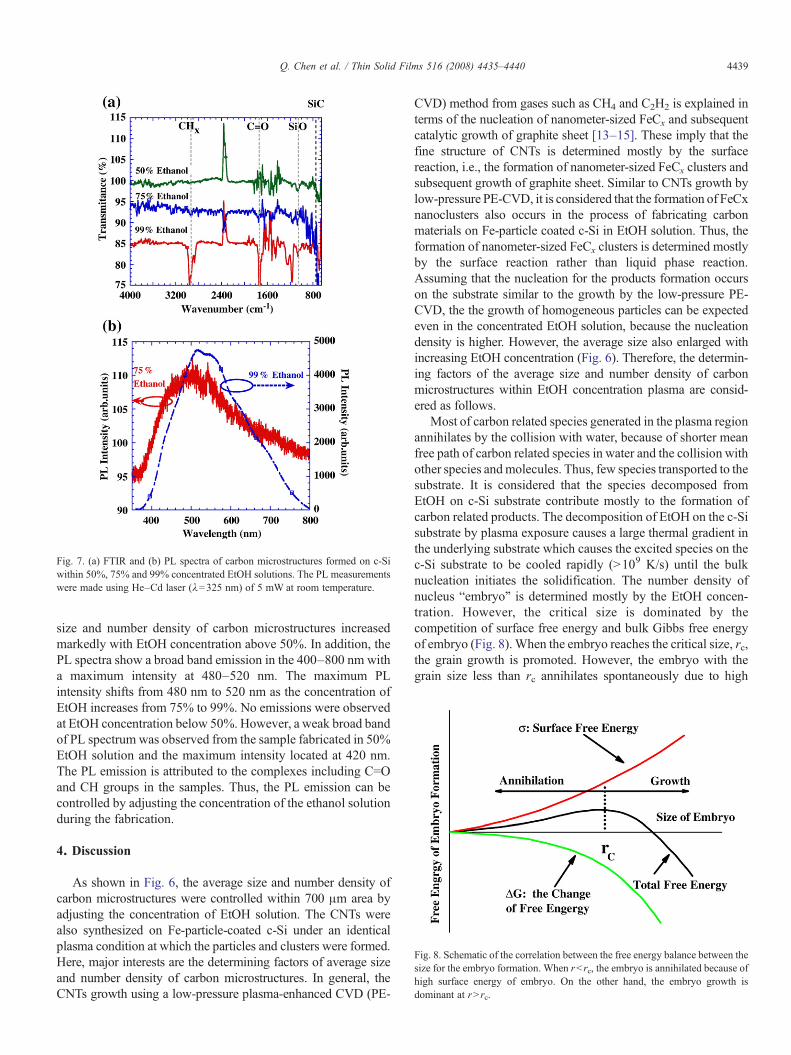
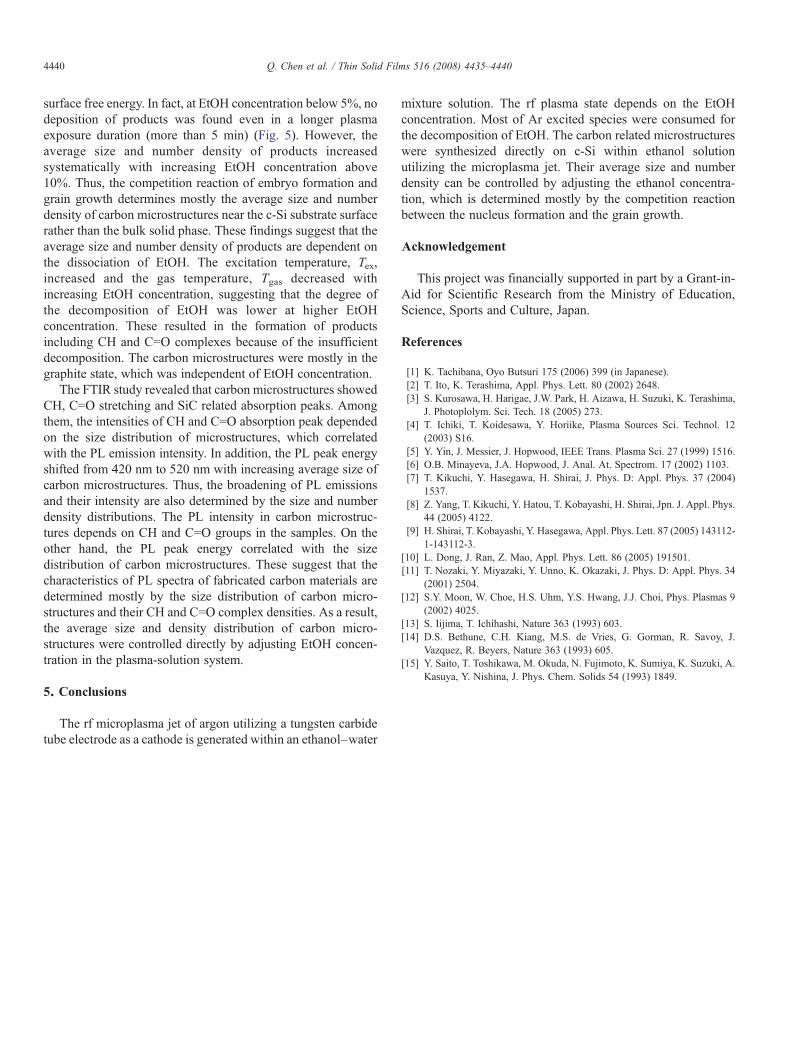
Fig. 8. Schematic of the correlation between the free energy balance between thesize for the embryo formation. When rb rc, the embryo is annihilated because ofhigh surface energy of embryo. On the other hand, the embryo growth isdominant at rN rc.
Fig. 7. (a) FTIR and (b) PL spectra of carbon microstructures formed on c-Siwithin 50%, 75% and 99% concentrated EtOH solutions. The PL measurementswere made using He–Cd laser (λ=325 nm) of 5 mW at room temperature.
4439Q. Chen et al. / Thin Solid Films 516 (2008) 4435–4440
size and number density of carbon microstructures increasedmarkedly with EtOH concentration above 50%. In addition, thePL spectra show a broad band emission in the 400–800 nm witha maximum intensity at 480–520 nm. The maximum PLintensity shifts from 480 nm to 520 nm as the concentration ofEtOH increases from 75% to 99%. No emissions were observedat EtOH concentration below 50%. However, a weak broad bandof PL spectrum was observed from the sample fabricated in 50%EtOH solution and the maximum intensity located at 420 nm.The PL emission is attributed to the complexes including C=Oand CH groups in the samples. Thus, the PL emission can becontrolled by adjusting the concentration of the ethanol solutionduring the fabrication.
4. Discussion
As shown in Fig. 6, the average size and number density ofcarbon microstructures were controlled within 700 μm area byadjusting the concentration of EtOH solution. The CNTs werealso synthesized on Fe-particle-coated c-Si under an identicalplasma condition at which the particles and clusters were formed.Here, major interests are the determining factors of average sizeand number density of carbon microstructures. In general, theCNTs growth using a low-pressure plasma-enhanced CVD (PE-
CVD) method from gases such as CH4 and C2H2 is explained interms of the nucleation of nanometer-sized FeCx and subsequentcatalytic growth of graphite sheet [13–15]. These imply that thefine structure of CNTs is determined mostly by the surfacereaction, i.e., the formation of nanometer-sized FeCx clusters andsubsequent growth of graphite sheet. Similar to CNTs growth bylow-pressure PE-CVD, it is considered that the formation of FeCxnanoclusters also occurs in the process of fabricating carbonmaterials on Fe-particle coated c-Si in EtOH solution. Thus, theformation of nanometer-sized FeCx clusters is determined mostlyby the surface reaction rather than liquid phase reaction.Assuming that the nucleation for the products formation occurson the substrate similar to the growth by the low-pressure PE-CVD, the the growth of homogeneous particles can be expectedeven in the concentrated EtOH solution, because the nucleationdensity is higher. However, the average size also enlarged withincreasing EtOH concentration (Fig. 6). Therefore, the determin-ing factors of the average size and number density of carbonmicrostructures within EtOH concentration plasma are consid-ered as follows.
Most of carbon related species generated in the plasma regionannihilates by the collision with water, because of shorter meanfree path of carbon related species in water and the collision withother species andmolecules. Thus, few species transported to thesubstrate. It is considered that the species decomposed fromEtOH on c-Si substrate contribute mostly to the formation ofcarbon related products. The decomposition of EtOH on the c-Sisubstrate by plasma exposure causes a large thermal gradient inthe underlying substrate which causes the excited species on thec-Si substrate to be cooled rapidly (N109 K/s) until the bulknucleation initiates the solidification. The number density ofnucleus “embryo” is determined mostly by the EtOH concen-tration. However, the critical size is dominated by thecompetition of surface free energy and bulk Gibbs free energyof embryo (Fig. 8). When the embryo reaches the critical size, rc,the grain growth is promoted. However, the embryo with thegrain size less than rc annihilates spontaneously due to high
4440 Q. Chen et al. / Thin Solid Films 516 (2008) 4435–4440
surface free energy. In fact, at EtOH concentration below 5%, nodeposition of products was found even in a longer plasmaexposure duration (more than 5 min) (Fig. 5). However, theaverage size and number density of products increasedsystematically with increasing EtOH concentration above10%. Thus, the competition reaction of embryo formation andgrain growth determines mostly the average size and numberdensity of carbon microstructures near the c-Si substrate surfacerather than the bulk solid phase. These findings suggest that theaverage size and number density of products are dependent onthe dissociation of EtOH. The excitation temperature, Tex,increased and the gas temperature, Tgas decreased withincreasing EtOH concentration, suggesting that the degree ofthe decomposition of EtOH was lower at higher EtOHconcentration. These resulted in the formation of productsincluding CH and C=O complexes because of the insufficientdecomposition. The carbon microstructures were mostly in thegraphite state, which was independent of EtOH concentration.
The FTIR study revealed that carbon microstructures showedCH, C=O stretching and SiC related absorption peaks. Amongthem, the intensities of CH and C=O absorption peak dependedon the size distribution of microstructures, which correlatedwith the PL emission intensity. In addition, the PL peak energyshifted from 420 nm to 520 nm with increasing average size ofcarbon microstructures. Thus, the broadening of PL emissionsand their intensity are also determined by the size and numberdensity distributions. The PL intensity in carbon microstruc-tures depends on CH and C=O groups in the samples. On theother hand, the PL peak energy correlated with the sizedistribution of carbon microstructures. These suggest that thecharacteristics of PL spectra of fabricated carbon materials aredetermined mostly by the size distribution of carbon micro-structures and their CH and C=O complex densities. As a result,the average size and density distribution of carbon micro-structures were controlled directly by adjusting EtOH concen-tration in the plasma-solution system.
5. Conclusions
The rf microplasma jet of argon utilizing a tungsten carbidetube electrode as a cathode is generated within an ethanol–water
mixture solution. The rf plasma state depends on the EtOHconcentration. Most of Ar excited species were consumed forthe decomposition of EtOH. The carbon related microstructureswere synthesized directly on c-Si within ethanol solutionutilizing the microplasma jet. Their average size and numberdensity can be controlled by adjusting the ethanol concentra-tion, which is determined mostly by the competition reactionbetween the nucleus formation and the grain growth.
Acknowledgement
This project was financially supported in part by a Grant-in-Aid for Scientific Research from the Ministry of Education,Science, Sports and Culture, Japan.
References
[1] K. Tachibana, Oyo Butsuri 175 (2006) 399 (in Japanese).[2] T. Ito, K. Terashima, Appl. Phys. Lett. 80 (2002) 2648.[3] S. Kurosawa, H. Harigae, J.W. Park, H. Aizawa, H. Suzuki, K. Terashima,
J. Photoplolym. Sci. Tech. 18 (2005) 273.[4] T. Ichiki, T. Koidesawa, Y. Horiike, Plasma Sources Sci. Technol. 12
(2003) S16.[5] Y. Yin, J. Messier, J. Hopwood, IEEE Trans. Plasma Sci. 27 (1999) 1516.[6] O.B. Minayeva, J.A. Hopwood, J. Anal. At. Spectrom. 17 (2002) 1103.[7] T. Kikuchi, Y. Hasegawa, H. Shirai, J. Phys. D: Appl. Phys. 37 (2004)
1537.[8] Z. Yang, T. Kikuchi, Y. Hatou, T. Kobayashi, H. Shirai, Jpn. J. Appl. Phys.
44 (2005) 4122.[9] H. Shirai, T. Kobayashi, Y. Hasegawa, Appl. Phys. Lett. 87 (2005) 143112-
1-143112-3.[10] L. Dong, J. Ran, Z. Mao, Appl. Phys. Lett. 86 (2005) 191501.[11] T. Nozaki, Y. Miyazaki, Y. Unno, K. Okazaki, J. Phys. D: Appl. Phys. 34
(2001) 2504.[12] S.Y. Moon, W. Choe, H.S. Uhm, Y.S. Hwang, J.J. Choi, Phys. Plasmas 9
(2002) 4025.[13] S. Iijima, T. Ichihashi, Nature 363 (1993) 603.[14] D.S. Bethune, C.H. Kiang, M.S. de Vries, G. Gorman, R. Savoy, J.
Vazquez, R. Beyers, Nature 363 (1993) 605.[15] Y. Saito, T. Toshikawa, M. Okuda, N. Fujimoto, K. Sumiya, K. Suzuki, A.
Kasuya, Y. Nishina, J. Phys. Chem. Solids 54 (1993) 1849.