Embed Size (px)
Citation preview
A Micron Reference Architecture
Micron® 9200 MAX NVMe™ With 5210 QLC SATA SSDs for Red Hat® Ceph Storage 3.2 and BlueStore on AMD EPYC™
Reference Architecture
John Mazzie, Storage Solutions Engineer
Tony Ansley, Principle Technical Marketing Engineer
ii
A Micron Reference Architecture
Contents
Executive Summary ...................................................................................................................................... 1
Why Micron for this Solution ......................................................................................................................... 1
Ceph Distributed Architecture Overview ....................................................................................................... 1
Reference Architecture Overview ................................................................................................................. 4
Software .................................................................................................................................................. 5
Red Hat Ceph Storage 3.2 ................................................................................................................ 5
Red Hat Enterprise Linux 7.6 ............................................................................................................ 5
Software by Node Type .......................................................................................................................... 5
Hardware ................................................................................................................................................ 6
Ceph Storage Node ........................................................................................................................... 6
Ceph Monitor Node ............................................................................................................................ 7
Micron 5210 ION SATA SSD ............................................................................................................. 7
Micron 9200 MAX NVMe SSDs ......................................................................................................... 8
Network Switches .............................................................................................................................. 8
Mellanox ConnectX®-5 EN Dual Port NICs ....................................................................................... 8
Planning Considerations ............................................................................................................................... 8
Number of Ceph Storage Nodes ............................................................................................................ 8
Number of Ceph Monitor Nodes ............................................................................................................. 8
Replication Factor ................................................................................................................................... 9
CPU Sizing ............................................................................................................................................. 9
Ceph Configuration Tuning ..................................................................................................................... 9
Networking .............................................................................................................................................. 9
Number of OSDs per Drive ..................................................................................................................... 9
Measuring Performance .............................................................................................................................. 10
4KB Random Workloads: FIO + RBD .................................................................................................. 10
4MB Object Workloads: RADOS Bench ............................................................................................... 11
Baseline Test Methodology ......................................................................................................................... 11
Storage Baseline Results ..................................................................................................................... 11
Network Baseline Results ..................................................................................................................... 12
Ceph Test Results and Analysis ................................................................................................................. 12
4KB Random Workload Testing ........................................................................................................... 12
4KB Random Write Workload Analysis ........................................................................................... 12
4KB Random Read Workload Analysis ........................................................................................... 15
Random Read Results Summary .................................................................................................... 17
4KB Random 70% Read / 30% Write Workload Analysis ............................................................... 18
Random 70/30 R/W Results Summary ............................................................................................ 20
4MB Object Workloads ......................................................................................................................... 21
4MB Object Write Results Summary ............................................................................................... 22
Summary ..................................................................................................................................................... 23
Appendix A: Configuration Details .............................................................................................................. 24
OS Tuning/NUMA ................................................................................................................................. 24
About Micron ............................................................................................................................................... 32
About Red Hat® ........................................................................................................................................... 32
About Ceph Storage .................................................................................................................................... 32
iii
A Micron Reference Architecture
List of Figures
Figure 1: Ceph Architecture ......................................................................................................................... 2
Figure 2: FileStore vs BlueStore .................................................................................................................. 4
Figure 3: Micron NVMe Reference Architecture .......................................................................................... 5
Figure 4: Supermicro A+ server AS-2113S-WTRT ...................................................................................... 6
Figure 5: Number of OSDs and Write Average Latency .............................................................................. 9
Figure 6: OSDs and Read Tail Latency ..................................................................................................... 10
Figure 7: 4KB Random Write Performance ............................................................................................... 13
Figure 8: 4KB Random Write IOPS vs CPU Utilization ............................................................................. 14
Figure 9: 4KB Random Read IOPS vs Average Latency .......................................................................... 15
Figure 10: 4KB Random Read IOPS vs QoS Latency ............................................................................... 16
Figure 11: 4KB Random Read IOPS vs CPU Utilization ........................................................................... 17
Figure 12: 4KB Random 70/30 R/W IOPS vs Average Latency ................................................................ 18
Figure 13: 4KB Random 70/30 R/W IOPS vs QoS (99.99%) Latency ...................................................... 19
Figure 14: 4KB Random 70/30 R/W IOPS vs CPU Utilization ................................................................... 20
Figure 15: 4MB Object Write Throughput vs Average Latency ................................................................. 21
Figure 16: 4MB Object Read Throughput vs Average Latency ................................................................. 22
1
A Micron Reference Architecture
Executive Summary
This document describes an example configuration of a performance-optimized Red Hat® Ceph® Storage
3.2 cluster using Micron® SATA SSDs and NVMe™ SSDs, rack-mount servers based on AMD EPYC™
architecture and 100 Gigabit Ethernet (GbE) networking infrastructure.
It details the hardware and software building blocks used to construct this reference architecture
(including the Red Hat Enterprise Linux® OS configuration, network switch configurations and Ceph
tuning parameters) and shows the performance test results and measurement techniques for a scalable
4-node Ceph architecture.
This solution is optimized for block performance while also providing very high object performance in a
compact, rack-efficient design to enable:
Faster deployment: The configuration has been pre-validated and is thoroughly documented to enable
faster deployment.
Balanced design: The right combination of NVMe SSDs, SATA SSDs, DRAM, processors and
networking ensures subsystems are balanced and performance-matched.
Broad use: Complete tuning and performance characterization across multiple IO profiles for broad
deployment across multiple uses.
Exceptional performance results were recorded for 4KB random block workloads and 4MB object workloads.
Why Micron for this Solution
Storage (SSDs and DRAM) represent a large portion
of the value of today’s advanced server/storage
solutions. Micron’s storage expertise starts at
memory technology research, innovation and design
and extends through collaborating with customers on
total data solutions. Micron develops and
manufactures the storage and memory products that
go into the enterprise solutions we architect. Micron
is the only storage provider able to offer a reference
architecture based on quad-level cell (QLC)
technology.1 We understand how QLC helps reduce
cost in unique ways that deliver a better total solution
in combination with our performance leadership on
the 9200.
____________ 1As of the publishing of this document (March 2019).
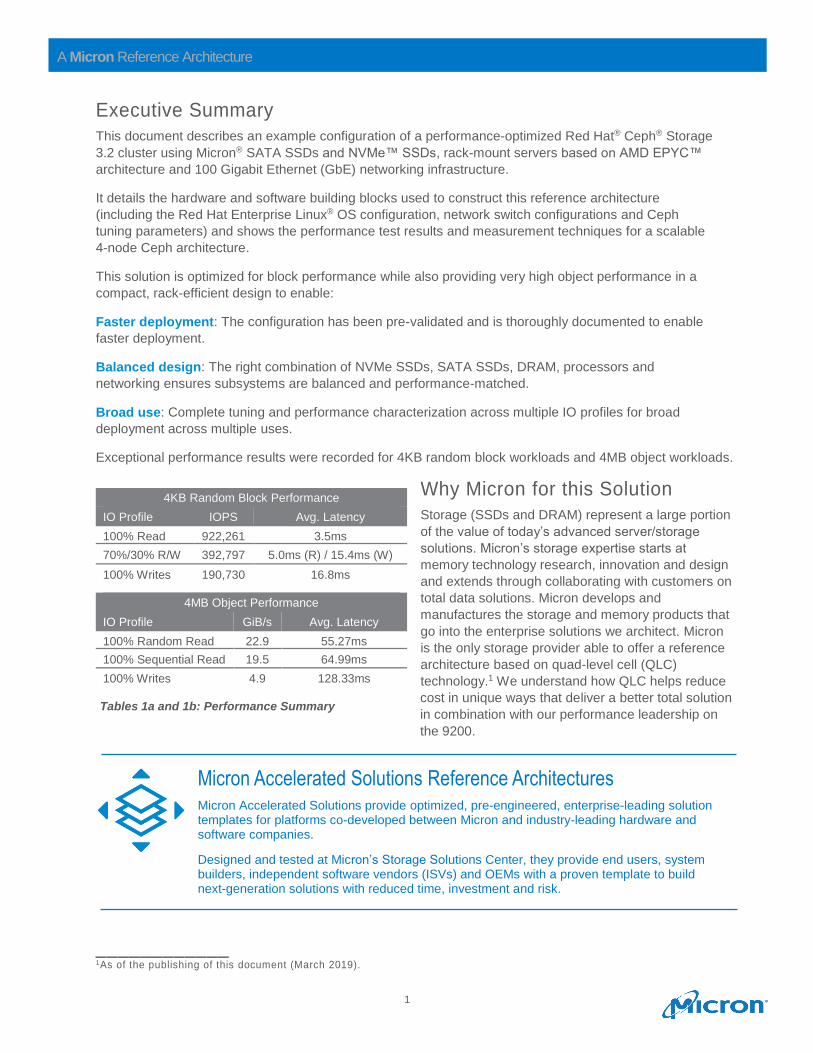
4KB Random Block Performance
IO Profile IOPS Avg. Latency
100% Read 922,261 3.5ms
70%/30% R/W 392,797 5.0ms (R) / 15.4ms (W)
100% Writes 190,730 16.8ms
4MB Object Performance
IO Profile GiB/s Avg. Latency
100% Random Read 22.9 55.27ms
100% Sequential Read 19.5 64.99ms
100% Writes 4.9 128.33ms
Micron Accelerated Solutions Reference Architectures Micron Accelerated Solutions provide optimized, pre-engineered, enterprise-leading solution templates for platforms co-developed between Micron and industry-leading hardware and software companies.
Designed and tested at Micron’s Storage Solutions Center, they provide end users, system builders, independent software vendors (ISVs) and OEMs with a proven template to build next-generation solutions with reduced time, investment and risk.
Tables 1a and 1b: Performance Summary
2
A Micron Reference Architecture
Ceph Distributed Architecture Overview
A Ceph storage cluster is frequently built from multiple Ceph storage and management nodes for
scalability, fault-tolerance and performance. Each node is based on industry-standard hardware and uses
intelligent Ceph daemons that communicate with each other to:
• Store, retrieve and replicate data
• Monitor and report on cluster health
• Redistribute data dynamically (remap and backfill)
• Ensure data integrity (scrubbing)
• Detect and recover from faults and failures
To the Ceph client interface that reads and writes data, a Ceph storage cluster looks like a simple, single
storage pool where data is stored. However, the storage cluster performs many complex operations in a
manner that is completely transparent to the client interface. Ceph clients and Ceph object storage
daemons (Ceph OSD daemons, or OSDs) both use the Controlled Replication Under Scalable Hashing
(CRUSH) algorithm to determine the location to store and retrieve stored data and data objects.
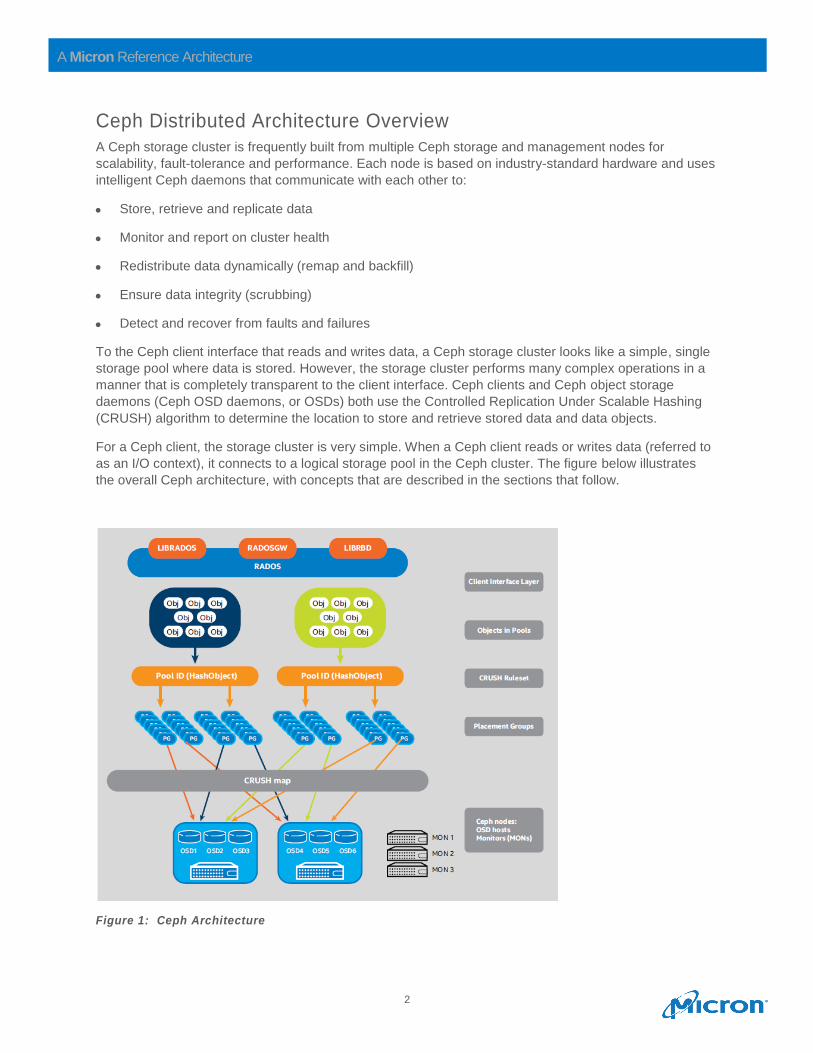
For a Ceph client, the storage cluster is very simple. When a Ceph client reads or writes data (referred to
as an I/O context), it connects to a logical storage pool in the Ceph cluster. The figure below illustrates
the overall Ceph architecture, with concepts that are described in the sections that follow.
Figure 1: Ceph Architecture
3
A Micron Reference Architecture
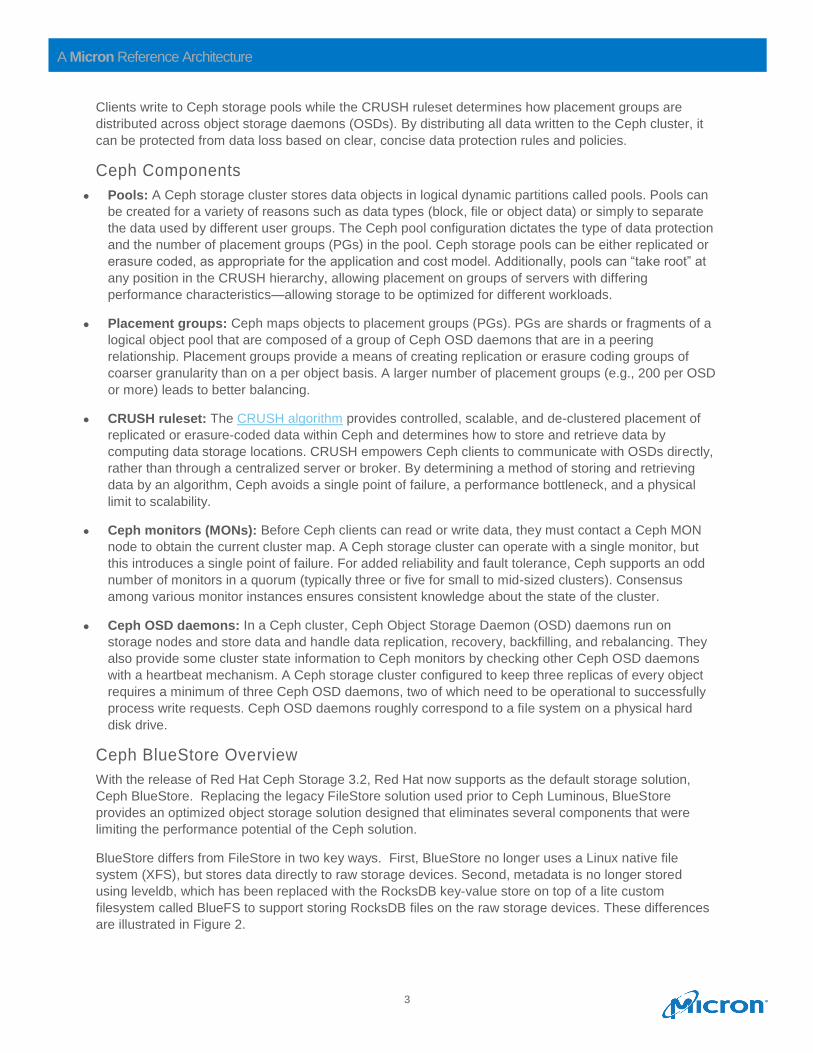
Clients write to Ceph storage pools while the CRUSH ruleset determines how placement groups are
distributed across object storage daemons (OSDs). By distributing all data written to the Ceph cluster, it
can be protected from data loss based on clear, concise data protection rules and policies.
Ceph Components
• Pools: A Ceph storage cluster stores data objects in logical dynamic partitions called pools. Pools can
be created for a variety of reasons such as data types (block, file or object data) or simply to separate
the data used by different user groups. The Ceph pool configuration dictates the type of data protection
and the number of placement groups (PGs) in the pool. Ceph storage pools can be either replicated or
erasure coded, as appropriate for the application and cost model. Additionally, pools can “take root” at
any position in the CRUSH hierarchy, allowing placement on groups of servers with differing
performance characteristics—allowing storage to be optimized for different workloads.
• Placement groups: Ceph maps objects to placement groups (PGs). PGs are shards or fragments of a
logical object pool that are composed of a group of Ceph OSD daemons that are in a peering
relationship. Placement groups provide a means of creating replication or erasure coding groups of
coarser granularity than on a per object basis. A larger number of placement groups (e.g., 200 per OSD
or more) leads to better balancing.
• CRUSH ruleset: The CRUSH algorithm provides controlled, scalable, and de-clustered placement of
replicated or erasure-coded data within Ceph and determines how to store and retrieve data by
computing data storage locations. CRUSH empowers Ceph clients to communicate with OSDs directly,
rather than through a centralized server or broker. By determining a method of storing and retrieving
data by an algorithm, Ceph avoids a single point of failure, a performance bottleneck, and a physical
limit to scalability.
• Ceph monitors (MONs): Before Ceph clients can read or write data, they must contact a Ceph MON
node to obtain the current cluster map. A Ceph storage cluster can operate with a single monitor, but
this introduces a single point of failure. For added reliability and fault tolerance, Ceph supports an odd
number of monitors in a quorum (typically three or five for small to mid-sized clusters). Consensus
among various monitor instances ensures consistent knowledge about the state of the cluster.
• Ceph OSD daemons: In a Ceph cluster, Ceph Object Storage Daemon (OSD) daemons run on
storage nodes and store data and handle data replication, recovery, backfilling, and rebalancing. They
also provide some cluster state information to Ceph monitors by checking other Ceph OSD daemons
with a heartbeat mechanism. A Ceph storage cluster configured to keep three replicas of every object
requires a minimum of three Ceph OSD daemons, two of which need to be operational to successfully
process write requests. Ceph OSD daemons roughly correspond to a file system on a physical hard
disk drive.
Ceph BlueStore Overview
With the release of Red Hat Ceph Storage 3.2, Red Hat now supports as the default storage solution,
Ceph BlueStore. Replacing the legacy FileStore solution used prior to Ceph Luminous, BlueStore
provides an optimized object storage solution designed that eliminates several components that were
limiting the performance potential of the Ceph solution.
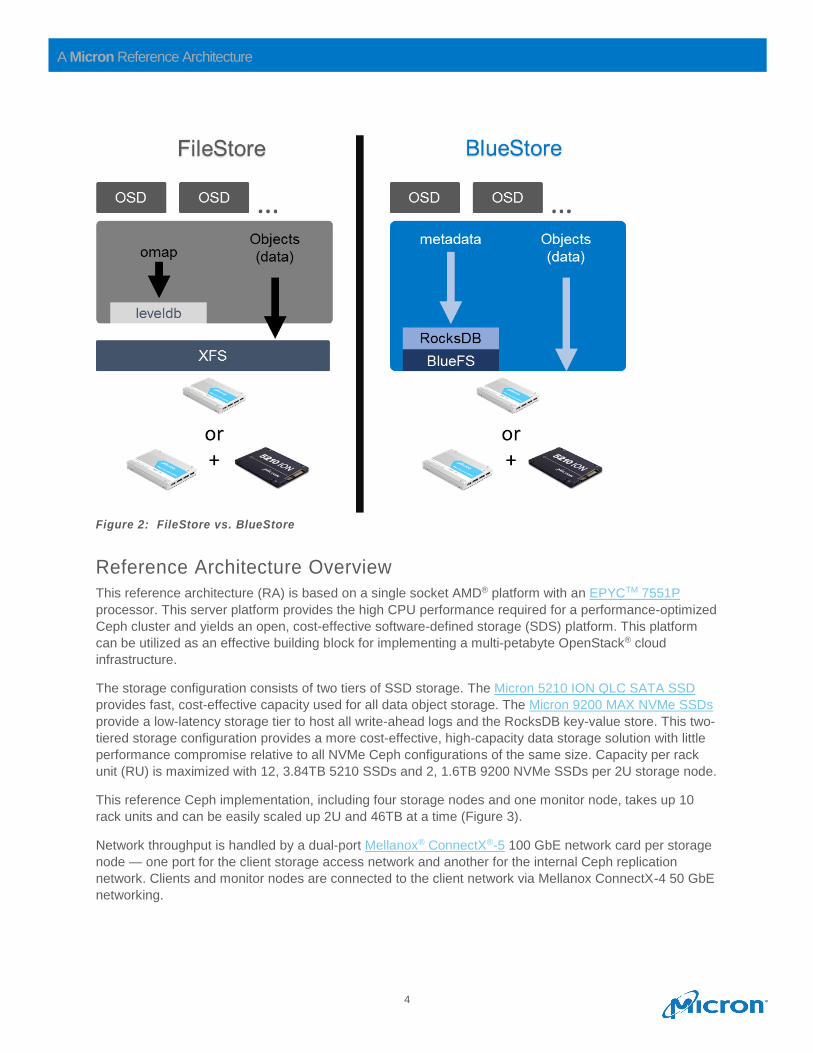
BlueStore differs from FileStore in two key ways. First, BlueStore no longer uses a Linux native file
system (XFS), but stores data directly to raw storage devices. Second, metadata is no longer stored
using leveldb, which has been replaced with the RocksDB key-value store on top of a lite custom
filesystem called BlueFS to support storing RocksDB files on the raw storage devices. These differences
are illustrated in Figure 2.
4
A Micron Reference Architecture
Figure 2: FileStore vs. BlueStore
Reference Architecture Overview
This reference architecture (RA) is based on a single socket AMD® platform with an EPYCTM 7551P
processor. This server platform provides the high CPU performance required for a performance-optimized
Ceph cluster and yields an open, cost-effective software-defined storage (SDS) platform. This platform
can be utilized as an effective building block for implementing a multi-petabyte OpenStack® cloud
infrastructure.
The storage configuration consists of two tiers of SSD storage. The Micron 5210 ION QLC SATA SSD
provides fast, cost-effective capacity used for all data object storage. The Micron 9200 MAX NVMe SSDs
provide a low-latency storage tier to host all write-ahead logs and the RocksDB key-value store. This two-
tiered storage configuration provides a more cost-effective, high-capacity data storage solution with little
performance compromise relative to all NVMe Ceph configurations of the same size. Capacity per rack
unit (RU) is maximized with 12, 3.84TB 5210 SSDs and 2, 1.6TB 9200 NVMe SSDs per 2U storage node.
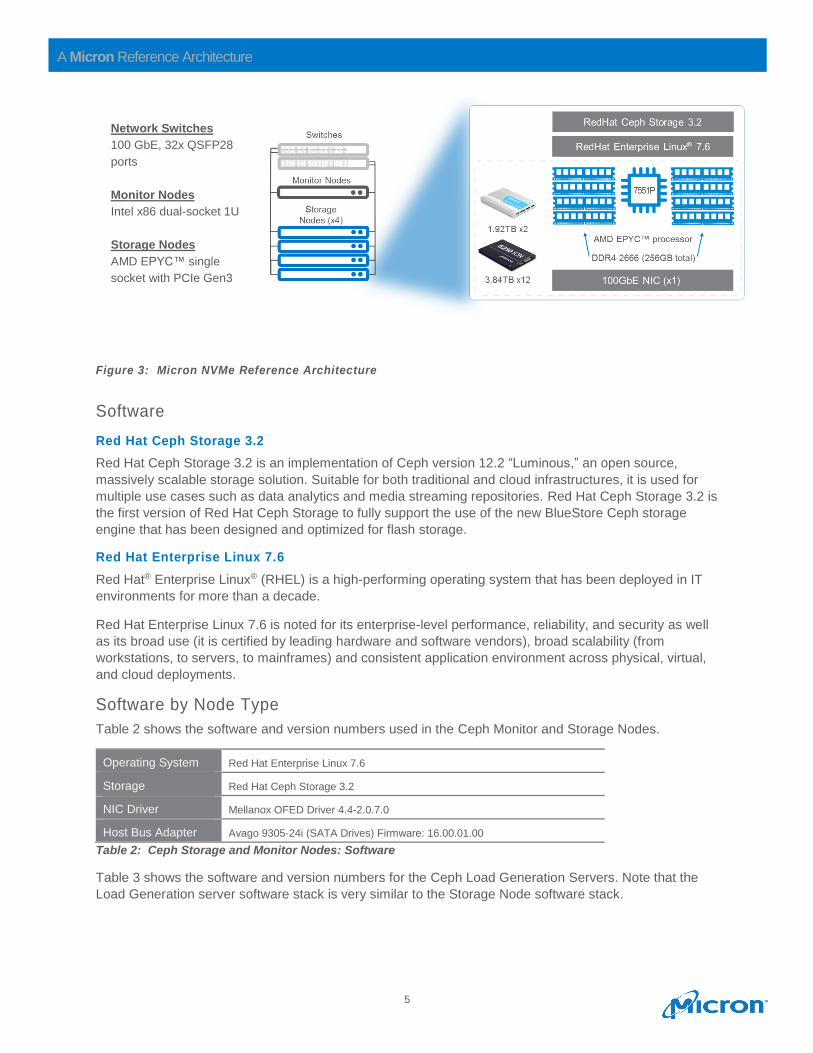
This reference Ceph implementation, including four storage nodes and one monitor node, takes up 10
rack units and can be easily scaled up 2U and 46TB at a time (Figure 3).
Network throughput is handled by a dual-port Mellanox® ConnectX®-5 100 GbE network card per storage
node — one port for the client storage access network and another for the internal Ceph replication
network. Clients and monitor nodes are connected to the client network via Mellanox ConnectX-4 50 GbE
networking.
5
A Micron Reference Architecture
Figure 3: Micron NVMe Reference Architecture
Software
Red Hat Ceph Storage 3.2
Red Hat Ceph Storage 3.2 is an implementation of Ceph version 12.2 “Luminous,” an open source,
massively scalable storage solution. Suitable for both traditional and cloud infrastructures, it is used for
multiple use cases such as data analytics and media streaming repositories. Red Hat Ceph Storage 3.2 is
the first version of Red Hat Ceph Storage to fully support the use of the new BlueStore Ceph storage
engine that has been designed and optimized for flash storage.
Red Hat Enterprise Linux 7.6
Red Hat® Enterprise Linux® (RHEL) is a high-performing operating system that has been deployed in IT
environments for more than a decade.
Red Hat Enterprise Linux 7.6 is noted for its enterprise-level performance, reliability, and security as well
as its broad use (it is certified by leading hardware and software vendors), broad scalability (from
workstations, to servers, to mainframes) and consistent application environment across physical, virtual,
and cloud deployments.
Software by Node Type
Table 2 shows the software and version numbers used in the Ceph Monitor and Storage Nodes.
Operating System Red Hat Enterprise Linux 7.6
Storage Red Hat Ceph Storage 3.2
NIC Driver Mellanox OFED Driver 4.4-2.0.7.0
Host Bus Adapter Avago 9305-24i (SATA Drives) Firmware: 16.00.01.00
Table 2: Ceph Storage and Monitor Nodes: Software
Table 3 shows the software and version numbers for the Ceph Load Generation Servers. Note that the
Load Generation server software stack is very similar to the Storage Node software stack.
Network Switches
100 GbE, 32x QSFP28
ports
Monitor Nodes
Intel x86 dual-socket 1U
Storage Nodes
AMD EPYC™ single
socket with PCIe Gen3
6
A Micron Reference Architecture
Operating System Red Hat Enterprise Linux 7.5
Storage Ceph Client: Red Hat Ceph Storage 3.2
Benchmark FIO 3.10 w/ librbd enabled
NIC Driver Mellanox OFED Driver 4.4-2.0.7.0
Table 3: Ceph Load Generation Nodes: Software
Hardware
This RA uses standard 2U, single-socket AMD EPYC architecture, x86 server platforms, each housing 12
SATA SSDs and 2 NVMe SSDs (U.2 form factor) with additional storage for local operating systems. All
SATA SSDs were connected to Avago 9305-24i SAS/SATA HBA.
Ceph Storage Node
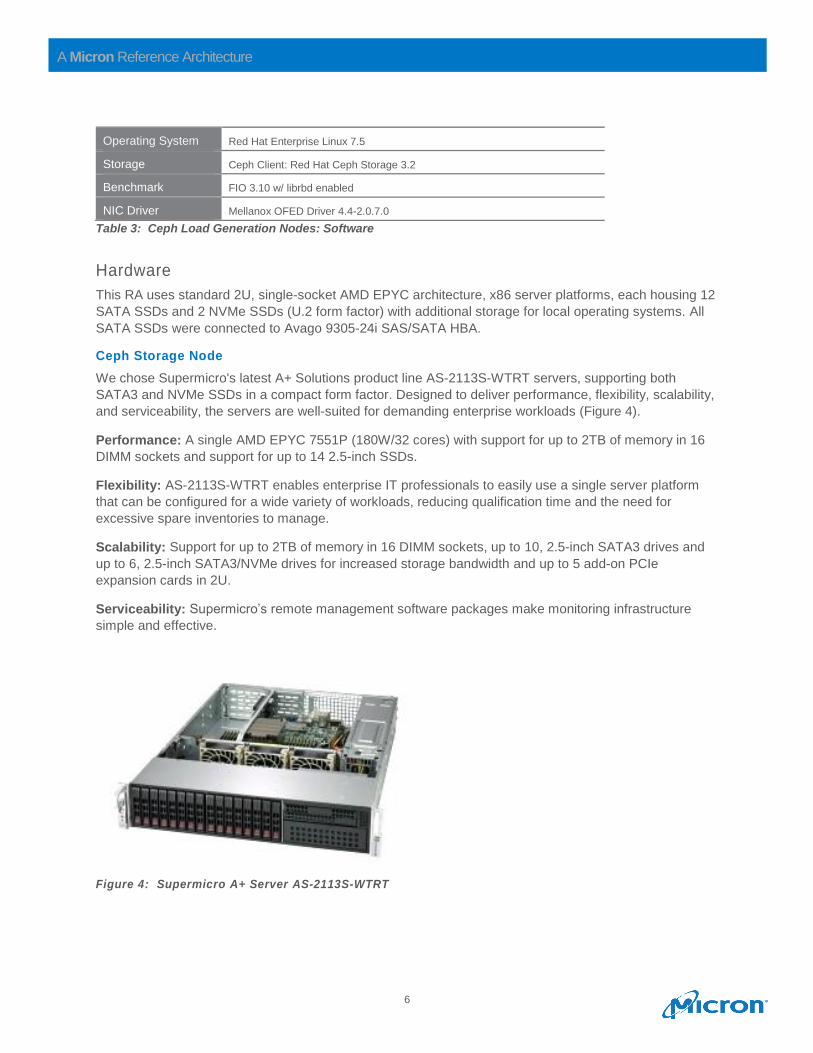
We chose Supermicro's latest A+ Solutions product line AS-2113S-WTRT servers, supporting both
SATA3 and NVMe SSDs in a compact form factor. Designed to deliver performance, flexibility, scalability,
and serviceability, the servers are well-suited for demanding enterprise workloads (Figure 4).
Performance: A single AMD EPYC 7551P (180W/32 cores) with support for up to 2TB of memory in 16
DIMM sockets and support for up to 14 2.5-inch SSDs.
Flexibility: AS-2113S-WTRT enables enterprise IT professionals to easily use a single server platform
that can be configured for a wide variety of workloads, reducing qualification time and the need for
excessive spare inventories to manage.
Scalability: Support for up to 2TB of memory in 16 DIMM sockets, up to 10, 2.5-inch SATA3 drives and
up to 6, 2.5-inch SATA3/NVMe drives for increased storage bandwidth and up to 5 add-on PCIe
expansion cards in 2U.
Serviceability: Supermicro’s remote management software packages make monitoring infrastructure
simple and effective.
Figure 4: Supermicro A+ Server AS-2113S-WTRT
7
A Micron Reference Architecture
Server Type x86 (single-socket) 2U with PCIe Gen3 (“EPYC”)
Model Supermicro A+ AS-2113S-WTRT
CPU (x1) AMD EPYC 7551P: 32 cores, 64 threads, 2.0 GHz base (2.55 GHz turbo)
DRAM (x8) Micron 32GB DDR4-2666 MT/s, 256GB total per node
SATA (x12) Micron 5210 ION QLC SSDs, 3.84TB each
NVMe (x2) Micron 9200 MAX NVMe SSDs, 1.6TB each
SATA (OS) 64GB SATA DOM
Network (x1) Mellanox ConnectX-5 100 GbE dual-port (MCX516A-CCAT)
Host Bus Adapter Avago 9305-24i
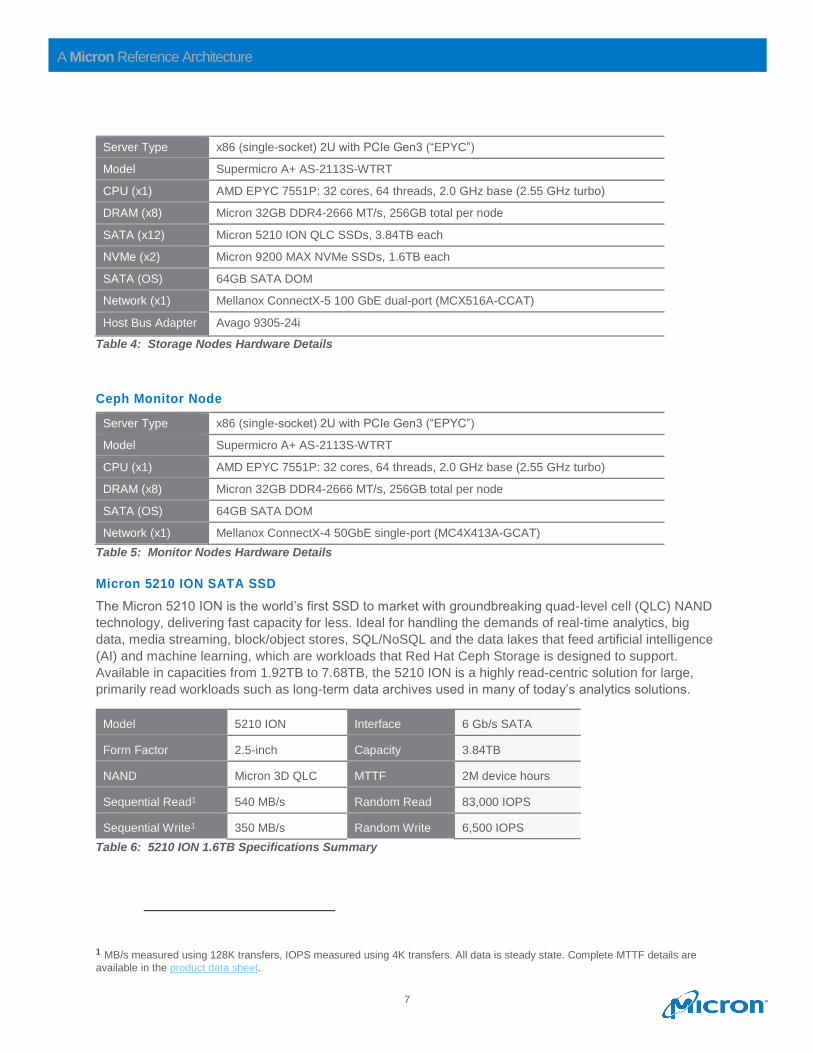
Table 4: Storage Nodes Hardware Details
Ceph Monitor Node
Server Type x86 (single-socket) 2U with PCIe Gen3 (“EPYC”)
Model Supermicro A+ AS-2113S-WTRT
CPU (x1) AMD EPYC 7551P: 32 cores, 64 threads, 2.0 GHz base (2.55 GHz turbo)
DRAM (x8) Micron 32GB DDR4-2666 MT/s, 256GB total per node
SATA (OS) 64GB SATA DOM
Network (x1) Mellanox ConnectX-4 50GbE single-port (MC4X413A-GCAT)
Table 5: Monitor Nodes Hardware Details
Micron 5210 ION SATA SSD
The Micron 5210 ION is the world’s first SSD to market with groundbreaking quad-level cell (QLC) NAND
technology, delivering fast capacity for less. Ideal for handling the demands of real-time analytics, big
data, media streaming, block/object stores, SQL/NoSQL and the data lakes that feed artificial intelligence
(AI) and machine learning, which are workloads that Red Hat Ceph Storage is designed to support.
Available in capacities from 1.92TB to 7.68TB, the 5210 ION is a highly read-centric solution for large,
primarily read workloads such as long-term data archives used in many of today’s analytics solutions.
Model 5210 ION Interface 6 Gb/s SATA
Form Factor 2.5-inch Capacity 3.84TB
NAND Micron 3D QLC MTTF 2M device hours
Sequential Read1 540 MB/s Random Read 83,000 IOPS
Sequential Write1 350 MB/s Random Write 6,500 IOPS
Table 6: 5210 ION 1.6TB Specifications Summary
1 MB/s measured using 128K transfers, IOPS measured using 4K transfers. All data is steady state. Complete MTTF details are
available in the product data sheet.
8
A Micron Reference Architecture
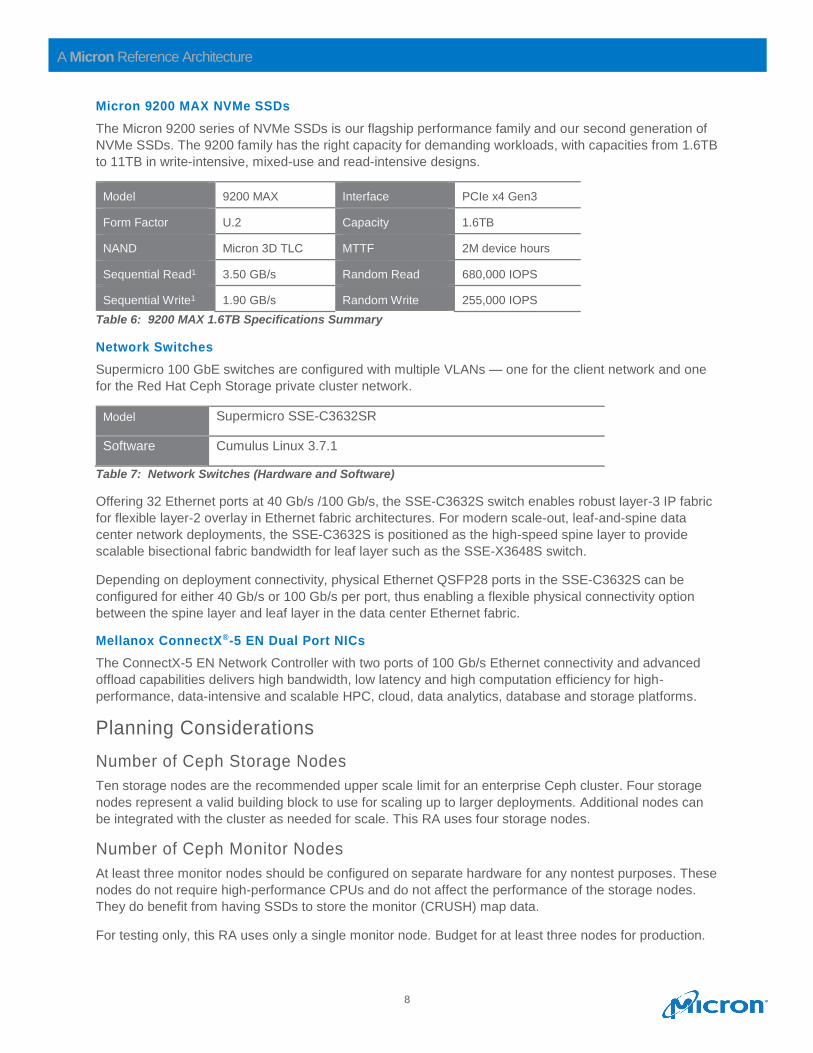
Micron 9200 MAX NVMe SSDs
The Micron 9200 series of NVMe SSDs is our flagship performance family and our second generation of
NVMe SSDs. The 9200 family has the right capacity for demanding workloads, with capacities from 1.6TB
to 11TB in write-intensive, mixed-use and read-intensive designs.
Model 9200 MAX Interface PCIe x4 Gen3
Form Factor U.2 Capacity 1.6TB
NAND Micron 3D TLC MTTF 2M device hours
Sequential Read1 3.50 GB/s Random Read 680,000 IOPS
Sequential Write1 1.90 GB/s Random Write 255,000 IOPS
Table 6: 9200 MAX 1.6TB Specifications Summary
Network Switches
Supermicro 100 GbE switches are configured with multiple VLANs — one for the client network and one
for the Red Hat Ceph Storage private cluster network.
Model Supermicro SSE-C3632SR
Software Cumulus Linux 3.7.1
Table 7: Network Switches (Hardware and Software)
Offering 32 Ethernet ports at 40 Gb/s /100 Gb/s, the SSE-C3632S switch enables robust layer-3 IP fabric
for flexible layer-2 overlay in Ethernet fabric architectures. For modern scale-out, leaf-and-spine data
center network deployments, the SSE-C3632S is positioned as the high-speed spine layer to provide
scalable bisectional fabric bandwidth for leaf layer such as the SSE-X3648S switch.
Depending on deployment connectivity, physical Ethernet QSFP28 ports in the SSE-C3632S can be
configured for either 40 Gb/s or 100 Gb/s per port, thus enabling a flexible physical connectivity option
between the spine layer and leaf layer in the data center Ethernet fabric.
Mellanox ConnectX®-5 EN Dual Port NICs
The ConnectX-5 EN Network Controller with two ports of 100 Gb/s Ethernet connectivity and advanced
offload capabilities delivers high bandwidth, low latency and high computation efficiency for high-
performance, data-intensive and scalable HPC, cloud, data analytics, database and storage platforms.
Planning Considerations
Number of Ceph Storage Nodes
Ten storage nodes are the recommended upper scale limit for an enterprise Ceph cluster. Four storage
nodes represent a valid building block to use for scaling up to larger deployments. Additional nodes can
be integrated with the cluster as needed for scale. This RA uses four storage nodes.
Number of Ceph Monitor Nodes
At least three monitor nodes should be configured on separate hardware for any nontest purposes. These
nodes do not require high-performance CPUs and do not affect the performance of the storage nodes.
They do benefit from having SSDs to store the monitor (CRUSH) map data.
For testing only, this RA uses only a single monitor node. Budget for at least three nodes for production.
9
A Micron Reference Architecture
Replication Factor
NVMe SSDs have high reliability with high MTBR and low bit error rate. 2x replication is recommended in
production when deploying OSDs on NVMe versus the 3x replication common with legacy storage.
CPU Sizing
Ceph OSD processes can consume large amounts of CPU while doing small block operations.
Consequently, a higher CPU core count generally results in higher performance for I/O-intensive
workloads. For throughput-intensive workloads characterized by large sequential I/O, Ceph performance
is more likely to be bound by the maximum network bandwidth or storage bandwidth of the cluster.
Ceph Configuration Tuning
Tuning Ceph for SSD devices can be complex. The ceph.conf settings used in this RA are optimized for
small block random performance and are included in Appendix A.
Networking
A 25 GbE network is required to leverage the maximum block performance benefits of an NVMe-based
Ceph cluster. For throughput-intensive workloads, 50 GbE to 100 GbE is recommended. It is
recommended that a physical network be deployed for Ceph internal data movement between storage
nodes and a separate physical network be deployed for application client server access to Ceph monitor
and data nodes to maximize performance.
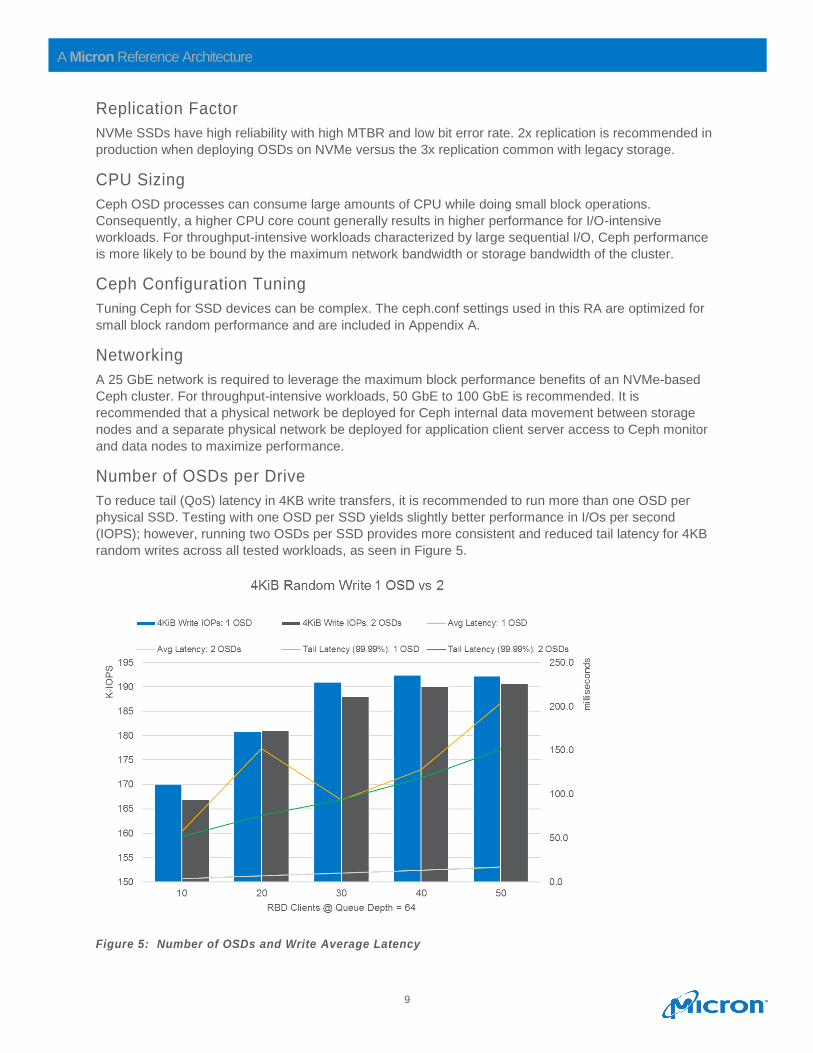
Number of OSDs per Drive
To reduce tail (QoS) latency in 4KB write transfers, it is recommended to run more than one OSD per
physical SSD. Testing with one OSD per SSD yields slightly better performance in I/Os per second
(IOPS); however, running two OSDs per SSD provides more consistent and reduced tail latency for 4KB
random writes across all tested workloads, as seen in Figure 5.
Figure 5: Number of OSDs and Write Average Latency
10
A Micron Reference Architecture
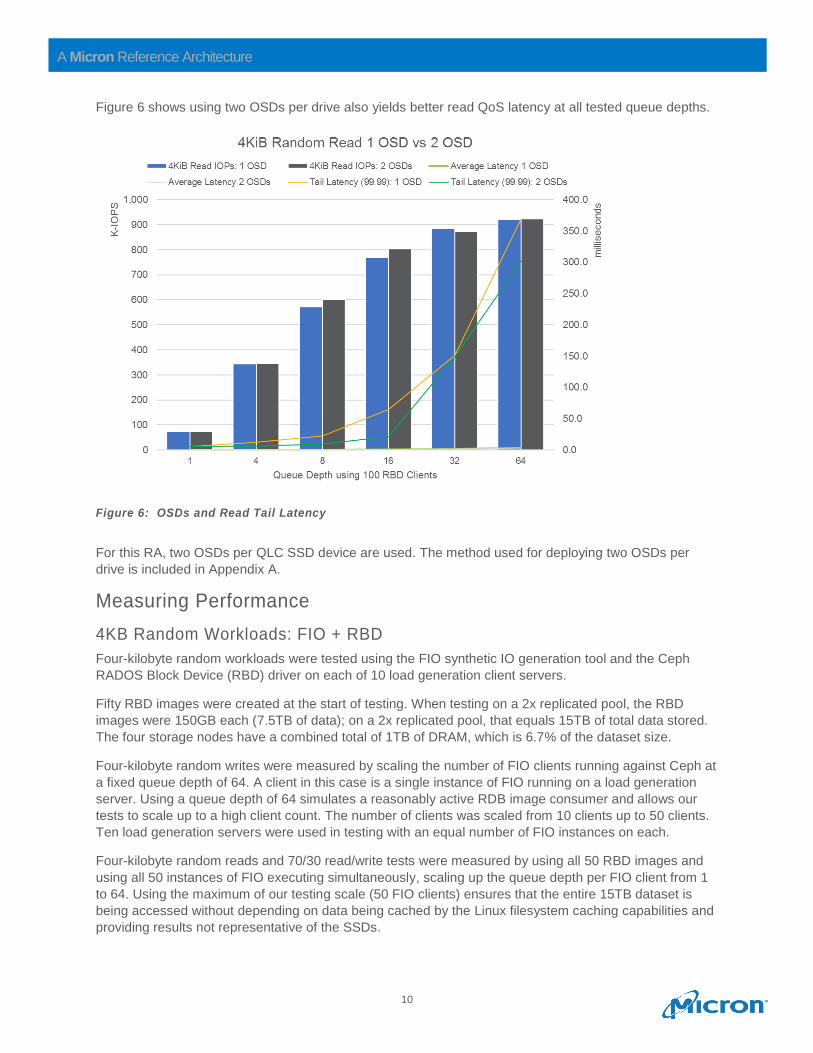
Figure 6 shows using two OSDs per drive also yields better read QoS latency at all tested queue depths.
Figure 6: OSDs and Read Tail Latency
For this RA, two OSDs per QLC SSD device are used. The method used for deploying two OSDs per
drive is included in Appendix A.
Measuring Performance
4KB Random Workloads: FIO + RBD
Four-kilobyte random workloads were tested using the FIO synthetic IO generation tool and the Ceph
RADOS Block Device (RBD) driver on each of 10 load generation client servers.
Fifty RBD images were created at the start of testing. When testing on a 2x replicated pool, the RBD
images were 150GB each (7.5TB of data); on a 2x replicated pool, that equals 15TB of total data stored.
The four storage nodes have a combined total of 1TB of DRAM, which is 6.7% of the dataset size.
Four-kilobyte random writes were measured by scaling the number of FIO clients running against Ceph at
a fixed queue depth of 64. A client in this case is a single instance of FIO running on a load generation
server. Using a queue depth of 64 simulates a reasonably active RDB image consumer and allows our
tests to scale up to a high client count. The number of clients was scaled from 10 clients up to 50 clients.
Ten load generation servers were used in testing with an equal number of FIO instances on each.
Four-kilobyte random reads and 70/30 read/write tests were measured by using all 50 RBD images and
using all 50 instances of FIO executing simultaneously, scaling up the queue depth per FIO client from 1
to 64. Using the maximum of our testing scale (50 FIO clients) ensures that the entire 15TB dataset is
being accessed without depending on data being cached by the Linux filesystem caching capabilities and
providing results not representative of the SSDs.
11
A Micron Reference Architecture
Each test was run three times for 10 minutes with a 5-minute ramp-up time. Linux filesystem caches were
cleared and the Ceph service was restarted between each test. The results reported are the averages
across all test runs.
4MB Object Workloads: RADOS Bench
RADOS Bench is a built-in tool for measuring object performance. It represents the best-case object
performance scenario of data coming directly to Ceph from a RADOS Gateway node.
Four-megabyte object writes were measured by running RADOS Bench with a “threads” value of 16 on a
load generation server writing directly to a Ceph storage pool. The number of load generation servers
scaled up from 2 to 10.
Four-megabyte object reads were measured by first writing 15TB of object data into a 2x replicated pool
using 10 RADOS Bench instances (1 per load generation server). Using the 10 RADOS Bench instances
during testing ensures that the entire 15TB dataset is being accessed and not cached by the operating
system. Once the data load was complete, the RADOS Bench instances were used to run 4MB object
reads against the storage pool. Performance was then measured across a wide variety of RADOS Bench
threads scaling from 1 thread to 32 threads. Separate read tests were performed to measure random and
sequential read use cases.
Object workload tests were run for 10 minutes, three times each. Linux filesystem caches were cleared,
and the Ceph service was restarted between each test. The results reported are the averages across all
test runs.
Baseline Test Methodology
Before Ceph testing was initiated, both the storage and network performance were baseline tested
(tested without Ceph software) to determine the theoretical hardware performance maximums using FIO
for storage testing and iPerf for network bandwidth testing. This provided a baseline for storage from
which to measure the impact of the Ceph software, as well as the benefits of adding NVMe SSDs as a
cache tier, as well as a baseline for network performance to identify the maximum usable network
bandwidth available.
• Baseline storage testing was done with one locally run FIO command test across all 12 SATA drives
simultaneously.
• Network testing used two concurrent iperf3 tests (details provided below).
Storage Baseline Results
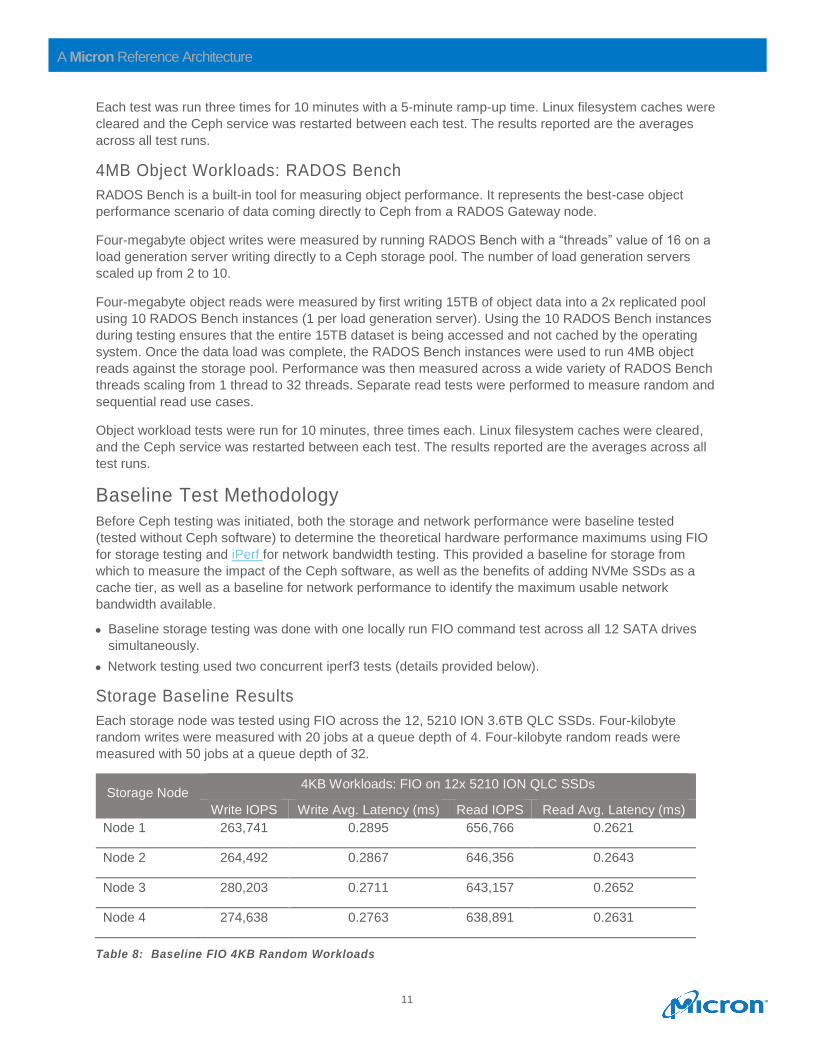
Each storage node was tested using FIO across the 12, 5210 ION 3.6TB QLC SSDs. Four-kilobyte
random writes were measured with 20 jobs at a queue depth of 4. Four-kilobyte random reads were
measured with 50 jobs at a queue depth of 32.
Storage Node 4KB Workloads: FIO on 12x 5210 ION QLC SSDs
Write IOPS Write Avg. Latency (ms) Read IOPS Read Avg. Latency (ms)
Node 1 263,741 0.2895 656,766 0.2621
Node 2 264,492 0.2867 646,356 0.2643
Node 3 280,203 0.2711 643,157 0.2652
Node 4 274,638 0.2763 638,891 0.2631
Table 8: Baseline FIO 4KB Random Workloads
12
A Micron Reference Architecture
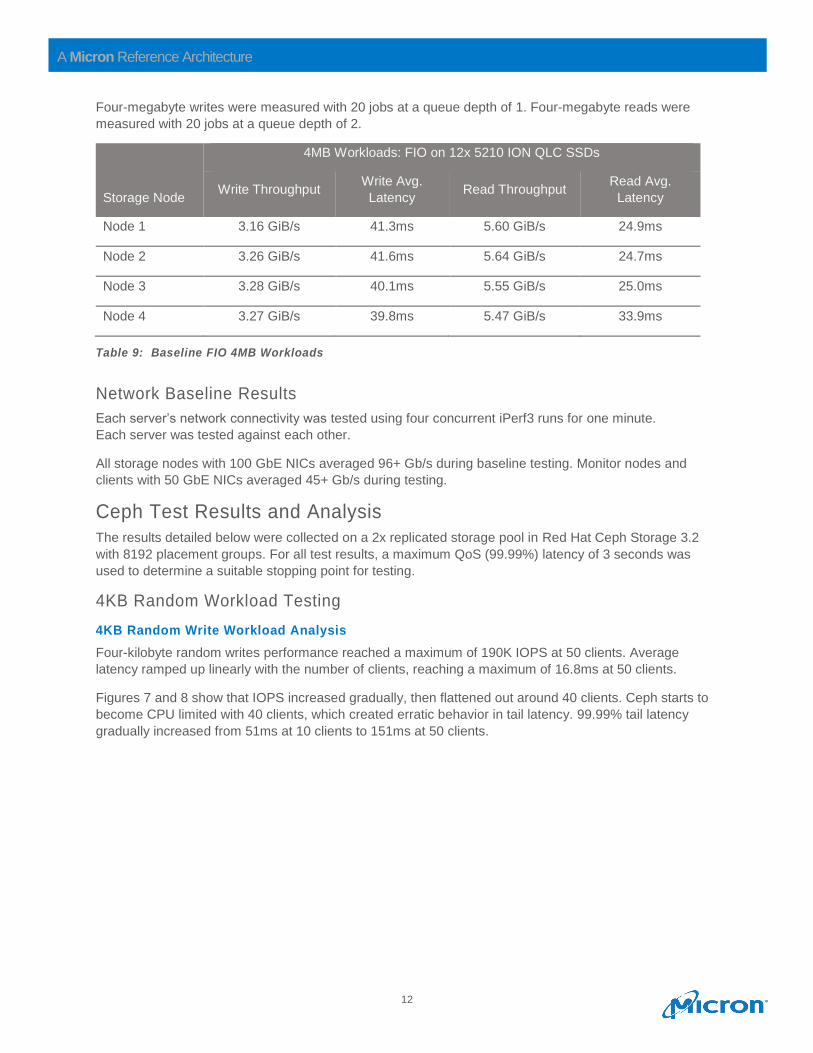
Four-megabyte writes were measured with 20 jobs at a queue depth of 1. Four-megabyte reads were
measured with 20 jobs at a queue depth of 2.
Storage Node
4MB Workloads: FIO on 12x 5210 ION QLC SSDs
Write Throughput Write Avg.
Latency Read Throughput
Read Avg.
Latency
Node 1 3.16 GiB/s 41.3ms 5.60 GiB/s 24.9ms
Node 2 3.26 GiB/s 41.6ms 5.64 GiB/s 24.7ms
Node 3 3.28 GiB/s 40.1ms 5.55 GiB/s 25.0ms
Node 4 3.27 GiB/s 39.8ms 5.47 GiB/s 33.9ms
Table 9: Baseline FIO 4MB Workloads
Network Baseline Results
Each server’s network connectivity was tested using four concurrent iPerf3 runs for one minute.
Each server was tested against each other.
All storage nodes with 100 GbE NICs averaged 96+ Gb/s during baseline testing. Monitor nodes and
clients with 50 GbE NICs averaged 45+ Gb/s during testing.
Ceph Test Results and Analysis
The results detailed below were collected on a 2x replicated storage pool in Red Hat Ceph Storage 3.2
with 8192 placement groups. For all test results, a maximum QoS (99.99%) latency of 3 seconds was
used to determine a suitable stopping point for testing.
4KB Random Workload Testing
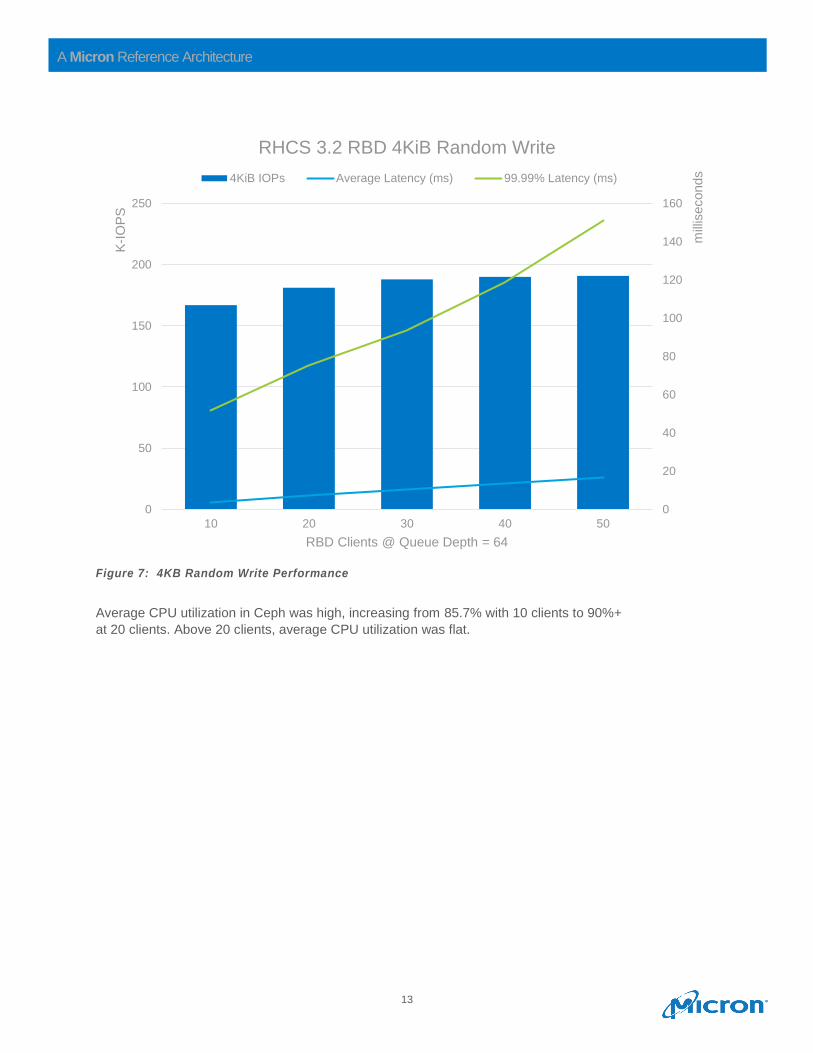
4KB Random Write Workload Analysis
Four-kilobyte random writes performance reached a maximum of 190K IOPS at 50 clients. Average
latency ramped up linearly with the number of clients, reaching a maximum of 16.8ms at 50 clients.
Figures 7 and 8 show that IOPS increased gradually, then flattened out around 40 clients. Ceph starts to
become CPU limited with 40 clients, which created erratic behavior in tail latency. 99.99% tail latency
gradually increased from 51ms at 10 clients to 151ms at 50 clients.
13
A Micron Reference Architecture
Figure 7: 4KB Random Write Performance
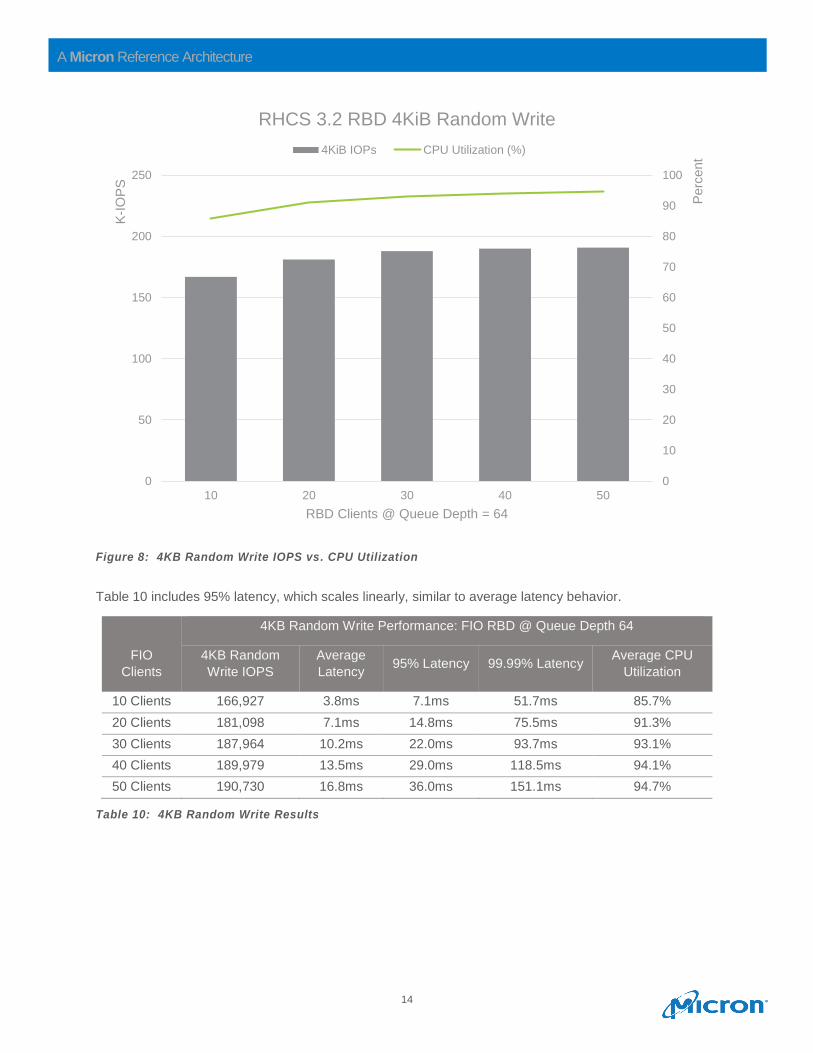
Average CPU utilization in Ceph was high, increasing from 85.7% with 10 clients to 90%+
at 20 clients. Above 20 clients, average CPU utilization was flat.
0
20
40
60
80
100
120
140
160
0
50
100
150
200
250
10 20 30 40 50
RBD Clients @ Queue Depth = 64
mill
iseconds
K-I
OP
S
RHCS 3.2 RBD 4KiB Random Write
4KiB IOPs Average Latency (ms) 99.99% Latency (ms)
14
A Micron Reference Architecture
Figure 8: 4KB Random Write IOPS vs. CPU Utilization
Table 10 includes 95% latency, which scales linearly, similar to average latency behavior.
FIO
Clients
4KB Random Write Performance: FIO RBD @ Queue Depth 64
4KB Random
Write IOPS
Average
Latency 95% Latency 99.99% Latency
Average CPU
Utilization
10 Clients 166,927 3.8ms 7.1ms 51.7ms 85.7%
20 Clients 181,098 7.1ms 14.8ms 75.5ms 91.3%
30 Clients 187,964 10.2ms 22.0ms 93.7ms 93.1%
40 Clients 189,979 13.5ms 29.0ms 118.5ms 94.1%
50 Clients 190,730 16.8ms 36.0ms 151.1ms 94.7%
Table 10: 4KB Random Write Results
0
10
20
30
40
50
60
70
80
90
100
0
50
100
150
200
250
10 20 30 40 50
RBD Clients @ Queue Depth = 64
Perc
ent
K-I
OP
SRHCS 3.2 RBD 4KiB Random Write
4KiB IOPs CPU Utilization (%)
15
A Micron Reference Architecture
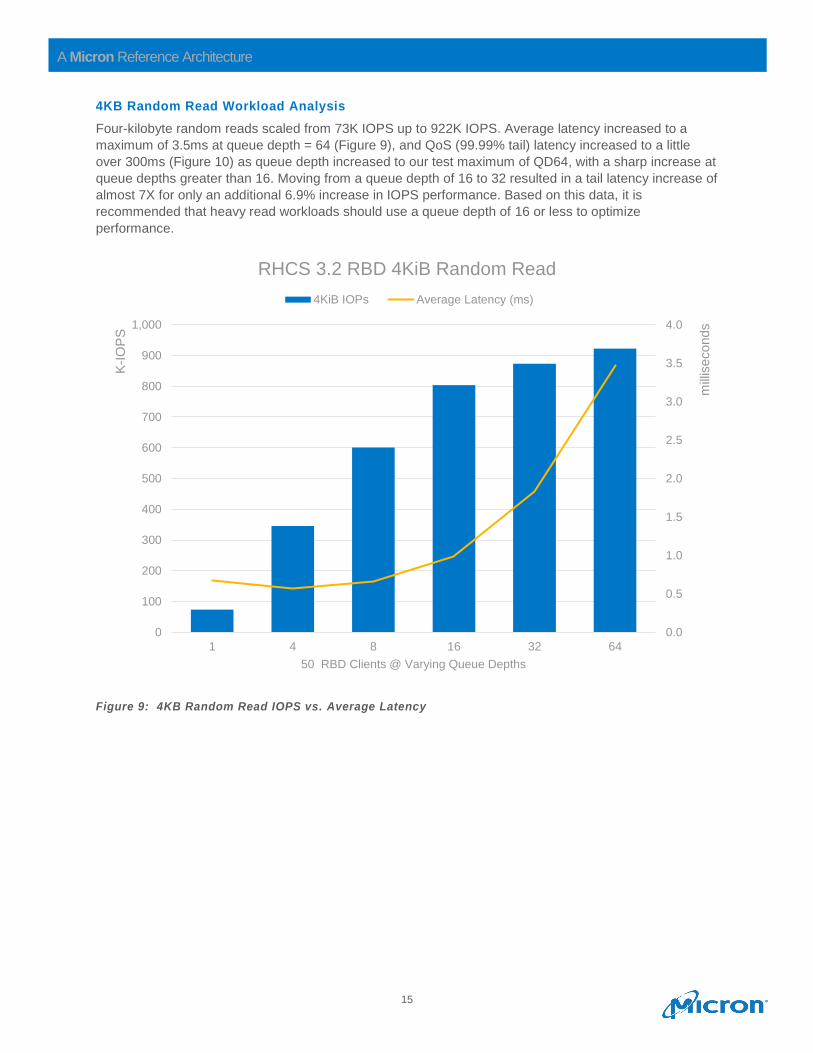
4KB Random Read Workload Analysis
Four-kilobyte random reads scaled from 73K IOPS up to 922K IOPS. Average latency increased to a
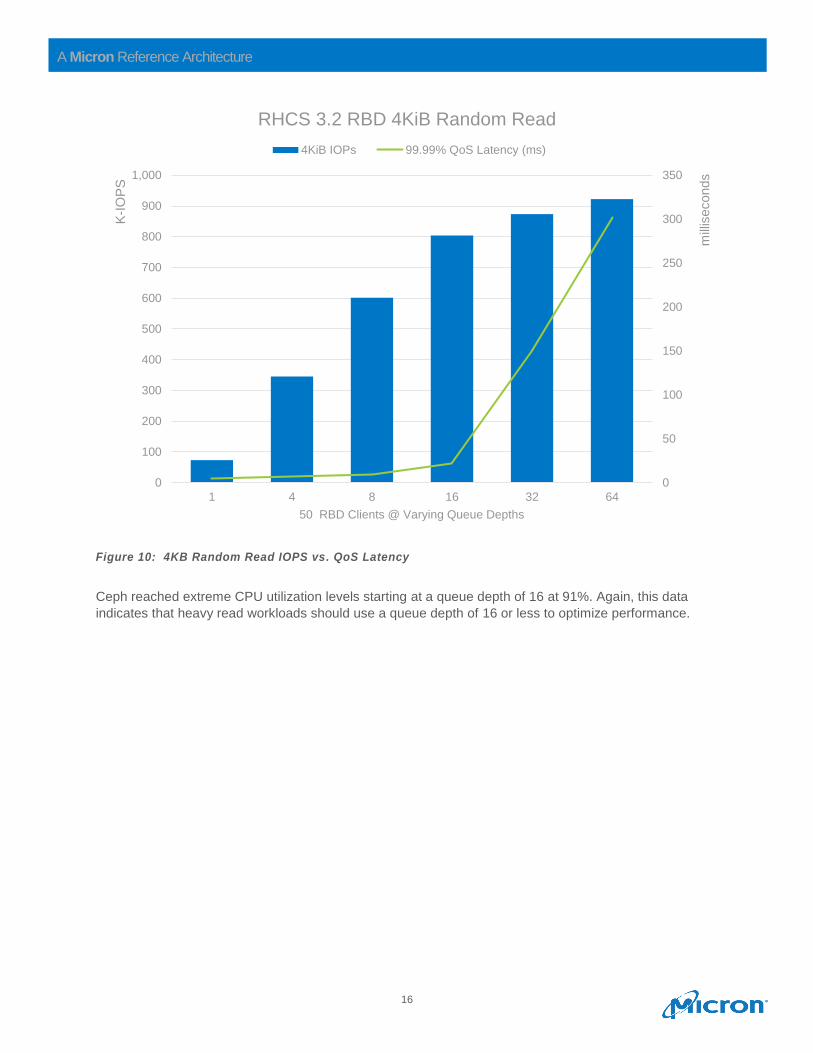
maximum of 3.5ms at queue depth = 64 (Figure 9), and QoS (99.99% tail) latency increased to a little
over 300ms (Figure 10) as queue depth increased to our test maximum of QD64, with a sharp increase at
queue depths greater than 16. Moving from a queue depth of 16 to 32 resulted in a tail latency increase of
almost 7X for only an additional 6.9% increase in IOPS performance. Based on this data, it is
recommended that heavy read workloads should use a queue depth of 16 or less to optimize
performance.
Figure 9: 4KB Random Read IOPS vs. Average Latency
0.0
0.5
1.0
1.5
2.0
2.5
3.0
3.5
4.0
0
100
200
300
400
500
600
700
800
900
1,000
1 4 8 16 32 64
mill
iseconds
K-I
OP
S
50 RBD Clients @ Varying Queue Depths
RHCS 3.2 RBD 4KiB Random Read
4KiB IOPs Average Latency (ms)
16
A Micron Reference Architecture
Figure 10: 4KB Random Read IOPS vs. QoS Latency
Ceph reached extreme CPU utilization levels starting at a queue depth of 16 at 91%. Again, this data
indicates that heavy read workloads should use a queue depth of 16 or less to optimize performance.
0
50
100
150
200
250
300
350
0
100
200
300
400
500
600
700
800
900
1,000
1 4 8 16 32 64
mill
iseconds
K-I
OP
S
50 RBD Clients @ Varying Queue Depths
RHCS 3.2 RBD 4KiB Random Read
4KiB IOPs 99.99% QoS Latency (ms)
17
A Micron Reference Architecture
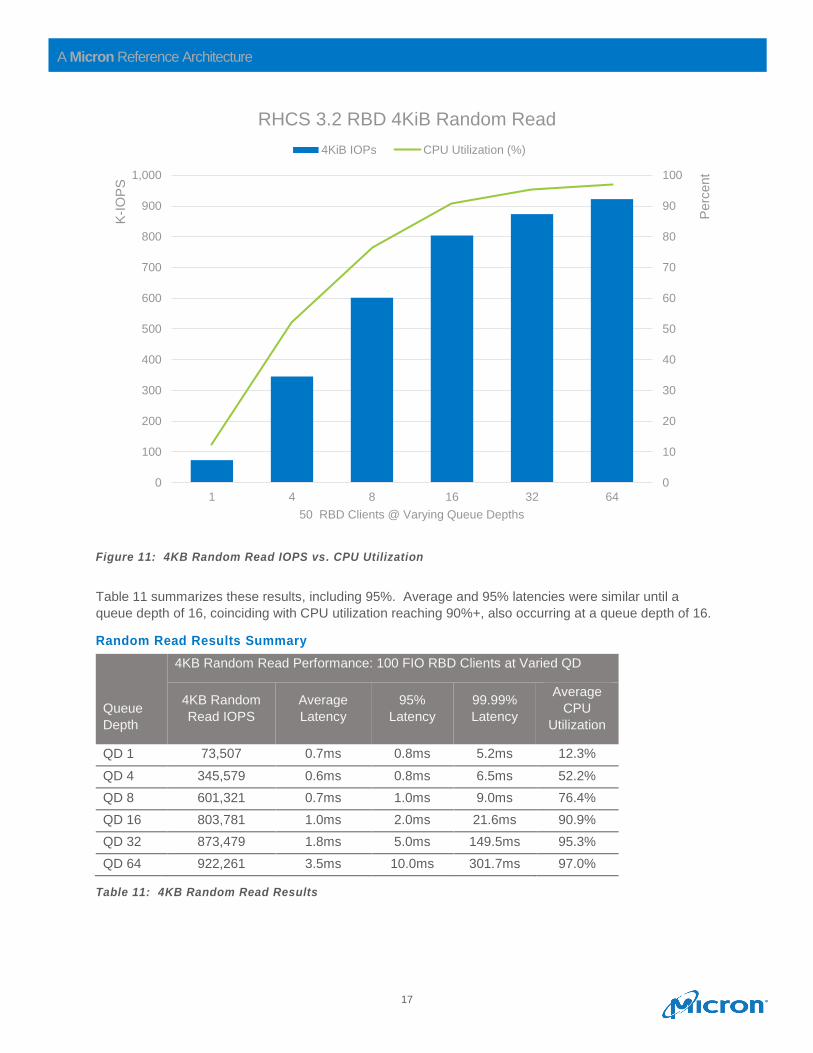
Figure 11: 4KB Random Read IOPS vs. CPU Utilization
Table 11 summarizes these results, including 95%. Average and 95% latencies were similar until a
queue depth of 16, coinciding with CPU utilization reaching 90%+, also occurring at a queue depth of 16.
Random Read Results Summary
Queue
Depth
4KB Random Read Performance: 100 FIO RBD Clients at Varied QD
4KB Random
Read IOPS
Average
Latency
95%
Latency
99.99%
Latency
Average
CPU
Utilization
QD 1 73,507 0.7ms 0.8ms 5.2ms 12.3%
QD 4 345,579 0.6ms 0.8ms 6.5ms 52.2%
QD 8 601,321 0.7ms 1.0ms 9.0ms 76.4%
QD 16 803,781 1.0ms 2.0ms 21.6ms 90.9%
QD 32 873,479 1.8ms 5.0ms 149.5ms 95.3%
QD 64 922,261 3.5ms 10.0ms 301.7ms 97.0%
Table 11: 4KB Random Read Results
0
10
20
30
40
50
60
70
80
90
100
0
100
200
300
400
500
600
700
800
900
1,000
1 4 8 16 32 64
Perc
ent
K-I
OP
S
50 RBD Clients @ Varying Queue Depths
RHCS 3.2 RBD 4KiB Random Read
4KiB IOPs CPU Utilization (%)
18
A Micron Reference Architecture
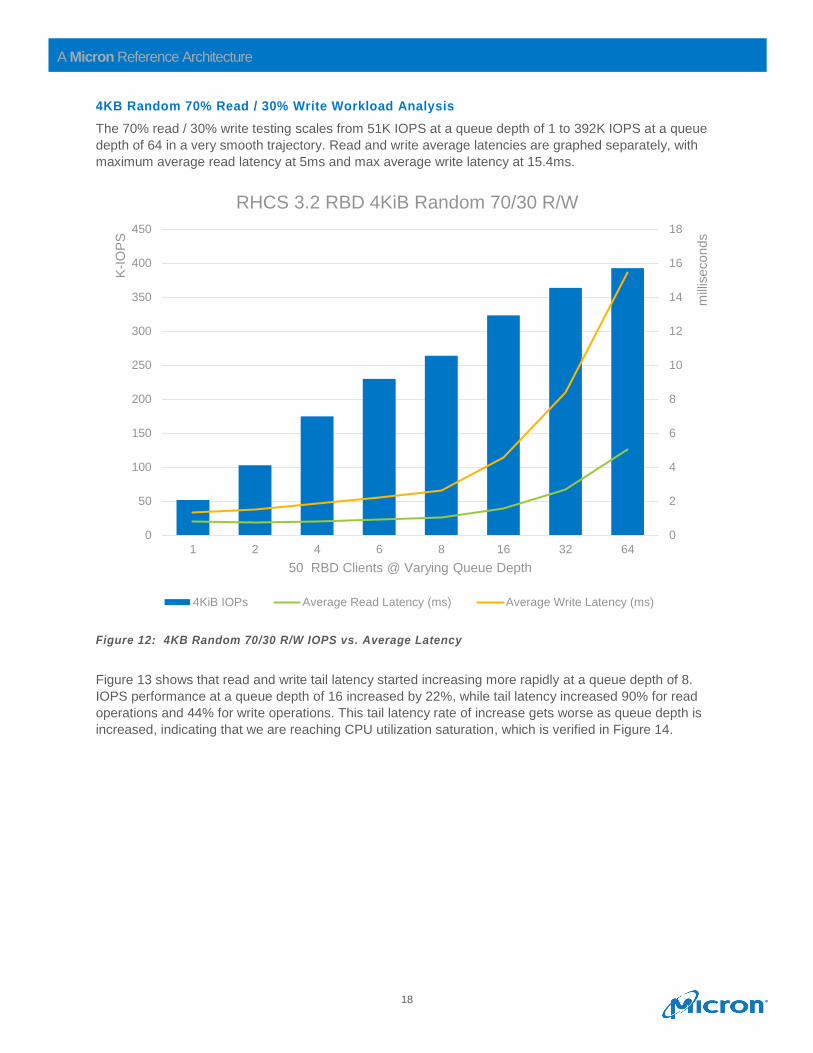
4KB Random 70% Read / 30% Write Workload Analysis
The 70% read / 30% write testing scales from 51K IOPS at a queue depth of 1 to 392K IOPS at a queue
depth of 64 in a very smooth trajectory. Read and write average latencies are graphed separately, with
maximum average read latency at 5ms and max average write latency at 15.4ms.
Figure 12: 4KB Random 70/30 R/W IOPS vs. Average Latency
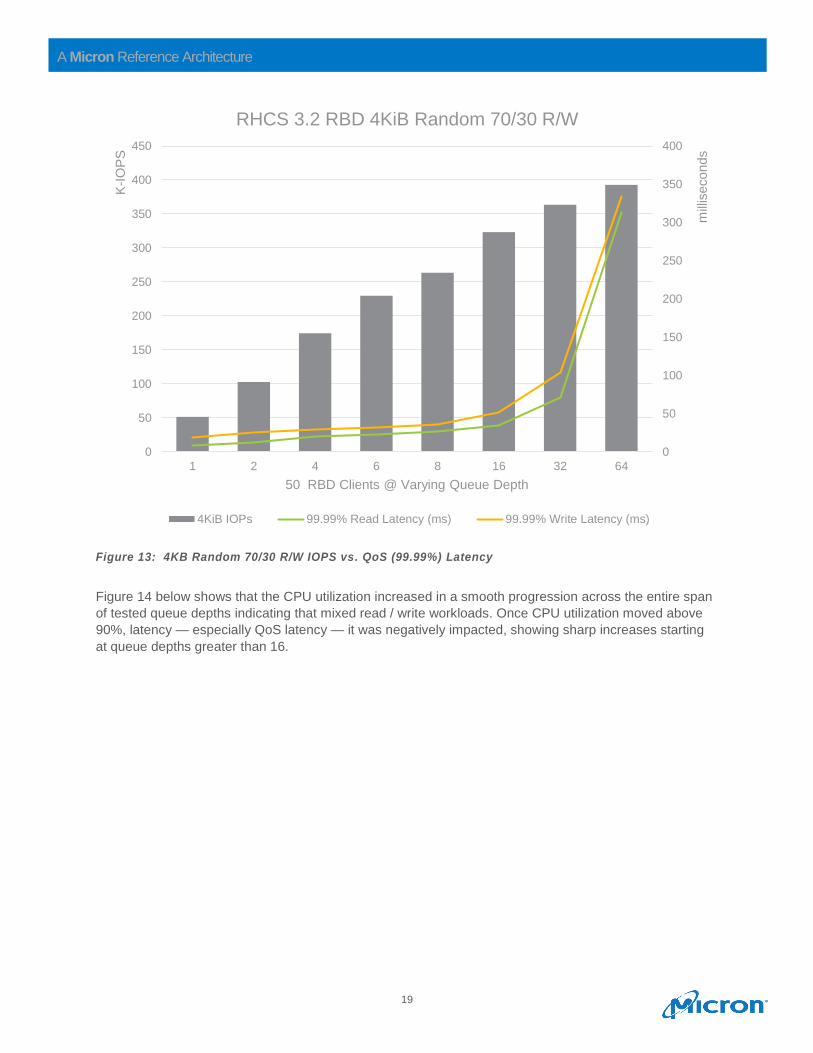
Figure 13 shows that read and write tail latency started increasing more rapidly at a queue depth of 8.
IOPS performance at a queue depth of 16 increased by 22%, while tail latency increased 90% for read
operations and 44% for write operations. This tail latency rate of increase gets worse as queue depth is
increased, indicating that we are reaching CPU utilization saturation, which is verified in Figure 14.
0
2
4
6
8
10
12
14
16
18
0
50
100
150
200
250
300
350
400
450
1 2 4 6 8 16 32 64
mill
iseconds
K-I
OP
S
50 RBD Clients @ Varying Queue Depth
RHCS 3.2 RBD 4KiB Random 70/30 R/W
4KiB IOPs Average Read Latency (ms) Average Write Latency (ms)
19
A Micron Reference Architecture
Figure 13: 4KB Random 70/30 R/W IOPS vs. QoS (99.99%) Latency
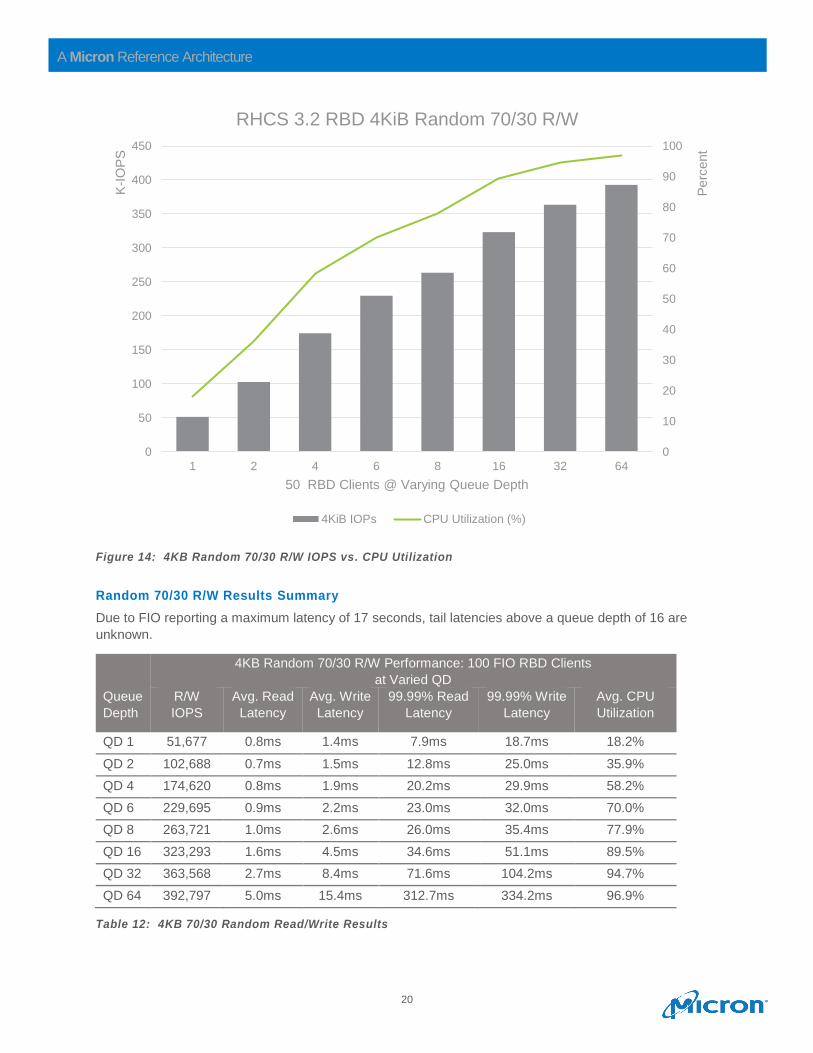
Figure 14 below shows that the CPU utilization increased in a smooth progression across the entire span
of tested queue depths indicating that mixed read / write workloads. Once CPU utilization moved above
90%, latency — especially QoS latency — it was negatively impacted, showing sharp increases starting
at queue depths greater than 16.
0
50
100
150
200
250
300
350
400
0
50
100
150
200
250
300
350
400
450
1 2 4 6 8 16 32 64
mill
iseconds
K-I
OP
S
50 RBD Clients @ Varying Queue Depth
RHCS 3.2 RBD 4KiB Random 70/30 R/W
4KiB IOPs 99.99% Read Latency (ms) 99.99% Write Latency (ms)
20
A Micron Reference Architecture
Figure 14: 4KB Random 70/30 R/W IOPS vs. CPU Utilization
Random 70/30 R/W Results Summary
Due to FIO reporting a maximum latency of 17 seconds, tail latencies above a queue depth of 16 are
unknown.
Queue
Depth
4KB Random 70/30 R/W Performance: 100 FIO RBD Clients
at Varied QD
R/W
IOPS
Avg. Read
Latency
Avg. Write
Latency
99.99% Read
Latency
99.99% Write
Latency
Avg. CPU
Utilization
QD 1 51,677 0.8ms 1.4ms 7.9ms 18.7ms 18.2%
QD 2 102,688 0.7ms 1.5ms 12.8ms 25.0ms 35.9%
QD 4 174,620 0.8ms 1.9ms 20.2ms 29.9ms 58.2%
QD 6 229,695 0.9ms 2.2ms 23.0ms 32.0ms 70.0%
QD 8 263,721 1.0ms 2.6ms 26.0ms 35.4ms 77.9%
QD 16 323,293 1.6ms 4.5ms 34.6ms 51.1ms 89.5%
QD 32 363,568 2.7ms 8.4ms 71.6ms 104.2ms 94.7%
QD 64 392,797 5.0ms 15.4ms 312.7ms 334.2ms 96.9%
Table 12: 4KB 70/30 Random Read/Write Results
0
10
20
30
40
50
60
70
80
90
100
0
50
100
150
200
250
300
350
400
450
1 2 4 6 8 16 32 64
Perc
ent
K-I
OP
S
50 RBD Clients @ Varying Queue Depth
RHCS 3.2 RBD 4KiB Random 70/30 R/W
4KiB IOPs CPU Utilization (%)
21
A Micron Reference Architecture
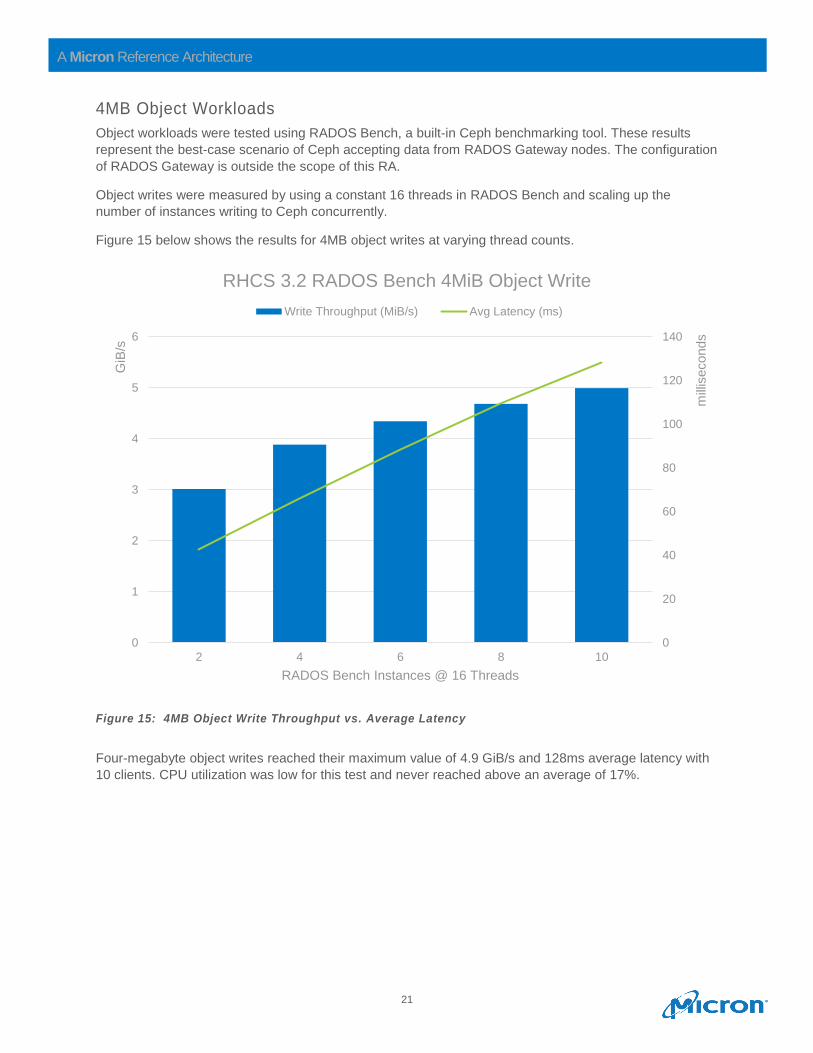
4MB Object Workloads
Object workloads were tested using RADOS Bench, a built-in Ceph benchmarking tool. These results
represent the best-case scenario of Ceph accepting data from RADOS Gateway nodes. The configuration
of RADOS Gateway is outside the scope of this RA.
Object writes were measured by using a constant 16 threads in RADOS Bench and scaling up the
number of instances writing to Ceph concurrently.
Figure 15 below shows the results for 4MB object writes at varying thread counts.
Figure 15: 4MB Object Write Throughput vs. Average Latency
Four-megabyte object writes reached their maximum value of 4.9 GiB/s and 128ms average latency with
10 clients. CPU utilization was low for this test and never reached above an average of 17%.
0
20
40
60
80
100
120
140
0
1
2
3
4
5
6
2 4 6 8 10
mill
iseconds
GiB
/s
RADOS Bench Instances @ 16 Threads
RHCS 3.2 RADOS Bench 4MiB Object Write
Write Throughput (MiB/s) Avg Latency (ms)
22
A Micron Reference Architecture
4MB Object Write Results Summary
Instances @
16 Threads
4MB Object Write Performance: RADOS Bench
Write Throughput Average Latency
2 Instances 2.9 GiB/s 42.5ms
4 Instances 3.8 GiB/s 65.9ms
6 Instances 4.2 GiB/s 88.6ms
8 Instances 4.6 GiB/s 109ms
10 Instances 4.9 GiB/s 128ms
Table 15: 4MB Object Write Results
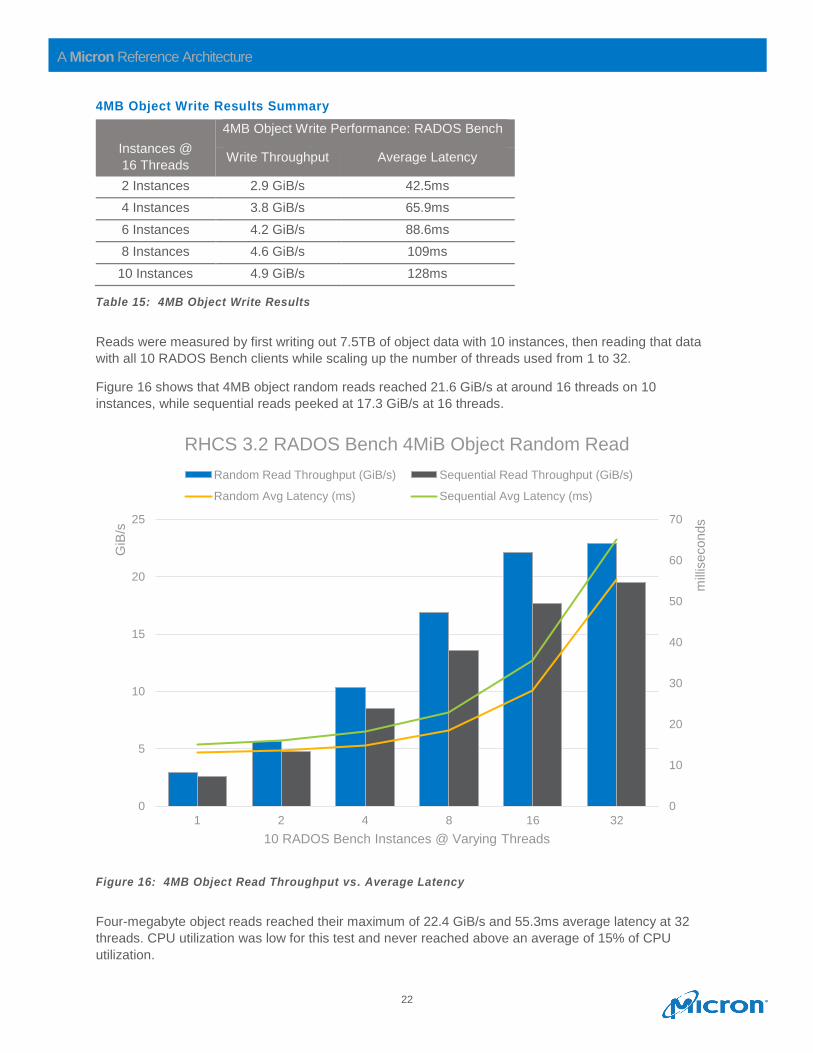
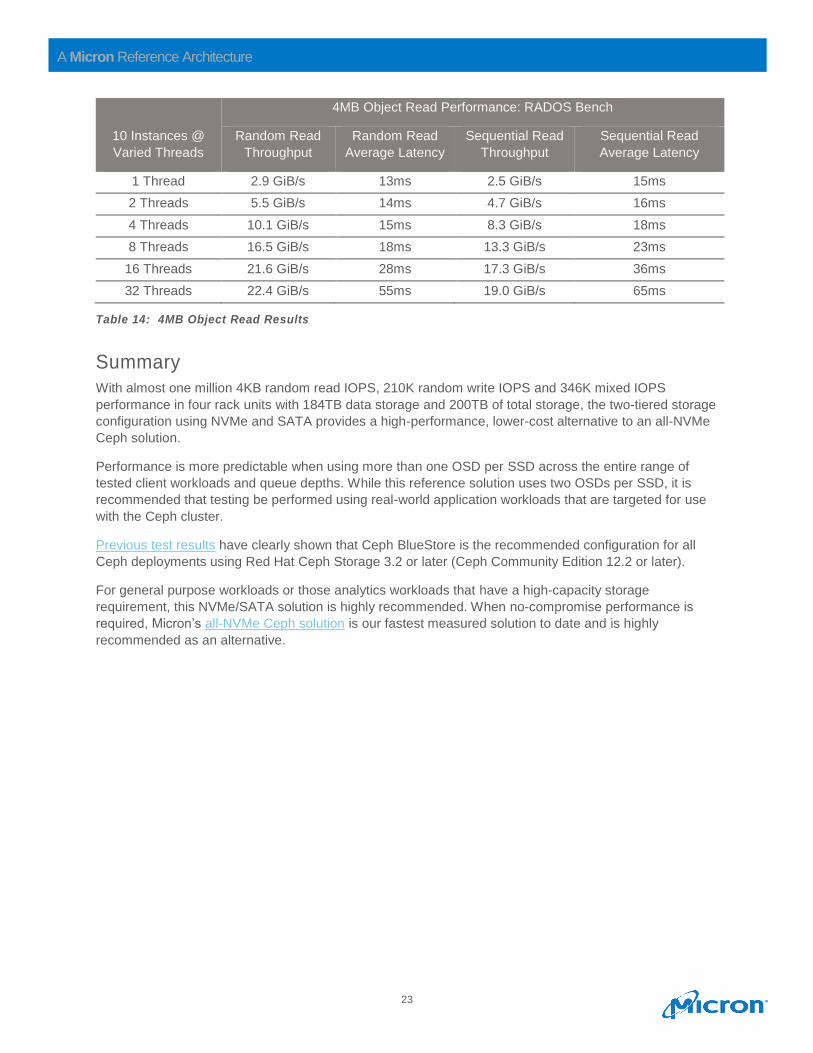
Reads were measured by first writing out 7.5TB of object data with 10 instances, then reading that data
with all 10 RADOS Bench clients while scaling up the number of threads used from 1 to 32.
Figure 16 shows that 4MB object random reads reached 21.6 GiB/s at around 16 threads on 10
instances, while sequential reads peeked at 17.3 GiB/s at 16 threads.
Figure 16: 4MB Object Read Throughput vs. Average Latency
Four-megabyte object reads reached their maximum of 22.4 GiB/s and 55.3ms average latency at 32
threads. CPU utilization was low for this test and never reached above an average of 15% of CPU
utilization.
0
10
20
30
40
50
60
70
0
5
10
15
20
25
1 2 4 8 16 32
mill
iseconds
GiB
/s
10 RADOS Bench Instances @ Varying Threads
RHCS 3.2 RADOS Bench 4MiB Object Random Read
Random Read Throughput (GiB/s) Sequential Read Throughput (GiB/s)
Random Avg Latency (ms) Sequential Avg Latency (ms)
23
A Micron Reference Architecture
10 Instances @
Varied Threads
4MB Object Read Performance: RADOS Bench
Random Read
Throughput
Random Read
Average Latency
Sequential Read
Throughput
Sequential Read
Average Latency
1 Thread 2.9 GiB/s 13ms 2.5 GiB/s 15ms
2 Threads 5.5 GiB/s 14ms 4.7 GiB/s 16ms
4 Threads 10.1 GiB/s 15ms 8.3 GiB/s 18ms
8 Threads 16.5 GiB/s 18ms 13.3 GiB/s 23ms
16 Threads 21.6 GiB/s 28ms 17.3 GiB/s 36ms
32 Threads 22.4 GiB/s 55ms 19.0 GiB/s 65ms
Table 14: 4MB Object Read Results
Summary
With almost one million 4KB random read IOPS, 210K random write IOPS and 346K mixed IOPS
performance in four rack units with 184TB data storage and 200TB of total storage, the two-tiered storage
configuration using NVMe and SATA provides a high-performance, lower-cost alternative to an all-NVMe
Ceph solution.
Performance is more predictable when using more than one OSD per SSD across the entire range of
tested client workloads and queue depths. While this reference solution uses two OSDs per SSD, it is
recommended that testing be performed using real-world application workloads that are targeted for use
with the Ceph cluster.
Previous test results have clearly shown that Ceph BlueStore is the recommended configuration for all
Ceph deployments using Red Hat Ceph Storage 3.2 or later (Ceph Community Edition 12.2 or later).
For general purpose workloads or those analytics workloads that have a high-capacity storage
requirement, this NVMe/SATA solution is highly recommended. When no-compromise performance is
required, Micron’s all-NVMe Ceph solution is our fastest measured solution to date and is highly
recommended as an alternative.
24
A Micron Reference Architecture
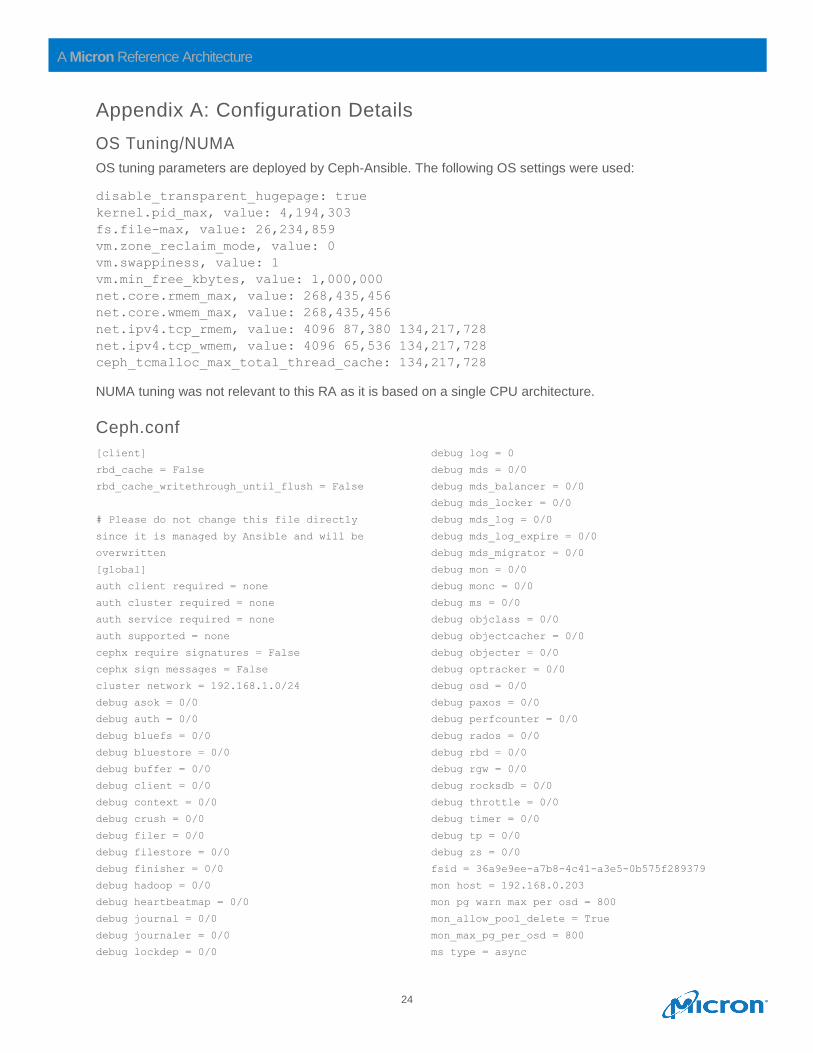
Appendix A: Configuration Details
OS Tuning/NUMA
OS tuning parameters are deployed by Ceph-Ansible. The following OS settings were used:
disable_transparent_hugepage: true
kernel.pid_max, value: 4,194,303
fs.file-max, value: 26,234,859
vm.zone_reclaim_mode, value: 0
vm.swappiness, value: 1
vm.min_free_kbytes, value: 1,000,000
net.core.rmem_max, value: 268,435,456
net.core.wmem_max, value: 268,435,456
net.ipv4.tcp_rmem, value: 4096 87,380 134,217,728
net.ipv4.tcp_wmem, value: 4096 65,536 134,217,728
ceph_tcmalloc_max_total_thread_cache: 134,217,728
NUMA tuning was not relevant to this RA as it is based on a single CPU architecture.
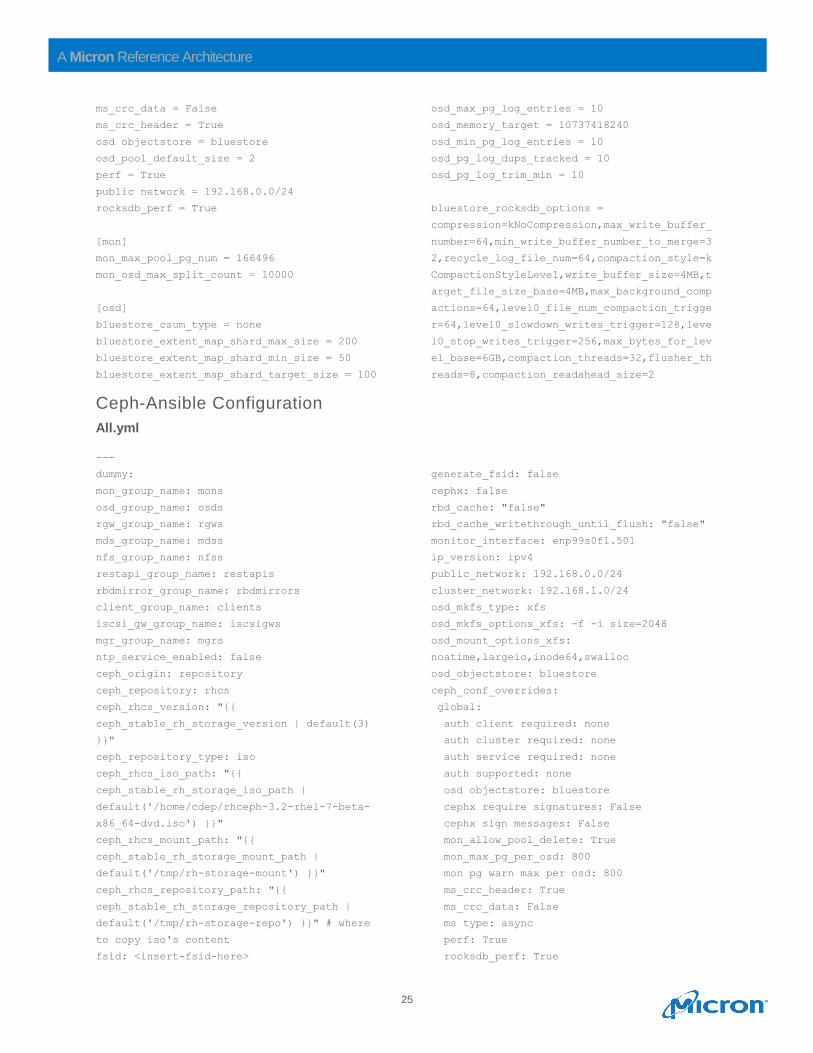
Ceph.conf
[client]
rbd_cache = False
rbd_cache_writethrough_until_flush = False
# Please do not change this file directly
since it is managed by Ansible and will be
overwritten
[global]
auth client required = none
auth cluster required = none
auth service required = none
auth supported = none
cephx require signatures = False
cephx sign messages = False
cluster network = 192.168.1.0/24
debug asok = 0/0
debug auth = 0/0
debug bluefs = 0/0
debug bluestore = 0/0
debug buffer = 0/0
debug client = 0/0
debug context = 0/0
debug crush = 0/0
debug filer = 0/0
debug filestore = 0/0
debug finisher = 0/0
debug hadoop = 0/0
debug heartbeatmap = 0/0
debug journal = 0/0
debug journaler = 0/0
debug lockdep = 0/0
debug log = 0
debug mds = 0/0
debug mds_balancer = 0/0
debug mds_locker = 0/0
debug mds_log = 0/0
debug mds_log_expire = 0/0
debug mds_migrator = 0/0
debug mon = 0/0
debug monc = 0/0
debug ms = 0/0
debug objclass = 0/0
debug objectcacher = 0/0
debug objecter = 0/0
debug optracker = 0/0
debug osd = 0/0
debug paxos = 0/0
debug perfcounter = 0/0
debug rados = 0/0
debug rbd = 0/0
debug rgw = 0/0
debug rocksdb = 0/0
debug throttle = 0/0
debug timer = 0/0
debug tp = 0/0
debug zs = 0/0
fsid = 36a9e9ee-a7b8-4c41-a3e5-0b575f289379
mon host = 192.168.0.203
mon pg warn max per osd = 800
mon_allow_pool_delete = True
mon_max_pg_per_osd = 800
ms type = async
25
A Micron Reference Architecture
ms_crc_data = False
ms_crc_header = True
osd objectstore = bluestore
osd_pool_default_size = 2
perf = True
public network = 192.168.0.0/24
rocksdb_perf = True
[mon]
mon_max_pool_pg_num = 166496
mon_osd_max_split_count = 10000
[osd]
bluestore_csum_type = none
bluestore_extent_map_shard_max_size = 200
bluestore_extent_map_shard_min_size = 50
bluestore_extent_map_shard_target_size = 100
osd_max_pg_log_entries = 10
osd_memory_target = 10737418240
osd_min_pg_log_entries = 10
osd_pg_log_dups_tracked = 10
osd_pg_log_trim_min = 10
bluestore_rocksdb_options =
compression=kNoCompression,max_write_buffer_
number=64,min_write_buffer_number_to_merge=3
2,recycle_log_file_num=64,compaction_style=k
CompactionStyleLevel,write_buffer_size=4MB,t
arget_file_size_base=4MB,max_background_comp
actions=64,level0_file_num_compaction_trigge
r=64,level0_slowdown_writes_trigger=128,leve
l0_stop_writes_trigger=256,max_bytes_for_lev
el_base=6GB,compaction_threads=32,flusher_th
reads=8,compaction_readahead_size=2
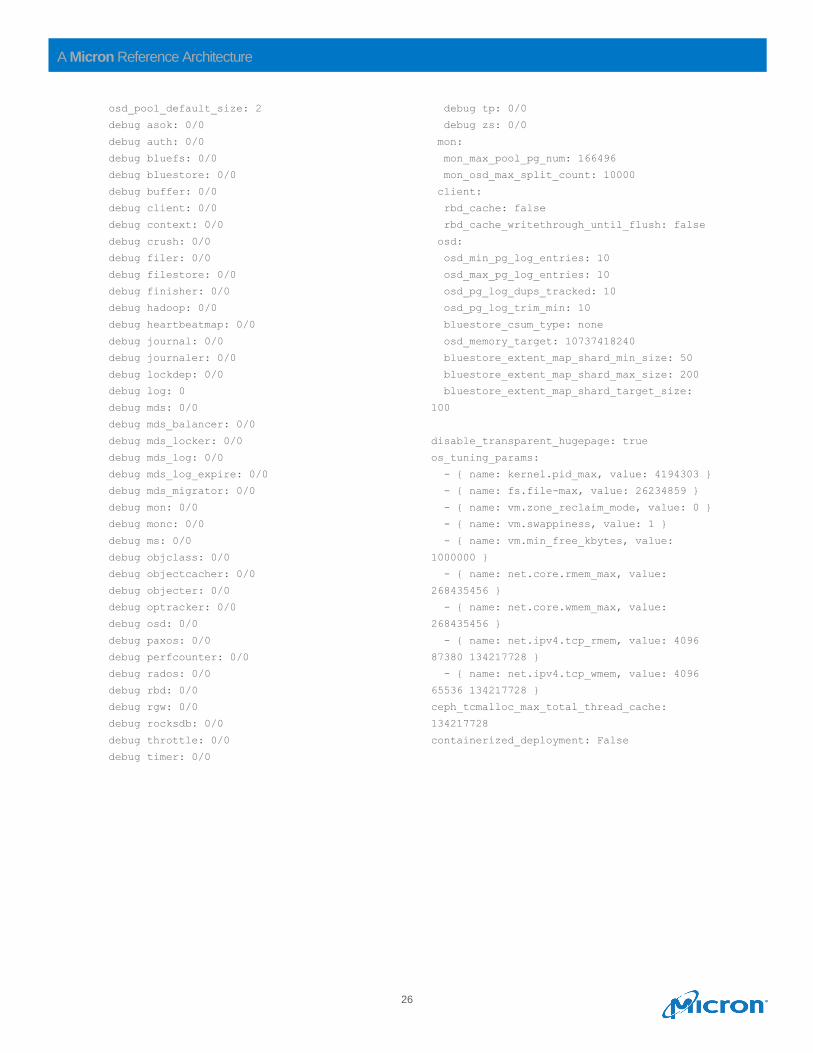
Ceph-Ansible Configuration
All.yml
---
dummy:
mon_group_name: mons
osd_group_name: osds
rgw_group_name: rgws
mds_group_name: mdss
nfs_group_name: nfss
restapi_group_name: restapis
rbdmirror_group_name: rbdmirrors
client_group_name: clients
iscsi_gw_group_name: iscsigws
mgr_group_name: mgrs
ntp_service_enabled: false
ceph_origin: repository
ceph_repository: rhcs
ceph_rhcs_version: "{{
ceph_stable_rh_storage_version | default(3)
}}"
ceph_repository_type: iso
ceph_rhcs_iso_path: "{{
ceph_stable_rh_storage_iso_path |
default('/home/cdep/rhceph-3.2-rhel-7-beta-
x86_64-dvd.iso') }}"
ceph_rhcs_mount_path: "{{
ceph_stable_rh_storage_mount_path |
default('/tmp/rh-storage-mount') }}"
ceph_rhcs_repository_path: "{{
ceph_stable_rh_storage_repository_path |
default('/tmp/rh-storage-repo') }}" # where
to copy iso's content
fsid: <insert-fsid-here>
generate_fsid: false
cephx: false
rbd_cache: "false"
rbd_cache_writethrough_until_flush: "false"
monitor_interface: enp99s0f1.501
ip_version: ipv4
public_network: 192.168.0.0/24
cluster_network: 192.168.1.0/24
osd_mkfs_type: xfs
osd_mkfs_options_xfs: -f -i size=2048
osd_mount_options_xfs:
noatime,largeio,inode64,swalloc
osd_objectstore: bluestore
ceph_conf_overrides:
global:
auth client required: none
auth cluster required: none
auth service required: none
auth supported: none
osd objectstore: bluestore
cephx require signatures: False
cephx sign messages: False
mon_allow_pool_delete: True
mon_max_pg_per_osd: 800
mon pg warn max per osd: 800
ms_crc_header: True
ms_crc_data: False
ms type: async
perf: True
rocksdb_perf: True
26
A Micron Reference Architecture
osd_pool_default_size: 2
debug asok: 0/0
debug auth: 0/0
debug bluefs: 0/0
debug bluestore: 0/0
debug buffer: 0/0
debug client: 0/0
debug context: 0/0
debug crush: 0/0
debug filer: 0/0
debug filestore: 0/0
debug finisher: 0/0
debug hadoop: 0/0
debug heartbeatmap: 0/0
debug journal: 0/0
debug journaler: 0/0
debug lockdep: 0/0
debug log: 0
debug mds: 0/0
debug mds_balancer: 0/0
debug mds_locker: 0/0
debug mds_log: 0/0
debug mds_log_expire: 0/0
debug mds_migrator: 0/0
debug mon: 0/0
debug monc: 0/0
debug ms: 0/0
debug objclass: 0/0
debug objectcacher: 0/0
debug objecter: 0/0
debug optracker: 0/0
debug osd: 0/0
debug paxos: 0/0
debug perfcounter: 0/0
debug rados: 0/0
debug rbd: 0/0
debug rgw: 0/0
debug rocksdb: 0/0
debug throttle: 0/0
debug timer: 0/0
debug tp: 0/0
debug zs: 0/0
mon:
mon_max_pool_pg_num: 166496
mon_osd_max_split_count: 10000
client:
rbd_cache: false
rbd_cache_writethrough_until_flush: false
osd:
osd_min_pg_log_entries: 10
osd_max_pg_log_entries: 10
osd_pg_log_dups_tracked: 10
osd_pg_log_trim_min: 10
bluestore_csum_type: none
osd_memory_target: 10737418240
bluestore_extent_map_shard_min_size: 50
bluestore_extent_map_shard_max_size: 200
bluestore_extent_map_shard_target_size:
100
disable_transparent_hugepage: true
os_tuning_params:
- { name: kernel.pid_max, value: 4194303 }
- { name: fs.file-max, value: 26234859 }
- { name: vm.zone_reclaim_mode, value: 0 }
- { name: vm.swappiness, value: 1 }
- { name: vm.min_free_kbytes, value:
1000000 }
- { name: net.core.rmem_max, value:
268435456 }
- { name: net.core.wmem_max, value:
268435456 }
- { name: net.ipv4.tcp_rmem, value: 4096
87380 134217728 }
- { name: net.ipv4.tcp_wmem, value: 4096
65536 134217728 }
ceph_tcmalloc_max_total_thread_cache:
134217728
containerized_deployment: False
27
A Micron Reference Architecture
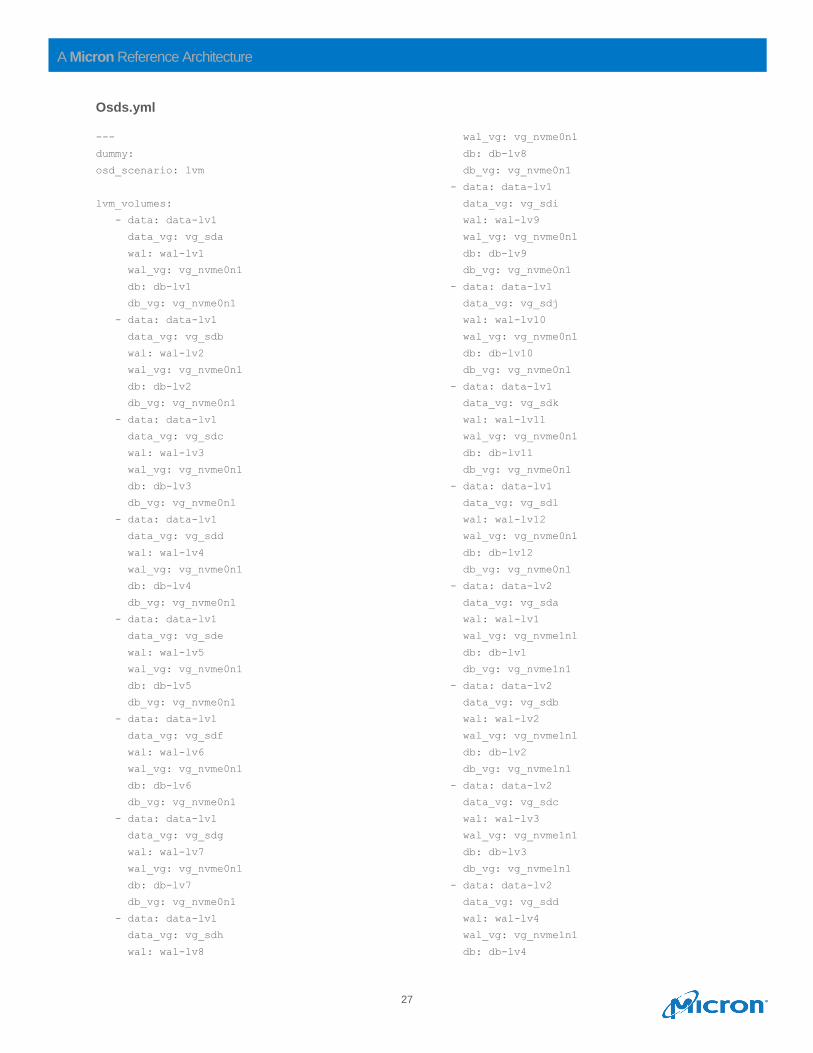
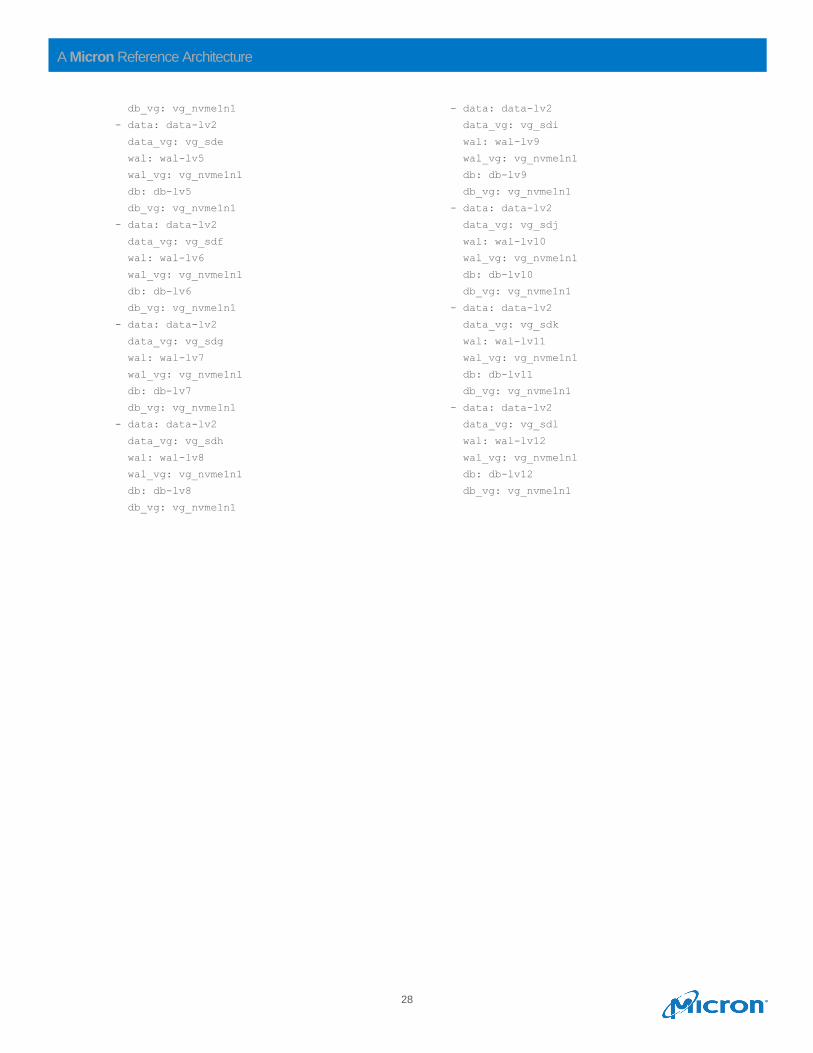
Osds.yml
---
dummy:
osd_scenario: lvm
lvm_volumes:
- data: data-lv1
data_vg: vg_sda
wal: wal-lv1
wal_vg: vg_nvme0n1
db: db-lv1
db_vg: vg_nvme0n1
- data: data-lv1
data_vg: vg_sdb
wal: wal-lv2
wal_vg: vg_nvme0n1
db: db-lv2
db_vg: vg_nvme0n1
- data: data-lv1
data_vg: vg_sdc
wal: wal-lv3
wal_vg: vg_nvme0n1
db: db-lv3
db_vg: vg_nvme0n1
- data: data-lv1
data_vg: vg_sdd
wal: wal-lv4
wal_vg: vg_nvme0n1
db: db-lv4
db_vg: vg_nvme0n1
- data: data-lv1
data_vg: vg_sde
wal: wal-lv5
wal_vg: vg_nvme0n1
db: db-lv5
db_vg: vg_nvme0n1
- data: data-lv1
data_vg: vg_sdf
wal: wal-lv6
wal_vg: vg_nvme0n1
db: db-lv6
db_vg: vg_nvme0n1
- data: data-lv1
data_vg: vg_sdg
wal: wal-lv7
wal_vg: vg_nvme0n1
db: db-lv7
db_vg: vg_nvme0n1
- data: data-lv1
data_vg: vg_sdh
wal: wal-lv8
wal_vg: vg_nvme0n1
db: db-lv8
db_vg: vg_nvme0n1
- data: data-lv1
data_vg: vg_sdi
wal: wal-lv9
wal_vg: vg_nvme0n1
db: db-lv9
db_vg: vg_nvme0n1
- data: data-lv1
data_vg: vg_sdj
wal: wal-lv10
wal_vg: vg_nvme0n1
db: db-lv10
db_vg: vg_nvme0n1
- data: data-lv1
data_vg: vg_sdk
wal: wal-lv11
wal_vg: vg_nvme0n1
db: db-lv11
db_vg: vg_nvme0n1
- data: data-lv1
data_vg: vg_sdl
wal: wal-lv12
wal_vg: vg_nvme0n1
db: db-lv12
db_vg: vg_nvme0n1
- data: data-lv2
data_vg: vg_sda
wal: wal-lv1
wal_vg: vg_nvme1n1
db: db-lv1
db_vg: vg_nvme1n1
- data: data-lv2
data_vg: vg_sdb
wal: wal-lv2
wal_vg: vg_nvme1n1
db: db-lv2
db_vg: vg_nvme1n1
- data: data-lv2
data_vg: vg_sdc
wal: wal-lv3
wal_vg: vg_nvme1n1
db: db-lv3
db_vg: vg_nvme1n1
- data: data-lv2
data_vg: vg_sdd
wal: wal-lv4
wal_vg: vg_nvme1n1
db: db-lv4
28
A Micron Reference Architecture
db_vg: vg_nvme1n1
- data: data-lv2
data_vg: vg_sde
wal: wal-lv5
wal_vg: vg_nvme1n1
db: db-lv5
db_vg: vg_nvme1n1
- data: data-lv2
data_vg: vg_sdf
wal: wal-lv6
wal_vg: vg_nvme1n1
db: db-lv6
db_vg: vg_nvme1n1
- data: data-lv2
data_vg: vg_sdg
wal: wal-lv7
wal_vg: vg_nvme1n1
db: db-lv7
db_vg: vg_nvme1n1
- data: data-lv2
data_vg: vg_sdh
wal: wal-lv8
wal_vg: vg_nvme1n1
db: db-lv8
db_vg: vg_nvme1n1
- data: data-lv2
data_vg: vg_sdi
wal: wal-lv9
wal_vg: vg_nvme1n1
db: db-lv9
db_vg: vg_nvme1n1
- data: data-lv2
data_vg: vg_sdj
wal: wal-lv10
wal_vg: vg_nvme1n1
db: db-lv10
db_vg: vg_nvme1n1
- data: data-lv2
data_vg: vg_sdk
wal: wal-lv11
wal_vg: vg_nvme1n1
db: db-lv11
db_vg: vg_nvme1n1
- data: data-lv2
data_vg: vg_sdl
wal: wal-lv12
wal_vg: vg_nvme1n1
db: db-lv12
db_vg: vg_nvme1n1
29
A Micron Reference Architecture
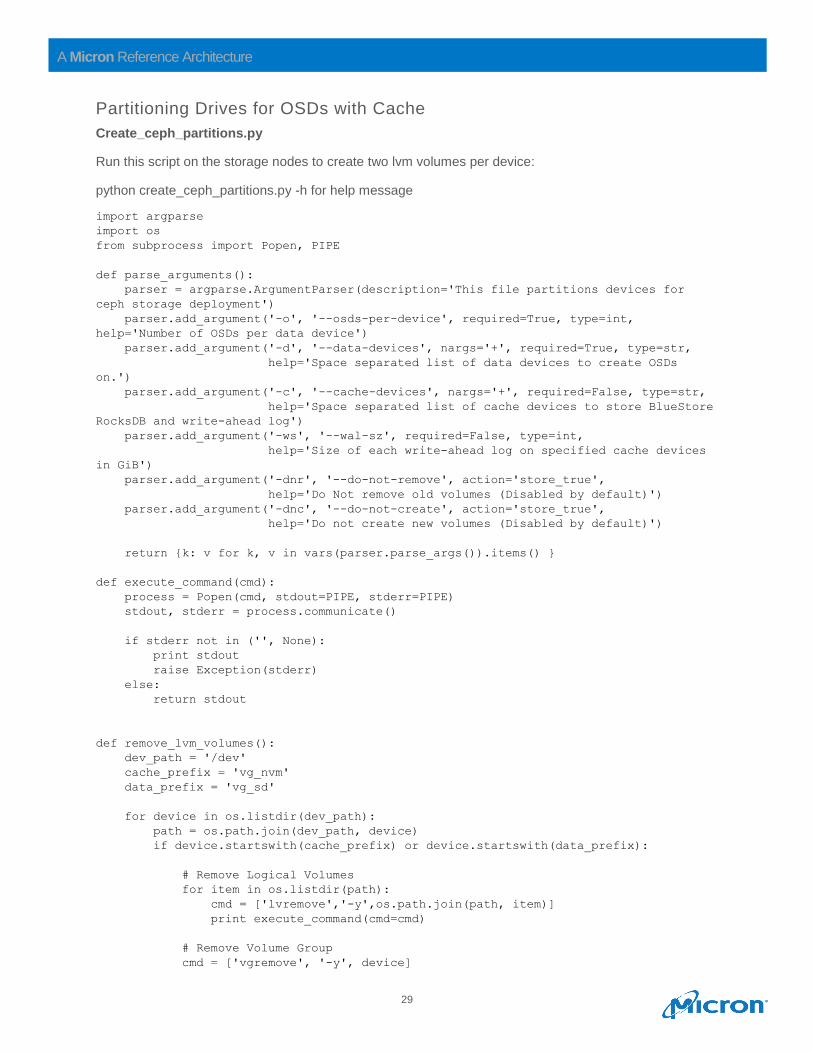
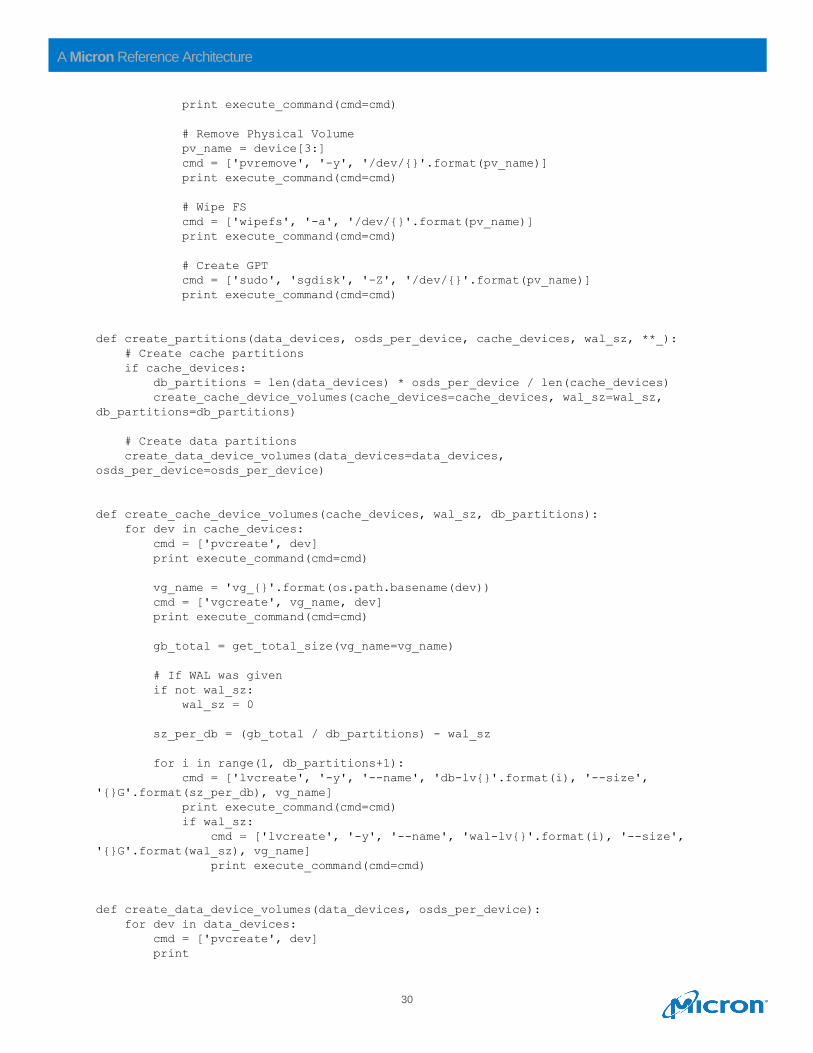
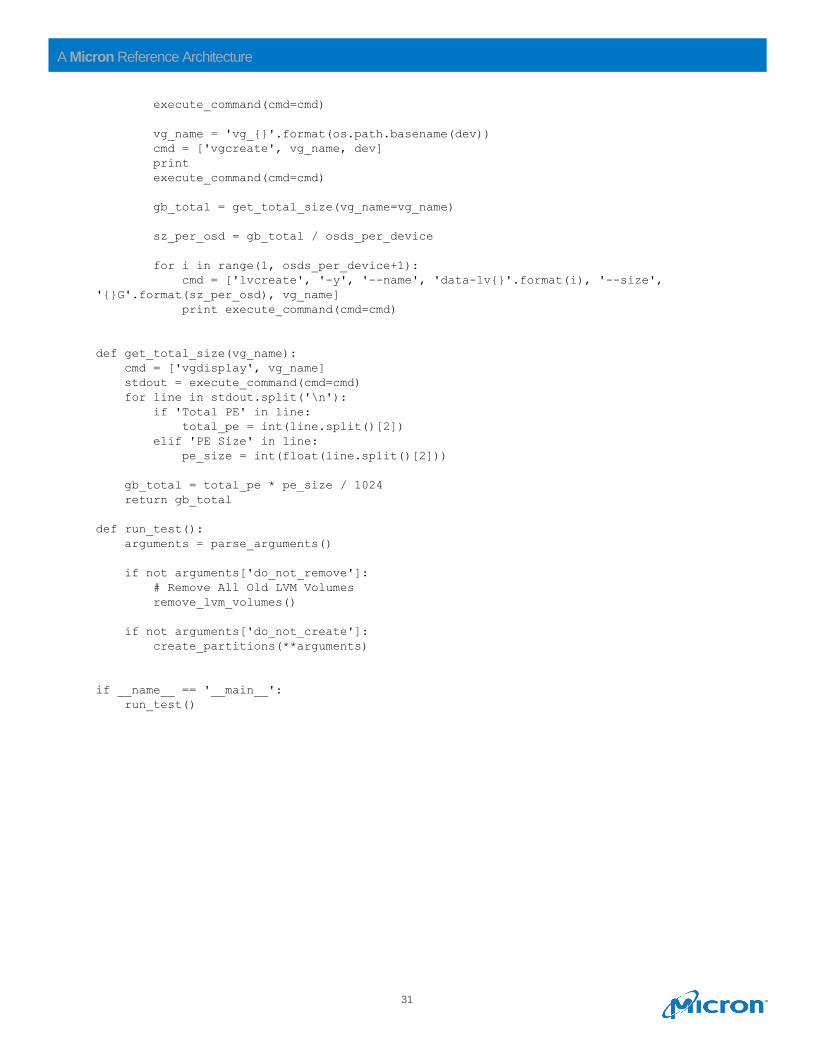
Partitioning Drives for OSDs with Cache
Create_ceph_partitions.py
Run this script on the storage nodes to create two lvm volumes per device:
python create_ceph_partitions.py -h for help message
import argparse
import os
from subprocess import Popen, PIPE
def parse_arguments():
parser = argparse.ArgumentParser(description='This file partitions devices for
ceph storage deployment')
parser.add_argument('-o', '--osds-per-device', required=True, type=int,
help='Number of OSDs per data device')
parser.add_argument('-d', '--data-devices', nargs='+', required=True, type=str,
help='Space separated list of data devices to create OSDs
on.')
parser.add_argument('-c', '--cache-devices', nargs='+', required=False, type=str,
help='Space separated list of cache devices to store BlueStore
RocksDB and write-ahead log')
parser.add_argument('-ws', '--wal-sz', required=False, type=int,
help='Size of each write-ahead log on specified cache devices
in GiB')
parser.add_argument('-dnr', '--do-not-remove', action='store_true',
help='Do Not remove old volumes (Disabled by default)')
parser.add_argument('-dnc', '--do-not-create', action='store_true',
help='Do not create new volumes (Disabled by default)')
return {k: v for k, v in vars(parser.parse_args()).items() }
def execute_command(cmd):
process = Popen(cmd, stdout=PIPE, stderr=PIPE)
stdout, stderr = process.communicate()
if stderr not in ('', None):
print stdout
raise Exception(stderr)
else:
return stdout
def remove_lvm_volumes():
dev_path = '/dev'
cache_prefix = 'vg_nvm'
data_prefix = 'vg_sd'
for device in os.listdir(dev_path):
path = os.path.join(dev_path, device)
if device.startswith(cache_prefix) or device.startswith(data_prefix):
# Remove Logical Volumes
for item in os.listdir(path):
cmd = ['lvremove','-y',os.path.join(path, item)]
print execute_command(cmd=cmd)
# Remove Volume Group
cmd = ['vgremove', '-y', device]
30
A Micron Reference Architecture
print execute_command(cmd=cmd)
# Remove Physical Volume
pv_name = device[3:]
cmd = ['pvremove', '-y', '/dev/{}'.format(pv_name)]
print execute_command(cmd=cmd)
# Wipe FS
cmd = ['wipefs', '-a', '/dev/{}'.format(pv_name)]
print execute_command(cmd=cmd)
# Create GPT
cmd = ['sudo', 'sgdisk', '-Z', '/dev/{}'.format(pv_name)]
print execute_command(cmd=cmd)
def create_partitions(data_devices, osds_per_device, cache_devices, wal_sz, **_):
# Create cache partitions
if cache_devices:
db_partitions = len(data_devices) * osds_per_device / len(cache_devices)
create_cache_device_volumes(cache_devices=cache_devices, wal_sz=wal_sz,
db_partitions=db_partitions)
# Create data partitions
create_data_device_volumes(data_devices=data_devices,
osds_per_device=osds_per_device)
def create_cache_device_volumes(cache_devices, wal_sz, db_partitions):
for dev in cache_devices:
cmd = ['pvcreate', dev]
print execute_command(cmd=cmd)
vg_name = 'vg_{}'.format(os.path.basename(dev))
cmd = ['vgcreate', vg_name, dev]
print execute_command(cmd=cmd)
gb_total = get_total_size(vg_name=vg_name)
# If WAL was given
if not wal_sz:
wal_sz = 0
sz_per_db = (gb_total / db_partitions) - wal_sz
for i in range(1, db_partitions+1):
cmd = ['lvcreate', '-y', '--name', 'db-lv{}'.format(i), '--size',
'{}G'.format(sz_per_db), vg_name]
print execute_command(cmd=cmd)
if wal_sz:
cmd = ['lvcreate', '-y', '--name', 'wal-lv{}'.format(i), '--size',
'{}G'.format(wal_sz), vg_name]
print execute_command(cmd=cmd)
def create_data_device_volumes(data_devices, osds_per_device):
for dev in data_devices:
cmd = ['pvcreate', dev]
31
A Micron Reference Architecture
execute_command(cmd=cmd)
vg_name = 'vg_{}'.format(os.path.basename(dev))
cmd = ['vgcreate', vg_name, dev]
execute_command(cmd=cmd)
gb_total = get_total_size(vg_name=vg_name)
sz_per_osd = gb_total / osds_per_device
for i in range(1, osds_per_device+1):
cmd = ['lvcreate', '-y', '--name', 'data-lv{}'.format(i), '--size',
'{}G'.format(sz_per_osd), vg_name]
print execute_command(cmd=cmd)
def get_total_size(vg_name):
cmd = ['vgdisplay', vg_name]
stdout = execute_command(cmd=cmd)
for line in stdout.split('\n'):
if 'Total PE' in line:
total_pe = int(line.split()[2])
elif 'PE Size' in line:
pe_size = int(float(line.split()[2]))
gb_total = total_pe * pe_size / 1024
return gb_total
def run_test():
arguments = parse_arguments()
if not arguments['do_not_remove']:
# Remove All Old LVM Volumes
remove_lvm_volumes()
if not arguments['do_not_create']:
create_partitions(**arguments)
if __name__ == '__main__':
run_test()
32
A Micron Reference Architecture
About Micron
Micron Technology (Nasdaq: MU) is a world leader in innovative memory solutions. Through our global
brands — Micron, Crucial® and Ballistix® — our broad portfolio of high-performance memory technologies,
including DRAM, NAND and NOR memory, is transforming how the world uses information. Backed by
more than 35 years of technology leadership, Micron's memory solutions enable the world's most
innovative computing, consumer, enterprise storage, data center, mobile, embedded, and automotive
applications. To learn more about Micron, and our complete portfolio of storage and memory products,
visit micron.com.
About Red Hat®
Red Hat is the world’s leading provider of open source software solutions, using a community-powered
approach to provide reliable and high-performing cloud, Linux, middleware, storage, and virtualization
technologies. Red Hat also offers award-winning support, training, and consulting services. As a
connective hub in a global network of enterprises, partners, and open source communities, Red Hat helps
create relevant, innovative technologies that liberate resources for growth and prepare customers for the
future of IT.
About Ceph Storage
Ceph is an open-source distributed object and file storage solution designed to provide excellent
performance, reliability and scalability. It can:
• Free you from the expensive lock-in of proprietary, hardware-based storage solutions.
• Consolidate labor and storage costs into 1 versatile solution.
• Introduce cost-effective scalability on self-healing clusters based on standard servers and disks.
micron.com ©2019 Micron Technology, Inc. All rights reserved. All information herein is provided on as “AS IS” basis without warranties of any kind, including any implied warranties, warranties of merchantability or warranties of fitness for a particular purpose. Micron, the Micron logo, and all other Micron trademarks are the property of Micron Technology, Inc. All other trademarks are the property of their respective owners. No hardware, software or system can provide absolute security and protection of data under all conditions. Micron assumes no liability for lost, stolen or corrupted data arising from the use of any Micron product, including those products that incorporate any of the mentioned security features. Products are warranted only to meet Micron’s production data sheet specifications. Products, programs and specifications are subject to change without notice. Dates are estimates only. All data and statements within this document were developed by Micron with cooperation of the vendors used. All vendors have reviewed the content for accuracy. Rev. A 03/19 CCM004-676576390-11275