Embed Size (px)
Citation preview
Micromechanics and Microstructure of WC Hard Metals Karyn Muir
Honeoye Falls – Lima High School Advisor: Professor John Lambropoulos
University of Rochester-Laboratory for Laser Energetics, 250 E. River Rd., Rochester NY 14623-1299
Abstract
Tungsten Carbide (WC), a composite material that contains ceramic grains of tungsten carbide within a binder of nickel or cobalt, combines the qualities of both metals and ceramics allowing it to be very strong. Several properties of these types of materials are typically measured, such as Young’s modulus of elasticity (E), hardness (H) (Rockwell HRA or Vickers Hv), and fracture toughness (Kc). Both Young’s modulus and hardness are relatively easy to measure but, because WC is so strong, Kc is difficult to measure. Therefore, it would be convenient to be able to estimate the fracture toughness of a material as a function of its hardness and modulus of elasticity. This project addresses the estimation of fracture toughness, the inverse determination of binder content (binder mass %), and the microstructure of WC composites. Two micromechanical models were used that allow the estimation of Kc based on the easily measurable properties E and H. The Laugier model proved to apply fairly well with some of the WC fracture data, though not all of the data. The model parameters were then optimized, and the correlation improved. The model created as part of this project apparently applies better for two published sets of fracture toughness data. The two models were then applied to the fracture toughness of novel non-magnetic WC samples (with Ni binder.) We have also developed a mass density model that allows the calculation of the density of WC as a function of the densities of the components (WC and binder) and the mass percent of the binder. Inversely, the model can predict the binder mass percent given the density of the WC composite. Parallel work addressed the measurement of important microstructural features of WC. In order to better understand these, five different samples including Fujilloy M10 and M45, Basic Carbide BC 12N, Kennametal K80, and Cerbide (a binderless WC) were analyzed. Surface roughness measurements were taken using the Zygo interferometer, optical images were taken using the Leica microscope, and SEM micrographs were taken in order to assess the grain structure, allowing the measurement of grain size, contiguity, and binder mean free path.
1. Introduction Tungsten Carbide, or WC, is a compound that consists of hard grains of the
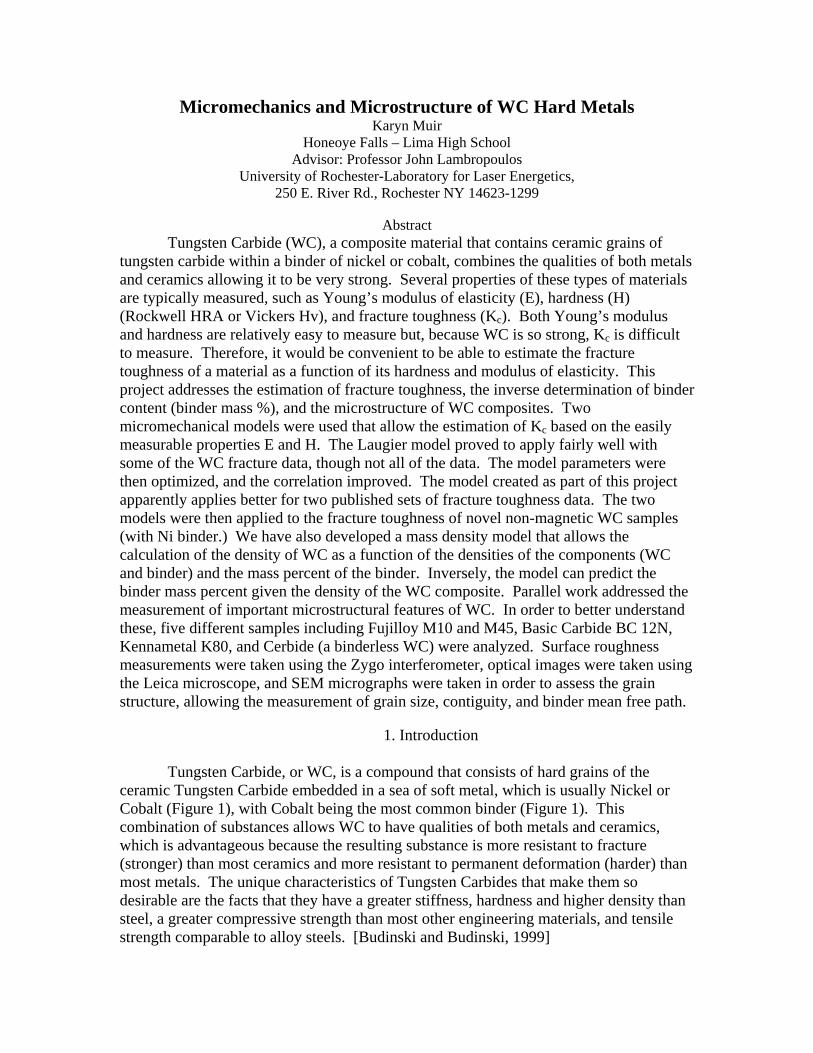
ceramic Tungsten Carbide embedded in a sea of soft metal, which is usually Nickel or Cobalt (Figure 1), with Cobalt being the most common binder (Figure 1). This combination of substances allows WC to have qualities of both metals and ceramics, which is advantageous because the resulting substance is more resistant to fracture (stronger) than most ceramics and more resistant to permanent deformation (harder) than most metals. The unique characteristics of Tungsten Carbides that make them so desirable are the facts that they have a greater stiffness, hardness and higher density than steel, a greater compressive strength than most other engineering materials, and tensile strength comparable to alloy steels. [Budinski and Budinski, 1999]
A B
Figure 1: - An SEM micrograph of a sample of
BC 12N. Tungsten Carbide consists of hard grains of Tungsten Carbide (A) surrounded by a sea of soft metal, which is usually Ni or Co. (B)
Commonly, WC is made by compaction, where Tungsten powder is milled with
the binder to reduce the carbide particle size. Then a sintering process is used to melt and combine the materials. As a result of this process, the ceramic grains make the composite WC extremely hard, but instead of being brittle like other ceramics, the softer metal strongly holds the composite together. Other qualities include negligible porosity, and high hardness and compressive strength. This all results in excellent resistance to low stress abrasive wear, and among its many uses, WC has been used in precision molds for optics.
In order to best use WC, the understanding of the machinability of both magnetic and non-magnetic versions of this compound is necessary. To understand the machinability, the characteristics of Tungsten Carbide must be understood, such as density, binder and grain mass percent, hardness (Vickers and Rockwell A), Young’s modulus (E), energy release rate (Gc), and fracture toughness (Kc). The microstructural features should be analyzed as well.
2. Terminology
To describe and measure the microstructure and mechanical properties of WC composites, several terms must be introduced.
Density is the mass of a substance divided by the volume of a substance (Units kg/m3).
Mass percent is the mass of a component (usually the binder) divided by the total mass of the composite. For the purposes of this project it is either the mass of the binder or the grains, divided by the sum of the masses of the binder and the grains.
Hardness can be measured in several ways, and in this project Vickers and Rockwell A hardness tests were used. The Rockwell A scale is dimensionless, but Vickers hardness uses units of GPa. To measure the hardness, both tests use the indentation method, where a diamond indenter is pushed into a material with a given force, and the resulting indent, or footprint “size” is used to determine the hardness. Though the process is the same for both tests, the differences are in the force extended on the indenter, and the size of the indenter. Vickers tests use a square pyramidal indenter with a 1g to 2000g
force, while Rockwell A tests use a spherical intenter with a 50kg force. The values obtained by these two tests are usually not comparable. [Callister, 1994]
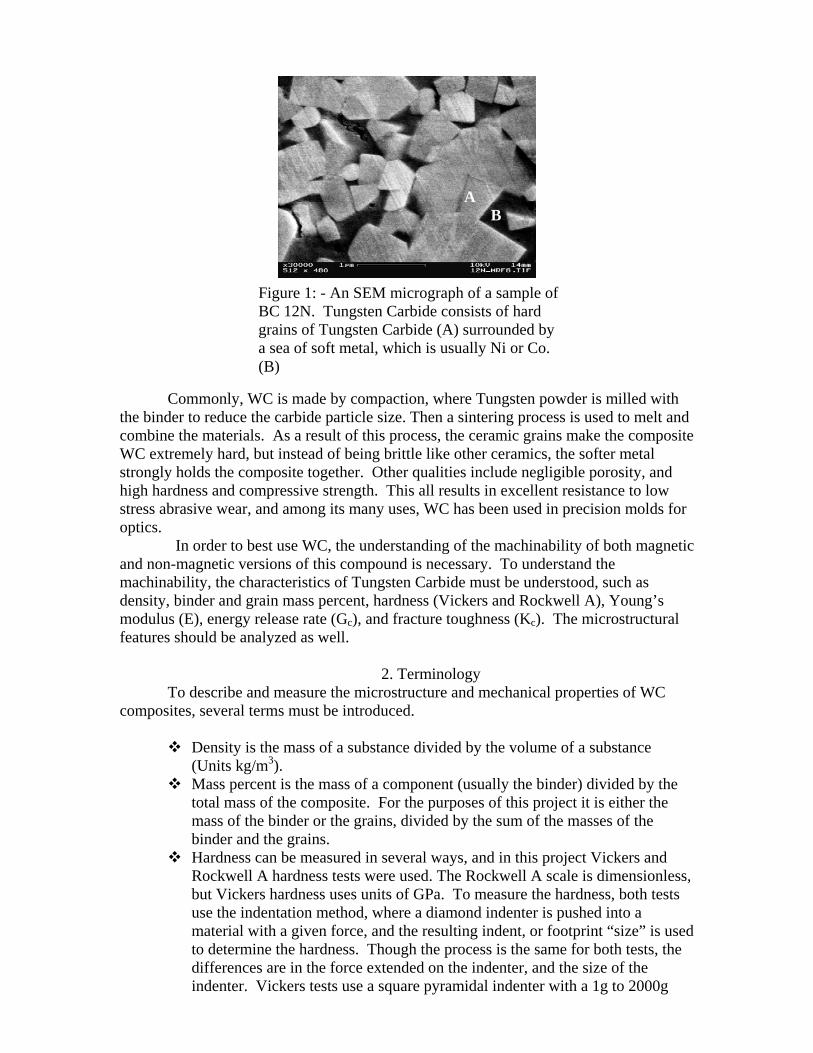
Young’s modulus, or E, is the ratio of stress to strain of a given substance for small (or recoverable) amounts of strain. This value is used to give its elastic stiffness, and is measured in GPa. It is usually the elastic modulus for tension. To measure this value, uniaxial forces are applied to an elongated sample. The cross sectional areas of the sections on which the forces are applied are measured, as well as the gauge length between these areas. Then the stress, or the force divided by the area, is plotted versus the strain, or the change in length divided by the original length. This will produce a straight line (for small strains), and the slope of this line is Young’s Modulus (Figure 2).
Fracture Toughness, or Kc, is the most important material parameter used in
fracture mechanics. [Callister, 1994]. Measured in MPa*m1/2, it is most commonly used for failure analysis. To measure Kc, a crack is introduced in a sample and the system is loaded to propagate the crack. The tougher the sample is, the smaller the crack growth will be and the higher the Kc (Figure 3).
Figure 3: - A diagram of how to measure Fracture Toughness, or Kc.
Figure 2: - A diagram of how Young’s Modulus, or E, is measured.
F
F
Lo
F A
(stress)
Δ L (strain) Lo
A
E
1
F/2 F/2
F
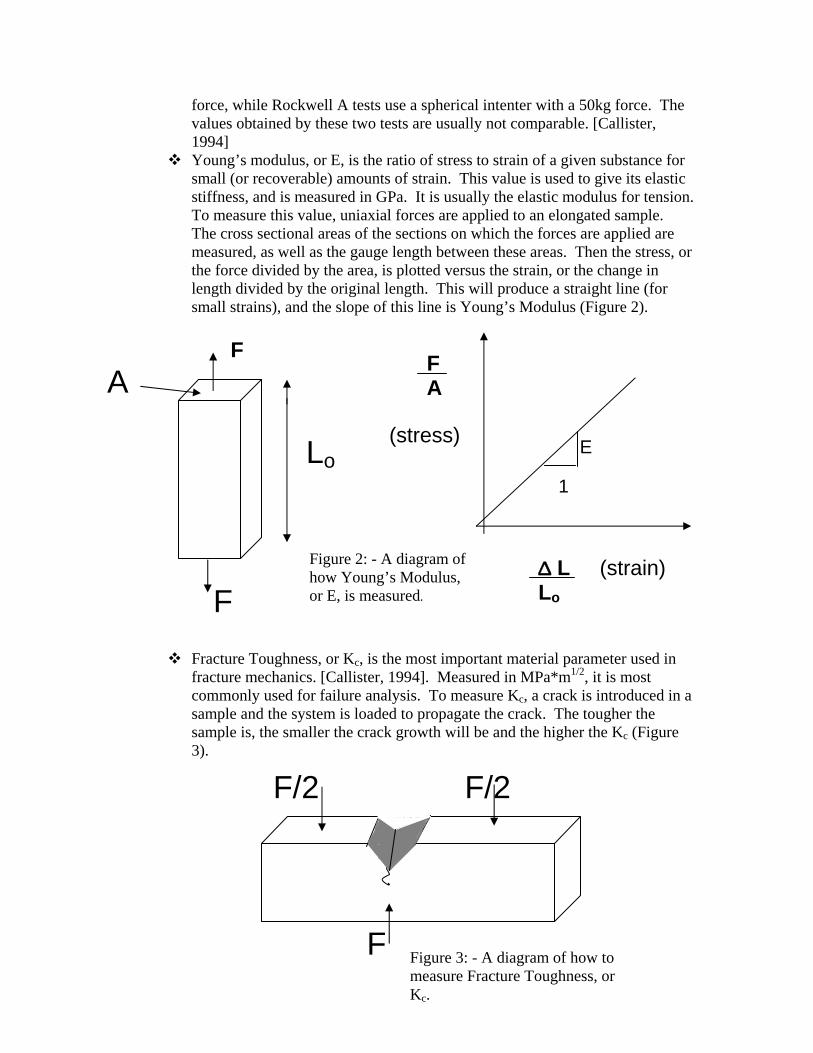
The Energy Release Rate, or Gc, is defined as Gc = Kc2/E (units of J/m2). It
provides the amount of total energy that must be expended to produce a unit increase in the crack surface area. (Figure 4).
Figure 4: - A diagram of how the energy release rate, or Gc is measured.
Mean binder free path is the distance between grains in a sample.
Contiguity is the percentage of grains touching in a sample.
3. Mass Density Model
One of the initial steps in this project was to find a way to correlate the mass density and binder mass content of WC. In the mass density model I created, I used the separate densities of the binder, or “soft” phase, and the WC, or “hard” phase, along with the mass percent (%) of the binder. The mass density model leads to
where and with 1 being the binder (softer phase) and 2 being the WC (harder phase). The model has the advantages of not depending on phase shape, size or contiguity. Not only can it be used to predict M for given , but it can also be used inversely to predict for given M. A plot of the mass density model is shown in Figure 5.
Energy E
ΔEnergy E- E
ΔA G = ΔE (J/m2) ΔA
121
21
ρρρρρ
ρΜ−Μ+
∗=
1
11 v
m=ρ
2
22 v
m=ρ
21
21
vv +mm +
=ρ21
1
mm+m
=Μ
ρρ
Mass Density Model (LLE, 2005)
12.50
13.00
13.50
14.00
14.50
15.00
0 5 10 15 20 25 30
Binder mass content M (%)
Mas
s de
nsity
pre
dict
ed
(g/c
c)
p2 = 15.4 g/cc p1 = 8.9 g/cc
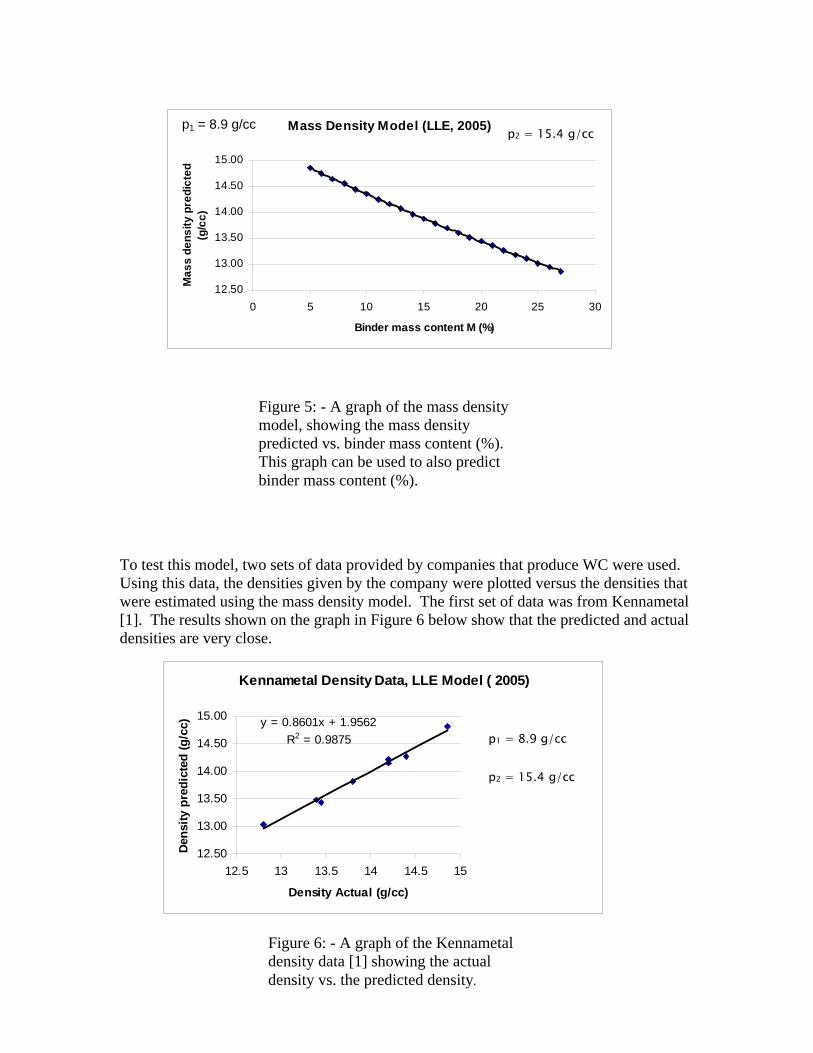
Figure 5: - A graph of the mass density
model, showing the mass density predicted vs. binder mass content (%). This graph can be used to also predict binder mass content (%).
To test this model, two sets of data provided by companies that produce WC were used. Using this data, the densities given by the company were plotted versus the densities that were estimated using the mass density model. The first set of data was from Kennametal [1]. The results shown on the graph in Figure 6 below show that the predicted and actual densities are very close.
Kennametal Density Data, LLE Model ( 2005)
y = 0.8601x + 1.9562R2 = 0.9875
12.50
13.00
13.50
14.00
14.50
15.00
12.5 13 13.5 14 14.5 15
Density Actual (g/cc)
Den
sity
pre
dict
ed (g
/cc)
p1 = 8.9 g/cc
p2 = 15.4 g/cc
Figure 6: - A graph of the Kennametal density data [1] showing the actual density vs. the predicted density.
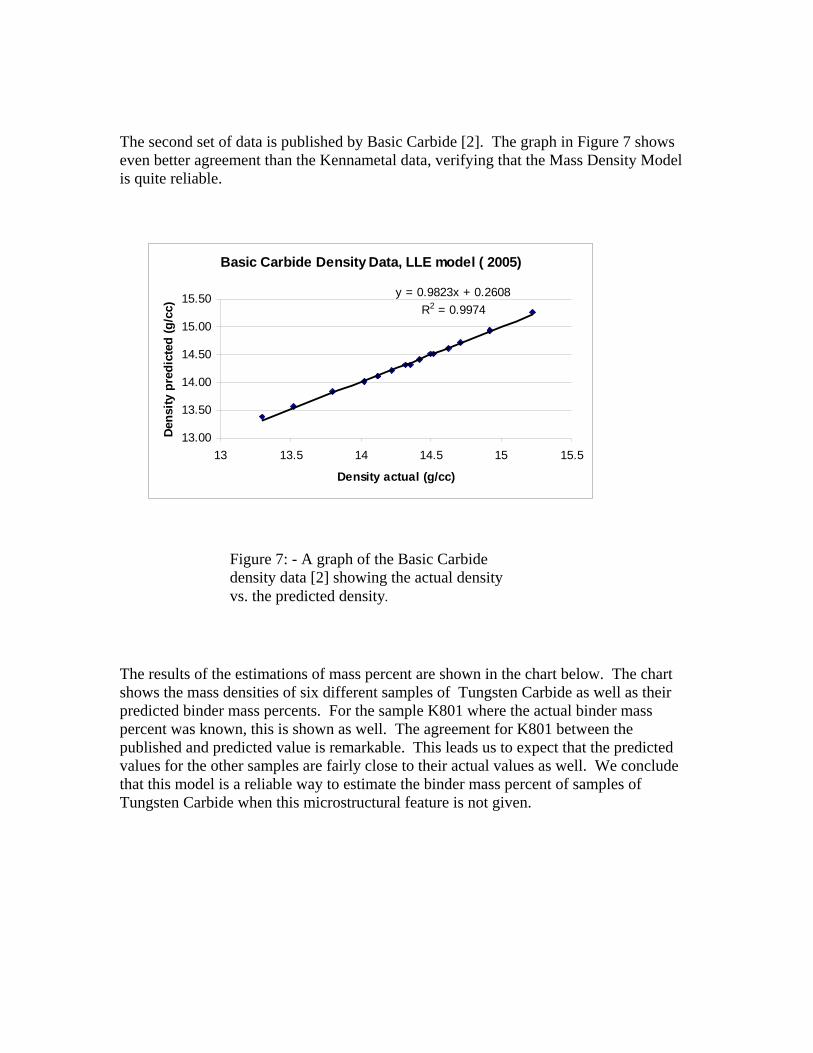
The second set of data is published by Basic Carbide [2]. The graph in Figure 7 shows even better agreement than the Kennametal data, verifying that the Mass Density Model is quite reliable.
Basic Carbide Density Data, LLE model ( 2005)
y = 0.9823x + 0.2608R2 = 0.9974
13.00
13.50
14.00
14.50
15.00
15.50
13 13.5 14 14.5 15 15.5
Density actual (g/cc)
Dens
ity p
redi
cted
(g/c
c)
Figure 7: - A graph of the Basic Carbide density data [2] showing the actual density vs. the predicted density.
The results of the estimations of mass percent are shown in the chart below. The chart shows the mass densities of six different samples of Tungsten Carbide as well as their predicted binder mass percents. For the sample K801 where the actual binder mass percent was known, this is shown as well. The agreement for K801 between the published and predicted value is remarkable. This leads us to expect that the predicted values for the other samples are fairly close to their actual values as well. We conclude that this model is a reliable way to estimate the binder mass percent of samples of Tungsten Carbide when this microstructural feature is not given.

6.3 6.31 14.85 Kennametal K801
12 11.2 14.35 Basic Carbide BC 12N
? 16.98 13.8 M70
? 13.77 14.1 M50
? 10.69 14.4 M45
? 12.21 14.25 Fuji M10
Binder Mass % actual
Binder Mass % predicted
Mass density (g/cc)
Figure 8: A chart showing the results of the binder mass percent prediction model.
4. Fracture Toughness Model The next task was to look at fracture toughness, or Kc, models. As previously
discussed, Kc is a very difficult property of WC to measure, due to the extreme strength of the material. Therefore, research has tried to create models that estimate Kc using other characteristics of WC that can more easily be measured.
The model I looked at was created by Laugier (1986). Laugier’s correlation is:
⎟⎠⎞
⎜⎝⎛
⎥⎦
⎤⎢⎣
⎡⎟⎠⎞
⎜⎝⎛+⎟
⎠⎞
⎜⎝⎛∗=
−
5.1
6.06.06 1012.011015.2
HHE
HEKc
where E and H are in units of MPa, and the resulting Kc is in units of MPa*m1/2. We tested the Laugier model using data from Kennametal [1] and Bhaghat
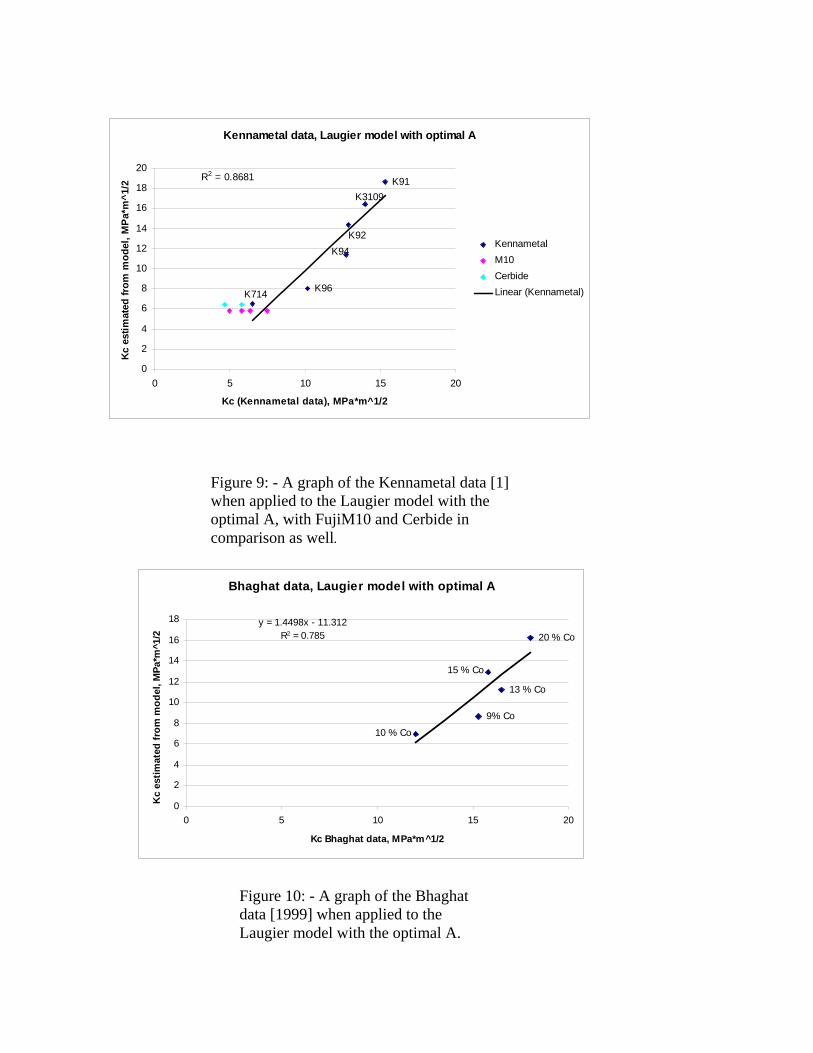
[1999]. Both the Kennametal data and Bhaghat data give measured values of Kc, so I was able to plot the known (measured) data versus the estimated data using Laugier’s model. After initially plotting this data, the plots showed a good correlation between the estimated and actual Kc of the samples. I then worked on optimizing the first numerical term (2.15 * 106) of Laugier’s model to attempt to obtain the best possible correlation using the data we had. The optimal numerical coefficient turned out to be 2.05 * 106. The results after optimizing this first term, or “A”, are shown below in Figures 9 and 10.
Kennametal data, Laugier model with optimal A
K714
K91K3109
K92K94
K96
R2 = 0.8681
0
2
4
6
8
10
12
14
16
18
20
0 5 10 15 20
Kc (Kennametal data), MPa*m^1/2
Kc
estim
ated
from
mod
el, M
Pa*m
^1/2
KennametalM10CerbideLinear (Kennametal)
Figure 9: - A graph of the Kennametal data [1]
when applied to the Laugier model with the optimal A, with FujiM10 and Cerbide in comparison as well.
Bhaghat data, Laugier model with optimal A
9% Co
10 % Co
13 % Co
15 % Co
20 % Coy = 1.4498x - 11.312
R2 = 0.785
0
2
4
6
8
10
12
14
16
18
0 5 10 15 20
Kc Bhaghat data, MPa*m^1/2
Kc
estim
ated
from
mod
el, M
Pa*m
^1/2
Figure 10: - A graph of the Bhaghat data [1999] when applied to the Laugier model with the optimal A.

These plots show that there is a fairly good correlation between actual and estimated Kc values using the Laugier model with optimal A, but there is definitely room for improvement. More recent work on this topic is the energy release rate model, which was created at the LLE in summer 2005. In this model, Gc is a function of Vickers hardness, or Hv. It has been discovered that if Gc is plotted versus Hv for several WC samples, the points almost form a line, showing excellent correlation. This has the potential to be extremely useful, because if the Hv of a sample is known, then by using a graph of this correlation the Kc of a sample can be estimated if the Young’s modulus is known. This is a relatively easy calculation. The plots of both the Kennametal data and the Bhaghat data energy release rate models are shown below in Figures 11 and 12.
Kennametal Data, Energy Release Rate Model (LLE 2005)
K91K3520
K92
K90
K96
K3833K3109
K94
y = -48.712x + 974.51R2 = 0.965
0
100
200
300
400
500
600
700
0 5 10 15 20 25 30
Hv (GPa)
Kc^
2/E
J/m
^2 Kennametal
M10
Cerbide
Linear(Kennametal)
Figure 11: - A graph of the Kennametal Data when applied to the energy release rate model, with Fuji M10 [3] and Cerbide [4] for comparison.
Bhaghat Data Energy Release Rate Model (LLE 2005)
20 % Co
20 % Co
15 % Co13 % Co
9 % Co
10 % Co
y = -43.789x + 1056R2 = 0.8113
0100200300400500600700800
0 5 10 15 20
Hv (GPa)
Kc^2
/E J
/m^2
Figure 12: - A graph of the Bhaghat Data when applied to the energy release rate model.
Both of these plots show a much stronger correlation using the energy release rate model than with the Laugier model, even after optimizing the A.
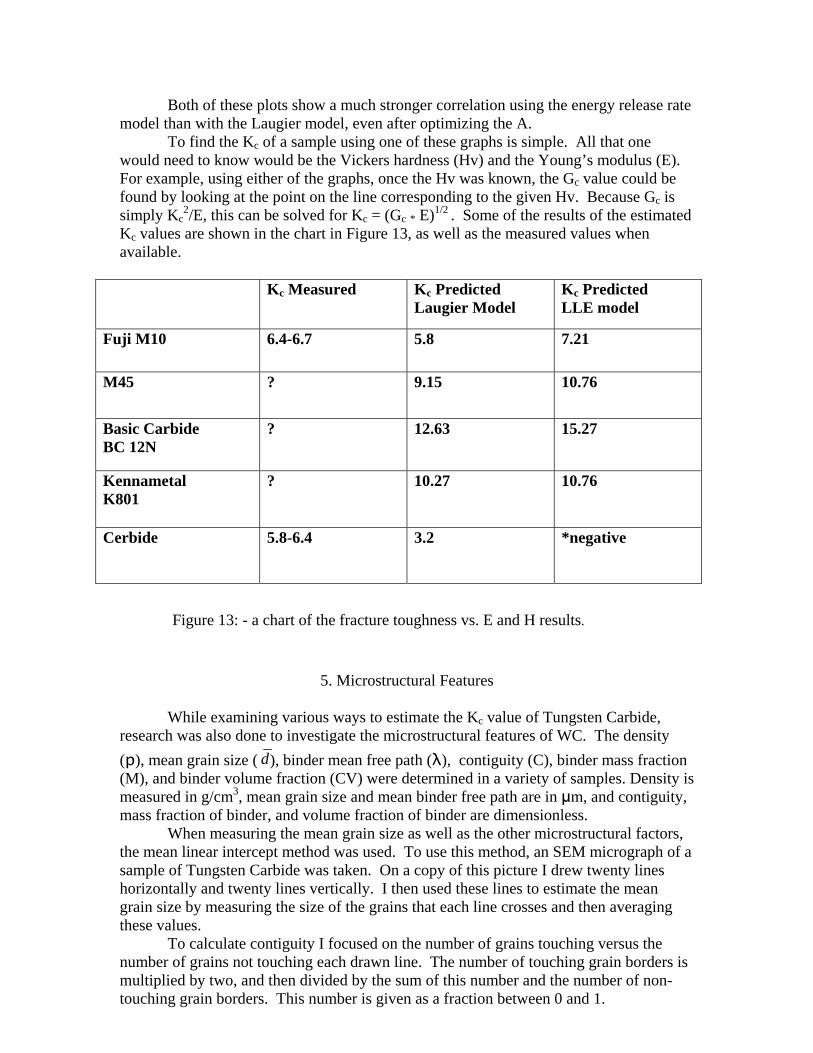
To find the Kc of a sample using one of these graphs is simple. All that one would need to know would be the Vickers hardness (Hv) and the Young’s modulus (E). For example, using either of the graphs, once the Hv was known, the Gc value could be found by looking at the point on the line corresponding to the given Hv. Because Gc is simply Kc
2/E, this can be solved for Kc = (Gc * E)1/2 . Some of the results of the estimated Kc values are shown in the chart in Figure 13, as well as the measured values when available.
Kc Measured Kc Predicted Laugier Model
Kc Predicted LLE model
Fuji M10 6.4-6.7 5.8 7.21
M45 ? 9.15 10.76
Basic Carbide BC 12N
? 12.63 15.27
Kennametal K801
? 10.27 10.76
Cerbide 5.8-6.4 3.2 *negative
Figure 13: - a chart of the fracture toughness vs. E and H results.
5. Microstructural Features
While examining various ways to estimate the Kc value of Tungsten Carbide, research was also done to investigate the microstructural features of WC. The density (p), mean grain size ( ), binder mean free path (λ), contiguity (C), binder mass fraction (M), and binder volume fraction (CV) were determined in a variety of samples. Density is measured in g/cm3, mean grain size and mean binder free path are in μm, and contiguity, mass fraction of binder, and volume fraction of binder are dimensionless.
d
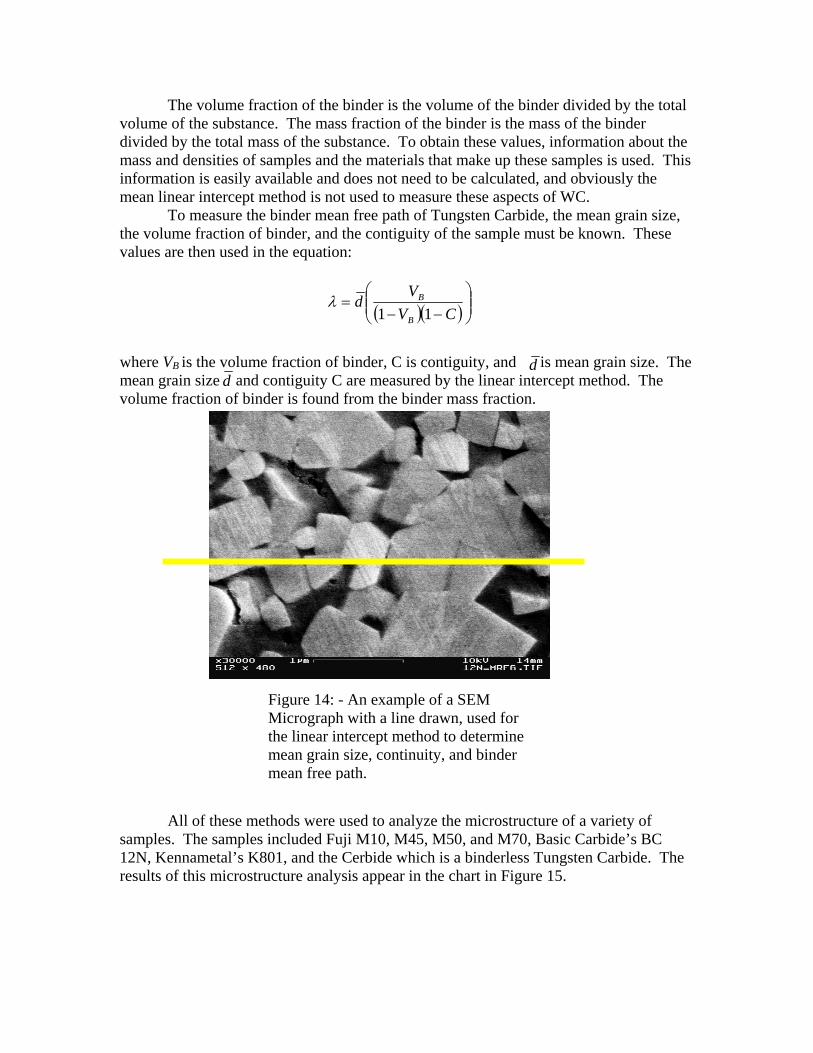
When measuring the mean grain size as well as the other microstructural factors, the mean linear intercept method was used. To use this method, an SEM micrograph of a sample of Tungsten Carbide was taken. On a copy of this picture I drew twenty lines horizontally and twenty lines vertically. I then used these lines to estimate the mean grain size by measuring the size of the grains that each line crosses and then averaging these values.
To calculate contiguity I focused on the number of grains touching versus the number of grains not touching each drawn line. The number of touching grain borders is multiplied by two, and then divided by the sum of this number and the number of non-touching grain borders. This number is given as a fraction between 0 and 1.
The volume fraction of the binder is the volume of the binder divided by the total volume of the substance. The mass fraction of the binder is the mass of the binder divided by the total mass of the substance. To obtain these values, information about the mass and densities of samples and the materials that make up these samples is used. This information is easily available and does not need to be calculated, and obviously the mean linear intercept method is not used to measure these aspects of WC.
To measure the binder mean free path of Tungsten Carbide, the mean grain size, the volume fraction of binder, and the contiguity of the sample must be known. These values are then used in the equation:
( )( )⎟⎟⎠
⎞⎜⎜⎝
⎛−−
=CV
Vd
B
B
11λ
where VB is the volume fraction of binder, C is contiguity, and is mean grain size. The mean grain size and contiguity C are measured by the linear intercept method. The volume fraction of binder is found from the binder mass fraction.
dd
Figure 14: - An example of a SEM
Micrograph with a line drawn, used for the linear intercept method to determine mean grain size, continuity, and binder mean free path.
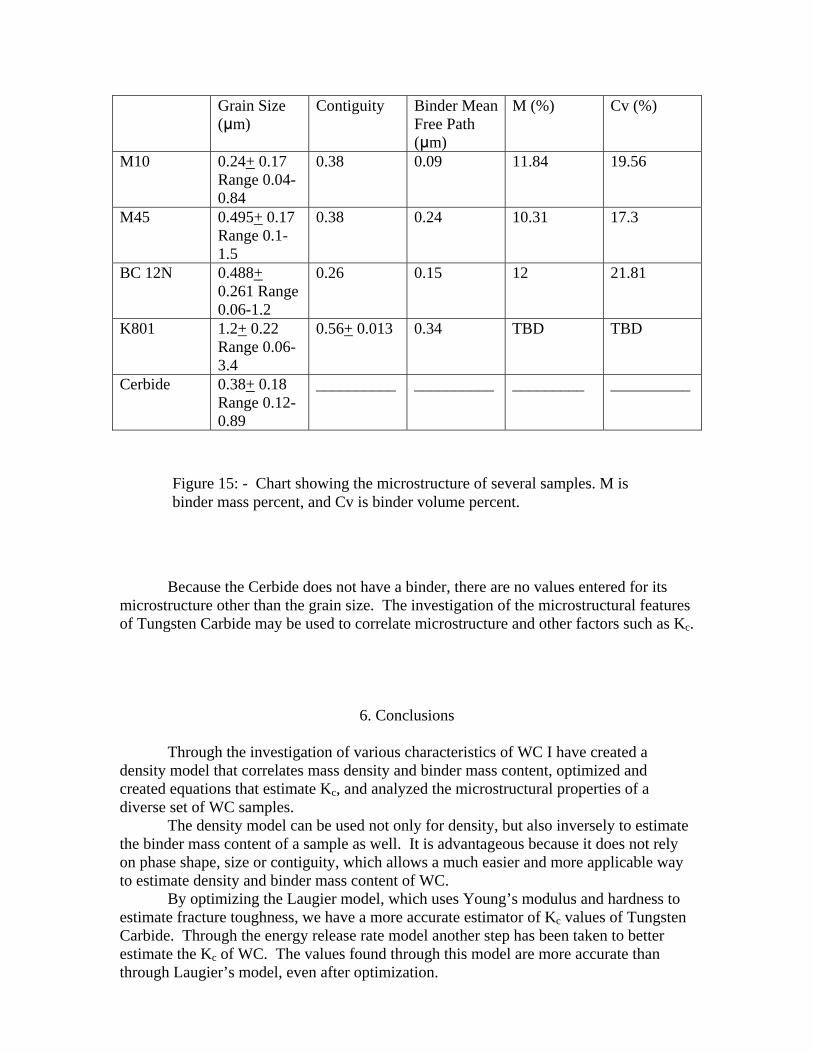
All of these methods were used to analyze the microstructure of a variety of
samples. The samples included Fuji M10, M45, M50, and M70, Basic Carbide’s BC 12N, Kennametal’s K801, and the Cerbide which is a binderless Tungsten Carbide. The results of this microstructure analysis appear in the chart in Figure 15.
Grain Size (μm)
Contiguity Binder Mean Free Path (μm)
M (%) Cv (%)
M10 0.24+ 0.17 Range 0.04-0.84
0.38 0.09 11.84 19.56
M45 0.495+ 0.17 Range 0.1-1.5
0.38 0.24 10.31 17.3
BC 12N 0.488+ 0.261 Range 0.06-1.2
0.26 0.15 12 21.81
K801 1.2+ 0.22 Range 0.06-3.4
0.56+ 0.013 0.34 TBD TBD
Cerbide 0.38+ 0.18 Range 0.12-0.89
__________ __________ _________ __________
Figure 15: - Chart showing the microstructure of several samples. M is
binder mass percent, and Cv is binder volume percent. Because the Cerbide does not have a binder, there are no values entered for its microstructure other than the grain size. The investigation of the microstructural features of Tungsten Carbide may be used to correlate microstructure and other factors such as Kc.
6. Conclusions
Through the investigation of various characteristics of WC I have created a density model that correlates mass density and binder mass content, optimized and created equations that estimate Kc, and analyzed the microstructural properties of a diverse set of WC samples.
The density model can be used not only for density, but also inversely to estimate the binder mass content of a sample as well. It is advantageous because it does not rely on phase shape, size or contiguity, which allows a much easier and more applicable way to estimate density and binder mass content of WC.
By optimizing the Laugier model, which uses Young’s modulus and hardness to estimate fracture toughness, we have a more accurate estimator of Kc values of Tungsten Carbide. Through the energy release rate model another step has been taken to better estimate the Kc of WC. The values found through this model are more accurate than through Laugier’s model, even after optimization.
Analyzing the microstructural characteristics of WC helps to better identify the features that may correlate to factors such as strength and durability of WC. All of these observations will prove useful as WC is used in more technical applications.
In the future, more work can be done to better understand the qualities of WC. To accomplish this, more microstructure and SEM images will be needed of more samples, as well as more known Kc data. Improved models for Kc and Gc will also help improve understanding of any correlations between properties. It would also be beneficial to have physics based models to help determine how microstructure may affect processing performance, such as with grinding and polishing. Improved knowledge of Tungsten Carbide will continue to be needed in order to understand how to best use this impressive material.
7. References
Basic Carbide Corporation, 900 Main Street, P.O. Box 228, Lowber, PA 15660, USA. Cerbide, Inc., 5720 Ellis Road, Orchard Park, NY 14127, USA. Materials tested were
commercially available on January 2005. Fuji Die, 2-17-10 Shimomaruko, OTA-ku, Tokyo, Japan. Kennametal Inc., Cambridge Beltway Park, 8910 Lenox Point Drive – Suite F, Charlotte,
NC, 28273, USA. K. G. Budinski and M. K. Budinski, Engineering Materials, Properties and Selection,
Chapters 1, 2, 6, 6th edition (Prentice Hall, Columbus, Ohio, 1999). M. T. Laugier, “Comparison of toughness in WC-Co determined by a compact tensile
technique with model predictions,” Journal of Materials Science Letters 6, 779- 780 (1987).
R. B. Bhagat, J.C. Conway, M.F. Amateau, and R. A. Brezler, Tribological performance
of WC-based cermets and development of a fracture mechanics wear model, Wear 201, 233-243 (1996).
W.D. Callister, Jr., Materials Science and Engineering – an Introduction, 3rd edition,
chapters 6 and 8 (Wiley, New York, 1994).