Embed Size (px)
Citation preview

© Authors. Terms and conditions of Creative Commons Attribution 4.0 International (CC BY 4.0) apply. * Correspondence: Sadegh Mohammadzadeh Bazarchi, Faculty of Electrical Engineering, University of Urmia, Urmia, Iran. [email protected]
OPEN ACCESS
Eurasian Journal of Analytical Chemistry ISSN: 1306-3057 2017 12(7b):1137-1151 DOI: 10.12973/ejac.2017.00239a
Micromachined Ionization Vacuum Gauge and Improve its Sensitivity with Magnetic Field
Sadegh Mohammadzadeh Bazarchi 1*, Ebrahim Abbaspour Sani 1 1 University of Urmia, IRAN
Received 9 June 2017 ▪ Revised 30 July 2017 ▪ Accepted 21 September 2017
ABSTRACT One of the most efficient methods for Ultra High Vacuum (UHV) measurement is the use of hot-filament ionization gauge which has been employed for several decades and can quantify pressures up to 〖10〗^(-12) torr. Large volume and high-power consumption are main drawbacks of this gauge. In this paper, a MEMS type ionization vacuum gauge has been introduced which occupies a volume of 3mm×1.5mm×1.5mm and is manufacturable with micromachines technology. Also, it operates based on gas ionization. In addition of low volume, the proposed structure has the advantages of low power consumption, low price and fast response time. With the help of COMSOL and MATLAB, a method has been proposed which helps us to obtain average length of movement for electron 1, average energy of the electrons, electron speed, elastic and ionization collision frequency and sensitivity coefficient S. Simulation results have been compared with theoretical analytic results in which there is good conformity between these results. Also, by means of the presented method in this article, the physical characteristics of the gauge can be optimized to achieve better performance. For the proposed scheme by introducing the magnetic field as the novel idea, the sensitivity coefficient has been enhanced up to 60% in comparison with similar structures.
Keywords: ionization, hot-filament ionization vacuum gauges, Bayard–Alpert vacuum gauge, micromachine, miniaturized ionization gauge
INTRODUCTION Two common methods which can quantify the vacancy of a gas at the range of 〖10〗^(-12)-〖10〗^(-3) torr are hot-filament ionization vacuum gauge and cold cathode ionization gauge [1, 2]. Their main drawbacks are big size (e.g. 12mm diameter and 46mm length) and high-power dissipation (e.g. 50W) [2, 3]. Many efforts have been carried out for miniaturization of cold cathode ionization gauge by MKS and other companies [4]. For the hot cathode ionization gauge a volume reduction of 5% along with measurement capability of 3×〖10〗^(-10) torr with 20torr^(-1) sensitivity coefficient has been achieved [5, 6].
Hot-filament ionization vacuum gauge works based on gas ionization and because of its inventors in known as Bayard–Alpert vacuum gauge. It is being used for several decades and can measure at the range of 〖10〗^(-13)-〖10〗^(-2) torr [3].
The article is followed by the discussion about the conventional ionization gauge in section 2 which is the old Bayard–Alpert gauge, because the same principles have been employed for the implementation of micromahine ionization gauge. In section 3 the structure of micromachine ionization gauge which has small dimensions will be introduced. The simulation results of designed micromachine gauge without applying the magnetic field and then, at the presence of magnetic field have been illustrated in section 4 and 5, respectively. For each level, a procedure will be presented in which the dimensions and distances can be modified so that a better performance for the

Bazarchi & Sani / Micromachined Ionization Vacuum Gauge and Improve its Sensitivity with Magnetic Field
1138
ionization gauge can be achieved. Section 6 pertains to the details provided for simulated ionization process and its utilization in micromachine ionization gauge for sensitivity coefficient calculation. In addition of the provided simulations, the necessary theoretic assumptions at each stage will be presented so that the reader can obtain a better verification of the performed simulations.
THE BAYARD–ALPERT IONIZATION GAUGE The operation of this gauge is based on the fact that a cylindrical ionization environment is formed by means of
narrow wires known as the grid or anode. In the middle of this cylinder the narrower wire of collector has been located. According to Figure 1, very close to anode grid in outside area the cathode filament has been placed. The cathode is composed of Tungsten filament coated with Thorium dioxide in which by means of the passing current through the filament, it will be heated and based on thermionic phenomenon, the free electrons will be generated on its around. The cathode wire current which supports the free electrons is denoted by Ie. Because of +180V potential voltage of the anode and electrostatic attraction, these electrons will be accelerated towards the grid and with a high speed equal to 105 V
S will enter to the ionization environment. After entering to the anode network, they
will collide to the gas atoms making them ionized. In exchange for each ionized gas atom, a positive ion and an electron will be created in which the positive ion will tend towards the most negative potential (0V) of the collector wire. The accumulated positive ions will then produce the collector current Ic which is proportional to the number of generated positive ions under the effect of gas ionization while the ionization itself is a function of gas pressure. Therefore, the collector current is an illustrator of environment gas pressure or the gas vacancy. Hence, the lower the gas pressure will result in the fewer gas atoms and smaller value for ionization. Equation (1) describes the formula for calculation of Ic [7].
Ic = S. Sr. Ie. P (1)
In (1), P describes the gas pressure in torr while the Sr coefficient relates to the gas which is under measure. For Nitrogen the value is equal to 1 while for the other gases, the ratio of ionization cross section of the gas to that of obtained for Nitrogen, results in the corresponding value. For example, if the measuring gas is oxygen, then Sr =σO2(ε)σN2(ε)
and the nominal values are available in special tables [8, 9, 10].
The coefficient S contains a value that indicates the sensitivity of ionization gauge which is dependent to electrical, geometrical and physical dimensions. This parameter is determined by manufacturer and is of high importance degree for the gauge. The higher the value of this parameter, the lower power consumption for cathode heating is expected. Also, the corresponding value of Ic will be higher which solves its quantifying problem.
Figure 1. Scheme of Bayard–Alpert vacuum gauge

Eurasian J Anal Chem
1139
Equation (2) expresses the sensitivity in 1/torr where for conventional hot-filament ionization gauge, S ranges from 10 to 45 and is dependent to the physical characteristics of the gauge [3].
S = σil
kT (2)
According to (2), the sensitivity is in direct relationship with effective length (l) of electron motion paths inside the anode network which lead to the ionization process and as the size of gauge enlarges, the value of sensitivity coefficient grows. As a result, it must be considered that although any dimension reduction would bring some benefits for the designer, the decrement of sensitivity coefficient must also be considered and there always exist a trade-off among different parameters. σi represents the ionization cross section because of being a function of electron energy, does not have a constant value.
THE PROPOSED STRUCTURE FOR MICROMACHINE IOIZATION GAUGE In this section, the hot-filament ionization gauge which is designed in very small size using micromachine
technology will be analyzed and simulated. The Charged Particle Tracing (CPT) simulation in COMSOL for emulation of ionization process of proposed gauge has been employed although the electric field simulation is also necessary. The calculations for average length and average energy of electron movements have been carried out by MATLAB.
Figure 2 illustrates general schematic of micromachine ionization gauge in which the dimensions are 3mm×1.5mm×1.5mm. The parallel rectangles constitute the anode network (grid) while two narrow wires of collector have the responsibility of gathering positive ions. The wires on both sides form the hot-filament cathode and generate the electrons. It must be mentioned that the potentials for cathode filament, anode network and collector are also specified in this figure.
For the former case of Figure 2, the cathode wires have been located at the center of grid’s vertical column so that the motion path for the electrons can be maximized. But at the presence of magnetic field, because the
Figure 2. The scheme of micromachine ionization gauge (a) without magnetic field (b) at the presence of magnetic field

Bazarchi & Sani / Micromachined Ionization Vacuum Gauge and Improve its Sensitivity with Magnetic Field
1140
movement route of electrons tends to a spiral state, then the cathodes must set alongside the vertical cathode column so that the spiral movement inside the anode network can create a longer path for the electrons.
Each of the dimensions and distances affect the performance of the micromachine ionization gauge. Hence, the listed parameters below must be designed for an optimum condition:
− Number of anode wires − The distance between cathode to the anode wire − Position of cathode wires in the Z direction
SIMULATION OF MICROMACHINE IONIZATION GAUGE WITHOUT MAGNETIC FIELD
The CPT simulation of COMSOL provides the possibility for an analysis of motions of charged particles like electrons and ions in an environment. Also, the simulations for elastic collision processes, ionization collision and the collisions leading to the stimulation are available in CPT simulation. Therefore, the movements of the accelerated electrons which are going out of the cathode and have any possibility of encounter to the gas atoms can be observed and analyzed. In this situation analysis, the speed and energy for electrons and positive ions is achievable at any time.
For better checking of micromachine ionization gauge performance and to obtain the optimum dimensions and distances and also evaluating the effect of magnetic field on its behavior, ionization process along with elastic and stimulation collisions have been disabled in the software and the concentration was on the average motion distance of the electrons l and average energy of the electrons. As it is clear from (2), for higher sensitivity coefficient the corresponding values for l and σ must be maximum and as diagram of Figure 3 illustrates, the value of σ at the specific energy of electron will reach to its upper bound. According to Figure 3 which is the ionization energy of Nitrogen, it is clear that the energy maximum value occurs in 120eV. Therefore, the potentials for anode and cathode will be set to 180V and 30V, respectively so that the initial energy for electron acceleration would be 150eV to let the electrons entering the ionization environment containing an average energy of 120eV along their path.
Because of electrostatic force initiating from 150V potential difference, the electrons will accelerate with the help of 150eV energy and in the distance between cathode to the anode, their speed will reach to Ve value. In order to obtain Ve, the potential and kinetic energies must be considered equal in (3).
Eelec = qV =12 me. v2 (3)
The speed of electron is much smaller than propagation speed. Hence, in (3) the electron mass me is considered equal to the initial mass m0 when the electron is quiet. Considering Eelec = 150eV and me = m0 = 9.109×10⁻³¹, in (3) the electron speed at the end of cathode-grid path will be V = 7.25×10⁶ meters per seconds.
Figure 3. The diagram for Nitrogen ionization cross section [8]

Eurasian J Anal Chem
1141
In a simulation by COMSOL, the motion path of 400 electrons is shown in Figure 4. The electrons exit time from the cathode is 2ns and according to the figure, because of 0V potential and repulsion of collector wires, the electrons got away and changed their path.
In Figure 5(a), the speed curvature of electrons of Figure 4 has been shown. It can be observed that the speed of electrons when they are going out of the cathode is equal to zero and because of electrostatic force of anode their speed grows to a high value. They enter the anode at t = 0.024ns and after that, their speed remains constant. It must be considered that for some electrons which are getting close to the collector, because of repulsion potential the speed decreases.
To match the theoretical and simulation results, the corresponding speed of the electrons on each time interval were averaged where this mean value is a function of time itself and is shown in Figure 5(b). It is clear that the electrons contain an ascending speed equal to 5×10⁶m/s at the entrance moment to the anode network. But as mentioned before, their speed drops at first because of collector repulsion potential but after that, the average speed
Figure 4. Simulation of electron motion paths in micromachine ionization gauge without magnetic field
Figure 5. a) movement speed of each electron

Bazarchi & Sani / Micromachined Ionization Vacuum Gauge and Improve its Sensitivity with Magnetic Field
1142
again starts to rise and reaches to the value of 7.07×10⁶m/s which is very close to the obtained theoretical quantity. The slight difference between theoretical and simulation values pertain to the repulsion potential of collector wire and the structure of anode wires as the electrons pass through the anode wires and the potential difference between cathode and the empty area of anode wires is less than 150V.
In the simulation of electron movements for Figure 4, there are two important factors for performance analysis. One factor is the average motion distance of the electrons inside the grid (ionization area) and the other one is the average energy of the electrons. The output data obtained from COMSOL have been analyzed by MATLAB in which the average motion distance and the average energy were l = 0.189mm and Eav = 93.41eV, respectively. According to (2) the higher value for l is more desired but based on Figure 3, for Eav = 100eV the higher quantity of ionization cross section σion can be obtained. As a result, for better interpretation of ionization gauge performance the product of these two parameters (l×σion) will be considered for distance adjustment and dimension selection.
As mentioned before, the distance of cathode to the grid is another important determinative parameter for the performance of the gauge. Therefore, the discussed simulations were repeated for different distances and the corresponding values of l and Eav have been calculated. Using the average energy and with the help of related tables from valid references, the ionization cross section was obtained. In Figure 6, the obtained curve for l×σionis demonstrated which shows that for the cathode to anode distance of 20µm, the maximum value occurs.
Figure 5 (continued). b) average speed of the electrons pertaining to simulation of Figure 5

Eurasian J Anal Chem
1143
The operations mentioned above, were repeated for several number of grid wires and the corresponding values of l and Eav have been obtained. Figure 7 illustrates the curve for l×σion which shows that for 11 anode wires the maximum value can be achieved.
As the results indicate, for the best conditions of dimensions and distances, the product of average motion distance and the average energy reaches to the value of 1.655mm×A2.
SIMULATION OF MICROMACHINE IONIZATION GAUGE AT THE PRESENCE OF MAGNETIC FIELD
With the presence of magnetic field aligned with Y axis, the Lorentz force will be applied to the motive electrons and makes them travel in a flexuous path inside the anode network. Equation (4) expresses the value of applied force to the electrons at the presence of both electric and magnetic fields [11].
Figure 6. The variations curve of 𝑙𝑙×𝜎𝜎𝑖𝑖𝑖𝑖𝑖𝑖 as a function of cathode to anode distance
Figure 7. The variations curve of 𝑙𝑙×𝜎𝜎𝑖𝑖𝑖𝑖𝑖𝑖 as a function anode wires
0 5 10 15 20 25 30 35 40 45 500.9
1
1.1
1.2
1.3
1.4
1.5
1.6
1.7
1.8
Distance between Cathode and Grid (μm)
l×σ
(mm
×A2 )
8 10 12 14 16 18 20 22 241.2
1.25
1.3
1.35
1.4
1.45
1.5
1.55
1.6
1.65
1.7
Anode wire Number
l×σ
(mm
×A2 )

Bazarchi & Sani / Micromachined Ionization Vacuum Gauge and Improve its Sensitivity with Magnetic Field
1144
F = q(E + v×B) (4)
In this expression, E indicates the electric field while B, q and v represent the magnetic field intensity, the electron charge and the electron velocity, respectively.
Because of 150V potential difference between cathode and the grid, the electrons under the effect of electrostatic field Ex, will accelerate and at the same direction with – X direction will enter the ionization environment. Also, because of magnetic field Bx, the Lorentz force affects the electrons vertically and aligned with Z axis making them travel in a flexuous route. This causes the electrons to travel a larger distance which increases l. Hence, the sensitivity will be increased which is favorable.
Figure 8 shows the motion path for the electrons at the presence of magnetic field. As it is clear, the magnetic field by deviating the electrons form their normal motion path has increased the path length.
In Figure 8, any angular deviation for magnetic field directly affects the angular rotation of electron paths and consequently, the length of electron motion paths. Therefore, the intensity of magnetic field must be adjusted for optimum performance of micromachine ionization vacuum gauge. In Figure 9, the curvature of l×σion variations respect to the magnetic field has been shown in which the best value for the proposed gauge occurs at 0.02Tesla.
The cathode situation in the direction of Z axis is also effective on the efficiency of the gauge. Hence, by the variation of cathode position over Z axis a diagram can be obtained which is illustrated in Figure 10 and describes that the best position for the cathode 110µm away from the corner of the anode network.
The simulation results for variations of magnetic field dimensions interpretations of average motion distance and average energy product in Figure 9 and Figure 10 demonstrate that for the best condition l×σ = 2.63mm×A2. This illustrates that by exerting the magnetic field the value of l×σ and consequently, the sensitivity coefficient 1.59 times becomes larger which means that 60% enhancement for sensitivity can be achieved.
Figure 8. Simulation of electrons motion path at the presence of magnetic field

Eurasian J Anal Chem
1145
This section is followed by adaptation of simulation results and theoretical outcomes. Equation (5) illustrates the centripetal force Fc which relates to the electron rotating with radius R, velocity of v and mass of me while equation (6) expresses the Lorentz force resulting from magnetic force that displaces the electrons orthogonal to the magnetic field orientation [11].
FC =me. v2
R (5)
FB = qv×B (6)
By merging the centripetal and Lorentz forces from (5) and (6), results in the spiral movement for the electrons that (7) expresses it [11].
R =
m0
�1 − (vc)2
×v
qB ≌ m0v
qB (7)
Figure 9. The variations curve of 𝑙𝑙×𝜎𝜎𝑖𝑖𝑖𝑖𝑖𝑖 as a function of magnetic field
Figure 10. The variations curve of 𝑙𝑙×𝜎𝜎𝑖𝑖𝑖𝑖𝑖𝑖 as a function of cathode distance to the corner of anode network
0 0.01 0.02 0.03 0.04 0.05 0.061.3
1.5
1.7
1.9
2.1
2.3
2.5
Magnetic Field Intensity (T)
l×σ
(mm
×A2 )
50 100 150 200 2502
2.1
2.2
2.3
2.4
2.5
2.6
2.7
Emitter location from the Grid corner
l×σ
(mm
×A2 )

Bazarchi & Sani / Micromachined Ionization Vacuum Gauge and Improve its Sensitivity with Magnetic Field
1146
The obtained theoretic and simulation results from section 4 demonstrated that the moving speed of the electron inside the grid is about 7×10⁶m/s. Also, according to simulation results obtained in this section, for the magnetic field of 0.02Tesla, the performance of the gauge reaches to its best value. Substituting these two in (7), we will obtain the radius as R = 2mm. Figure 11 illustrates the electrons motion path from the cathode in the right side for a spiral path with the obtained 2mm radius and as it is clear, again the theoretical and simulation results have conformity.
According to Figure 13(b), the electrons motion path is somehow different from circular curvature which comes from the electrostatic repulsion force of collector wires. Assuming the circular form for the motion path and with the help of mathematical expressions, the simulation results indicate on the radius of 2.18mm. Table 1 illustrates the comparison between simulation results and theoretical calculations. The main difference factors between these results as expressed before were the grid wires as well as the collector wires. As a result, the simulation results are trustable.
IONIZATION SIMULATION The electrons which have been accelerated due to 150V potential difference between cathode and the anode,
will enter the grid with 150eV energy and encounter the gas atoms. This collision is usually of elastic type and leads to the ionization while the probability of excitation collision is very small. Each of these probabilities can be defined by collision cross section or σ. As we know based on Figure 2, σ is a function of the energy and for different gases
Figure 11. The electrons motion path based on a) theoretical calculations b) simulation results
Table 1. Electron velocity in theoretical and simulation modes cyclotron radius Electron velocity in grid
2mm 7.25×10⁶ m/s Theory 2.18mm 7.07×10⁶ m/s Simulation
Eurasian J Anal Chem
1147
is available in specific tables [8, 9, 10]. These tables can be imported to the CPT simulation option of COMSOL as table files. Hence, the electron on its motion path due to the environment gas pressure and with the probabilities of σcollision, σionization or σexcitationcan have elastic, ionization and excitation encounters.
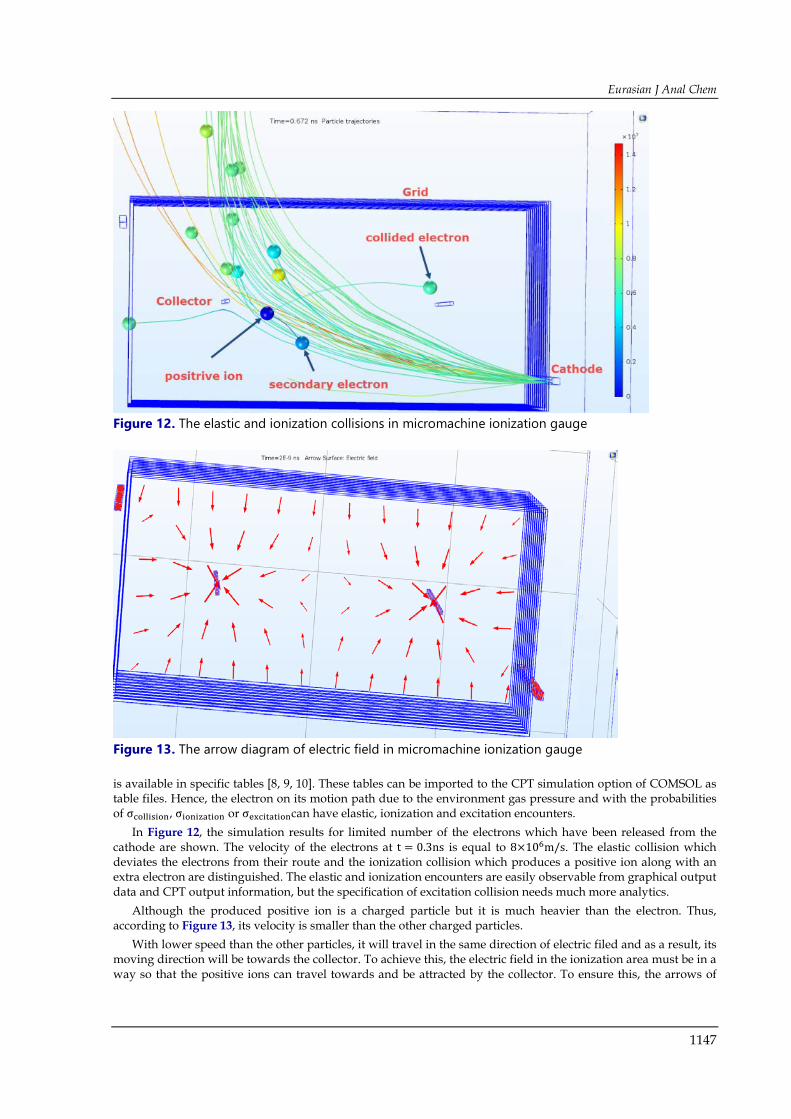
In Figure 12, the simulation results for limited number of the electrons which have been released from the cathode are shown. The velocity of the electrons at t = 0.3ns is equal to 8×10⁶m/s. The elastic collision which deviates the electrons from their route and the ionization collision which produces a positive ion along with an extra electron are distinguished. The elastic and ionization encounters are easily observable from graphical output data and CPT output information, but the specification of excitation collision needs much more analytics.
Although the produced positive ion is a charged particle but it is much heavier than the electron. Thus, according to Figure 13, its velocity is smaller than the other charged particles.
With lower speed than the other particles, it will travel in the same direction of electric filed and as a result, its moving direction will be towards the collector. To achieve this, the electric field in the ionization area must be in a way so that the positive ions can travel towards and be attracted by the collector. To ensure this, the arrows of
Figure 12. The elastic and ionization collisions in micromachine ionization gauge
Figure 13. The arrow diagram of electric field in micromachine ionization gauge

Bazarchi & Sani / Micromachined Ionization Vacuum Gauge and Improve its Sensitivity with Magnetic Field
1148
electric field in Figure 13 are indicating the direction towards the collector. Therefore, the positive ion will always be attracted by the collector.
A theoretic analysis can effectively confirm the accuracy of simulation results. To evaluate the conformity of these results in elastic and ionization collision processes, we must consider the elastic and ionization frequencies. According to the definition, the elastic collision frequency is the number of collision over the time unit and is denoted by velastic. It is dependent to the density of gas atoms Nd, elastic collision cross section σelastic and the relative velocity of the electrons respect to the gas atoms speed v′. On the other hand, according to (9), v′ is proportional to the electrons velocity v, electrons mass mp, mass of the atoms mg, relative velocity of the electrons respect to the center of mass reference g, post collision relative velocity g′ and uniformly distributed random unit vector R [11].
νelastic = Nd×σelastic×v′ (8)
v′ = v −mp
mp + mg(g − g′), g = v − vg, , g′ = |g|R (9)
The considerations for (9) become important when the electron mass is close to the mass of the atom and their speed are somehow equal. But because mp ≪ mg and v ≫ vg, then v can be substituted instead of v′ [11, 13].
νionization = Nd×σionization×v′ (10)
𝑣𝑣′ = 𝑣𝑣 −𝑚𝑚𝑝𝑝
𝑚𝑚𝑝𝑝 + 𝑚𝑚𝑔𝑔(𝑔𝑔 − 𝑔𝑔′ ) ,𝑔𝑔 = 𝑣𝑣 − 𝑣𝑣𝑔𝑔,𝑔𝑔′ = |𝑔𝑔′|𝑅𝑅 (11)
|𝑔𝑔′| = �𝑔𝑔.𝑔𝑔 −2𝛥𝛥𝛥𝛥(𝑚𝑚𝑝𝑝 + 𝑚𝑚𝑔𝑔)
𝑚𝑚𝑝𝑝.𝑚𝑚𝑔𝑔 (12)
There are the same relations for ionization collision state which have been illustrated in (10), (11) and (12). The only difference occurs for the value of g′ which is a result of energy drop after encounter equal to ∆E. The approximation mentioned for elastic collision is also valid for theoretic expressions of ionization collision.
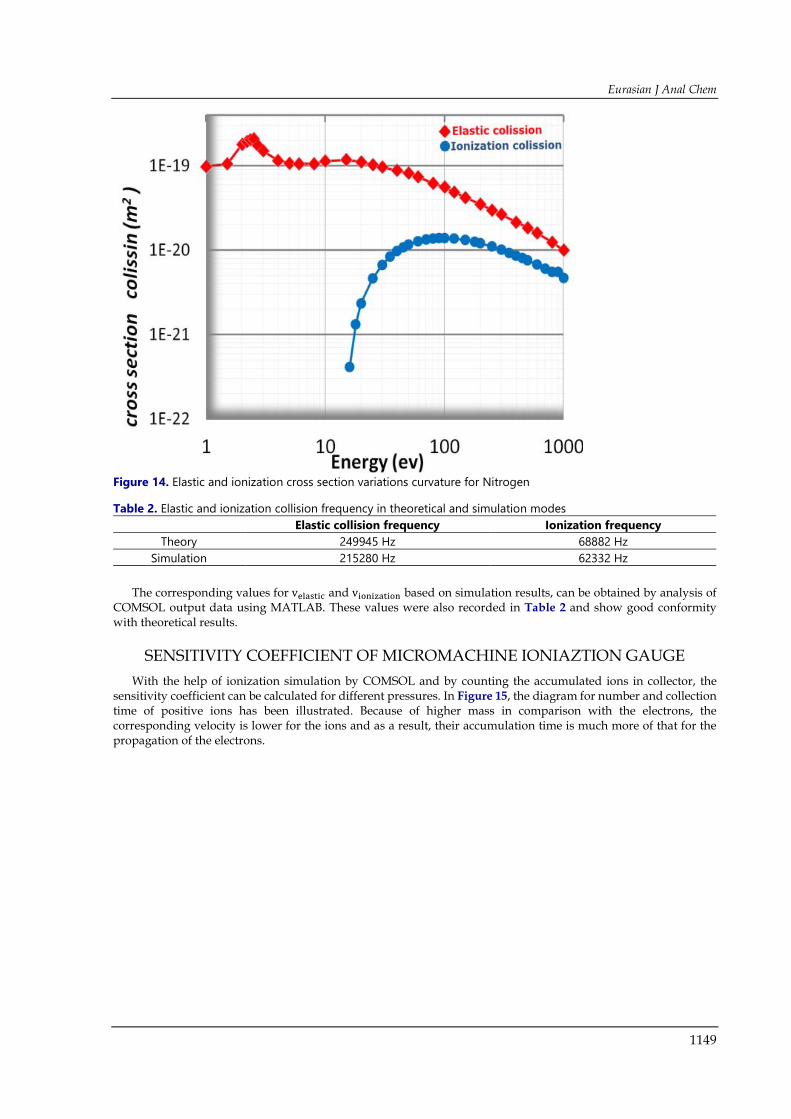
To calculate the elastic and ionization frequencies, the velocity of gas atoms can be neglected and as obtained in section 4, the electron speed is equal to 7.25×10⁶m/s. Also, it must be considered that the elastic and ionization cross sections are not constant. In Figure 14, the curvature of σelastic and σionization for Nitrogen have been drawn which are functions of the energy. To analyze, one can say that according to the potential difference between cathode and grid which is equal to 120V, the energy of electrons will be 120eV. Therefore, σelastic and σionization must be extracted for 120eV energy in Figure 14. The elastic and ionization frequencies can be obtained by calculation of Nd for a certain pressure of gas (for example 10−5 torr) in which the values have been recorded in Table 2.
Eurasian J Anal Chem
1149
The corresponding values for velastic and vionization based on simulation results, can be obtained by analysis of COMSOL output data using MATLAB. These values were also recorded in Table 2 and show good conformity with theoretical results.
SENSITIVITY COEFFICIENT OF MICROMACHINE IONIAZTION GAUGE With the help of ionization simulation by COMSOL and by counting the accumulated ions in collector, the
sensitivity coefficient can be calculated for different pressures. In Figure 15, the diagram for number and collection time of positive ions has been illustrated. Because of higher mass in comparison with the electrons, the corresponding velocity is lower for the ions and as a result, their accumulation time is much more of that for the propagation of the electrons.
Figure 14. Elastic and ionization cross section variations curvature for Nitrogen
Table 2. Elastic and ionization collision frequency in theoretical and simulation modes Ionization frequency Elastic collision frequency
68882 Hz 249945 Hz Theory 62332 Hz 215280 Hz Simulation

Bazarchi & Sani / Micromachined Ionization Vacuum Gauge and Improve its Sensitivity with Magnetic Field
1150
To obtain the sensitivity coefficient by COMSOL, (13) is used. In this expression, the generated ions under a certain vacuum pressure which have been accumulated by collector wires are counted and then, by dividing this value to the number of transmitted electrons by the cathodes, the sensitivity coefficient with the dimension of 1/torr will be resulted.
S =number of collected ion
number of trajected electron ×1P torr−1 (13)
In the diagram of Figure 16, the sensitivity coefficient of proposed ionization vacuum gauge at the presence of 0.02Tesla magnetic field has been demonstrated for several vacuum pressures. As it is clear, the sensitivity coefficient on the measurement interval of 10−2 torr to 5×10⁻⁴ torr has a value of 2.5torr−1 which shows a 60% enhancement in comparison with absence of the magnetic field.
Figure 15. The simulation for attracted ions by the collector
Figure 16. Sensitivity coefficient of proposed ionization gauge
1.00E-051.00E-041.00E-031.00E-020
0.5
1
1.5
2
2.5
3
3.5
Pressure (torr)
S (1
/tor
r)

Eurasian J Anal Chem
1151
CONCLUSIONS In this paper design, simulation and analysis of a hot-filament ionization vacuum gauge with micromachine
technology has been discussed which is 1000 times smaller than the conventional gauge. All aspects of an ionization vacuum gauge from the viewpoint of electron velocity, electron energy and average motion path of the electrons inside the ionization area by COMSOL and MATLAB simulations have been covered for an optimum design. Accordingly, dimensions and distances of the proposed scheme from cathode wires and cathode-grid distance to cathode wire position and other specifications have been chosen carefully to achieve the highest possible value for sensitivity coefficient.
With the help of a specific scheme which was the utilization of the cathode in sideways of the grid and by employing the magnetic field, the electron motion paths turned into cyclotrons which showed a 60% enhancement for traveling route increment. The corresponding magnetic field intensity for this purpose was 0.02Tesla.
At the presence of magnetic field, the sensitivity coefficient of proposed scheme shows an average value of 2.5torr−1 for different vacuum pressures which is a reasonable value in comparison with 20torr−1 sensitivity coefficient of the conventional type.
In addition of the simulations, the theoretic analytics for some parameters have been performed in this paper to prove the conformity of simulation results and theoretic assumptions.
REFERENCES 1. Hanlon, F. O. (2004). User’s Guide to Vacuum Technology. New York: John Wiley and sons. 2. BAG model ETI8136: global sources. (2017). Global sources. Retrieved from
http://www.globalsources.com/si/AS/The-Fredericks/6008848028802/pdtl/Eti-Hot-Cathode/1092447868.htm. [Accessed 28 august 2017].
3. Bayard-Alpert Ionization Gauges. (2017). Stanford research system. Retrieved from http://www.thinksrs.com/products/BAgauges.htm. [Accessed 28 august 2017].
4. Series 943 operation and maintenance manual cold cathode Vacuum Sensor System. (2017). MKS Instrument Inc. Retrieved from https://www.mksinst.com/docs/R/943-man.pdf. [Accessed 28 august 2017].
5. Filipelli, A. (1999). A miniature Dual-Collector Ionization Gauge. In Proceedings of the 46th International Symposium, American Vacuum Society, Washington State Convention Center.
6. Mini Ion Gauge (MIG). (2017). Hot Cathode Ionization Pressure Vacuum Sensor, MKS, Inc. Retrieved from https://www.mksinst.com/product/Product.aspx?ProductID-=459. [Accessed 28 august 2017].
7. Lafferty, J. M. (1997). Foundations of Vacuum Science and Technology. New York: John Wiley and Sons. 8. Shigemi Suginuma, T. K. (2016). Simulation of Relative Sensitivity Coefficient of Bayard-Alpert Gauge.
Journal of the Vacuum Society of Japan, 59(6), 156-159. 9. Yong-Ki Kim, J.-P. D. (2002). Ionization of carbon, nitrogen, and oxygen by electron impact. Journal of
Physical Review, 66(1), 275-284. 10. Kaido Tämm, P. B. (2013). Theoretical modeling of sensitivity factors of Bayard-Alpert ionization gauges.
Journal of International Journal of Mass Spectrometry, 37(2), 52-58. 11. Humphries, S. (2013). Charged particle beams. New York: Dover. 12. Enketeswara, R., Vidyadhara, S., Sasidhar, L. C, Ganesh Kumar, T. N. V., & Rokiya, Md. (2016). A Novel
Stability Indicating RP-HPLC Method Development and Validation for The Simultaneous Estimation of Losartan Potassium, Ramipril and Hydrochlorothiazide in Bulk and Pharmaceutical Dosage Form. Eurasian Journal of Analytical Chemistry, 5(3), 255-265.
13. Veena, D. S., & Sanjay, J. D. (2017). Optimization of RP-HPLC Method for Simultaneous Estimation of Lamivudine and Raltegravir in Binary Mixture by Using Design of Experiment. Eurasian Journal of Analytical Chemistry, 8(2), 179-195.
http://www.eurasianjournals.com