Embed Size (px)
Citation preview
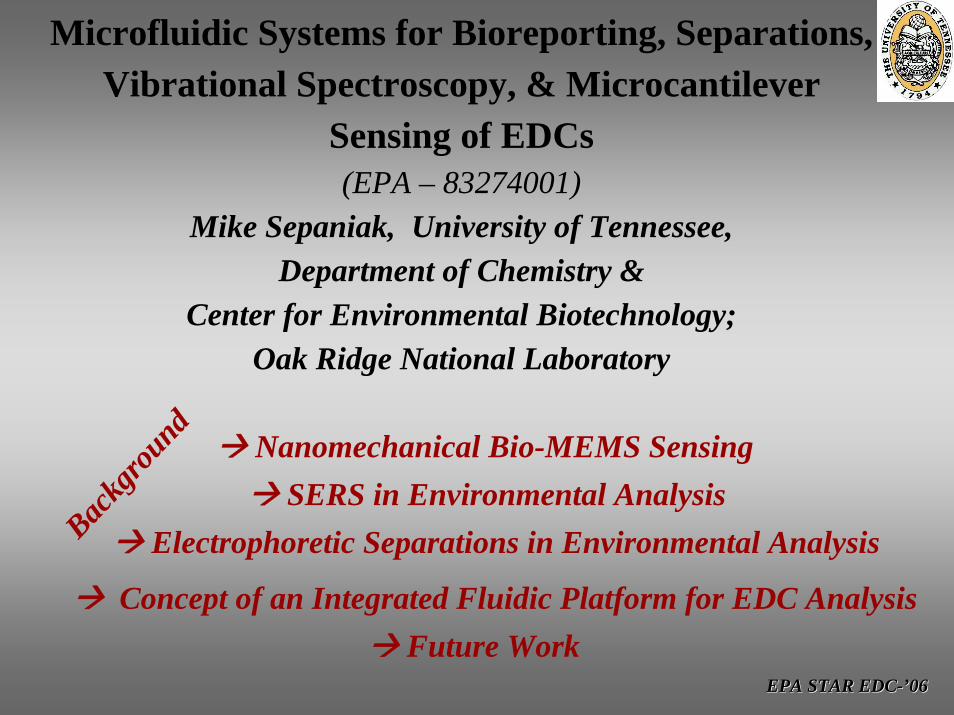
EPA STAR EDCEPA STAR EDC--’’0606
Microfluidic Systems for Bioreporting, Separations, Vibrational Spectroscopy, & Microcantilever
Sensing of EDCs(EPA – 83274001)
Mike Sepaniak, University of Tennessee,Department of Chemistry &
Center for Environmental Biotechnology;Oak Ridge National Laboratory
Backg
round
Electrophoretic Separations in Environmental AnalysisSERS in Environmental Analysis
Nanomechanical Bio-MEMS Sensing
Future WorkConcept of an Integrated Fluidic Platform for EDC Analysis
EPA STAR EDCEPA STAR EDC--’’0606
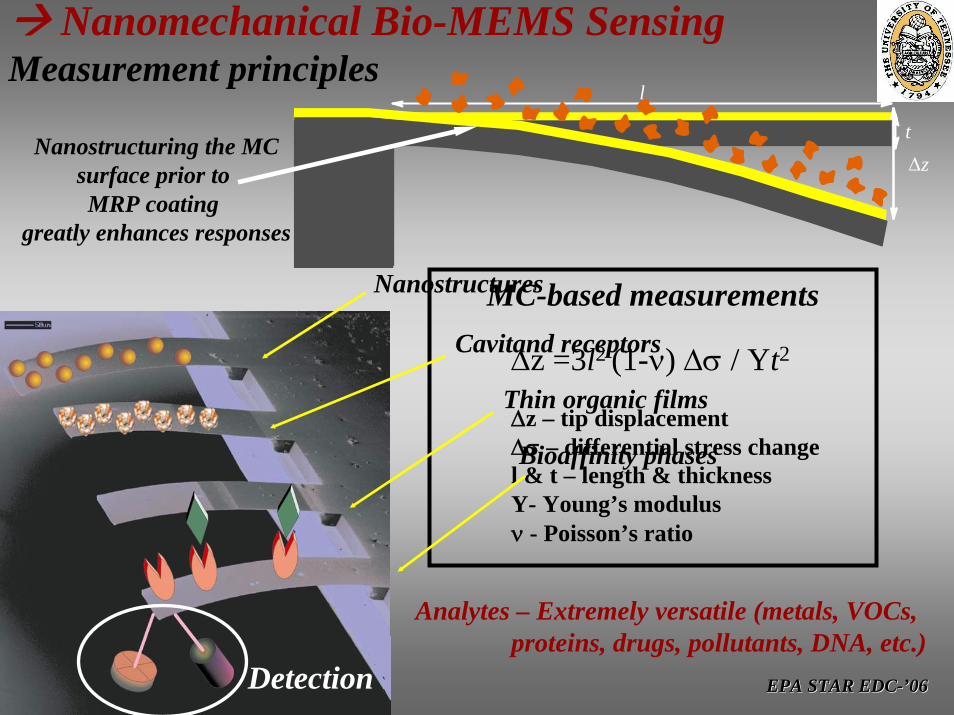
Nanomechanical Bio-MEMS SensingMeasurement principles
t
l
MC-based measurements
∆z =3l2 (1-ν) ∆σ / Yt2
∆z – tip displacement∆σ – differential stress changel & t – length & thicknessY- Young’s modulusν - Poisson’s ratio
∆z
Nanostructures
Cavitand receptors
Thin organic films
Bioaffinity phases
Nanostructuring the MCsurface prior to MRP coating
greatly enhances responses
Analytes – Extremely versatile (metals, VOCs,proteins, drugs, pollutants, DNA, etc.)
Detection

EPA STAR EDCEPA STAR EDC--’’0606
IgG IgG IgG IgG IgG
IgGIgGIgGIgGIgG IgGIgG
IgGIgGIgG
IgG
Following initial exposure (above), protein-protein &
protein-surface interactions and charge effects can
influence magnitude and direction of bending
Non-specific and Specific Binding of Proteins(Toward Bioaffinity Approach to Selectivity in
nanomechanical sensing of EDCs)
-1200
-800
-400
0
400
0 40 80 120 160 200
Time (minute)
Def
lect
ion
(nm
) PBS
Protein 1
2
3
4
5
2 – IgG on smooth surface3 – IgG on nanostructured surface4 – IgG on functionalized, nanostructured surface
“tensile
” (vs
“compressive
”)
bending
Stable receptors require anchoring; e.g. Glutaraldehyde or Protein A

EPA STAR EDCEPA STAR EDC--’’0606
Chiral Discrimination Using Ab-Mediated Cantilever Nanomechanics
-150
-100
-50
0
50
100
150
200
250
0 5 10 15 20 25 30 35
Time (minute)
Def
lect
ion
(nm
)
D /L-AA
1
2
34
5
6
1 – 50 mg/L L-tryptophan (anti-L-AA)
2 – 50 mg/L L-phenylalanine (anti-L-AA)
3 – 50 mg/L D-tryptophan (anti-L-AA)
4 – 50 mg/L D-phenylalanine (anti-L-AA)
5 – 50 mg/L L-phenylalanine (IgG)
6 – 50 mg/L D-phenylalanine (IgG)
3 & 4 no response with“wrong” Ab (exceptionalselectivity)
Linear calibration and > 99% ee capability

EPA STAR EDCEPA STAR EDC--’’0606
Calibration Using Antibody Functionalized MCs
Toxin A Cytokine
-0.1
0
0.1
0.2
0.3
0.4
0.5
0.6
0 50 100 150 200 250
Time (minute)
0.8ppm
0.5ppm
0.1ppm0.05ppmHIL
PBS(pH 7)
R2 = 0.9904
0
0.1
0.2
0.3
0.4
0.5
0 0.2 0.4 0.6 0.8 1 1.2
Concentration of HIL-1beta (ppm)
Res
pons
e(V
)
-0.1
0
0.1
0.2
0.3
0.4
0.5
0.6
0 50 100 150 200 250
Time (minute)
0.8ppm
0.5ppm
0.1ppm0.05ppmHIL
PBS(pH 7)
R2 = 0.9904
0
0.1
0.2
0.3
0.4
0.5
0 0.2 0.4 0.6 0.8 1 1.2
Concentration of HIL-1beta (ppm)
Res
pons
e(V
)
-0.1
0
0.1
0.2
0.3
0.4
0.5
0 20 40 60 80 100 120
Time (minute)
Res
pons
e (V
)
600ppb
100ppb60ppb
12ppb
y = 0.0012x + 0.0525R2 = 0.9998
00.10.20.30.4
0 50 100 150
Concentration (ppb)R
espo
nse(
V)
Low ppb concentrations can be detected

EPA STAR EDCEPA STAR EDC--’’0606
Distributed Selectivity Approach via Differentially Coated, VCSEL-Interrogated MCAs
Laser array pitch matches that of MC array; lasers –850 nm, 5 mW typicallyscanned over MC array in less than one second

EPA STAR EDCEPA STAR EDC--’’0606
Distributed Selectivity Response Signatures(Signatures of EDCs should be possible)
Time (Sec)0 10 20 30 40 50 60
Res
pons
e
-0.2
0.0
0.2
0.4
0.6
0.8Coating D
Data @ one/sec
Both Equilibrium & kinetic phenomenainfluence shape following 30 sec injection
Each MC in the arrayproduces a characteristic response that depends on the MRP & analyte
GC phase 1Polymer phase 1
CD macrocycleCalix macrocycle
Etc.

EPA STAR EDCEPA STAR EDC--’’0606
Distributed Selectivity & ANN Training & Performance
Input Middle
Output
Wim Wmo Ws are weighting factors
ANN 3-Layer Feed-Forward, Back-Propagation Diagram
ANN Training For Dioxane (4th analyte)
Five snapshots of training showing zeroing-in on 1.0 probably that
analyte is DIOXANE
44,000 training iterations
10 min. training time (computer!)
Most components in 10 analytetest suite identified with > 95%Does not identify CHCl3 forwhich not trained

EPA STAR EDCEPA STAR EDC--’’0606
SERS in Environmental AnalysisThe Optical Process
Anti-Stokes Scatter
Stokes Scatter
VibrationalSignatures
Raman scattering is an information rich process but, unfortunately, it is also very inefficient

EPA STAR EDCEPA STAR EDC--’’0606
SERS - Why
Small inherent cross sections of the normal Raman process lead to poor sensitivity, however Raman signals can be greatly enhanced by SERS and resonance effects (enhancements > 1012 have been reported in rare cases)
Commonly used optical methods fluorescence & absorbance are “information poor” while Raman methods provide detailed vibration information (unambiguous identification when needed)
SERS - Why NotLimited qualitative & quantitative reproducibilityLimited dynamic rangeHigh sensitivity is not very uniform
surface/nanostructure/phenomenon

EPA STAR EDCEPA STAR EDC--’’0606
SERS – What is it
I Raman is proportional to product of EM field and polarizability of molecule
Electromagnetic model ( “E” ) -> Radiation-induced polarization in nanometer-dimensioned precious metals enhances field (E) experienced by proximal analytes; metal type (Ag & Au), dimensions and shape, and spatial arrangement are very important

EPA STAR EDCEPA STAR EDC--’’0606
SERS Project GoalsBy technique and substrate advances, address these
analytical limitations and apply to EDCs
Our Advanced substrates are metal – polymer nano-composites substrates formed by vapor depositing Ag or Au onto:
15 nm 0.2 Å/s
Moldable PDMS Films
Spontaneous generatedsubstrates with randommorphologies
E-Beam Resist Pillars
Lithographically preparedsubstrates with controllablemorphologies

EPA STAR EDCEPA STAR EDC--’’0606
Comparison of SERS Substrates
Ag-PDMS Ag-E-Beam Pillars
A
B
C
D
A
B
C
D
Rh6G on different EBL
patterns
Different EBL-created pillarpatterns yield variations in SERS activity
0
10000
20000
30000
450 1200 1950Wavenumber (cm-1)
Ag-PDMS
Ag- Glass
4-Aminobenzoic acid (PABA)
0
10000
20000
30000
450 1200 1950Wavenumber (cm-1)
Ag-PDMS
Ag- Glass
4-Aminobenzoic acid (PABA)
Our substrates significantly out-perform traditional Ag islands on glass

EPA STAR EDCEPA STAR EDC--’’0606
SERS “On-The-Move” Improves PerformanceTranslating Stationary
SERS -Mapping
Reproducibility:Intra-Well RSD: <7%Inter-Well RSD: <10%
NH 2
HS
Spinning(translating)
Rastoring(static)p-ATPSTT-SERS
EPA STAR EDCEPA STAR EDC--’’0606
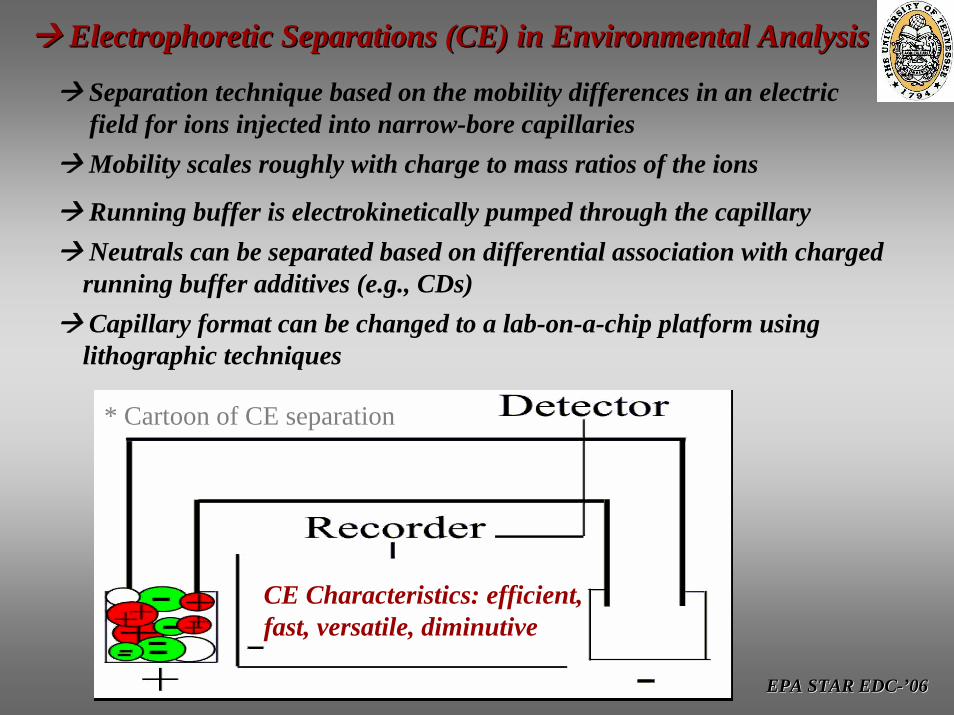
Electrophoretic Separations (CE) in Environmental AnalysisElectrophoretic Separations (CE) in Environmental Analysis
Separation technique based on the mobility differences in an electric field for ions injected into narrow-bore capillaries
Neutrals can be separated based on differential association with chargedrunning buffer additives (e.g., CDs)
Running buffer is electrokinetically pumped through the capillary
Mobility scales roughly with charge to mass ratios of the ions
Capillary format can be changed to a lab-on-a-chip platform usinglithographic techniques
* Cartoon of CE separation
CE Characteristics: efficient,fast, versatile, diminutive
EPA STAR EDCEPA STAR EDC--’’0606
+
- - - - - - - - - - - - - - - - - - - - - - - - - - - -
- - - - - - - - - - - - - - - - - - - - - - - - - - - -
-
+++++++++++++++ +++++++++++++++
++++++++++++++++++++++++++++++
NeutralsEOF
-OOC
-OOC
-OOC
-OOC
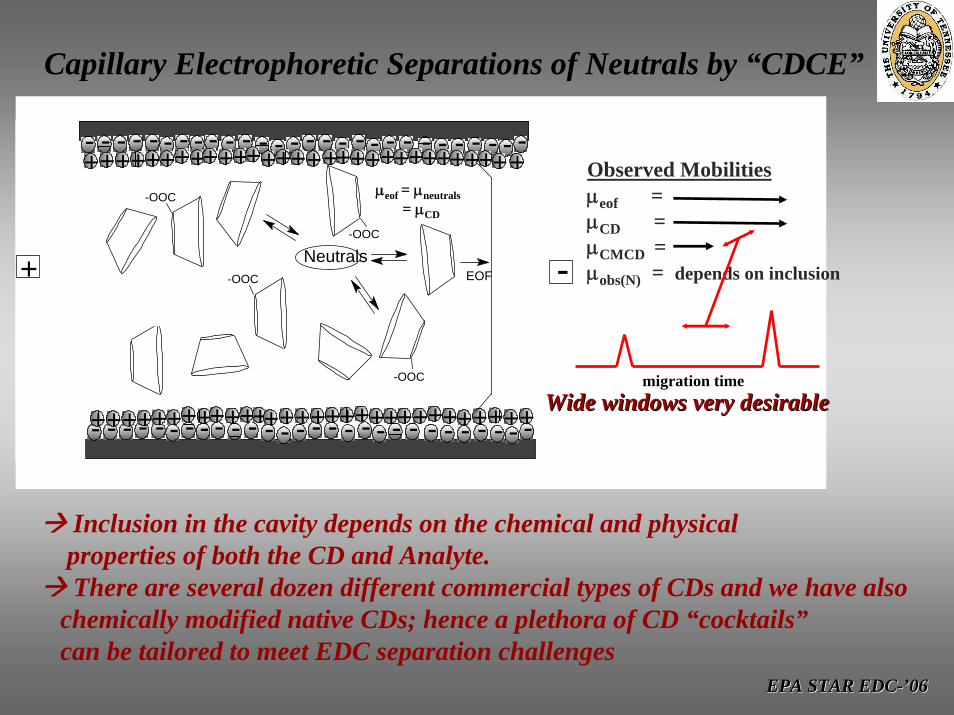
Capillary Electrophoretic Separations of Neutrals by “CDCE”
Observed Mobilitiesµeof =µCD =µCMCD =µobs(N) = depends on inclusion
Wide windows very desirableWide windows very desirablemigration time
Creates an elution window
µeof = µneutrals= µCD
Inclusion in the cavity depends on the chemical and physicalproperties of both the CD and Analyte. There are several dozen different commercial types of CDs and we have also
chemically modified native CDs; hence a plethora of CD “cocktails”can be tailored to meet EDC separation challenges

EPA STAR EDCEPA STAR EDC--’’0606
Examples of Prior Pseudo-phase CE Separations of Environmentally Significant Mixtures
mixture of ten mycotoxins
mixture of PCBs
alkyl substituted PAHs

EPA STAR EDCEPA STAR EDC--’’0606
Conceptual Design & Early Progress
EPA STAR EDCEPA STAR EDC--’’0606
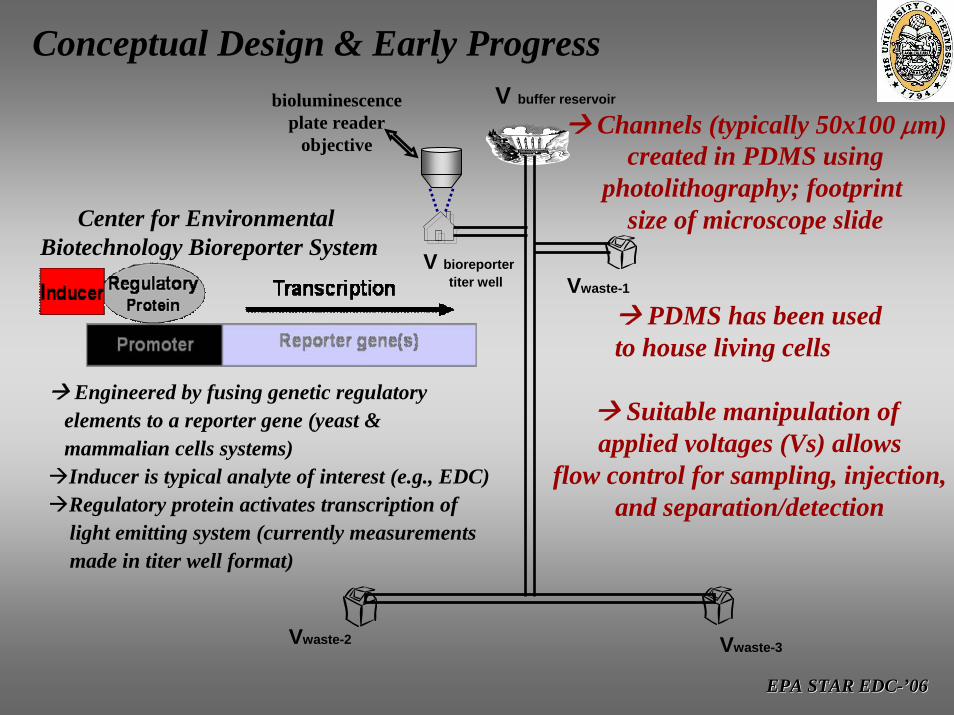
Conceptual Design & Early ProgressV buffer reservoir
V bioreportertiter well Vwaste-1
Vwaste-2
bioluminescenceplate reader
objectiveChannels (typically 50x100 µm)
created in PDMS usingphotolithography; footprint
size of microscope slide
PDMS has been used to house living cells
Center for Environmental Biotechnology Bioreporter System
Engineered by fusing genetic regulatoryelements to a reporter gene (yeast & mammalian cells systems)Inducer is typical analyte of interest (e.g., EDC)Regulatory protein activates transcription oflight emitting system (currently measurementsmade in titer well format)
Suitable manipulation of applied voltages (Vs) allows
flow control for sampling, injection,and separation/detection
Vwaste-3

EPA STAR EDCEPA STAR EDC--’’0606
Conceptual Design & Early Progress
V buffer reservoir
V bioreportertiter well Vwaste-1
Vwaste-2
bioluminescenceplate reader
objectiveTimed
electrokinetic fillingof offset with < 1 µL
of well contents
Vwaste-3

EPA STAR EDCEPA STAR EDC--’’0606
Conceptual Design & Early Progress
V buffer reservoir
V bioreportertiter well Vwaste-1
Vwaste-2
bioluminescenceplate reader
objective
Injection performed,cross channels cleared,the separation proceeds
Vwaste-3

EPA STAR EDCEPA STAR EDC--’’0606
Conceptual Design & Early ProgressExample CE separation of EDCs
V buffer reservoir
V bioreportertiter well Vwaste-1
Vwaste-2 Vwaste-3
V buffer reservoir
V bioreportertiter well Vwaste-1
Vwaste-2 Vwaste-3
Separation of kaempferol (a), genistein & daidzein (b),
apigenin (c) and DES (d) usinga running buffer with
β-CD & SDS pseudo-phases.
-5
5
15
25
35
15 20 25 30tim e
A.U
. @ 2
14nm
(a)
(b)
(a)
(c)(d)
(d)
-5
5
15
25
35
15 20 25 30tim e
A.U
. @ 2
14nm
(a)
(b)
(a)
(c)(d)
(d)
0
10
20
30
40
15 20 25time
A.U
. @ 2
14nm
(a)
(b)
(c)
(d)(d)
0
10
20
30
40
15 20 25time
A.U
. @ 2
14nm
(a)
(b)
(c)
(d)(d)
Separation of bisphenol A (a), 17b-esradiol (b), 17 a-
ethynylestradiol (c) and DES (d)using a running buffer with β-
CD & SDS pseudo-phases.
Chemical Changes

EPA STAR EDCEPA STAR EDC--’’0606
Conceptual Design & Early ProgressV buffer reservoir
V bioreportertiter well Vwaste-1
Vwaste-2
bioluminescenceplate reader
objective
Diversion into detection channels (NMC & SSC)
Vwaste-3

EPA STAR EDCEPA STAR EDC--’’0606
Conceptual Design & Early ProgressDistinctive SERS Spectra of EDCs using Ag-PDMS substrates
-1000
0
1000
2000
3000
4000
5000
150 700 1250 1800 2350
Wavenumbers cm-1
Inte
nsity
(A.U
.)
Bisphenol A
0
2000
4000
6000
8000
10000
12000
14000
16000
150 700 1250 1800 2350
Wavenumbers cm-1
Inte
nsity
(A.U
.) Diethylstilbestrol
-200
0
200
400
600
800
1000
1200
1400
1600
150 700 1250 1800 2350
Wavenumbers cm-1
Inte
nsity
(A.U
.)
Kaempferol
V buffer reservoir
V bioreportertiter well Vwaste-1
Vwaste-2 Vwaste-3
V buffer reservoir
V bioreportertiter well Vwaste-1
Vwaste-2 Vwaste-3
-500
50100150200250300350400450
150 700 1250 1800 2350
Wavenumbers cm-1
Inte
nsity
(A.U
.)
Apigenin
-100
0
100
200
300
400
500
150 700 1250 1800 2350
Wavenumbers cm-1
Inte
nsity
(A.U
.)
Genistein
Bands unique to each EDC are evident

EPA STAR EDCEPA STAR EDC--’’0606
Conceptual Design & Early ProgressSERS Spectra of EDCs using EBL nanofabricated substrates
25 nm of Ag was deposited onto nano-dimensional hexagon, square, and elliptical (2 aspect ratio) pillars; Apigenin SERSactivity greatest on square pattern
-50
3950
7950
11950
15950
19950
200 700 1200 1700 2200 2700
Wavenumbers cm-1
Inte
nsity
(A.U
.)
0
4000
8000
12000
16000
HCC EC2-1:3 EC2-1:4 CC4-1:1
Pattern
Ban
d A
rea
698-
763
cm-1
(A.U
.)Apigenin
-50
3950
7950
11950
15950
19950
200 700 1200 1700 2200 2700
Wavenumbers cm-1
Inte
nsity
(A.U
.)
0
4000
8000
12000
16000
HCC EC2-1:3 EC2-1:4 CC4-1:1
Pattern
Ban
d A
rea
698-
763
cm-1
(A.U
.)Apigenin
EPA STAR EDCEPA STAR EDC--’’0606
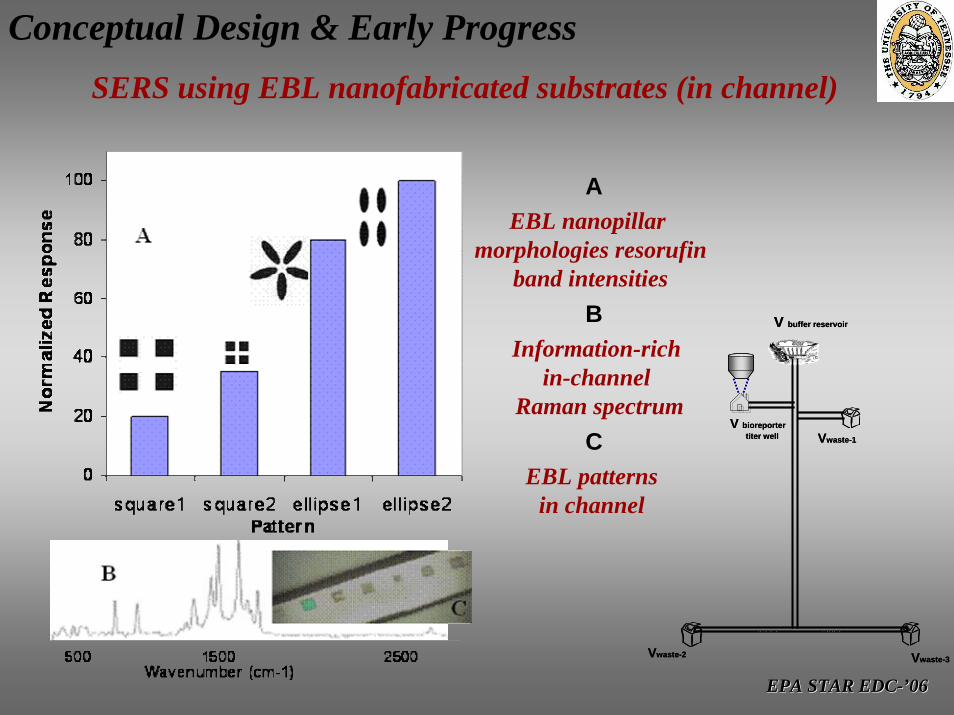
Conceptual Design & Early ProgressSERS using EBL nanofabricated substrates (in channel)
EBL nanopillarmorphologies resorufin
band intensities
A
Information-rich in-channel
Raman spectrum
B
CEBL patterns
in channel
V buffer reservoir
V bioreportertiter well Vwaste-1
Vwaste-2 Vwaste-3
V buffer reservoir
V bioreportertiter well Vwaste-1
Vwaste-2 Vwaste-3
EPA STAR EDCEPA STAR EDC--’’0606
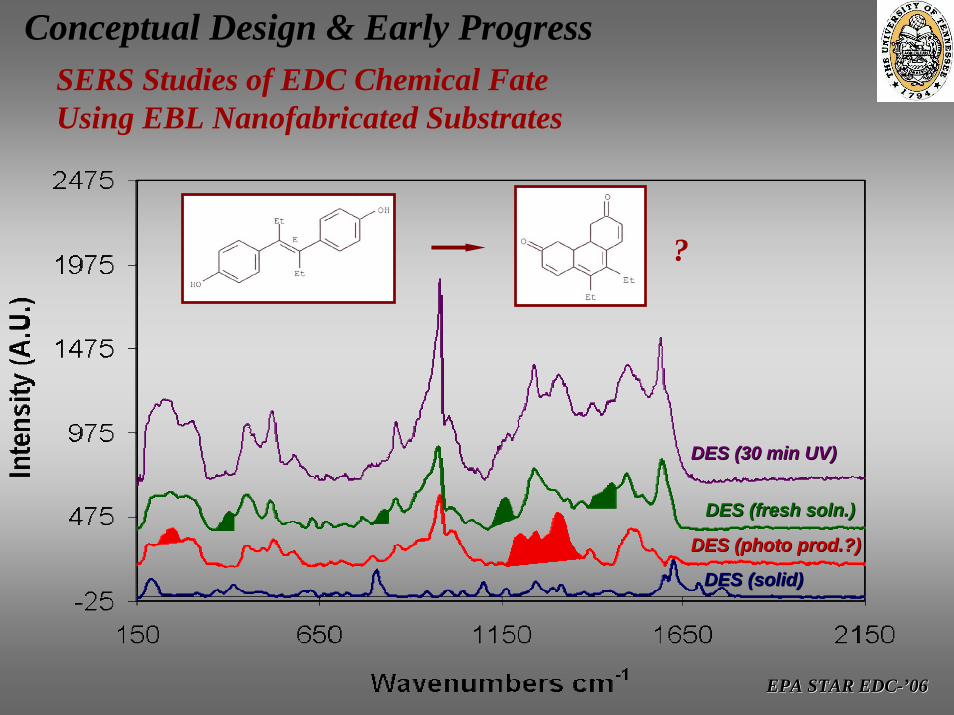
Conceptual Design & Early ProgressSERS Studies of EDC Chemical Fate Using EBL Nanofabricated Substrates
DES (30 min UV) DES (30 min UV)
DES (fresh DES (fresh solnsoln.).)
DES (photo prod.?)DES (photo prod.?)
DES (solid)DES (solid)
?
EPA STAR EDCEPA STAR EDC--’’0606
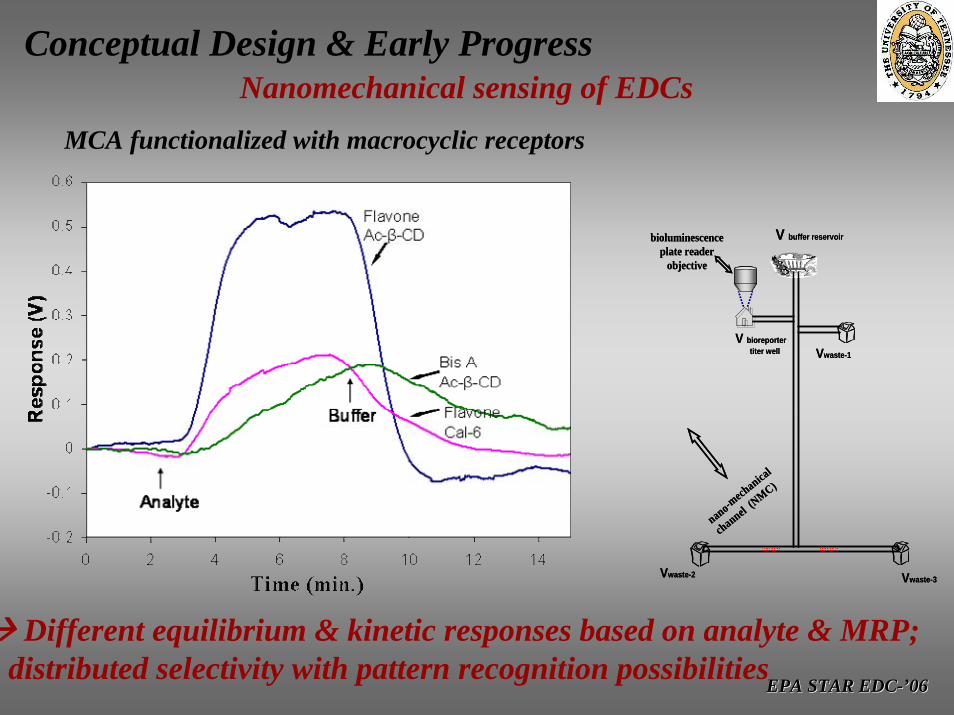
Conceptual Design & Early ProgressNanomechanical sensing of EDCs
MCA functionalized with macrocyclic receptors
V buffer reservoir
V bioreportertiter well Vwaste-1
Vwaste-2 Vwaste-3
bioluminescenceplate reader
objective
nano-mech
anical
channel (NMC)
V buffer reservoir
V bioreportertiter well Vwaste-1
Vwaste-2 Vwaste-3
bioluminescenceplate reader
objective
nano-mech
anical
channel (NMC)
Different equilibrium & kinetic responses based on analyte & MRP;distributed selectivity with pattern recognition possibilities

EPA STAR EDCEPA STAR EDC--’’0606
Conceptual Design & Early ProgressNanomechanical sensing of EDCs
Responses to EDCs for MC with anImmobilized h-ER-β on surface V buffer reservoir
V bioreportertiter well Vwaste-1
Vwaste-2 Vwaste-3
bioluminescenceplate reader
objective
nano-mech
anical
channel (N
MC)
V buffer reservoir
V bioreportertiter well Vwaste-1
Vwaste-2 Vwaste-3
bioluminescenceplate reader
objective
nano-mech
anical
channel (N
MC)
Further bioaffinity approach studies are being performed(literally as I speak)
-0.04
0
0.04
0.08
0.12
0.16
0.2
0 10 20
Res
pons
e (V
)
Analyte
PBS
1*10-6
PBS-0.
-0.04
0
0.04
0.08
0.12
0.16
0.2
0 10 20
Res
pons
e (V
)
Analyte
PBS
1*10-6
PBS-0.
Time, min.
AnalyteµM
PBS
17 β-Estradiol
Bisphenol A
PBS blank

EPA STAR EDCEPA STAR EDC--’’0606
Future Work (next 12 month period):
Continue surveying targeted EDCs for nanomechanical and SERS responsesMCA modifications (phases and nano structuring) to enhance responses & selectivityAdvanced SERS substrates to enhance sensitivityFate studies of DES and other EDCs
Develop conditions for on-chip separations for various target EDC combinationsPerform correlation studies involving mating our advanced methods with bioluminescence reporting in titer well formatWork toward integrating the individual analytical components and field portability
Key Members of Research Team:UT-Chemistry – Maggie Connatser, Kasey Hill, Jenny Oran
Pampa Dutta, Marco DeJesusUT-CEB – Gary Sayler, John Sanseverino, Melanie Eldridge

EPA STAR EDCEPA STAR EDC--’’0606
Questions?
Key Members of Research Team:UT-Chemistry – Maggie Connatser, Kasey Hill, Jenny Oran
Pampa Dutta, Marco DeJesusUT-CEB – Gary Sayler, John Sanseverino, Melanie Eldridge

EPA STAR EDCEPA STAR EDC--’’0606
Field-Ready Potential for These Technologies

EPA STAR EDCEPA STAR EDC--’’0606
Key Issue - SelectivityAchieving Selectivity Analysis
MCA
extra

EPA STAR EDCEPA STAR EDC--’’0606
Achieving Selectivity In AnalysisWith analyte sensitive sensors (e.g. MCs) these spectroscopic &
chromatographic analytical attributes are not present. However, selectivity is attainable through the clever
uses of molecular recognition phases (MRPs).
MCA
extra
Two viable approaches
Use of highly selective MRPs with large binding constants:
• Bioaffinity • Selective chelates for metal ions• Issues of reversibility & robustness
Use of moderately selective Phases in arrays for “distributed selectivity”:
• Based on response signatures• Pattern recognition• Issues of molecular recognitioncontrast and differential coating
EPA STAR EDCEPA STAR EDC--’’0606
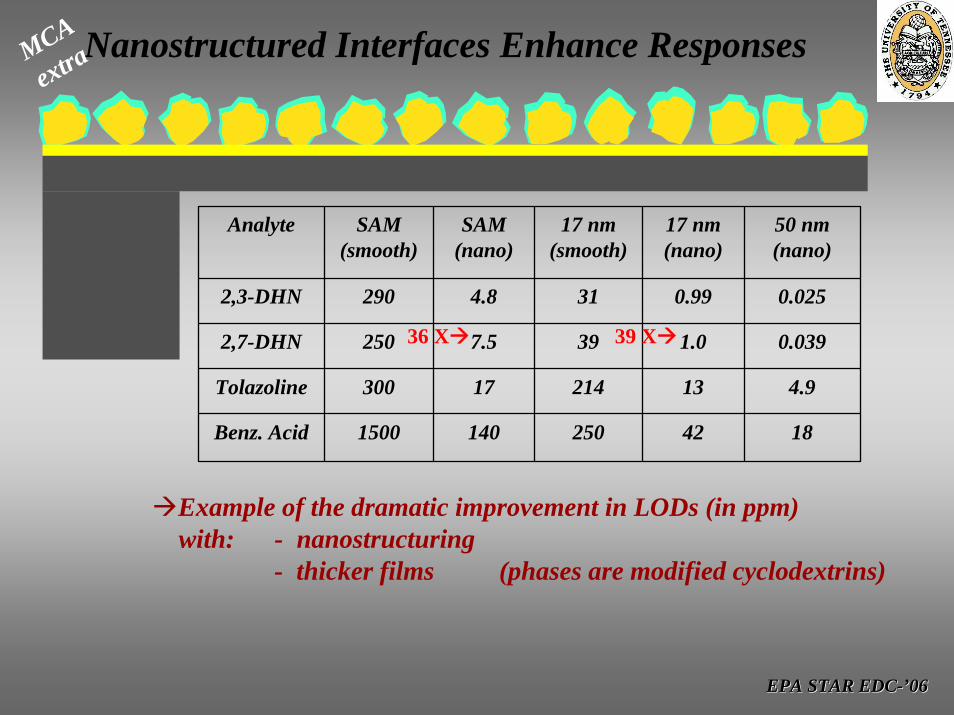
Nanostructured Interfaces Enhance Responses
Analyte SAM (smooth)
SAM (nano)
17 nm (smooth)
17 nm (nano)
50 nm (nano)
2,3-DHN 290 4.8 31 0.99 0.025
2,7-DHN 250 7.5 39 1.0 0.039
Tolazoline 300 17 214 13 4.9
Benz. Acid 1500 140 250 42 18
36 X 39 X
MCA
extra
Example of the dramatic improvement in LODs (in ppm) with: - nanostructuring
- thicker films (phases are modified cyclodextrins)

EPA STAR EDCEPA STAR EDC--’’0606
MCA
extraBioaffinity Interaction on Different Surfaces
Antihuman IgG - human IgG
Our dealloyed surfaces not only provide larger signals, but also better reversibility. Studies are currently underwayto investigate mechanism

EPA STAR EDCEPA STAR EDC--’’0606
Cantilever Deflections Can Also be Usedfor DNA Hybridization Studies
The direction of cantilever motion is opposite during
immobilization and hybridization of ss-DNA on
two different surfaces (dealloyed gold, smooth
gold).
Inconsistencies maybe related to the complexity of surface charge, adsorbate-
surface, adsorbate-adsorbate, and adsorbate
rearrangement effects.
MCA
extra
EPA STAR EDCEPA STAR EDC--’’0606
MCA
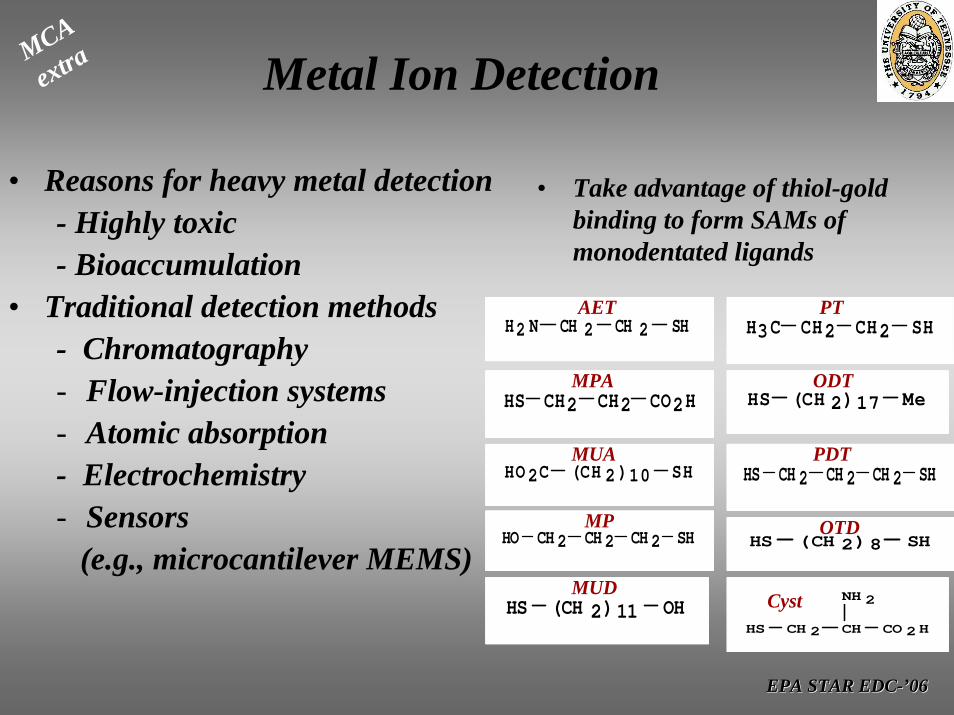
extra Metal Ion Detection
• Reasons for heavy metal detection- Highly toxic- Bioaccumulation
• Traditional detection methods- Chromatography- Flow-injection systems- Atomic absorption - Electrochemistry- Sensors
(e.g., microcantilever MEMS)
CH 2 CH 2H 2 N SH
CO2HCH2CH2HS
(CH 2 )10HO 2C SH
CH 2CH 2 CH 2HO SH
(CH 2) 11 OHHS
CH 2 CH 2H3 C SH
(CH 2) 17 MeHS
CH 2CH 2 CH 2HS SH
(CH 2) 8HS SH
CO 2 HCHCH 2
NH 2
HS
AET
MPA
Cyst
MUA
MP
MUD
OTD
PDT
ODT
PTCH 2 CH 2H 2 N SH
CO2HCH2CH2HS
(CH 2 )10HO 2C SH
CH 2CH 2 CH 2HO SH
(CH 2) 11 OHHS
CH 2 CH 2H3 C SH
(CH 2) 17 MeHS
CH 2CH 2 CH 2HS SH
(CH 2) 8HS SH
CO 2 HCHCH 2
NH 2
HS
AET
MPA
Cyst
MUA
MP
MUD
OTD
PDT
ODT
PT
• Take advantage of thiol-gold binding to form SAMs of monodentated ligands

EPA STAR EDCEPA STAR EDC--’’0606LiCl CsCl CoCl2 CuCl2 AlCl3 CrCl30
0.1
0.2
0.3
0.4
0.5
0.6
0.7
Res
pons
e (V
)
AET MP MPA Cysteine 0.1mM salt solution
LiCl CsCl CoCl2 CuCl2 AlCl3 CrCl30
0.1
0.2
0.3
0.4
0.5
0.6
0.7
Res
pons
e (V
)
AET MP MPA Cysteine 0.1mM salt solution
LiCl CsCl CoCl2 CuCl2 AlCl3 CrCl3LiCl CsCl CoCl2 CuCl2 AlCl3 CrCl30
0.1
0.2
0.3
0.4
0.5
0.6
0.7
Res
pons
e (V
)
AET MP MPA Cysteine 0.1mM salt solution
Metal-Ligand Interaction & MC Response
L
S
M
S
L
L
S
L
S
S
L
S
L M L
S
L
S
L
SWash with AB
L
S
L
SS
L
L
S
L
S
S
L
S
L L
SL
SMetal ion /AB
L
S
L
SS
L
L
S
L
S
S
L
S
L L
SL
S
Nanostructured surface
L
S
M
S
L
L
S
L
S
S
L
S
L M L
S
L
S
L
SWash with AB
L
S
L
SS
L
L
S
L
S
S
L
S
L L
SL
SMetal ion /AB
L
S
L
SS
L
L
S
L
S
S
L
S
L L
SL
S
L
S
M
S
L
L
S
L
S
S
L
S
L M L
S
L
S
L
S
L
S
M
S
L
L
S
L
S
S
LL
S
L
SS
MMM
S
L
S
L
L
S
L
S
L
S
L
SS
S
L
S
L
S
L M L
S
L
S
L
SS
L
S
L M L
S
L
S
L
S
MMM L
S
L
S
L
S
L
S
L
S
L
SWash with ABWash with AB
L
S
L
SS
L
L
S
L
S
S
L
S
L L
SL
S
L
S
L
SS
L
L
S
L
S
S
L
S
L L
SL
S
L
S
L
S
L
SS
L
L
S
L
S
S
L
S
L L
SL
S
L
S
L
SSS
L
S
L
L
S
L
S
L
S
L
SS
S
L
S
L
S
L
S
L L
S
L
SL
S
L
SMetal ion /ABMetal ion /AB
L
S
L
SS
L
L
S
L
S
S
L
S
L L
SL
S
L
S
L
SS
L
L
S
L
S
S
L
S
L L
SL
S
L
S
L
S
L
SS
L
L
S
L
S
S
L
S
L L
SL
S
L
S
L
SSS
L
S
L
L
S
L
S
L
S
L
SS
S
L
S
L
S
L
S
L L
S
L
SL
S
L
S
Nanostructured surface
L
S
M
S
L
L
S
L
S
S
L
S
L M L
S
L
S
L
SWash with AB
L
S
L
SS
L
L
S
L
S
S
L
S
L L
SL
SMetal ion /AB
L
S
L
SS
L
L
S
L
S
S
L
S
L L
SL
S
Nanostructured surface
L
S
M
S
L
L
S
L
S
S
L
S
L M L
S
L
S
L
SWash with AB
L
S
L
SS
L
L
S
L
S
S
L
S
L L
SL
SMetal ion /AB
L
S
L
SS
L
L
S
L
S
S
L
S
L L
SL
S
L
S
M
S
L
L
S
L
S
S
L
S
L M L
S
L
S
L
S
L
S
M
S
L
L
S
L
S
S
LL
S
L
SS
MMM
S
L
S
L
L
S
L
S
L
S
L
SS
S
L
S
L
S
L M L
S
L
S
L
SS
L
S
L M L
S
L
S
L
S
MMM L
S
L
S
L
S
L
S
L
S
L
SWash with ABWash with AB
L
S
L
SS
L
L
S
L
S
S
L
S
L L
SL
S
L
S
L
SS
L
L
S
L
S
S
L
S
L L
SL
S
L
S
L
S
L
SS
L
L
S
L
S
S
L
S
L L
SL
S
L
S
L
SSS
L
S
L
L
S
L
S
L
S
L
SS
S
L
S
L
S
L
S
L L
S
L
SL
S
L
SMetal ion /ABMetal ion /AB
L
S
L
SS
L
L
S
L
S
S
L
S
L L
SL
S
L
S
L
SS
L
L
S
L
S
S
L
S
L L
SL
S
L
S
L
S
L
SS
L
L
S
L
S
S
L
S
L L
SL
S
L
S
L
SSS
L
S
L
L
S
L
S
L
S
L
SS
S
L
S
L
S
L
S
L L
S
L
SL
S
L
S
Nanostructured surface
MCA
extra
Selectivity patterns For MCs with
SAMs of different monodentated
ligands

EPA STAR EDCEPA STAR EDC--’’0606
SERS
extra Sample Translation Technique; Effect on Various Analytes
300
800
1300
1800
2300
2800
150 350 550 750 950 1150 1350 1550 1750 1950
Wavenumbers (cm-1)
Inte
nsity
(Cou
nts)
Stationary STT
Riboflavin
0
5000
10000
15000
20000
25000
30000
35000
150 350 550 750 950 1150 1350 1550 1750 1950 2150 2350 2550 2750 2950
Wavenumbers (cm-1)
Inte
nsity
(Cou
nts)
Stationary STT
Folic Acid
500
1500
2500
3500
4500
5500
6500
7500
150 350 550 750 950 1150 1350 1550 1750 1950
Wavenumbers (cm-1)
Inte
nsity
(Cou
nts)
Stationary STT
8-Hydroxyquinoline
100
600
1100
1600
2100
2600
3100
150 350 550 750 950 1150 1350 1550 1750 1950
Wavenumbers (cm-1)
Inte
nsity
(Cou
nts)
Stationary STT
Tetracaine
0
5000
10000
15000
20000
25000
30000
35000
150 350 550 750 950 1150 1350 1550 1750 1950 2150 2350 2550 2750 2950
Wavenumbers (cm-1)
Inte
nsity
(Cou
nts)
Stationary STT
Rhodamine 6G
300
800
1300
1800
2300
2800
150 350 550 750 950 1150 1350 1550 1750 1950
Wavenumbers (cm-1)
Inte
nsity
(Cou
nts)
Stationary STT
Benzoic Acid(BA)
Samples centeredon spinner then moved
off-center a few hundred µm &
spun at leastseveral hundred RPMto yield STT spectra

EPA STAR EDCEPA STAR EDC--’’0606
Quantitative Performance of STT-SERS With Ag-PDMS Substrates
SERS
extra
1.0E+04
1.1E+04
1.2E+04
1.3E+04
1.4E+04
1.5E+04
1.6E+04
1.7E+04
1.8E+04
1.9E+04
2.0E+04
0.0E+00 2.0E-05 4.0E-05 6.0E-05 8.0E-05 1.0E-04
Concentration(M)
Ban
d Ar
ea 7
83 ±
(35)
cm
-1 (A
. U.)
R6G Linear Fit Poly. (R6G)
Y=4.3± (0.6)E+08 X +9.5± (0.5)E+03R2=0.98
Rh6G
y = 5.290±(0.009)E+08x + 5.06±(0.4)E+02R2 = 1.0
0
500
1000
1500
2000
2500
3000
3500
4000
4500
5000
0.0E+00 2.0E-06 4.0E-06 6.0E-06 8.0E-06Concentration (M)
Ban
d Ar
ea 5
73.4
1-64
2.98
cm
-1(A
.U.)
R6G Linear (R6G)
Rh6GExperimental values for:LOL: 1.0x10⁻⁵ MLOD: 1.0x10⁻⁹ M
0
2000
4000
6000
8000
10000
12000
14000
16000
18000
0.0E+00 2.0E-06 4.0E-06 6.0E-06 8.0E-06 1.0E-05Concentration (M)
Ban
d A
rea
1342
.15-
1443
.67
cm-1 (A
.U.)
p-ABA Reg
Y=1.57±(0.03)E+09X+4±(1)E+02R2=1.0
0
5000
10000
15000
20000
150 350 550 750 950 1150 1350 1550 1750 1950
Wavenumbers (cm-1)
Stationary STT
p-ABA
Experimental values for:LOL: N.R.LOD: 1x10⁻⁸ M

EPA STAR EDCEPA STAR EDC--’’0606
Saccharomyces cerevisiae Yeast Estrogen Screen
Bioextra
Routledge and Sumpter. 1996. Environ. Toxicol Chem. 15:241-248

EPA STAR EDCEPA STAR EDC--’’0606
Microtiter Plate Layout1:2
1:10
1:10
1:10
1:10
Bioextra

EPA STAR EDCEPA STAR EDC--’’0606
Our EPA STAR work is focused on development of advanced, materials-based, integrated analytical methodologies for EDC analysis
Objectives:
Develop conditions for capillary then on-chip electrokinetic separations
Optimize nanocomposite-based SERS substrate morphologies for greatest activity and survey responses
Evaluate nanomechanical response signatures using functionalized MCAs- traditional molecular recognition phases - bioaffinity phases for EDCs
Integrate bioreporter yeast conditions for total systems with bioluminescence-based screening of EDCs and the aforementioned advanced analytical technologies (initially in titer-plate to microfluidic configuration; ultimately a totally integrated platform )