Embed Size (px)
Citation preview

Microfluidic System for Solution Array Based Bioassays
G. M. Dougherty, J. B.-H. Tok, S. S. Pannu, Klint A. Rose
13 February 2006
UCRL-TR-219167

–2–
Disclaimer
This document was prepared as an account of work sponsored by an agency of the United States Government. Neither the United States Government nor the University of California nor any of their employees, makes any warranty, express or implied, or assumes any legal liability or responsibility for the accuracy, completeness, or usefulness of any information, apparatus, product, or process disclosed, or represents that its use would not infringe privately owned rights. Reference herein to any specific commercial product, process, or service by trade name, trademark, manufacturer, or otherwise, does not necessarily constitute or imply its endorsement, recommendation, or favoring by the United States Government or the University of California. The views and opinions of authors expressed herein do not necessarily state or reflect those of the United States Government or the University of California, and shall not be used for advertising or product endorsement purposes.
Auspices Statement
This work was performed under the auspices of the U. S. Department of Energy (DOE) by the University of California, Lawrence Livermore National Laboratory (LLNL) under Contract No. W-7405-Eng-48. The project (03-ERD-024) was funded by the Laboratory Directed Research and Development Program at LLNL.

–3–
FY05 LDRD Final ReportMicrofluidic System for Solution Array Based Bioassays
LDRD Project Tracking Code: 03-ERD-024George Dougherty, Principal Investigator
Abstract
The objective of this project is to demonstrate new enabling technology for multiplex biodetection systems that are flexible, miniaturizable, highly automated, low cost, and high performance. It builds on prior successes at LLNL with particle-based solution arrays, such as those used in the Autonomous Pathogen Detection System (APDS) successfully field deployed to multiple locations nationwide. We report the development of a multiplex solution array immunoassay based upon engineered metallic nanorod particles. Nanobarcodes® particles are fabricated by sequential electro-deposition of dissimilar metals within porous alumina templates, yielding optically encoded striping patterns that can be read using standard laboratory microscope optics and PC-based image processing software. The addition of self-assembled monolayer (SAM) coatings and target-specific antibodies allows each encoded class of nanorod particles to be directed against a different antigen target. A prototype assay panel directed against bacterial, viral, and soluble protein targets demonstrates simultaneous detection at sensitivities comparable to state of the art immunoassays, with minimal cross-reactivity. Studies have been performed to characterize the colloidal properties (zeta potential) of the suspended nanorod particles as a function of pH, the ionic strength of the suspending solution, and surface functionalization state. Additional studies have produced means for the non-contact manipulation of the particles, including the insertion of magnetic nickel stripes within the encoding pattern, and control via externally applied electromagnetic fields. Using the results of these studies, the novel Nanobarcodes®based assay was implemented in a prototype automated system with the sample processing functions and optical readout performed on a microfluidic card. The unique physical properties of the nanorod particles enable the development of integrated microfluidic systems for biodefense, protein expression studies, and other applications.
Introduction/Background
Multiplex bioassays are critical for biodefense and medical diagnostic applications. In many cases, multiple threat agents must be screened simultaneously, or multiple samples must be rapidly tested [1]. Host-response assays require detection and monitoring of combinations of biomarkers, including DNA, RNA, proteins, and small molecules. While tremendous advances in multiplexed biomarker analysis have come about with the advent of DNA and protein chips, this technology is limited in several important ways (see Table I for a comparison between solution arrays and chip technology): (1) microarrays are 2-dimensional, limiting interaction with target molecules; (2) gene and protein chips are aimed at only one type of marker (DNA, RNA, or protein); (3) DNA and protein chips are not reconfigurable; and (4) microarray technologies require the manufacture of specific chips, an approach that is expensive and time consuming. Solution arrays address all of these shortcomings.

–4–
- high reagent use- large sample volumes
- low reagent use- low sample volume required
Sample and reagent use
separate DNA, protein chipsDNA, RNA, ProteinsBioassayLimitedFlexibleAdaptability
High - $500k for new Affy chipLow Cost
slow (several hours) - diffusionfast (~15 mins)Kinetics
Positional encoding by immobilization on surface
Encoded particles perform bioassay in solution
Description
ARRAYTYPE
Solution Arrays Microarrays
LuminexNBC
Q-dotsIllumina
AffymetrixNanogen
HyseqIncyte
Table I. Comparison of solution arrays and 2-D microarrays.
Solution arrays are similar in purpose to gene and protein array chips, but use surface functionalized particles in solution, rather than a 2-D chip that binds the biomolecules to locations on a fixed surface. A fluorescent signal is typically used to report a binding event; instead of correlating fluorescence with location, as in a chip format, the particles are encoded for identification, so that fluorescence is correlated with particle type. The solution array concept is illustrated in Figure 1. The different particles are mixed with the sample, and any target molecules in the sample are captured by the particles that are specifically functionalized for them. After the excess sample is washed away, reporter molecules (identical to those on the particles) tagged with fluorophore are introduced, and these bind to any target molecules that were captured on the surfaces of the particles. Then the excess reporter is washed away and the particles are examined; any that are fluorescent are known to have found their target molecules in the sample, and by determining the “flavors” of the fluorescent particles, it can be determined which targets have been found.
Potential particles must have two properties: they must be capable of being functionalized to exhibit specific reactivity with selected biochemical targets, and each class or “flavor” of particle specific to a particular target must be readily distinguishable by the detection system. The general advantages of a solution array approach over the chip-based approach include faster reaction kinetics, the ability to perform immunoassays and nucleic acid hybridization assays simultaneously on the same sample, the flexibility to assemble a custom assay panel at the point of use by mixing and matching the particle “flavors” of most interest, and avoidance of the cost and delay involved in producing a unique chip design.

–5–
sets of distinguishable particles
surface functionalizeeach particle with aunique receptor
mix particles withfluorescently taggedsample in solution(sandwich assay)
read out particle & fluorescenceto detect biomolecules of interest
anthrax plague small pox botulism
…
Figure 1. Illustration of the solution array concept.
Past work at LLNL has focused on Luminex fluorescent beads. This has enabledvery successful large-scale automated multiplex biodetection systems such as the Autonomous Pathogen Detection System (APDS) [2]. These polymer beads are encoded spectroscopically, and as a result require the use of fairly sophisticated and expensive flow cytometers or similar optical systems for readout. Requirements are motivating research into miniaturized biodetection systems that integrate multiple functions within a compact unit [3-6]. Preliminary work in implementing fluorescent bead based solution array assays in a microfluidic format revealed difficulties in handling and processing beads because it proved difficult to retain the beads in place during incubation and washing steps, and the beads tended to adhere to the inner surfaces of the microfluidic channels and wells [7].
We have chosen to demonstrate a novel solution array bioassay system using Nanobarcodes® particles as the solution array elements. Nanobarcodes® (Figure 2) are metallic nanorod particles, approximately 250 nm in diameter and 6 microns long, developed by Nanoplex Technologies, Inc. They are fabricated by sequential electrodeposition of silver, gold, or other metals within porous anodic alumina templates. The alternating segments of silver and gold have different reflectivities when viewed in blue light, so when the finished particles are present in solution they can be readily identified visually, using a standard optical microscope. The striping patterns are conceptually the same as the barcode patterns used to identify items in a supermarket. The soft metals used mean that well-understood alkanethiol chemistry can be used to functionalize the particle surfaces, and they can be made with magnetic materials, opening up new possibilities for manipulating, trapping, and reading the particles.

–6–
Figure 2. Nanobarcodes®™ particles contain a striping pattern, visible in blue light, that allows them to be
readily identified in the same way as supermarket barcodes.
In the solution array assay implementation, the assay results are determined by obtaining a matched pair of images of the particles in blue reflected light (darkfield), and in fluorescence. The reflectance image provides the identity of each of the visible particles, and the fluorescence image indicates the degree of antigen binding. Figure 3shows such a pair of images. The images can be obtained using standard microscope hardware, and the images can be processed using a PC to collect the results for a multiplex assay involving many simultaneous particle types / antigen targets.
Figure 3. A reflectance / fluorescence image pair, used to read the results of a Nanobarcode based solution
array assay. The absence of fluorescence from several of the particles (indicated at right) shows that the target for those particles was absent from the sample.
The objective of this project is to demonstrate microfluidic system technologies for performing automated solution array assays based on Nanobarcodes® particles. The techniques we demonstrate can be applied to the detection and identification of biowarfare (BW) agents, and presymptomatic exposure to BW agents and infectious diseases. Specific technical objectives fell into 4 areas: 1. assay development, 2. particle manipulation and control, 3. optical readout, and 4. microfluidic device integration.
Research Activities
At project initiation, it was decided to focus work on the scientifically critical questions limiting the deployment of fieldable solution array bioassays, and not on engineering component development. Hence, there was no effort to develop unique miniaturized optical imaging equipment, miniature fluid pumps, compact power sources

–7–
and so on. Development of components is expensive and is being addressed by other projects both at LLNL and in the larger research community.
The structure of the project focused early phases of the work on the enabling technologies of assay development, particle manipulation and control, and optical readout. Once sufficient progress had been achieved in these enabling technologies, they were brought together to address the objective of microfluidic device integration.
1. Assay Development
The first critical objective was the demonstration of a multiplex biodetection assay based on Nanobarcodes® particles that shows good performance on the benchtop. Only after the basic assay is successfully demonstrated with manual benchtop techniquescan it be confidently transitioned to an automated, microfluidic format. Nanoplex Technologies, Inc. had made some initial studies of Nanobarcodes® based multiplex immunoassays directed against purified cytokines, using highly optimized commercial medical antibodies. Our aim was to extend this work to biodetection assays using currently available bioagent simulant antigen–antibody systems and realistic antigen samples.
Assay performance is based on optimized functionalization of the particles. The first step in the functionalization is the addition of a thiol-linked self-assembled monolayer (SAM) coating. As described in the following section, several alternative SAM coatings were evaluated for their ability to provide zeta potential enhancement and inhibit particle aggregation and adhesion. In all cases, the basic structure of the SAM coating and protein functionalization resembles that shown in Fig. 4. Each SAM molecule spontaneously bonds to the metal surface via a sulfur thiol linkage, and presents a carboxyl residue at its free end. This carboxyl terminus allows for the easy conjugation of proteins (e.g. antibodies) to the coated particles by means of Sulfo-NHS chemistry.
Figure 4. Structure of the self-assembled monolayer (SAM) and protein coating for the particles. Carboxyl-terminated SAM molecules bind to the metal surface via sulfur thiol bonds (a), and proteins such
as antibodies are covalently attached in order to provide the specific biochemical affinity (b).

–8–
The chosen SAM coating was 11-mercaptoundecanoic acid (MUA). A 5-plex biodetection assay panel was designed, consisting of 5 unique striping patterns or “flavors” of particles, with particles of different patterns functionalized with antibodies against Bacillus globigii (Bg) bacterial spores, MS2 bacteriophage virus, and ovalbumin protein, plus two controls. These three target antigens were chosen as surrogates for bacterial, viral, and protein (biotoxin) threats. The positive control particles were made by conjugating fluorescently labeled antibody directly to the particles, and the negative controls were made by conjugating nonfluorescent bovine serum albumin (BSA) protein to the particles. Once early results showed that the conjugation method was reliable, the positive control was generally omitted, as the bright glow from the positive control particles tended to complicate the readout for the other flavors.
The resulting 4-plex assay panel (shown in Table 2) was used to test the assay performance, and to evaluate several alternative sulfo-NHS based protocols, as well as several post-conjugation blocking treatments used to limit nonspecific binding reactions and thereby boost the assay’s signal-to-noise ratio. The assay steps were carried out within 1.5 ml Eppendorf-type centrifuge tubes, with benchtop agitators, centrifuges, and pipettors used to manually carry out the steps of the procedure. The results of the completed assays were read by imaging the particles and performing image analysis as described in Section 3 below.
Table 2. Particle “flavors” and functionalizations for the 4-plex biodetection assay.
As a result of this work, a 4-plex Nanobarcodes® based assay panel was shown to have high performance. The previous cytokine work had shown that the sensitivity of the Nanobarcodes® assay (the limit of detection) is similar to that for state of the art immunoassays, with low nanomolar or even picomolar sensitivity when optimized antibodies are used. Biodetection immunoassays are more often limited by the binding constants of the less perfect antibodies and the nonideal (i.e. particulate and inhomogenous) state of the antigen target, nonetheless the performance of the assay was quite high. Example results for one test series are given in Fig. 5, showing the fluorescent intensities of each flavor particle as a function of the concentration of samples containing Bg spores. There is minimal cross-talk between particle flavors, indicating little nonspecific binding. The signal-to-noise ratio is approximately 10.

–9–
Figure 5. Sample results from a series of 4-plex Nanobarcodes®-based assays showing highly specific and sensitive detection of Bg spores.
Once magnetic Nanobarcodes® particles became available (as described in section 2 below), the assay panel was re-implemented using the magnetic particles, with no change in performance.
2. Particle Manipulation and Control
One of the main motivations for the Nanobarcodes® format is the advantage it promises for particle manipulation and control. The functionalization of the metal surfaces permits good control over the surface properties, and the physical properties of the particles allow for easy separation and manipulation, particularly using electrical and magnetic fields. These issues are critical for implementing the assay in a high surface area microfluidic environment.
Initial studies were performed in order to predict the behavior of metallic nanorod particles under the influence of Brownian motion, and external electric fields. The output of a numerical model of the induced field around such a particle in an electric field is shown in Figure 6. Such induced fields lead to particle rotation and alignment with the external field lines. Experimental studies were also performed. The imposition of a DC electric field across a suspension of Nanobarcodes® particles causes some alignment of the particles, but the bulk electrophoretic migration of the particles is much more significant. If however an AC field is applied, with a frequency over approximately 100 Hz, there is no net movement of the particles and they align strongly along the field lines. Brownian motion, the random translational and rotational movement of very small particles, is seen to be an important contributor to Nanobarcode behavior, and is a limiting factor in the degree of uniformity that can be attained using different means of manipulation. Figure 7 shows the results of analytical prediction and experimental work showing the degree of particle alignment achieved using AC fields of different intensities.

–10–
Figure 6. Model results showing the induced field around a metallic Nanobarcode particle in an external electric field.
Figure 7. Theoretical and experimentally observed angular alignment of pure silver and half silver/half gold particles in AC fields of different magnitudes. The sharpness of the distribution indicates the degree of alignment with the electric field direction. Models were developed for particles in both high and low conductivity solutions (λD >> radius and λD << radius). Alignment is limited by the Brownian motion of
the particles (all data taken at room temperature).
A major experimental undertaking was the measurement of the electrokinetic properties of surface-functionalized metallic nanorod particles within aqueous suspension. Despite its relevance to nanoparticle science of many types, very little published data on this subject exists in the literature. The main property of concern is the zeta potential, or net charge on the surface of a particle immersed in liquid. This net charge not only determines the electrophoretic mobility of the particle within an external electric field, but is also a main determinant of particle aggregation and sticking to surfaces. Higher zeta potentials allow more effective manipulation with electric fields, and high zeta potentials of like sign serve to mutually repel particles and surfaces, preventing sedimentation and adhesion. Our results revealed the zeta potential behavior
–11–
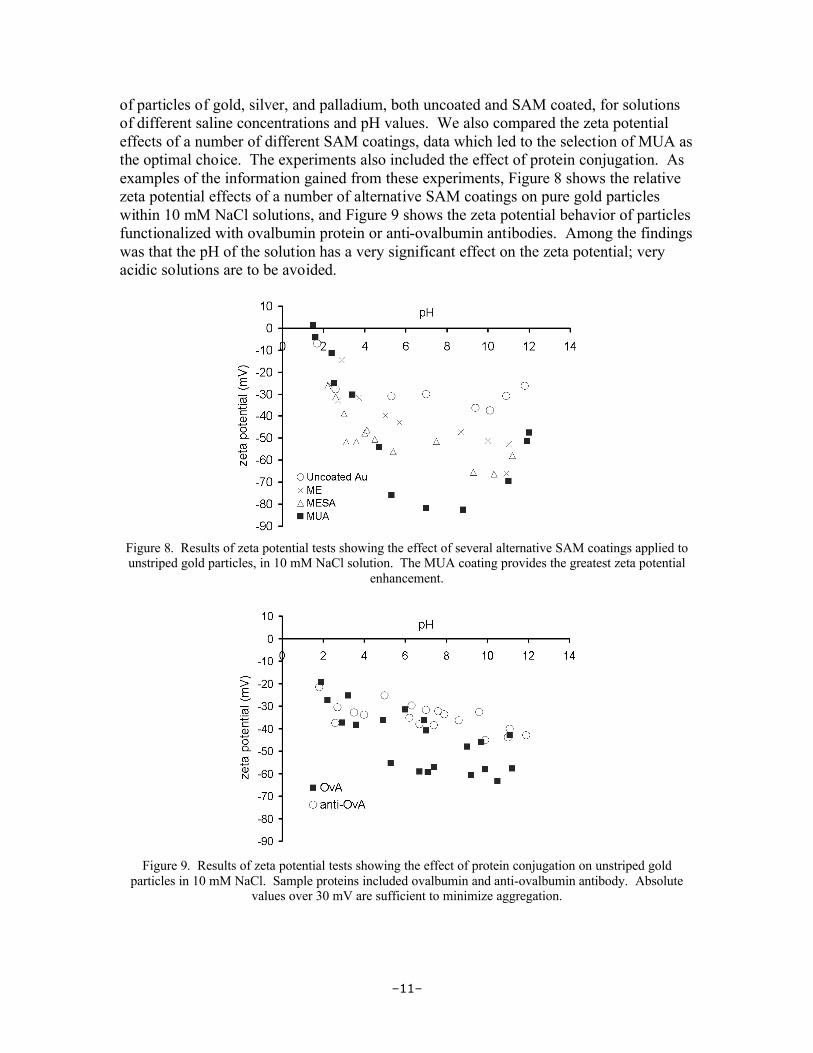
of particles of gold, silver, and palladium, both uncoated and SAM coated, for solutions of different saline concentrations and pH values. We also compared the zeta potential effects of a number of different SAM coatings, data which led to the selection of MUA as the optimal choice. The experiments also included the effect of protein conjugation. As examples of the information gained from these experiments, Figure 8 shows the relative zeta potential effects of a number of alternative SAM coatings on pure gold particles within 10 mM NaCl solutions, and Figure 9 shows the zeta potential behavior of particles functionalized with ovalbumin protein or anti-ovalbumin antibodies. Among the findings was that the pH of the solution has a very significant effect on the zeta potential; very acidic solutions are to be avoided.
Figure 8. Results of zeta potential tests showing the effect of several alternative SAM coatings applied to unstriped gold particles, in 10 mM NaCl solution. The MUA coating provides the greatest zeta potential
enhancement.
Figure 9. Results of zeta potential tests showing the effect of protein conjugation on unstriped gold particles in 10 mM NaCl. Sample proteins included ovalbumin and anti-ovalbumin antibody. Absolute
values over 30 mV are sufficient to minimize aggregation.

–12–
Flow tests were performed in order to confirm that the functionalized Nanobarcodes® particles would flow through microchannels of the intended materials without aggregation or sticking. Figure 10 is a captured image from a video of MUA-coated particles flowing in dispersed suspension through a PDMS silicone-on-glass microchannel. These tests raised confidence that properly coated particles would move without difficulty through the planned microfluidic system.
Figure 10. A video frame from tests of particle flow in microfluidic channels showing MUA-coated Nanobarcode particles flowing without aggregation through a PDMS-on-glass microchannel under pressure
driven flow.
In addition to the alignment within electric fields made possible by the zeta potential of conductive nanorod particles, the integration of magnetic material within the particles allows for manipulation within magnetic fields. In the case of Nanobarcodes®this is accomplished by inserting ferromagnetic nickel segments into the striping pattern. Nickel stripes were initially located at the center of the particles, and while this allowed for manipulation it also caused some particles to break in half. Later particles included nickel stripes at the particle ends. Subsequent work determined the magnetophoretic velocity of particles containing magnetic stripes of different length, as shown in Figure 11.
Figure 11. Magnetophoresis results showing the mobility of particles containing ferromagnetic nickel segments of different lengths. Practical segment length was limited by aggregation of the magnetic
particles containing nickel stripes over about 50 nm.

–13–
The results of the experiments summarized in this section revealed powerful ways of controlling the particles within automated assay devices. In each case they also revealed practical limitations to these mechanisms. In the case of electrical field alignment, strong AC fields led to strong particle alignment but eventually to particle aggregation, as the induced fields caused adjacent particles to gradually form “rafts” of particles aligned with the electric field. Similarly, if too much nickel was integrated into the particles, the magnetic dipoles would induce north-south alignment of adjacent particles, causing them to collect in pairs or groups. In the latter case it was determined that 50 nm was an optimal length for the Ni stripes.
3. Optical Readout
The optical readout method avoids the use of flow cytometers and other expensive components by using image processing of the images collected from a standard epifluorescent microscope, of the type found in many microbiology laboratories. Some additions, such as an autofocus stage and computer software control, were made in order to automate the image collection. A pair of images, such as shown in Figure 3 above, is taken of the same field of particles that have completed the assay process, one image in reflected blue light, and the other in fluorescence (in a wavelength corresponding to the emission of the reporter molecule). The reflectance image is analyzed to determine the “flavor” of each particle in the field of view, and the corresponding fluorescence image reveals how much antigen target is bound to each particle. By correlating the images, a data file is constructed showing the average relative intensity of each particle flavor.
The image capture was done using a Zeiss Axiovert S100 inverted epifluorescent microscope with some added components as mentioned. Best results were obtained using a 63x oil immersion objective lens. The automated processing of the acquired images was performed by the custom image processing software package NBSee™ developed by Nanoplex Technologies, Inc.
As a result of the early experiments in the optical readout of Nanobarcode particles, it became clear that a major limitation on the readout efficiency was the number of particles that touched or overlapped other particles upon random sedimentation into the viewing plane. The image processing system was usually unable to read such particles, and they were discarded from the data set. Based upon the knowledge gained in the particle manipulation investigations, it was possible to devise a simple enhancement to increase the readout effectiveness by aligning most of the particles in a single direction, reducing touches and overlaps. While this could be accomplished using AC electric field alignment, it was also possible to do this passively by relying upon thelarge negative zeta potential of the particles and the similar large negative zeta potential of glass. Patterns of parallel grooves were lithographically etched into the surface of the glass substrate; when particles sediment onto the grooved surface they move randomly due to Brownian motion, and if they remain unadhered due to mutual double layerrepulsion, eventually settle into the defined grooves. A number of groove patterns were tested and the optimal results were obtained with narrow grooves 500 nm across, with a
–14–
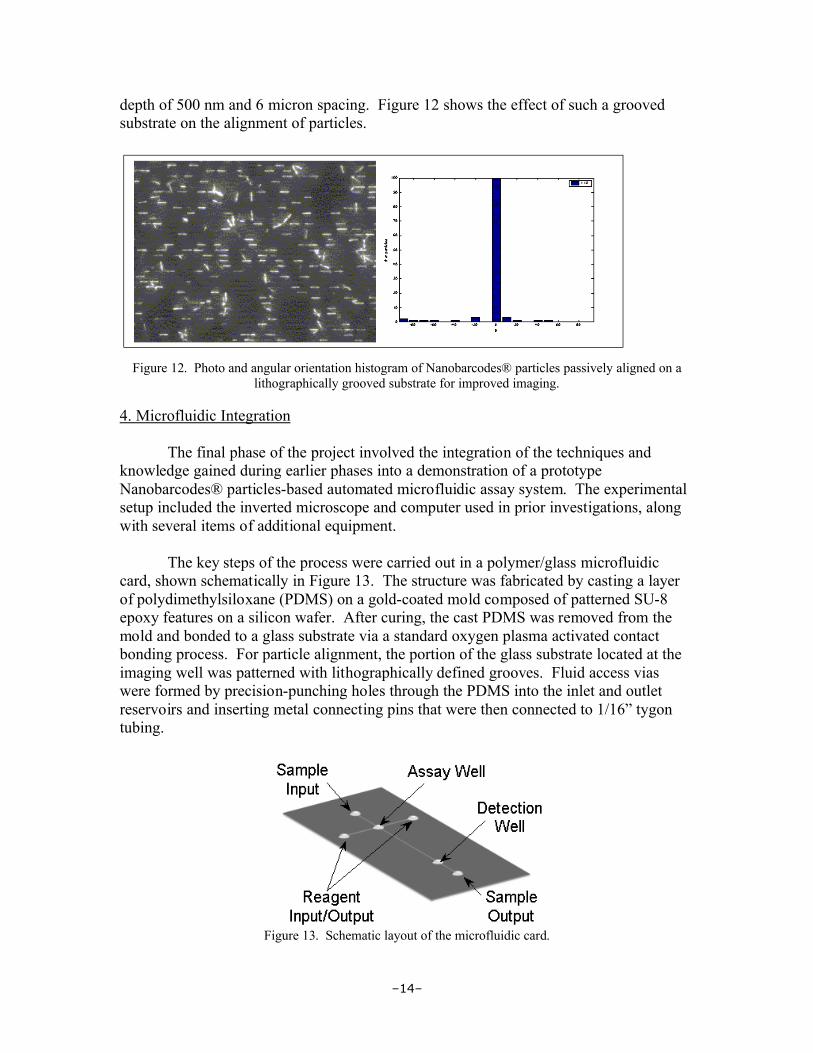
depth of 500 nm and 6 micron spacing. Figure 12 shows the effect of such a grooved substrate on the alignment of particles.
Figure 12. Photo and angular orientation histogram of Nanobarcodes® particles passively aligned on a lithographically grooved substrate for improved imaging.
4. Microfluidic Integration
The final phase of the project involved the integration of the techniques and knowledge gained during earlier phases into a demonstration of a prototype Nanobarcodes® particles-based automated microfluidic assay system. The experimental setup included the inverted microscope and computer used in prior investigations, along with several items of additional equipment.
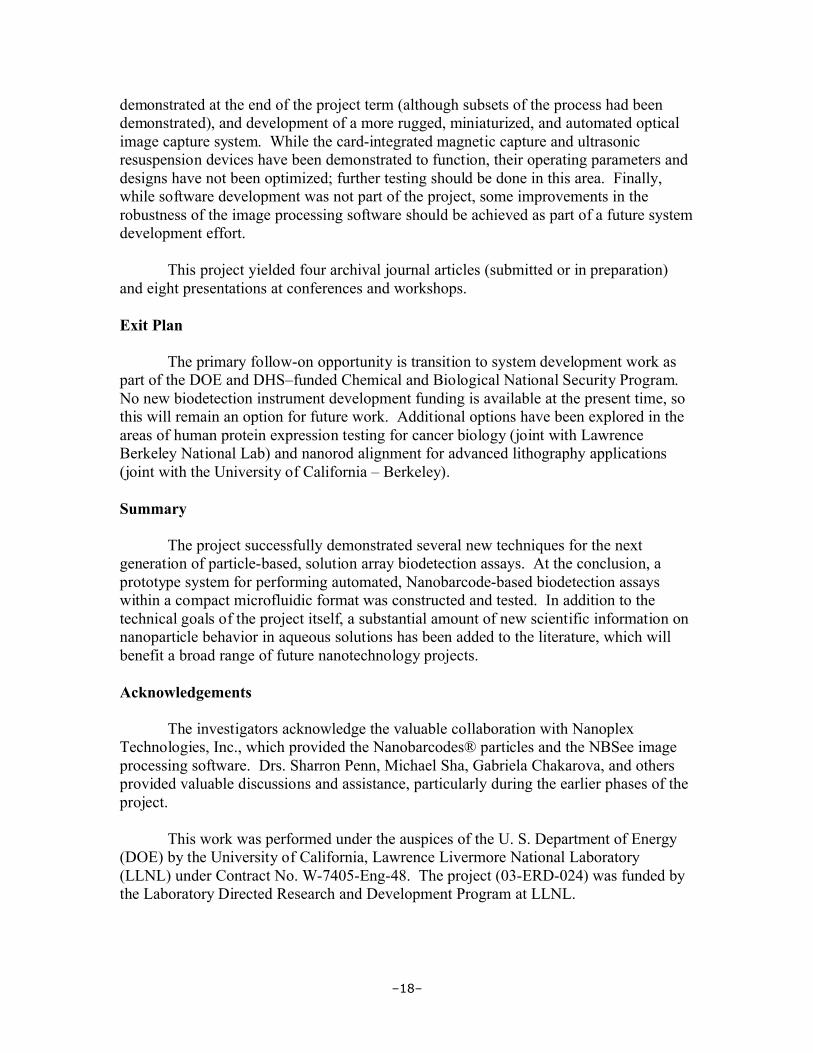
The key steps of the process were carried out in a polymer/glass microfluidic card, shown schematically in Figure 13. The structure was fabricated by casting a layer of polydimethylsiloxane (PDMS) on a gold-coated mold composed of patterned SU-8 epoxy features on a silicon wafer. After curing, the cast PDMS was removed from the mold and bonded to a glass substrate via a standard oxygen plasma activated contact bonding process. For particle alignment, the portion of the glass substrate located at the imaging well was patterned with lithographically defined grooves. Fluid access vias were formed by precision-punching holes through the PDMS into the inlet and outlet reservoirs and inserting metal connecting pins that were then connected to 1/16” tygon tubing.
Figure 13. Schematic layout of the microfluidic card.

–15–
A custom microscope stage was constructed to hold the microfluidic card. In addition, the stage included brackets to hold an electromagnet, interfacing with the assay (capture) well from beneath, and a miniature 40 kHz ultrasonicator converter-horn assembly, contacting the assay well from above. In order to better enhance and focus the magnetic field of the electromagnet within the small assay well, a custom-machined metallic focusing cone was bonded to the core of the electromagnet. The stage was designed so that the microscope objective could view the detection well while the other hardware interfaced with the assay well. An image of a microfluidic card in operating position is shown in Figure 14.
Figure 14. A completed microfluidic card in position within the custom microscope stage. The microscope objective is located beneath the detection well at left, while the ultrasonic horn (and electromagnet, underneath) interface with the assay well.
The microfluidic card is connected to an external fluidic control system (FlowPro, Global FIA). All the components were centrally controlled using scripts implemented using custom LabView-based instrument control software originally developed for the control of autonomous pathogen detection systems. During operation, the sample (including magnetic Nanobarcodes® particles) is introduced and flows through the assaywell, where the energized electromagnet captures the magnetic particles and retains them while the remainder of the sample is flushed from the well. Tests showed the capture electromagnet to be effective (Figure 15). Washes are accomplished by passing clean rinse buffer over the captured Nanobarcodes® particles, which are subsequently resuspended by a short (approximately 100 ms) burst of cavitating ultrasound from the ultrasonicator horn. After introduction of the reporter antibody, the particles are resuspended for a final time and transported to the imaging well for readout.

–16–
Figure 15. Results of optical measurements of particle capture near the magnet during flow through a PDMS-on-glass microchannel. The data in blue correspond to a magnet with integrated focusing cone, as used in the final system. The results show very dense and localized capture at the cone tip.
The microfluidic system described functioned well, and work was partially complete to transition the full multiplex assay protocol to the card format when the project funding was concluded. A computer-controlled protocol was written and tested for the magnetic extraction and readout of Nanobarcodes® particles embedded in explosives as a means of tagging the material for forensic attribution. In this application, a sample of explosive residue (Comp B, consisting of 63% RDX, 36% TNT, and 1% wax) with included Nanobarcodes® was withdrawn from an eppendorf tube and transferred into the capture well of the microfluidic card under the control of the automated fluidic system. The electromagnet extracted the particles and the capture well was rinsed with buffer. The ultrasonicator resuspended the captured particles, and they were automatically transferred to the imaging well. The Nanobarcode tag particles were imaged there, as shown in Figure 16. This test provided a qualitative test of the effectiveness of the system in a realistic application.
Figure 16. Nanobarcode particles from explosive residue, magnetically extracted and imaged using the microfluidic system.

–17–
An issue with misregistration between the reflectance and fluorescence image pairs was encountered with use of the custom stage and microfluidic card. This, and the conclusion of project funding, prevented the full demonstration of the multiplex bioassay in the microfluidic format, but the successful demonstration of the constituent components and functions, as well as a somewhat simpler protocol for the extraction and imaging of explosive tag particles, provide encouragement that the full bioassay implementation is achievable.
Results/Technical Outcome
The project objectives were to demonstrate several technologies for advancing the capabilities of automated multiplex solution-array biodetection assays. A novel automated system was demonstrated, using functionalized Nanobarcodes® particles as array elements. The technical achievements can be summarized as follows:
1. A multiplex biodetection assay was developed and implemented in the Nanobarcodes® format. The assay detected simulants for bacterial, viral, and protein toxin agents. This assay demonstrated performance similar to state of the art immunoassays implemented in more traditional formats, showing that the Nanobarcode format is highly viable for future systems with regard to assay sensitivity and specificity.
2. A number of new techniques were demonstrated for the non-contact manipulation and alignment of conductive rod-shaped particles in solution, including the use of DC and AC fields, and the integration of magnetic stripes allowing manipulation and capture by external magnetic fields. These techniques enable the efficient processing within compact microfluidic systems, and are applicable to other applications involving positional control of rod-shaped particles in solution.
3. A substantial database of new information regarding the electrokinetic properties of bio-functionalized metallic particles in aqueous solution was developed through experiment. These include measurements of zeta potential with variation of particle material, solution pH, ionic strength, and surface functionalization state, including the performance of alternative self-assembled monolayer (SAM) coatings and the effect of protein conjugation. This information is broadly useful to researchers developing nanoparticle technologies for biomedical and other applications.
4. The ability of Nanobarcodes® particles to enable improved sample processing techniques and simplified readout within compact fluidic systems was verified. By constructing and testing an automated microfluidic system for performing Nanobarcode based solution array tests, particle transport, trapping and extraction, and optical image readout using standard microscope optics were demonstrated. This also included a passive array alignment technique for minimizing particle touches and overlaps for optimal image analysis.
Areas that remain to be achieved in future work include the complete implementation of the assay sequence on the microfluidic card, as this had not been fully
–18–
demonstrated at the end of the project term (although subsets of the process had been demonstrated), and development of a more rugged, miniaturized, and automated optical image capture system. While the card-integrated magnetic capture and ultrasonic resuspension devices have been demonstrated to function, their operating parameters and designs have not been optimized; further testing should be done in this area. Finally, while software development was not part of the project, some improvements in the robustness of the image processing software should be achieved as part of a future system development effort.
This project yielded four archival journal articles (submitted or in preparation) and eight presentations at conferences and workshops.
Exit Plan
The primary follow-on opportunity is transition to system development work as part of the DOE and DHS–funded Chemical and Biological National Security Program. No new biodetection instrument development funding is available at the present time, so this will remain an option for future work. Additional options have been explored in the areas of human protein expression testing for cancer biology (joint with Lawrence Berkeley National Lab) and nanorod alignment for advanced lithography applications (joint with the University of California – Berkeley).
Summary
The project successfully demonstrated several new techniques for the next generation of particle-based, solution array biodetection assays. At the conclusion, a prototype system for performing automated, Nanobarcode-based biodetection assays within a compact microfluidic format was constructed and tested. In addition to thetechnical goals of the project itself, a substantial amount of new scientific information on nanoparticle behavior in aqueous solutions has been added to the literature, which will benefit a broad range of future nanotechnology projects.
Acknowledgements
The investigators acknowledge the valuable collaboration with Nanoplex Technologies, Inc., which provided the Nanobarcodes® particles and the NBSee image processing software. Drs. Sharron Penn, Michael Sha, Gabriela Chakarova, and others provided valuable discussions and assistance, particularly during the earlier phases of the project.
This work was performed under the auspices of the U. S. Department of Energy (DOE) by the University of California, Lawrence Livermore National Laboratory (LLNL) under Contract No. W-7405-Eng-48. The project (03-ERD-024) was funded by the Laboratory Directed Research and Development Program at LLNL.

–19–
References
1. Vitko, J. ed. Sensor Systems for Biological Agent Attacks: Protecting Buildings and Military Bases, National Research Council, National Academies Press, 2004.
2. Hindson, B. J., Makarewicz, A. J., Setlur, U. S., Henderer, B. D., McBride, M. T., and Dzenitis, J. M. “APDS: The Autonomous Pathogen Detection System,” Biosensors and Bioelectronics 20, 2005, 1925-1931.
3. Anderson, R. C., Bogdan, G. J., Barniv, Z., Dawes, T. D., Winkjer, J., and Roy, K. “Microfluidic Biochemical Analysis System,” in Proc. Intl. Conf. on Solid State Sensors and Actuators (Transducers ’97), IEEE, 1997, 477-480.
4. Yang, J. M., Bell, J., Huang, Y., Tirado, M., Thomas, D., Forster, A. H., Haigis, R. W., Swanson, P. D., Wallace, R. B., Martinsons, B., and Krihak, M. “An Integrated, Stacked Microlaboratory for Biological Agent Detection with DNA and Immunoassays,” Biosensors and Bioelectronics 17, 2002, 605-618.
5. Koh, C. G., Tan, W., Zhao, M., Ricco, A. J., and Fan, Z. H. “Integrating Polymerase Chain Reaction, Valving, and Electrophoresis in a Plastic Device for Bacterial Detection,” Anal. Chem. 75 (17) 2003, 4591-4598.
6. Lui, R. H., Yang, J., Lenigk, R., Bonanno, J., and Grodzinski, P. “Self-Contained, Fully Integrated Biochip for Sample Preparation, Polymerase Chain Reaction Amplification, and DNA Microarray Detection,” Anal. Chem. 76 (7) 2004, 1824-1831.
7. Colston, B., Visuri, S., Mcbride, M., Rao, R., Richards, J., Chuang, F., Chang, J., Carlson, J., and Derlet, R. “Microbead immunoassay dipstick system (MIDS),” Proc. 15th Annual Meeting of the IEEE Lasers and Electro-Optics Society, vol.1, 2002, 363-4.