Embed Size (px)
Citation preview

Microcomputed Tomography Imaging in a RatModel of Delayed Union/Non-Union Fracture
G.R. Dickson,1 C. Geddis,1 N. Fazzalari,2 D. Marsh,3 I. Parkinson2
1Tissue Engineering Research Team, Department of Trauma and Orthopaedic Surgery,Queen’s University Belfast, Stockman’s Lane, Belfast BT9 7JB, Northern Ireland
2Bone and Joint Research Laboratory, Division of Tissue Pathology, Institute of Medical and Veterinary Science and HansonInstitute, Adelaide, South Australia
3Department of Orthopaedic Surgery, University College London, Royal National Orthopaedic Hospital,Stanmore, United Kingdom
Received 4 June 2007; accepted 24 August 2007
Published online in Wiley InterScience (www.interscience.wiley.com). DOI 10.1002/jor.20540
ABSTRACT: We aimed to develop a clinically relevant delayed union/non-union fracture model toevaluate a cell therapy intervention repair strategy. Histology, three-dimensional (3D) micro-computed tomography (micro-CT) imaging and mechanical testing were utilized to develop ananalytical protocol for qualitative and quantitative assessment of fracture repair. An open femoraldiaphyseal osteotomy, combined with periosteal diathermy and endosteal excision, was held incompression by a four pin unilateral external fixator. Three delayed union/non-union fracturegroups established at 6weeks—(a) a control group, (b) a cell therapy group, and (c) a group receivingphosphate-buffered saline (PBS) injection alone—were examined subsequently at 8 and 14 weeks.Thehistological responsewas combinedfibrous and cartilaginousnon-unions in groupsAandBwithfibrous non-unions in group C. Mineralized callus volume/total volume percentage showed nostatistically significant differences between groups. Endosteal calcified tissue volume/endostealtissue volume, at the center of the fracture site, displayed statistically significant differencesbetween 8 and 14 weeks for cell and PBS intervention groups but not for the control group. Thepercentage load to failurewas significantly lower in the control and cell treatment groups than in thePBS alone group. High-resolution micro-CT imaging provides a powerful tool to augmentcharacterization of repair in delayed union/non-union fractures together with outcomes such ashistology and mechanical strength measurement. Accurate, nondestructive, 3D identificationof mineralization progression in repairing fractures is enabled in the presence or absence ofinterventionstrategies. �2007OrthopaedicResearchSociety.PublishedbyWileyPeriodicals, Inc. J
Orthop Res 26:729–736, 2008
Keywords: micro-CT; fracture repair; non-union; mineralized callus; histology
INTRODUCTION
Fracture non-union occurs clinically in up to 10%of tibial fractures,1–3 is higher for femoral frac-tures,4 and results in prolonged patient morbidity.Highly invasive costly surgical interventions arerequired.5 An alternative therapy to autologousgraft bone is delivery of osteogenic cells, of bonemarrow mesenchymal origin, to repair sites.5–8
Histological section analysis of fracture heal-ing9–11 does not allow longitudinal and transversedirectional approaches on the same specimen.
However, serial axial sectioning through repairsites, enabled by microcomputed tomography(micro-CT) images, yields quantitative validationof the progress of fracture repair, in a three-dimensional (3D) context.12 This provides signifi-cant improvement over a purely two-dimensional(2D) histological approach. Two-dimensional tomo-graphs, equivalent to histological sections, allowaccurate qualitative 3D reconstruction of bonemicroanatomy. Quantitative measurements ofcortical13 and cancellous bone14–17 can be derivedseparately as micro-CT image software providesthe ability to delineate specific tissue compart-ments as separate datasets. The nondestructiveimaging modality allows for subsequent histolog-ical processing and analysis while spatial registra-tion of micro-CT and histological images links 3Dmorphology with cellular events. This increases
JOURNAL OF ORTHOPAEDIC RESEARCH MAY 2008 729
G.R. Dickson and I. Parkinson contributed equally to thiswork.Correspondence to: Glenn Dickson (Telephone: 02890902858;
Fax: 02890661112; E-mail: [email protected])
� 2007 Orthopaedic Research Society. Published by Wiley Periodicals,Inc.

analytical power and reduces animal numbers asboth histology and mechanical testing can be doneafter micro-CT imaging. The objective was todevelop a clinically relevant model of delayedunion/non-union fracture in which cell therapyrepair strategies could be evaluated using com-binedhistologyandmicro-CT imaging to character-ize the qualitative and quantitative extent offracture repair. Our micro-CT investigation eval-uates a novel externally fixated compressionmodelcombined with periosteal diathermy and endostealstripping to produce a non-union, compared tostudies using osteotomy gap models with variableinterventions.12,18,19
MATERIALS AND METHODS
Experimental Delayed Union/NonunionFracture Model
Female Sprague–Dawley rats (n¼ 62, 16–18 weeks old)were housed singly and maintained on a 12-h light–dark cycle at 228C with ad libitum access to food andwater. Before surgery dextrose and Temgesic wereadministered subcutaneously (SC), for fluid mainte-nance and pain relief, together with 0.1 mL/kg ofantibiotic (Baytril). For anaesthesia isoflurane (4%),nitrous oxide (48%), and oxygen (48%) were adminis-tered via a gas chamber system, followed by an intra-peritoneal injection of hypnorm and midazolam.
A lateral incision through shaved skin and fascia latawas made from the right knee to the greater trochanterand the exposed femur, in the plane between the vasti andhamstrings, was cleared of muscle on its anterior surface.Five 1.2-mm diameter pinholes were drilled, four bicort-ical and a central unicortical hole. A custom-made drillingjig was used ensuring positioning of a transverse osteot-omy over the central drill hole (Fig. 1). Bicortical pinholeswere tapped and threaded stainless-steel pins, with brassnuts, were screwedmanually into the holes. A low-energymid-diaphyseal osteotomy was performed, under saline,using the central pinhole as a guide. After insertion of thefour fixator pins, the periosteum was circumferentiallydamaged by diathermy (Aaron Low–Tip TM OphthamicFine Tip, Advanced Meditech International) from thefracture to the innermost proximal and distal pins. Theendosteum was then sharply stripped using a needle. Aunilateral, single-plane, aluminium plate was appliedwith nuts secured above and below the plate, leavingthe central drill hole in the plate as the location site forfuture cell and vehicle delivery (Fig. 1). The 1-mm offsetdistance between the drilling jig and fixator bar dimen-sions enables accurate reduction that was confirmedvisually at the time of surgery and by postoperativeradiography. Themuscle, fascia lata, and skinwere closedwith vicryl absorbable sutures and animals left to recoverunder a heat lamp/heatmat postoperation. Temgesic jelly(1 mg/kg) was available for postoperative pain relief.
Experimental Groups
Animals (n¼ 62) were randomized into three delayedunion/non-union fracture groups at the 6-week timepoint for experimental investigation as (a) a non-unionfracture control group, n¼ 26; (b) a cell therapy group(receiving osteogenic cellsþPBS), n¼ 18; and (c) a PBSalone group, n¼ 18. The non-union fracture modelcontrol group had no intervention and represented thenatural history of non-union in the model, the celltherapy group had a 0.7-mm hole drilled at the fracturesiteþ littermate bone marrow–derived mesenchymalstromal cells (promoted in vitro along the osteogenicpathway, see cell preparation and delivery below)injected in phosphate-buffered saline (PBS) vehicle atthe original osteotomy site, and, finally, the no-cellsgroup had a 0.7-mm hole drilled at the non-unionfracture site and PBS vehicle delivered. Animals wereinvestigated subsequently at 8 weeks (2 weeks post-intervention) and 14 weeks (8 weeks postintervention)using micro CT imaging to obtain qualitative andquantitative information, histology for identification ofconnective tissue subtypes, and mechanical testing forbone strength. Samples were retrieved from animalsafter anaesthesia as above, followed by carbon dioxideasphyxiation and cervical dislocation. Experimentswere performed under U.K Home Office Project andPersonal license approval.
Cell Preparation and Delivery
Rat bone marrow cells were harvested aseptically byflushing from the tibiae and femora of littermates usinga 21-gauge needle and a MEM medium supplementedwith 20% serum, penicillin–streptomycin (1:100),amphotericin (1:100), ascorbic acid (1:1000), and dex-amethasone (1:106). Cell suspension was layered onLymphoprep to isolate the buffy coat before initialplating of cells at a density of 3� 105 cells/cm2. Cell
Figure 1. Schema of drilling jig (top), fixator bar dimensions(middle), and an excised femurwithfixator bar, pins, andnuts insitu (bottom).
730 DICKSON ET AL.
JOURNAL OF ORTHOPAEDIC RESEARCH MAY 2008

preparations were left for 7 days to allow adherence ofmesenchymal cells, then fed twice weekly and passagedon confluence after which cell growth was controlled byadjustment of serum concentration to enable reimplan-tation at the 6-week time point, when the delayed union/non-union fractures were established. The implantedcells were assayed by immunocytochemistry to confirmexpression of osteogenic markers, including alkalinephosphatase and osteocalcin (manuscript in prepara-tion). Animals from the cell therapy and no cells PBStreated groups were anesthetized as above together withsubcutaneous administration of antibiotics, analgesia,and a fluid bolus. Using aseptic procedures prior to andincluding subsequent cell and PBS vehicle delivery, asharp needle was inserted through the central drill holein the plate (Fig. 1) to pierce the skin in order to align theneedle with the original osteotomy site. This markedthe target site for cell and PBS delivery. Radiographywas used to confirm correct needle positioning and a0.7-mm bicortical drill hole was made through thedelayed union/non-union fracture site, with the aid ofa drill guide aligned with the central pin hole in theplate. The drill was removed leaving the drill guide inplace to enable delivery from a preloaded syringe of1� 106 culture expanded cells in PBS or PBS alone intothe drilled implantation site. Operation site closure andmanagement of animal recovery were as above withaccurate reduction being confirmed by radiography atthe time of surgery and postoperatively.
Micro-CT Imaging
For micro-CT imaging (n¼ 29; control group, n¼ 8; celltherapy group, n¼ 11; and PBS alone group, n¼ 10),washed formalin fixed femora, stored in 70% ethanol,had the external fixator and soft tissue removed.Imaging was done at a 10-mm spatial resolution usinga Skyscan 1072 (Skyscan Ltd, Antwerp, Belgium).Scanner settings were: voltage¼ 80 kV, current¼120 mA, frame averaging¼ 4, and rotation ¼ 0.98.Samples were rotated about the X-ray source at 0.98intervals, to yield 206 back-projection images overaround 1808 of total rotation. From these images, cone-beam reconstruction software yielded up to 1,000 tomo-graphs, in the axial plane, for each sample. A volume ofinterest (VOI), which included the fracture site andassociated callus tissue, was delineated using CTAnsoftware (Skyscan Ltd, Belgium), to enable quantitativeanalysis to be performed. The VOI was selected from thetomographs of micro-CT data sets 1.5 mm distal tothe lower margin of the upper screw hole and 1.5 mmproximal to the lower screw hole. Using a custom-written routine in Matlab (MathWorks Ltd) a binaryimage, discriminating bone from marrow in each tomo-graph, was obtained using Otsu’s method which allowsfor automatic selection and thresholding of pixel valuesto ‘‘foreground’’ and ‘‘background.’’ 20 This was followed bya binary closing to remove small unconnected artifacts.
The volume of calcified tissue in the callus, expressedasmineralized callus volume per tissue volume percentage
(MCV/TV), was measured from the binarized VOI of eachsample. The calcified tissue in each sample includedoriginal bone, new bone, and calcified cartilage. Frombinarized tomographs at the center of the fracture site,endosteal calcified tissue volume per tissue volume wasmeasured. Three-dimensional visualizationwas performedusing combined CTAn and Paraview (Kitware Inc.)software. Sample surface rendering was performed usinga marching cubes algorithm implemented in CTAn andvisualized using Paraview software.
Histology
After micro-CT scanning, these samples (n¼ 29) weredemineralized in 9% nitric acid: 1% EDTA for 24 h,washed, and the end point of mineralization checked byX-ray evaluation. Samples were processed through anascending series of ethanols, cleared in xylene, andembedded whole in paraffin wax. Sagittal sections, 7 mmthick, were prepared and stained using hematoxylin–eosin and Alcian Blue.
Mechanical Testing
Distinct from the histological and micro-CT studiesmechanical testing (n¼ 33) was performed in threegroups of rats: (a) non-union control group, n¼ 18; (b)cell therapy group, n¼ 7; and (c) PBS alone group, n¼ 8.The percentage load to failure relative to the contrala-teral femur was determined by four-point bending21
using an Instron testing machine with a 100 kN load celland a displacement rate of 5 mm/s.
Statistical Analysis
The distribution of some parameters were not normallydistributed, therefore for uniformity nonparametricanalysis of variance with the post hoc Kruskal–Wallistest was performed to test for differences betweengroups and differences between time points. Statisticalsignificance was set at p< 0.05.
RESULTS
Qualitative Histology and Micro-CT
All samples except one in the control groupdisplayed either fibrous or combined fibrous andcartilaginous non-unions. Because the histologicaland micro-CT observations of non-unions are wellillustrated for other experimental groups reportedbelow, we show here an example of the oneatypical spontaneously healed fracture observedat the 14 week time point (8 weeks postinterven-tion) in this group (Fig. 2). Histology (Fig. 2a)displays significant bony bridging while micro-CT(Fig. 2b,c) reveal this across the medullary cavityand cortex. Tomographs (Fig. 2b) from threeorthogonal views help show the extent of healingby displaying the mineralized component and the
MICRO-CT IMAGING OF DELAYED UNION/NON-UNION FRACTURES 731
JOURNAL OF ORTHOPAEDIC RESEARCH MAY 2008
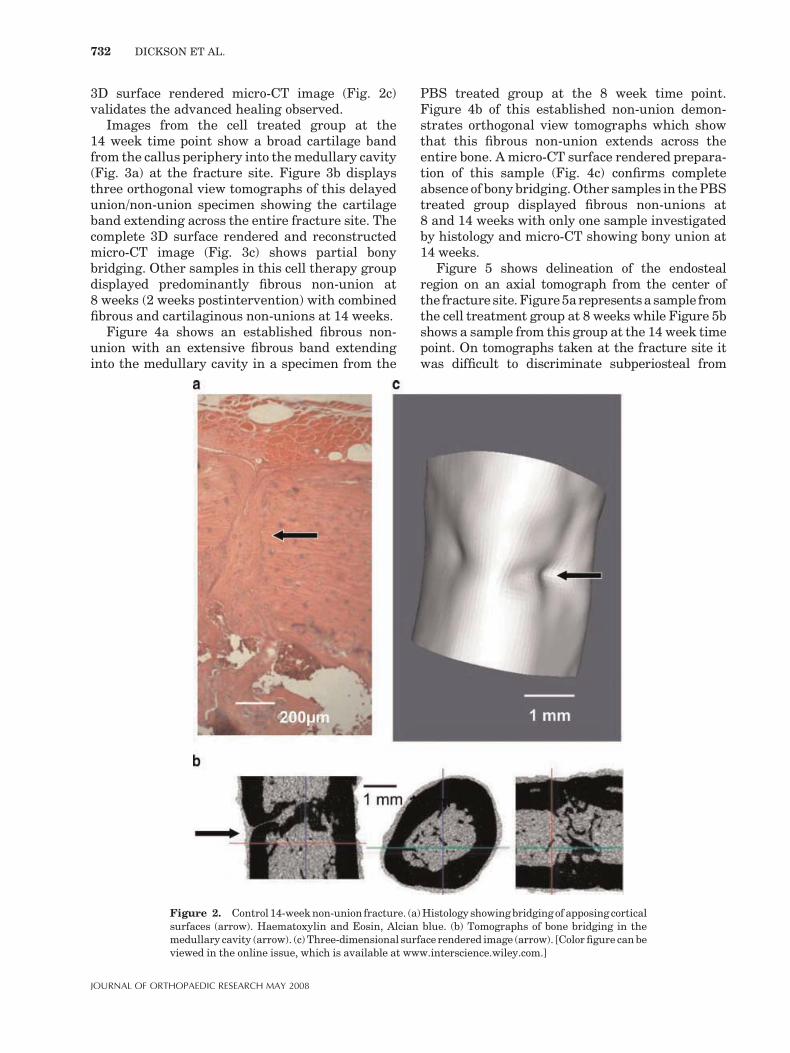
3D surface rendered micro-CT image (Fig. 2c)validates the advanced healing observed.
Images from the cell treated group at the14 week time point show a broad cartilage bandfrom the callus periphery into themedullary cavity(Fig. 3a) at the fracture site. Figure 3b displaysthree orthogonal view tomographs of this delayedunion/non-union specimen showing the cartilageband extending across the entire fracture site. Thecomplete 3D surface rendered and reconstructedmicro-CT image (Fig. 3c) shows partial bonybridging. Other samples in this cell therapy groupdisplayed predominantly fibrous non-union at8 weeks (2 weeks postintervention) with combinedfibrous and cartilaginous non-unions at 14 weeks.
Figure 4a shows an established fibrous non-union with an extensive fibrous band extendinginto the medullary cavity in a specimen from the
PBS treated group at the 8 week time point.Figure 4b of this established non-union demon-strates orthogonal view tomographs which showthat this fibrous non-union extends across theentire bone. A micro-CT surface rendered prepara-tion of this sample (Fig. 4c) confirms completeabsence of bony bridging.Other samples in thePBStreated group displayed fibrous non-unions at8 and 14 weeks with only one sample investigatedby histology and micro-CT showing bony union at14 weeks.
Figure 5 shows delineation of the endostealregion on an axial tomograph from the center ofthe fracture site.Figure5arepresentsa sample fromthe cell treatment group at 8 weeks while Figure 5bshows a sample from this group at the 14 week timepoint. On tomographs taken at the fracture site itwas difficult to discriminate subperiosteal from
Figure 2. Control 14-weeknon-union fracture. (a)Histology showingbridgingof apposing corticalsurfaces (arrow). Haematoxylin and Eosin, Alcian blue. (b) Tomographs of bone bridging in themedullary cavity (arrow). (c) Three-dimensional surface rendered image (arrow). [Colorfigure canbeviewed in the online issue, which is available at www.interscience.wiley.com.]
732 DICKSON ET AL.
JOURNAL OF ORTHOPAEDIC RESEARCH MAY 2008

cortical and medullary elements particularly at theearlier 8 week time point (Fig. 5a). However, at14 weeks there was more calcified tissue at thefracture site and this enabled ready discriminationof medullary elements (Fig. 5b).
Quantitative Micro-CT
The overall mineralized callus volume/total volume(MCV/TV) in the entire volume of interest for thecontrol non-union group was 64.51%�SD 7.32, forthe cell therapy group (drillþ cells) 63.06%� 7.28,and for the no cells group (drillþPBS) was54.80%� 13.49. There were no statistically signifi-cant differences between groups. The percentage ofendosteal calcified tissue volume per tissue volumeat the center of the fracture site wasmeasured for allsamples (Fig. 6). There were statistically significantdifferences between 8 weeks and 14 weeks for thecell (25.4� 7.2 vs. 41.9� 14.0, respectively; p¼ 0.03)and PBS intervention groups (20.0� 20.6 vs.41.4� 18.9, respectively; p¼ 0.05), but no significant
difference was detected for the no interventiongroups (33.6� 27.5 and 40.49� 17.1, respectively).
Mechanical Testing
The load to failure was 81.72�SD 57.94 N for thecontrol group, 100.34� 43.74 N for the cell therapygroup, and 134.05� 45.85 N for the no cells group.The nonintervention control group was signifi-cantly lower than the PBS alone group (p¼ 0.034).The percentage load to failure relative to theunfractured contralateral limb was 40.65%�30.22 (control group), 49.60%� 22.47 (cell therapygroup), and 65.39%� 21.90 (PBS alone group). Thenonintervention control and cell treatment groupswere significantly lower than the PBS alone group(p¼ 0.025 and p¼ 0.049, respectively).
DISCUSSION
The objective of creating a clinically relevantmodel of delayed union/non-union fracture repair
Figure 3. Cell treated group (14 weeks). (a) Cartilage band (arrow) extending to the medullarycavity. Haematoxylin and Eosin, Alcian blue. (b) Tomographs of cartilaginous non-union/delayedunion (arrow). (c) Three-dimensional rendered image (arrow) with partial bony bridging (doublearrows). [Color figure can be viewed in the online issue, which is available at www.interscience.wiley.com.]
MICRO-CT IMAGING OF DELAYED UNION/NON-UNION FRACTURES 733
JOURNAL OF ORTHOPAEDIC RESEARCH MAY 2008

has been achieved and outcomes assessed usingcombined histology and micro-CT together withmechanical strength testing. The model was setup, in part, to parallel our pilot clinical inves-tigation on the usefulness of autologous celltherapy for the management of non-union frac-tures.5 Our study demonstrates variationsbetween and within groups concerning the char-acter of callus tissue subtypes and the extent of
bony bridging. While most samples exhibitedeither fibrous or combined fibrous and cartilagi-nous non-unions/delayed unions, the occasionalspecimen displayed advanced repair (detectedonce in the control group). This finding is consis-tent with a previous study of induced non-unionfracture in the rat femur, where there was also a17% incidence of spontaneous union.18
Spontaneous repair occurs in clinical practiceand extending the time period of the experimentmight have resulted in more samples exhibitingthis. A significant advantage of applying high-resolution micro-CT imaging is that it enablesthe mineralized bone phase of the repairingfracture to be investigated in 3D22 nondestruc-tively. Mineralized callus volume can be quantifiedand micro-CT surface rendering of the mineralcomponent is useful when investigating bonybridging across the fracture site. This key eventimpacts upon mechanical stability of the bonehealing environment. Subsequent histology ofthe same specimens facilitates correlation withmicro-CT findings and this two-stage approach isalso adaptable for subsequent biomechanicaltesting.
Figure 4. PBStreatedgroup (8weeks). (a)Histological section showingafibrous tissuebandfillingthe fracture site (arrow). Haematoxylin and Eosin, Alcian blue. (b) Tomographs of the fibrous non-union (arrow). (c) Three-dimensional surface rendering of thenon-union (arrow). [Color figure canbeviewed in the online issue, which is available at www.interscience.wiley.com.]
Figure 5. Mid-fracture site tomographs of the cell therapygroup with delineated endosteal compartment (white line): (a)8 weeks and (b) 14 weeks.
734 DICKSON ET AL.
JOURNAL OF ORTHOPAEDIC RESEARCH MAY 2008

Because histology and functional mechanicaltestingboth involvedestructiveprocesses, thepriorapplication of 3D micro-CT analysis enables sub-stantial additional qualitative and quantitativedata to be derived. Micro-CT images demonstratethat regions remote from the site of individualhistological sections can be markedly different inappearance to those seen in those histologicalsections. Tomographs can be visualized rapidlyand noninvasively compared to those observedin either a specific histological section or multi-ple sections. On treatment of rat non-union frac-tures with allograft, littermate marrow–derivedmesenchymal cells we found that the magnitude ofthe bone response and mechanical strength ofhealing bones was equivalent to rats that had nocellular intervention. This implies that variabletissue remodeling rates are involved and thatintervention procedures, including cell injection,initially set back the bone healing repair clock.Endosteal calcified tissue volume showed catch upbetween 8 and 14 weeks for intervention groupsbut significant differences were not evident inthe nonintervention groups. Cell treated delayedunion/non-union fractures manifested cartilagi-nous callus at the fracture site in contrast to PBStreatment alone, which had fibrous non-unions inall but one sample. That sample exhibited partialbony bridging. While the MCV/TV% of drilled/PBSinjected non-unions was lower, though not signifi-cantly so, than in other groups, paradoxically theirmechanical strength was significantly greater.
In contrast to the current cell alone approach, itwould have been interesting to examine theinfluence of cell treatment in the presence of aninjectable support substrate23 which might haveprovided the cells with an environmental substrataon which to better express their osteogenic poten-tial.23,24
A longitudinal study of patients receivingimplants seeded with culture expanded autologousbone marrow mesenchymal stem cells8 utilizedconventional and computed radiography to dem-onstrate the durability of bone regeneration.Interestingly, a recent investigation evaluatingthe number and proliferative capacity of humanmesenchymal stem cells (MSCs,) using the colonyforming unit fibroblast (CFU-F) assay, demon-strated significant positive modulation of osteo-genic capacity in multiple trauma patients butsignificant negative modulation in atrophic non-unions.25 This demonstrates the importance ofdeveloping a clinically relevant non-union fracturemodel in which cell therapy interventions can beexplored, in combination with 3D micro-CT imag-ing and histological outcomes.
State-of-the-art high-resolution micro-CT imag-ingenablesaccurate identificationof themineralizationstatus in fracture callus during repair. Specificallyit provides a powerful tool to augment histologicalexamination in characterizing the repair of non-union fractures, either those which fail to heal,resolve spontaneously, or heal in response tointervention strategies.
Figure 6. Bar graph showing endosteal calcified tissue volume to tissue volume (%) for the threeexperimental groupsat each timepoint. *Signifies statistically significantdifference to8weekgroup.
MICRO-CT IMAGING OF DELAYED UNION/NON-UNION FRACTURES 735
JOURNAL OF ORTHOPAEDIC RESEARCH MAY 2008
ACKNOWLEDGMENTS
This study was kindly supported by funding from TheDraper’s Company, London & Action Medical Research,U.K, to G. Dickson and by Fellowship support from theAustralian Academy of Sciences to I. Parkinson.
REFERENCES
1. Einhorn TA. 1995. Enhancement of fracture-healing.J Bone Joint Surg [Am] 77:940–956.
2. Patel M, McCarthy J, Herzenberg J. 2004. Tibial non-unions. In: Mehlman CT, editor. WebMD (www.emedicine.com/orthoped/topic569htm) sections 1–11.
3. Praemer A, Furner S, Rice DP. 1999. Musculoskeletalconditions in the United States, 2nd revised ed. pp 1–182.American Academy of Orthopaedic Surgeons.
4. Toh EM, Sahni V, Acharya A, et al. 2004. Management ofintracapsular femoral neck fractures in the elderly; isit time to rethink our strategy? Injury 35:125–129.
5. Dickson GR, Buchanan F, Marsh DR, et al. 2007.Orthopaedic tissue engineering and bone regeneration.Tech Health Care 15:57–67.
6. Bruder SP, Fink DJ, Caplan AI. 1994. Mesenchymal stemcells in bone development, bone repair, and skeletalregeneration therapy. J Cell Biochem 56:283–294.
7. Connolly JF, Guse R, Tiedeman J, et al. 1989. Autologousmarrow injection for delayed unions of the tibia: apreliminary report. J Orthop Trauma 3:276–282.
8. Marcacci M, Kon E, Moukhachev V, et al. 2007. Stem cellsassociated with macroporous bioceramics for long bonerepair: 6- to 7- year outcome of a pilot clinical study. TissueEng 13:947–955.
9. Connolly CK, Li G, Bunn JR, et al. 2003. A reliableexternally fixated murine femoral fracture model thataccounts for variation in movement between animals.J Orthop Res 21:843–849.
10. Gerstenfeld LC, Wronski TJ, Hollinger JO, et al. 2005.Application of histomorphometric methods to the study ofbone repair. J Bone Miner Res 20:1715–1722.
11. Sevitt S. 1981. Bone repair and fracture healing in man.Edinburgh: Churchill Livingstone.
12. Gabet Y, Muller R, Regev E, et al. 2004. Osteogenic growthpeptide modulates fracture callus structural and mechan-ical properties. Bone 35:65–73.
13. Levenston ME, Beaupre GS, van der Meulen MCH. 1994.Improved method for analysis of whole body torsion tests.J Bone Miner Res 9:1459–1465.
14. Hahn M, Vogel M, Popesius-Kempa M, et al. 1992.Trabecular bone pattern factor: a new parameter forsimple quantification of bone microarchitecture. Bone 13:327–330.
15. Hildebrand T, Ruegsegger P. 1997. A new method for themodel-independent assessment of thickness in three-dimensional images. J Microsc 185:67–75.
16. Hildebrand T, Ruegsegger P. 1997. Quantification of bonemicroarchitecture with the structuremodel index. CMBBE1:15–23.
17. Odgaard A, Gundersen HJ. 1993. Quantification ofconnectivity in cancellous bone, with special emphasis on3-D reconstructions. Bone 14:173–182.
18. Schmidhammer R, Zandieh S, Mittermayr R, et al. 2006.Assessment of bone union/nonunion in an experimentalmodel using microcomputed tomography. J Trauma 61:199–205.
19. Ibiwoye MO, Powell KA, Grabiner MD, et al. 2004. bonemass is preserved in a critical-sized osteotomy by low energypulsed electromagnetic fields as quantitated by in vivomicro-computed tomography. J Orthop Res 22:1086–1093.
20. Otsu N. 1979. A threshold selection method from gray-level histograms. IEEE Trans Sys Manage Cyber 9:62–66.
21. Little DG, Cornell MS, Hile MS, et al. 2001. Effect ofpamidronate on distraction osteogenesis and fixator-related osteoporosis. Injury 32:14–20.
22. Jones AC, Milthorpe B, Averdunk H, et al. 2004. Analysisof 3D bone ingrowth into polymer scaffolds via micro-computed tomography imaging. Biomaterials 25:4947–4954.
23. Shi X, Hudson JL, Spicer PP, et al. 2006. Injectablenanocomposites of single-walled carbon nanotubes andbiodegradable polymers for bone tissue engineering. Bio-macromolecules 7:2237–2242.
24. Ruhe PQ, Hedberg-Dirk EL, Padron NT, et al. 2006.Porous poly(DL-lactic-co-glycolic acid)/calcium phosphatecement composite for reconstruction of bone defects. TissueEng 12:789–800.
25. Seebach C, Henrich D, Tewksbury R, et al. 2007. Numberand proliferative capacity of human mesenchymal stemcells are modulated positively in multiple trauma patientsand negatively in atrophic nonunions. Calcif Tiss Int80:294–300.
736 DICKSON ET AL.
JOURNAL OF ORTHOPAEDIC RESEARCH MAY 2008