Embed Size (px)
Citation preview
Submitted: April 28, 2010
SD-May1014 Team Members: Michael Peat Kollin Moore Matt Rich Alex Reifert Advisors: Dr. Nicola Elia Dr. Phillip Jones
MicroCART-Phase 5 Final Report The goal of this project is to create a Vertical Take-off and Landing Unmanned Aerial Vehicle (VTOL UAV) which, at a minimum, can take off, hover, and land autonomously. We will be basing our design off of a purchasable, electrically powered, indoor use base platform which can handle all necessary flight mechanics for the system. The system will then incorporate a variety of sensors, definitely including a position tracking system and probably also including an inertial measurement unit, to provide the necessary stabilization during flight. The system will also use wireless communication channels to provide information to a ground station, which may or may not do the required processing.
i | P a g e
Table of Contents
Section Page
Table of Contents ........................................................................................................................................... i
List of Tables and Figures .............................................................................................................................. ii
I. Executive Summary .......................................................................................................................... 1
II. Problem/Mission Statement ............................................................................................................ 2
III. Solution/Procedure Statement ........................................................................................................ 2
IV. Operating Environment ................................................................................................................... 2
V. Intended use and users .................................................................................................................... 3
VI. Assumptions and Limitations ........................................................................................................... 3
VII. End Product ...................................................................................................................................... 3
VIII. Deliverables ..................................................................................................................................... 4
IX. Approach Used ................................................................................................................................. 4
X. Detailed Design .............................................................................................................................. 10
XI. Estimated Resource Requirements ................................................................................................ 18
XII. Project Schedule ............................................................................................................................ 19
XIII. Project Team Information .............................................................................................................. 20
XIV. Closing Summary............................................................................................................................ 21
Appendix 1: Cwiid Library Download Location ........................................................................................... 22
Appendix 2: Our Source Code ..................................................................................................................... 22
Appendix 3: XBOX Flight Control mapping ................................................................................................. 54
Appendix 4: Current Header Files ............................................................................................................... 55
Appendix 5: Current Matlab Scripts for Data Analysis ................................................................................ 62
Appendix 6: Matlab Analysis Script Documentation .................................................................................. 99
Appendix 7: Old Matlab Data Analysis Script............................................................................................ 100

ii | P a g e
List of Tables and Figures
Name Page
Table 1. Personal Effort Requirements ...................................................................................................... 18
Table 2. Financial Requirements ................................................................................................................ 18
Figure 1: Top-level system breakdown ....................................................................................................... 10
Figure 2: Overall System Design.................................................................................................................. 10
Figure 3: Sensor System Breakdown ........................................................................................................... 11
Figure 4: Sensor Power System Breakdown ............................................................................................... 12
Figure 5. Unused Voltage divider circuit .................................................................................................... 13
Figure 6: Buck Converter Schematic ........................................................................................................... 13
Figure 7: Communication System Design Breakdown ................................................................................ 14
Figure 8: Breakdown of the Software Subsystem ....................................................................................... 15
Figure 9. Project Schedule .......................................................................................................................... 19

iii | P a g e
List of Definitions
autonomous: controlled by non-human input, i.e. by a computer program.
ground station: most likely a wirelessly-enabled computer or network of devices which will send
the robot commands, such as take-off, hover, fly to waypoint A, and land.
inertial measurement unit (IMU): sensor device which uses internal gyroscopes and
accelerometers to measure acceleration, velocity, and orientation in several different axes.
indoor positioning system (IPS): sensor system which is capable of calculating the x-, y-, and z-
axis coordinates of the user by using wireless signals within a building.
latency: time delay in a system, a.k.a. lag.

1 | P a g e
I. Executive Summary
Our product is a small electrically powered autonomous coaxial helicopter capable of
maintaining a stable hover within a predefined flight area. It has onboard sensors which
provide all necessary information for such flight. The sensor data is transmitted wirelessly to
a computer ground station for overall flight instruction and control. These instructions are
transmitted via an FPGA and an FM transmitter back to the helicopter. All necessary power
for all onboard components is provided by the helicopter battery through a power
conversion circuit. Our approach was a new direction from the previous course of this
project, and is the first time any stable flight has been attained.
Our sensor system consists of the sensors found on a Nintendo Wii-mote, i.e. a three axis
accelerometer and 1024x768 pixel infrared camera. We were limited to this sensor system
by severe budget constraints. Of course the quality of these sensors with respect to our
purposes has limited the overall effectiveness of our control system. One advantage to this
system however, besides very low cost, is that it already includes an onboard Bluetooth chip
for wireless communication of data to the computer ground station.
Our onboard power distribution system includes a DC/DC buck converter circuit we
manufactured using general circuit elements and a high frequency switching chip. It allows
the helicopter battery to power both the motors and our sensor system at the same time by
providing power at the appropriate voltage level for each.
Our next subsystem is the interface from our computer control system to the FM
transmitter. It consists of an FPGA converting commands from our controllers written in C to
the analog voltages required by the FM transmitter taken from a helicopter manual
controller, and a power connection for this transmitter from a bench top supply.
Next is the ground control station itself. This is a laptop PC running a Linux operating system
with C programs either written by or altered by our team to be capable of receiving sensor
data transmitted via Bluetooth, processing this data through multiple controllers, and
sending the resulting commands through the previous system back to the helicopter. It is
also capable of receiving manual control inputs from a modified Xbox controller for manual
flight testing and logging both input and sensor data.
Finally, our platform itself is a Colco Air-Wolf a fairly low cost commercially available, four
channel dual concentric RC helicopter. It comes with an on board controller capable of
taking received commands and properly transmitting them to the onboard actuators for
adjusting yaw, pitch, roll, and throttle.
This project has spanned from August 2009 to April 2010.

2 | P a g e
II. Problem/Mission Statement
To create a small electrically powered autonomous flying vehicle capable of takeoff and
landing from horizontal surfaces as well as stable indoor hover without human assistance.
Ideally this should include onboard sensors for orientation and acceleration along all three
rotational axes as well as altitude and overall position relative to known reference points.
III. Solution/Procedure Statement
In order to achieve our goal, we researched platforms fitting the above outlined description,
attempted to maximize payload capabilities in order to allow for the desired on board
electronics to be carried in stable flight. To help with this we also researched the most light
weight sensors available to us and when necessary cut out any that we did not absolutely
need for basic takeoff, hover, and landing.
Once a platform is firmly established and tested for capabilities we attempted to either find
or create mathematical/computer simulation models for it in order to aid us in the process
of designing our control system.
We also attempted to establish effective and reliable Wi-Fi communication with a computer
ground station for overall flight instructions.
IV. Operating Environment
The operating environment for our system will be climate controlled university buildings
without any obstacles (dynamic or otherwise) in the intended flight path. The vehicle shall
have enough room to takeoff, hover, and land without any probable danger of collision with
its surroundings.
The position tracking system will use Bluetooth to communicate from platform to ground
station with an approximate maximum range of 30ft. However the IR camera will be limited
to operating within approximately 4 to 16 ft. of the IR reference sources as well as being
limited by the focal cone of the camera. The accelerometer (IMU) has no range
considerations of its own, although it as all the sensors is limited by the communication
range of the Bluetooth transmission.
Hazards in this environment included the possibility of serious loss of control and a collision
with walls and/or other obstacles resulting in damage to the vehicle, as well as the
possibility of accidental human interference from an unknowing intruder into our flight
space. Both of these hazards occurred multiple times during the course of testing the
project.

3 | P a g e
V. Intended use and users
The intended end use of our system is continued research and development into the area of
autonomous flight systems, and the intended users are knowledgeable engineering students
and/or professors.
VI. Assumptions and Limitations
We will be operating under the following assumptions and limitations:
1. Our system will only be operated in the environment defined in this project plan.
See Operating Environment for more information.
a. Our vehicle will not have to deal with any obstacles dynamic or otherwise
b. Our vehicle will not be subject to any weather conditions
2. Basic flight mechanics will be taken care of by the base platform and we will not
have to do any sort of design or modification in order to achieve mechanical flight
capabilities.
3. Our vehicle will be able to communicate data to and receive instructions from a
computer ground station
a. The ground station will handle overall flight instructions such as takeoff, landing,
and possible waypoint movement.
b. The ground station will not be responsible for fast flight stability adjustments.
4. Our vehicle should have sufficient payload capability to carry the required sensor
and control equipment to maintain a stable hover for at least some small period of
time.
a. Our vehicle payload will be severely limited
b. We may have to make design changes as progress is made if we are unable to
procure the desired sensors and controls within the payload limit
VII. End Product
Our end product is a small electrically powered autonomous flying vehicle capable of stable
indoor hover without human assistance, including onboard sensors for orientation and
acceleration along all three rotational axes as well as overall position relative to known
reference points. The sensor system also capable of a bluetooth communication with a
computer ground station. We also delivered a test flight system used for controller design
which can be used to fly any four channel controlled helicopter (with modification to the
system being minimal).

4 | P a g e
VIII. Deliverables
We plan on being able to deliver the following things:
1. A presentation giving a general overview of the current technology involved in non-
ISU UAV projects, both at other universities and in the general marketplace.
2. A written report
a. detailing the capabilities of our platform.
b. detailing the sensors used in our systems operation.
c. detailing overall processes and means by which our system operates.
d. summarizing the design, development, implementation and testing processes.
3. Our end product itself.
IX. Approach Used
i. Past Project Considerations
1. History
a. MicroCART has been an active project since 1998.
b. There are many useable aspects of engineering which have been completed to
this point.
c. There are many parts of the previous projects that will not apply to this project.
2. Rationale for project restructuring
a. Platform needed to be smaller.
b. Platform needed to be more stable.
c. Platform needed to be flown indoors.
d. Control system needed to be simplified.
ii. Functional Requirements:
Our end product will be designed subject to the following set of functional
requirements:
1. Capability of autonomous takeoff, flight, and landing
a. The vehicle should be able to power up when signaled
b. The vehicle should be able to enter flight autonomously with signaled
c. The vehicle should be able to maintain stable hover for a given span of time
d. The vehicle should be able to land on a level surface
e. The vehicle should be able to power down when signaled
f. The vehicle should do no damage to itself or any surroundings during this
process

5 | P a g e
2. Capability to make high frequency mid-flight stability adjustments
a. The vehicle must be able to stabilize itself during indoor hover for a given period
of time
b. The stabilization must be controlled fast enough to avoid any amount of lag
which would permit the unit to lose overall control or stability
c. The sensors for the vehicle must be able to communicate with the control
system quickly enough to avoid such lag
3. Capability to communicate with computer ground control station
a. The vehicle should be able to communicate information to a ground station
b. The vehicle should be able to receive instructions from a ground station
c. The vehicle will ideally be able to be overridden by manual control through the
ground station
iii. Constraint Considerations:
We will be operating under the following constraint considerations:
1. Size constraint
a. Our vehicle must be small enough to operate indoors
i. Specifically it must be operable in available university buildings
containing proper flight environments.
2. Power constraint
a. Our vehicle will have a limited power supply for flight in the form of a battery.
b. This power supply must be carried within the platform during flight.
c. This power supply should ideally allow at least 5 minutes of stable flight with all
equipment attached.
d. This power supply will be limited in capacity due to weight considerations. *see
below.
3. Payload constraint
a. Our vehicle will have a severely limited payload capability
i. Due to this, our equipment and power payload will also be severely
limited by weight
iv. Technological Considerations:
Our design will take place subject to the following technological considerations:
Platform:
1. Must be electrically powered and controlled
2. Must be of a small size for indoor flight
3. Must be a wirelessly controlled model during human flight
6 | P a g e
4. Must fit within our budget
5. Will have a necessarily very limited payload due to power source and size
Sensors/Controls:
1. A six degree of freedom inertial measurement unit (IMU)
a. Should not suffer from accumulated error
i. If so, we must be able to mitigate or eliminate the effects of such error or
somehow prevent their accumulation by modification
b. Must be light enough to fit within payload capabilities of platform
2. An image tracking unit to help eliminate error from the IMU as well as give a precise
location of the base platform inside of the intended environment.
Communications:
1. The transmitter on sensor array must be able to transmit a minimum of 35ft to
ensure adequate space for the ground station and personnel.
2. The sensor transmitter communication must be compatible with the ground station.
3. The ground station must be able to alter the signal being transmitted to the base
platform
v. Testing Requirements Considerations
Platform determination:
First we determined that a small, electrically powered coaxial RC helicopter would
provide ease of testing indoors and maximum general in flight stability. We did so both
theoretically and through testing done with a few platforms available or us to use for
this purpose.
Payload capabilities testing:
Second we tested the payload capabilities of our platform in order to determine if it
would be able to carry the necessary sensors and power circuitry. This was
accomplished by attaching the platform to the top surface of a digital scale capable of
positive and negative readings and recording the times the platform was capable of
providing various levels of lift before draining its batteries. The results of this testing
confirmed that we could not power our sensor system with the normal batteries used to
power it, and also had to remove its outer casing to reduce weight further in order to
obtain satisfactory performance. The details of this experimentation are available in a
payload report we created.

7 | P a g e
Sensor System Testing:
Testing of our sensor system was a major concern first in determining whether or not
the system could even feasibly be used for our purposes, and second, to determine the
optimal configuration to use in order to achieve best results. The two main components
of our sensor system were our three axis accelerometer and the 1024x768 infrared
camera. We needed to determine the accuracy and usability of each of these sensors in
flying a RC helicopter with high frequency vibrations, i.e. definitely not the task they
were designed to perform best at.
The accelerometer was tested for a number of things specifically. First we wanted to see
how consistent and accurate the accelerometer could be while subject to the high
frequency disturbances it would endure while on a running helicopter. Second we
wanted to see if there was any possibility we may be able to get angular orientation (at
least around two axes and near hovering) using three dimensional trigonometry and our
acceleration vectors. Third we were concerned with the fact that we knew we would
need some sort of filtering in order to reject high frequency noise, and were unsure of
the delay this would introduce into our system.
We eventually determined that the accelerometer, while very good at picking up the
kind of movements that a human arm would produce during game play, would even
after filtering not provide us with reliable information about angular orientation of the
helicopter or its linear movements. Though there may be some possibility that filtered
data could be manipulated in some form to produce useful measurements, this was not
within the scope of time we had left available to us by the time we reached our
conclusions.
Infrared (IR) camera testing had been going on at the same time. We were initially
looking to determine whether or not the IR camera could provide us with a reference
for updating the absolute position of our platform in flight, as we had no other way of
doing so other than dead reckoning (using double integration) of our accelerometer
data.
Since the IR camera we used has the capability to track four IR LEDs (or small clusters of
LEDs), we determined that a constellation of this number would allow us to gain the
most information out of any data received. Also, it was decided that we would be able
to best correlate IR coordinate movements with actual helicopter movements if our
constellation of LEDs were above the helicopter, and the camera looking up at it. In this
way, the angular movements of the helicopter that would create linear movements
agreed in their produced coordinate changes.
We derived some transforms that allowed us to with fairly good accuracy determine the
left/right (or roll) and forward/back (or pitch) planar position of the helicopter as well as
its yaw angle and current height all from the coordinate pairs for each of the four IR LED

8 | P a g e
clusters our IR camera would give us. Fortunately, although improved by two
dimensional filtering, these coordinates did not absolutely need to be filtered and this
saved us time in our implementation and testing. Though for future projects filtering
should provide even better results. We also determined an approximate flight area
inside which our helicopter would have reliable view of each IR cluster and be able to
accurately calculate its current state.
This testing was accomplished using open source code Cwiid, which we modified to suit
our purposes of data collection in both real time display and logging. This same software
is also what we modified and added onto many of our own scripts to enable us to
provide our control system with accurate sensor data to work off of.
The logged data for both helicopter inputs and or sensor outputs was, when not
observed in real time, analyzed more thoroughly using MATLAB and a number of data
analysis scripts we produced to see the effectiveness of various filtering schemes as well
as estimates of latency and accuracy during flight and non-flight sensor testing.
Control Testing (Simulation):
After we implemented a control system on our ground control station, we needed to
ensure that this system could actually maintain the level of stability and control we
wished to achieve in the platform without human assistance of any kind. However, as
accurate mathematical modeling proved much more complicated than expected, we
tested the system by flying the helicopter using the flight test system and then changing
flight control over to the computer for short periods of time.
Integrated System Testing:
Once a control system was determined to handle a simulation successfully, we tested
its real world functionality by running the system, gradually increasing degrees of
independence in a very tightly controlled environment to minimize the risk of serious
damage to the system. Eventually the system was tested fully independent of any
constraints or assistance and determined fit for autonomous operation.
Of course this phase of testing will go beyond the software control alone. It will also
determine the effectiveness of our communications system, power system, mechanical
system, and sensor system integration. Our testing procedure will seek to isolate as
much as possible each of these systems and determine appropriate adjustments as well
as ensuring a working integrated system overall.
vi. Safety Considerations
Since we will be working with a helicopter and no one on the team is a professional
model pilot, there will always be the risk of someone possibly being injured by the
spinning rotors. Also if a larger and higher power model is used any time in the future,

9 | P a g e
the risk of electrical shock and being burned by hot motors also comes into play. The
only other potentially harmful aspect of our project is when testing the different
electrical components. The components themselves are not particularly dangerous but
the equipment we use to test them most notably the power generator could potentially
cause serious injury to the user if not used correctly. However, we are all trained to use
such equipment so even though it is a potential risk it is not very likely to occur.

10 | P a g e
X. Detailed Design
Figure 1: Top-level system breakdown
Figure 2: Overall System Design
UAVSensor System
•Wii Remote
•Position Tracking System
•Inertial Measurement Unit
Power System
•Onboard UAV power
•Base Platform
•Sensor Array
•Ground Station Power
•Control System Power
•Communications Power
Communication System
•Sensor to Ground Station Communications
•Ground Station to Controller Communications
•Controller to UAV Communications
Software System
•Data Acquisition
•Input Data Transform
•Controller
•Output Data Transform
•Data Transmission Protocols
Mechanical System
•Sensor Mounting to Base Platform
•Testing platforms
11 | P a g e
i. Overall System Design
There are five main subsystems which the design of our UAV can be broken
down into, as seen in Figure 1. These systems are the Sensor System, Power
System, Communications System, Software System, and the Mechanical
System. Each of these systems is described in more detail below. The actual
implementation of this plan can be seen in Figure 2.
ii. Sensor System Design
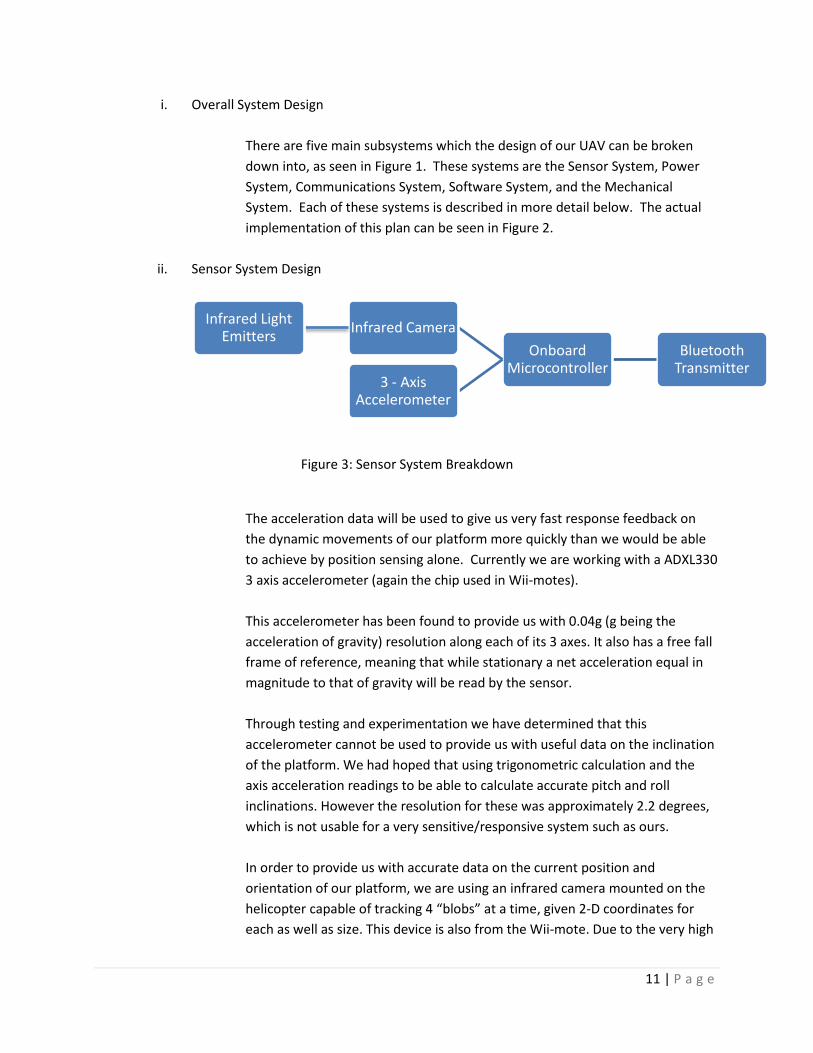
Figure 3: Sensor System Breakdown
The acceleration data will be used to give us very fast response feedback on
the dynamic movements of our platform more quickly than we would be able
to achieve by position sensing alone. Currently we are working with a ADXL330
3 axis accelerometer (again the chip used in Wii-motes).
This accelerometer has been found to provide us with 0.04g (g being the
acceleration of gravity) resolution along each of its 3 axes. It also has a free fall
frame of reference, meaning that while stationary a net acceleration equal in
magnitude to that of gravity will be read by the sensor.
Through testing and experimentation we have determined that this
accelerometer cannot be used to provide us with useful data on the inclination
of the platform. We had hoped that using trigonometric calculation and the
axis acceleration readings to be able to calculate accurate pitch and roll
inclinations. However the resolution for these was approximately 2.2 degrees,
which is not usable for a very sensitive/responsive system such as ours.
In order to provide us with accurate data on the current position and
orientation of our platform, we are using an infrared camera mounted on the
helicopter capable of tracking 4 “blobs” at a time, given 2-D coordinates for
each as well as size. This device is also from the Wii-mote. Due to the very high
Bluetooth Transmitter
Onboard Microcontroller
Infrared CameraInfrared Light
Emitters
3 - Axis Accelerometer

12 | P a g e
resolution it has in tracking IR dots (essentially IR LEDs) we will use it to give us
(through complicated calculations) a full orientation, pitch, yaw, roll, as well as
x, y, and z spatial coordinates. It will also track movements, the data of which
will be supplemented by the accelerometer data.
The IR LED constellation consists of 4 clusters of 4 IR LEDs, arranged in a square
shape. Each LED cluster is spaced 7.5 inches apart; this distance was chosen
because it is the spacing used in a standard Wii IR sensor bar. Resistors are
wired in series with the LEDs to prevent power supply short-circuiting. The
constellation is mounted on a square piece of plywood and is powered by a
plug-in 12V wall adaptor.
iii. Power System Design
1. Onboard UAV Power
a. Base Platform
The power system which was used to power the vehicle and any
onboard sensors was a 7.4 volt, 1000 mAh, 2-cell lithium polymer
rechargeable battery pack. This battery pack is designed to provide
approximately 10-15 minutes of flight time with our selected vehicle
without powering any additional electronics.
Figure 4: Sensor Power System Breakdown
b. Sensor Array
There are two primary issues that had to be addressed when selecting
an onboard power supply: power conversion and battery life
considerations. The issue of power conversion arises when trying to
connect sensors that run at lower voltages than the vehicle. To solve
this issue, we first attempted to design a simple voltage divider circuit
using to resistors, as shown in Figure 5 below.
7.4V, 1000 mAh lithium-polymer rechargeable 2-cell battery pack
7.4V - 3.3V step-down DC-
DC (buck) converter
Wii Remote PCB

13 | P a g e
Figure 5. Unused Voltage divider circuit
One fundamental flaw with this design is that much of the power
introduced into the circuit is dissipated as heat, in the form of IR2
losses. Since battery life is already relatively short while powering the
vehicle alone, we cannot afford to waste energy when trying to power
the onboard sensors.
Another disadvantage of using a simple voltage divider involves the
sensor system itself. The impedance load of the sensor system will
change as the sensors power up, which will change the value of Vout in
Figure 5 above. Since the load is constantly fluctuating, the voltage will
also fluctuate which may cause the device to either shut off or receive
sudden moments of high voltage which can damage the device.
Ultimately, it was decided that the issue of power conversion could
easily be solved by using an off-the-shelf buck converter, which is
designed to take an input voltage and output a lower voltage at a preset
level. We initially selected the model TPS62056 step-down converter
from Texas Instruments, which takes an input voltage range of 2.7-10V
and outputs at a preset 3.3V. However, the chip was much smaller than
anticipated, making it very difficult to work with. We designed a new
buck converter, whose schematic can be seen below in Figure 6.
Figure 6: Buck Converter Schematic

14 | P a g e
2. Ground Station Power
a. Control System Power
The ground station will consist of a standard PC that is Bluetooth-
enabled (this will likely be a USB plug-in device). The computer portion
of the ground station will only require a wall socket to power the PC and
computer monitor.
The computer will be linked to an FPGA board via RS-232 serial
communication. The FPGA board converts our serial data into data sent
to a 4 channel DAC. This FPGA setup is powered by a AC/DC 5V
converter.
b. Communications Power
The platform controller normally runs with 8 AA batteries, but also has
an optional plug-in. The controller plug-in uses a simple AC/DC
converter which plugs in to the wall. To minimize project costs, the wall
plug-in was used whenever possible. However, we found that the
AC/DC converter made the original RC board fail to work properly, and
began powering the system using a benchtop power supply, which also
gave us current draw of the board when in use.
Figure 7: Communication System Design Breakdown
iv. Communication System Design
1. Sensor to Computer Communications
Since the sensor system design is entirely based off the Nintendo Wii Remote,
the communication channel between the sensor system and the ground station
was already defined. The Wii Remote uses Bluetooth standard IEEE 802.15
(through a Broadcom 2042 IC) communication channels and Bluetooth HID
protocols to transfer information. We will use the BlueSoliel Bluetooth dongle
to receive the information.
Information from On-
Board Sensors Computer Processor
DAC to RC Controller
UAV Control System

15 | P a g e
2. Computer to Controller Communications
To make our UAV fly autonomously we could not use the original controlling
method, i.e. a human using a dual joystick 8 channel RC controller. To remove
the controller’s dependence on human interaction we will be using serial
communication from the computer to control a 4 channel DAC via an FPGA
board. This design was said to be simple and was completed for the team by Dr.
Phillip Jones.
3. Controller to UAV Communications
The controller used RF transmission to send information to the on board control
systems on the UAV. The UAV will read these signals no differently than if a
human were using the controller.
Figure 8: Breakdown of the Software Subsystem
v. Software System Design
1. Data Acquisition
Since the minimal sensor system design is entirely based off the Nintendo Wii
Remote, the data acquisition program was available in a downloadable library
Data Aquisition
• Outputs:
• X, Y, Z positions
• X,Y,Z accelerations
• Pitch, Roll, and Yaw
Input Data Transform and Filtering
• Outputs
• Actual Angular speed for both propellers.
• Actual Blade Pitch for both propellers.
Controller
• Outputs
• New Angular Speed for both propellers
• New Blade Pitch for both propellers
Output Data Transform
• Outputs
• New Throttle
• New Yaw
• New Pitch
• New Roll
Data Transmission
• Outputs
• Data Stream for sending to the DAC described in the communications plan.

16 | P a g e
called Cwiid. This C library handles linking to multiple Wii Remotes and
reporting any pertinent sensor data requested (IR positions or accelerometer
readings). The challenges of using this library are familiarization with a non-
team programmer’s code. For source code site link, see Appendix 1. We did not
edit the library itself, just the functions which call things from the library.
2. Input Data Transform and Filtering
The sensor system is designed to report an X and Y coordinate from the image
tracking system as well as X, Y, and Z acceleration from the IMU. Due to the
sensor system being far substandard for the task, the accelerometer data is not
useable for any real time tracking data. However, the system still functions
fairly well off the image tracking system. This module currently transforms the
X and Y coordinate into current Yaw position based on the angle the line
segment connecting the front two dots makes with the Y axis, center X and Y
positions of the constellation seen based on the averages of all 4 X and Y
locations, and current Height based on the changing perimeter of the
constellation.
This module will also be responsible for filtering the input data. However, we
found that at this time no filtering was needed to maintain a semi-stable hover.
3. Controller
Insert picture of control loop and add as appendix.
The current controllers involve a proportional controller for yaw, a proportional
integral controller for roll and pitch, and a split proportional derivative
controller for height. All of these controllers are based upon the trim values of
each axis being correct, as well as constants which we set inside the source
code. The constants for Yaw, Roll, and Height are fixed for each helicopter.
However, the height controller constants are set for fully charged batteries. As
the battery drains, the throttle response varies exponentially. This module
outputs control levels for throttle, pitch, roll, and yaw.
4. Output Data Transform
The inputs to this module will be the outputs from the controller module. The
function of this module will be to take each type of output data and transform it
into the input data needed for the module to communicate the intent of the
controller module to the base platform by means of the ground station
communication which is implemented. The outputs of this function will be

17 | P a g e
numerical values describing the new desired throttle position, yaw position,
pitch position, and roll position.
5. Data Transmission
The inputs of this module will be the outputs from the Output Data Transform
module. These include the new throttle, pitch, roll, and yaw positions. These
values will then be put into the correct number of bits to be sent to each
perspective DAC converter. Each converter will be patched into the original RC
controller instead of the potentiometers which is used for manual control. The
RC controller will be streaming these signals back to the control unit on the base
platform.
vi. Mechanical System Design
1. Sensor Mounting
At first, we tried designing two carriers for the wii remote which mounted with
brackets and screws to the helicopter. After the first of these designs failed, Dr.
Elia recommended we attached the sensor board and the camera using Velcro
with adhesive backing. Thus, we followed this suggestion and mounted the
sensor board, camera, IR filter, and buck converter with Velcro to the
helicopter. This also allows us to switch the components between the three
base platforms which we acquired.
2. Testing Platforms
The main testing platform for the system will be a 4x4 ft piece of plywood.
There will be four harnessing points anchored to the plywood base which will be
attached by flexible cables to the four corners of the base platform struts.

18 | P a g e
XI. Estimated Resource Requirements
i. Personal Effort Requirements:
Expected Personnel Effort Requirements (hours)
Team Member Problem Statement
Tech Selection
End Product Design
Prototype Implement
End Product Testing
End Product Document
End Product Demos
Project Reporting
Totals
Michael Peat 15 65 85 65 25 15 15 65 350
Kollin Moore 12 80 80 55 25 15 15 50 332
Matt Rich 17 65 80 60 40 10 20 30 322
Alex Reifert 10 65 85 60 40 10 20 30 320
Totals 54 275 330 240 130 50 70 175 1324
Table 1. Personal Effort Requirements
ii. Financial Requirements:
Project Costs
Section Item Cost
Equipment:
Base Platform Donated
Replacement Parts $ 10.00
Upgraded Batteries $ 20.00
Additional Platforms $ 180.00
Sensors Donated
Tools and Hardware $ 10.00
Reporting:
Project Poster $ 10.00
Bound Project/Design Plans $ 15.00
Labor:
1324 hours at $20/hour $ 26,480.00
Subtotal (without labor): $ 245.00
Total: $ 26,725.00
Table 2. Financial Requirements

19 | P a g e
XII. Project Schedule
Figure 9. Project Schedule
Problem Statement
Problem Definition Completion
End-Users and End-Use Identification
Constraint and System Requirement Identification
Technology and implementation considerations and …
Identification of Possible Technologies
Identification of Selection Criteria
Technology Research
Technology Selection
End-product design
Identification of Design Requirements
Simulation Design Process
Design Process
Documentation of Design
End-product prototype implementation
Identification of Prototype Limitations and …
Implementation of End-Product Prototype
End-product testing
Test Planning
Test Development
Text Execution
Test Evaluation
Documentation of Testing
End-product documentation
Development of End-User Documentation
Development of Maintenance and Support …
End-product demonstration
Demonstration Planning
Faculty Advisor Demonstration
Industrial Review Panel Demonstration
Project Reporting
Project Plan Development
Project Poster Development
End-Product Design Report Development
Project Phase Report Development
Weekly Email Reporting
SD-May10-14: MicroCART Phase 5 Schedule Breakdown
Task Duration Subtask Duration

20 | P a g e
XIII. Project Team Information
Client Information: N/A (project dropped by Lockheed Martin)
Advisor Information:
Dr. Nicola Elia, EE Assistant Professor 3131 Coover Hall Iowa State University Ames, IA 50010 [email protected] (515) 294-3579
Dr. Phillip Jones, EE/CprE Assistant Professor 329 Durham Hall Iowa State University Ames, IA 50010 [email protected] (515) 294-9208
Student Team Information:
Michael Peat, EE 4362 Maricopa Dr Ames, IA 50014-7980 [email protected] (712) 540-8170
Kollin Moore, EE 211 Campus Ave Ames, IA 50014-7407 [email protected] (563) 940-8502
Matt Rich, EE 620 S 4th St Unit 205 Ames, IA 50010-6901 [email protected] (712) 899-7691
Alex Reifert, EE 1224 Frederiksen Court Ames, IA 50010 [email protected] (563) 506-5769

21 | P a g e
XIV. Closing Summary
The goal of this project was to create a Vertical Take-off and Landing Unmanned Aerial
Vehicle (VTOL UAV) which, at a minimum, could take off, hover, and land autonomously. It
was designed using a purchasable, electrically powered, indoor use base platform which
could handle all necessary flight mechanics for the system. The system incorporated a
position tracking system to provide the necessary stabilization during flight. The system also
used wireless communication to both provide information from the sensors to a ground
station, where information processing took place, and also to receive flight commands from
the computer-controlled remote controller.
The project spanned from August 2009 until May 2010, during which time the team
delivered an assortment of reports and designs, as well implemented a prototype of the end
product. The overall project cost was $26,725 (including labor) or $245 (without labor
included).

22 | P a g e
Appendix 1: Cwiid Library Download Location
I had intended to put the source code in this appendix. After inserting it, I realized that it was far to
large to print (30+ pages at 8pt font). This source code can be found at: http://abstrakraft.org/cwiid/
Appendix 2: Our Source Code
//Heli_Wii_Test.c by Michael Peat Last Update:4/27/2010
//To compile:
//Login as Root
//Run Command: export
LD_LIBRARY_PATH=/home/kito/Desktop/CWIID_Experimental/cwiid-0.6.00/libcwiid
//Note: the export command only has to be run once each time a terminal is
opened and logged into as root.
//Run Command: make clean
//Run Command: make
//Then Run Executable (see makefile for current executable name)
/* This program is made to allow the Colco Airwolf Dual Concentric Helicopter
to be flown using an XBox controller while streaming
* sensor data from a wii remote to an output file. It also creates a file
of how the helicopter is being controlled
* by the XBox controller.
* The data gathered from the wiimote is used to calculate the current yaw,
height, and Center X and Y location of the helicopter.
* The error between this data and our setpoints allows the computer the
calculate control values for flying the helicopter.
* Before control is given to the computer to fly the helicopter, it is
important to make sure the trim values are set so that there
* is not much drift when the helicopter is throttled up (make sure you set
the trims for when the helicopter is off the ground as
* the up currents created when flying close to the ground and any angle the
helicopter has due to its landing gear makes trimming while
* on the ground worse than useless).
* Control can be given to the computer by squeezing the right trigger.
*
* All of the code for the wii is taken from the wmdemo.c program which comes
in the download of the cwiid library.
* The interface is not the best, but it works well enough for our purposes.
*/
#include <stdarg.h>
#include <stdio.h>
#include <stdlib.h>
#include <cwiid.h>
#include <sys/time.h>
#include <string.h>
#include "xbox_control.h"
#include "out_functions.h"
#include "uart_rx_tx.h"
#include "data_conversion.h"
#define toggle_bit(bf,b) \

23 | P a g e
(bf) = ((bf) & b) \
? ((bf) & ~(b)) \
: ((bf) | (b))
extern TIME Time;
extern joystick xbox_controller;
extern Output output;
extern char print_on;
extern unsigned char PITCH_MID;
extern unsigned char ROLL_MID;
extern unsigned char YAW_MIN;
extern unsigned char YAW_MID;
extern unsigned char YAW_MAX;
//File naming variables
int fileIndex = 0;
char base2[] = "input_data";
char base[] = "sensor_data";
char exten[] = ".txt";
char fileName[25];
char fileName2[25];
FILE * outfile;
char end_program =0;//if set to 1, the main loop will not run
char Print_to_Screen = 0;//if set to 1, LOTS!! of data will print to the
terminal
cwiid_mesg_callback_t cwiid_callback;
cwiid_wiimote_t *wiimote; /* wiimote handle */
cwiid_err_t err;
unsigned char mesg = 0;
//Function Prototypes for functions below the main
void set_led_state(cwiid_wiimote_t *wiimote, unsigned char led_state);
void set_rpt_mode(cwiid_wiimote_t *wiimote, unsigned char rpt_mode);
void print_state(struct cwiid_state *state);
void err(cwiid_wiimote_t *wiimote, const char *s, va_list ap)
{
if (wiimote) printf("%d:", cwiid_get_id(wiimote));
else printf("-1:");
vprintf(s, ap);
printf("\n");
}
int main(int argc, char *argv[])
{
struct cwiid_state state; /* wiimote state */
int led_count = 0; //used to update which LED's are on...not
currently implemented
bdaddr_t bdaddr; /* bluetooth device address */

24 | P a g e
unsigned char rpt_mode = 0;
unsigned char led_state = 0;
char check=0; // only allows main program to run if right
number of ports initialized
int uart_fd; // UART file descriptor
//double dummy;
fprintf(stderr,"Starting Flight Test Program.\n");
cwiid_set_err(err);
/* Connect to address given on command-line, if present */
if (argc > 1) {
str2ba(argv[1], &bdaddr);
}
else {
bdaddr = *BDADDR_ANY;
}
/* Connect to the wiimote */
printf("Put Wiimote in discoverable mode now (press the red
button)...\n");
if (!(wiimote = cwiid_open(&bdaddr, 0)))
{
fprintf(stderr, "Unable to connect to wiimote\n");
return -1;
}
else
{
check++;
//turns all Wiimote LEDS on when connection established
toggle_bit(led_state, CWIID_LED1_ON);
toggle_bit(led_state, CWIID_LED2_ON);
toggle_bit(led_state, CWIID_LED3_ON);
toggle_bit(led_state, CWIID_LED4_ON);
set_led_state(wiimote, led_state);
fprintf(stderr,"Wiimote Connected\n");
}
//sets Wiimote up to report accelerometer data
toggle_bit(rpt_mode, CWIID_RPT_ACC);
set_rpt_mode(wiimote, rpt_mode);
//sets Wiimote up to report IR data
/* libwiimote picks the highest quality IR mode available with the
* other options selected (not including as-yet-undeciphered
* interleaved mode */
toggle_bit(rpt_mode, CWIID_RPT_IR);
set_rpt_mode(wiimote, rpt_mode);
print_on=0;//turns on print statements in the terminal for the xbox
events
//Sets filename automatically naming the files numerically
fileIndex++;
sprintf(fileName2, "%s%d", base2, fileIndex);

25 | P a g e
sprintf(fileName2, "%s%s", fileName2, exten);
sprintf(fileName, "%s%d", base, fileIndex);
sprintf(fileName, "%s%s", fileName, exten);
outfile = fopen( fileName, "a+" );
if(xbox_init()) // initializes xbox port and increments
check if successful
{
check++;
}
if(output_init(fileName2)) // initializes output file and
variables and increments check if successful
{
check++;
}
if((uart_fd = open_port()) != -1) //initializes the UART and
increments check if successful
{
set_uart_options(uart_fd);
check++;
}
write_uart_FPGA(uart_fd,0,PITCH_MID,ROLL_MID,YAW_MID);
fprintf(stderr,"Hit enter to start test\n");
//getchar();
while((getchar()) != '\n')
{}
//sets up all time variables to be used in the main loop--some of them
are no longer used in this version
gettimeofday(&Time.Tp,0);
Time.Start = (Time.Tp.tv_sec*1000000 + Time.Tp.tv_usec);
Time.Temp2 = Time.Start;
Time.Temp3 = Time.Start;
Time.Temp4 = Time.Start;
Time.Current = 0;
//Changes to just having the first and third LEDs on after the main
loop is started
toggle_bit(led_state, CWIID_LED2_ON);
toggle_bit(led_state, CWIID_LED4_ON);
set_led_state(wiimote, led_state);
/*
if (cwiid_enable(wiimote, CWIID_FLAG_MESG_IFC))
{
fprintf(stderr, "Error enabling messages\n");
}
else
{
mesg = 1;
//sprintf(fileName, "%s%d", base, fileIndex);
//sprintf(fileName, "%s%s", fileName, exten);
}*/
26 | P a g e
while(check==4 && (!end_program))//((Time.Current < dCheck_Duration)
&& (check==3))
{
controller(); //runs the code pulling data from the XBOX controller
// output_transform();
//
fprintf(stderr,"%d,%d,%d,%d,%d\n",output.throttle,output.pitch,output.r
oll,output.yaw,output.kill_switch);
//updates time structure
gettimeofday(&Time.Tp,0);
Time.Temp = (Time.Tp.tv_sec*1000000 + Time.Tp.tv_usec);
Time.Current2 = (Time.Temp - Time.Temp3);
Time.Current3 = (Time.Temp - Time.Temp4);
//updates every 1.5ms
if(Time.Current3 > 1500)
{
//output_transform();
Time.Temp4 = Time.Temp;
}
//updates every 10ms--if this value is made smaller, the computer
may not be able to handle the write statements to the UART
if(Time.Current2 > 10000)
{
output_transform();
//Grabs the current state of the Wiimote
if (cwiid_get_state(wiimote, &state))
{
fprintf(stderr, "Error getting state\n");
}
Dot_Label(&state); //Sorts and labels the IR dots
Yaw_Conversion(); //Converts IR data into current Yaw state
Center_Conversion(); //Converts current IR data into current
center position states
Height_Conversion(); //Converts current IR data into current
Height (based on a 3rd order function of the perimeter)
output_uart_write(uart_fd); //writes the appropriate values to
the UART
Time.Current = (Time.Temp - Time.Start)/1000;//used in the
output file write function for timestamping
if(output.kill_switch == 0)
{
output_file_write(); //writes values sent to the UART into the
input_data_*.txt file
print_state(&state); //writes the current wii state to the
sensor_data_*.txt file
}
Time.Temp3 = Time.Temp;//updates time
led_count++; //updates led_count each loop
//used to flash the LEDs...can cause problems with proper code
execution if connection to the wiimote is lost for some reason
// if(led_count == 10)
27 | P a g e
//{
// toggle_bit(led_state, CWIID_LED1_ON);
// toggle_bit(led_state, CWIID_LED2_ON);
// toggle_bit(led_state, CWIID_LED3_ON);
//toggle_bit(led_state, CWIID_LED4_ON);
//set_led_state(wiimote, led_state);
//led_count = 0;
//}
}
}
//kills harmful values being transmitted to the helicopter
write_uart_FPGA(uart_fd,0,PITCH_MID,ROLL_MID,YAW_MID);
//output trim values to screen
fprintf(stderr,"Current Trim Values:\n");
fprintf(stderr,"\tPitch Midpoint: %3d\n",PITCH_MID);
fprintf(stderr,"\tRoll Midpoint: %3d\n",ROLL_MID);
fprintf(stderr,"\tYaw Midpoint: %3d\n\n",YAW_MID);
// Close ports and files
fprintf(stderr,"\nClosing UART Port\n");
close(uart_fd);
fprintf(stderr,"Closing Xbox Port\n");
close(xbox_controller.fd);
fprintf(stderr,"Closing Xbox Input Data File\n");
fclose(output.fd);
fprintf(stderr,"Closing Sensor Data File\n");
fclose(outfile);
fprintf(stderr,"Disconnecting Wiimote\n");
if (cwiid_close(wiimote))
{
fprintf(stderr, "Error on wiimote disconnect\n");
return -1;
}
fprintf(stderr,"Ending Program\n\n\n");
return 0;
}
//Sets the LEDs on the wiimote
void set_led_state(cwiid_wiimote_t *wiimote, unsigned char led_state)
{
if (cwiid_set_led(wiimote, led_state)) {
fprintf(stderr, "Error setting LEDs \n");
end_program = 1;
}
}
//Sets the reporting mode of the wiimote-- a changes accelerometer reporting,
i changes IR reporting
void set_rpt_mode(cwiid_wiimote_t *wiimote, unsigned char rpt_mode)
{
if (cwiid_set_rpt_mode(wiimote, rpt_mode)) {
fprintf(stderr, "Error setting report mode\n");
}
}

28 | P a g e
//Prints current state of the wii to a file and to the screen when the
Print_to_Screen variable = 1
void print_state(struct cwiid_state *state)
{
int i;
int valid_source = 0;
if(Print_to_Screen)
{
printf("%.3f,%d,%d,%d", Time.Current, state->acc[CWIID_X]-125, state-
>acc[CWIID_Y]-125, state->acc[CWIID_Z]-125);
}
fprintf(outfile, "%8.0f,%d,%d,%d", Time.Current, state->acc[CWIID_X]-
125, state->acc[CWIID_Y]-125, state->acc[CWIID_Z]-125);
for (i = 0; i < 4; i++) {
valid_source=0;
if (state->ir_src[i].valid) { //unsure whether state-
>ir_src[i].valid simply returns 1 and 0 or other numbers, hence valid_source
variable
valid_source = 1;
if(Print_to_Screen)
{
printf(",%d,%d,%d,%d", 1, state->ir_src[i].pos[CWIID_X],
state->ir_src[i].pos[CWIID_Y],state->ir_src[i].size);
}
fprintf(outfile, ",%d,%d,%d,%d", 1, state-
>ir_src[i].pos[CWIID_X], state->ir_src[i].pos[CWIID_Y],state-
>ir_src[i].size);
}
if (!valid_source) {
if(Print_to_Screen)
{
printf(",%d,%d,%d,%d", 0, state-
>ir_src[i].pos[CWIID_X], state->ir_src[i].pos[CWIID_Y],state-
>ir_src[i].size);
}
fprintf(outfile, ",%d,%d,%d,%d", 0, state-
>ir_src[i].pos[CWIID_X], state->ir_src[i].pos[CWIID_Y],state-
>ir_src[i].size);
}
}
if(Print_to_Screen)
{
printf("\n");
}
fprintf(outfile, "\n");
}

29 | P a g e
/*
* File xbox_control_3.c
* Author: Mike Peat
* Date: Spring 2010
*/
#include <stdio.h>
#include <stdlib.h>
#include <sys/ioctl.h>
#include <sys/types.h>
#include <linux/input.h>
#include <math.h>
#include <sys/stat.h>
#include <fcntl.h>
#include <pthread.h>
#include <unistd.h>
#include <sys/socket.h>
#include <netinet/ip.h>
#include <string.h>
#include "xbox_control.h"
#include "out_functions.h"
/* Global Variables */
joystick xbox_controller;
char print_on=0;
extern Output output;
/* Initializes the xbox controller */
int xbox_init(void)
{
printf("Opening Xbox Port\n\r");
xbox_controller.fd = open("/dev/input/js0",O_RDONLY | O_NONBLOCK );
if(xbox_controller.fd == -1)
{
fprintf(stderr,"Unable to open Xbox port\n\r Exiting...");
return 0;
}
return 1;
}
/* Reads values from the Xbox controller and sends them out */
int controller(void)
{
struct js_event xboxEvent;
//while(1)
//{
read(xbox_controller.fd, &xboxEvent, sizeof(struct js_event));
if(xboxEvent.time!=xbox_controller.old_time)
{
xbox_controller.old_time=xboxEvent.time;
if (xboxEvent.type == JS_EVENT_AXIS) {
switch(xboxEvent.number) {
case 0: // LEFT ANALOG X

30 | P a g e
xbox_controller.state.left_analog_x =
xboxEvent.value;
if(print_on) fprintf(stderr, "Left Stick
X: %d \n",xbox_controller.state.left_analog_x);
break;
case 1: // LEFT ANALOG Y
xbox_controller.state.left_analog_y =
xboxEvent.value;
if(print_on) fprintf(stderr, "Left Stick
Y: %d \n",xbox_controller.state.left_analog_y);
break;
case 2: // LEFT TRIGGER
xbox_controller.state.left_trigger =
xboxEvent.value;
if(print_on) fprintf(stderr, "Left
Trigger: %d \n",xbox_controller.state.left_trigger);
break;
case 3: // RIGHT X
xbox_controller.state.right_analog_x =
xboxEvent.value;
if(print_on) fprintf(stderr, "Right Stick
X: %d \n",xbox_controller.state.right_analog_x);
break;
case 4: // RIGHT Y
xbox_controller.state.right_analog_y =
xboxEvent.value;
if(print_on) fprintf(stderr, "Right Stick
Y: %d \n",xbox_controller.state.right_analog_y);
break;
case 5: // RIGHT TRIGGER
xbox_controller.state.right_trigger =
xboxEvent.value;
if(print_on) fprintf(stderr, "Right
Trigger: %d \n",xbox_controller.state.right_trigger);
break;
case 6: // D-PAD LEFT / RIGHT
xbox_controller.state.buttons =
(xbox_controller.state.buttons | XBOX_BUTTON_MASK_RIGHT) &
((~XBOX_BUTTON_MASK_RIGHT) | ((xboxEvent.value > 0) ? XBOX_BUTTON_MASK_RIGHT
: 0));
xbox_controller.state.buttons =
(xbox_controller.state.buttons | XBOX_BUTTON_MASK_LEFT) &
((~XBOX_BUTTON_MASK_LEFT ) | ((xboxEvent.value < 0) ? XBOX_BUTTON_MASK_LEFT
: 0));
if(print_on) fprintf(stderr, "DPAD left or
right pressed\n");
break;
case 7: // D-PAD UP / DOWN
xbox_controller.state.buttons =
(xbox_controller.state.buttons | XBOX_BUTTON_MASK_UP) &
((~XBOX_BUTTON_MASK_UP ) | ((xboxEvent.value < 0) ? XBOX_BUTTON_MASK_UP :
0));
xbox_controller.state.buttons =
(xbox_controller.state.buttons | XBOX_BUTTON_MASK_DOWN) &
((~XBOX_BUTTON_MASK_DOWN) | ((xboxEvent.value > 0) ? XBOX_BUTTON_MASK_DOWN :
0));

31 | P a g e
if(print_on) fprintf(stderr, "DPAD up or
down pressed\n");
break;
}
} else if (xboxEvent.type == JS_EVENT_BUTTON) {
switch(xboxEvent.number) {
case 0: // A BUTTON
xbox_controller.state.buttons =
(xbox_controller.state.buttons | XBOX_BUTTON_MASK_A) & ((~XBOX_BUTTON_MASK_A)
| ((xboxEvent.value > 0) ? XBOX_BUTTON_MASK_A : 0));
output.new_press[XBOX_BUTTON_A]=1;
if(print_on) fprintf(stderr, "A Button
Pressed\n");
break;
case 1: // B BUTTON
xbox_controller.state.buttons =
(xbox_controller.state.buttons | XBOX_BUTTON_MASK_B) & ((~XBOX_BUTTON_MASK_B)
| ((xboxEvent.value > 0) ? XBOX_BUTTON_MASK_B : 0));
output.new_press[XBOX_BUTTON_B]=1;
if(print_on) fprintf(stderr, "B Button
Pressed\n");
break;
case 2: // BLACK BUTTON
xbox_controller.state.buttons =
(xbox_controller.state.buttons | XBOX_BUTTON_MASK_BLACK) &
((~XBOX_BUTTON_MASK_BLACK) | ((xboxEvent.value > 0) ? XBOX_BUTTON_MASK_BLACK
: 0));
output.new_press[XBOX_BUTTON_BLACK]=1;
if(print_on) fprintf(stderr, "Black Button
Pressed\n");
break;
case 3: // X BUTTON
xbox_controller.state.buttons =
(xbox_controller.state.buttons | XBOX_BUTTON_MASK_X) & ((~XBOX_BUTTON_MASK_X)
| ((xboxEvent.value > 0) ? XBOX_BUTTON_MASK_X : 0));
output.new_press[XBOX_BUTTON_X]=1;
if(print_on) fprintf(stderr, "X Button
Pressed\n");
break;
case 4: // Y BUTTON
xbox_controller.state.buttons =
(xbox_controller.state.buttons | XBOX_BUTTON_MASK_Y) & ((~XBOX_BUTTON_MASK_Y)
| ((xboxEvent.value > 0) ? XBOX_BUTTON_MASK_Y : 0));
output.new_press[XBOX_BUTTON_Y]=1;
if(print_on) fprintf(stderr, "Y Button
Pressed\n");
break;
case 5: // WHITE BUTTON
xbox_controller.state.buttons =
(xbox_controller.state.buttons | XBOX_BUTTON_MASK_WHITE) &
((~XBOX_BUTTON_MASK_WHITE) | ((xboxEvent.value > 0) ? XBOX_BUTTON_MASK_WHITE
: 0));
output.new_press[XBOX_BUTTON_WHITE]=1;
if(print_on) fprintf(stderr, "White Button
Pressed\n");
break;
case 6: // START BUTTON
32 | P a g e
xbox_controller.state.buttons =
(xbox_controller.state.buttons | XBOX_BUTTON_MASK_START) &
((~XBOX_BUTTON_MASK_START) | ((xboxEvent.value > 0) ? XBOX_BUTTON_MASK_START
: 0));
output.new_press[XBOX_BUTTON_START]=1;
if(print_on) fprintf(stderr, "Start Button
Pressed\n");
break;
case 7: // LEFT ANALAG STICK BUTTON
xbox_controller.state.buttons =
(xbox_controller.state.buttons | XBOX_BUTTON_MASK_LSTICK) &
((~XBOX_BUTTON_MASK_LSTICK) | ((xboxEvent.value > 0) ?
XBOX_BUTTON_MASK_LSTICK : 0));
output.new_press[XBOX_BUTTON_LEFT_STICK]=1;
if(print_on) fprintf(stderr, "Left Stick
Button Pressed\n");
break;
case 8: // RIGHT ANALAG STICK BUTTON
xbox_controller.state.buttons =
(xbox_controller.state.buttons | XBOX_BUTTON_MASK_RSTICK) &
((~XBOX_BUTTON_MASK_RSTICK) | ((xboxEvent.value > 0) ?
XBOX_BUTTON_MASK_RSTICK : 0));
output.new_press[XBOX_BUTTON_RIGHT_STICK]=1;
if(print_on) fprintf(stderr, "Right Stick
Button Pressed\n");
break;
case 9: // BACK BUTTON
xbox_controller.state.buttons =
(xbox_controller.state.buttons | XBOX_BUTTON_MASK_BACK) &
((~XBOX_BUTTON_MASK_BACK) | ((xboxEvent.value > 0) ? XBOX_BUTTON_MASK_BACK :
0));
output.new_press[XBOX_BUTTON_BACK]=1;
if(print_on) fprintf(stderr, "Back Button
Pressed\n");
break;
}
}
}
return EXIT_SUCCESS;
}

33 | P a g e
/*
* File out_fucntions.c
* Author: Mike Peat
* Date: Spring 2010
*/
#include <stdio.h>
#include <stdlib.h>
#include <string.h>
#include <unistd.h>
#include <sys/types.h>
#include <sys/stat.h>
#include <sys/time.h>
#include <fcntl.h>
#include <math.h>
#include <cwiid.h>
#include "xbox_control.h"
#include "out_functions.h"
#include "uart_rx_tx.h"
#include "controllers.h"
#define toggle_bit(bf,b) \
(bf) = ((bf) & b) \
? ((bf) & ~(b)) \
: ((bf) | (b))
//External Globals
extern joystick xbox_controller;
extern int fileIndex;
extern char base2[];
extern char base[];
extern char exten[];
extern int fileIndex;
extern char fileName[25];
extern char fileName2[25];
extern char end_program;
extern char Print_to_Screen;
extern FILE * outfile;
extern cwiid_wiimote_t *wiimote;
extern struct cwiid_state state;
extern unsigned char mesg;
extern double Accumulated_Roll_Error;
extern double Accumulated_Pitch_Error;
extern double Accumulated_Height_Error;
extern double Previous_Roll_error;
extern double Previous_Pitch_error;
extern double Previous_Height_error;
//Global Variables
Output output;
TIME Time;
unsigned char PITCH_MIN = 0;
unsigned char PITCH_MID = 101;//94;//98;//102
unsigned char PITCH_MAX = 255;
unsigned char PITCH_RANGE = 100;
unsigned char ROLL_MIN = 0;
unsigned char ROLL_MID = 111;//106;//87

34 | P a g e
unsigned char ROLL_MAX = 255;
unsigned char ROLL_RANGE = 100;
unsigned char YAW_MIN = 103;
unsigned char YAW_MID = 119;//127;//112;//137
unsigned char YAW_MAX = 153;
unsigned char YAW_RANGE = 50;
unsigned char Controllers_Active = 0;
char Reset_Accumulators = 1;
//initializes output file and output values
int output_init(char *path)
{
//char disp[100];
//fprintf(stderr,"Creating and Opening %s \n",path);
//output.fd = open(path ,O_CREAT);
output.fd = fopen(path, "a+");
//fprintf(output.fd,"Time Throttle Pitch Roll Yaw Kill\n");
//sprintf(disp,"Time Throttle Pitch Roll Yaw Kill\n");
//write(output.fd, disp, strlen(disp));
//fclose(output.fd);
output.throttle=THROTTLE_MIN;
output.pitch=PITCH_MID;
output.roll=ROLL_MID;
output.yaw=YAW_MID;
output.kill_switch = FALSE;
return 1;
}
/* Transforms Xbox Controller values into the values to be sent out on the
RS232
* Mapping is as follows: (can also be found in the xbox mapping appendix of
the final report)
* Left Stick Y = Throttle
* Left Stick X = Yaw
* Right Stick Y = Pitch
* Right Stick X = Roll
* Y Button = Pitch Trim Up
* A Button = Pitch Trim Down
* B Button = Roll Trim Up
* X Button = Roll Trim Down
* White Button = Yaw Trim Down
* Black Button = Yaw Trim Up
*
* Back Button = End Program (exits main while loop in Heli_Wii_Test_2.c
*
* Squeeze left trigger once sets kill switch which returns all values to the
* initial states (Throttle Min, Pitch Mid, Roll Mid, and Yaw Mid) it
also
* increments the input data and sensor data files so that this can be
used
* to start a new test data set.
*
* Squeeze and hold of the right trigger transfers control of the helicopter
to the computer

35 | P a g e
* control system. Each time it is released and then squeezed again, the
variables associated
* with the I and D parts of the controllers are reset appropriately.
*/
void output_transform(void)
{
if(output.kill_switch == 0)
{
//If right trigger is squeezed, control of outputs is passed to the
program
if(xbox_controller.state.right_trigger > 0)
{
//checks each time the function is called to see whether the control
should be given to the computer
//control system or be flown manually by the xbox controller
Controllers_Active = 1;
//resets values associated with I and D controllers each time the
controllers are restarted.
if(Reset_Accumulators)
{
Accumulated_Roll_Error = 0;
Accumulated_Pitch_Error = 0;
Accumulated_Height_Error = 0;
Previous_Roll_error = 0;
Previous_Pitch_error = 0;
Previous_Height_error = 0;
Reset_Accumulators = 0;
}
}
else
{
Controllers_Active = 0;
Reset_Accumulators = 1;
}
//Throttle
if(Controllers_Active)
{
throttle_controller();
}
else
{
if(xbox_controller.state.left_analog_y < 0)
{
output.throttle = (unsigned char)(xbox_controller.state.left_analog_y
* (THROTTLE_STICK_MIDPOINT / 32768.0) + THROTTLE_STICK_MIDPOINT);
}
else
{
output.throttle = (unsigned char)(xbox_controller.state.left_analog_y
* ((255 - THROTTLE_STICK_MIDPOINT) / 32768.0) + THROTTLE_STICK_MIDPOINT);
}
}

36 | P a g e
if(Controllers_Active)
{
pitch_controller();
}
else
{
PITCH_MIN = PITCH_MID - (PITCH_RANGE / 2);
PITCH_MAX = PITCH_MID + (PITCH_RANGE / 2);
//Pitch
if(xbox_controller.state.right_analog_y < 0)
{
output.pitch = (unsigned char)(xbox_controller.state.right_analog_y *
((PITCH_MID - PITCH_MIN) / 32768.0) + PITCH_MID);
}
else
{
output.pitch = (unsigned char)(xbox_controller.state.right_analog_y *
((PITCH_MAX - PITCH_MID) / 32768.0) + PITCH_MID);
}
//Pitch Trim
if(output.new_press[XBOX_BUTTON_Y])
{
if(PITCH_MID < PITCH_MAX)
{
PITCH_MID++;
//fprintf(stderr,"Yaw Up\n");
}
output.new_press[XBOX_BUTTON_Y]=0;
}
if(output.new_press[XBOX_BUTTON_A])
{
if(PITCH_MID > PITCH_MIN)
{
PITCH_MID--;
//fprintf(stderr,"Yaw Up\n");
}
output.new_press[XBOX_BUTTON_A]=0;
}
}
if(Controllers_Active)
{
roll_controller();
}
else
{
ROLL_MIN = ROLL_MID - (ROLL_RANGE / 2);
ROLL_MAX = ROLL_MID + (ROLL_RANGE / 2);
//Roll
if(xbox_controller.state.right_analog_x < 0)
{
output.roll = (unsigned char)(xbox_controller.state.right_analog_x *
((ROLL_MID - ROLL_MIN) / 32768.0) + ROLL_MID);
}

37 | P a g e
else
{
output.roll = (unsigned char)(xbox_controller.state.right_analog_x *
((ROLL_MAX - ROLL_MID) / 32768.0) + ROLL_MID);
}
//Roll Trim
if(output.new_press[XBOX_BUTTON_B])
{
if(ROLL_MID < ROLL_MAX)
{
ROLL_MID++;
//fprintf(stderr,"Yaw Up\n");
}
output.new_press[XBOX_BUTTON_B]=0;
}
if(output.new_press[XBOX_BUTTON_X])
{
if(ROLL_MID > ROLL_MIN)
{
ROLL_MID--;
//fprintf(stderr,"Yaw Up\n");
}
output.new_press[XBOX_BUTTON_X]=0;
}
}
if(Controllers_Active)
{
yaw_controller();
}
else
{
YAW_MIN = YAW_MID-(YAW_RANGE/2);
YAW_MAX = YAW_MID+(YAW_RANGE/2);
//Yaw
if(xbox_controller.state.right_analog_x < 0)
{
output.yaw = (unsigned char)(xbox_controller.state.left_analog_x *
((YAW_MID - YAW_MIN) / 32768.0) + YAW_MID);
}
else
{
output.yaw = (unsigned char)(xbox_controller.state.left_analog_x *
((YAW_MAX - YAW_MID) / 32768.0) + YAW_MID);
}
//Yaw Trim
if(output.new_press[XBOX_BUTTON_BLACK])
{
if(YAW_MID<YAW_MAX)
{
YAW_MID++;
//fprintf(stderr,"Yaw Up\n");
}
output.new_press[XBOX_BUTTON_BLACK]=0;
}

38 | P a g e
if(output.new_press[XBOX_BUTTON_WHITE])
{
if(YAW_MID>YAW_MIN)
{
YAW_MID--;
//fprintf(stderr,"Yaw Up\n");
}
output.new_press[XBOX_BUTTON_WHITE]=0;
}
}
//Kill Switch->Squeeze Left Trigger Once
if(xbox_controller.state.left_trigger > 0)
{
output.kill_switch = 1;
//toggle_bit(rpt_mode, CWIID_RPT_ACC);
//toggle_bit(rpt_mode, CWIID_RPT_IR);
//set_rpt_mode(wiimote, rpt_mode);
if (cwiid_disable(wiimote, CWIID_FLAG_MESG_IFC))
{
fprintf(stderr, "Error disabling message\n");
}
else
{
mesg = 0;
}
//Accumulated_Roll_Error = 0;
//Accumulated_Pitch_Error = 0;
//Previous_Roll_error = 0;
//Previous_Pitch_error = 0;
fprintf(stderr,"Current Trim Values:\n");
fprintf(stderr,"\tPitch Midpoint: %3d\n",PITCH_MID);
fprintf(stderr,"\tRoll Midpoint: %3d\n",ROLL_MID);
fprintf(stderr,"\tYaw Midpoint: %3d\n\n",YAW_MID);
//fprintf(stderr,"I am here\n"); //used for debugging segmentation
faults
fclose(output.fd);
//fprintf(stderr,"Now I am here\n"); //used for debugging segmentation
faults
fclose(outfile);
//fprintf(stderr,"And Now here\n"); //used for debugging segmentation
faults
}
}
else
{
output.throttle=THROTTLE_MIN;
output.pitch=PITCH_MID;
output.roll=ROLL_MID;
output.yaw=YAW_MID;
//fileIndex++;
if(xbox_controller.state.left_trigger < 0)

39 | P a g e
{
output.kill_switch = 0;
gettimeofday(&Time.Tp,0);
Time.Start = (Time.Tp.tv_sec*1000000 + Time.Tp.tv_usec);
Time.Temp2 = Time.Start;
Time.Temp3 = Time.Start;
Time.Temp4 = Time.Start;
Time.Current = 0;
fileIndex++;
sprintf(fileName2, "%s%d", base2, fileIndex);
sprintf(fileName2, "%s%s", fileName2, exten);
fprintf(stderr,"Creating New Input File: %s\n",fileName2);//used for
debugging segmentation faults
output_init(fileName2);
sprintf(fileName, "%s%d", base, fileIndex);
sprintf(fileName, "%s%s", fileName, exten);
fprintf(stderr,"Creating New Sensor Data File: %s\n",fileName);
outfile = fopen( fileName, "a+" );
//toggle_bit(rpt_mode, CWIID_RPT_ACC);
//toggle_bit(rpt_mode, CWIID_RPT_IR);
//set_rpt_mode(wiimote, rpt_mode);
if (cwiid_enable(wiimote, CWIID_FLAG_MESG_IFC))
{
fprintf(stderr, "Error enabling messages\n");
}
else
{
mesg = 1;
}
}
}
if((xbox_controller.state.buttons & XBOX_BUTTON_MASK_BACK) ==
XBOX_BUTTON_MASK_BACK)
{
end_program=1;
if (cwiid_disable(wiimote, CWIID_FLAG_MESG_IFC))
{
fprintf(stderr, "Error disabling message\n");
}
else
{
mesg = 0;
}
}
}
// Outputs the Helicopter Inputs to specified file in output.fd
void output_file_write(void)
{
//char disp[100];
// fprintf(stderr,"Output.fd=%d\n",output.fd);
40 | P a g e
//sprintf(disp,"%8.0f,%d,%d,%d,%d,%d\n",Time.Current,output.throttle,output.p
itch,output.roll,output.yaw,output.kill_switch);
//write(output.fd, disp, strlen(disp));
fprintf(output.fd,"%8.0f,%d,%d,%d,%d,%d\n",Time.Current,output.throttle,outpu
t.pitch,output.roll,output.yaw,Controllers_Active);
}
// Outputs the Helicopter Inputs to UART
// The command statements tell the FPGA which DAC line to put the next value
on
// Each send value is separated into a statement which gives the correct
value
// if the computer controllers are flying or the xbox has control.
void output_uart_write(int uart_fd)
{
unsigned char THROTTLE_COMMAND = 0XC1;
unsigned char PITCH_COMMAND = 0XC2;
unsigned char ROLL_COMMAND = 0XC3;
unsigned char YAW_COMMAND = 0XC4;
unsigned char output_yaw_temp; // phjones
unsigned char output_roll_temp;
unsigned char output_pitch_temp;
unsigned char output_throttle_temp;
int n; // number of bytes written out of the UART port
//Throttle command and value
n = write(uart_fd,&THROTTLE_COMMAND,sizeof(THROTTLE_COMMAND));
if (n < 1)
{
fprintf(stderr,"Incomplete UART Transmission: THROTTLE_COMMAND\n");
}
if(Controllers_Active)
{
output_throttle_temp = THROTTLE_STICK_MIDPOINT - (signed
char)output.throttle;
}
else
{
output_throttle_temp = output.throttle;
}
n = write(uart_fd,&output_throttle_temp,1);
if (n < 1)
{
fprintf(stderr,"Incomplete UART Transmission: THROTTLE VALUE\n");
}
//Pitch command and value
n = write(uart_fd,&PITCH_COMMAND,sizeof(PITCH_COMMAND));
if (n < 1)
{
fprintf(stderr,"Incomplete UART Transmission: PITCH_COMMAND\n");
}
41 | P a g e
if(Controllers_Active)
{
output_pitch_temp = PITCH_MID - (signed char)output.pitch;
//output.pitch;
}
else
{
output_pitch_temp = output.pitch;
}
n = write(uart_fd,&output_pitch_temp,1);
if (n < 1)
{
fprintf(stderr,"Incomplete UART Transmission: PITCH VALUE\n");
}
//Roll command and value
n = write(uart_fd,&ROLL_COMMAND,sizeof(ROLL_COMMAND));
if (n < 1)
{
fprintf(stderr,"Incomplete UART Transmission: ROLL_COMMAND\n");
}
if(Controllers_Active)
{
output_roll_temp = ROLL_MID - (signed char)output.roll; //= output.roll;
}
else
{
output_roll_temp = output.roll;
}
n = write(uart_fd,&output_roll_temp,1);
if (n < 1)
{
fprintf(stderr,"Incomplete UART Transmission: ROLL VALUE\n");
}
//Yaw command and value
n = write(uart_fd,&YAW_COMMAND,sizeof(YAW_COMMAND));
if (n < 1)
{
fprintf(stderr,"Incomplete UART Transmission: YAW_COMMAND\n");
}
if(Controllers_Active) // phjones
{
output_yaw_temp = YAW_MID - (signed char) output.yaw; // phjones added
}
else
{
output_yaw_temp = output.yaw;
}
//n = write(uart_fd,&output.yaw,1);
n = write(uart_fd,&output_yaw_temp,1); // phjones added
// fprintf(stderr, "Output_yaw_temp = %u\n", output_yaw_temp);

42 | P a g e
if (n < 1)
{
fprintf(stderr,"Incomplete UART Transmission: YAW VALUE\n");
}
if(Print_to_Screen)
{
fprintf(stderr,"Wrote to UART: \n");
fprintf(stderr,"\tThrottle: %d\n",output.throttle);
fprintf(stderr,"\tPitch: %d\n",output.pitch);
fprintf(stderr,"\tRoll: %d\n",output.roll);
fprintf(stderr,"\tYaw: %d\n",output.yaw);
}
}

43 | P a g e
/*
* File uart_rx_tx.c
* Author: Phillip Jones/Mike Peat
* Date: Spring 2010
*/
///////////////////////////////////////////////////////////////
// //
// File Name: simple_uart_tx_rx.c //
// Author: Phillip Jones //
// //
// Description: Simple program that use the UART port to //
// send and receve data. //
// //
// //
///////////////////////////////////////////////////////////////
#include <stdio.h> /* Standard input/output definitions */
#include <string.h> /* String function definitions */
#include <unistd.h> /* UNIX standard function definitions */
#include <fcntl.h> /* File control definitions */
#include <errno.h> /* Error number definitions */
#include <termios.h> /* POSIX terminal control definitions */
///////////////////////////////////
// Define helper functions start //
///////////////////////////////////
//////////////////////////////////////////////////////////////
// 'open_port()' - Open serial port 1. //
// //
// Returns the file descriptor on success or -1 on error. //
// //
//////////////////////////////////////////////////////////////
int open_port(void)
{
int fd; /* File descriptor for the port */
fd = open("/dev/ttyS0", O_RDWR | O_NDELAY);
//fd = open("/dev/ttyS0", O_RDWR | O_NOCTTY | O_NDELAY);
if (fd == -1)
{
//Could not open the port.
perror("open_port: Unable to open /dev/ttyS0 - ");
return(0);
}
else
{
fcntl(fd, F_SETFL, 0);
}
return(fd);
}
///////////////////////////////////////////////////////////
// Function Name: set_uart_options //

44 | P a g e
// //
//Description: Sets up various UART port attributes //
// //
///////////////////////////////////////////////////////////
void set_uart_options(int fd)
{
struct termios options; // UART port options data structure
// Get the current options for the port...
tcgetattr(fd, &options);
// Set the baud rates to 38400...
cfsetispeed(&options, B38400);
cfsetospeed(&options, B38400);
// Enable the receiver and set local mode...
options.c_cflag |= (CLOCAL | CREAD);
// Set charater size
options.c_cflag &= ~CSIZE; // Mask the character size bits
options.c_cflag |= CS8; // Select 8 data bits
// Set no parity 8N1
options.c_cflag &= ~PARENB;
options.c_cflag &= ~CSTOPB;
options.c_cflag &= ~CSIZE;
options.c_cflag |= CS8;
// Disable Hardware flow control
options.c_cflag &= ~CRTSCTS;
// Use raw input
options.c_lflag &= ~(ICANON | ECHO | ECHOE | ISIG);
// Disable SW flow control
options.c_iflag &= ~(IXON | IXOFF | IXANY);
// Use raw output
options.c_oflag &= ~OPOST;
// Set new options for the port...
tcsetattr(fd, TCSANOW, &options);
}
void read_uart(int fd, char *payload, int length)
{
char *buf; // Pointer into payload buffer
int i;
buf = payload;
// Read from UART one byte at a time
for(i=0; i<length; i++)
{
if(read(fd, (void *)buf, 1) == -1)

45 | P a g e
{
fprintf(stderr,"READ ERROR!!!");
}
buf = buf++;
}
}
void write_uart_single(int fd, char Command, char value)
{
int n = 0; // number of bytes written out of the UART port
n = write(fd,&Command,sizeof(Command));
if (n < (signed int) sizeof(Command))
{
fprintf(stderr,"Incomplete UART Transmission: COMMAND\n");
}
n = write(fd,&value,sizeof(value));
if (n < (signed int) sizeof(value))
{
fprintf(stderr,"Incomplete UART Transmission: VALUE\n");
}
return;
}
void write_uart_FPGA(int fd, char v1, char v2, char v3, char v4)
{
write_uart_single(fd,0xC1,v1);
write_uart_single(fd,0xC2,v2);
write_uart_single(fd,0xC3,v3);
write_uart_single(fd,0xC4,v4);
return;
}
///////////////////////////////////
// Define helper functions end //
///////////////////////////////////
46 | P a g e
// File: data_conversion.c
// By Michael Peat
// Updated 4-16-10
// Coverts wii sensor data to current yaw
#include <math.h>
#include <stdarg.h>
#include <stdio.h>
#include <stdlib.h>
#include <cwiid.h>
#include "data_conversion.h"
#include "out_functions.h"
extern char Print_to_Screen;
extern Output output;
//extern struct cwiid_state *state;
extern cwiid_wiimote_t *wiimote;
DOT_LOCATION current_dot_locations;
HELI_STATE Heli_State;
void Dot_Label(struct cwiid_state *state)
{
short i = 0;
short right_most = 0;
short second_right = 0;
short left_most = 0;
short second_left = 0;
for(i=0; i<4; i++) //runs i 0 to 3
{
if(state->ir_src[i].pos[CWIID_X] <= state-
>ir_src[right_most].pos[CWIID_X])
{
right_most = i;
}
}
if(right_most == 0)
{
second_right = 1; //ensure second_right starts as different index than
right_most
}
for(i=0; i<4; i++) //runs i 0 to 3
{
if(i != right_most)
{
if(state->ir_src[i].pos[CWIID_X] <= state-
>ir_src[second_right].pos[CWIID_X])
{

47 | P a g e
second_right = i;
}
}
}
for(i=0; i<4; i++) //runs i 0 to 3
{
if(state->ir_src[i].pos[CWIID_X] >= state->ir_src[left_most].pos[CWIID_X])
{
left_most = i;
}
}
for(i=0; i<4; i++) //runs i 0 to 3
{
if((i != right_most) && (i != second_right) && (i != left_most))
{
second_left = i;
}
}
//fprintf(stderr,"Pos 3\n");
if(state->ir_src[right_most].pos[CWIID_Y] > state-
>ir_src[second_right].pos[CWIID_Y])
{
current_dot_locations.Front_Left_X = state-
>ir_src[right_most].pos[CWIID_X];
current_dot_locations.Front_Left_Y = state-
>ir_src[right_most].pos[CWIID_Y];
current_dot_locations.Front_Right_X = state-
>ir_src[second_right].pos[CWIID_X];
current_dot_locations.Front_Right_Y = state-
>ir_src[second_right].pos[CWIID_Y];
}
else
{
current_dot_locations.Front_Left_X = state-
>ir_src[second_right].pos[CWIID_X];
current_dot_locations.Front_Left_Y = state-
>ir_src[second_right].pos[CWIID_Y];
current_dot_locations.Front_Right_X = state-
>ir_src[right_most].pos[CWIID_X];
current_dot_locations.Front_Right_Y = state-
>ir_src[right_most].pos[CWIID_Y];
}
if(state->ir_src[left_most].pos[CWIID_Y] > state-
>ir_src[second_left].pos[CWIID_Y])
{

48 | P a g e
current_dot_locations.Back_Left_X = state-
>ir_src[left_most].pos[CWIID_X];
current_dot_locations.Back_Left_Y = state-
>ir_src[left_most].pos[CWIID_Y];
current_dot_locations.Back_Right_X = state-
>ir_src[second_left].pos[CWIID_X];
current_dot_locations.Back_Right_Y = state-
>ir_src[second_left].pos[CWIID_Y];
}
else
{
current_dot_locations.Back_Left_X = state-
>ir_src[second_left].pos[CWIID_X];
current_dot_locations.Back_Left_Y = state-
>ir_src[second_left].pos[CWIID_Y];
current_dot_locations.Back_Right_X = state-
>ir_src[left_most].pos[CWIID_X];
current_dot_locations.Back_Right_Y = state-
>ir_src[left_most].pos[CWIID_Y];
}
//fprintf(stderr,"%d, %d, %d,
%d\n",right_most,second_right,left_most,second_left);
//fprintf(stderr,"(%4d,%4d)\t\t(%4d,%4d)\n\n)",current_dot_locations.Back_Lef
t_X,current_dot_locations.Back_Left_Y,current_dot_locations.Front_Left_X,curr
ent_dot_locations.Front_Left_Y);
//fprintf(stderr,"(%4d,%4d)\t\t(%4d,%4d)\n\n\n\n)",current_dot_locations.Back
_Right_X,current_dot_locations.Back_Right_Y,current_dot_locations.Front_Right
_X,current_dot_locations.Front_Right_Y);
for(i = 0; i < 4; i++)
{
//fprintf(stderr,"IR %d: (%d, %d)",i, state->ir_src[i].pos[CWIID_X], state-
>ir_src[i].pos[CWIID_Y]);
}
//fprintf(stderr,"\n");
//fprintf(stderr,"Front_Left: (%d, %d), Front_Right: (%d, %d) \n",
// current_dot_locations.Front_Left_X,
current_dot_locations.Front_Left_Y,
// current_dot_locations.Front_Right_X,
current_dot_locations.Front_Left_Y);
return;
}
void Yaw_Conversion(void)
{
Heli_State.Yaw = (180.0 / M_PI) *
atan((double)((current_dot_locations.Front_Left_X -
current_dot_locations.Front_Right_X)/ (current_dot_locations.Front_Left_Y -
current_dot_locations.Front_Right_Y + 0.0001) ));
49 | P a g e
if(Print_to_Screen)
{
fprintf(stderr,"Yaw: %2.3f deltaX: %d deltaY:
%d\n",Heli_State.Yaw,(current_dot_locations.Front_Left_X -
current_dot_locations.Front_Right_X),(current_dot_locations.Front_Left_Y -
current_dot_locations.Front_Right_Y));
}
return;
}
//Note that X Center Location will be used for adjusting pitch and Y Center
Location will be used for adjusting roll
void Center_Conversion(void)
{
Heli_State.Center_X = (double)((current_dot_locations.Front_Left_X +
current_dot_locations.Front_Right_X + current_dot_locations.Back_Left_X +
current_dot_locations.Back_Right_X) / 4.0);
Heli_State.Center_Y = (double)((current_dot_locations.Front_Left_Y +
current_dot_locations.Front_Right_Y + current_dot_locations.Back_Left_Y +
current_dot_locations.Back_Right_Y) / 4.0);
if(Print_to_Screen)
{
fprintf(stderr,"Center: (%2.2f, %2.2f)", Heli_State.Center_X,
Heli_State.Center_Y);
}
return;
}
double Perimeter_Conversion(void)
{
float length1;
float length2;
float length3;
float length4;
float perimeter;
length1 = sqrt(pow(fabs((float)(current_dot_locations.Front_Left_X -
current_dot_locations.Front_Right_X)),2) +
pow(fabs((float)(current_dot_locations.Front_Left_Y -
current_dot_locations.Front_Right_Y)),2));
length2 = sqrt(pow(fabs((float)(current_dot_locations.Front_Right_X -
current_dot_locations.Back_Right_X)),2) +
pow(fabs((float)(current_dot_locations.Front_Right_Y -
current_dot_locations.Back_Right_Y)),2));
length3 = sqrt(pow(fabs((float)(current_dot_locations.Back_Right_X -
current_dot_locations.Back_Left_X)),2) +
pow(fabs((float)(current_dot_locations.Back_Right_Y -
current_dot_locations.Back_Left_Y)),2));
length4 = sqrt(pow(fabs((float)(current_dot_locations.Back_Left_X -
current_dot_locations.Front_Left_X)),2) +
pow(fabs((float)(current_dot_locations.Back_Left_Y -
current_dot_locations.Front_Left_Y)),2));
perimeter = length1 + length2 + length3 + length4;
50 | P a g e
//fprintf(stderr,"Perimeter: %2.2f\t\t",perimeter);
return ((double)perimeter);
}
void Height_Conversion(void)
{
double perimeter = 0;
perimeter = Perimeter_Conversion();
Heli_State.Height = (1.23 * pow(10,-6)) * pow(perimeter,3) - 0.0022 *
pow(perimeter,2) + 1.4227 * perimeter - 265.41;
//fprintf(stderr,"Height: %2.2f\n",Heli_State.Height);
return;
}
51 | P a g e
// File: controllers.c
// By Michael Peat
// Updated 4-27-10
// Simple controllers for helicopter stabilization
#include <stdarg.h>
#include <stdio.h>
#include <stdlib.h>
#include <math.h>
#include "data_conversion.h"
#include "out_functions.h"
#include "controllers.h"
extern unsigned char YAW_MID;
extern unsigned char ROLL_MID;
extern unsigned char PITCH_MID;
extern HELI_STATE Heli_State;
extern Output output;
//Variables for Integrator controller
double Accumulated_Roll_Error = 0;
double Accumulated_Pitch_Error = 0;
double Accumulated_Height_Error = 0;
//Variables for Derivative controller
double Previous_Roll_error = 0;
double Previous_Pitch_error = 0;
double Previous_Height_error = 0;
// This is a simple yet very effective proportional yaw controller. Note
that Yaw trim needs to be set for this to function properly.
void yaw_controller(void)
{
float Prop_Const = 1.5;
if((Heli_State.Yaw > 1) || (Heli_State.Yaw < -1))
{
output.yaw = (char)(Prop_Const * Heli_State.Yaw); // phjones removed =+
}
// fprintf(stderr,"Yaw: %2.3f, Control:
%d\n",Heli_State.Yaw,(char)(Prop_Const * Heli_State.Yaw));
//fprintf(stderr,"Yaw: %2.3f, Control: %d, output_yaw :
%d\n",Heli_State.Yaw,(char)(Prop_Const * Heli_State.Yaw), (signed char)
output.yaw); // phjones added output.yaw
return;
}
// This is a PID controller for the Roll of the helicopter. Since we have no
actual measure of the current roll, we are
// controlling the roll of the helicopter based on the error from the optimal
Center_Y
void roll_controller(void)
{
float Prop_Const = 0.125;//0.25//0.1302 is max value for a roll range of +-
50 from center (100/768)
float Integrator_Const = 0.00125;//0.001875;//0.00125;//0.0025;
float Diff_Const = 0.00;

52 | P a g e
double error = 0;
//fprintf(stderr,"Accum:%2.5f",Accumulated_Roll_Error);
error = Heli_State.Center_Y - OPTIMAL_CENTER_Y;
if((error > 0.1) || (error < -0.1))
{
// PID controller
output.roll = (char)( (Prop_Const * error) + (Integrator_Const * error
* 0.01 + Accumulated_Roll_Error) + ( Diff_Const * (error -
Previous_Roll_error) / 0.01) );
Accumulated_Roll_Error = Accumulated_Roll_Error + Integrator_Const *
error * 0.01;
Previous_Roll_error = error;
//END OF PID CTRL
}
else
{
output.roll = 0;
}
//fprintf(stderr,"Error: %2.2f, Control: %2.2f, output_roll :
%d\n",error,(Prop_Const * error), (signed char) output.roll);
//fprintf(stderr,"Error: %2.2f,Accum.Error: %2.5f
\n",error,Accumulated_Roll_Error);
//fprintf(stderr,"(%2.2f,",error);
return;
}
// This is a PID controller for the Pitch of the helicopter. Since we have
no actual measure of the current pitch, we are
// controlling the pitch of the helicopter based on the error from the
optimal Center_X
void pitch_controller(void)
{
float Prop_Const = 0.0075;//0.005;//0.01//0.09765 is max value for a pitch
range of +-50 from center (100/1024)
float Integrator_Const = 0.001;//0.00175//0.001875;//0.00125;//0.0025
float Diff_Const = 0.00;
double error = 0;
error = Heli_State.Center_X - OPTIMAL_CENTER_X;
if((error > 0.1) || (error < -0.1))
{
//output.pitch = (char)(Prop_Const * error);
output.pitch = (char)( (Prop_Const * error) + (Integrator_Const * error
* 0.01 + Accumulated_Pitch_Error) + ( Diff_Const * (error -
Previous_Pitch_error) / 0.01) );
Accumulated_Pitch_Error = Accumulated_Pitch_Error + Integrator_Const *
error * 0.01;
Previous_Pitch_error = error;
}

53 | P a g e
else
{
output.pitch = 0;
}
//fprintf(stderr,"Error: %2.2f, Accumulated:
%2.2f\n",error,Accumulated_Pitch_Error);
//fprintf(stderr," %2.2f)\n",error);
return;
}
// This is a PID controller for the Throttle of the helicopter. Since we
have no actual measure of the current throttle, we are
// controlling the throttle of the helicopter based on the error from the
Height state and the Height Set Pt. Please note that this
// is a piecewise PID controller, meaning that the control given is different
based on whether the error is positive or negative.
// This is necessary so that the controller is not reinforcing the
gravitational pull on the helicopter by cutting its power beyond
// that needed for hovering.
void throttle_controller(void)
{
float Prop_Const = 3.0;//2.5;//1.75//1.3
float Integrator_Const = 0.00;
float Diff_Const = 0.1;//0.2;//0.1;//0.05;
double error = 0;
error = Heli_State.Height - HEIGHT_SET_PT;
if(error < 0)
{
output.throttle = (char)((Prop_Const * error) + (Integrator_Const *
error * 0.01 + Accumulated_Height_Error) + ( Diff_Const * (error -
Previous_Height_error) / 0.01) );
//fprintf(stderr,"Error: %2.2f, Diff: %2.5f\n",error,( Diff_Const *
(error - Previous_Height_error) / 0.01));
fprintf(stderr,"Error: %2.2f, Height: %2.2f , Control: %d \n" , error ,
Heli_State.Height , (signed char) output.throttle );
Accumulated_Height_Error = Accumulated_Height_Error + Integrator_Const *
error * 0.01;
Previous_Height_error = error;
}
else
{
output.throttle = 0;//note, this says that the control is 0, meaning the
UART value will be the set THROTTLE_STICK_MIDPOINT
}
//fprintf(stderr,"Error: %2.2f, Diff: %2.5f\n",error,( Diff_Const * (error
- Previous_Height_error) / 0.01));
return;
}

54 | P a g e
Appendix 3: XBOX Flight Control mapping

55 | P a g e
Appendix 4: Current Header Files
//Header file for xbox_control_3.c located in Helicopter_Wii_Demo_* files
//Created by Michael Peat
//Spring 2010
#ifndef _XBOX_CONTROL_H
#define _XBOX_CONTROL_H
#include <stdio.h>
#include <stdlib.h>
#include <sys/ioctl.h>
#include <sys/types.h>
#include <linux/input.h>
#include <math.h>
#include <sys/stat.h>
#include <fcntl.h>
#include <pthread.h>
#include <unistd.h>
#include <sys/types.h>
#include <sys/socket.h>
#include <netinet/ip.h>
#include <string.h>
#define JS_EVENT_BUTTON 0x01 /* button pressed/released */
#define JS_EVENT_AXIS 0x02 /* joystick moved */
#define JS_EVENT_INIT 0x80 /* initial state of device */
// Masks for button_mask_1
#define XBOX_BUTTON_MASK_A 0x0001 // 0000000000000001
#define XBOX_BUTTON_MASK_B 0x0002 // 0000000000000010
#define XBOX_BUTTON_MASK_X 0x0004 // 0000000000000100
#define XBOX_BUTTON_MASK_Y 0x0008 // 0000000000001000
#define XBOX_BUTTON_MASK_BLACK 0x0010 //
0000000000010000
#define XBOX_BUTTON_MASK_WHITE 0x0020 //
0000000000100000
#define XBOX_BUTTON_MASK_BACK 0x0040 // 0000000001000000
#define XBOX_BUTTON_MASK_START 0x0080 //
0000000010000000
#define XBOX_BUTTON_MASK_UP 0x0100 // 0000000100000000
#define XBOX_BUTTON_MASK_DOWN 0x0200 // 0000001000000000
#define XBOX_BUTTON_MASK_LEFT 0x0400 // 0000010000000000
#define XBOX_BUTTON_MASK_RIGHT 0x0800 //
0000100000000000
#define XBOX_BUTTON_MASK_LSTICK 0x1000 //
0001000000000000
#define XBOX_BUTTON_MASK_RSTICK 0x2000 //
0010000000000000
#define XBOX_BUTTON_A 0
#define XBOX_BUTTON_B 1
#define XBOX_BUTTON_X 2

56 | P a g e
#define XBOX_BUTTON_Y 3
#define XBOX_BUTTON_BLACK 4
#define XBOX_BUTTON_WHITE 5
#define XBOX_BUTTON_START 6
#define XBOX_BUTTON_BACK 7
#define XBOX_BUTTON_LEFT_STICK 8
#define XBOX_BUTTON_RIGHT_STICK 9
struct js_event
{
__u32 time; /* event timestamp in milliseconds */
__s16 value; /* value */
__u8 type; /* event type */
__u8 number; /* axis/button number */
};
typedef struct
{
short left_analog_x;
short left_analog_y;
short right_analog_x;
short right_analog_y;
short left_trigger;
short right_trigger;
short buttons;
} xbox_controller_t;
typedef struct
{
int fd;
__u32 old_time;
xbox_controller_t state;
}joystick;
/* Functions */
int xbox_init(void);
int controller(void);
#endif

57 | P a g e
//Header file for out_functions.c located in Helicopter_Wii_Demo_* files
//Created by Michael Peat
//Spring 2010
#ifndef _OUT_FUNCTIONS_H
#define _OUT_FUNCTIONS_H
#include <sys/time.h>
#define THROTTLE_MIN 0
#define THROTTLE_STICK_MIDPOINT 155//150//175//145
#define THROTTLE_MAX 255
//THESE DEFINES FROM PREVIOUS VERSION: THEY ARE NOW GLOBABL VARIABLES DEFINED
IN
//out_functions.c
//#define PITCH_MIN 0 //actually the min for the middle value now
//#define PITCH_MID 128
//#define PITCH_MAX 255 //actually the max for the middle value now
//#define ROLL_MIN 0 //actually the min for the middle value now
//#define ROLL_MID 128
//#define ROLL_MAX 255 //actually the max for the middle value now
//#define YAW_MIN 0
//#define YAW_MID 128
//#define YAW_MAX 255
//#define SENSITIVITY 3 //Higher number means less sensitive to xbox
controller sticks
//#define THROTTLE_YAW_RATE 2 //higher number makes throttle and yaw update
slower.
#define FALSE 0
#define TRUE 1
/* THESE DEFINES NO LONGER USED
#define THROTTLE_COMMAND 0xC1
#define PITCH_COMMAND 0xC2
#define ROLL_COMMAND 0xC3
#define YAW_COMMAND 0xC4
*/
/* This struct holds the output values which will be used for sending to the
UART
* When the computer controllers are active, the throttle, pitch, roll, and
yaw variables
* are used to store the control value calculated in the appropriate function
found in controllers.c
* The new_press array says whether a previous button press has been handled
before allowing
* the same button to register again. Checking the Xbox button state caused
buttons to be
* continuously locked on because the code only toggled the state with each
event received in
* the joystick file associated with the xbox controller. Sometimes button
presses can still be
* missed, but now the buttons never get stuck on.
*/

58 | P a g e
typedef struct
{
FILE * fd;
unsigned char throttle;
unsigned char pitch;
unsigned char roll;
unsigned char yaw;
unsigned char kill_switch;
unsigned char new_press[11];
}Output;
/* This structure is used to hold all variables associated with keeping track
of the system time
* and a makeshift real time handling system. There are extra variables in
this struct now as
* the way the main function was written has been changed.
*/
typedef struct
{
struct timeval Tp;
unsigned long long Start;
unsigned long long End;
unsigned long long Temp;
unsigned long long Temp2;
unsigned long long Temp3;
unsigned long long Temp4;
double Total;
double Current;
double Current2;
double Current3;
}TIME;
//Prototype functions for functions in out_functions.c
int output_init(char *path);
void output_transform(void);
void output_file_write(void);
void output_uart_write(int uart_fd);
#endif

59 | P a g e
#ifndef _UART_RX_TX_H
#define _UART_RX_TX_H
#include <stdio.h> /* Standard input/output definitions */
#include <string.h> /* String function definitions */
#include <unistd.h> /* UNIX standard function definitions */
#include <fcntl.h> /* File control definitions */
#include <errno.h> /* Error number definitions */
#include <termios.h> /* POSIX terminal control definitions */
int open_port(void);
void set_uart_options(int fd);
void read_uart(int fd, char *payload, int length);
void write_uart_single(int fd, char Command, char value);
void write_uart_FPGA(int fd, char v1, char v2, char v3, char v4);
#endif
60 | P a g e
//Header file for data_conversion.c located in Helicopter_Wii_Demo_* files
//Created by Michael Peat
//Spring 2010
#ifndef _DATA_CONVERSION_H
#define _DATA_CONVERSION_H
#include <cwiid.h>
/* This struct is used to store all the dot locations which are sorted once
* each 10ms. This guarantees the values we use do not change in the middle
* of the control sequence, and also labels which dot is which.
* Note that these names are in the orientation of the helicopter using the
* original X and Y returned from the wii IR data
*/
typedef struct
{
signed int Front_Left_X;
signed int Front_Left_Y;
signed int Front_Right_X;
signed int Front_Right_Y;
signed int Back_Left_Y;
signed int Back_Left_X;
signed int Back_Right_Y;
signed int Back_Right_X;
}DOT_LOCATION;
/* This struct is used to store all the current states we are converting the
* wii data into. These states are then used to figure the errors for the
* controllers.
*/
typedef struct
{
double Yaw;
double Center_X;
double Center_Y;
double Height;
}HELI_STATE;
//Prototype functions for functions in data_conversion.c
void Dot_Label(struct cwiid_state *state);
void Yaw_Conversion(void);
void Center_Conversion(void);
double Perimeter_Conversion(void);
void Height_Conversion(void);
#endif

61 | P a g e
//Header file for controllers.c located in Helicopter_Wii_Demo_* files
//Created by Michael Peat
//Spring 2010
#ifndef _CONTROLLERS_H
#define _CONTROLLERS_H
#define OPTIMAL_CENTER_Y 384 //center y location in pixels
#define OPTIMAL_CENTER_X 512 //center x location in pixels
#define HEIGHT_SET_PT 30.0 //this is in inches from the floor to the bottom
of the helicopter
//Prototype functions for functions found in controllers.c
void yaw_controller(void);
void roll_controller(void);
void pitch_controller(void);
void throttle_controller(void);
#endif

62 | P a g e
Appendix 5: Current Matlab Scripts for Data Analysis
function [dataF,B,A] = accelFilt( data , order , cutoff )
%accelFilt:
%
%Use:
% To filter the accelerometer data of a data set and compare the results
% to the unfiltered raw data.
%
% *If 'order' and 'cutoff' not specified, a set of defaults is used.
%
% **Angles only accurate assuming center of mass has 0 acceleration in a
% standard inertial reference frame.
%
%Syntax:
%
% (1):
% [dataF,B,A] = accelFilt( data , order , cutoff );
% (2):
% [dataF] = accelFilt( data , order , cutoff);
%
%Inputs:
%
%(Required):
% 'data' is a Wii data set in the format produced by MicroCART wmdemo
%(Optional):
% 'order' is cheby1 IIR filter order
% 'cutoff' is from 0 to 1 , 1 corresponding to 1/2 sampling frequency
%
%Outputs:
%(Data):
% (Required):
% 'dataF' is the data set with x y and z accelerations filtered
% (Optional):
% 'B' is the filter numerator coefficients (z transform)
% 'A' is the filter denominator coefficients (z transform)
%(Figures):
% (1): Subplot showing x,y,z filtered VS original accelerations as well
% as pitch and roll calculated from the original and filtered accels
%
%Custom Function Call Info:
%
% Currently Calls: none
% Currently Called by: none
%
%Author(s):
%
% Matt Rich
%%
if nargin == 1 %these defaults seem to be very well working
order = 2;
cutoff = 0.05;
end
%% col # assignments
tcol=1;
xcol=2;
ycol=3;
zcol=4;
%%
t = data(:,tcol);
x = data(:,xcol);
y = data(:,ycol);
z = data(:,zcol);
r = 180/pi*atan(z./sqrt(y.^2 + x.^2));
p = 180/pi*atan(y./sqrt(x.^2 + z.^2));

63 | P a g e
%%
[B,A] = cheby1(order,0.5,cutoff);
x2 = filter(B,A,x);
y2 = filter(B,A,y);
z2 = filter(B,A,z);
r2 = 180/pi*atan(z2./sqrt(y2.^2 + x2.^2));
p2 = 180/pi*atan(y2./sqrt(x2.^2 + z2.^2));
dataF = data;
dataF(:,xcol) = x2;
dataF(:,ycol) = y2;
dataF(:,zcol) = z2;
%%
figure;
subplot(5,1,1)
plot(t,x,'r'); hold on; plot(t,x2); grid; hold off;
title('X acceleration'); legend('Original','Filtered');
ylabel('accel (g/25)');
subplot(5,1,2)
plot(t,y,'r'); hold on; plot(t,y2); grid; hold off;
title('Y acceleration'); %legend('Original','Filtered');
ylabel('accel (g/25)');
subplot(5,1,3)
plot(t,z,'r'); hold on; plot(t,z2); grid; hold off;
title('Z acceleration'); %legend('Original','Filtered');
ylabel('accel (g/25)');
subplot(5,1,4)
plot(t,r,'r'); hold on; plot(t,r2); grid; hold off;
title('Roll'); %legend('Original','Filtered');
ylabel('angle (deg)');
subplot(5,1,5)
plot(t,p,'r'); hold on; plot(t,p2); grid; hold off;
title('Pitch'); %legend('Original','Filtered');
xlabel('Time (ms)'); ylabel('angle (deg)');
%%
end

64 | P a g e
function [] = accelPlot( data )
%accelPlot:
%
%Use:
% To show the raw accelerometer data and angles calculated from it.
%
% *Angles only accurate assuming center of mass has 0 acceleration in a
% standard inertial reference frame.
%
%Syntax:
%
%(1):
% accelPlot( data );
%
%Inputs:
%
%(Required):
% 'data' is a Wii data set in the format produced by MicroCART wmdemo
%(Optional):
% none
%
%Outputs:
%
%(Data):
% none
%(Figures):
% (1): Plot of raw accelerometer data as well as pitch and roll angles
% calculated off of these.
%
%Custom Function Call Info:
%
% Currently Calls: none
% Currently Called by: none
%
%Author(s):
%
% Matt Rich
%%
tcol=1;
xcol=2;
ycol=3;
zcol=4;
%%
t = data(:,tcol);
x = data(:,xcol);
y = data(:,ycol);
z = data(:,zcol);
r = 180/pi*atan(z./sqrt(y.^2 + x.^2));
p = 180/pi*atan(y./sqrt(x.^2 + z.^2));
%%
figure
subplot(5,1,1)
plot(t,x);
title('X acceleration');
ylabel('accel (g/25)');
subplot(5,1,2)
plot(t,y);
title('Y acceleration');
ylabel('accel (g/25)');
subplot(5,1,3)
plot(t,z);
title('Z acceleration');
ylabel('accel (g/25)');
subplot(5,1,4)
plot(t,r);
title('Roll');
ylabel('angle (deg)');

65 | P a g e
subplot(5,1,5)
plot(t,p);
title('Pitch');
xlabel('Time (ms)'); ylabel('angle (deg)');
%%
end

66 | P a g e
function [] = accelSpect( dataOriginal, dataFiltered, B, A )
%accelSpect:
%
%Use:
% To analyze the spectral properties of the accelerometer data both pre
% and post filtered, as well as the filter itself.
%
%Syntax:
%
%(1):
% accelSpect( dataOriginal, dataFiltered, B, A );
%
%Inputs:
%
%(Required):
% 'dataOriginal' is an original unfiltered data set
% (the corresponding input to accelFilt.m)
% 'dataFiltered' is a data set with filterd accelerations
% (from accelFilt.m)
% 'B' is the filter numerator coefficients (z transform)
% (from accelFilt.m)
% 'A' is the filter denominator coefficients (z transform)
% (from accelFilt.m)
%(Optional):
% none
%
%Outputs:
%
%(Data):
% none
%(Figures):
% (1): Subplot of the approximate spectrums of each x,y,z acceleration
% reading both pre and post filtered, as well as the magnitude and
% phase information for the filter used.
%
%Custom Function Call Info:
%
% Currently Calls: fftPlot.m
% Currently Called by: none
%
%Author(s):
%
% Matt Rich
%%
tcol=1;
xcol=2;
ycol=3;
zcol=4;
%%
t = dataOriginal(:,tcol);
x = dataOriginal(:,xcol);
y = dataOriginal(:,ycol);
z = dataOriginal(:,zcol);
t2 = dataFiltered(:,tcol);
x2 = dataFiltered(:,xcol);
y2 = dataFiltered(:,ycol);
z2 = dataFiltered(:,zcol);
X = fft(x);
Y = fft(y);
Z = fft(z);
X2 = fft(x2);
Y2 = fft(y2);
Z2 = fft(z2);
H = freqz(B,A);

67 | P a g e
H = [conj(H(end:-1:1));H];
%% call to vectorDelta.m
%fs = 1/mean(vectorDelta(t)); % average sampling rate (for fftplot.m)
%%
L = max(t)/1000; %duration of signal in seconds (for fftplot.m)
fs1 = length(t)/L; %approximate average sampling rate (for fftplot.m)
%EXACT if sampling rate uniform
fs2 = length(t2)/L;
%%
figure
subplot(5,1,1)
fftPlot(X,L,fs1,'r'); hold on;
fftPlot(X2,L,fs2); hold off;
axis([ -fs1/2 fs1/2 0 3 ]) %fs1 and fs2 will be nearly identical anyway
title('X Spectrums')
legend('Original','Filtered')
subplot(5,1,2)
fftPlot(Y,L,fs1,'r'); hold on;
fftPlot(Y2,L,fs2); hold off;
axis([ -fs1/2 fs1/2 0 3 ]) %fs1 and fs2 will be nearly identical anyway
title('Y Spectrums')
subplot(5,1,3)
fftPlot(Z,L,fs1,'r'); hold on;
fftPlot(Z2,L,fs2); hold off;
axis([ -fs1/2 fs1/2 0 3 ]) %fs1 and fs2 will be nearly identical anyway
title('Z Spectrums')
%frequency axis for filter, normalized to match spectrums
F = fs1/2*[-length(H)/2+1:length(H)/2]/(length(H)/2);
subplot(5,1,4)
plot(F,abs(H),'k')
ylabel('Filter Magnitude')
xlabel('frequency (Hz)')
title('Filter Fequency Response (Magnitude)')
axis([ -fs1/2 fs1/2 0 3 ])
subplot(5,1,5)
plot(F,180/pi*angle(H),'k')
ylabel('Filter Phase (deg)')
xlabel('frequency (Hz)')
title('Filter Frequency Response (Phase)')
axis([ -fs1/2 fs1/2 -360 360 ])
end
68 | P a g e
function [ accelSum ] = accelSum( data )
%accelSum:
%
%Use:
% To show the sum of the acceleration readings on all three axes of the
% accelerometer output (if unfiltered) or the sum of all three filtered
% readings, hopefully indicating the presence or absence of a net
% acceleration in a standard inertial reference frame.
%
%Syntax:
%
%(1):
% [ accelSum ] = accelSum( data );
%
%Inputs:
%
%(Required):
% 'data' is a Wii data set in the format produced by MicroCART wmdemo
%(Optional):
% none
%
%Outputs:
%
%(Data):
% 'accelSum' is the |vector sum| of all three axes of the accelerometer
%(Figures):
% (1): Plot of 'accelSum' VS time.
%
%Custom Function Call Info:
%
% Currently Calls: none
% Currently Called by: none
%
%Author(s):
%
% Matt Rich
%%
tcol=1;
xcol=2;
ycol=3;
zcol=4;
%%
t = data(:,tcol);
x = data(:,xcol);
y = data(:,ycol);
z = data(:,zcol);
%%
accelSum = sqrt(x.^2+y.^2+z.^2);
figure;
plot(t,accelSum,'x'); hold on;
lsline;
hold off;
legend('Sum','Least Sq. Line');
title('Sum of XYZ accels VS Time');
ylabel('Sum (g/25)');
xlabel('Time (ms)');
grid;
end
69 | P a g e
function [ superData ] = dataCat( varargin )
%dataCat:
%
%Use:
% To concatenate any number of data sets into one large date set with
% timestamp continuity.
%
% *Format of output data set is the same as all input sets in general,
% only larger.
%
%Syntax:
%
%(1):
% [ superData ] = dataCat( varargin );
%
%Inputs:
%
%(Required):
% Any number of data sets equal or greater than one can be entered.
% Each 'data' is a data set in the format produced by MicroCART wmdemo.
%(Optional):
% none
%
%Outputs:
%
%(Data):
% 'superData' is the vertical concatenation of all data sets input in the
% order they were input with a timestamp progressing as though all the
% data were from one continuous set.
%
%(Figures):
% none
%Custom Function Call Info:
%
% Currently Calls: dataFix.m
% Currently Called by: none
%
%Author(s):
%
% Matt Rich
%%
%% call on dataFix.m function
for k = 1:nargin
varargin{k} = dataFix(varargin{k});
end
%%
superData = varargin{1};
for k = 2:nargin
varargin{k}(:,1) = varargin{k}(:,1)+varargin{k-1}(end,1);
superData = [superData ; varargin{k}];
end
end

70 | P a g e
function [ dataFixed ] = dataFix( data )
%dataFix:
%
%Use:
% To fix the possible problem of having extra data on the end of a set
% where the timestamp has reset itself.
%
% *If there are no such problems with the data set, nothing is done.
%
%Syntax:
%
%(1):
% [ dataFixed ] = dataFix( data );
%
%Inputs:
%
%(Required):
% 'data' is a Wii data set in the format produced by MicroCART wmdemo
%(Optional):
% none
%
%Outputs:
%
%(Data):
% 'dataFixed' is the data set with any rows on the end with timestamps
% less than the previous timestamp removed.
%(Figures):
% none
%
%Custom Function Call Info:
%
% Currently Calls: none
% Currently Called by: dataFixAll.m
% dataLoad.m
% dataCat.m
% dataReform.m
%
%Author(s):
%
% Matt Rich
%%
t = data(:,1);
last = length(t);
% currently assumes no more than ten will ever be screwed up
% have only ever seen at most three, so this should work
for k = length(t)-10:length(t)
if t(k) <= t(k-1)
last = k-1;
break
end
end
dataFixed = data(1:last,:);
end
71 | P a g e
%dataFixAll:
%
%Use:
% To fix the possible problem of having extra data on the end of a set
% where the timestamp has reset itself for a group of several data sets.
%
% *If there are no such problems a data set, nothing is done to it.
%
% **Runs on ALL variables in the current Workspace, so if non data set
% variables are present this will cause an error.
%
% ***The functionality of this script is already included in dataLoad.m,
% i.e. when loading a number of data sets with dataLoad.m each will
% already be fixed by the time it reaches the Workspace. Hence using
% dataLoad.m saves time and possible Workspace issues. Use dataFix.m for
% individual sets not already fixed among other variables.
%
%Syntax:
%
%(1):
% dataFixAll;
%
%Custom Function Call Info:
%
% Currently Calls: dataFix.m
% Currently Called by: none
%
%Author(s):
%
% Matt Rich
%%
DATAS = who; %assignes names of all data sets in Workspace to a cell array
for k = 1:length(DATAS) %passes each through dataFix.m
%% call on dataFix.m
eval([DATAS{k},'=dataFix(',DATAS{k},');']);
%%
end
clear DATAS k %clears the leftover internal variables
72 | P a g e
%dataLoad:
%
%Use:
% To load a number of data set files all at once from a given directory.
%
% *Will automatically run dataFix.m on all incoming data sets.
%
% **Will try and load ALL files so make sure only data set files are in
% the directory you choose! To load a single file use MATLAB default
% load command with dataFix.m, e.g. dataSet = dataFix(load(dataFile));
%
% ***Will not work for file names that contain special characters not
% allows in MATLAB variable names. File names starting with numbers are
% also not allowed, however these will be automatically fixed and a
% notification sent to the Command Window.
%
%Syntax:
%
%(1):
% dataLoad;
% (then choose a directory in the GUI window)
%
%Custom Function Call Info:
%
% Currently Calls: dataFix.m
% Currently Called by: none
%
%Author(s):
%
% Matt Rich
%%
path = uigetdir;
files = dir(path);
fileIndex = find(~[files.isdir]);
for k = 1:length(fileIndex)
fileName = files(fileIndex(k)).name;
dataTemp = load([path,'\',fileName]);
%% call on dataFix.m
if isvarname(fileName(1:end-4)) %check to make sure it is a valid name
eval([fileName(1:end-4),'=dataFix(dataTemp);']);
else %if name is invalid, append an 'a' to the front to fix
eval(['a',fileName(1:end-4),'=dataFix(dataTemp);']);
disp([fileName(1:end-4),' has been renamed a',fileName(1:end-4),...
' to be a valid MATLAB variable name.']);
end
%%
end
%clears the leftover internal variables
clear path files fileIndex k fileName dataTemp

73 | P a g e
function [ dataR ] = dataReform( data )
%dataReform:
%
%Use:
% To transform a data set so that it has an artificial uniform sampling
% rate.
%
% *This is accomplished through non-uniform up-sampling based on the
% approximate number of times each present sampling interval can be
% divided by the minimum present sampling interval.
%
% **This adds quite a large amount of redundant data to the set and
% usually makes it artificially longer in samples (& equivalent time) by
% a short interval.
% (The exact percentage increase is output to the Command Window)
%
% ***The additional data is essentially Zero Order Hold in nature.
%
%Syntax:
%
%(1):
% [dataR] = dataReform( data );
%
%Inputs:
%
%(Required):
% 'data' is a Wii data set in the format produced by MicroCART wmdemo
%(Optional):
% none
%
%Outputs:
%
%(Data):
% 'dataR' is the data with an artificial uniform sampling rate.
%(Figures):
% none
%
%Custom Function Call Info:
%
% Currently Calls: vectorDelta.m
% Currently Called by: none
%
%Author(s):
%
% Matt Rich
%%
%%
tcol=1;
%% call on dataFix.m function
data = dataFix(data);
%%
t = data(:,tcol);
%% call on delta.m function
dt = vectorDelta(t); % dt has 1 fewer elements than t
%%
mindt = min(dt); %minimum step size between elements in t
fills = ceil(dt./mindt); %has as many elements as dt
L = sum(fills);
t2 = [1:L]*mindt;
dataR=[];

74 | P a g e
for k = 1:length(fills)
addOn = [];
for q = 1:fills(k)
addOn = [addOn ; data(k,:)];
end
dataR = [dataR ; addOn];
end
dataR(:,1) = t2;
overage = (max(t2)-max(t))/max(t);
disp(['Output is ',num2str(overage*100),' % longer.']);
end
75 | P a g e
function [] = dataSampInfo( data )
%dataSampInfo:
%
%Use:
% To analyze the time/sampling properties of a data set.
%
%Syntax:
%
%(1):
% dataSampInfo( data );
%
%Inputs:
%
%(Required):
% 'data' is a Wii data set in the format produced by MicroCART wmdemo
%(Optional):
% none
%
%Outputs:
%
%(Data):
% none
%(Figures):
% (1): Plot of Timestamp Vector as a function of Samples
% (2): Subplot of Occurrences VS Values for Sampling Period and Frequency
% Including statistical desctriptions on plot
% (3): Subplot of Timestamp Vector , Sampling Period and Frequency as
% functions of samples
%
%Custom Function Call Info:
%
% Currently Calls: vectorDelta.m
% Currently Called by: none
%
%Author(s):
%
% Matt Rich
%%
tcol=1;
xcol=2;
ycol=3;
zcol=4;
%%
t = data(:,tcol);
x = data(:,xcol);
y = data(:,ycol);
z = data(:,zcol);
figure;
plot(1:length(t),t,'.k');
grid;
ylabel('Time (ms)');
xlabel('Samples');
title('Timestamp Vector');
dt = vectorDelta(t);
figure;
subplot(2,1,1);
[HT,XT]=hist(dt/1000,sort(dt/1000));
plot(XT,HT,'.');
xlabel('Sampling Intervals (sec)');
ylabel('Number of Occurrences');
title(['T_s Disribution: MAX = ',num2str(max(dt/1000)),...
' MIN = ',num2str(min(dt/1000)),' MEAN = ',num2str(mean(dt/1000)),...
' MODE = ',num2str(mode(dt/1000)),' MED. = ',...
num2str(median(dt/1000)),' ST.DEV. = ',num2str(std(dt/1000))]);
subplot(2,1,2);

76 | P a g e
[Hf,Xf]=hist(1000./dt,sort(1000./dt));
plot(Xf,Hf,'.r');
xlabel('Sampling Frequency (Hz)');
ylabel('Number of Occurrences');
title(['f_s Distribution: MAX = ',num2str(max(1000./dt)),...
' MIN = ',num2str(min(1000./dt)),' MEAN = ',num2str(mean(1000./dt)),...
' MODE = ',num2str(mode(1000./dt)),' MED. = ',...
num2str(median(1000./dt)),' ST.DEV. = ',num2str(std(1000./dt))]);
figure;
subplot(3,1,1);
plot(1:length(t),t/1000,'.k');
ylabel('Time (sec)');
xlabel('Samples');
title('Timestamp Vector');
subplot(3,1,2);
plot(2:length(t),dt/1000,'.b');
ylabel('Interval (sec)');
xlabel('Samples');
title('Sampling Interval Sizes');
subplot(3,1,3);
plot(2:length(t),1000./dt,'.r');
ylabel('Freq. (Hz)')
xlabel('Samples');
end

77 | P a g e
function [] = fftPlot( X , t , fs , plotOptions )
%fftPlot:
%
%Use:
% To plot the data resulting from the Fast Fourier Transform of a vector
% in a form more resembling a standard spectrum.
%
% *This is specifically geared towards applications where the vector the
% FFT was taken for was actually a set of samples of a real continuous
% time signal, or at least meant to mimic such a set of samples. Hence
% the spectrum mimics a standard Continuous Time Fourier Transform.
%
%Syntax:
%
%(1):
% fftPlot( X , t , fs , plotOptions );
%
%Inputs:
%
%(Required):
% 'X' is the FFT to be plotted, e.g. fft(x) : x is signal/vector
% 't' is the time duration of the time domain signal, e.g. 1 second
% 'fs' is the sampling frequency for the time domain signal, e.g. 1000 Hz
%(Optional):
% 'plotOptions' is a string detailing how to plot the data following the
% exact same syntax as the normal plot command.
%
%Outputs:
%
%(Data):
% none
%(Figures):
% (1): Plot of the FFT 'X' reformatted to mimic a CTFT spectrum
%
%Custom Function Call Info:
%
% Currently Calls: none
% Currently Called by: accelSpect.m
%
%Author(s):
%
% Matt Rich
%%
N = t*fs; %the length of the signal in samples
F = ([-N/2:N/2-1]/N)*fs; %frequency axis for plotting FFTs (Hz)
if nargin == 4
plot(F,fftshift(abs(X))/N,plotOptions) %fft made to imitate spectrum
else
plot(F,fftshift(abs(X))/N) %fft made to imitate spectrum
end
xlabel('frequency (Hz)')
ylabel('|FFT/N|')
end

78 | P a g e
function [] = inputPlot( dataInputs )
%inputPlot:
%
%Use:
% To show the inputs VS time given to the system during a test.
%
%Syntax:
%
%(1):
% inputPlot( dataInputs );
%
%Inputs:
%
%(Required):
% 'dataInputs' is a MicroCART input log data set
%(Optional):
% none
%
%Outputs:
%
%(Data):
% none
%(Figures):
% (1): Plot of each Input VS Time.
%
%Custom Function Call Info:
%
% Currently Calls: none
% Currently Called by: none
%
%Author(s):
%
% Matt Rich
%%
tcol=1;
throttlecol = 2;
pitchcol = 3;
rollcol = 4;
yawcol = 5;
killcol = 6;
%%
t = dataInputs(:,tcol);
throttle = dataInputs(:,throttlecol);
pitch = dataInputs(:,pitchcol);
roll = dataInputs(:,rollcol);
yaw = dataInputs(:,yawcol);
kill = dataInputs(:,killcol);
%%
figure;
subplot(4,1,1);
plot(t,throttle);
title('Throttle Input VS Time');
subplot(4,1,2);
plot(t,pitch);
title('Pitch Input VS Time');
subplot(4,1,3);
plot(t,roll);
title('Roll Input VS Time');
subplot(4,1,4);
plot(t,yaw);
title('Yaw Input VS Time');
xlabel('Time (ms)');
end

79 | P a g e
function [ constellationArea ] = irArea( data )
%irArea:
%
%Use:
% To calculate and the viewed area of the constellation seen
% by the IR camera.
%
% *The area is currently calculated assuming the constellation is
% rectangular, by taking the product of all 4 pairs of adjacent sides and
% averaging the results.
%
%Syntax:
%
%(1):
% [constellationArea] = irArea( data );
%
%Inputs:
%
%(Required):
% 'data' is a Wii data set in the format produced by MicroCART wmdemo
%(Optional):
% none
%
%Outputs:
%
%(Data):
% 'constellationArea' is the area in pixels^2 of the constellation as
% veiwed by the IR camera.
%(Figures):
% (1): Plot of 'constellationArea' VS Time
%
%Custom Function Call Info:
%
% Currently Calls: none
% Currently Called by: none
%
%Author(s):
%
% Matt Rich
%%
tcol=1;
irAxcol=6; %ranges 0 to 1024
irAycol=7; %ranges 0 to 768
irBxcol=10; %ranges 0 to 1024
irBycol=11; %ranges 0 to 768
irCxcol=14; %ranges 0 to 1024
irCycol=15; %ranges 0 to 768
irDxcol=18; %ranges 0 to 1024
irDycol=19; %ranges 0 to 768
%%
t = data(:,tcol);
irAx = data(:,irAxcol);
irAy = data(:,irAycol);
irBx = data(:,irBxcol);
irBy = data(:,irBycol);
irCx = data(:,irCxcol);
irCy = data(:,irCycol);
irDx = data(:,irDxcol);
irDy = data(:,irDycol);
%%
A = [ irAx , irAy ];

80 | P a g e
B = [ irBx , irBy ];
C = [ irCx , irCy ];
D = [ irDx , irDy ];
%%
Corners{1} = A;
Corners{2} = B;
Corners{3} = C;
Corners{4} = D;
for k = 1:length(t)
AVectMags =[ norm(B(k,:)-A(k,:),2) , norm(C(k,:)-A(k,:),2) ,...
norm(D(k,:)-A(k,:),2)];
BVectMags =[ norm(A(k,:)-B(k,:),2) , norm(C(k,:)-B(k,:),2) ,...
norm(D(k,:)-B(k,:),2)];
CVectMags =[ norm(A(k,:)-C(k,:),2) , norm(B(k,:)-C(k,:),2) ,...
norm(D(k,:)-C(k,:),2)];
DVectMags =[ norm(A(k,:)-D(k,:),2) , norm(B(k,:)-D(k,:),2) ,...
norm(C(k,:)-D(k,:),2)];
AVectMags = sort(AVectMags);
BVectMags = sort(BVectMags);
CVectMags = sort(CVectMags);
DVectMags = sort(DVectMags);
%taking the smaller of the 3 vects should be the sides not the diagonals
AVectMags = AVectMags(1:2);
BVectMags = BVectMags(1:2);
CVectMags = CVectMags(1:2);
DVectMags = DVectMags(1:2);
constellationArea(k) = (prod(AVectMags) + prod(BVectMags) +...
prod(CVectMags) + prod(DVectMags))/4;
%division by 4 to average the 4 areas obtained by each pair of sides
end
constellationArea = constellationArea';
% to form into column vect
figure;
plot(t,constellationArea);
title('Constellation Area VS Time');
ylabel('Area (pixels^2)/10^4');
xlabel('Time (ms)');
grid;
end
81 | P a g e
function [ center ] = irCenter( data )
%irCenter:
%
%Use:
% To display and analyze the center point of the observed IR
% constellation.
%
%Syntax:
%
%(1):
% [ center ] = irCenter( data );
%
%Inputs:
%
%(Required):
% 'data' is a Wii data set in the format produced by MicroCART wmdemo
%(Optional):
% none
%
%Outputs:
%
%(Data):
% 'centerABCD' is a ?x2 vector containing the x and y coordinates of the
% center point calculated for the observed IR constellation
%(Figures):
% (1): Subplot of the X and Y coordinates of the center point VS time.
% (2): 3D Plot shwoing the XY coordinate of the center point vS time.
%
%Custom Function Call Info:
%
% Currently Calls: irDotPlot.m
%
% Currently Called by: none
%
%Author(s):
%
% Matt Rich
%%
%%
tcol=1;
xcol=2;
ycol=3;
zcol=4;
irAfcol=5; % 1 found 0 not found 'A' dot
irAxcol=6; %ranges 0 to 1024
irAycol=7; %ranges 0 to 768
irAscol=8; %ranges 0 to 6?
irBfcol=9; % 1 found 0 not found 'B' dot
irBxcol=10; %ranges 0 to 1024
irBycol=11; %ranges 0 to 768
irBscol=12; %ranges 0 to 6?
irCfcol=13; % 1 found 0 not found 'C' dot
irCxcol=14; %ranges 0 to 1024
irCycol=15; %ranges 0 to 768
irCscol=16; %ranges 0 to 5
irDfcol=17; % 1 found 0 not found 'D' dot
irDxcol=18; %ranges 0 to 1024
irDycol=19; %ranges 0 to 768
irDscol=20; %ranges 0 to 6?
%%
t = data(:,tcol);
irAx = data(:,irAxcol);
irAy = data(:,irAycol);

82 | P a g e
irBx = data(:,irBxcol);
irBy = data(:,irBycol);
irCx = data(:,irCxcol);
irCy = data(:,irCycol);
irDx = data(:,irDxcol);
irDy = data(:,irDycol);
%%
centerX = (irAx+irBx+irCx+irDx)/4;
centerY = (irAy+irBy+irCy+irDy)/4;
center = [ centerX , centerY ];
%%
figure;
subplot(2,1,1);
plot(t,centerX);
grid;
title('IR X Coordinate VS Time');
subplot(2,1,2);
plot(t,centerY);
grid;
title('IR Y Coordinate VS Time');
xlabel('Time (ms)');
figure;
irDotPlot(t,center); hold on;
irDotPlot(t,center,'bx'); hold off;
grid;
%%
end

83 | P a g e
function [] = irDotPlot( timeVect , coordXY , plotOptions )
%irDotPlot:
%
%Use:
% To display an IR dot coordinate pair VS time
%
%Syntax:
%
%(1):
% irDotPlot( timeVect , coordXY , plotOptions );
%
%Inputs:
%
%(Required):
% 'timeVect' is the timestamp vector to plot the IR data against
% 'coordXY' is a matrix containing the x and y coordinates of the IR dot
% as column vectors side by side.
% ~If in separate vectors, simply input coordXY = [coordX,coordY];
%(Optional):
% 'plotOptions' is a string detailing how to plot the data following the
% same syntax as the normal MATLAB plot commands,
% e.g. 'r' means red, 'ro' red circles, 'g:x' green dotted line with x's
%
%Outputs:
%
%(Data):
% none
%(Figures):
% (1): 3D Plot of the IR data coordinate VS time
%
%Custom Function Call Info:
%
% Currently Calls: none
% Currently Called by: irPlot.m
% irCenter.m
% irFilt.m
%
%Author(s):
%
% Matt Rich
%%
if nargin == 2
plotOptions = 'k-';
end
t = timeVect;
irX = coordXY(:,1);
irY = coordXY(:,2);
plot3(t,irX,irY,plotOptions);
if ~isempty(t)
axis( [ 0 max(t) 0 1024 0 768 ] );
end
xlabel('Time (ms)');
ylabel('X coordinate');
zlabel('Y coordinate');
grid
end

84 | P a g e
function [dataF,B,A] = irFilt( data , order , cutoff )
%irFilt:
%
%Use:
% To filter the IR data of a data set and compare the results
% to the unfilterd raw data.
%
% *If 'order' and 'cutoff' not specified, a set of defaults is used.
%
% **Filtering is done in 2D in this case. However the same 1D filter
% is simply applied to both coordinate vectors for each point.
%
%
%
%Syntax:
%
% (1):
% [dataF,B,A] = irFilt( data , order , cutoff );
% (2):
% [dataF] = irFilt( data , order , cutoff);
%
%Inputs:
%
%(Required):
% 'data' is a Wii data set in the format produced by MicroCART wmdemo
%(Optional):
% 'order' is cheby1 IIR filter order
% 'cutoff' is from 0 to 1 , 1 corresponding to 1/2 samling frequency
%
%Outputs:
%(Data):
% (Required):
% 'dataF' is the data set with all IR quantities filtered
% (Optional):
% 'B' is the filter numerator coefficients (z transform)
% 'A' is the filter denominator coefficients (z transform)
%(Figures):
% (1): 3D plot showing the filtered coordinates of the IR 'dots' VS time.
% No plot of the unfiltered data is shown, use regular IRplot.m for
% comparision.
%
%Custom Function Call Info:
%
% Currently Calls: irPlot.m
% Currently Called by: none
%
%Author(s):
%
% Matt Rich
%%
if nargin == 1
order = 2;
cutoff = 0.05;
end
%% col # assignments
tcol=1;
xcol=2;
ycol=3;
zcol=4;
irAfcol=5; % 1 found 0 not found 'A' dot
irAxcol=6; %ranges 0 to 1024
irAycol=7; %ranges 0 to 768
irAscol=8; %ranges 0 to 6?
irBfcol=9; % 1 found 0 not found 'B' dot
irBxcol=10; %ranges 0 to 1024
irBycol=11; %ranges 0 to 768

85 | P a g e
irBscol=12; %ranges 0 to 6?
irCfcol=13; % 1 found 0 not found 'C' dot
irCxcol=14; %ranges 0 to 1024
irCycol=15; %ranges 0 to 768
irCscol=16; %ranges 0 to 5
irDfcol=17; % 1 found 0 not found 'D' dot
irDxcol=18; %ranges 0 to 1024
irDycol=19; %ranges 0 to 768
irDscol=20; %ranges 0 to 6?
%%
t = data(:,tcol);
irAx = data(:,irAxcol);
irAy = data(:,irAycol);
irBx = data(:,irBxcol);
irBy = data(:,irBycol);
irCx = data(:,irCxcol);
irCy = data(:,irCycol);
irDx = data(:,irDxcol);
irDy = data(:,irDycol);
%%
[B,A] = cheby1(order,0.5,cutoff);
irAx2 = filter(B,A,irAx);
irAy2 = filter(B,A,irAy);
irBx2 = filter(B,A,irBx);
irBy2 = filter(B,A,irBy);
irCx2 = filter(B,A,irCx);
irCy2 = filter(B,A,irCy);
irDx2 = filter(B,A,irDx);
irDy2 = filter(B,A,irDy);
dataF = data;
dataF(:,irAxcol) = irAx2;
dataF(:,irAycol) = irAy2;
dataF(:,irBxcol) = irBx2;
dataF(:,irBycol) = irBy2;
dataF(:,irCxcol) = irCx2;
dataF(:,irCycol) = irCy2;
dataF(:,irDxcol) = irDx2;
dataF(:,irDycol) = irDy2;
%%
%figure;
% irDotPlot(t,[irAx2,irAy2],'-k'); hold on;
% irDotPlot(t,[irAx2,irAy2],'xb');
%
% irDotPlot(t,[irBx2,irBy2],'-k');
% irDotPlot(t,[irBx2,irBy2],'xr');
%
% irDotPlot(t,[irCx2,irCy2],'-k');
% irDotPlot(t,[irCx2,irCy2],'xg');
%
% irDotPlot(t,[irDx2,irDy2],'-k');
% irDotPlot(t,[irDx2,irDy2],'xm');
irPlot(dataF);
% legend(' ','irA filtered',' ','irB filtered ',' ','irC filtered ',...
% ' ','irD filtered')
legend(' ','irA filtered','irA invalid',' ','irB filtered',...
'irB invalid',' ','irC filtered','irC invalid',' ',...
'irD filtered','irD invalid');
% hold off;

86 | P a g e
% grid;
%%
end

87 | P a g e
function [perimeter] = irPerim( data )
%irPerim:
%
%Use:
% To calculate the 'apparent perimeter seen' taken up by the IR LED
% constellation
%
%Syntax:
%
%(1):
% [perimeter] = irPerim( data );
%
%Inputs:
%
%(Required):
% 'data' is a Wii data set in the format produced by MicroCART wmdemo
%(Optional):
% none
%
%Outputs:
%
%(Data):
% 'perimeter' is the 'appparent constellation perimeter seen' by the IR
% sensor.
%(Figures):
% (1): Plot of 'perimeter' VS time
%
%Custom Function Call Info:
%
% Currently Calls: none
% Currently Called by: none
%
%Author(s):
%
% Matt Rich
%%
tcol=1;
irAxcol=6; %ranges 0 to 1024
irAycol=7; %ranges 0 to 768
irBxcol=10; %ranges 0 to 1024
irBycol=11; %ranges 0 to 768
irCxcol=14; %ranges 0 to 1024
irCycol=15; %ranges 0 to 768
irDxcol=18; %ranges 0 to 1024
irDycol=19; %ranges 0 to 768
%%
t = data(:,tcol);
irAx = data(:,irAxcol);
irAy = data(:,irAycol);
irBx = data(:,irBxcol);
irBy = data(:,irBycol);
irCx = data(:,irCxcol);
irCy = data(:,irCycol);
irDx = data(:,irDxcol);
irDy = data(:,irDycol);
%%
A = [ irAx , irAy ];
B = [ irBx , irBy ];
C = [ irCx , irCy ];

88 | P a g e
D = [ irDx , irDy ];
%%
Corners{1} = A;
Corners{2} = B;
Corners{3} = C;
Corners{4} = D;
for k = 1:length(t)
AVectMags =[ norm(B(k,:)-A(k,:),2) , norm(C(k,:)-A(k,:),2) ,...
norm(D(k,:)-A(k,:),2)];
BVectMags =[ norm(A(k,:)-B(k,:),2) , norm(C(k,:)-B(k,:),2) ,...
norm(D(k,:)-B(k,:),2)];
CVectMags =[ norm(A(k,:)-C(k,:),2) , norm(B(k,:)-C(k,:),2) ,...
norm(D(k,:)-C(k,:),2)];
DVectMags =[ norm(A(k,:)-D(k,:),2) , norm(B(k,:)-D(k,:),2) ,...
norm(C(k,:)-D(k,:),2)];
AVectMags = sort(AVectMags);
BVectMags = sort(BVectMags);
CVectMags = sort(CVectMags);
DVectMags = sort(DVectMags);
%taking the smaller of the 3 vects should be the sides not the diagonals
AVectMags = AVectMags(1:2);
BVectMags = BVectMags(1:2);
CVectMags = CVectMags(1:2);
DVectMags = DVectMags(1:2);
perimeter(k) = (sum(AVectMags) + sum(BVectMags) + sum(CVectMags)...
+ sum(DVectMags))/2;
%division by 2 beause every side gets duplicated once
end
perimeter = perimeter';
% to form into column vect
figure;
plot(t,perimeter);
title('Viewed Perimeter VS Time');
ylabel('Perimeter (pixels)');
xlabel('Time (ms)');
grid;
end

89 | P a g e
function [] = irPlot( data )
%irPlot:
%
%Use:
% To show the raw IR camera data.
%
% *'Found' and 'unfound' coordinates are
% distinguished between by a black circle on top of any coordinate whos
% found bit was not 1. (Due to plotting/legend issues, the very last
% element of any set is always artifically shown as 'unfound'.)
%
%Syntax:
%
%(1):
% irPlot( data );
%
%Inputs:
%
%(Required):
% 'data' is a Wii data set in the format produced by MicroCART wmdemo
%(Optional):
% none
%
%Outputs:
%
%(Data):
% none
%(Figures):
% (1): 3D Plot of raw IR data VS time.
%
%Custom Function Call Info:
%
% Currently Calls: irDotPlot.m
% Currently Called by: irCenter.m (with 'all' option)
%
%Author(s):
%
% Matt Rich
%%
tcol=1;
xcol=2;
ycol=3;
zcol=4;
irAfcol=5; % 1 found 0 not found 'A' dot
irAxcol=6; %ranges 0 to 1024
irAycol=7; %ranges 0 to 768
irAscol=8; %ranges 0 to 6?
irBfcol=9; % 1 found 0 not found 'B' dot
irBxcol=10; %ranges 0 to 1024
irBycol=11; %ranges 0 to 768
irBscol=12; %ranges 0 to 6?
irCfcol=13; % 1 found 0 not found 'C' dot
irCxcol=14; %ranges 0 to 1024
irCycol=15; %ranges 0 to 768
irCscol=16; %ranges 0 to 5
irDfcol=17; % 1 found 0 not found 'D' dot
irDxcol=18; %ranges 0 to 1024
irDycol=19; %ranges 0 to 768
irDscol=20; %ranges 0 to 6?
%%
t = data(:,tcol);
irAx = data(:,irAxcol);
irAy = data(:,irAycol);

90 | P a g e
irAf = data(:,irAfcol);
irAf(length(t)) = 0;%last element "not found" to ensure ~empty for plotting
irBx = data(:,irBxcol);
irBy = data(:,irBycol);
irBf = data(:,irBfcol);
irBf(length(t)) = 0;%last element "not found" to ensure ~empty for plotting
irCx = data(:,irCxcol);
irCy = data(:,irCycol);
irCf = data(:,irCfcol);
irCf(length(t)) = 0;%last element "not found" to ensure ~empty for plotting
irDx = data(:,irDxcol);
irDy = data(:,irDycol);
irDf = data(:,irDfcol);
irDf(length(t)) = 0;%last element "not found" to ensure ~empty for plotting
%%
Anf = find(irAf ~= 1);
Bnf = find(irBf ~= 1);
Cnf = find(irCf ~= 1);
Dnf = find(irDf ~= 1);
irA = [irAx,irAy];
irAnf = [irAx(Anf),irAy(Anf)];
tAnf = t(Anf);
irB = [irBx,irBy];
irBnf = [irBx(Bnf),irBy(Bnf)];
tBnf = t(Bnf);
irC = [irCx,irCy];
irCnf = [irCx(Cnf),irCy(Cnf)];
tCnf = t(Cnf);
irD = [irDx,irDy];
irDnf = [irDx(Dnf),irDy(Dnf)];
tDnf = t(Dnf);
%%
figure;
irDotPlot(t,irA); hold on;
irDotPlot(t,irA,'bx');
irDotPlot(tAnf,irAnf,'ko');
irDotPlot(t,irB);
irDotPlot(t,irB,'rx');
irDotPlot(tBnf,irBnf,'ko');
irDotPlot(t,irC);
irDotPlot(t,irC,'gx');
irDotPlot(tCnf,irCnf,'ko');
irDotPlot(t,irD);
irDotPlot(t,irD,'mx');
irDotPlot(tDnf,irDnf,'ko'); hold off;
legend(' ','irA','irA invalid',' ','irB',...
'irB invalid',' ','irC','irC invalid',' ',...
'irD','irD invalid');
grid;
%%
end

91 | P a g e
function [Rot] = irRot( data )
%irRot:
%
%Use:
% To calculate the rot angle (angle around IR camera y axis) based off of
% IR constellation data.
%
%Syntax:
%
%(1):
% [Rot] = irRot( data );
%
%Inputs:
%
%(Required):
% 'data' is a Wii data set in the format produced by MicroCART wmdemo
%(Optional):
% none
%
%Outputs:
%
%(Data):
% 'Rot' is the rot vector calculated off of the angle the 'right side'
% of the constellation makes with respect to IR +y axis , in degrees.
%(Figures):
% (1): Plot of 'Rot' VS time
%
%Custom Function Call Info:
%
% Currently Calls: none
% Currently Called by: none
%
%Author(s):
%
% Matt Rich
%%
tcol=1;
irAxcol=6; %ranges 0 to 1024
irAycol=7; %ranges 0 to 768
irBxcol=10; %ranges 0 to 1024
irBycol=11; %ranges 0 to 768
irCxcol=14; %ranges 0 to 1024
irCycol=15; %ranges 0 to 768
irDxcol=18; %ranges 0 to 1024
irDycol=19; %ranges 0 to 768
%%
t = data(:,tcol);
irAx = data(:,irAxcol);
irAy = data(:,irAycol);
irBx = data(:,irBxcol);
irBy = data(:,irBycol);
irCx = data(:,irCxcol);
irCy = data(:,irCycol);
irDx = data(:,irDxcol);
irDy = data(:,irDycol);
%%
A = [ irAx , irAy ];
B = [ irBx , irBy ];
C = [ irCx , irCy ];

92 | P a g e
D = [ irDx , irDy ];
%%
Corners{1} = A;
Corners{2} = B;
Corners{3} = C;
Corners{4} = D;
for k = 1:length(t)
CornerXs = [ A(k,1) , B(k,1) , C(k,1) , D(k,1) ];
CornerYs = [ A(k,2) , B(k,2) , C(k,2) , D(k,2) ];
CornerXsSorted = sort(CornerXs);
rightsIndex1 = find(CornerXs == CornerXsSorted(1));
rightsIndex2 = find(CornerXs == CornerXsSorted(2));
% if the two dots on the right side have identical x coordinates, this
% causes the Index vectors above to become lenght 2. In the case that this
% happens, (the 'else' part) it is ensured that distinct dots are assigned
% to rightCorners{1} and ''{2} respectively.
if length(rightsIndex1 < 2)
rightCorners{1} = Corners{rightsIndex1(1)}(k,:);
rightCorners{2} = Corners{rightsIndex2(1)}(k,:);
else
rightCorners{1} = Corners{rightsIndex1(1)}(k,:);
rightCorners{2} = Corners{rightsIndex1(2)}(k,:);
end
if rightCorners{1}(2) > rightCorners{2}(2)
TRC = rightCorners{1};
BRC = rightCorners{2};
else
TRC = rightCorners{2};
BRC = rightCorners{1};
end
Rot(k) = 180/pi*atan((TRC(1)-BRC(1))/(TRC(2)-BRC(2)+eps));
end
figure;
plot(t,Rot);
title('Rotation VS Time (IR)');
xlabel('Time (ms)');
ylabel('Rotation (deg)');
grid;
end

93 | P a g e
function [Top,Right,Bottom,Left] = irSides( data )
%irSides:
%
%Use:
% To calculate and analyze all 4 side lengths of the constellation seen
% by the IR camrea.
% *This particular 'ir function' assumes no dots will be lost or
% re-assigned in the data set. It assumes dots A , B , C , and D will be
% in the same general area the whole time. Other 'ir functions' are more
% robust to this.
%
%Syntax:
%
%(1):
% [Top,Right,Bottom,Left] = irSides( data );
%
%Inputs:
%
%(Required):
% 'data' is a Wii data set in the format produced by MicroCART wmdemo
%(Optional):
% none
%
%Outputs:
%
%(Data):
% 'Top' is the top side length vector in pixels
% 'Right' is the right side length vector in pixels
% 'Bottom' is the bottom side length vector in pixels
% 'Left' is the left side length vector in pixels
%(Figures):
% (1): Subplot of all for side lengths VS time
%
%Custom Function Call Info:
%
% Currently Calls: none
% Currently Called by: none
%
%Author(s):
%
% Matt Rich
%%
tcol=1;
irAxcol=6; %ranges 0 to 1024
irAycol=7; %ranges 0 to 768
irBxcol=10; %ranges 0 to 1024
irBycol=11; %ranges 0 to 768
irCxcol=14; %ranges 0 to 1024
irCycol=15; %ranges 0 to 768
irDxcol=18; %ranges 0 to 1024
irDycol=19; %ranges 0 to 768
%%
t = data(:,tcol);
irAx = data(:,irAxcol);
irAy = data(:,irAycol);
irBx = data(:,irBxcol);
irBy = data(:,irBycol);
irCx = data(:,irCxcol);
irCy = data(:,irCycol);
irDx = data(:,irDxcol);
irDy = data(:,irDycol);

94 | P a g e
%%
A = [ irAx , irAy ];
B = [ irBx , irBy ];
C = [ irCx , irCy ];
D = [ irDx , irDy ];
%%
Corners{1} = A;
Corners{2} = B;
Corners{3} = C;
Corners{4} = D;
CornerLabels{1} = 'A';
CornerLabels{2} = 'B';
CornerLabels{3} = 'C';
CornerLabels{4} = 'D';
%CornerMags = [ norm(A(1,:),2) , norm(B(1,:),2) , ...
% norm(C(1,:),2) , norm(D(1,:),2) ];
CornerXs = [ A(1,1) , B(1,1) , C(1,1) , D(1,1) ];
CornerYs = [ A(1,2) , B(1,2) , C(1,2) , D(1,2) ];
CenterX = sum(CornerXs)/4;
CenterY = sum(CornerYs)/4;
%%
rights = CornerXs < CenterX;
tops = CornerYs > CenterY;
bottoms = CornerYs < CenterY;
lefts = CornerXs > CenterX;
%%
topRight = tops.*rights;
topRightIndex = find(topRight);
bottomRight = bottoms.*rights;
bottomRightIndex = find(bottomRight);
topLeft = tops.*lefts;
topLeftIndex = find(topLeft);
bottomLeft = bottoms.*lefts;
bottomLeftIndex = find(bottomLeft);
%%
TRC = Corners{topRightIndex}; %top right corner
BRC = Corners{bottomRightIndex}; %bottom right corner
TLC = Corners{topLeftIndex}; %top left corner
BLC = Corners{bottomLeftIndex}; %bottom left corner
%%
topRightName = CornerLabels{topRightIndex};
bottomRightName = CornerLabels{bottomRightIndex};
%
topLeftName = CornerLabels{topLeftIndex};
bottomLeftName = CornerLabels{bottomLeftIndex};
%%
Top = sqrt((TLC(:,1)-TRC(:,1)).^2 + (TLC(:,2)-TRC(:,2)).^2);
Right = sqrt((TRC(:,1)-BRC(:,1)).^2 + (TRC(:,2)-BRC(:,2)).^2);
Bottom = sqrt((BLC(:,1)-BRC(:,1)).^2 + (BLC(:,2)-BRC(:,2)).^2);
Left = sqrt((TLC(:,1)-BLC(:,1)).^2 + (TLC(:,2)-BLC(:,2)).^2);
figure;
subplot(4,1,1);
plot(t,Top,'x'); hold on;
lsline;
hold off;
legend('length','Least Sq. Line');
title(['Top Side Length VS Time (IR), Top Left Dot: ',topLeftName...
,' Top Right Dot: ',topRightName]);
ylabel('Length (pixels)');

95 | P a g e
grid;
subplot(4,1,2);
plot(t,Right,'x'); hold on;
lsline;
hold off;
title(['Right Side Length VS Time (IR), Top Right Dot: ',topRightName...
,' Bottom Right Dot: ',bottomRightName]);
ylabel('Length (pixels)');
grid;
subplot(4,1,3);
plot(t,Bottom,'x'); hold on;
lsline;
hold off;
title(['Bottom Side Length VS Time (IR), Bottom Right Dot: ',...
bottomRightName,' Bottom Left Dot: ',bottomLeftName]);
ylabel('Length (pixels)');
grid;
subplot(4,1,4);
plot(t,Left,'x'); hold on;
lsline;
hold off;
title(['Left Side Length VS Time (IR), Top Left Dot: ',...
topLeftName,' Bottom Left Dot: ',bottomLeftName]);
xlabel('Time (ms)');
ylabel('Length (pixels)');
grid;
end
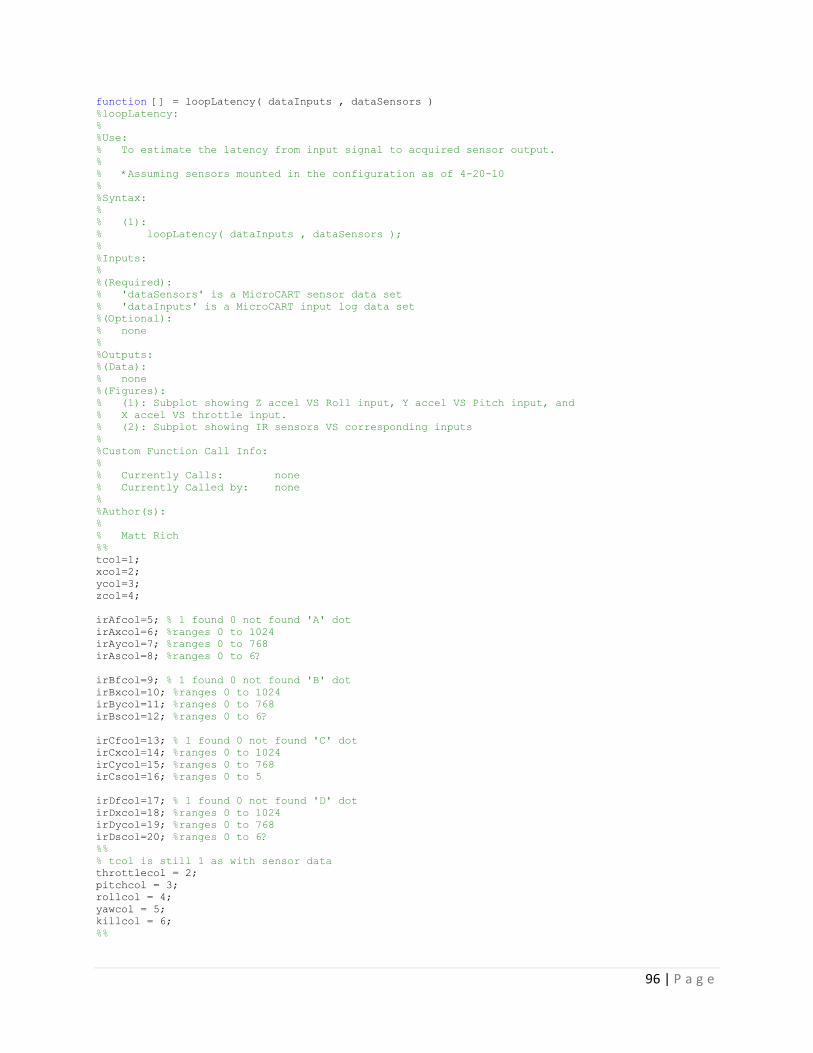
96 | P a g e
function [] = loopLatency( dataInputs , dataSensors )
%loopLatency:
%
%Use:
% To estimate the latency from input signal to acquired sensor output.
%
% *Assuming sensors mounted in the configuration as of 4-20-10
%
%Syntax:
%
% (1):
% loopLatency( dataInputs , dataSensors );
%
%Inputs:
%
%(Required):
% 'dataSensors' is a MicroCART sensor data set
% 'dataInputs' is a MicroCART input log data set
%(Optional):
% none
%
%Outputs:
%(Data):
% none
%(Figures):
% (1): Subplot showing Z accel VS Roll input, Y accel VS Pitch input, and
% X accel VS throttle input.
% (2): Subplot showing IR sensors VS corresponding inputs
%
%Custom Function Call Info:
%
% Currently Calls: none
% Currently Called by: none
%
%Author(s):
%
% Matt Rich
%%
tcol=1;
xcol=2;
ycol=3;
zcol=4;
irAfcol=5; % 1 found 0 not found 'A' dot
irAxcol=6; %ranges 0 to 1024
irAycol=7; %ranges 0 to 768
irAscol=8; %ranges 0 to 6?
irBfcol=9; % 1 found 0 not found 'B' dot
irBxcol=10; %ranges 0 to 1024
irBycol=11; %ranges 0 to 768
irBscol=12; %ranges 0 to 6?
irCfcol=13; % 1 found 0 not found 'C' dot
irCxcol=14; %ranges 0 to 1024
irCycol=15; %ranges 0 to 768
irCscol=16; %ranges 0 to 5
irDfcol=17; % 1 found 0 not found 'D' dot
irDxcol=18; %ranges 0 to 1024
irDycol=19; %ranges 0 to 768
irDscol=20; %ranges 0 to 6?
%%
% tcol is still 1 as with sensor data
throttlecol = 2;
pitchcol = 3;
rollcol = 4;
yawcol = 5;
killcol = 6;
%%

97 | P a g e
%%
ts = dataSensors(:,tcol);
x = dataSensors(:,xcol);
y = dataSensors(:,ycol);
z = dataSensors(:,zcol);
irAx = dataSensors(:,irAxcol);
irAy = dataSensors(:,irAycol);
irAf = dataSensors(:,irAfcol);
irAf(length(ts)) = 0;%last element "not found", ensures ~empty for plotting
irBx = dataSensors(:,irBxcol);
irBy = dataSensors(:,irBycol);
irBf = dataSensors(:,irBfcol);
irBf(length(ts)) = 0;%last element "not found", ensures ~empty for plotting
irCx = dataSensors(:,irCxcol);
irCy = dataSensors(:,irCycol);
irCf = dataSensors(:,irCfcol);
irCf(length(ts)) = 0;%last element "not found", ensures ~empty for plotting
irDx = dataSensors(:,irDxcol);
irDy = dataSensors(:,irDycol);
irDf = dataSensors(:,irDfcol);
irDf(length(ts)) = 0;%last element "not found", ensures ~empty for plotting
%%
ti = dataInputs(:,tcol);
throttle = dataInputs(:,throttlecol);
pitch = dataInputs(:,pitchcol);
roll = dataInputs(:,rollcol);
yaw = dataInputs(:,yawcol);
kill = dataInputs(:,killcol);
%%
[ centerABCD ] = irCenter( dataSensors ); %coordinates of const. center
close; close; % to get rid of unwanted figure(s)
constellationArea = irArea( dataSensors );
close;
[perimeter] = irPerim( dataSensors );
close;
[Rot] = irRot( dataSensors );
close;
dataSensorsAccelFiltered = accelFilt( dataSensors );
close;
x2 = dataSensorsAccelFiltered(:,xcol);
y2 = dataSensorsAccelFiltered(:,ycol);
z2 = dataSensorsAccelFiltered(:,zcol);
figure;
subplot(3,1,1)
plot(ts,z,'c'); hold on; plot(ts,z2);
plot(ti,roll,'r');
grid; hold off;
title('Z accel VS Roll Input'); legend('Original','Filtered','Input');
ylabel('accel (g/25)');
subplot(3,1,2)
plot(ts,y,'c'); hold on; plot(ts,y2);
plot(ti,pitch,'r');
grid; hold off;
title('Y accel VS Pitch Input');
ylabel('accel (g/25)');
subplot(3,1,3)
plot(ts,x,'c'); hold on; plot(ts,x2);
plot(ti,throttle,'r');

98 | P a g e
grid; hold off;
title('X accel VS Throttle Input');
ylabel('accel (g/25)');
xlabel('Time (ms)');
%%
figure;
subplot(4,1,1);
plot(ts,Rot); hold on;
plot(ti,yaw,'r'); hold off;
legend('IR rotation (deg)','Yaw Input');
title('Rotation Angle VS Yaw Input');
subplot(4,1,2);
plot(ts,centerABCD(:,1)); hold on;
plot(ti,roll,'r'); hold off;
legend('IR Center X coord.','Roll Input');
title('Constellation Center X VS Roll Input');
subplot(4,1,3);
plot(ts,centerABCD(:,2)); hold on;
plot(ti,pitch,'r'); hold off;
legend('IR Center Y coord.','Pitch Input');
title('Constellation Center Y and Area and Perimeter VS Pitch Input');
subplot(4,1,4);
plot(ts,perimeter); hold on;
plot(ti,throttle,'r'); hold off;
legend('IR Perimeter','Throttle Input');
xlabel('Time (ms)');
title('Constellation Perimeter VS Throttle Input');
end

99 | P a g e
function [dt] = vectorDelta(T)
%vectorDelta:
%
%Use:
% To produce a vector giving the step sizes between all consecutive
% elements of the input vector.
%
%Syntax:
%
%(1):
% [dt] = vectorDelta(T);
%
%Inputs:
%
%(Required):
% 'T' is a column or row vector of data, e.g. a timestamp vector
%(Optional):
% none
%
%Outputs:
%
%(Data):
% 'dt' is a vector of all step sizes between elements of the input vector
%(Figures):
% none
%
%Custom Function Call Info:
%
% Currently Calls: none
% Currently Called by: none
%
%Author(s):
%
% Matt Rich
%%
tb = zeros(1,length(T)+1);
ta = tb;
%
ta(2:length(T)+1)=T;
tb(1:length(T))=T;
DT = tb-ta;
dt = DT(2:length(T));
end
Appendix 6: Matlab Analysis Script Documentation
Please see separate document INFO.docx

100 | P a g e
Appendix 7: Old Matlab Data Analysis Script
function[xmins,ymins,zmins,pmins,rmins] = wiidata8(varargin)
%
%EXAMPLE: [xmins,ymins,zmins,pmins,rmins] = wiidata7(INPUTS)
%INPUT ORDER: accelChoice,IRchoice,data1,data2,data3,data4,data5,data6
%
%
%This function takes up to 6 data set inputs to plot with unique colors.
%Any more than 6 data sets will cause color pattern to begin repeating.
%
%It requires that the first input be a choice of 1 (yes) or 0 (no) choosing
%to analyze Acceleration data. The second input must be a choice of 1 (yes)
%or 0 (no) choosing to analyze IR data.
%
%
%
%% ========================================================================
%History
%==========================================================================
%version 0:
% -needs 6 data set inputs and produces accel, pitch, roll plots only
%
% AUTHOR: Matt Rich
%--------------------------------------------------------------------------
%version 1:
% -support added for variable number of inputs
% *(nargin) number of arguments adjusting figure outputs correctly
%
% AUTHOR: Mike Peat
%--------------------------------------------------------------------------
%version 2:
% -support added for IR dot data inputs (two dots A and B)
% -a plot of each data sets dot xy posisitons as x's
% *(nargin adjusted to nargin-1 due to new 1st input [IRchoice])
%
% AUTHOR: Matt Rich
%--------------------------------------------------------------------------
%version 3:
% -a composite plot of dot position as x's from each data set added
%
% AUTHOR: Matt Rich
%--------------------------------------------------------------------------
%version 4:
% -dot size data incorporated and plotted as "boldness" (linewidth)
%
% AUTHOR: Matt Rich
%--------------------------------------------------------------------------
%version 5:
% -improved IR plotting with distinguised dots: two triangle types
% -added x markers to accel, pitch, roll plots to show actual data points
% as well as trend line
% -additional one time figure showing x and y coordiantes of dots A and B
% from data set 1 as functions of time on isolated plots with trendline
% and markers IF IRchoice is 1
%
% AUTHOR: Matt Rich
%--------------------------------------------------------------------------
%version 6:
% -minimum step size for all accels, pitch, roll, for each data set
% calculated and returned in vectors
% -in this update to 6 pitch,roll, mins converted to degrees from rad
%
% AUTHOR: Matt Rich
%--------------------------------------------------------------------------
%version 7:
% -Entire code completely re-written:
% ~Emphasized vector, matrix, and cell array operations as opposed to
% the many inefficient if, for, and other element by element loops

101 | P a g e
% when dealing with the data sets.
% ~Wherever possible, memory pre-allocated to the proper size instead
% of allowing re-sizing of vectors etc... on each iteration
% ~Emphasized modularity and expandability
% ~Attempted to provide more commentary...
% -Support added for 4 IR dots (A B C D)
% -Support added for fully variable number of inputs (with additional
% elements to the 'colorScheme' vector)
% -Support added for analysis of Only accel or Only IR (choice for each)
% -Fixed issues with minimums staying 1e10 if no change occured
% -Shortened overall length
% -Improved 'help' display
% -All featured outputs of previous versions maintained/expanded except:
% ~One time only figures: The IR dot coordinates VS time one time
% figure has been expanded to include all data sets and altered in
% presentation to more effectively display the data.
% ~The direct plots of IR dot coordinates no longer uses 'boldness'
% to convey size and no longer differentiates between found/unfound
% dots because these features were mostly useless/un-visible on such
% plots.(The found and size info is now incorporated into coordinate
% VS time figures)
% ~*If analyzing IR data from sets without 4 dots, must use version 6
% -Vastly Improved run time
%
% AUTHOR: Matt Rich
%--------------------------------------------------------------------------
% version 8: (this version)
% -fixed an error in the way pitch and roll were calculated which would
% affect the accuracy when both were non-zero simultaneously
% ~results still only accurate under conditions where center of mass
% has constant velocity...
% -fully variable number of inputs fully supported: colorScheme vector is
% automatically lengthened if necessary
% ~colors will just repeat
% ~output plots will be properly labeled (numbered) up to any number
%
% AUTHOR: Matt Rich
%~~~~~~~~~~~~~~~~~~~~~~~~~~~~~~~~~~~~~~~~~~~~~~~~~~~~~~~~~~~~~~~~~~~~~~~~~~
%Current Issues / Possible Improvements :
% + IR analysis and display ...
% + further simplification of code (some unnecessary redundancies)
% + additonal alalysis overall ...
% (vector sum of accels, "integration" of accels, filtered data?)
%==========================================================================
%
close all
if nargin < 3
disp('ERROR: you need at least one data set')
return
end
% if nargin > 8
% disp('ERROR: currently a maximum of 6 data sets may be entered.')
% disp('To expand this limit, add entries to the colorScheme vector.')
% disp('See code.')
% return
% end
% ^no longer necessary in this version, any number can be tolerated
accelChoice = varargin{1}; % 1 OR 0
irChoice = varargin{2}; % 1 0R 0
if accelChoice ~= 1 && irChoice ~=1
disp('Error: you have not asked this function to do anything!')
return
end
%% col # assignments

102 | P a g e
tcol=1;
xcol=2;
ycol=3;
zcol=4;
irAfcol=5; % 1 found 0 not found 'A' dot
irAxcol=6; %ranges 0 to 1024
irAycol=7; %ranges 0 to 768
irAscol=8; %ranges 0 to 6?
irBfcol=9; % 1 found 0 not found 'B' dot
irBxcol=10; %ranges 0 to 1024
irBycol=11; %ranges 0 to 768
irBscol=12; %ranges 0 to 6?
irCfcol=13; % 1 found 0 not found 'C' dot
irCxcol=14; %ranges 0 to 1024
irCycol=15; %ranges 0 to 768
irCscol=16; %ranges 0 to 5
irDfcol=17; % 1 found 0 not found 'D' dot
irDxcol=18; %ranges 0 to 1024
irDycol=19; %ranges 0 to 768
irDscol=20; %ranges 0 to 6?
%%
numDATAS = nargin-2;
%the number of data sets entered by the user with 2 'choice'
%arguments before them
W = ceil(numDATAS/6);
% = 1 for 1-6 datas, 2 for 7-12 datas, 3 for 13-18 datas, ...
%(to lengthen colorScheme vector if needed)
colorScheme=['b','r','g','m','k','c'];
if W > 1 % are more than 6 colors needed or not
for k = 1:W %how many more sets of 6 will suffice
colorScheme = [colorScheme,colorScheme];
%concatenates colorScheme on itself if necessary
end
end
%
for k = 3:nargin
TIMEVECTS{k-2} = varargin{k}(:,tcol);
%again assuming 2 choice args, k-2 ensuring a start @ 1
XVECTS{k-2} = varargin{k}(:,xcol);
YVECTS{k-2} = varargin{k}(:,ycol);
ZVECTS{k-2} = varargin{k}(:,zcol);
%RVECTS{k-2} = varargin{k}(:,rcol); %these do not exist, they're calculated
%PVECTS{k-2} = varargin{k}(:,pcol); %these do not exist, they're calculated
IRAFVECTS{k-2} = varargin{k}(:,irAfcol);
IRAXVECTS{k-2} = varargin{k}(:,irAxcol);
IRAYVECTS{k-2} = varargin{k}(:,irAycol);
IRASVECTS{k-2} = varargin{k}(:,irAscol);
IRBFVECTS{k-2} = varargin{k}(:,irBfcol);
IRBXVECTS{k-2} = varargin{k}(:,irBxcol);
IRBYVECTS{k-2} = varargin{k}(:,irBycol);
IRBSVECTS{k-2} = varargin{k}(:,irBscol);
IRCFVECTS{k-2} = varargin{k}(:,irCfcol);
IRCXVECTS{k-2} = varargin{k}(:,irCxcol);
IRCYVECTS{k-2} = varargin{k}(:,irCycol);
IRCSVECTS{k-2} = varargin{k}(:,irCscol);
IRDFVECTS{k-2} = varargin{k}(:,irDfcol);
IRDXVECTS{k-2} = varargin{k}(:,irDxcol);
IRDYVECTS{k-2} = varargin{k}(:,irDycol);
IRDSVECTS{k-2} = varargin{k}(:,irDscol);
end

103 | P a g e
% below: delcaration of minimum step size vectors as huge to start with
xmins = 1e10*ones(1,numDATAS);
ymins = 1e10*ones(1,numDATAS);
zmins = 1e10*ones(1,numDATAS);
rmins = 1e10*ones(1,numDATAS);
pmins = 1e10*ones(1,numDATAS);
%-----------------------------
%% PLOTTING AND CALCULATIONS:
%% subplot plots (+ min calculations)
if accelChoice == 1 %
figure(1) %subplots of each x acceleration
for k = 1:numDATAS %run through each data set entered 1 to numDATAS
subplot(numDATAS,1,k)
%declare a subplot numDATAS X 1, plot 1st to numDATAth set
timeVector=zeros(1,length(TIMEVECTS{k}));
%pre-delcare length of current time vector
xVector=zeros(1,length(TIMEVECTS{k}));
%pre-delcare length of current x vector
for p = 1:length(TIMEVECTS{k})
timeVector(p) = TIMEVECTS{k}(p);
% assign values out of cell vector set to time vector
end
for p = 1:length(XVECTS{k})
xVector(p) = XVECTS{k}(p);
% assign values out of cell vector set to x vector
end
for p = 1:length(XVECTS{k})-1
%calculation of minimum step sizes for x accels
if XVECTS{k}(p+1) ~= XVECTS{k}(p) && abs(XVECTS{k}(p+1) - ...
XVECTS{k}(p)) < xmins(k)
xmins(k) = abs(XVECTS{k}(p+1) - XVECTS{k}(p));
end
end
if xmins(k) == 1e10
xmins(k) = 0; %since this implies it actually never changed at all
end
plot(timeVector,xVector,[colorScheme(k),'x-'])
%plots with corresponding color
n=num2str(k); %gives a string to name which data set is plotted
title(['x acceleration ',n]) %names each data set plot
ylabel('a/g (unitless)')
xlabel('Time (ms)')
end
figure(3) %subplots of each y acceleration
for k = 1:numDATAS %run through each data set entered 1 to numDATAS
subplot(numDATAS,1,k)
%declare a subplot numDATAS X 1, plot 1st to numDATAth set
timeVector=zeros(1,length(TIMEVECTS{k}));
%pre-delcare length of current time vector
yVector=zeros(1,length(TIMEVECTS{k}));
%pre-delcare length of current y vector
for p = 1:length(TIMEVECTS{k})
timeVector(p) = TIMEVECTS{k}(p);
% assign values out of cell vector set to time vector
end
for p = 1:length(YVECTS{k})
yVector(p) = YVECTS{k}(p);
% assign values out of cell vector set to y vector
end
for p = 1:length(YVECTS{k})-1
%calculation of minimum step sizes for y accels
if YVECTS{k}(p+1) ~= YVECTS{k}(p) &&...
abs(YVECTS{k}(p+1) - YVECTS{k}(p)) < ymins(k)
ymins(k) = abs(YVECTS{k}(p+1) - YVECTS{k}(p));
end
end
if ymins(k) == 1e10

104 | P a g e
ymins(k) = 0; %since this implies it actually never changed at all
end
plot(timeVector,yVector,[colorScheme(k),'x-'])
%plots with corresponding color
n=num2str(k); %gives a string to name which data set is plotted
title(['y acceleration ',n]) %names each data set plot
ylabel('a/g (unitless)')
xlabel('Time (ms)')
end
figure(5) %subplots of each z acceleration
for k = 1:numDATAS %run through each data set entered 1 to numDATAS
subplot(numDATAS,1,k)
%declare a subplot numDATAS X 1, plot 1st to numDATAth set
timeVector=zeros(1,length(TIMEVECTS{k}));
%pre-delcare length of current time vector
zVector=zeros(1,length(TIMEVECTS{k}));
%pre-delcare length of current z vector
for p = 1:length(TIMEVECTS{k})
timeVector(p) = TIMEVECTS{k}(p);
% assign values out of cell vector set to time vector
end
for p = 1:length(ZVECTS{k})
zVector(p) = ZVECTS{k}(p);
% assign values out of cell vector set to z vector
end
for p = 1:length(ZVECTS{k})-1
%calculation of minimum step sizes for z accels
if ZVECTS{k}(p+1) ~= ZVECTS{k}(p) && ...
abs(ZVECTS{k}(p+1) - ZVECTS{k}(p)) < zmins(k)
zmins(k) = abs(ZVECTS{k}(p+1) - ZVECTS{k}(p));
end
end
if zmins(k) == 1e10
zmins(k) = 0; %since this implies it actually never changed at all
end
plot(timeVector,zVector,[colorScheme(k),'x-'])
%plots with corresponding color
n=num2str(k); %gives a string to name which data set is plotted
title(['z acceleration ',n]) %names each data set plot
ylabel('a/g (unitless)')
xlabel('Time (ms)')
end
figure(7) %subplots of each roll angle
for k = 1:numDATAS %run through each data set entered 1 to numDATAS
subplot(numDATAS,1,k)
%declare a subplot numDATAS X 1, plot 1st to numDATAth set
timeVector=zeros(1,length(TIMEVECTS{k}));
%pre-delcare length of current time vector
rVector=zeros(1,length(TIMEVECTS{k}));
%pre-delcare length of current r vector
for p = 1:length(TIMEVECTS{k})
timeVector(p) = TIMEVECTS{k}(p);
% assign values out of cell vector set to time vector
end
for p = 1:length(ZVECTS{k})
rVector(p) = (180/pi)*atan(XVECTS{k}(p)./sqrt((ZVECTS{k}(p)).^2 ...
+ (YVECTS{k}(p)).^2));
% assign values out of cell vector set to r vector
end
for p = 1:length(XVECTS{k})-1
%calculation of minimum step sizes for roll angles
if rVector(p+1) ~= rVector(p) && abs(rVector(p+1) ...
- rVector(p)) < rmins(k)
rmins(k) = abs(rVector(p+1) - rVector(p));
end
end
if rmins(k) == 1e10
rmins(k) = 0; %since this implies it actually never changed at all
end
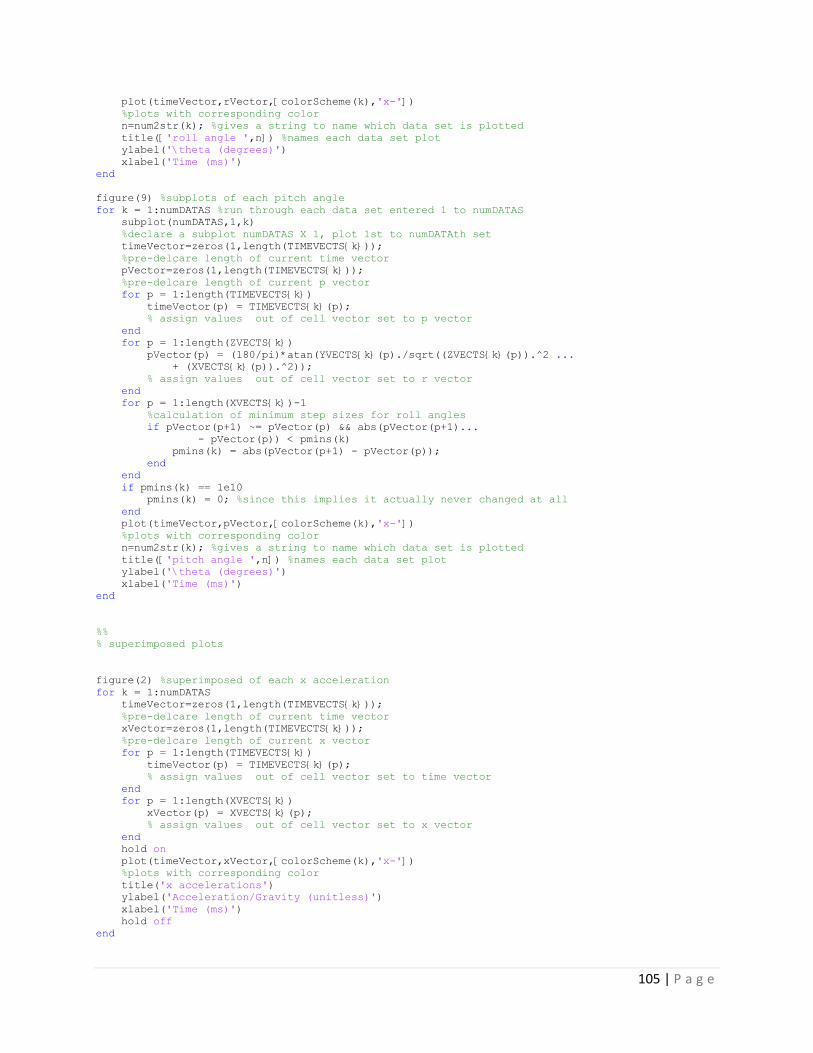
105 | P a g e
plot(timeVector,rVector,[colorScheme(k),'x-'])
%plots with corresponding color
n=num2str(k); %gives a string to name which data set is plotted
title(['roll angle ',n]) %names each data set plot
ylabel('\theta (degrees)')
xlabel('Time (ms)')
end
figure(9) %subplots of each pitch angle
for k = 1:numDATAS %run through each data set entered 1 to numDATAS
subplot(numDATAS,1,k)
%declare a subplot numDATAS X 1, plot 1st to numDATAth set
timeVector=zeros(1,length(TIMEVECTS{k}));
%pre-delcare length of current time vector
pVector=zeros(1,length(TIMEVECTS{k}));
%pre-delcare length of current p vector
for p = 1:length(TIMEVECTS{k})
timeVector(p) = TIMEVECTS{k}(p);
% assign values out of cell vector set to p vector
end
for p = 1:length(ZVECTS{k})
pVector(p) = (180/pi)*atan(YVECTS{k}(p)./sqrt((ZVECTS{k}(p)).^2 ...
+ (XVECTS{k}(p)).^2));
% assign values out of cell vector set to r vector
end
for p = 1:length(XVECTS{k})-1
%calculation of minimum step sizes for roll angles
if pVector(p+1) ~= pVector(p) && abs(pVector(p+1)...
- pVector(p)) < pmins(k)
pmins(k) = abs(pVector(p+1) - pVector(p));
end
end
if pmins(k) == 1e10
pmins(k) = 0; %since this implies it actually never changed at all
end
plot(timeVector,pVector,[colorScheme(k),'x-'])
%plots with corresponding color
n=num2str(k); %gives a string to name which data set is plotted
title(['pitch angle ',n]) %names each data set plot
ylabel('\theta (degrees)')
xlabel('Time (ms)')
end
%%
% superimposed plots
figure(2) %superimposed of each x acceleration
for k = 1:numDATAS
timeVector=zeros(1,length(TIMEVECTS{k}));
%pre-delcare length of current time vector
xVector=zeros(1,length(TIMEVECTS{k}));
%pre-delcare length of current x vector
for p = 1:length(TIMEVECTS{k})
timeVector(p) = TIMEVECTS{k}(p);
% assign values out of cell vector set to time vector
end
for p = 1:length(XVECTS{k})
xVector(p) = XVECTS{k}(p);
% assign values out of cell vector set to x vector
end
hold on
plot(timeVector,xVector,[colorScheme(k),'x-'])
%plots with corresponding color
title('x accelerations')
ylabel('Acceleration/Gravity (unitless)')
xlabel('Time (ms)')
hold off
end

106 | P a g e
figure(4) %superimposed of each y acceleration
for k = 1:numDATAS
timeVector=zeros(1,length(TIMEVECTS{k}));
%pre-delcare length of current time vector
yVector=zeros(1,length(TIMEVECTS{k}));
%pre-delcare length of current y vector
for p = 1:length(TIMEVECTS{k})
timeVector(p) = TIMEVECTS{k}(p);
% assign values out of cell vector set to time vector
end
for p = 1:length(YVECTS{k})
yVector(p) = YVECTS{k}(p);
% assign values out of cell vector set to y vector
end
hold on
plot(timeVector,yVector,[colorScheme(k),'x-'])
%plots with corresponding color
title('y accelerations')
ylabel('Acceleration/Gravity (unitless)')
xlabel('Time (ms)')
hold off
end
figure(6) %superimposed of each z acceleration
for k = 1:numDATAS
timeVector=zeros(1,length(TIMEVECTS{k}));
%pre-delcare length of current time vector
zVector=zeros(1,length(TIMEVECTS{k}));
%pre-delcare length of current z vector
for p = 1:length(TIMEVECTS{k})
timeVector(p) = TIMEVECTS{k}(p);
% assign values out of cell vector set to time vector
end
for p = 1:length(ZVECTS{k})
zVector(p) = ZVECTS{k}(p);
% assign values out of cell vector set to z vector
end
hold on
plot(timeVector,zVector,[colorScheme(k),'x-'])
%plots with corresponding color
title('z accelerations')
ylabel('Acceleration/Gravity (unitless)')
xlabel('Time (ms)')
hold off
end
figure(8) %superimposed of each roll angle
for k = 1:numDATAS
timeVector=zeros(1,length(TIMEVECTS{k}));
%pre-delcare length of current time vector
rVector=zeros(1,length(TIMEVECTS{k}));
%pre-delcare length of current r vector
for p = 1:length(TIMEVECTS{k})
timeVector(p) = TIMEVECTS{k}(p);
% assign values out of cell vector set to time vector
end
for p = 1:length(ZVECTS{k})
rVector(p) = (180/pi)*atan(XVECTS{k}(p)./sqrt((ZVECTS{k}(p)).^2 ...
+ (YVECTS{k}(p)).^2));
% assign values out of cell vector set to r vector
end
hold on
plot(timeVector,rVector,[colorScheme(k),'x-'])
%plots with corresponding color
title('roll angles')
ylabel('\theta (degrees)')
xlabel('Time (ms)')
hold off
end
figure(10) %superimposed of each pitch angle

107 | P a g e
for k = 1:numDATAS
timeVector=zeros(1,length(TIMEVECTS{k}));
%pre-delcare length of current time vector
pVector=zeros(1,length(TIMEVECTS{k}));
%pre-delcare length of current p vector
for p = 1:length(TIMEVECTS{k})
timeVector(p) = TIMEVECTS{k}(p);
% assign values out of cell vector set to time vector
end
for p = 1:length(ZVECTS{k})
pVector(p) = (180/pi)*atan(YVECTS{k}(p)./sqrt((ZVECTS{k}(p)).^2 ...
+ (XVECTS{k}(p)).^2));
% assign values out of cell vector set to p vector
end
hold on
plot(timeVector,pVector,[colorScheme(k),'x-'])
%plots with corresponding color
title('pitch angles')
ylabel('\theta (degrees)')
xlabel('Time (ms)')
hold off
end
end %end if accelChoice...
%%
% subplot plots
if irChoice == 1 %
figure(11)
% DOT A
for k = 1:numDATAS %run through each data set entered 1 to numDATAS
n4titles = num2str(k);
subplot(numDATAS,1,k)
%declare a subplot numDATAS X 1, plot 1st to numDATAth set
timeVector=zeros(1,length(TIMEVECTS{k}));
%pre-delcare length of current time vector
irAfVector = zeros(1,length(IRAFVECTS{k}));
%pre-delcare length of current ir found vector
irAxVector = zeros(1,length(IRAXVECTS{k})); %''
irAyVector = zeros(1,length(IRAYVECTS{k})); %''
irAsVector = zeros(1,length(IRASVECTS{k})); %''
for p = 1:length(TIMEVECTS{k})
timeVector(p) = TIMEVECTS{k}(p);
% assign values out of cell vector set to time vector
end
for p = 1:length(IRAFVECTS{k})
irAfVector(p) = IRAFVECTS{k}(p);
% assign values out of cell vector set to the vector
end
for p = 1:length(IRAXVECTS{k})
irAxVector(p) = IRAXVECTS{k}(p);
% assign values out of cell vector set to the vector
end
for p = 1:length(IRAYVECTS{k})
irAyVector(p) = IRAYVECTS{k}(p);
% assign values out of cell vector set to the vector
end
for p = 1:length(IRASVECTS{k})
irAsVector(p) = IRASVECTS{k}(p);
% assign values out of cell vector set to the vector
end
subplot(numDATAS,1,k)
plot(irAxVector,irAyVector,[colorScheme(k),'>'],'markersize',10)
%xy coordinate dot A
xlabel('x coord.')
ylabel('y coord.')
hold on

108 | P a g e
% DOT B
irBfVector = zeros(1,length(IRBFVECTS{k}));
%pre-delcare length of current ir found vector
irBxVector = zeros(1,length(IRBXVECTS{k})); %''
irByVector = zeros(1,length(IRBYVECTS{k})); %''
irBsVector = zeros(1,length(IRBSVECTS{k})); %''
for p = 1:length(TIMEVECTS{k})
timeVector(p) = TIMEVECTS{k}(p);
% assign values out of cell vector set to time vector
end
for p = 1:length(IRBFVECTS{k})
irBfVector(p) = IRBFVECTS{k}(p);
% assign values out of cell vector set to the vector
end
for p = 1:length(IRAXVECTS{k})
irBxVector(p) = IRBXVECTS{k}(p);
% assign values out of cell vector set to the vector
end
for p = 1:length(IRAYVECTS{k})
irByVector(p) = IRBYVECTS{k}(p);
% assign values out of cell vector set to the vector
end
for p = 1:length(IRASVECTS{k})
irBsVector(p) = IRBSVECTS{k}(p);
% assign values out of cell vector set to the vector
end
subplot(numDATAS,1,k)
plot(irBxVector,irByVector,[colorScheme(k),'<'],'markersize',10)
%xy coordinate of dot B
% DOT C
irCfVector = zeros(1,length(IRCFVECTS{k}));
%pre-delcare length of current ir found vector
irCxVector = zeros(1,length(IRCXVECTS{k})); %''
irCyVector = zeros(1,length(IRCYVECTS{k})); %''
irCsVector = zeros(1,length(IRCSVECTS{k})); %''
for p = 1:length(TIMEVECTS{k})
timeVector(p) = TIMEVECTS{k}(p);
% assign values out of cell vector set to time vector
end
for p = 1:length(IRCFVECTS{k})
irCfVector(p) = IRCFVECTS{k}(p);
% assign values out of cell vector set to the vector
end
for p = 1:length(IRAXVECTS{k})
irCxVector(p) = IRCXVECTS{k}(p);
% assign values out of cell vector set to the vector
end
for p = 1:length(IRAYVECTS{k})
irCyVector(p) = IRCYVECTS{k}(p);
% assign values out of cell vector set to the vector
end
for p = 1:length(IRASVECTS{k})
irCsVector(p) = IRCSVECTS{k}(p);
% assign values out of cell vector set to the vector
end
subplot(numDATAS,1,k)
plot(irCxVector,irCyVector,[colorScheme(k),'^'],'markersize',10)
%xy coordinate of dot C
% DOT D
irDfVector = zeros(1,length(IRDFVECTS{k}));
%pre-delcare length of current ir found vector
irDxVector = zeros(1,length(IRDXVECTS{k})); %''

109 | P a g e
irDyVector = zeros(1,length(IRDYVECTS{k})); %''
irDsVector = zeros(1,length(IRDSVECTS{k})); %''
for p = 1:length(TIMEVECTS{k})
timeVector(p) = TIMEVECTS{k}(p);
% assign values out of cell vector set to time vector
end
for p = 1:length(IRDFVECTS{k})
irDfVector(p) = IRDFVECTS{k}(p);
% assign values out of cell vector set to the vector
end
for p = 1:length(IRAXVECTS{k})
irDxVector(p) = IRDXVECTS{k}(p);
% assign values out of cell vector set to the vector
end
for p = 1:length(IRAYVECTS{k})
irDyVector(p) = IRDYVECTS{k}(p);
% assign values out of cell vector set to the vector
end
for p = 1:length(IRASVECTS{k})
irDsVector(p) = IRDSVECTS{k}(p);
% assign values out of cell vector set to the vector
end
subplot(numDATAS,1,k)
plot(irDxVector,irDyVector,[colorScheme(k),'v'],'markersize',10)
%xy coordinate of dot D
title(['SET ',n4titles,' ABCD coordinates'])
hold off % PUT AFTER DOT 'D' WHEN INCORPORATED
%
end
figure(12)
% DOT A
for k = 1:numDATAS %run through each data set entered 1 to numDATAS
hold on
timeVector=zeros(1,length(TIMEVECTS{k}));
%pre-delcare length of current time vector
irAfVector = zeros(1,length(IRAFVECTS{k}));
%pre-delcare length of current ir found vector
irAxVector = zeros(1,length(IRAXVECTS{k})); %''
irAyVector = zeros(1,length(IRAYVECTS{k})); %''
irAsVector = zeros(1,length(IRASVECTS{k})); %''
for p = 1:length(TIMEVECTS{k})
timeVector(p) = TIMEVECTS{k}(p);
% assign values out of cell vector set to time vector
end
for p = 1:length(IRAFVECTS{k})
irAfVector(p) = IRAFVECTS{k}(p);
% assign values out of cell vector set to the vector
end
for p = 1:length(IRAXVECTS{k})
irAxVector(p) = IRAXVECTS{k}(p);
% assign values out of cell vector set to the vector
end
for p = 1:length(IRAYVECTS{k})
irAyVector(p) = IRAYVECTS{k}(p);
% assign values out of cell vector set to the vector
end
for p = 1:length(IRASVECTS{k})
irAsVector(p) = IRASVECTS{k}(p);
% assign values out of cell vector set to the vector
end
plot(irAxVector,irAyVector,[colorScheme(k),'>'],'markersize',10)
%xy coordinate dot A
title('All Data Sets Superimposed Dot A,B,C,D Coordinates')
xlabel('x coord.')
ylabel('y coord.')

110 | P a g e
% DOT B
irBfVector = zeros(1,length(IRBFVECTS{k}));
%pre-delcare length of current ir found vector
irBxVector = zeros(1,length(IRBXVECTS{k})); %''
irByVector = zeros(1,length(IRBYVECTS{k})); %''
irBsVector = zeros(1,length(IRBSVECTS{k})); %''
for p = 1:length(TIMEVECTS{k})
timeVector(p) = TIMEVECTS{k}(p);
% assign values out of cell vector set to time vector
end
for p = 1:length(IRBFVECTS{k})
irBfVector(p) = IRBFVECTS{k}(p);
% assign values out of cell vector set to the vector
end
for p = 1:length(IRAXVECTS{k})
irBxVector(p) = IRBXVECTS{k}(p);
% assign values out of cell vector set to the vector
end
for p = 1:length(IRAYVECTS{k})
irByVector(p) = IRBYVECTS{k}(p);
% assign values out of cell vector set to the vector
end
for p = 1:length(IRASVECTS{k})
irBsVector(p) = IRBSVECTS{k}(p);
% assign values out of cell vector set to the vector
end
plot(irBxVector,irByVector,[colorScheme(k),'<'],'markersize',10)
%xy coordinate of dot B
% DOT C
irCfVector = zeros(1,length(IRCFVECTS{k}));
%pre-delcare length of current ir found vector
irCxVector = zeros(1,length(IRCXVECTS{k})); %''
irCyVector = zeros(1,length(IRCYVECTS{k})); %''
irCsVector = zeros(1,length(IRCSVECTS{k})); %''
for p = 1:length(TIMEVECTS{k})
timeVector(p) = TIMEVECTS{k}(p);
% assign values out of cell vector set to time vector
end
for p = 1:length(IRCFVECTS{k})
irCfVector(p) = IRCFVECTS{k}(p);
% assign values out of cell vector set to the vector
end
for p = 1:length(IRAXVECTS{k})
irCxVector(p) = IRCXVECTS{k}(p);
% assign values out of cell vector set to the vector
end
for p = 1:length(IRAYVECTS{k})
irCyVector(p) = IRCYVECTS{k}(p);
% assign values out of cell vector set to the vector
end
for p = 1:length(IRASVECTS{k})
irCsVector(p) = IRCSVECTS{k}(p);
% assign values out of cell vector set to the vector
end
plot(irCxVector,irCyVector,[colorScheme(k),'^'],'markersize',10)
%xy coordinate of dot C
% DOT D
irDfVector = zeros(1,length(IRDFVECTS{k}));

111 | P a g e
%pre-delcare length of current ir found vector
irDxVector = zeros(1,length(IRDXVECTS{k})); %''
irDyVector = zeros(1,length(IRDYVECTS{k})); %''
irDsVector = zeros(1,length(IRDSVECTS{k})); %''
for p = 1:length(TIMEVECTS{k})
timeVector(p) = TIMEVECTS{k}(p);
% assign values out of cell vector set to time vector
end
for p = 1:length(IRDFVECTS{k})
irDfVector(p) = IRDFVECTS{k}(p);
% assign values out of cell vector set to the vector
end
for p = 1:length(IRAXVECTS{k})
irDxVector(p) = IRDXVECTS{k}(p);
% assign values out of cell vector set to the vector
end
for p = 1:length(IRAYVECTS{k})
irDyVector(p) = IRDYVECTS{k}(p);
% assign values out of cell vector set to the vector
end
for p = 1:length(IRASVECTS{k})
irDsVector(p) = IRDSVECTS{k}(p);
% assign values out of cell vector set to the vector
end
plot(irDxVector,irDyVector,[colorScheme(k),'v'],'markersize',10)
%xy coordinate of dot D
hold off % PUT AFTER DOT 'D' WHEN INCORPORATED
%
end
%info plot
% DOT A
for k = 1:numDATAS %run through each data set entered 1 to 1
figure(k+12)
n4titles = num2str(k);
timeVector=zeros(1,length(TIMEVECTS{k}));
%pre-delcare length of current time vector
irAfVector = zeros(1,length(IRAFVECTS{k}));
%pre-delcare length of current ir found vector
irAxVector = zeros(1,length(IRAXVECTS{k})); %''
irAyVector = zeros(1,length(IRAYVECTS{k})); %''
irAsVector = zeros(1,length(IRASVECTS{k})); %''
for p = 1:length(TIMEVECTS{k})
timeVector(p) = TIMEVECTS{k}(p);
% assign values out of cell vector set to time vector
end
for p = 1:length(IRAFVECTS{k})
irAfVector(p) = IRAFVECTS{k}(p);
% assign values out of cell vector set to the vector
end
for p = 1:length(IRAXVECTS{k})
irAxVector(p) = IRAXVECTS{k}(p);
% assign values out of cell vector set to the vector
end
for p = 1:length(IRAYVECTS{k})
irAyVector(p) = IRAYVECTS{k}(p);
% assign values out of cell vector set to the vector
end
for p = 1:length(IRASVECTS{k})
irAsVector(p) = IRASVECTS{k}(p);
% assign values out of cell vector set to the vector
end
subplot(2,4,1)
plot(16*irAxVector./max(irAxVector),timeVector,'kx-')
% NORMALIZED 0-10 x coordinate by time of dot A
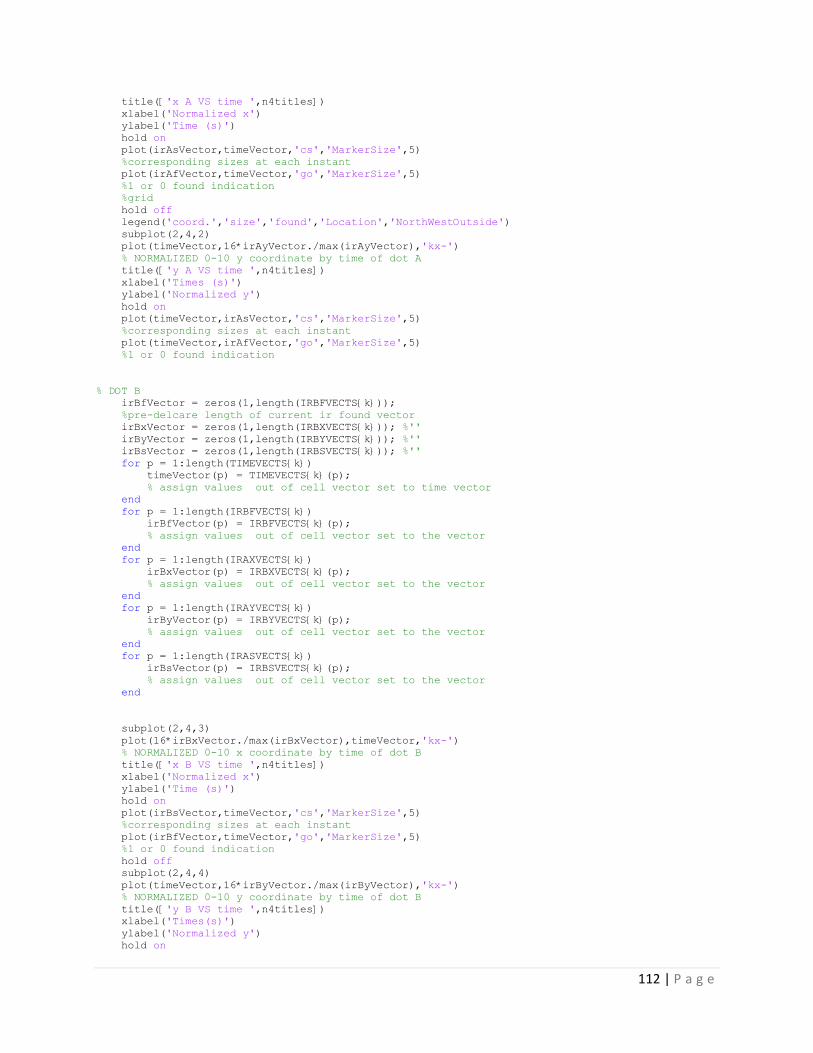
112 | P a g e
title(['x A VS time ',n4titles])
xlabel('Normalized x')
ylabel('Time (s)')
hold on
plot(irAsVector,timeVector,'cs','MarkerSize',5)
%corresponding sizes at each instant
plot(irAfVector,timeVector,'go','MarkerSize',5)
%1 or 0 found indication
%grid
hold off
legend('coord.','size','found','Location','NorthWestOutside')
subplot(2,4,2)
plot(timeVector,16*irAyVector./max(irAyVector),'kx-')
% NORMALIZED 0-10 y coordinate by time of dot A
title(['y A VS time ',n4titles])
xlabel('Times (s)')
ylabel('Normalized y')
hold on
plot(timeVector,irAsVector,'cs','MarkerSize',5)
%corresponding sizes at each instant
plot(timeVector,irAfVector,'go','MarkerSize',5)
%1 or 0 found indication
% DOT B
irBfVector = zeros(1,length(IRBFVECTS{k}));
%pre-delcare length of current ir found vector
irBxVector = zeros(1,length(IRBXVECTS{k})); %''
irByVector = zeros(1,length(IRBYVECTS{k})); %''
irBsVector = zeros(1,length(IRBSVECTS{k})); %''
for p = 1:length(TIMEVECTS{k})
timeVector(p) = TIMEVECTS{k}(p);
% assign values out of cell vector set to time vector
end
for p = 1:length(IRBFVECTS{k})
irBfVector(p) = IRBFVECTS{k}(p);
% assign values out of cell vector set to the vector
end
for p = 1:length(IRAXVECTS{k})
irBxVector(p) = IRBXVECTS{k}(p);
% assign values out of cell vector set to the vector
end
for p = 1:length(IRAYVECTS{k})
irByVector(p) = IRBYVECTS{k}(p);
% assign values out of cell vector set to the vector
end
for p = 1:length(IRASVECTS{k})
irBsVector(p) = IRBSVECTS{k}(p);
% assign values out of cell vector set to the vector
end
subplot(2,4,3)
plot(16*irBxVector./max(irBxVector),timeVector,'kx-')
% NORMALIZED 0-10 x coordinate by time of dot B
title(['x B VS time ',n4titles])
xlabel('Normalized x')
ylabel('Time (s)')
hold on
plot(irBsVector,timeVector,'cs','MarkerSize',5)
%corresponding sizes at each instant
plot(irBfVector,timeVector,'go','MarkerSize',5)
%1 or 0 found indication
hold off
subplot(2,4,4)
plot(timeVector,16*irByVector./max(irByVector),'kx-')
% NORMALIZED 0-10 y coordinate by time of dot B
title(['y B VS time ',n4titles])
xlabel('Times(s)')
ylabel('Normalized y')
hold on

113 | P a g e
plot(timeVector,irBsVector,'cs','MarkerSize',5)
%corresponding sizes at each instant
plot(timeVector,irBfVector,'go','MarkerSize',5)
%1 or 0 found indication
hold off
% DOT C
irCfVector = zeros(1,length(IRCFVECTS{k}));
%pre-delcare length of current ir found vector
irCxVector = zeros(1,length(IRCXVECTS{k})); %''
irCyVector = zeros(1,length(IRCYVECTS{k})); %''
irCsVector = zeros(1,length(IRCSVECTS{k})); %''
for p = 1:length(TIMEVECTS{k})
timeVector(p) = TIMEVECTS{k}(p);
% assign values out of cell vector set to time vector
end
for p = 1:length(IRCFVECTS{k})
irCfVector(p) = IRCFVECTS{k}(p);
% assign values out of cell vector set to the vector
end
for p = 1:length(IRAXVECTS{k})
irCxVector(p) = IRCXVECTS{k}(p);
% assign values out of cell vector set to the vector
end
for p = 1:length(IRAYVECTS{k})
irCyVector(p) = IRCYVECTS{k}(p);
% assign values out of cell vector set to the vector
end
for p = 1:length(IRASVECTS{k})
irCsVector(p) = IRCSVECTS{k}(p);
% assign values out of cell vector set to the vector
end
subplot(2,4,5)
plot(16*irCxVector./max(irCxVector),timeVector,'kx-')
% NORMALIZED 0-10 x coordinate by time of dot C
title(['x C VS time ',n4titles])
xlabel('Normalized x')
ylabel('Time (s)')
hold on
plot(irCsVector,timeVector,'cs','MarkerSize',5)
%corresponding sizes at each instant
plot(irCfVector,timeVector,'go','MarkerSize',5)
%1 or 0 found indication
%grid
hold off
subplot(2,4,6)
plot(timeVector,16*irCyVector./max(irCyVector),'kx-')
% NORMALIZED 0-10 y coordinate by time of dot C
title(['y C VS time ',n4titles])
xlabel('Times (s)')
ylabel('Normalized y')
hold on
plot(timeVector,irCsVector,'cs','MarkerSize',5)
%corresponding sizes at each instant
plot(timeVector,irCfVector,'go','MarkerSize',5)
%1 or 0 found indication
% DOT D
irDfVector = zeros(1,length(IRDFVECTS{k}));
%pre-delcare length of current ir found vector
irDxVector = zeros(1,length(IRDXVECTS{k})); %''
irDyVector = zeros(1,length(IRDYVECTS{k})); %''
irDsVector = zeros(1,length(IRDSVECTS{k})); %''
for p = 1:length(TIMEVECTS{k})
timeVector(p) = TIMEVECTS{k}(p);
% assign values out of cell vector set to time vector
end

114 | P a g e
for p = 1:length(IRDFVECTS{k})
irDfVector(p) = IRDFVECTS{k}(p);
% assign values out of cell vector set to the vector
end
for p = 1:length(IRAXVECTS{k})
irDxVector(p) = IRDXVECTS{k}(p);
% assign values out of cell vector set to the vector
end
for p = 1:length(IRAYVECTS{k})
irDyVector(p) = IRDYVECTS{k}(p);
% assign values out of cell vector set to the vector
end
for p = 1:length(IRASVECTS{k})
irDsVector(p) = IRDSVECTS{k}(p);
% assign values out of cell vector set to the vector
end
subplot(2,4,7)
plot(16*irDxVector./max(irDxVector),timeVector,'kx-')
% NORMALIZED 0-10 x coordinate by time of dot D
title(['x D VS time ',n4titles])
xlabel('Normalized x')
ylabel('Time (s)')
hold on
plot(irDsVector,timeVector,'cs','MarkerSize',5)
%corresponding sizes at each instant
plot(irDfVector,timeVector,'go','MarkerSize',5)
%1 or 0 found indication
%grid
hold off
subplot(2,4,8)
plot(timeVector,16*irDyVector./max(irDyVector),'kx-')
% NORMALIZED 0-10 y coordinate by time of dot D
title(['y D VS time ',n4titles])
xlabel('Times (s)')
ylabel('Normalized y')
hold on
plot(timeVector,irDsVector,'cs','MarkerSize',5)
%corresponding sizes at each instant
plot(timeVector,irDfVector,'go','MarkerSize',5)
%1 or 0 found indication
%
end
end %end if irChoice...
%%
end % MAIN FUNCTION END