Embed Size (px)
Citation preview
Top Curr ChemDOI 10.1007/128_2007_28© Springer-Verlag Berlin Heidelberg
Microcantilever Sensors
Hans Peter Lang (�) · Christoph Gerber (�)
National Competence Center for Research in Nanoscale Science, University of Basel,Institute of Physics, Klingelbergstrasse 82, 4056 Basel, [email protected], [email protected]
1 Introduction to Microcantilever Sensors1.1 Historical Development1.2 Measurement Principle1.2.1 Concept1.2.2 Compressive and Tensile Stress1.2.3 Differential Measurements1.2.4 Deflection Measurement1.3 Realization of an Optical Beam-Deflection Setup
2 Operating Modes2.1 Static Mode2.2 Dynamic Mode2.3 Heat Mode2.4 Photothermal Spectroscopy2.5 Electrochemistry
3 Functionalization3.1 Coating in Microcapillary Arrays3.2 Coating Using an Inkjet Spotter
4 Applications4.1 Chemical Vapor Detection4.2 Explosives Detection
5 Recent Literature and Outlook
References
Abstract Microfabricated cantilevers have been used in atomic force microscopy for thetopography imaging of non-conductive surfaces for more than 20 years. Cantilever beamswithout tips have proved their applicability in recent years as miniaturized, ultrasen-sitive, and fast-responding sensors for applications in chemistry, physics, biochemistry,and medicine. Microcantilever sensors respond by bending due to the absorption ofmolecules. A shift in resonance frequency also occurs. They can be operated in differentenvironments such as gaseous environment, liquids, or vacuum. In gas, microcantileversensors can be operated as an artificial nose, whereby the bending pattern of a microfab-ricated array of eight polymer-coated silicon cantilevers is characteristic of the differentvapors from solvents, flavors, and beverages. When operated in a liquid, microcantileversensors are able to detect biochemical reactions. Each cantilever is functionalized witha specific biochemical probe receptor, sensitive for detection of the corresponding tar-get molecule. Applications lie in the fields of label- and amplification-free detection of
H.P. Lang · C. Gerber
DNA hybridization, the detection of proteins as well as antigen-antibody reactions, andthe detection of larger entities, such as bacteria and fungi.
Keywords Artificial nose · Biosensor · Microcantilever sensor
AbbreviationsAFM Atomic force microscopyCMC Carboxymethyl celluloseCMOS Complementary metal oxide semiconductorDDT DichlorodiphenyltrichloroethaneDIMP Diisopropyl methyl phosphonateDMMP DimethylmethylphosphonateDNA Deoxyribonucleic acidDNT DinitrotolueneHPC Hydroxypropyl celluloseHPLC High Performance Liquid ChromatographyPAAM Poly(allylamine)PC Personal computerPCA Principal component analysisPEEK Poly-etheretherketonePEI PolyethyleniminePEO Poly(2-ethyl-2-oxazoline)PETN Pentaerythritol tetranitratePSA Prostate-specific antigenPSD Position sensitive detectorPSS PolystyrenesulfonatePVP PolyvinylpyrrolidonePZT Lead zirconium titanateRDX Hexahydro-1,3,5-triazineQCM Quarz crystal microbalanceSPR Surface plasmon resonanceTNT TrinitrotolueneVCSEL Vertical cavity surface emitting laserVOC Volatile organic compound
1Introduction to Microcantilever Sensors
1.1Historical Development
Measurement of adsorption-induced bending or a change in resonance fre-quency using beams of silicon as sensors was already described in literaturein 1968, by Wilfinger et al. [1], who detected resonances in large siliconcantilever structures of 50 mm×30 mm×8 mm. Actuation was realized by lo-calized thermal expansion in diffused resistors (piezoresistors) located near
Microcantilever Sensors
the cantilever support to create a temperature gradient for driving the can-tilever at its resonance frequency. Similarly, the piezoresistors could also beused to monitor mechanical deflection of the cantilever. Heng [2] fabricatedin 1971 gold microcantilevers capacitively coupled to microstrip lines for themechanical trimming of high-frequency oscillator circuits. Petersen [3] con-structed in 1979 cantilever-type micromechanical membrane switches madefrom silicon designed to bridge the gap between silicon transistors and me-chanical electromagnetic relays. Kolesar [4] suggested in 1985 the use ofcantilever structures as electronic detectors for nerve agents.
Since the advent of atomic force microscopy (AFM) in 1986 [5] micro-fabricated cantilevers have become easily commercially available, triggeringresearch reports on the use of microcantilevers as sensors. In 1994, Itohet al. [6] presented a microcantilever coated with a thin film of zinc-oxidewith piezoresistive deflection readout. Cleveland et al. [7] reported the track-ing of cantilever resonance frequency to detect nanogram changes in massloading when small particles are deposited onto AFM probe tips. Gimzewskiet al. [8] showed the first chemical sensing applications, in which static can-tilever bending revealed chemical reactions, such as the platinum-assistedcatalytic conversion of hydrogen and oxygen into water at very high sensi-tivity. Thundat et al. [9] demonstrated that the resonance frequency as wellas the static bending of microcantilevers is influenced by changing ambi-ent conditions, such as moisture adsorption. Furthermore, they found thatthe deflection of metal-coated cantilevers is also thermally influenced (thebimetallic effect). Later, Thundat et al. [10] observed changes in the reson-ance frequency of microcantilevers due to the adsorption of analyte vaporon exposed surfaces. The frequency changes are due to mass loading oradsorption-induced changes in the cantilever spring constant. By coatingcantilever surfaces with hygroscopic materials, such as phosphoric acid orgelatin, the cantilever can sense water vapor at picogram mass resolution.
1.2Measurement Principle
1.2.1Concept
Microcantilevers as sensors, unlike AFM cantilevers, neither need a tip attheir apex nor a sample surface. The microcantilever surfaces serve as sen-sors, in particular, to detect the adsorption of molecules taking place on thesesurfaces. The generation of surface stress is monitored, eventually resulting inthe bending of the microcantilever, if the adsorption preferentially occurs onone of its surfaces. Selective adsorption is controlled by coating one surface(typically the upper surface) of a microcantilever with a thin layer of a mate-rial that shows an affinity to molecules in the environment (sensor surface).
H.P. Lang · C. Gerber
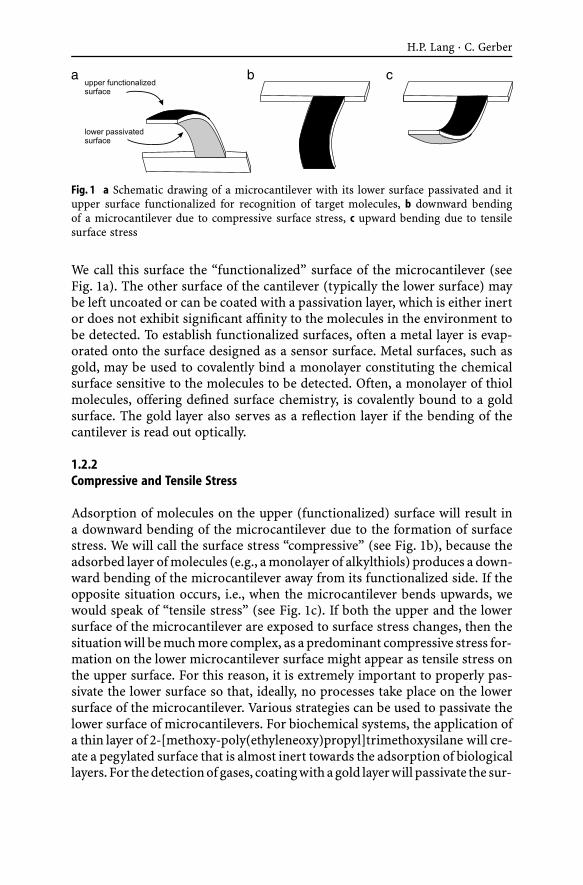
Fig. 1 a Schematic drawing of a microcantilever with its lower surface passivated and itupper surface functionalized for recognition of target molecules, b downward bendingof a microcantilever due to compressive surface stress, c upward bending due to tensilesurface stress
We call this surface the “functionalized” surface of the microcantilever (seeFig. 1a). The other surface of the cantilever (typically the lower surface) maybe left uncoated or can be coated with a passivation layer, which is either inertor does not exhibit significant affinity to the molecules in the environment tobe detected. To establish functionalized surfaces, often a metal layer is evap-orated onto the surface designed as a sensor surface. Metal surfaces, such asgold, may be used to covalently bind a monolayer constituting the chemicalsurface sensitive to the molecules to be detected. Often, a monolayer of thiolmolecules, offering defined surface chemistry, is covalently bound to a goldsurface. The gold layer also serves as a reflection layer if the bending of thecantilever is read out optically.
1.2.2Compressive and Tensile Stress
Adsorption of molecules on the upper (functionalized) surface will result ina downward bending of the microcantilever due to the formation of surfacestress. We will call the surface stress “compressive” (see Fig. 1b), because theadsorbed layer of molecules (e.g., a monolayer of alkylthiols) produces a down-ward bending of the microcantilever away from its functionalized side. If theopposite situation occurs, i.e., when the microcantilever bends upwards, wewould speak of “tensile stress” (see Fig. 1c). If both the upper and the lowersurface of the microcantilever are exposed to surface stress changes, then thesituation will be much more complex, as a predominant compressive stress for-mation on the lower microcantilever surface might appear as tensile stress onthe upper surface. For this reason, it is extremely important to properly pas-sivate the lower surface so that, ideally, no processes take place on the lowersurface of the microcantilever. Various strategies can be used to passivate thelower surface of microcantilevers. For biochemical systems, the application ofa thin layer of 2-[methoxy-poly(ethyleneoxy)propyl]trimethoxysilane will cre-ate a pegylated surface that is almost inert towards the adsorption of biologicallayers. For the detection of gases, coating with a gold layer will passivate the sur-
Microcantilever Sensors
face. For the recognition of solvent vapors, coating with a fluorinated polymerlayer will serve as a non-reactive layer. The actual experiment will show whetherthe passivation layer was really efficient, as such passivated cantilevers will notshow a substantial bending response upon exposure to an analyte.
1.2.3Differential Measurements
Single microcantilevers may bend due to thermal drift or an interaction withtheir environment, in particular if operated in a liquid. Furthermore, non-specific physisorption of molecules on the cantilever surface or nonspecificbinding to receptor molecules during measurements may contribute to thedrift.
To exclude such influences, the simultaneous measurement of reference mi-crocantilevers aligned in the same array as the sensing microcantilevers iscrucial [11]. The difference in signals from the reference and sensor microcan-tilevers yields the net bending response, and even small sensor signals can beextracted from large microcantilever deflections without being dominated byundesired effects. When only single microcantilevers are used, no thermal-driftcompensation is possible. To obtain useful data under these circumstances,both microcantilever surfaces have to be chemically well-defined. One of thesurfaces, typically the lower one, has to be passivated; otherwise, the micro-cantilever response will be convoluted with undesired effects originating fromuncontrolled reactions taking place on the lower surface. With a pair of mi-crocantilevers, reliable measurements are obtained. One of them is used as thesensor microcantilever (coated typically on the upper side with a molecule layerthat shows affinity to the molecules to be detected), whereas the other micro-cantilever serves as the reference. It should be coated with a passivation layeron the upper surface so as not to exhibit affinity to the molecules to be detected.Thermal drifts are cancelled out if difference responses, i.e., the differencein deflections of sensor and reference microcantilevers are taken (differentialmeasurements). Alternatively, both microcantilevers are used as sensors (sen-sor layers on the upper surfaces), and the lower surface has to be passivated.It is best to use an array of microcantilevers, in which some are used either assensor or as reference microcantilevers so that multiple difference signals canbe evaluated simultaneously. Thermal drift is cancelled out as one surface ofall microcantilevers, typically the lower one, is left uncoated or coated with thesame passivation layer.
1.2.4Deflection Measurement
The bending response of the microcantilever due to adsorption of moleculesonto the functional layer is caused by stress formation at the interface be-
H.P. Lang · C. Gerber
tween the functional layer and the forming molecular layer. Because theforces within the functional layer try to keep the distance between moleculesconstant, the cantilever beam responds by bending because of its extremeflexibility. The quantity describing the flexibility of the microcantilever is itsspring constant k. For a rectangular microcantilever of length l, thickness tand width w the spring constant k is calculated as follows:
k =Ewt3
4l3, (1)
where E is Young’s modulus (ESi = 1.3×10¹¹ N/m2 for Si(100)).The microcantilever bends as a response to the formation of surface stress
caused by the adsorption of a molecular layer. In its simplest case, the shapeof the bent microcantilever can be approximated as part of a circle with ra-dius R. This radius of curvature is given by [12, 13]
1R
=6(1 – ν)
Et2 . (2)
The resulting surface stress change is described using Stoney’s formula [12]:
∆σ =Et2
6R(1 – ν), (3)
where E is Young’s modulus, t the thickness of the cantilever, ν the Poisson’sratio (νSi = 0.24), and R the bending radius of the cantilever.
The deflection of microcantilever sensors can be measured in variousways. They differ in the sensitivity, the effort for alignment and setup, therobustness and ease of readout, and in the potential for miniaturization.
1.2.4.1Piezoresistive Readout
Piezoresistive microcantilevers [6, 14] are usually U-shaped and have diffusedpiezoresistors in both of the legs close to the fixed end. The resistance inthe piezoresistors is measured using a Wheatstone bridge circuit with threereference resistors, of which one is adjustable. The current flowing betweenthe two branches of the Wheatstone bridge is first nulled by changing theresistance of the adjustable resistor. If the microcantilever bends, the piezore-sistor changes its value and a current will flow between the two branches ofthe Wheatstone bridge. The current is converted via a differential amplifierinto a voltage, which is proportional to the deflection value. For dynamic-mode measurement, the piezoresistive microcantilever is externally actuatedvia a piezocrystal driven by a frequency generator. The ac actuation voltageis fed as reference voltage into a lock-in amplifier and compared with the re-sponse of the Wheatstone bridge circuit allowing to sweep resonance curvesand to determine shifts in resonance frequency.
Microcantilever Sensors
1.2.4.2Piezoelectric Readout
Piezoelectric microcantilevers [15] are driven via the inverse piezoelectriceffect (self-excitation) by applying an electric ac voltage to the piezoelec-tric material (PZT or ZnO). Sensing of bending is performed by recordingthe piezoelectric current change taking advantage of the fact that the PZTlayer produces a sensitive field response to weak stress through the directpiezoelectric effect. Piezoelectric microcantilevers are multilayer structuresconsisting of a SiO2 cantilever and the PZT piezoelectric layer. Two electrodelayers, insulated from each other, provide electrical contact. The entire struc-ture is protected using passivation layers. An identical structure is usuallyintegrated into the rigid chip body to provide a reference for the piezoelectricsignals from the cantilever.
1.2.4.3Optical (Beam-Deflection) Readout
The most frequently used approach to read out microcantilever deflectionsis optical beam deflection [16], because it is a comparatively simple methodwith an excellent lateral resolution.
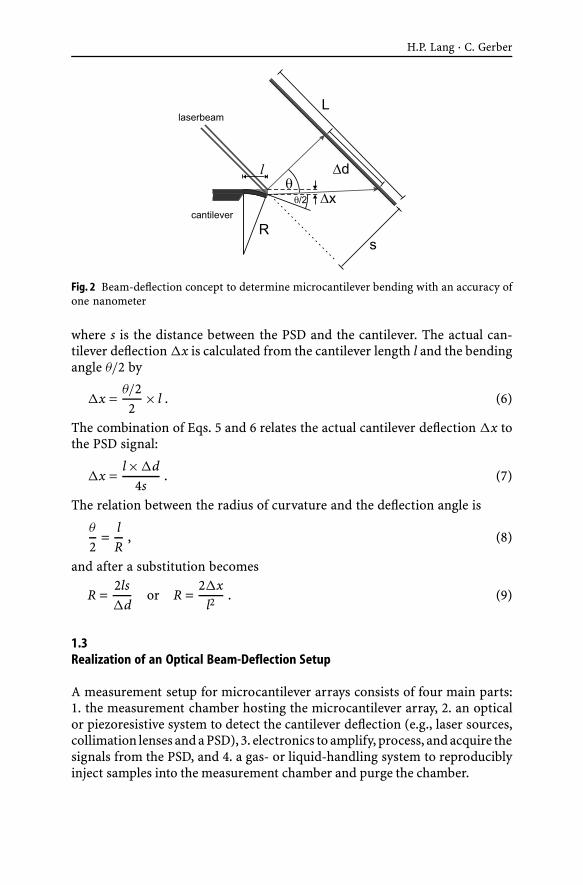
The actual cantilever deflection ∆x scales with the cantilever dimensions;therefore, deflection responses should be expressed in terms of surface stress∆σ in N/m to be able to compare cantilever responses acquired with differ-ent setups. Various strategies to convert beam deflection signals into stressare described in the literature [17, 18]. Surface stress takes into account thecantilever material properties, such as the Poisson ratio ν, Young’s modulus Eand the cantilever thickness t. The radius of the curvature R of the cantilevercharacterizes bending, see Eq. 2. As shown in the drawing in Fig. 2, the ac-tual cantilever displacement ∆x is transformed into a displacement ∆d onthe position sensitive detector (PSD). The position of a light spot on a PSD isdetermined by measuring the photocurrents from the two facing electrodes.The movement of the light spot on the linear PSD is calculated from the twocurrents I1 and I2 and the size L of the PSD by
∆d =I1 – I2
I1 + I2× L
2. (4)
As all angles are very small, it can be assumed that the bending angle of thecantilever is equal to half of the angle θ of the deflected laser beam, i.e., θ/2.Therefore, the bending angle of the cantilever can be calculated to be
θ
2=
∆d2s
, (5)
H.P. Lang · C. Gerber
Fig. 2 Beam-deflection concept to determine microcantilever bending with an accuracy ofone nanometer
where s is the distance between the PSD and the cantilever. The actual can-tilever deflection ∆x is calculated from the cantilever length l and the bendingangle θ/2 by
∆x =θ/22
× l . (6)
The combination of Eqs. 5 and 6 relates the actual cantilever deflection ∆x tothe PSD signal:
∆x =l×∆d
4s. (7)
The relation between the radius of curvature and the deflection angle is
θ
2=
lR
, (8)
and after a substitution becomes
R =2ls∆d
or R =2∆x
l2. (9)
1.3Realization of an Optical Beam-Deflection Setup
A measurement setup for microcantilever arrays consists of four main parts:1. the measurement chamber hosting the microcantilever array, 2. an opticalor piezoresistive system to detect the cantilever deflection (e.g., laser sources,collimation lenses and a PSD), 3. electronics to amplify, process, and acquire thesignals from the PSD, and 4. a gas- or liquid-handling system to reproduciblyinject samples into the measurement chamber and purge the chamber.
Microcantilever Sensors
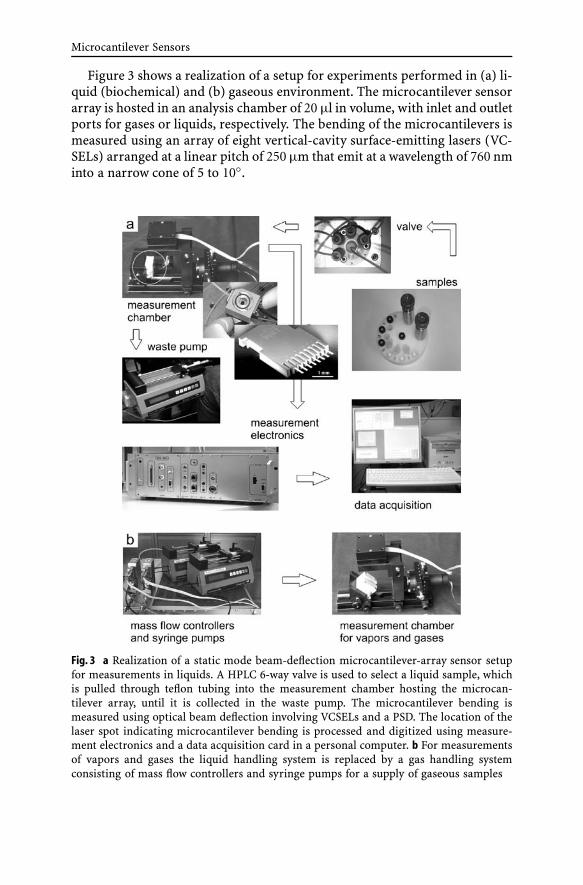
Figure 3 shows a realization of a setup for experiments performed in (a) li-quid (biochemical) and (b) gaseous environment. The microcantilever sensorarray is hosted in an analysis chamber of 20 µl in volume, with inlet and outletports for gases or liquids, respectively. The bending of the microcantilevers ismeasured using an array of eight vertical-cavity surface-emitting lasers (VC-SELs) arranged at a linear pitch of 250 µm that emit at a wavelength of 760 nminto a narrow cone of 5 to 10◦.
Fig. 3 a Realization of a static mode beam-deflection microcantilever-array sensor setupfor measurements in liquids. A HPLC 6-way valve is used to select a liquid sample, whichis pulled through teflon tubing into the measurement chamber hosting the microcan-tilever array, until it is collected in the waste pump. The microcantilever bending ismeasured using optical beam deflection involving VCSELs and a PSD. The location of thelaser spot indicating microcantilever bending is processed and digitized using measure-ment electronics and a data acquisition card in a personal computer. b For measurementsof vapors and gases the liquid handling system is replaced by a gas handling systemconsisting of mass flow controllers and syringe pumps for a supply of gaseous samples
H.P. Lang · C. Gerber
The light of each VCSEL is collimated and focused onto the apex of the cor-responding microcantilever by a pair of achromatic doublet lenses, 12.5 mmin diameter. This size was selected in order to make sure that all eight laserbeams pass through the lenses close to its center in order to minimize scatter-ing, chromatic, and spherical aberration artifacts. The light is then reflectedoff the gold-coated surface of the cantilever and hits the surface of a PSD.As only a single PSD is used, the eight lasers cannot be switched on sim-ultaneously. Therefore, a time-multiplexing procedure is used to switch thelasers on and off sequentially at typical intervals of 10–100 ms. The result-ing deflection signal is digitized and stored together with time information ona personal computer (PC), which also controls the multiplexing of the VCSELsas well as the switching of the valves and mass flow controllers used for settingthe composition ratio of the analyte mixture.
The measurement setup for liquids consists of a poly-etheretherketone(PEEK) liquid cell, which contains the cantilever array and is sealed by a vi-ton O-ring and a glass plate. The VCSELs and the PSD are mounted on a metalframe around the liquid cell. After preprocessing the position of the deflectedlight beam using a current-to-voltage converter and amplifier stage, the sig-nal is digitized in an analog-to-digital converter and stored on a PC. Theliquid cell is equipped with inlet and outlet ports for liquids. They are con-nected via 0.18 mm of i.d. teflon tubing to individual thermally-equilibratedglass containers, in which the biochemical liquids are stored. A six-positionvalve allows the inlet to the liquid chamber to be connected to each of theliquid-sample containers separately. The liquids are pulled through the liquidchamber by means of a syringe pump connected to the outlet of the cham-ber. A peltier element located beneath the microcantilever array in the PEEKchamber allows regulating the temperature within the chamber. The entireexperimental setup is housed in a temperature-controlled box regulated withan accuracy of 0.01 K to the target temperature.
2Operating Modes
A microcantilever sensor is a versatile tool for the investigation of varioussample properties and allows to follow reactions occurring on its surface. Var-ious operating modes have been presented.
2.1Static Mode
Gradual bending of a microcantilever with molecular coverage is referred toas operation in the “static mode”. Various environments are possible, suchas vacuum, ambient environment, and liquids. In a gaseous environment,
Microcantilever Sensors
molecules adsorb on the functionalized sensing surface and form a molecu-lar layer, provided there is affinity for the molecules to adhere to the surface.Polymer sensing layers show a partial sensitivity, because molecules fromthe environment diffuse into the polymer layer at different rates, mainly de-pending on the size and solubility of the molecules in the polymer layer.By selecting polymers among a wide range of hydrophilic/hydrophobic lig-ands, the chemical affinity of the surface can be influenced, because differentpolymers vary in diffusion suitability for polar/unpolar molecules. Thus, fordetection in the gas phase, the polymers can be chosen according to the de-tection problem, i.e. what the applications demand. Typical chemicals to bedetected are volatile organic compounds (VOCs).
Static-mode operation in liquids, however, usually requires rather specificsensing layers, based on molecular recognition, such as DNA hybridization orantigen-antibody recognition.
2.2Dynamic Mode
If the molecules adsorb as a monolayer, the coverage and therewith the massadsorbed can be determined from the static deflection signal. More gen-erally, information on the amount of molecules adsorbed can be obtainedby oscillating the microcantilever at its eigenfrequency. However, the sur-face coverage is basically not known. Furthermore, molecules on the surfacemight be exchanged with molecules from the environment in a dynamic equi-librium.
In contrast, mass changes can be determined accurately by tracking theeigenfrequency of the microcantilever during mass adsorption or desorption.The eigenfrequency equals the resonance frequency of an oscillating micro-cantilever if its elastic properties remain unchanged during the moleculeadsorption/desorption process and damping effects are negligible. This oper-ation mode is called the dynamic mode. The microcantilever is used as a mi-crobalance, as with mass addition on the cantilever surface, the cantilever’seigenfrequency will shift to a lower value. The mass change on a rectangularcantilever is calculated [9] according to
∆m = (k/4π2)× (1/f 21 – 1/f 2
0 ) , (10)
where f0 is the eigenfrequency before the mass change occurs, and f1 theeigenfrequency after the mass change. For the calculation of the spring con-stant k of the cantilever see Eq. 1.
Mass-change determination can be combined with varying environmenttemperature conditions to obtain a method introduced in the literature as“micromechanical thermogravimetry” [14]. The sample to be investigated ismounted onto the cantilever. Its mass should not exceed several hundrednanograms. In case of adsorption, desorption, or decomposition processes,
H.P. Lang · C. Gerber
mass changes in the picogram range can be observed in real time by trackingthe resonance-frequency shift.
Dynamic mode operation in a liquid environment poses problems, such ashigh damping of the cantilever oscillation due to the high viscosity of the sur-rounding media. This results in a low quality factor Q of the oscillation, andthe resonance frequency shift is difficult to track with high resolution. Thequality factor is defined as
Q = 2∆f /f0 , (11)
whereas in air a frequency resolution of below 1 Hz is easily achieved, reso-lution values of about 20 Hz are already to be considered very good formeasurements in a liquid environment. In the case of damping or changesof the elastic properties of the cantilever during the experiment, e.g., a stiff-ening or softening of the spring constant by adsorption of a molecule layer,the measured resonance frequency will not be exactly the same as the eigen-frequency, and the mass derived from the frequency shift will be inaccurate.Unlike in ultrahigh vacuum conditions [19, 20], where resonance frequencyis equal to eigenfrequency, these terms should be carefully distinguishedfor operation in a large damping environment, as described, for example,in [21].
2.3Heat Mode
For a microcantilever that is coated with metal layers, thermal expansion dif-ferences in cantilever and coating layer will have to be taken into account, asthey will further influence cantilever bending as a function of temperature.This mode of operation is referred to as “heat mode” and causes cantileverbending because of differing thermal expansion coefficients in sensor layerand cantilever materials [8]:
∆z = 1.25× (α1 – α2)× (t1 + t2)/t22κ × l3P/(α1t1 + α2t2)w . (12)
Here α1, α2 are the thermal expansion coefficients of the microcantilever andcoating materials, t1, t2 the material thicknesses, P is the total power gener-ated on the cantilever, and κ a geometry parameter of the cantilever device.
Heat changes are either caused by external influences, such as a change intemperature, occur directly on the surface by exothermal, e.g., catalytic, re-actions, or are due to material properties of a sample attached to the apexof the cantilever (micromechanical calorimetry). The sensitivity of the can-tilever heat mode is orders of magnitude higher than that of traditionalcalorimetric methods performed on milligram samples, as it only requiresnanogram amounts of sample and achieves nanojoules [9] to picojoules [22,23] sensitivity.
Microcantilever Sensors
These three measurement modes have established cantilevers as versatiletools to perform experiments in nanoscale science with very small amountsof material.
2.4Photothermal Spectroscopy
When a material adsorbs photons, a fraction of energy is converted into heat.This photothermal heating can be measured as a function of the light wave-length to provide optical absorption data of the material. The interaction oflight with a bimetallic cantilever creates heat on the cantilever surface, result-ing in a bending of the cantilever [24]. Such bimetallic-cantilever devices arecapable of detecting heat flows due to an optical heating power of 100 pW,being two orders of magnitude better than in conventional photothermalspectroscopy.
2.5Electrochemistry
A cantilever coated with a metallic layer (a measurement electrode) on oneside is placed in an electrolytic medium, e.g., a salt solution, together witha metallic reference electrode, usually made of a noble metal. Variations of thevoltage between measurement and reference electrode induce electrochem-ical processes on the measurement electrode (cantilever), e.g., the adsorptionor desorption of ions from the electrolyte solution onto the measurementelectrode. These processes lead to a bending of the cantilever according to theShuttleworth equation relating stress, surface energy, and its derivative withrespect to strain [25].
3Functionalization
It is essential that the surfaces of the cantilever are coated in a proper wayto provide suitable receptor surfaces for the molecules to be detected. Suchcoatings should be specific, homogeneous, stable, reproducible, and eitherreusable or designed for single use only. For static mode measurements, oneside of the cantilever should be passivated for blocking unwanted adsorption.Often, the cantilever’s upper side, the sensor side, is coated with a 20 nm thicklayer of gold to provide a platform for the binding of receptor molecules, forexample via thiol chemistry, whereas the lower side is passivated using silanechemistry for coupling an inert surface such as poly-ethylene glycol silane.Silanization is performed first on the silicon microcantilever. Then, a goldlayer is deposited on the top side of the cantilever, leaving the lower side un-
H.P. Lang · C. Gerber
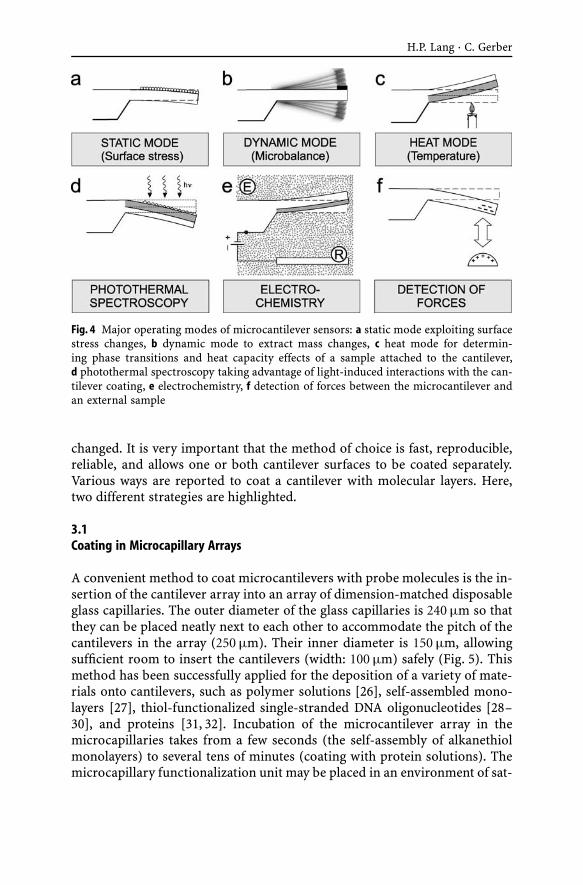
Fig. 4 Major operating modes of microcantilever sensors: a static mode exploiting surfacestress changes, b dynamic mode to extract mass changes, c heat mode for determin-ing phase transitions and heat capacity effects of a sample attached to the cantilever,d photothermal spectroscopy taking advantage of light-induced interactions with the can-tilever coating, e electrochemistry, f detection of forces between the microcantilever andan external sample
changed. It is very important that the method of choice is fast, reproducible,reliable, and allows one or both cantilever surfaces to be coated separately.Various ways are reported to coat a cantilever with molecular layers. Here,two different strategies are highlighted.
3.1Coating in Microcapillary Arrays
A convenient method to coat microcantilevers with probe molecules is the in-sertion of the cantilever array into an array of dimension-matched disposableglass capillaries. The outer diameter of the glass capillaries is 240 µm so thatthey can be placed neatly next to each other to accommodate the pitch of thecantilevers in the array (250 µm). Their inner diameter is 150 µm, allowingsufficient room to insert the cantilevers (width: 100 µm) safely (Fig. 5). Thismethod has been successfully applied for the deposition of a variety of mate-rials onto cantilevers, such as polymer solutions [26], self-assembled mono-layers [27], thiol-functionalized single-stranded DNA oligonucleotides [28–30], and proteins [31, 32]. Incubation of the microcantilever array in themicrocapillaries takes from a few seconds (the self-assembly of alkanethiolmonolayers) to several tens of minutes (coating with protein solutions). Themicrocapillary functionalization unit may be placed in an environment of sat-
Microcantilever Sensors
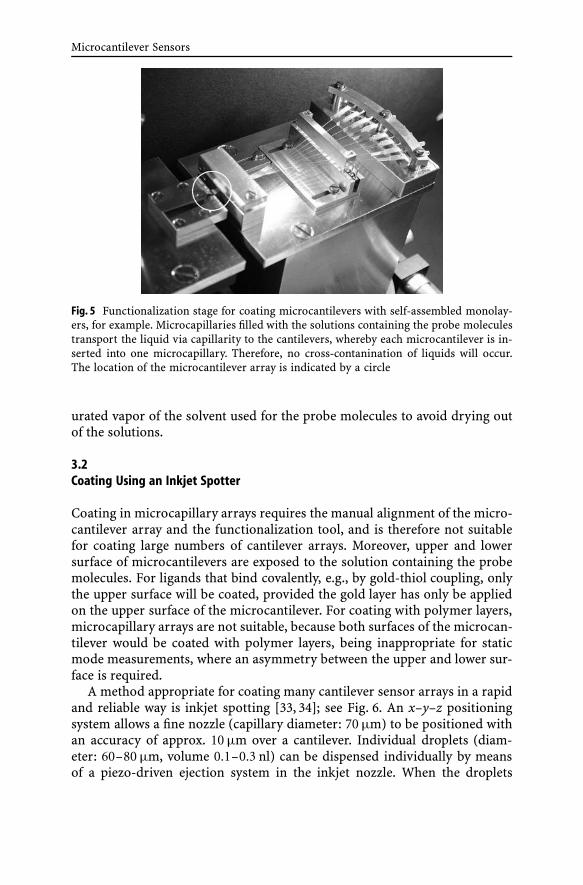
Fig. 5 Functionalization stage for coating microcantilevers with self-assembled monolay-ers, for example. Microcapillaries filled with the solutions containing the probe moleculestransport the liquid via capillarity to the cantilevers, whereby each microcantilever is in-serted into one microcapillary. Therefore, no cross-contanination of liquids will occur.The location of the microcantilever array is indicated by a circle
urated vapor of the solvent used for the probe molecules to avoid drying outof the solutions.
3.2Coating Using an Inkjet Spotter
Coating in microcapillary arrays requires the manual alignment of the micro-cantilever array and the functionalization tool, and is therefore not suitablefor coating large numbers of cantilever arrays. Moreover, upper and lowersurface of microcantilevers are exposed to the solution containing the probemolecules. For ligands that bind covalently, e.g., by gold-thiol coupling, onlythe upper surface will be coated, provided the gold layer has only be appliedon the upper surface of the microcantilever. For coating with polymer layers,microcapillary arrays are not suitable, because both surfaces of the microcan-tilever would be coated with polymer layers, being inappropriate for staticmode measurements, where an asymmetry between the upper and lower sur-face is required.
A method appropriate for coating many cantilever sensor arrays in a rapidand reliable way is inkjet spotting [33, 34]; see Fig. 6. An x–y–z positioningsystem allows a fine nozzle (capillary diameter: 70 µm) to be positioned withan accuracy of approx. 10 µm over a cantilever. Individual droplets (diam-eter: 60–80 µm, volume 0.1–0.3 nl) can be dispensed individually by meansof a piezo-driven ejection system in the inkjet nozzle. When the droplets
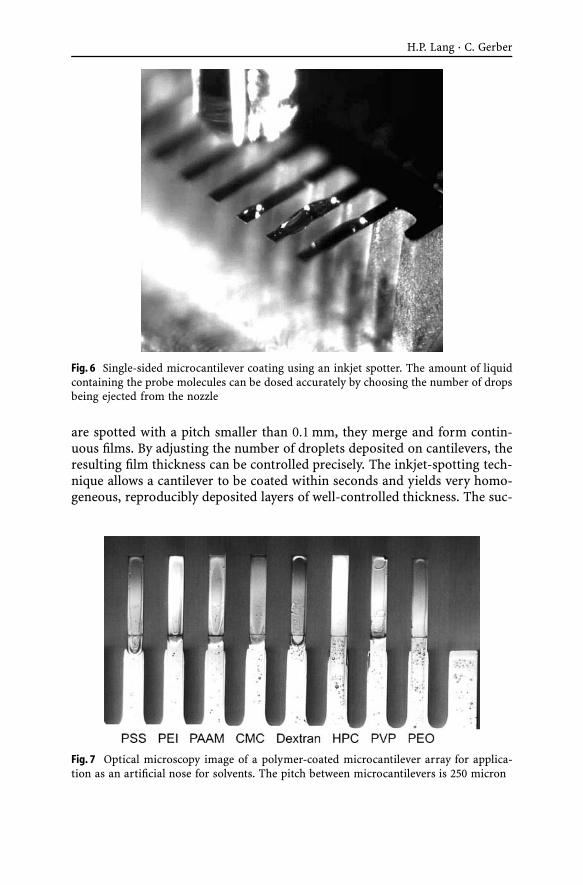
H.P. Lang · C. Gerber
Fig. 6 Single-sided microcantilever coating using an inkjet spotter. The amount of liquidcontaining the probe molecules can be dosed accurately by choosing the number of dropsbeing ejected from the nozzle
are spotted with a pitch smaller than 0.1 mm, they merge and form contin-uous films. By adjusting the number of droplets deposited on cantilevers, theresulting film thickness can be controlled precisely. The inkjet-spotting tech-nique allows a cantilever to be coated within seconds and yields very homo-geneous, reproducibly deposited layers of well-controlled thickness. The suc-
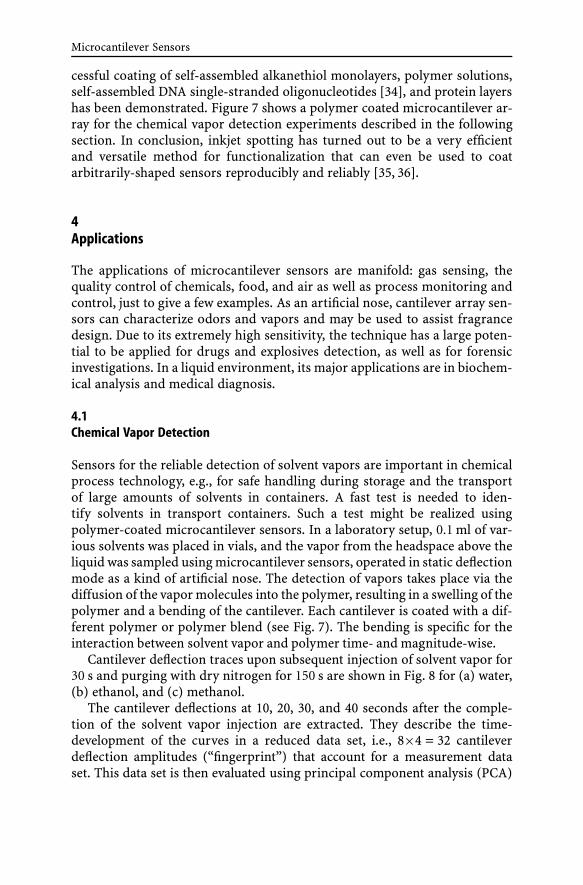
Fig. 7 Optical microscopy image of a polymer-coated microcantilever array for applica-tion as an artificial nose for solvents. The pitch between microcantilevers is 250 micron
Microcantilever Sensors
cessful coating of self-assembled alkanethiol monolayers, polymer solutions,self-assembled DNA single-stranded oligonucleotides [34], and protein layershas been demonstrated. Figure 7 shows a polymer coated microcantilever ar-ray for the chemical vapor detection experiments described in the followingsection. In conclusion, inkjet spotting has turned out to be a very efficientand versatile method for functionalization that can even be used to coatarbitrarily-shaped sensors reproducibly and reliably [35, 36].
4Applications
The applications of microcantilever sensors are manifold: gas sensing, thequality control of chemicals, food, and air as well as process monitoring andcontrol, just to give a few examples. As an artificial nose, cantilever array sen-sors can characterize odors and vapors and may be used to assist fragrancedesign. Due to its extremely high sensitivity, the technique has a large poten-tial to be applied for drugs and explosives detection, as well as for forensicinvestigations. In a liquid environment, its major applications are in biochem-ical analysis and medical diagnosis.
4.1Chemical Vapor Detection
Sensors for the reliable detection of solvent vapors are important in chemicalprocess technology, e.g., for safe handling during storage and the transportof large amounts of solvents in containers. A fast test is needed to iden-tify solvents in transport containers. Such a test might be realized usingpolymer-coated microcantilever sensors. In a laboratory setup, 0.1 ml of var-ious solvents was placed in vials, and the vapor from the headspace above theliquid was sampled using microcantilever sensors, operated in static deflectionmode as a kind of artificial nose. The detection of vapors takes place via thediffusion of the vapor molecules into the polymer, resulting in a swelling of thepolymer and a bending of the cantilever. Each cantilever is coated with a dif-ferent polymer or polymer blend (see Fig. 7). The bending is specific for theinteraction between solvent vapor and polymer time- and magnitude-wise.
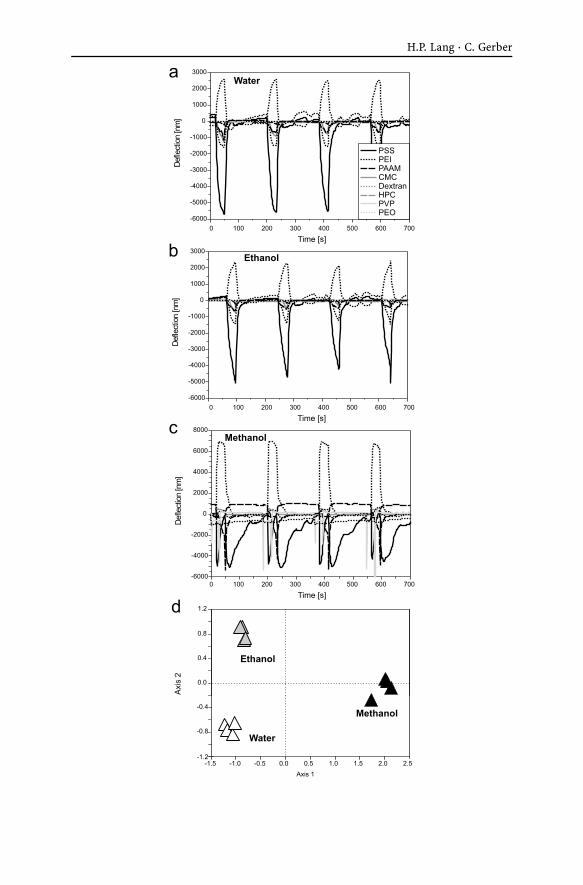
Cantilever deflection traces upon subsequent injection of solvent vapor for30 s and purging with dry nitrogen for 150 s are shown in Fig. 8 for (a) water,(b) ethanol, and (c) methanol.
The cantilever deflections at 10, 20, 30, and 40 seconds after the comple-tion of the solvent vapor injection are extracted. They describe the time-development of the curves in a reduced data set, i.e., 8×4 = 32 cantileverdeflection amplitudes (“fingerprint”) that account for a measurement dataset. This data set is then evaluated using principal component analysis (PCA)
H.P. Lang · C. Gerber
Microcantilever Sensors
Fig. 8� Application of microcantilever array sensors as an artificial electronic nose. Meas-urement traces of microcantilevers coated with polymers during the detection of a water,b ethanol, c methanol. For every solvent, four consecutive injections of vapor saturatedwith solvent are shown. Upon injection of solvent vapor, the microcantilevers deflect ina specific way due to the swelling of the polymer layer on exposure to the solvent va-por. Subsequent purging of the measurement chamber with dry nitrogen gas (flow rate:100 ml/min) promotes diffusion of the solvent molecules out of the polymer layer, re-sulting in a bending back of the microcantilevers to the baseline. d Principal componentanalysis (PCA) of the response patterns of all eight microcantilevers upon exposure to thethree different solvent vapors. Clear separation of the clusters proves the excellent distinc-tion capability of the artificial nose setup. Each symbol in the PCA plot corresponds toone of the injections in a–c
techniques, extracting the most dominant deviations in the responses forthe various sample vapors. The axes refer to projections of the multidimen-sional datasets into two dimensions (principal components). The labels in thePCA plot (Fig. 8d) indicate the individual measurements. The PCA plot showswell-separated clusters of measurements indicating the clear identification ofvapor samples. Even vapor mixtures can be analyzed using PCA [37].
4.2Explosives Detection
A large effort is also put into the development of inexpensive, highly selec-tive, and very sensitive small sensors that can be mass-produced and micro-fabricated. Current miniaturized versions, including ion mobility spectrom-eters [38] or nuclear quadrupole resonance [39] are bulky. Microcantileversensors offer sensitivities more than two orders of magnitude better thanquartz crystal microbalances [40], flexural plate wave oscillators [41], andsurface acoustic wave devices [42]. Several approaches to detect dangerouschemicals are already described in the literature: photomechanical chem-ical microsensors based on adsorption-induced and photo-induced stresschanges due to the presence of diisopropyl methyl phosphonate (DIMP),which is a model compound for phosphorous-containing chemical warfareagents, and trinitrotoluene (TNT), an explosive [43]. Further explosives fre-quently used include pentaerythritol tetranitrate (PETN) and hexahydro-1,3,5-triazine (RDX), often also with plastic fillers [44]. These compoundsare very stable, if no detonator is present. Their explosive power, however, isvery large, and moreover, the vapor pressures of PETN and RDX are very low,in the range of ppb and ppt. By functionalizing microcantilevers with self-assembled monolayers of 4-mercaptobeonzoic acid (4-MBA) PETN was de-tected at a level of 1400 ppt and RDX at a level of 290 ppt [44]. TNT was foundto readily stick to Si surfaces, suggesting the use of microcantilevers for TNTdetection, taking advantage of the respective adsorption/desorption kinet-ics [45, 46]. The detection of TNT via deflagration on a microcantilever is de-
H.P. Lang · C. Gerber
Table 1 Polymer coatings
Cantilever Polymer Full name of compound
1 PSS Poly(sodium 4-styrenesulfonate)2 PEI Polyethylenimine3 PAAM Poly(allylamine hydrochloride)4 CMC Carboxymethylcellulose sodium salt5 Dextran Dextran from Leuconostoc spp.6 HPC Hydroxypropyl cellulose7 PVP Polyvinylpyrrolidone8 PEO Poly(2-ethyl-2-oxazoline)
scribed by Pinnaduwage et al. [47]. They used piezoresistive microcantileverswhere the cantilever deflection was measured optically via beam deflection.TNT vapor from a generator placed 5 mm away from the microcantileverwas observed to adsorb on its surface resulting in a decrease of resonancefrequency. Application of an electrical pulse (10 V, 10 ms) to the piezoresis-tive cantilever resulted in deflagration of the TNT vapor and a bump in thecantilever bending signal. This bump was found to be related to the heat pro-duced during deflagration. The amount of heat released is proportional to thearea of the bump in the time vs. bending signal diagram of the process. Thedeflagration was found to be complete, as the same resonance frequency asbefore the experiment was observed. The amount of TNT mass involved wasdetermined as 50 pg. The technique was later extended to the detection ofPETN and RDX, where a much slower reaction kinetics was observed [48, 49].Traces of 2,4-dinitrotoluene (DNT) in TNT can also be used for detectionof TNT, because it is the major impurity in production grade TNT. Further-more DNT is a decomposition product of TNT. The saturation concentrationof DNT in air at 20 ◦C is 25 times higher than that of TNT. DNT was reportedto be detected at the 300 ppt level using polysiloxane polymer layers [50]. Themicrofabrication of electrostatically actuated resonant microcantilever beamsin CMOS technology for detection of the nerve agent stimulant dimethyl-methylphosphonate (DMMP) using polycarbosilane-coated beams [51] is animportant step towards an integrated platform based on silicon microcan-tilevers, which, besides compactness, might also include telemetry [52].
5Recent Literature and Outlook
In recent years the field of cantilever sensors has been very active. Somerecent developments are reviewed in [53–58]. Major topics published in-clude the following studies: the fabrication of silicon piezoresistive [59, 60] or
Microcantilever Sensors
polymer [61] cantilevers, detection of vapors and volatile compounds, e.g.,mercury vapor [62], HF vapor [63, 64], chemical vapors [65], as well as thedevelopment of gas sensors based on the piezoresistive concept [66]. Pd-based sensors for hydrogen [67], deuterium and tritium [68] are reported,as well as sensors taking advantage of the sensing properties of hydro-gels [69] or zeolites [70]. A humidity sensor is suggested in [71]. A field ofgrowing interest is the detection of explosives [47], pathogens [72], nerveagents [73], viruses [74], bacteria, e.g., E. coli, [75], and pesticides such asdichlorodiphenyltrichloroethane (DDT) [76]. The issues of detection of en-vironmental pollutants are discussed in [77]. A chemical vapor sensor basedon the bimetal technique is described in [78]. The measurement of electro-chemical redox reactions with cantilevers is reported [79]. In biochemicalapplications, detection of DNA [80, 81], proteins [82], prostate-specific anti-gen (PSA) [83], peptides using antibodies [84] and living cells [85] is possible.Medical applications involve diagnostics [86], drug discovery [87], and thedetection of glucose [88]. To increase the complexity of microcantilever ap-plications, two-dimensional microcantilever arrays have been proposed formultiplexed biomolecular analysis [89, 90].
For measurements in gaseous environment, a sensor application in dy-namic mode of piezoelectric cantilevers for an ultrasensitive nanobalanceis reported [91]. Micromolded plastic microcantilevers are proposed forchemical sensing [92], as well as micromachined silicon microcantilevers forgas sensing based on capacitive read-out [93]. In chemical sensing, ligand-functionalized microcantilevers for characterization of metal ion sensing arepresented [94], and an array of flexible microcantilever beams is used toobserve the action of rotaxane based artificial molecular muscles [95]. Theimportance of homeland security is discussed in [51], where electrostaticallyactuated resonant microcantilever beams in CMOS technology are utilized forthe detection of chemical weapons. An integrated sensor platform for home-land defense based on silicon microcantilevers is described in [52]. In thefield of electrochemistry, microcantilevers have been used to measure redox-induced surface stress [96], and a differential microcantilever-based systemfor measuring surface stress changes induced by electrochemical reactionshas been presented [97].
Many publications concern biochemical applications, such as a label-free immunosensor array using single-chain antibody fragments [32] andthe label-free analysis of transcription factors using microcantilever ar-rays [98]. Microcantilevers modified by horseradish peroxidase intercalatednano-assembly have been applied for hydrogen peroxide detection [99], andthe detection of cystamine dihydrochloride and glutaraldehyde [100, 101].Furthermore, a back-propagation artificial neural network recognition studyof analyte species and concentration has been presented [102].
Cantilever sensors for nanomechanical detection have been used for theobservation of specific protein conformation changes [103]. In the field of
H.P. Lang · C. Gerber
DNA hybridization detection, the chemomechanics of surface stresses in-duced by DNA hybridization has been studied [104] and the grafting densityand binding efficiency of DNA and proteins on gold surfaces has been charac-terized and improved [105]. An electrostatic microcantilever array biosensorhas been applied for DNA detection [106], and microcantilever sensors forDNA hybridization reactions or antibody-antigen interactions without usingexternal labels have been tested in dynamic mode [107].
An immunoassay of prostate-specific antigen (PSA) exploiting the res-onant frequency shift of piezoelectric nanomechanical microcantilevers isreported [108], as well as phospholipid vesicle adsorption measured in situusing resonating cantilevers in a liquid cell [109]. Microcantilevers have beenutilized to detect bacillus anthracis [110], and glucose oxidase multilayermodified microcantilevers can measure glucose [111].
Effort has been put into the refinement of the cantilever sensor method:a dimension dependence study of the thermomechanical noise of micro-cantilevers is available to determine the minimal detectable force and sur-face stress [112]. Furthermore, the geometrical and flow configurations forenhanced microcantilever detection within a fluidic cell have been investi-gated [113]. A microcapillary pipette-assisted method to prepare polyethy-lene glycol-coated microcantilever sensors has been suggested [114] and therole of material microstructure in plate stiffness with relevance to microcan-tilever sensors has been studied [115]. Double-sided surface stress cantileversensors for more sensitive cantilever surface stress measurement have beenproposed [116].
Enhanced microcantilever sensor techniques involve a biosensor basedon magnetostrictive microcantilevers [117], the piezoelectric self-sensing ofadsorption-induced microcantilever bending [118], the optical sequentialreadout of microcantilever arrays for biological detection achieved by scan-ning the laser beam [119], and cysteine monolayer modified microcantileversto monitor flow pulses in a liquid [120]. The photothermal effect has beenused to study dynamic elastic bending in microcantilevers [121]. For dynamicmode, temperature and pressure dependence of resonance in multi-layer mi-crocantilevers have been investigated [122] and the inaccuracy in the detec-tion of molecules has been discussed [123].
The influence of surface stress on the resonance behavior of microcan-tilevers in higher resonant modes has been studied [124] and an alternativesolution has been proposed to improve the sensitivity of resonant micro-cantilever chemical sensors by measuring in high-order modes and reducinggeometrical dimensions [125]. A modal analysis of microcantilever sensorswith environmental damping is reported [126]. Furthermore, theoretical workis available on the simulation of adsorption-induced stress of a microcantileversensor [127], the influence of nanobubbles on the bending of microcan-tilevers [128], the modeling and simulation of thermal effects in flexuralmicrocantilever resonator dynamics [129], and surface stress effects related to
Microcantilever Sensors
the resonance properties of cantilever sensors [130]. Further information aboutthe origin of the signal in microcantilever sensors, especially diffusion proper-ties, is found in [131]. Finally, a review on nanotechnologies for biomoleculardetection and medical diagnostics appeared [132].
Cantilever array sensors might be one of the solutions to the demand forminiaturized, ultrasensitive and fast-responsive sensors for application in gasdetection, and surveillance, as well as in biochemistry and medicine. For theirreliable use, some technical issues have still to be resolved, e.g., the simplifica-tion of the alignment procedure, which is related to the optical beam deflectionreadout. Here, the integration possibilities with piezoresistive microcantileversare much higher than for those based on optical beam-deflection. Silicon ni-tride coating [133] is a promising strategy to obtain the durable protection ofpiezoresistive microcantilevers, even in biochemical solutions.
Furthermore, the periphery for measurements with microcantilever arraysensors is required to be miniaturized as well, whereby microfluidic conceptshave to be integrated with the microcantilever array. Further downscalingis theoretically favorable as the sensitivity of the devices improves, but italso poses technical challenges to determine deflection signals from such tinystructures. The use of a few hundred nanometer long and a few ten nanome-ter thick nanocantilevers has been reported to yield a dramatical increasein performance [134, 135], but their practical use becomes very complicated,e.g., as far as the functionalization, the sample handling, and the readout areconcerned. The field is open to welcome completely new ideas for efficientworking procedures for nanocantilever sensors.
Acknowledgements We thank R. McKendry (University College London, London, U.K.),M. Hegner, W. Grange, Th. Braun, J. Zhang, A. Bietsch, V. Barwich, M. Ghatkesar, F. Hu-ber, N. Backmann, J.-P. Ramseyer, A. Tonin, H.R. Hidber, E. Meyer and H.-J. Güntherodt(University of Basel, Basel, Switzerland) for valuable contributions and discussions,as well as U. Drechsler, M. Despont, H. Schmid, E. Delamarche, H. Wolf, R. Stutz,R. Allenspach, and P.F. Seidler (IBM Research, Zurich Research Laboratory, Rüschlikon,Switzerland). We also thank the European Union FP 6 Network of Excellence FRONTIERSfor support. This project is funded partially by the National Center of Competence in Re-search in Nanoscience (Basel, Switzerland), the Swiss National Science Foundation andthe Commission for Technology and Innovation (Bern, Switzerland).
References
1. Wilfinger RJ, Bardell PH, Chhabra DS (1968) IBM J Res Dev 12:1132. Heng TMS (1971) IEEE Trans Microwave Theory Techn 19:6523. Petersen KE (1979) IBM J Res Develop 23:3764. Kolesar ES (1983) US Patent 4 549 4275. Binnig G, Quate CF, Gerber C (1986) Phys Rev Lett 56:9306. Itoh T, Suga T (1994) Appl Phys Lett 64:377. Cleveland JP, Manne S, Bocek D, Hansma PK (1993) Rev Sci Instrum 64:4038. Gimzewski JK, Gerber C, Meyer E, Schlittler RR (1994) Chem Phys Lett 217:589
H.P. Lang · C. Gerber
9. Thundat T, Warmack RJ, Chen GY, Allison DP (1994) Appl Phys Lett 64:289410. Thundat T, Chen GY, Warmack RJ, Allison DP, Wachter EA (1995) Anal Chem 67:51911. Lang HP, Berger R, Andreoli C, Brugger J, Despont M, Vettiger P, Gerber C,
Gimzewski J, Ramseyer JP, Meyer E, Güntherodt HJ (1998) Appl Phys Lett 72:38312. Stoney GG (1909) Proc R Soc London, Ser A 82:17213. von Preissig FJ (1989) J Appl Phys 66:426214. Berger R, Lang HP, Gerber C, Gimzewski JK, Fabian JH, Scandella L, Meyer E, Gün-
therodt HJ (1998) Chem Phys Lett 294:36315. Lee C, Itoh T, Ohashi T, Maeda R, Suga T (1997) J Vac Sci Technol B 15:155916. Meyer G, Amer NM (1988) Appl Phys Lett 53:240017. Jeon S, Jung N, Thundat T (2007) Sens Actuators B 122:36518. Godin M, Williams PJ, Tabard-Cossa V, Laroche O, Beaulieu LY, Lennox RB, Grut-
ter P (2004) Langmuir 20:709019. Ekinci KL, Roukes ML (2005) Rev Sci Instr 76:06110120. Ilic B, Craighead HG, Krylov S, Senaratne W, Ober C, Neuzil P (2004) J Appl Phys
95:369421. Braun T, Barwich V, Ghatkesar MK, Bredekamp AH, Gerber C, Hegner M, Lang HP
(2005) Phys Rev E 72:03190722. Bachels T, Schäfer R (1999) Chem Phys Lett 300:17723. Bachels T, Tiefenbacher F, Schäfer R (1999) J Chem Phys 110:1000824. Barnes JR, Stephenson RJ, Welland ME, Gerber C, Gimzewski JK (1994) Nature
372:7925. Tabard-Cossa V, Godin M, Burgess IJ, Monga T, Lennox RB, Grutter P (2007) Anal
Chem 79:813626. Baller MK, Lang HP, Fritz J, Gerber C, Gimzewski JK, Drechsler U, Rothuizen H, De-
spont M, Vettiger P, Battiston FM, Ramseyer JP, Fornaro P, Meyer E, Güntherodt HJ(2000) Ultramicroscopy 82:1
27. Fritz J, Baller MK, Lang HP, Strunz T, Meyer E, Güntherodt HJ, Delamarche E,Gerber C, Gimzewski JK (2000) Langmuir 16:9694
28. Fritz J, Baller MK, Lang HP, Rothuizen H, Vettiger P, Meyer E, Güntherodt HJ, Ger-ber C, Gimzewski JK (2000) Science 288:316
29. McKendry R, Zhang J, Arntz Y, Strunz T, Hegner M, Lang HP, Baller MK, Certa U,Meyer E, Güntherodt HJ, Gerber C (2002) Proc Natl Acad Sci USA 99:9783
30. Zhang J, Lang HP, Huber F, Bietsch A, Grange W, Certa U, McKendry R, GüntherodtHJ, Hegner M, Gerber C (2006) Nat Nanotechn 1:214
31. Arntz Y, Seelig JD, Lang HP, Zhang J, Hunziker P, Ramseyer JP, Meyer E, Hegner M,Gerber C (2003) Nanotechnology 14:86
32. Backmann N, Zahnd C, Huber F, Bietsch A, Plückthun A, Lang HP, Güntherodt HJ,Hegner M, Gerber C (2005) Proc Natl Acad Sci USA 102:14587
33. Bietsch A, Hegner M, Lang HP, Gerber C (2004) Langmuir 20:511934. Bietsch A, Zhang J, Hegner M, Lang HP, Gerber C (2004) Nanotechnology 15:87335. Lange D, Hagleitner C, Hierlemann A, Brand O, Baltes H (2002) Anal Chem 74:308436. Savran CA, Burg TP, Fritz J, Manalis SR (2003) Appl Phys Lett 83:165937. Taurino AM, Distante C, Siciliano P, Vasanelli L (2003) Sens Actuators B 93:11738. Ewing RG, Miller CJ (2001) Field Anal Chem Technol 5:21539. Garroway AN, Buess ML, Miller JB, Suits BH, Hibbs AD, Barrall GA, Matthews R,
Burnett LJ (2001) IEEE Trans Geosci Remote Sens 39:110840. O’Sullivan CK, Guilbault GG (1999) Biosens Bioelectron 14:66341. Cunningham B, Weinberg M, Pepper J, Clapp C, Bousquet R, Hugh B, Kant R, Daly C,
Hauser E (2001) Sens Actuators B 73:112
Microcantilever Sensors
42. Grate JW (2000) Chem Rev 100:2627 (Washington, DC)43. Datskos PG, Sepaniak MJ, Tipple CA, Lavrik N (2001) Sens Actuators B 76:39344. Pinnaduwage LA, Boiadjiev V, Hawk JE, Thundat T (2003) Appl Phys Lett 83:147145. Muralidharan G, Wig A, Pinnaduwage LA, Hedden D, Thundat T, Lareau RT (2003)
Ultramicroscopy 97:43346. Pinnaduwage LA, Yi D, Tian F, Thundat T, Lareau RT (2004) Langmuir 20:269047. Pinnaduwage LA, Wig A, Hedden DL, Gehl A, Yi D, Thundat T, Lareau RT (2004)
J Appl Phys 95:587148. Pinnaduwage LA, Thundat T, Gehl A, Wilson SD, Hedden DL, Lareau RT (2004)
Ultramicroscopy 100:21149. Pinnaduwage LA, Gehl A, Hedden DL, Muralidharan G, Thundat T, Lareau RT,
Sulchek T, Manning L, Rogers B, Jones M, Adams JD (2003) Nature 425:47450. Pinnaduwage LA, Thundat T, Hawk JE, Hedden DL, Britt R, Houser EJ, Stepnowski S,
McGill RA, Bubb D (2004) Sens Actuators B 99:22351. Voiculescu I, Zaghloul ME, McGill RA, Houser EJ, Fedder GK (2005) IEEE Sensors J
5:64152. Pinnaduwage LA, Ji HF, Thundat T (2005) IEEE Sensors J 5:77453. Majumdar A (2002) Disease Markers 18:16754. Lavrik NV, Sepaniak MJ, Datskos PG (2004) Rev Sci Instrum 75:222955. Ziegler C (2004) Anal Bioanal Chem 379:94656. Hansen KM, Thundat T (2005) Methods 37:5757. Carrascosa LG, Moreno M, Alvarez M, Lechuga LM (2005) TRAC-Trends Anal Chem
25:19658. Yan XD, Ji HF, Thundat T (2006) Curr Anal Chem 2:29759. Tang YJ, Fang J, Yan XD, Ji HF (2004) Sens Actuators B 97:10960. Forsen E, Nilsson SG, Carlberg P, Abadal G, Perez-Murano F, Esteve J, Montser-
rat J, Figueras E, Campabadal F, Verd J, Montelius L, Barniol N, Boisen A (2004)Nanotechnology 15:S628
61. McFarland AW, Poggi MA, Bottomley LA, Colton JS (2004) Rev Sci Instrum 75:275662. Rogers B, Manning L, Jones M, Sulchek T, Murray K, Beneschott B, Adams JD, Hu Z,
Thundat T, Cavazos H, Minne SC (2003) Rev Sci Instrum 74:489963. Mertens J, Finot E, Nadal MH, Eyraud V, Heintz O, Bourillot E (2004) Sens Actua-
tors B 99:5864. Tang YJ, Fang J, Xu XH, Ji HF, Brown GM, Thundat T (2004) Anal Chem 76:247865. Abedinov N, Popov C, Yordanov Z, Ivanov T, Gotszalk T, Grabiec P, Kulisch W,
Rangelow IW, Filenko D, Shirshov YJ (2003) Vac Sci Technol B 21:293166. Zhou J, Li P, Zhang S, Huang YP, Yang PY, Bao MH, Ruan G (2003) Microelectron
Eng 69:3767. Baselt DR, Fruhberger B, Klaassen E, Cemalovic S, Britton Jr. CL, Patel SV, Mlsna TE,
McCorkle D, Warmack B (2003) Sens Actuators B 88:12068. Fabre A, Finot E, Demoment J, Contreras S (2003) Ultramicroscopy 97:42569. Zhang YF, Ji HF, Brown GM, Thundat T (2003) Anal Chem 75:477370. Zhou J, Li P, Zhang S, Long YC, Zhou F, Huang YP, Yang PY, Bao MH (2003) Sens
Actuators B 94:33771. Lee CY, Lee GB (2003) J Micromech Microeng 13:62072. Weeks BL, Camarero J, Noy A, Miller AE, Stanker L, De Yoreo JJ (2003) Scanning
25:29773. Yang YM, Ji HF, Thundat T (2003) J Am Chem Soc 125:112474. Gunter RL, Delinger WG, Manygoats K, Kooser A, Porter TL (2003) Sens Actuators A
107:219
H.P. Lang · C. Gerber
75. Gfeller KY, Nugaeva N, Hegner M (2005) Biosens Bioelectron 21:52876. Alvarez M, Calle A, Tamayo J, Lechuga LM, Abad A, Montoya A (2003) Biosens
Bioelectron 18:64977. Cherian S, Gupta RK, Mullin BC, Thundat T (2003) Biosens Bioelectron 19:41178. Adams JD, Parrott G, Bauer C, Sant T, Manning L, Jones M, Rogers B, McCorkle D,
Ferrell TL (2003) Appl Phys Lett 83:342879. Quist F, Tabard-Cossa V, Badia A (2003) J Phys Chem B 107:1069180. Gunter RL, Zhine R, Delinger WG, Manygoats K, Kooser A, Porter TL (2004) IEEE
Sensors J 4:43081. Alvarez M, Carrascosa LG, Moreno M, Calle A, Zaballos A, Lechuga LM, Martinez C,
Tamayo J (2004) Langmuir 20:966382. Lee JH, Kim TS, Yoon KH (2004) Appl Phys Lett 84:318783. Wu G, Datar RH, Hansen KM, Thundat T, Cote RJ, Majumdar A (2001) Nat Biotech-
nol 19:85684. Kim BH, Mader O, Weimar U, Brock R, Kern DP (2003) J Vac Sci Technol B 21:147285. Saif MTA, Sager CR, Coyer S (2003) Ann Biomed Eng 31:95086. Kumar S, Bajpai RP, Bharadwaj LM (2003) IETE Techn Rev 20:36187. Zhang YF, Venkatachalan SP, Xu H, Xu XH, Joshi P, Ji HF, Schulte M (2004) Biosens
Bioelectron 19:147388. Pei JH, Tian F, Thundat T (2004) Anal Chem 76:29289. Khanafer K, Khaled ARA, Vafai K (2004) J Micromech Microeng 14:132890. Yue M, Lin H, Dedrick DE, Satyanarayana S, Majumdar A, Bedekar AS, Jenkins JW,
Sundaram S (2004) J Microelectromech Syst 13:29091. Shin S, Paik JK, Lee NE, Park JS, Park HD, Lee J (2005) Ferroelectrics 328:5992. McFarland AW, Colton JS (2005) J MEMS 14:137593. Amirola J, Rodríguez A, Castaner L, Santos JP, Gutierrez J, Horrillo MC (2005) Sens
Actuators B 111:24794. Dutta P, Chapman PJ, Datskos PG, Sepaniak MJ (2005) Anal Chem 77:660195. Liu Y, Flood AH, Bonvallett PA, Vignon SA, Northrop BH, Tseng HR, Jeppesen JO,
Huang TJ, Brough B, Baller M, Magonov S, Solares SD, Goddard WA, Ho CM, Stod-dart JF (2005) J Am Chem Soc 127:9745
96. Tabard-Cossa V, Godin M, Grutter P, Burgués I, Lennox RB (2005) J Phys Chem B109:17531
97. Tabard-Cossa V, Godin M, Beaulieu LY, Grutter P (2005) Sens Actuators B 107:23398. Huber F, Hegner M, Gerber C, Güntherodt HJ, Lang HP (2006) Biosens Bioelectron
21:159999. Yan XD, Shi XL, Hill K, Ji HF (2006) Anal Sci 22:205
100. Yoo KA, Na KH, Joung SR, Nahm BH, Kang CJ, Kim YS (2006) Japn J Appl Phys Pt1 45:515
101. Na KH, Kim YS, Kang CJ (2005) Ultramicroscopy 105:223102. Senesac LR, Dutta P, Datskos PG, Sepaniak MJ (2006) Anal Chim Acta 558:94103. Mukhopadhyay R, Sumbayev VV, Lorentzen M, Kjems J, Andreasen PA, Besen-
bacher F (2005) Nano Lett 5:2385104. Stachowiak JC, Yue M, Castelino K, Chakraborty A, Majumdar A (2006) Langmuir
22:263105. Castelino K, Kannan B, Majumdar A (2005) Langmuir 21:1956106. Zhang ZX, Li MQ (2005) Progr Biochem Biophys 32:314107. Tian F, Hansen KM, Ferrell TL, Thundat T (2005) Anal Chem 77:1601108. Lee JH, Hwang KS, Park J, Yoon KH, Yoon DS, Kim TS (2005) Biosens Bioelectron
20:2157
Microcantilever Sensors
109. Ghatnekar-Nilsson S, Lindahl J, Dahlin A, Stjernholm T, Jeppesen S, Hook F, Mon-telius L (2005) Nanotechnology 16:1512
110. Wig A, Arakawa ET, Passian A, Ferrell TL, Thundat T (2006) Sens Actuators B114:206
111. Yan XD, Xu XHK, Ji HF (2005) Anal Chem 77:6197112. Alvarez M, Tamayo J, Plaza JA, Zinoviev K, Dominguez C, Lechuga LM (2006) J Appl
Phys 99:024910113. Khanafer K, Vafai K (2005) Int J Heat Mass Transfer 48:2886114. Wright YJ, Kar AK, Kim YW, Scholz C, George MA (2005) Sens Actuators B 107:242115. McFarland AW, Colton JS (2005) J Micromech Microeng 15:1060116. Rasmussen PA, Grigorov AV, Boisen A (2005) J Micromech Microeng 15:1088117. Li SQ, Orona L, Li ZM, Cheng ZY (2006) Appl Phys Lett 88:073507118. Adams JD, Rogers B, Manning L, Hu Z, Thundat T, Cavazos H, Minne SC (2005) Sens
Actuators A 121:457119. Alvarez M, Tamayo J (2005) Sens Actuators B 106:687120. Tang YJ, Ji HF (2005) Instr Sci Technol 33:131121. Todorovic DM, Bojicic A (2005) J Phys IV 125:459122. Sandberg R, Svendsen W, Molhave K, Boisen A (2005) J Micromech Microeng
15:1454123. Luo C (2005) J Appl Mech – Transactions of the ASME 72:617124. McFarland AW, Poggi MA, Doyle MJ, Bottomley LA, Colton JS (2005) Appl Phys Lett
87:053505125. Lochon F, Dufour I, Rebiere D (2005) Sens Actuators B 108:979126. Dareing DW, Thundat T, Jeon SM, Nicholson M (2005) J Appl Phys 97:084902127. Dareing DW, Thundat T (2005) J Appl Phys 97:043526128. Jeon SM, Desikan R, Fang TA, Thundat T (2006) Appl Phys Lett 88:103118129. Jazar GN (2006) J Vibration Control 12:139130. Lu P, Lee HP, Lu C, O’Shea SJ (2005) Phys Rev B 72:085405131. Sheehan PE, Whitman LJ (2005) Nano Lett 5:803132. Chang MMC, Cuda G, Bunimovich YL, Gaspari M, Heath JR, Hill HD, Mirkin CA,
Nijdam AJ, Terracciano R, Thundat T, Ferrari M (2006) Curr Opin Chem Biol 10:11133. Aeschimann L, Meister A, Akiyama T, Chui BW, Niedermann P, Heinzelmann H, De
Rooij NF, Staufer U, Vettiger P (2006) Microelectr Eng 83:1698134. Yang JL, Despont M, Drechsler U, Hoogenboom BW, Frederix PLTM, Martin S, En-
gel A, Vettiger P, Hug HJ (2005) Appl Phys Lett 86:134101135. Yang J, Ono T, Esashi M (2000) Sens Actuators A 82:102