Embed Size (px)
Citation preview
PresentationMicrocalorimetry – Guiding the SAR Process
Agenda
• Principles of microcalorimetry• Factors involved in ligand/macromolecule binding• Application examples of Calorimetry
•
SAR•
Profiling existing drug molecules•
Confirming binding mechanisms•
Optimizing crystallization potential• Instrument overview
Microcalorimetry Offers Enhanced Information Content
•
Experimental biological relevance •
Label-free•
True in solution •
No immobilization requirement •
No molecular weight limitations •
Optical clarity unimportant•
Non-destructive•
Minimal to no assay development saves time and conserves sample
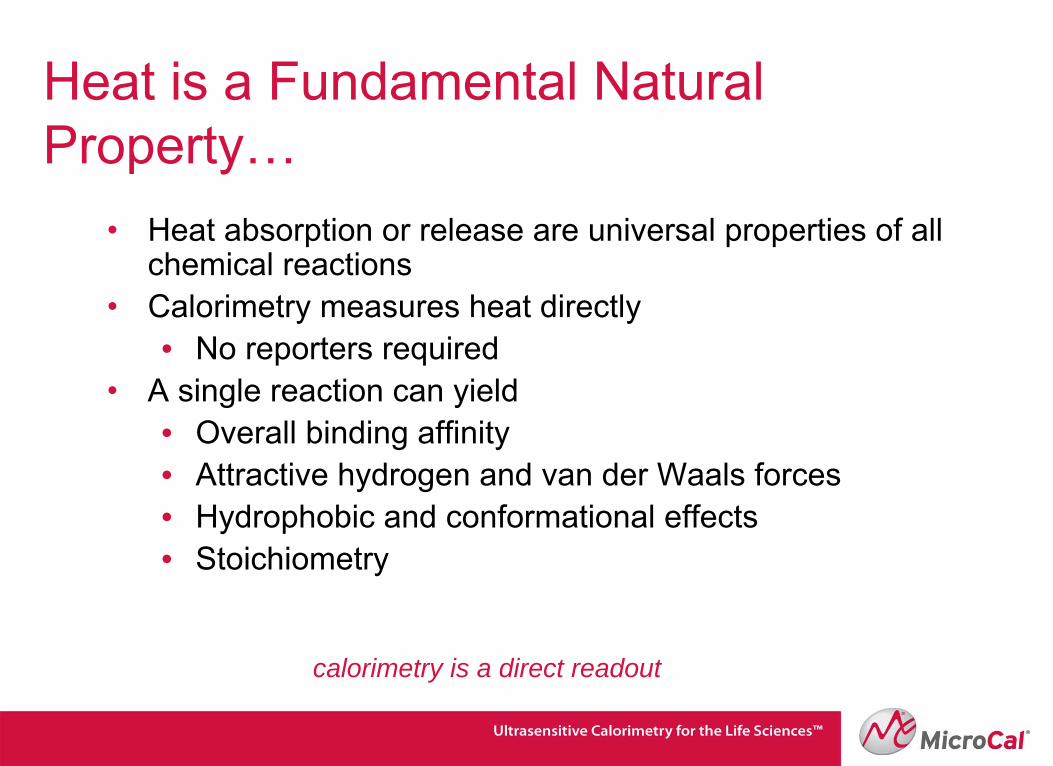
Heat is a Fundamental Natural Property…
•
Heat absorption or release are universal properties of all chemical reactions
•
Calorimetry measures heat directly•
No reporters required•
A single reaction can yield •
Overall binding affinity •
Attractive hydrogen and van der Waals forces
•
Hydrophobic and conformational effects •
Stoichiometry
calorimetry is a direct readout
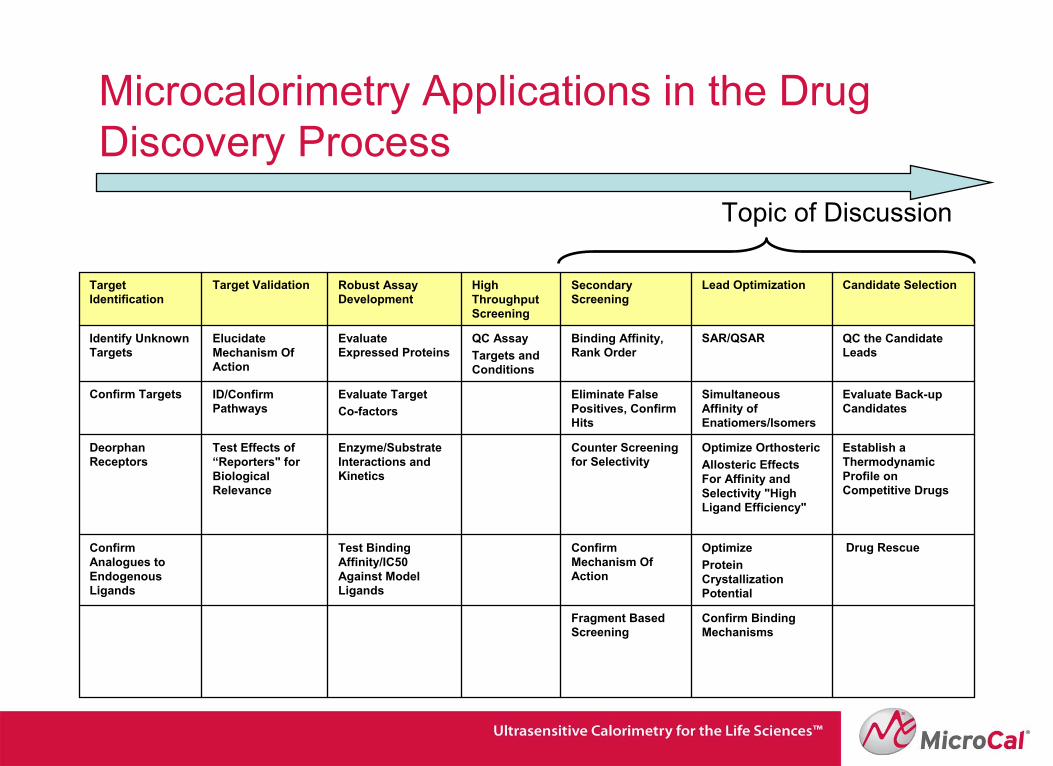
Microcalorimetry Applications in the Drug Discovery Process
Target Identification
Target Validation Robust Assay Development
High Throughput Screening
Secondary Screening
Lead Optimization Candidate Selection
Identify Unknown Targets
Elucidate Mechanism Of Action
Evaluate Expressed Proteins
QC AssayTargets and Conditions
Binding Affinity, Rank Order
SAR/QSAR QC the Candidate Leads
Confirm Targets ID/Confirm Pathways
Evaluate TargetCo-factors
Eliminate False Positives, Confirm Hits
Simultaneous Affinity of Enatiomers/Isomers
Evaluate Back-up Candidates
Deorphan
Receptors
Test Effects of “Reporters" for Biological Relevance
Enzyme/Substrate Interactions and Kinetics
Counter Screening for Selectivity
Optimize OrthostericAllosteric
Effects For Affinity and Selectivity "High Ligand Efficiency"
Establish a Thermodynamic Profile on Competitive Drugs
Confirm Analogues to Endogenous Ligands
Test Binding Affinity/IC50 Against Model Ligands
Confirm Mechanism Of Action
Optimize Protein Crystallization Potential
Drug Rescue
Fragment Based Screening
Confirm Binding Mechanisms
Topic of Discussion
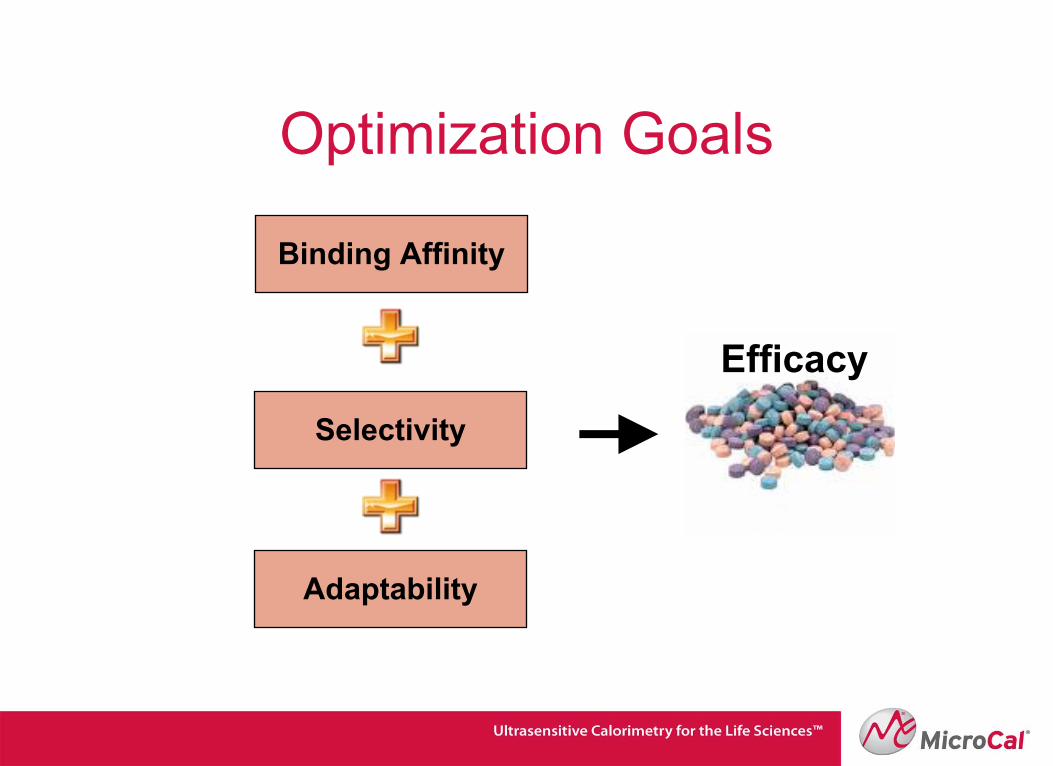
Optimization Goals
Efficacy
Binding Affinity
Selectivity
Adaptability
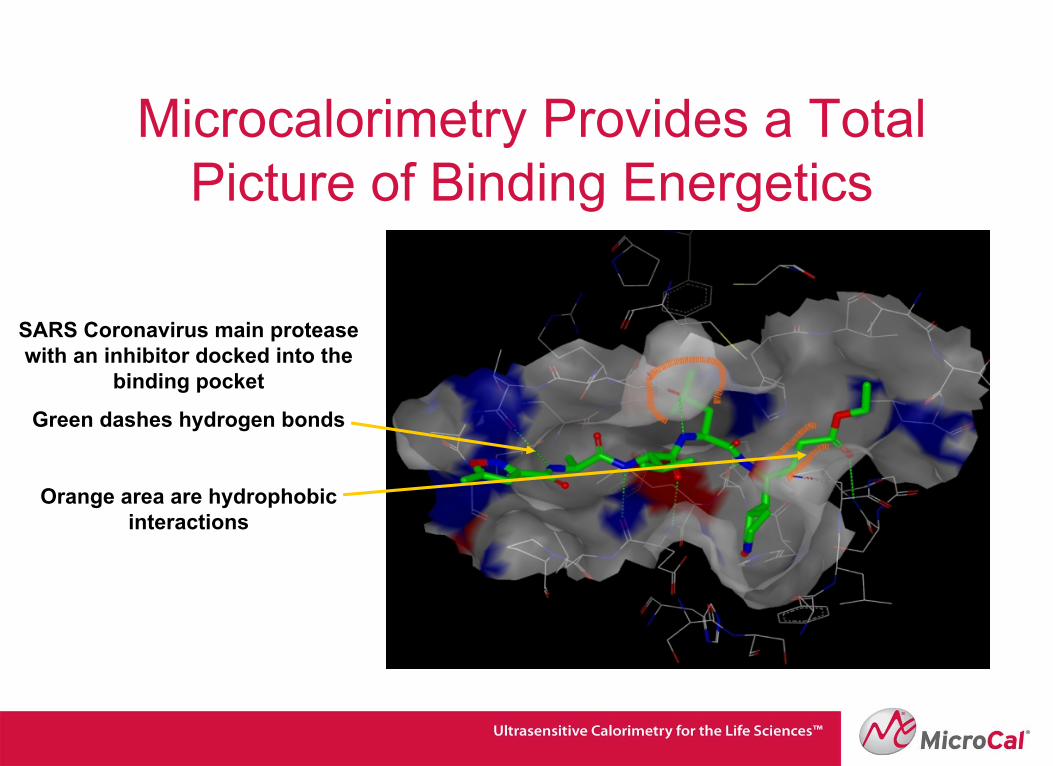
Microcalorimetry Provides a Total Picture of Binding Energetics
SARS Coronavirus main protease
with an inhibitor docked into the binding pocket
Green dashes hydrogen bonds
Orange area are hydrophobic interactions
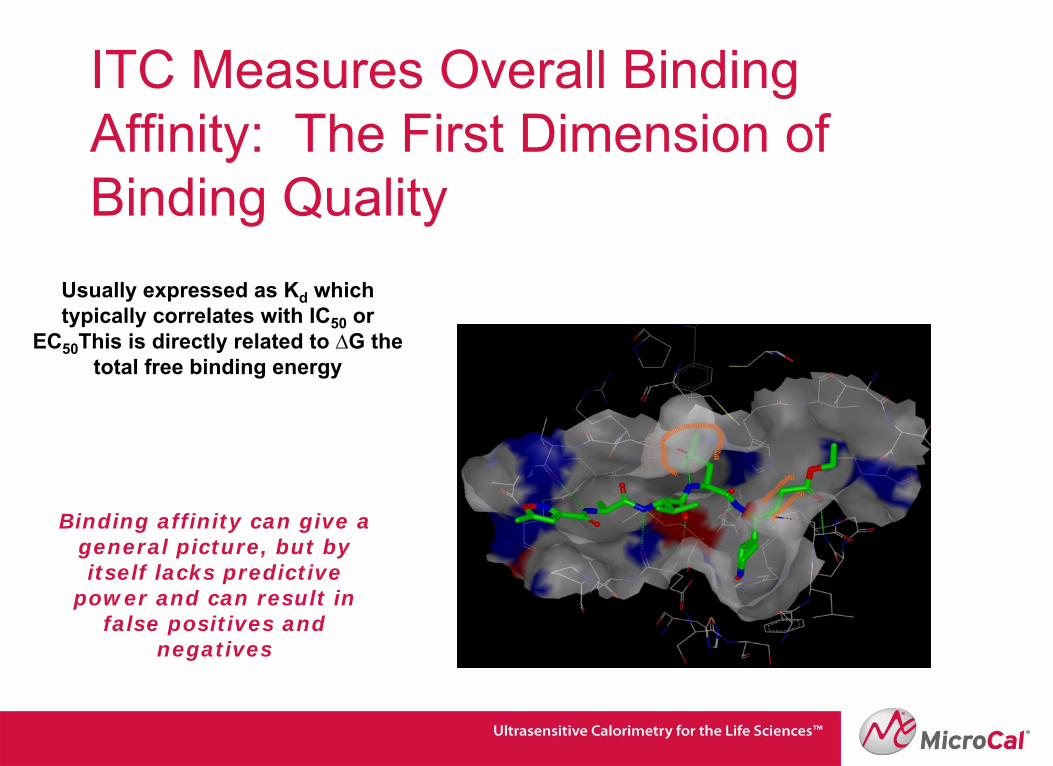
ITC Measures Overall Binding Affinity: The First Dimension of Binding Quality
Usually expressed as Kd
which typically correlates with IC50
or EC50
This is directly related to ∆G the total free binding energy
Binding affinity can give a general picture, but by itself lacks predictive
power and can result in false positives and
negatives
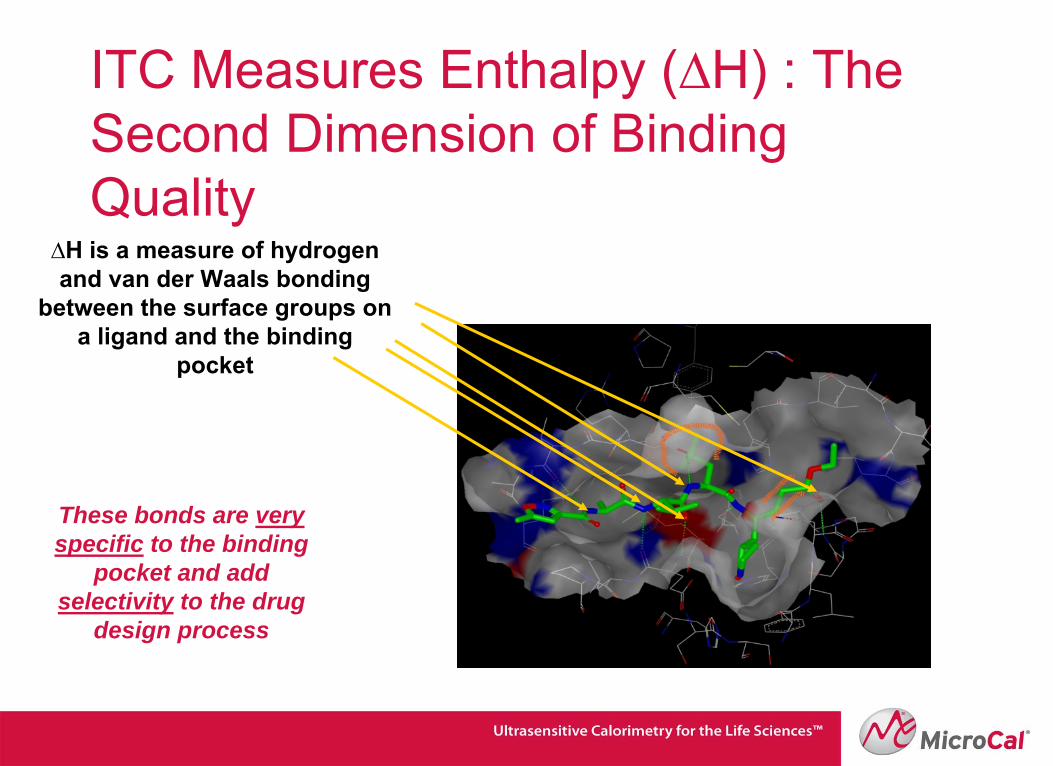
ITC Measures Enthalpy (∆H) : The Second Dimension of Binding Quality
∆H is a measure of hydrogen and van der
Waals bonding
between the surface groups on a ligand and the binding
These bonds are very specific to the binding
pocket and add selectivity to the drug
design process
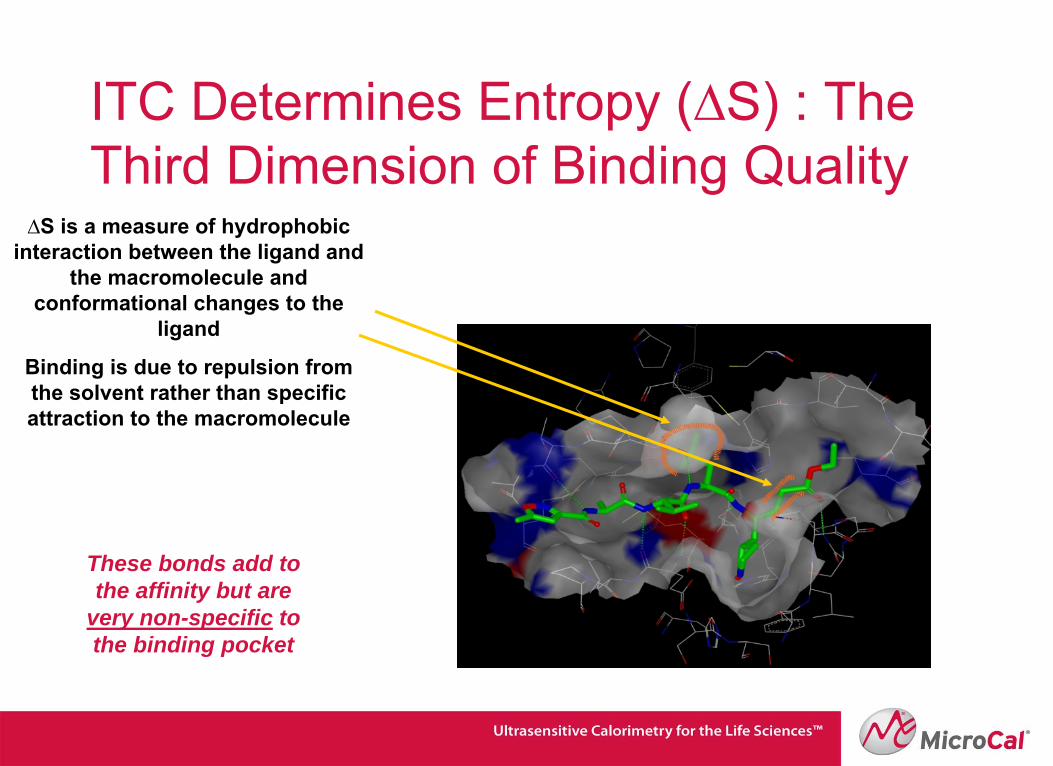
ITC Determines Entropy (∆S) : The Third Dimension of Binding Quality
∆S is a measure of hydrophobic interaction between the ligand and
the macromolecule and conformational changes to the
ligand
Binding is due to repulsion from the solvent rather than specific attraction to the macromolecule
These bonds add to the affinity but are
very non-specific to the binding pocket
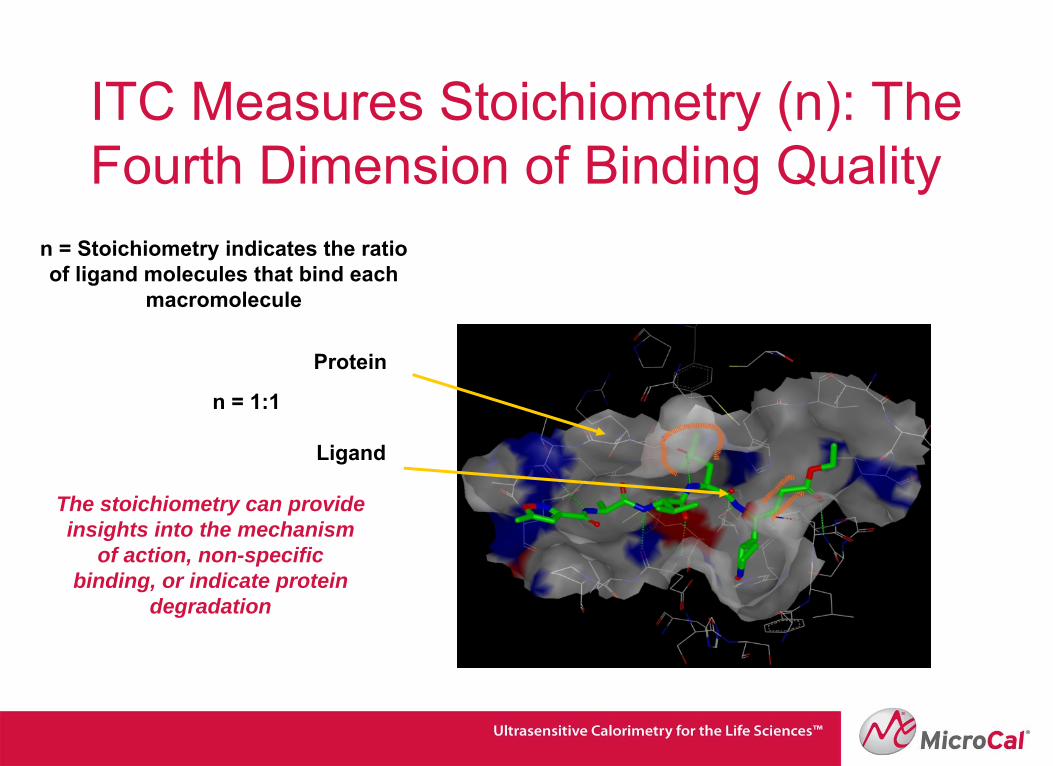
ITC Measures Stoichiometry (n): The Fourth Dimension of Binding Quality
n = Stoichiometry indicates the ratio of ligand molecules that bind each
macromolecule
The stoichiometry can provide insights into the mechanism
of action, non-specific binding, or indicate protein
degradation
n = 1:1
Protein
Ligand
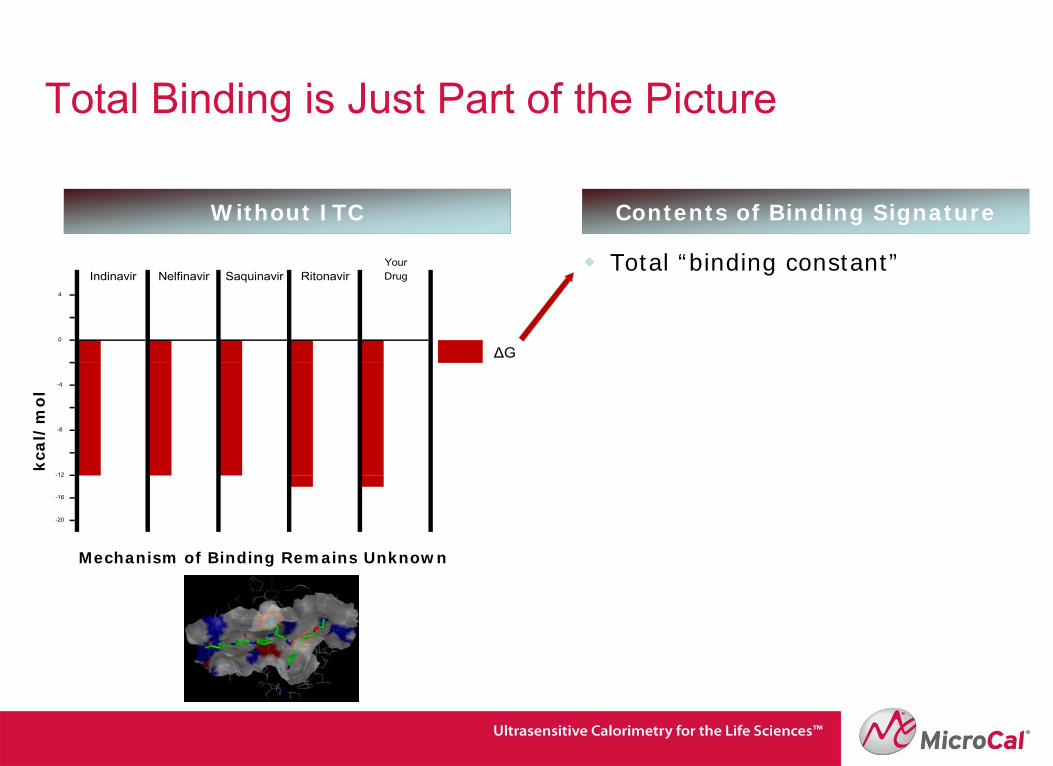
Total Binding is Just Part of the Picture
Total “binding constant”
Contents of Binding SignatureWithout ITC
Indinavir Nelfinavir Saquinavir Ritonavir DrugYour
ΔG
-12
-16
-20
4
0
-4
-8
kca
l/m
ol
Mechanism of Binding Remains Unknown
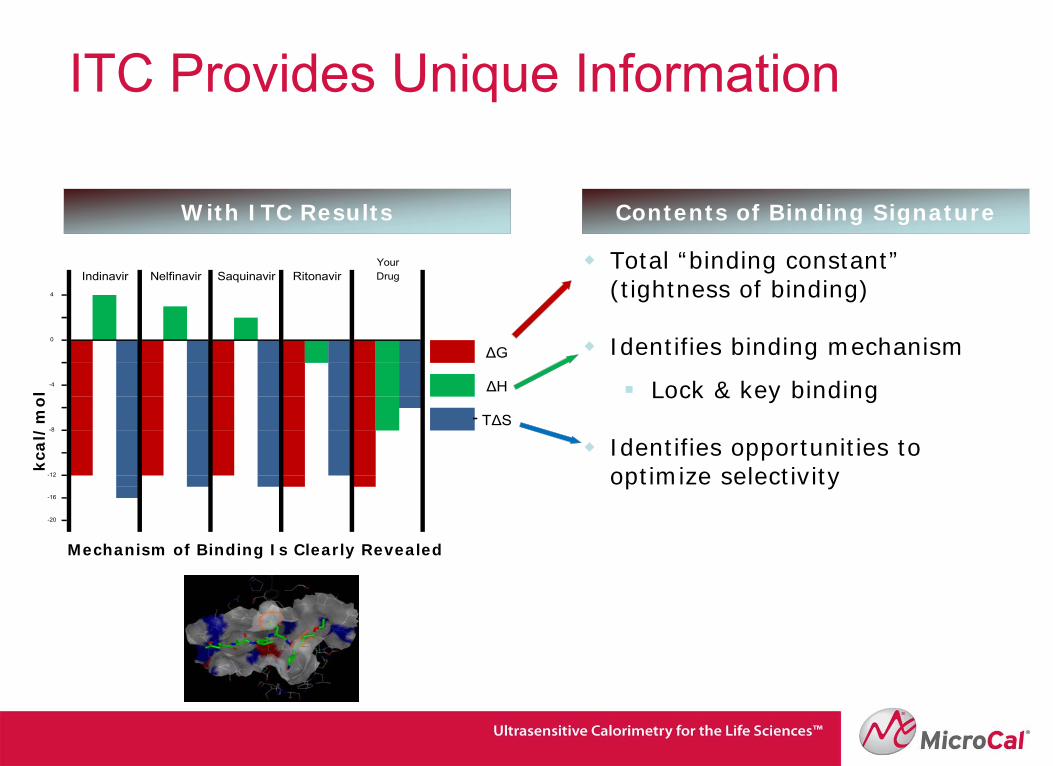
ITC Provides Unique Information
Total “binding constant”(tightness of binding)
Identifies binding mechanism
Lock & key binding
Identifies opportunities to optimize selectivity
Contents of Binding SignatureWith ITC Results
Nelfinavir Saquinavir Ritonavir Drug
-8
-12
-16
-20
ΔG
ΔH
0
-4
TΔS
4
YourIndinavir
kca
l/m
ol
Mechanism of Binding Is Clearly Revealed
-
Optimizing Diaminopyrimidine Renin Inhibitors
Aided by ITC and structural data
Abstracted from Sarver, et al, Anal. Biochem. 2007
-12-10
-8-6-4-2024
1
Kca
l/mol
∆G ∆H -T∆S
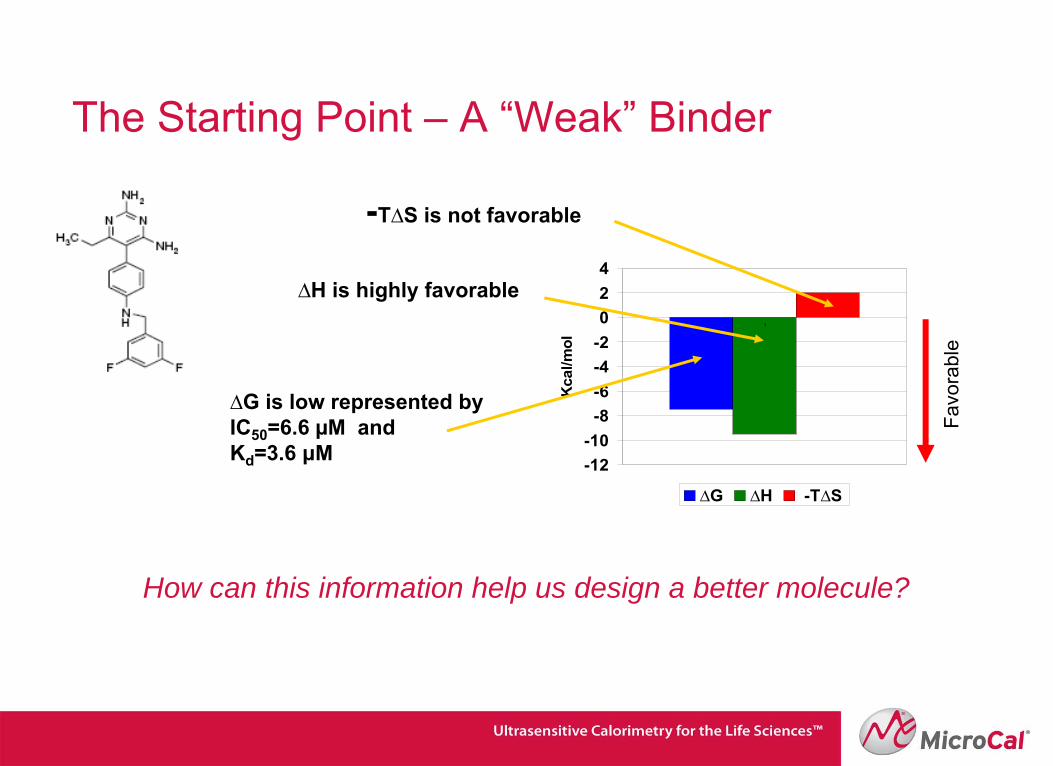
The Starting Point – A “Weak” Binder
How can this information help us design a better molecule?
∆H is highly favorable
-T∆S is not favorable
∆G is low represented byIC50
=6.6 µM and Kd
=3.6 μM
Favo
rabl
e
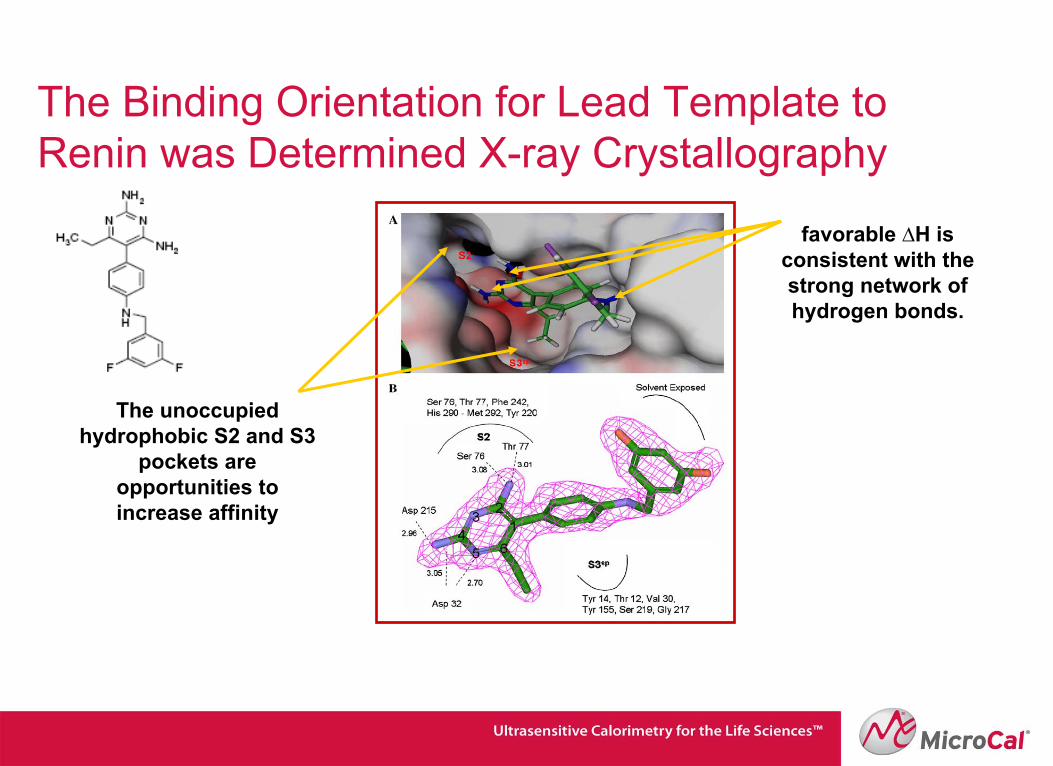
The Binding Orientation for Lead Template to Renin was Determined X-ray Crystallography
favorable ∆H is consistent with the strong network of hydrogen bonds.
The unoccupied hydrophobic S2 and S3
pockets are opportunities to increase affinity
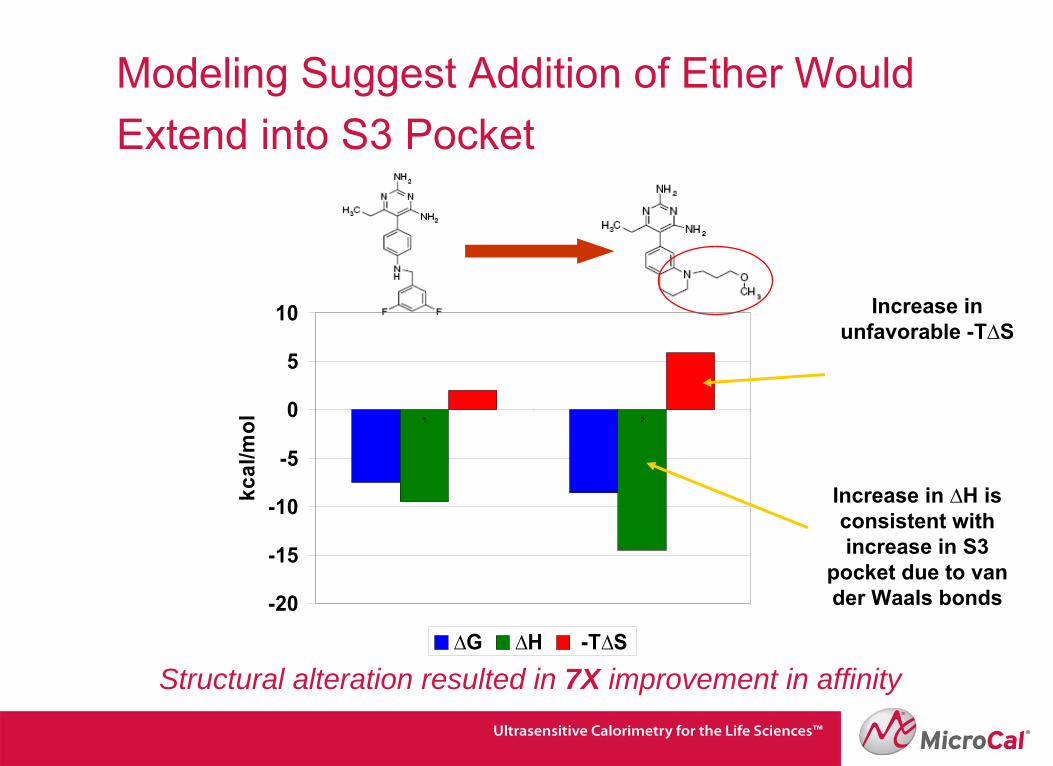
Modeling Suggest Addition of Ether Would Extend into S3 Pocket
-20
-15
-10
-5
0
5
10
1 2
kcal
/mol
∆G ∆H -T∆S
Increase in ∆H is consistent with increase in S3
pocket due to van der
Waals bonds
Structural alteration resulted in 7X improvement in affinity
Increase in unfavorable -T∆S
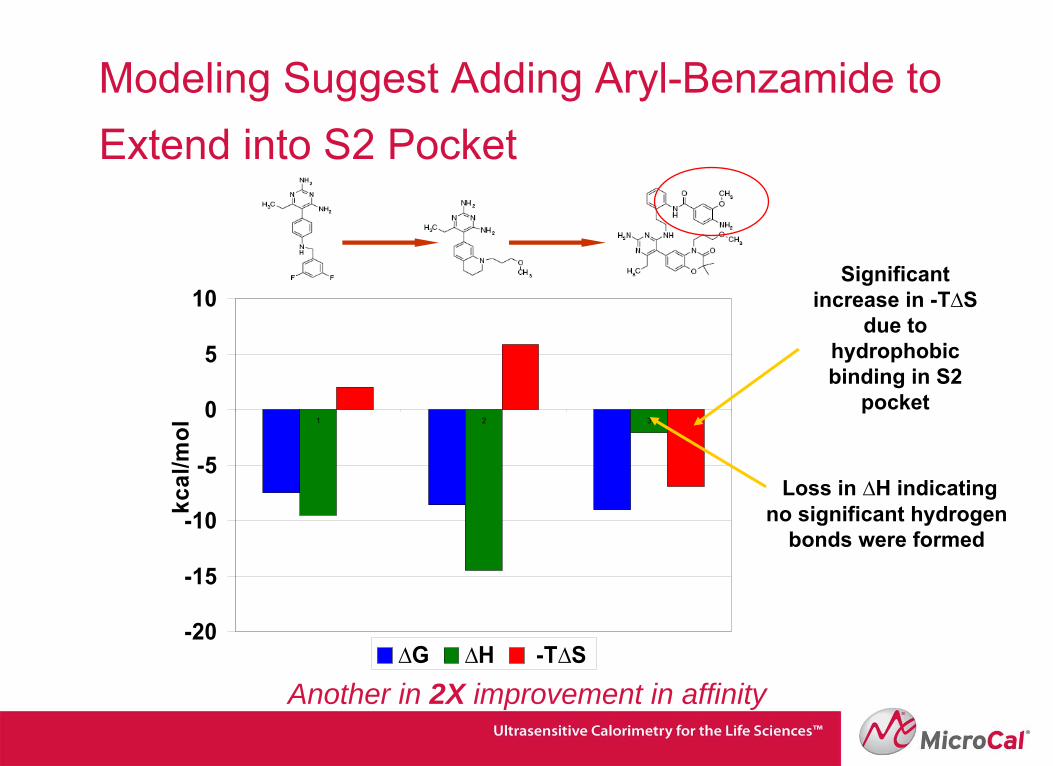
Modeling Suggest Adding Aryl-Benzamide to Extend into S2 Pocket
-20
-15
-10
-5
0
5
10
1 2 3
kcal
/mol
∆G ∆H -T∆S
Loss in ∆H indicating no significant hydrogen
bonds were formed
Another in 2X improvement in affinity
Significant increase in -T∆S
due to hydrophobic binding in S2
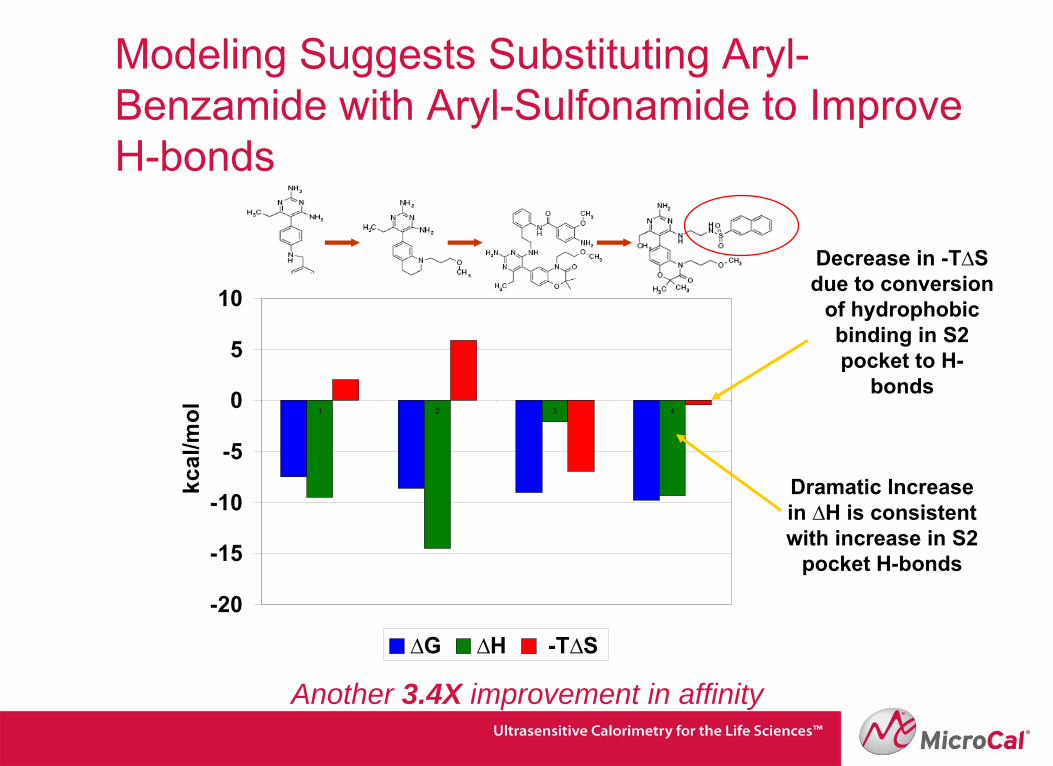
Modeling Suggests Substituting Aryl- Benzamide with Aryl-Sulfonamide to Improve H-bonds
-20
-15
-10
-5
0
5
10
1 2 3 4
kcal
/mol
∆G ∆H -T∆S
Another 3.4X improvement in affinity
Dramatic Increase in ∆H is consistent with increase in S2
pocket H-bonds
Decrease in -T∆S due to conversion
of hydrophobic binding in S2 pocket to H-
bonds
S2 S2
S3 S3
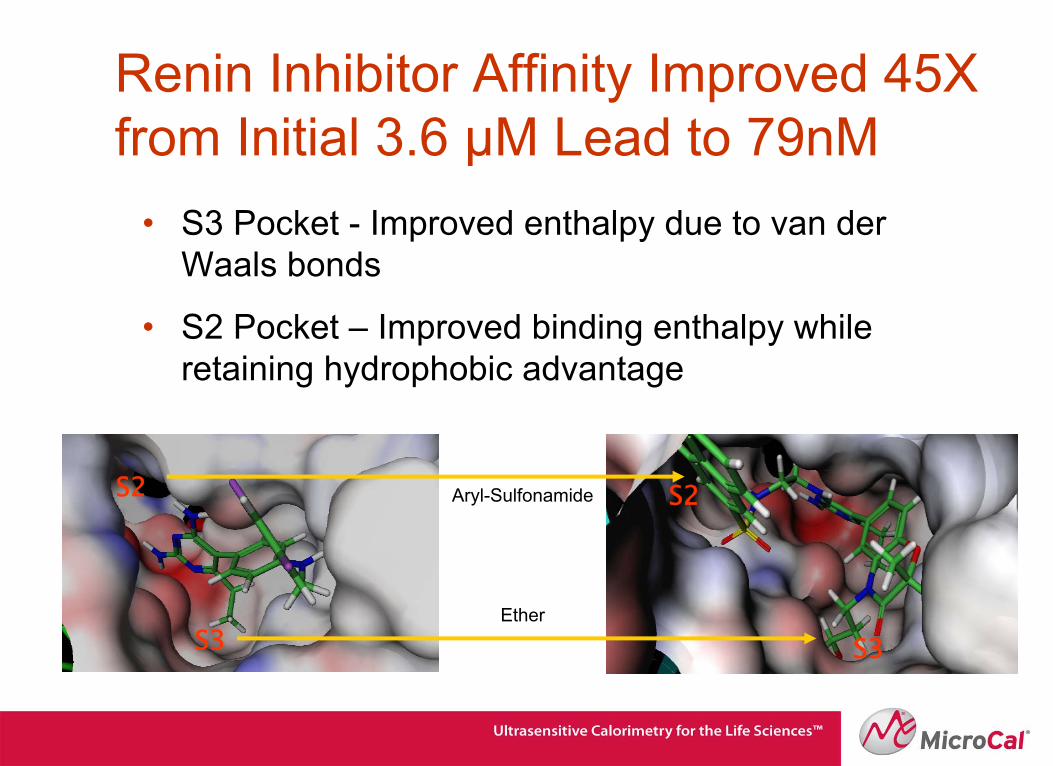
Renin Inhibitor Affinity Improved 45X from Initial 3.6 μM Lead to 79nM
•
S3 Pocket - Improved enthalpy due to van der
Waals bonds
•
S2 Pocket – Improved binding enthalpy while
retaining hydrophobic advantage
Aryl-Sulfonamide
Ether
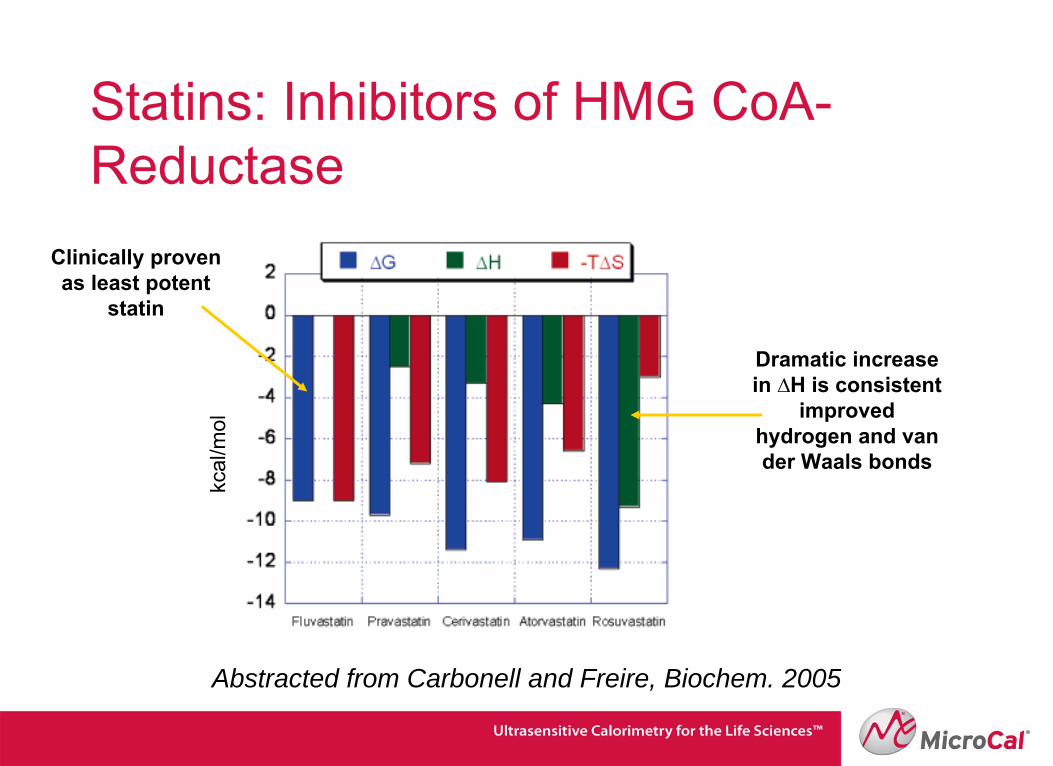
Statins: Inhibitors of HMG CoA- Reductase
Dramatic increase in ∆H is consistent
improved hydrogen and van der
Waals bonds
Abstracted from Carbonell and Freire, Biochem. 2005
Clinically proven as least potent
statin
kcal
/mol
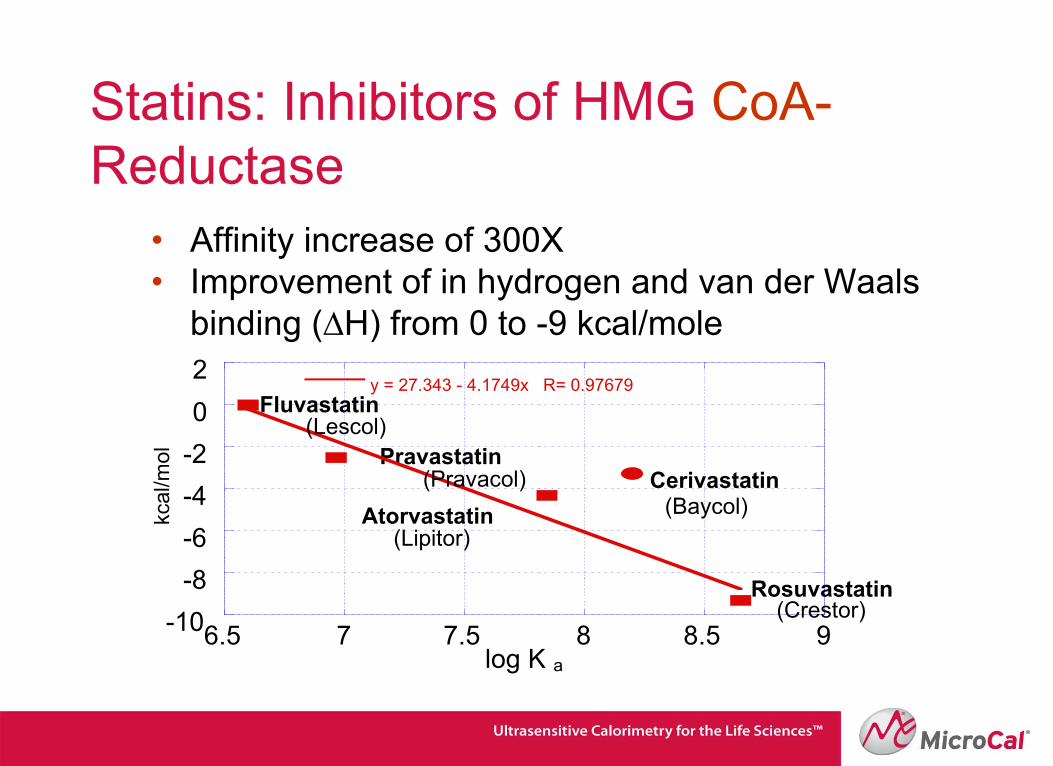
Statins: Inhibitors of HMG CoA- Reductase
Fluvastatin
PravastatinCerivastatin
Atorvastatin
Rosuvastatin-10
-8-6-4-202
6.5 7 7.5 8 8.5 9
y = 27.343 - 4.1749x R= 0.97679
Δ H k
cal/m
ol
log K a
•
Affinity increase of 300X•
Improvement of in hydrogen and van der Waals
binding (∆H) from 0 to -9 kcal/mole
(Crestor)
(Baycol)(Lipitor)
(Pravacol)
(Lescol)
kcal
/mol
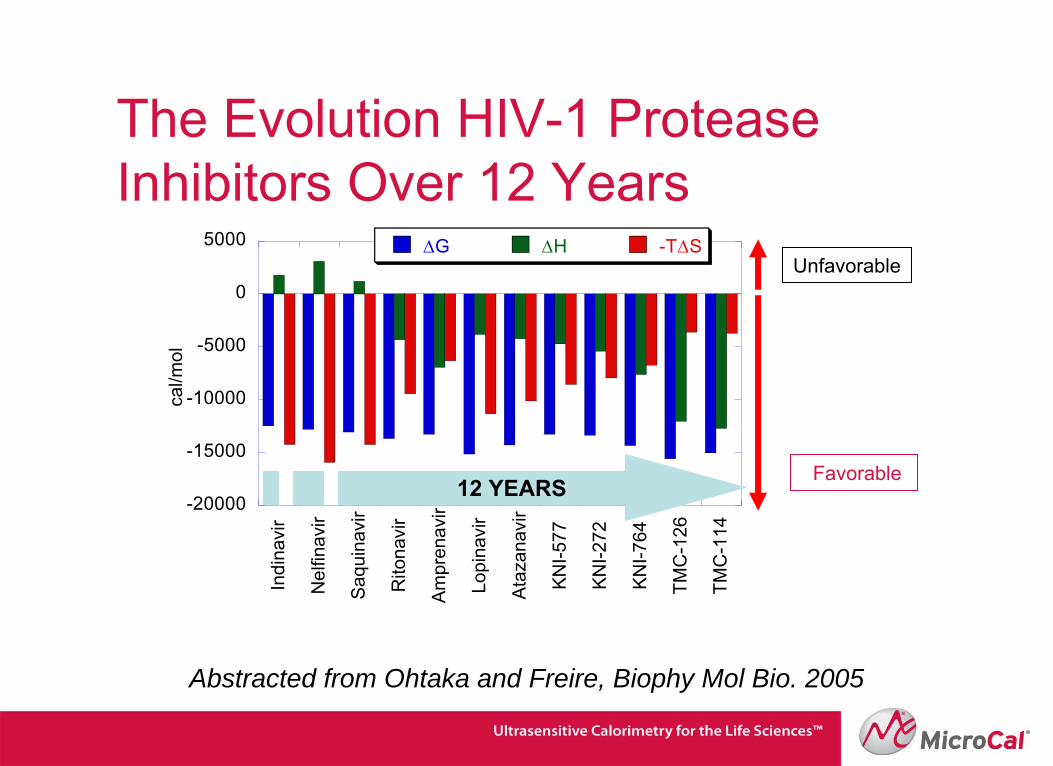
The Evolution HIV-1 Protease Inhibitors Over 12 Years
Abstracted from Ohtaka and Freire, Biophy Mol Bio. 2005
-20000
-15000
-10000
-5000
0
5000
Indi
navi
r
Nel
finav
ir
Saq
uina
vir
Rito
navi
r
Am
pren
avir
Lopi
navi
r
Ata
zana
vir
KN
I-577
KN
I-272
KN
I-764
TMC
-126
TMC
-114
ΔG ΔH -TΔS
cal/m
ol
Unfavorable
Favorable12 YEARS
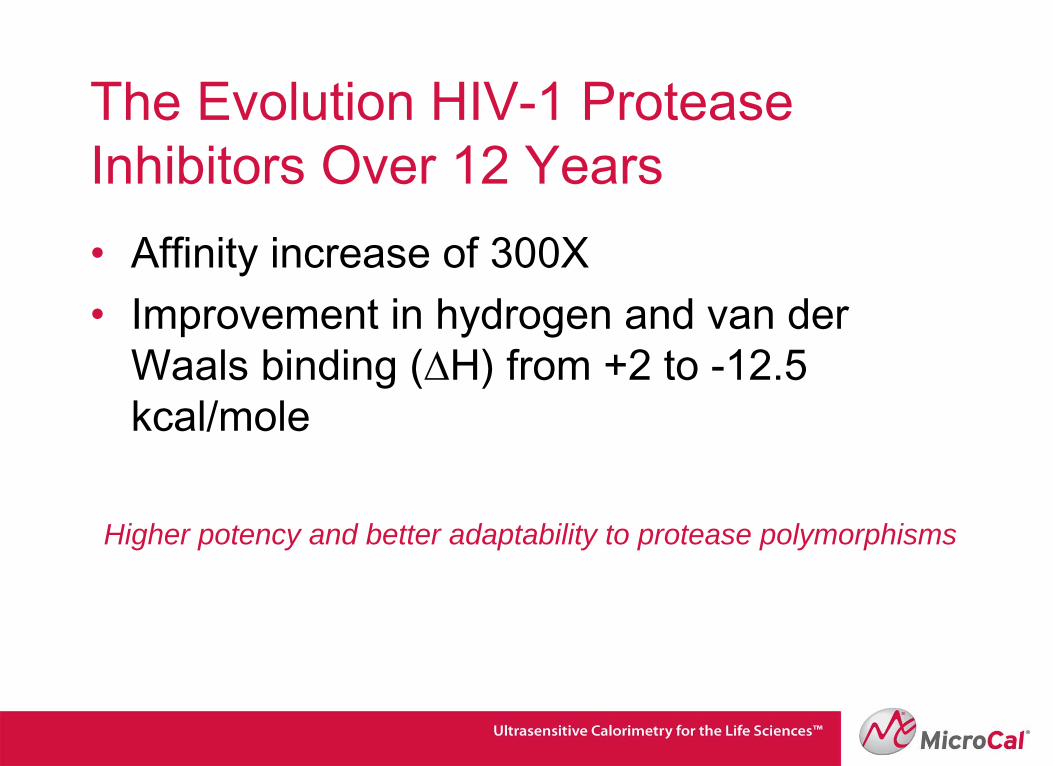
The Evolution HIV-1 Protease Inhibitors Over 12 Years• Affinity increase of 300X• Improvement in hydrogen and van der Waals binding (∆H) from +2 to -12.5
kcal/mole
Higher potency and better adaptability to protease polymorphisms
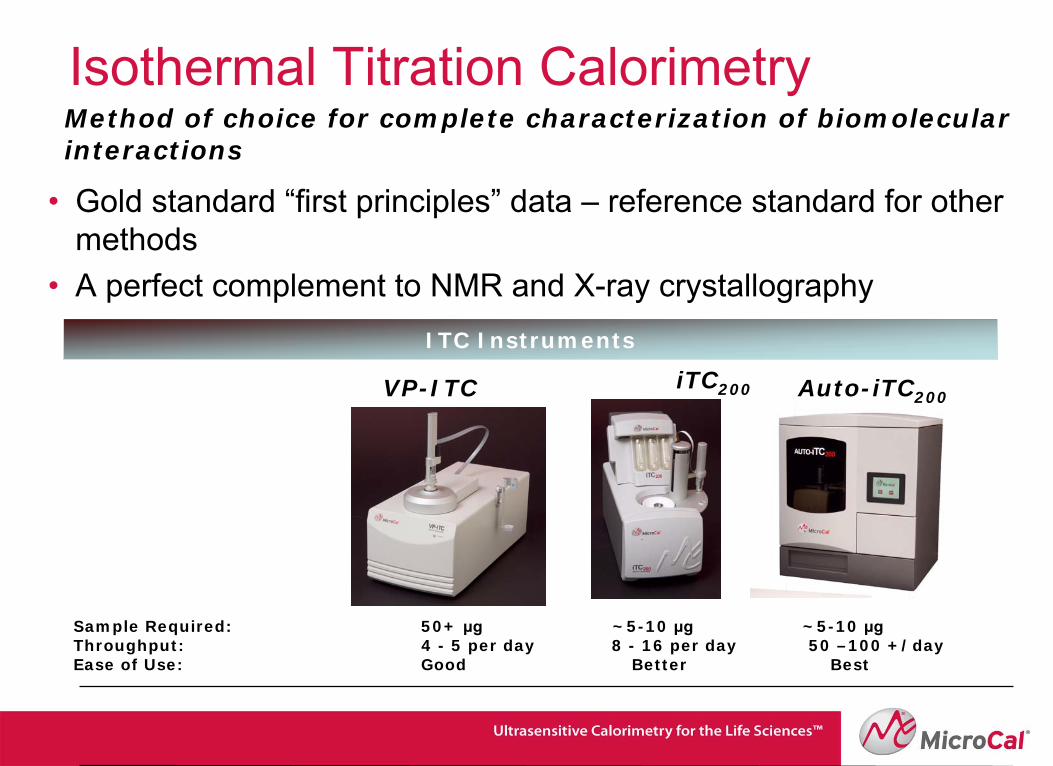
• Gold standard “first principles”
data –
reference standard for other
methods• A perfect complement to NMR and X-ray crystallography
Isothermal Titration Calorimetry Method of choice for complete characterization of biomolecular interactions
ITC Instruments
VP-ITC iTC200 Auto-iTC200
Sample Required: 50+ μg ~5-10 μg
~5-10 μg Throughput: 4 - 5 per day 8 - 16 per day 50 –100 +/day
Ease of Use: Good Better Best
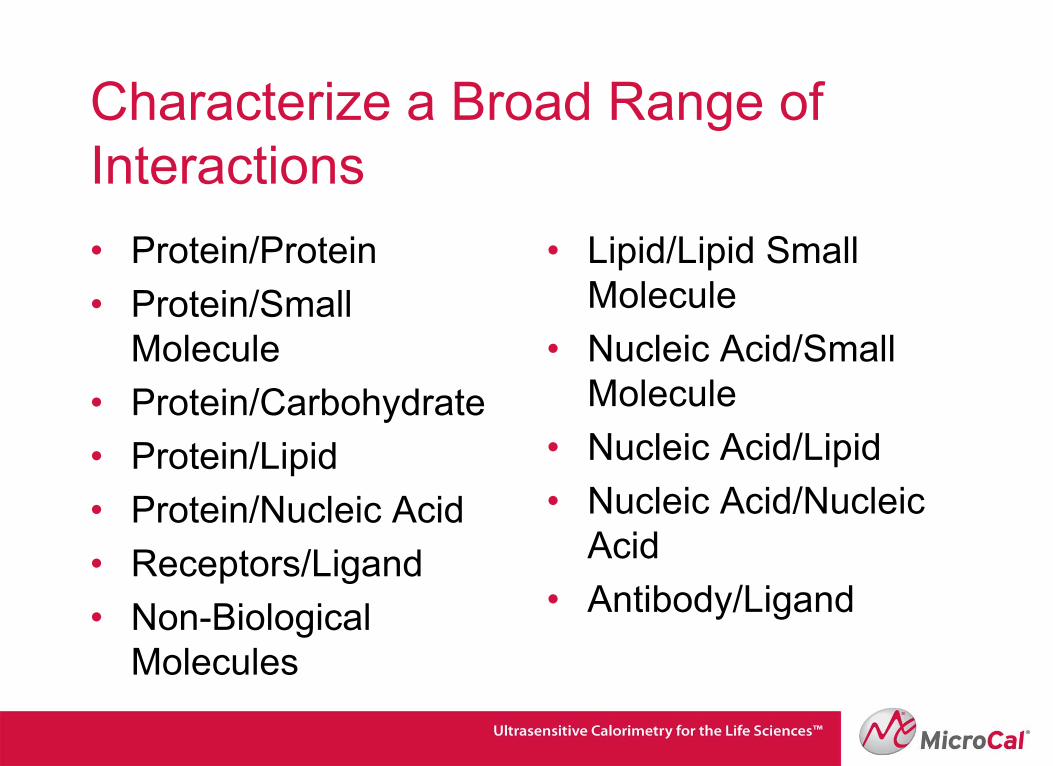
Characterize a Broad Range of Interactions• Protein/Protein• Protein/Small
Molecule• Protein/Carbohydrate• Protein/Lipid• Protein/Nucleic Acid• Receptors/Ligand• Non-Biological
Molecules
• Lipid/Lipid Small Molecule
• Nucleic Acid/Small Molecule
• Nucleic Acid/Lipid• Nucleic Acid/Nucleic
Acid• Antibody/Ligand
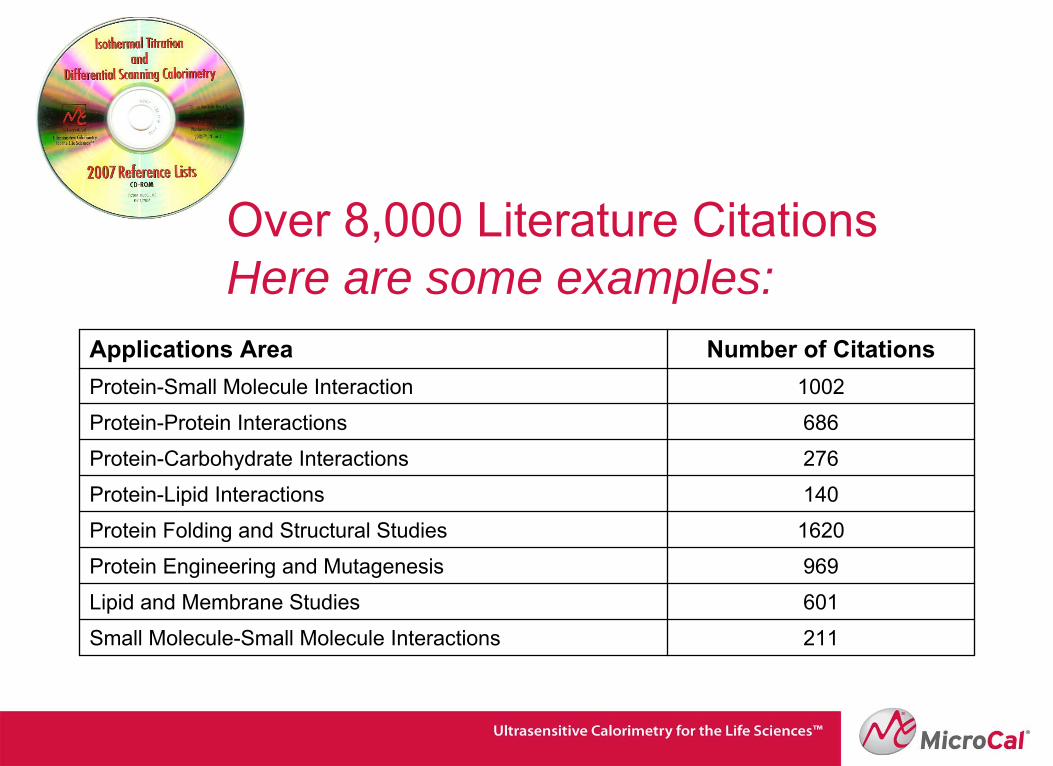
Over 8,000 Literature Citations Here are some examples:
Applications Area Number of CitationsProtein-Small Molecule Interaction 1002
Protein-Protein Interactions 686
Protein-Carbohydrate Interactions 276
Protein-Lipid Interactions 140
Protein Folding and Structural Studies 1620
Protein Engineering and Mutagenesis 969
Lipid and Membrane Studies 601
Small Molecule-Small Molecule Interactions 211
The MicroCal Advantage™
• Over 30 years of experience in calorimetry for the life sciences
• Unparalleled technical and applications expertise
• Consistently high customer satisfaction ratings
• An on-going commitment to advance calorimetry education through symposia, conferences, webinars and support materials