Embed Size (px)
Citation preview
Using Chimeric Viruses to study Kaposi’s sarcoma-
associated herpesvirus pathogenesis in mice
André Filipe Coimbra e Seixas
Thesis to obtain the Master of Science Degree in
Microbiology
Supervisors:
Professor Doutor João Pedro Monteiro e Louro Machado de Simas
Professor Doutor Jorge Humberto Gomes Leitão
Examination Committee
Chairperson:
Professora Doutora Isabel Maria de Sá Correia Leite de Almeida
Supervisor:
Professor Doutor João Pedro Monteiro e Louro Machado de Simas
Members of the committee:
Doutora Sofia Pinto Guia Marques
November 2016
i
Acknowledgements
I would like to thank Dr. Pedro Simas for accepting me in his lab, for believing in me and for all the
good advices that he gave me during the development of my work. Thank you also to Dra. Isabel Sá-
Correia for letting me choose this master thesis theme. A special thanks to Dra. Marta Pires de Miranda
for the tremendous help that she provided me and for all the patience to teach me and to advise me.
Thank you to all the former and present members of the Herpesvirus Pathogenesis lab, especially Ana
Quendera, Francesca Martin, Sofia Cerqueira and Diana Fontinha, for the friendship and help provided.
Thank you in general to the Instituto de Medicina Molecular for providing a great environment for me to
develop my work and to Instituto Superior Técnico for accepting me in the Microbiology master.
Queria agradecer aos meus colegas de mestrado por toda a amizade e ajuda que me proporcionaram
ao longo de todo o mestrado, em especial à Inês Leonardo por ser uma amiga sempre presente.
Obrigado também a todos os meus amigos, que são a minha 2ª família com a qual eu posso sempre
contar.
Obrigado a toda a minha família por estar sempre presente e por me apoiar sempre em qualquer
momento, sem hesitação. Não poderia deixar de fazer um agradecimento especial ao meu avô, que
sem ele nada disto seria possível.

ii
Abstract
Herpesvirus are one of the most ubiquitous group of viruses in the world. Kaposi’s sarcoma-
associated herpesvirus (KSHV) is one of the eight herpesvirus that infects humans, and it is the
etiological agent of Kaposi’s sarcoma (KS), primary effusion lymphoma (PEL) and multicentric
Castleman’s disease in our species. Without a good model to study KSHV, the solution resides on a
mouse equivalent virus, murine herpesvirus-68 (MHV-68). Previous work done in our lab aimed to
generate chimeric recombinant viruses, where an essential protein in KSHV latency, latency-associated
nuclear antigen (kLANA) was cloned in a MHV-68 background, substituting the mouse herpesvirus
original LANA (mLANA). It was possible to have a chimeric virus where the influence of kLANA in vivo
was addressed, despite establishing latency in the spleen with lower levels when compared to the wild
type virus. kLANA protein sequence contains an internal acidic repeat region that is poorly
characterized. Only in vitro studies were performed so far regarding this part of the protein. The objective
of this work was to test the importance of these internal regions in vivo, by generating two chimeric
recombinant viruses’: vkLANAΔ465-929 and vkLANAΔ332-929, lacking part or the entirety of the repeat
region, respectively. In vivo it is clear that vkLANAΔ465-929 has the same latency levels as the virus
expressing full length vkLANA, whilst vkLANAΔ332-929 completely failed to established latency in the
spleen. Thus, data indicates that the aspartate and glutamate (DE) (a.a. 330-464) is crucial for the
infection and for the correct latency in the spleen.
Keywords: kLANA; KSHV; internal repeat region; MHV-68; chimeric viruses; in vivo.
iii
Resumo
Herpesvírus são dos vírus mais ubíquos do mundo. O herpesvírus associado ao sarcoma de
Kaposi é um dos oito herpesvírus que afetam humanos, e é o agente etiológico de doenças como o
sarcoma de Kaposi, linfoma primário das cavidades e a doença de Castleman multicêntrica. Sem um
modelo animal para estudar o KSHV, a solução reside no uso de um herpesvírus de ratinho, o
herpesvírus murídeo tipo 68. Previamente no nosso laboratório criou-se um vírus quimérico, no qual
uma proteína essencial na latência de KSHV, o antigénio nuclear associado à latência, foi clonada no
genoma de MHV-68, substituindo a LANA original do herpesvírus de ratinho. Obtiveram-se assim vírus
quiméricos onde a influência de kLANA pode ser analisada in vivo apesar de estabelecer latência com
níveis mais baixos que o vírus MHV-68. kLANA é crucial para o estabelecimento de latência do vírus.
Uma das partes menos bem caracterizadas de kLANA é a sua região interna repetitiva. Apenas estudos
in vitro foram realizados em relação a esta parte da proteína, sendo que o objetivo deste trabalho era
testar a importância desta região interna de kLANA in vivo. Dois vírus quiméricos foram criados,
vkLANAΔ465-929 e vkLANAΔ332-929 onde parte, ou a totalidade da região interna repetitiva for
removida, respetivamente. In vivo é possível observar que vkLANAΔ332-929 tem mais impacto no
estabelecimento de latência no baço, enquanto vkLANAΔ465-929 tem menos impacto, indicando que
a região interna de aspartato e glutamato (DE) é essencial para a infeção e para o estabelecimento de
latência no baço
Palavras-chave: kLANA; KSHV; região interna repetitiva; MHV-68; vírus quiméricos; in vivo.
iv
Abbreviations
%GC – Percentage of guanine and cytosine
AIDS – Acquired Immune Deficiency Syndrome
BAC – Bacterial artificial chromosome
BHK – Baby hamster kidney
cDNA – Complementary DNA
CPE – Cytopathic effect
Ct – Threshold cycle
CWS – Cell working stock
D.p.i. – Days post-infection
DBD – DNA-binding domain
DMEM – Dulbecco's Modified Eagle Medium
DNA – Deoxyribonucleic acid
EBNA-1 – Epstein-Barr nuclear antigen-1
EBV – Epstein-Barr virus
EDTA - Ethylenediamine tetraacetic acid
FACS – Fluorescence-activated cell sorting
GC – Germinal center
GFP – Green fluorescent protein
GMEM – Glasgow Minimum Essential Medium
HCMV – Human cytomegalovirus
HHV-6 – Human herpesvirus-6
HHV-7 – Human herpesvirus-7
HHV-8 – Human herpesvirus-8
HIV – Human Immunodeficiency Virus
HSV-1 – Herpes simplex virus-1
HSV-2 – Herpes simplex virus-2
IE – Immediate early
kLANA – KSHV latency-associated nuclear
antigen
KS – Kaposi’s sarcoma
KSHV – Kaposi’s sarcoma-associated
herpesvirus
LANA – Latency-associated nuclear antigen
LB – Luria-Bertani
LUR – Long unique coding region
LZ – Leucine-zipper
MHV-68 – Murine herpesvirus 68
Min – Minutes
mLANA – MHV-68 latency-associated nuclear
antigen
MOI – Multiplicity of infection
mRNA – Messenger ribonucleic acid
MuHV-4 – Murine herpesvirus-4
MZ – Marginal zone
ORF – Open reading frame
PBS – Phosphate buffered saline
PBS-T – PBS-Tween 20
PCR – Polymerase chain reaction
PEL – Primary effusion lymphoma
pfu – Plaque forming unit
qPCR – Quantitative PCR
RNA – Ribonucleic acid
RT – Room temperature
v
RTA – Replication and transcription activator
SDS-PAGE - Sodium dodecyl sulphate
polyacrylamide gel electrophoresis
SE – Standard error
SHPM – Single-hit Poisson model
SOB – Super optimal broth
SOC – SOB plus glucose
TAE – Tris-acetate-EDTA
TEMED – Tetramethylethylenediamine
TGS – Tris-glycine-SDS
TR – Terminal repeat
vBcl-2 – Viral B-cell lymphoma 2
v-FLIP – Viral Fas-associated death domain-
like interleukin-1β-converting enzyme-inhibitory
protein
v-GPCR – Viral G protein-coupled receptor
VZV – Varicella-zoster virus
WSM – Working stock media
WT – Wild type

1
Table of contents
Acknowledgements ...................................................................................................................................i
Abstract..................................................................................................................................................... ii
Resumo ................................................................................................................................................... iii
Abbreviations ........................................................................................................................................... iv
Table of contents ..................................................................................................................................... 1
1. Introduction ...................................................................................................................................... 3
1.1 Herpesvirus ................................................................................................................................... 3
1.1.1 Gammaherpesvirus ................................................................................................................ 4
1.2 Kaposi’s sarcoma-associated herpesvirus (KSHV) ....................................................................... 4
1.2.1 KSHV latency-associated nuclear antigen (kLANA) .............................................................. 7
1.2.2 The kLANA internal repeat acidic region ................................................................................ 8
1.3 Murine herpesvirus 68 (MHV-68) .................................................................................................. 9
1.3.1 MHV-68 latency-associated nuclear antigen (mLANA) .......................................................... 9
1.4 MHV-68 as a model to study Kaposi’s sarcoma-associated herpesvirus pathogenesis in mice ........ 10
2. Aim of the project ........................................................................................................................... 12
3. Materials and Methods .................................................................................................................. 13
3.1 Plasmids and cloning................................................................................................................... 13
3.2 Ethics statement .......................................................................................................................... 13
3.3 Mice ............................................................................................................................................. 13
3.4 Bacteria ....................................................................................................................................... 14
3.5 Cell lines ...................................................................................................................................... 14
3.6 Transformation of competent bacteria ......................................................................................... 14
3.7 Control Viruses ............................................................................................................................ 14
3.8 Generation and characterization of recombinant viruses ............................................................ 14
3.9 BAC DNA Preps .......................................................................................................................... 15
3.10 Reconstitution of MHV-68 virus on BHK-21 cells ...................................................................... 16
3.11 Production of viral stocks .......................................................................................................... 16
3.12 Plaque assay (virus titration using suspension assay) .............................................................. 16
3.13 Multi-step growth curves............................................................................................................ 17
3.14 Immunoblotting .......................................................................................................................... 17

2
3.15 Transcription analysis of kLANA mutants.................................................................................. 18
3.16 In vivo Assays ............................................................................................................................ 19
3.16.1 Infection of mice ................................................................................................................. 19
3.16.2 Single cell suspensions. ..................................................................................................... 19
3.16.3 Infectious Center Assay (ex vivo explant co-culture assay) ............................................... 20
3.16.4 Sorting of GC B cells .......................................................................................................... 20
3.16.5 Limiting dilution assay and Real-time PCR of viral DNA positive cells .............................. 20
3.17 Statistical analysis ..................................................................................................................... 21
4. Results ........................................................................................................................................... 22
4.1 Generation and characterization of MHV-68 recombinant viruses ............................................. 22
4.2 The chimeric recombinant viruses display normal in vitro growth ............................................... 23
4.3 Expression of kLANA mutant proteins ......................................................................................... 24
4.4 Transcription analysis of kLANA mutants .................................................................................... 25
4.5 The internal acidic repeat region has impact in the establishment of latency in the spleen ....... 26
4.6 Quantification of the frequency of viral DNA-positive total splenocytes and GC B-cells ............ 27
5. Discussion ..................................................................................................................................... 29
6. Conclusion ..................................................................................................................................... 31
7. References .................................................................................................................................... 32

3
1. Introduction
1.1 Herpesvirus
Herpesvirus are amongst the most ubiquitous group of viruses in the world. They are widely spread
across the spectrum of vertebrate species and at least in one invertebrate species. These viruses have
co-evolved with their hosts over long periods of time, being extremely well adapted to each one of them
(Davison et al., 2002). Herpesvirus family can be distinguished by having a large double-stranded DNA
genome (130-250 kb) inside a highly ordered icosahedral-shape nucleocapsid (125-130nm in diameter),
surrounded by a semi-ordered tegument that, in turn, is enclosed within a lipid bilayer envelope with
different viral glycoproteins that are responsible for viral attachment and entry to host cells (Figure 1).
Figure 1: Schematic diagram illustrating the multilayer organization of human herpesvirus. Adapted from Human
Herpesviruses: Biology, Therapy, and Immunoprophylaxis; Chapter 3, Comparative virion structures of human
herpesviruses.
Herpesvirus are also characterized by having two different life cycles: a lytic phase and a latent
phase. In the lytic phase more than 80 genes are expressed in a specific order which leads to the
production of infectious viral particles (virions) that infect and lyse other cells (Wu et al., 2010). The
latent phase is characterized by maintenance of the viral genome in the nucleus as a multicopy, non-
integrated circular form designated episome. In latency, there are no infectious virions produced and
viral gene expression is strongly reduced, allowing the virus to escape unnoticed from the host immune
system (Wu et al., 2010).
As mentioned above, herpesvirus are very well adapted to their hosts, with a fine-tuned
equilibrium between the host’s immune system and the viral spread that, in the vast majority of the
cases, results in the absence of pathogenicity. Only when this equilibrium is disturbed, that is, the
immune system is affected by other diseases, stress or changes in life-style, pathogenicity is higher
(Davison et al., 2002).

4
According to the International Committee on Taxonomy of Viruses, the order Herpesvirales
currently has three families: Alloherpesviridae, Malacoherpesviridae and Herpesviridae, the latter being
divided in three subfamilies: Alphaherpesvirinae, Betaherpesvirinae and Gammaherpevirinae.
Alphaherpesvirinae can infect a wide number of mammal species whereas Betaherpesvirinae and
Gammaherpevirinae are more restricted in their host range. Herpesvirus establish life-long latent
infections. Alphaherpesvirinae remain latent in neurons, Betaherpesvirinae remain latent in the
monocyte cell lineage and Gammaherpevirinae remain latent mainly in lymphocytes (Davison et al.,
2009).
Humans are one of the mammal species that can be infected by Herpesvirus. There are eight
known viruses that can infect humans: Herpes simplex virus type-1 (HSV-1), Herpes simplex virus type-
2 (HSV-2) and Varicella-zoster virus (VZV) from the Alphaherpesvirinae; Human cytomegalovirus
(HCMV), Human herpesvirus 6 (HHV-6) and Human herpesvirus 7 (HHV-7) from the Betaherpesvirinae;
Epstein-Barr virus (EBV) and Human herpesvirus 8/Kaposi’s sarcoma-associated herpesvirus (HHV-
8/KSHV) from the Gammaherpevirinae (Wu et al., 2010).
1.1.1 Gammaherpesvirus
Gammaherpesvirus can be found widely in the natural environment, infecting several mammal
species. The Epstein-Barr virus (EBV) and the Kaposi’s sarcoma-associated herpesvirus (KSHV) are
representative viruses of the gamma-1-herpesvirus and gamma-2-herpesvirus subfamily division,
respectively (Simas & Efstathiou, 1998 and Chang et al., 1994).
These viruses are distinguished among other herpesviruses for their association with human
cancers (Wen & Damania, 2009). They are able to establish latency in lymphocytes, where the viral
episome is maintained in the nucleus and replicated in step with cellular mitosis. They induce
lymphoproliferative diseases and lymphomas in hosts with a compromised immune system (Nash et al.,
2001).
1.2 Kaposi’s sarcoma-associated herpesvirus (KSHV)
Kaposi’s sarcoma-associated herpesvirus (KSHV) is a blood-borne gammaherpesvirus first
discovered in 1994 by Yuan Chang and colleagues. It is the etiological agent of Kaposi´s sarcoma (KS)
a tumour of endothelial-cell origin mostly found in immunosuppressed HIV infected patients (Coscoy,
2007). Besides KS this virus is also an etiological agent in primary effusion lymphoma (PEL), a B cell
lymphoma and multicentric Castleman’s disease, a B cell lymphoproliferative disorder (Moore & Chang,
2003).
Before the acquired immunodeficiency syndrome (AIDS) epidemics, KS was considered
relatively rare, only affecting elderly man in Mediterranean and Eastern Europe regions. AIDS epidemic
transformed KS in the most severe AIDS-associated cancer (Cai et al., 2010). KSHV infected individuals

5
are found around the world. The seroprevalence of KSHV is below 10% in Northern Europe, Asia and
North America, but in the sub-Saharan Africa the values exceed 50% (Figure 2) (Uppal et al., 2014 and
Mesri et al., 2010).
Figure 2: Geographical seroprevalence of KSHV. Adapted from Mesri et al., 2010.
The genome of KSHV consists in a long unique coding region (LUR) of ≈ 140kb with 53,5% GC
content flanked by approximately 40 non-coding terminal repeats (TR) with 84,5% of GC content (Russo
et al., 1996; Lagunoff and Ganem, 1997).
Like other gammaherpesvirus, the KSHV life cycle is divided in two different phases of infection,
the transient lytic infection and the persistent latent infection phases (Figure 3), with different patterns
of viral gene expression in each phase (Ye et al., 2011).
6
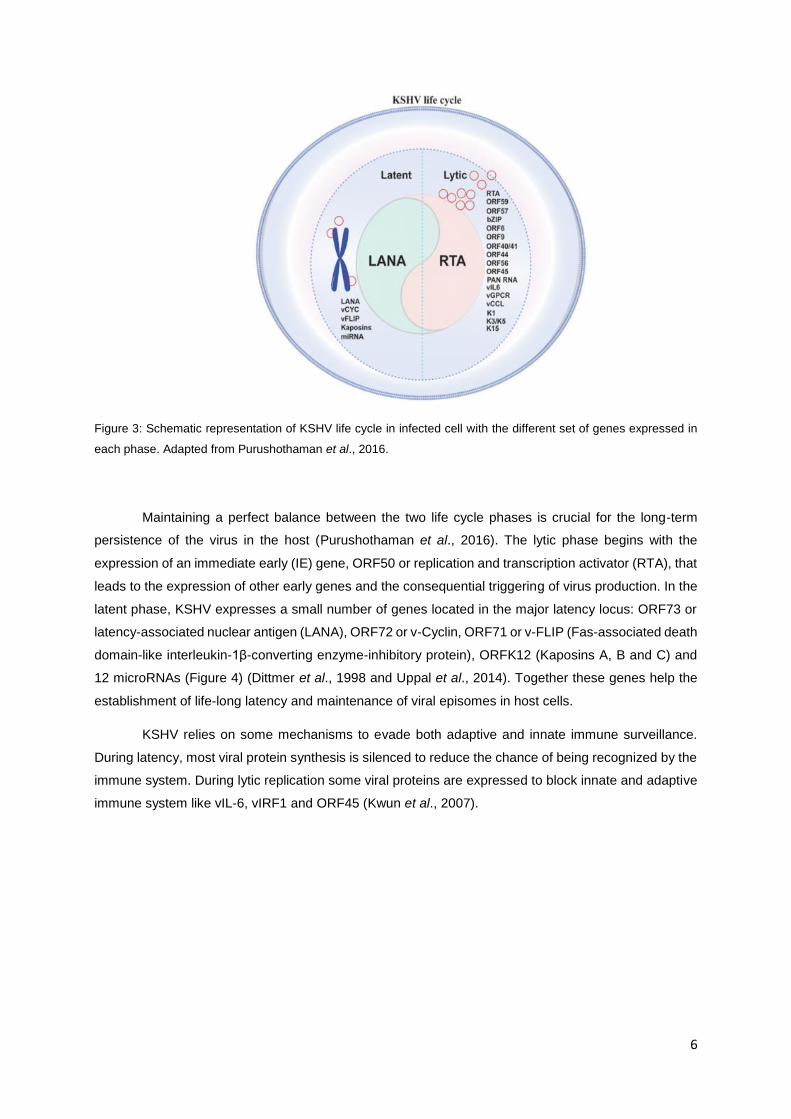
Figure 3: Schematic representation of KSHV life cycle in infected cell with the different set of genes expressed in
each phase. Adapted from Purushothaman et al., 2016.
Maintaining a perfect balance between the two life cycle phases is crucial for the long-term
persistence of the virus in the host (Purushothaman et al., 2016). The lytic phase begins with the
expression of an immediate early (IE) gene, ORF50 or replication and transcription activator (RTA), that
leads to the expression of other early genes and the consequential triggering of virus production. In the
latent phase, KSHV expresses a small number of genes located in the major latency locus: ORF73 or
latency-associated nuclear antigen (LANA), ORF72 or v-Cyclin, ORF71 or v-FLIP (Fas-associated death
domain-like interleukin-1β-converting enzyme-inhibitory protein), ORFK12 (Kaposins A, B and C) and
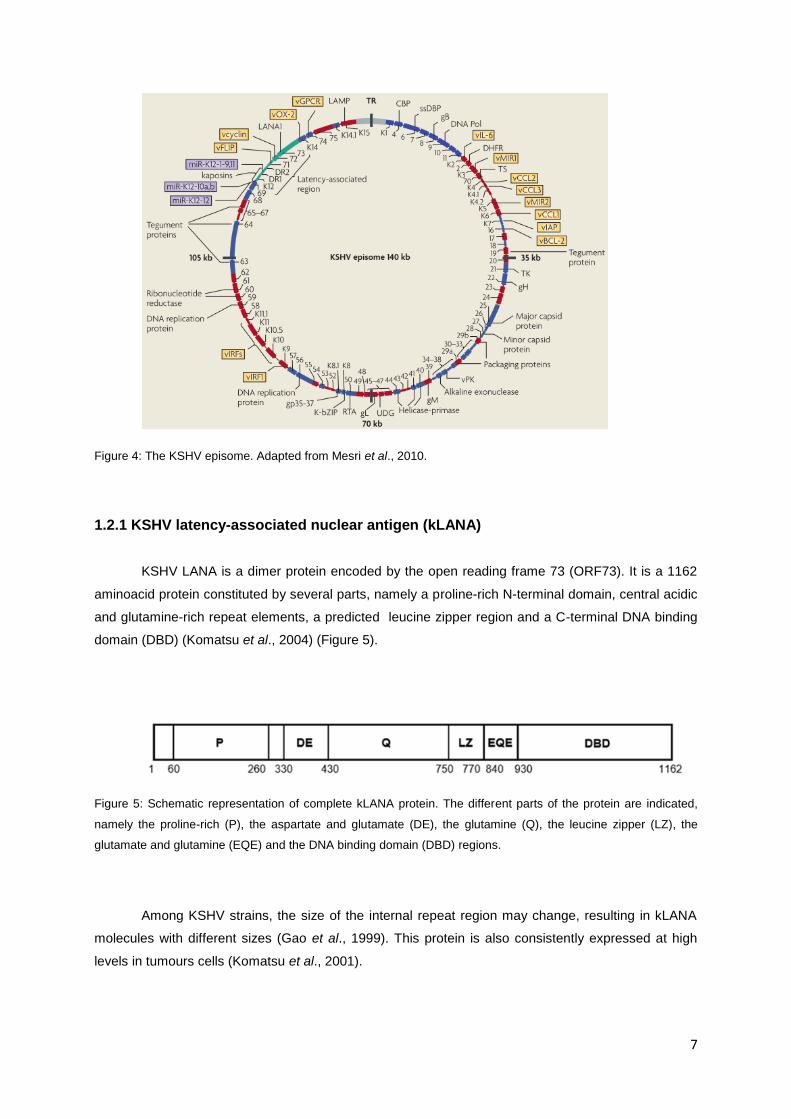
12 microRNAs (Figure 4) (Dittmer et al., 1998 and Uppal et al., 2014). Together these genes help the
establishment of life-long latency and maintenance of viral episomes in host cells.
KSHV relies on some mechanisms to evade both adaptive and innate immune surveillance.
During latency, most viral protein synthesis is silenced to reduce the chance of being recognized by the
immune system. During lytic replication some viral proteins are expressed to block innate and adaptive
immune system like vIL-6, vIRF1 and ORF45 (Kwun et al., 2007).
7
Figure 4: The KSHV episome. Adapted from Mesri et al., 2010.
1.2.1 KSHV latency-associated nuclear antigen (kLANA)
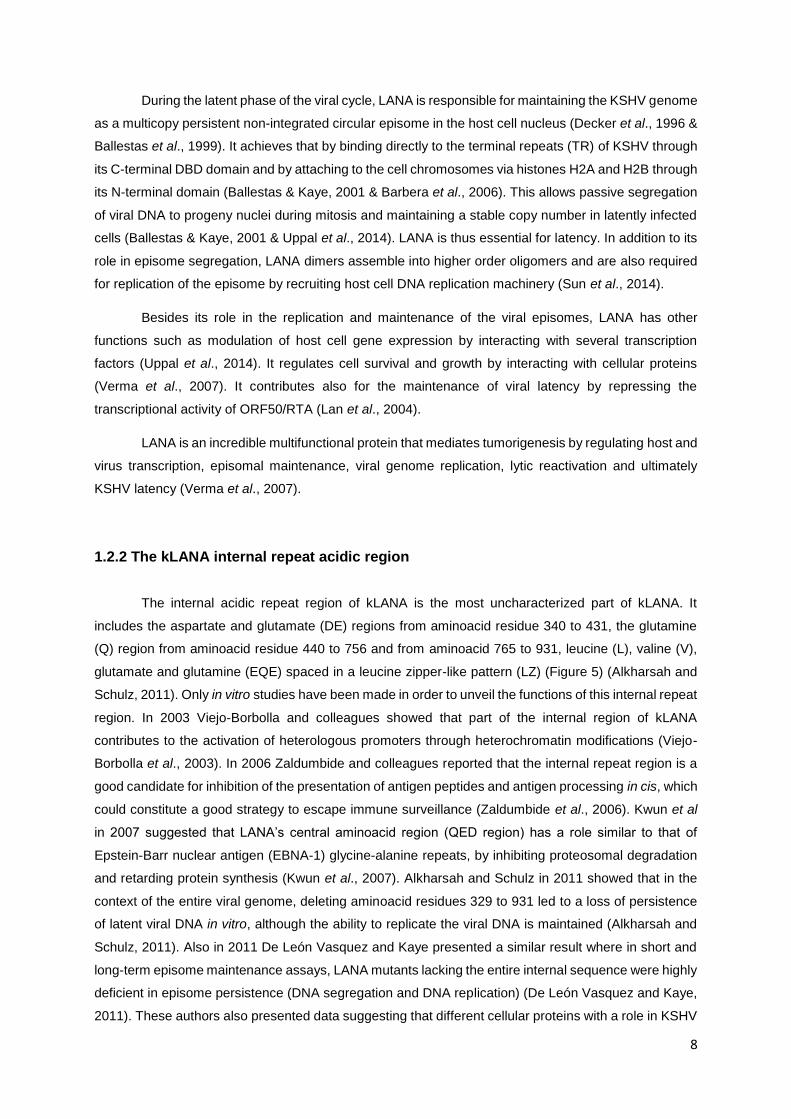
KSHV LANA is a dimer protein encoded by the open reading frame 73 (ORF73). It is a 1162
aminoacid protein constituted by several parts, namely a proline-rich N-terminal domain, central acidic
and glutamine-rich repeat elements, a predicted leucine zipper region and a C-terminal DNA binding
domain (DBD) (Komatsu et al., 2004) (Figure 5).
Figure 5: Schematic representation of complete kLANA protein. The different parts of the protein are indicated,
namely the proline-rich (P), the aspartate and glutamate (DE), the glutamine (Q), the leucine zipper (LZ), the
glutamate and glutamine (EQE) and the DNA binding domain (DBD) regions.
Among KSHV strains, the size of the internal repeat region may change, resulting in kLANA
molecules with different sizes (Gao et al., 1999). This protein is also consistently expressed at high
levels in tumours cells (Komatsu et al., 2001).
8
During the latent phase of the viral cycle, LANA is responsible for maintaining the KSHV genome
as a multicopy persistent non-integrated circular episome in the host cell nucleus (Decker et al., 1996 &
Ballestas et al., 1999). It achieves that by binding directly to the terminal repeats (TR) of KSHV through
its C-terminal DBD domain and by attaching to the cell chromosomes via histones H2A and H2B through
its N-terminal domain (Ballestas & Kaye, 2001 & Barbera et al., 2006). This allows passive segregation
of viral DNA to progeny nuclei during mitosis and maintaining a stable copy number in latently infected
cells (Ballestas & Kaye, 2001 & Uppal et al., 2014). LANA is thus essential for latency. In addition to its
role in episome segregation, LANA dimers assemble into higher order oligomers and are also required
for replication of the episome by recruiting host cell DNA replication machinery (Sun et al., 2014).
Besides its role in the replication and maintenance of the viral episomes, LANA has other
functions such as modulation of host cell gene expression by interacting with several transcription
factors (Uppal et al., 2014). It regulates cell survival and growth by interacting with cellular proteins
(Verma et al., 2007). It contributes also for the maintenance of viral latency by repressing the
transcriptional activity of ORF50/RTA (Lan et al., 2004).
LANA is an incredible multifunctional protein that mediates tumorigenesis by regulating host and
virus transcription, episomal maintenance, viral genome replication, lytic reactivation and ultimately
KSHV latency (Verma et al., 2007).
1.2.2 The kLANA internal repeat acidic region
The internal acidic repeat region of kLANA is the most uncharacterized part of kLANA. It
includes the aspartate and glutamate (DE) regions from aminoacid residue 340 to 431, the glutamine
(Q) region from aminoacid residue 440 to 756 and from aminoacid 765 to 931, leucine (L), valine (V),
glutamate and glutamine (EQE) spaced in a leucine zipper-like pattern (LZ) (Figure 5) (Alkharsah and
Schulz, 2011). Only in vitro studies have been made in order to unveil the functions of this internal repeat
region. In 2003 Viejo-Borbolla and colleagues showed that part of the internal region of kLANA
contributes to the activation of heterologous promoters through heterochromatin modifications (Viejo-
Borbolla et al., 2003). In 2006 Zaldumbide and colleagues reported that the internal repeat region is a
good candidate for inhibition of the presentation of antigen peptides and antigen processing in cis, which
could constitute a good strategy to escape immune surveillance (Zaldumbide et al., 2006). Kwun et al
in 2007 suggested that LANA’s central aminoacid region (QED region) has a role similar to that of
Epstein-Barr nuclear antigen (EBNA-1) glycine-alanine repeats, by inhibiting proteosomal degradation
and retarding protein synthesis (Kwun et al., 2007). Alkharsah and Schulz in 2011 showed that in the
context of the entire viral genome, deleting aminoacid residues 329 to 931 led to a loss of persistence
of latent viral DNA in vitro, although the ability to replicate the viral DNA is maintained (Alkharsah and
Schulz, 2011). Also in 2011 De León Vasquez and Kaye presented a similar result where in short and
long-term episome maintenance assays, LANA mutants lacking the entire internal sequence were highly
deficient in episome persistence (DNA segregation and DNA replication) (De León Vasquez and Kaye,
2011). These authors also presented data suggesting that different cellular proteins with a role in KSHV
9
episome persistence might interact with LANA’s internal region. The same authors, in 2013, generated
a panel of kLANA mutants and showed, in vitro, that a mutant kLANA protein lacking aminoacid residues
465 to 929 had 56,7% of the WT kLANA DNA replication capacity and another mutant lacking aminoacid
residues 332 to 929 had only 36,7% of the WT kLANA DNA replication capacity, suggesting that
aminoacid residues 331 to 464 have a contribution in episome replication in addition to the already
identified important episome replication region (aminoacid residues 262-320) (De León Vasquez and
Kaye, 2013). Overall, a defect in episome maintenance was observed in this two mutants showing that
internal aminoacid residues contribute to maintaining the episomes in in vitro assays.
1.3 Murine herpesvirus 68 (MHV-68)
MHV-68 is an isolate of murine herpesvirus 4 (MuHV-4) and is also a gamma-2-herpesvirus. It
was first isolated from free-living rodents like bank voles (Myodes glareolus) and yellow-necked field
mice (Apodermus flavicollis) in Slovakia (Blaskovic et al., 1980). However, the wood mice (Apodermus
sylvaticus) is the natural reservoir of this virus (Blasdell et al., 2003). The MHV-68 genome consists in
118kb of a unique sequence of DNA flanked by multiple copies of 1,2kb terminal repeats and has a GC
content of approximately 45% (Efstathiou et al., 1990). The virus encodes at least 80 gene products, 63
of them collinear with herpesvirus saimiri (HVS) and human herpesvirus 8/Kaposi’s sarcoma-associated
herpesvirus (HHV-8/KSHV) (Simas and Efstathiou, 1998) and some of them homologous to cellular
genes (Nash et al., 2001). MHV-68 is able to establish a life-long latent infection (Sunil-Chandra et al.,
1992a). Mice that are intranasally inoculated develop an acute lytic infection in the lungs, affecting
alveolar epithelial cells (Sunil-Chandra et al., 1992a). This lytic infection is resolved by the host’s immune
system 9 to 12 days post-infection (Sunil-Chandra et al., 1992b). The virus then spreads to lymph nodes
via dendritic cells and reaches the spleen by infecting marginal zone (MZ) macrophages first, and then
MZ B-cells (Frederico et al., 2014), followed by a marked expansion of latently infected B-cells in
lymphoid germinal centers (Simas et al., 1999), ultimately gaining access to the long-lived memory B
cell pool, the principal long-term reservoir of the virus (Flãno et al., 2002). The peak of latency
(approximately 14 days post-infection) is coupled with splenomegaly and followed by a decrease in the
number of infected cells that ultimately reach a steady-state level (Simas and Efstathiou, 1998). MHV-
68 latent infection is established predominantly in B-cells (Marques et al., 2003), but macrophages,
dendritic and epithelial cells can also be latently infected (Stewart et al., 1998; Weck et al., 1999; Flãno
et al., 2000).
1.3.1 MHV-68 latency-associated nuclear antigen (mLANA)
MHV-68 latency-associated nuclear antigen (mLANA) is a 314 aminoacid protein encoded by
MHV-68 ORF73 that is homologous in sequence and in function to KSHV LANA (Grundhoff and Ganem,
2003). Despite these similarities, mLANA is significantly shorter than kLANA. mLANA is similar to kLANA
in the C-terminal domain (viral DNA binding domain) and in the N-terminal proline rich region, but it lacks

10
the long internal repeat region and the amino-terminal domains present in kLANA (Figure 6) (Barton et
al., 2011 and Habinson et al., 2012).
Figure 6: Schematic representation of the comparison between KSHV latency-associated nuclear antigen (LANA)
and MHV-68 latency-associated nuclear antigen (mLANA). Homologous regions are shown with similar shading.
Unshaded regions lack homology. Aminoacid residues are indicated with numbers. P, proline-rich region; LZ,
predicted leucine zipper. Adapted from Habinson et al., 2012.
Previous studies have demonstrated that mLANA is essential for the establishment and
maintenance of latency in the spleen (Fowler et al., 2003 and Moorman et al., 2003). This protein is
selectively expressed in GC B-cells (Marques et al., 2003). mLANA binds terminal TR elements of the
viral genome to mediate episome persistence by tethering them to the mitotic host chromosomes and
allowing the correct segregation to the daughter cells, analogously to the effect of kLANA on KSHV TR’s
(Habinson et al., 2012). Another common feature between mLANA and kLANA is the regulation of viral
lytic gene expression that is likely to facilitate the establishment of latency (Barton et al., 2011). mLANA,
despite lacking the central repeat region, also confers limited presentation of linked epitopes, reduced
protein synthesis and protein degradation, thus having a role in immune evasion and surveillance
(Bennet et al., 2005).
Given all the common characteristics of mLANA and kLANA, it becomes pertinent to substitute
mLANA for kLANA in the MHV-68 genome in order to study KSHV related properties in a viable in vivo
mouse model.
1.4 MHV-68 as a model to study Kaposi’s sarcoma-associated herpesvirus
pathogenesis in mice
Herpesvirus are thought to have coevolved with their hosts during speciation, with each virus
having a very narrow host range. This aspect is essential when it comes to human gammaherpesvirus,
because no amenable laboratory model exists to study them. An adequate small animal model to study
basic immunological and virological aspects of both phases of infection, as well as evaluate
chemotherapeutic and vaccination strategies, was needed (Barton et al., 2011 and Efstathiou et al.,
1990). MHV-68 represents a good model system to use. It is relatively simple to introduce mutations in
the genome (Simas and Efstathiou, 1998), it encodes some genes involved in latency and reactivation

11
that are conserved between some rodent and primate herpesvirus (v- cyclin, vBcl-2, vGPCR, LANA and
RTA) and despite some differences in the viral pathogenesis between distant related
gammaherpesvirus, MHV-68 has the core pathogenic strategies conserved. Furthermore, the highly
conserved innate and adaptive immune systems between mice and humans helps to reinforce the power
of this murine virus as a good model (Barton et al. 2011).
12
2. Aim of the project
KSHV is an oncogenic gammaherpesvirus that affects humans and for which there is no model
of infection. MHV-68 is a gammaherpesvirus related with KSHV that can function as a mice virus
equivalent model. Previous work done in the lab generated chimeric viruses, that is, MHV-68
recombinant viruses expressing KSHV LANA (kLANA) instead of its original LANA (mLANA). It was
demonstrated that kLANA is able to support MHV-68 latency, despite being with lower levels (Pires de
Miranda and Simas, personal communication). This proved that the chimera model works.
The aim of this project was to access the impact of kLANA internal repeat deletions in vivo.
Collaborators of our laboratory have already expressed kLANA proteins with internal repeat deletions in
vitro, namely kLANAΔ465-929 and kLANAΔ332-929 and assessed their ability to maintain an artificial
episome. Both these mutant proteins presented deficiencies in episome maintenance in vitro. By
introducing these two mutant proteins in a MHV-68 background, we created chimeric mutant viruses
where is possible to understand the importance of kLANA internal repeat regions in vivo.
Ultimately, infection of mice with MHV-68/KSHV chimera will provide a mouse model to
investigate an important part of an essential KSHV latency protein. These studies may constitute the
basis for in vivo testing drug inhibitors to block KSHV latency or tumorigenesis.

13
3. Materials and Methods
3.1 Plasmids and cloning
pT7 kLANAΔ465-929 and pT7 kLANAΔ332-929 containing DNA encoding kLANA with
aminoacid residues 465-929 and 332-929 deleted respectively, were kindly provided by Professor
Kenneth M. Kaye. pSP72 PCR 1_5 was constructed by Marta Miranda. It contains DNA encoding the
full length kLANA ORF and its 5’ untranslated region (KSHV genome coordinates 123,808-127,886,
U75698), flanked by MHV-68 sequences. The BamHI-G shuttle plasmid was constructed by Sofia
Marques. This plasmid contains the MHV-68 genomic BamHI-G fragment (genome coordinates 101,654
to 106,903, U97553) cloned in the pST76K-SR (shuttle) plasmid. The BamHI-G fragment contains
mLANA coding sequence (coordinates 103,927-104,868). DNA fragments encompassing internal
kLANA deletions were excised from pT7 kLANAΔ465-929 and pT7 kLANAΔ332-929 using BamHI and
StuI and subcloned into BamHI/StuI sites of pSP72 PCR 1_5, thus substituting full length kLANA by the
deleted kLANA sequences. The resulting plasmids were termed pSP72Δ465-929 and pSP72Δ332-929,
respectively. (pSP72Δ465-929 and pSP72Δ332-929 were constructed by Ana Quendera). BglII
fragments encompassing Δ465-929 or Δ332-929 kLANA sequences and 5´-UTR, flanked by MHV-68
genomic sequences, were excised from pSP72Δ465-929 and pSP72Δ332-929, respectively, and
subcloned into the BglII sites of BamHI-G shuttle replacing mLANA coding sequence by the deleted
kLANA constructs. The resulting recombinant plasmids were termed Shuttle BamHI-G Δ465-929 and
Shuttle BamHI-G Δ332-929. (Shuttle BamHI-G Δ465-929 was constructed by Ana Quendera).
3.2 Ethics statement
The study was in accordance with the Federation of European Laboratory Animal Science
Associations guidelines on laboratory animal welfare.
3.3 Mice
Female C57BL/6 were purchased from Charles River Institute in France. Animals were housed
and subjected to experimental procedures in specific pathogen-free conditions, at the Instituto de
Medicina Molecular animal facility, Lisbon, Portugal.

14
3.4 Bacteria
To produce the recombinant viruses competent E. coli DH10B with a MHV-68 bacterial artificial
chromosome were used. Standard Competent E. coli DH5α were also used. For transformation of the
ligation reactions XL10-Gold® ultracompetent cells (Agilent Technologies) were used.
3.5 Cell lines
NIH-3T3 (mouse embryonic fibroblasts) stably expressing Cre recombinase were maintained in
DMEM (Dulbecco’s Modified Eagle Medium) containing 10% of heat inactivated fetal bovine serum
(FBS), 5000U/mL of penicillin, 5000μg/mL of streptomycin and 200mM of L-glutamine. Baby hamster
kidney (BHK-21) fibroblasts were maintained in Glasgow Minimum Essential Medium (supplemented
GMEM) supplemented as above plus 10% of tryptose phosphate broth (Sigma).
3.6 Transformation of competent bacteria
Competent E. coli DH10B harboring a bacterial artificial chromosome (BAC) (Collins et al.,
2009) were transformed using the heat shock method. An aliquot of cells was gently thawed on ice and
0.5μL of plasmid DNA (BamHI-G shuttle) with a concentration between 250 and 450 ng/μL was added.
After a gentle swirl each aliquot was incubated for 30 min on ice, subsequently heat-pulsed for 90 sec
in a 42°C water bath and left for 2 min on ice again. 500 μL of Super Optimal Broth + glucose (SOC)
(2% w/v tryptone; 0.5% w/v Yeast extract; 10mM NaCl; 2.5mM KCl; 10mM MgCl2 and 20mM glucose)
was added and cells were incubated for 1h at 30°C with an agitation of 220rpm. Finally cells were spread
onto LB agar plates containing 17 μg/mL of chloramphenicol and 30 μg/mL of kanamycin and incubated
at 30°C.
3.7 Control Viruses
The WT MHV-68 (v-WT) has been described by others (18). The chimeric MHV-68 in which
mLANA DNA was replaced by the full length kLANA DNA an 5’ UTR (v-kLANA) was constructed by
Marta Miranda (Miranda and Simas unpublished results).
3.8 Generation and characterization of recombinant viruses
The MHV-68 recombinant viruses were generated by a mutagenesis procedure in E. coli DH10B
according to the Two-Step-Replacement Strategy (O’ Connor et al., 1989).
15
The BamHI-G shuttle harbouring the kLANA with the desired mutations was transformed by
heat shock into competent E. coli DH10B that contains a BAC with the entire WT MHV-68 genome
cloned. Bacteria were plated in plates that contained the selection marker of the BamHI-G shuttle
plasmid (kanamycin) and the selection marker of the BAC (chloramphenicol) for 1-2 days at 30°C
because the shuttle plasmid as a temperature-sensitive origin of replication and still needs to replicate.
A homologous recombination event between the shuttle BamHI-G and the BAC occurred, mediated by
the bacterial protein RecA which is within the shuttle plasmid (Adler et al., 2003) and it is responsible
for the complete integration of the BamHI-G shuttle plasmid into the BAC genome forming the co-
integrates. For selection of the co-integrates the bacteria were incubated overnight at 43°C in the
presence of kanamycin/chloramphenicol. Next the clones were plated only on LB agar with
chloramphenicol and incubated 1-2 days at 30°C. With this the co-integrates can resolve themselves
spontaneously by homologous recombination to either the initial condition or to the expected BAC
mutant state. In order to isolate the resolved clones with the BAC mutants the bacteria were plated on
LB agar with chloramphenicol and 5% of sucrose, which is a counter selection against SacB gene
encoded by the BamHI-G shuttle plasmid, and incubated 1-2 days at 30°C. Colonies were picked once
and plated in parallel in kanamycin LB agar and in chloramphenicol LB agar and incubated overnight at
37°C. The resistance to sucrose and the sensitivity to kanamycin are two independent indications that
the co-integrates are well resolved. To identify BAC recombinants containing kLANA coding sequences,
a colony PCR was performed using primers that amplify the C-terminal region, namely 1019 F (forward)
(5’-GTCCCTTACAGACAGATAGATGATTG-3’) and 1150 R (reverse) (5’-
AAAAAGCTTTTATTCCCCTGGCTGGGTTAATG-3’). kLANA PCR positive clones were further
characterized by restriction profile analysis using EcoRI and BamHI to assess the integrity of the
genome and confirm kLANA deletions.
.
3.9 BAC DNA Preps
To obtain BAC DNA minipreps, colonies that were positive in the colony PCR were inoculated
in 10mL of LB broth supplemented with chloramphenicol and grown, overnight at 37°C with shaking.
The bacterial cells were pelleted by centrifugation for 10 min at 4000rpm at 4°C. The pellet was first
resuspended in 200μL of buffer S1 (50mM Tris-HCl, 10mM EDTA, 100μg/mL RNase A, pH 8.0). Next
the cells were lysed by adding 200μL of buffer S2 (200mM NaOH, 1% SDS). The cell suspension was
mixed carefully and left 5 min at RT. 200μL of pre-cooled buffer S3 (2.8M KAc, pH 5.1) was added and
the suspension was mixed by inversion and incubated for 15 min on ice. In order to separate the cell
debris from the BAC DNA the mixture was centrifuged for 15 min at 13000rpm at 4°C. The supernatant
was passed to other tube, mixed with an equal volume of phenol:chloroform:isoamyl alcohol (25:24:1,
Applichem A0944, 0250), inverted for mixing and incubated for 5 min at RT. The mixture was centrifuged
for 10 min at 13000rpm at 4°C and the aqueous phase was transferred to a fresh Eppendorf. 0.7 volumes
of isopropanol were added and the mixture was inverted and incubated for 5 min at RT. To pellet the
BAC DNA the tubes were centrifuged for 20 min at 13000rpm at 4°C. Next the supernatant was
16
discarded and the pellet was washed with 200μL of 70% EtOH and centrifuged for 10 min at 13000rpm
at 4°C. Finally the supernatant was discarded and the pellet was dried and resuspended in 60μL of
nuclease-free water at stored at 4°C. To obtain large amounts of pure BAC DNA, for transfections, DNA
maxipreps were produced from 250mL cultures with the NucleoBond® BAC 100 kit (Macherey-Nagel),
according to manufacturer’s instructions. Due to the size of the BAC DNA, cut tips were used when
needed in order to avoid shearing the DNA
3.10 Reconstitution of MHV-68 virus on BHK-21 cells
BHK-21 cells were splitted one day before in order to have 106cells/6cm2dish. 1μg of BAC DNA
maxiprep was diluted in 500μL of unsupplemented GMEM with a cut tip. 2μL of X-tremeGENE HP DNA
Transfection Reagent (Roche Applied Science) was added into the media. The mixture was mixed gently
and left incubating for 20 min at RT. The transfection complexes were added to the dishes and incubated
at 37°C. After a few days a cytophatic effect (CPE) of approximately 50% was visible and the cells were
scrapped onto media and stored at -80°C (BAC+ virus). To remove completely the BAC cassette, BAC+
viral stocks were passaged trough NIH-3T3- Cre cells. 1,75x10⁵ cells were seeded in 6 well plates and
the loxP-flanked BAC cassette was removed by cell passage coupled with limiting dilutions in order to
loose gradually the GFP signal stemming from the GFP expression cassette present in the BAC
sequences. Resulting virus stock is termed BAC- virus and was used to produce working stocks.
3.11 Production of viral stocks
Working virus stocks were prepared by infecting BHK-21 cells in 175cm2 flasks with a low MOI
(0.002 pfu/cell). Cells stayed incubating for 4 days at 37°C. After the incubation cells are scrapped into
the media and centrifuged for 5 min at 1500rpm at 4°C. Cell pellet was resuspended in 2mL of fresh
supplemented GMEM, aliquoted and stored at -80°C. These are the cell working stocks (CWS) that can
be used to produce subsequent viral stocks. The supernatant was transferred to 30mL bottles and ultra-
centrifuged for 2h at 12000rpm at 4°C to pellet virus. The supernatant was discarded and the pellet was
first softened in 2mL of fresh supplemented GMEM for 1h on ice and before resuspended in that same
volume. Virus were aliquoted and stored at -80°C. These stocks are termed working stock media (WSM)
and were used for all infectivity assays.
3.12 Plaque assay (virus titration using suspension assay)
1mL of 2,5x10⁵ BHK-21 cells were incubated in a rotating table with viral 10-fold serial dilutions
(10-3 to 10-8) for 1h at RT in 15mL falcon tubes. After the incubation 2mL of fresh supplemented GMEM
was added to the tubes, they were inverted for mixing and the mixture was poured to 6 well plates and

17
incubated for 4 days at 37°C. After the incubation the media covering the cells was removed and the
cells were fixed with formaldehyde 4% in PBS for 10 min at RT. The fixative was removed and the cells
were covered with toluidine blue 0.1% for a minimum of 5 min. After that time the plates were washed
in tap water and dried. Titrations were performed in duplicate. Viral plaques were counted in a
magnifying glass and the viral titers were calculated from the number of viral plaques, the corresponded
dilution and the initial inoculum, according to the formula:
nº of plaques x 1
dilution x
1
inoculum
3.13 Multi-step growth curves
To perform this assay 5x10⁴ BHK-21 cells/well were seeded in 24 well plates. The media was
removed and the cells were infected with a low MOI (0.01pfu/cell) with controls (v-WT and v-kLANA)
and the mutant viruses (v-kLANAΔ465-929 and v-kLANAΔ332-929) in 200μL of fresh supplemented
GMEM. Cells were incubated for 1h at 37°C. After the virus adsorbed to the cells, the inoculum was
removed, and cells washed 2x with 500μL of PBS. 1mL of fresh supplemented GMEM was added per
well and cells were incubated at 37°C. The multistep growth curve consists in recovering the cells and
media overtime (0, 24, 48, 72, 96 and 120 h.p.i), freeze-thawing and determine virus titers by plaque
assay. Titers were determined by plaque assay in duplicate.
3.14 Immunoblotting
Immunoblotting was performed to detect kLANA proteins in infected BHK-21 cells.
5x10⁵cells/well in a 12 well plate were infected at a MOI of 3 pfu/cell in a total volume of 500μL. As a
control, a well with non-infected cells (mock) was analysed in parallel. The viral inoculum was added to
the wells and cells were incubated for 2h at 37°C with a gentle rock every 30 min. The inoculum was
removed and cells were washed gently with 1mL of pre-warmed supplemented GMEM. 1mL of media
was added to each well and cells were left to incubate another 4h at 37°C. After that time cells were
washed twice with ice cold PBS. 110μL of lysis buffer (150mM NaCL, 10mM Tris-HCl pH 7.4, 1mM
Na3VO4, 1mM NaF, 1% Triton™ X-100, complete protease inhibitors (Roche), millieQ H2O) were added
to each well and cells were harvested into a Eppendorf to perform a quick vortex and left for 10 min on
ice. Lysates were centrifuged for 10 min at 13000rpm at 4°C and 100μL of cleared supernatant was
recovered. 100μL of 2x Laemmli’s Buffer (100mM Tris-HCl pH 6.8, 20% glycerol, 4% SDS, 10% β-
mercaptoethanol, 0.1% bromophenol blue, millieQ H2O) was added and the samples were heated at
100°C for 10 min. 50μL of each sample was loaded into a gel to be resolved by sodium dodecyl sulfate-
polyacrylamide gel electrophoresis (SDS-PAGE). The resolving gel was prepared with 30%
Acrylamide/Bis Solution, 37.5:1 from Bio-Rad, resolving gel buffer from Bio-Rad (1.5M Tris-HCl buffer,
pH 8.8), 10% SDS, 10% ammonium persulfate and TEMED (Tetramethylethylenediamine). The stacking
18
gel was prepared with 30% Acrylamide/Bis Solution, 37.5:1 from Bio-Rad, stacking gel buffer from Bio-
Rad (0.5M Tris-HCl buffer, pH 6.8), 10% SDS, 10% ammonium persulfate and TEMED. The
electrophoresis occurred in a Bio-Rad tray in TGS buffer 1X (25mM Tris-base, 192 mM glycine and
0.1% (w/v) SDS, pH 8.3) at 180V. After the electrophoresis, proteins were transferred from the gel to
nitrocellulose membranes by the wet-transfer method. After the transfer, nitrocellulose membranes were
incubated with Ponceau dye for 2 min to confirm the transfer of proteins. The membrane was blocked
with a blocking solution (PBS+0.05% Tween-20 (PBS-T) + 2.5g of non-fat powder milk) in a rotating
platform for 30 min at RT. The membrane was washed with PBS-T and incubated with blocking solution
containing each of the primary antibodies: rat α-kLANA LN53 1:1000 (Advanced Biotechnologies),
mouse α-kLANA 4C11 1:1000 (Novus Biologicals), mouse α-mLANA mAb 6A3 1:20 (Pires de Miranda
et al., 2013), rabbit α-M3 1:3000 (Jensen et al., 2003) and rabbit α-Actin 1:1000 (Sigma) in a sealed bag
in a rotating table for 2h at RT. The membrane is washed 3x, 5 min each with PBS-T and incubated with
blocking solution containing horseradish peroxidase conjugated secondary antibody (Jackson Immuno
Research) specific to the species of the primary antibodies. Incubation was for 30 min at RT. The
membrane was washed 3x, 5 min each with PBS-T. Detection of bound antibodies was performed by
chemiluminescence using SuperSignal® West Pico Chemiluminescence Substrate (Thermo Scientific)
according to the manufacturer’s instructions.
3.15 Transcription analysis of kLANA mutants
Expression of kLANA WT and kLANA mutant viral transcripts was analysed by real-time PCR.
BHK-21 (6x10⁵ cells/well in a 12 well plate) were infected with virus at a MOI of 5 pfu/cell in 500μL of
complete media for 8h. Total intracellular RNA was extracted using TRIzol® (Invitrogen) according to
the reagent supplier’s protocol. To avoid contamination with genomic DNA, samples were treated with
DNAse from the TURBO DNA-free™ (Ambion) according to the manufacturer’s instructions. Each
sample was reverse transcribed into cDNA using SuperScript III First-Strand Synthesis System
(Invitrogen) following the manufacturer’s instructions. 20μL reactions containing 500ng of DNAse treated
RNA, 50μM Oligo (dT) primer, 10mM dNTP mix, 10x RT buffer (200mM Tris HCl, pH 8.4 and 500mM
KCl), 25mM MgCl2, 0,1M DTT, 40 U/μL of RNase OUT and 200 U/μL of SuperScript III reverse
transcriptase were incubated in a thermocycler at 50°C for 50 min, followed by 85°C for 5min. Samples
were then treated with 2 U/μL of RNase H (Invitrogen). Real-time qPCR was performed on a Rotor Gene
6000 thermocycler from Corbett Research using the the DyNAmo Flash SYBR Green qPCR Kit
(ThermoFisher Scientific) and primers specific for the C-terminal coding region of kLANA (kLANA RT2-
F: 5’-TGGTTGTTGGTATCTTGG-3’ and kLANA RT2-R: 5’-CCTGGAGTTCGTATGAGG-3’). As a control
for viral infection, ORF50 viral transcripts were detected in parallel reactions using also specific primers
(ORF50-RT2_F: 5’-CAACATGGTCTTTTCAGG-3’ and ORF50-RT2_R: 5’-TAATGGGTGAAAATGGCC-
3’). The mix for the RT-qPCR contained 2μL of cDNA (diluted 1:10), 2x master mix (provided in the kit)
and 0,5 μM of each forward and reverse primer. The samples were incubated in a 72-well rotor at 95°C
for 10 min, followed by 40 cycles of 95°C for 10 sec, 55°C for 15 sec and 72°C for 30 sec, followed by
19
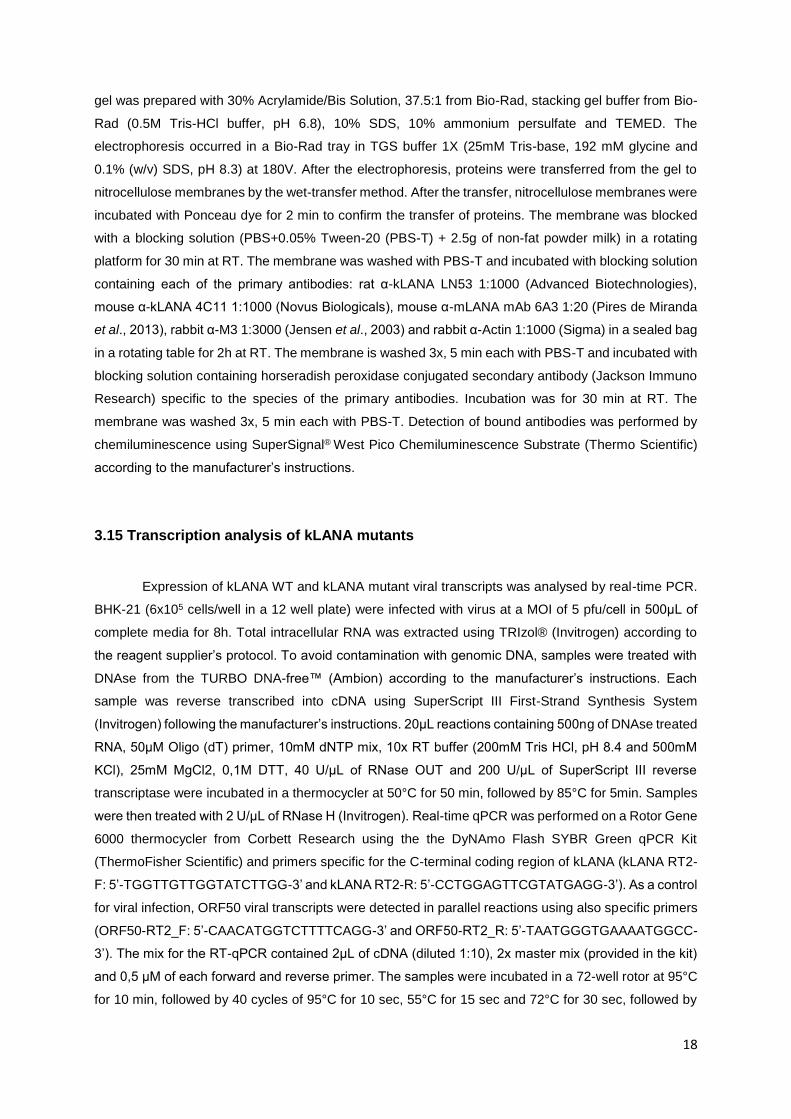
a melting analysis step from 50°C to 95°C at 0,1°C/sec. The samples were run in triplicate, the control
plasmids (psp72 PCR1_5 for kLANA full length and ORF50) were run in duplicate. Relative mRNA
values, normalized to ORF50, were calculated by the Pfaffl method (22):
Briefly this method determines a relative quantification of a gene of interest comparing it to a reference
gene. The relative expression ratio or fold difference is calculated taking into account the efficiency of
the PCR reaction (E depicted in the formula) and the Ct (in the equation is depicted as crossing points
or CP) deviation of an unknown sample against a control (v-kLANA). The target in the formula is the
samples, containing the gene of interest, which are unknown, the reference gene, or normalizer is the
ORF50, the control is the full length kLANA and the samples are the deletion mutants. The threshold
cycle (CT) is defined as the fractional cycle number at which the fluorescence passes the fixed threshold.
The results are normalized to a ORF50. PCR results were analysed with Rotor-Gene™ 6000 real-time
rotary analyser Software version 1.7. (Corbett Life Science).
3.16 In vivo Assays
3.16.1 Infection of mice
Six to eight week old mice were anaesthetized with isoflurane and inoculated intranasally with
104 pfu of virus in 20μL of PBS. At 14 days post-infection, mice were sacrificed by CO2 inhalation and
the spleens were surgically removed to a falcon containing 5mL of PBS with 2% FBS.
3.16.2 Single cell suspensions.
Spleens were mechanically disrupted and filtered through a 100 μm cell strainer in order to
remove stromal debris. Cells were then pelleted by centrifugation at 1200 rpm for 5 min at 4°C.
Supernatants were discarded and cells were resuspended in 1 mL of Red Blood Cells Lysis Buffer (154
mM ammonium chloride, 14 mM sodium hydrogen carbonate, 1 mM EDTA pH 7.3) and incubated on
ice for 5 min. Cells were washed with PBS/2% FBS and resuspended in 5mL of PBS/2% FBS These
splenocyte suspensions were used to assess viral latency by infectious centre assay/reactivation assay
(ICA) and determination of the frequency of viral DNA positive cells.

20
3.16.3 Infectious Center Assay (ex vivo explant co-culture assay)
Latent virus titers were determined by a reactivation assay. In this assay, co-culture of single-
cell suspension of splenocytes with permissive fibroblasts, in this case, BHK-21, leads to reactivation of
latent virus and formation of viral plaques. Briefly, 2-fold and 10-fold serial dilutions of splenocyte
suspension were prepared and plated, in duplicate, in 6 cm2 plates containing 5x10⁵ BHK-21 cells.
Spleens were also analysed for the presence of pre-formed infectious viruses, by performing plaque
assay in freeze-thawed splenocyte suspensions. Plates were incubated for 5 days at 37°C, 5% CO2, for
the reactivation assay and 4 days for the plaque assay. Cells were fixed with 1% formaldehyde in PBS
and stained with 0.1% toluidine blue. Viral plaques were counted with the help of a magnifier lenses and
infectious centers (pfu/spleen) were determined.
3.16.4 Sorting of GC B cells
Splenocyte suspension were prepared as described above from a pool of 5 spleens for each
infection group. To block Fc receptors, cells were incubated with purified Rat anti-mouse CD16/CD32
(mouse BD Fc Block™) (1:100 in PBS with 2% FBS) for 15 min on ice. Cells were washed with PBS
with 2% FBS and pelleted by centrifugation. Splenocytes were surfaced stained by a 25 min on dark
and on ice incubation with the following antibodies: APC-H7 Rat anti-mouse CD19 from BD Biosciences
(1:400), Anti-Human/Mouse GL7 eFluor® 660 from eBiosciences (1:200) and PE conjugated hamster
anti-mouse CD95 (FAS) Mab from BD Biosciences (1:800). Cells were then washed 2x with PBS with
2% FBS, the pellets resuspended and transferred to FACS tubes. For each infection group, 1x10⁶ GC
B cells (CD19+CD95hiGL7hi) were purified by a BD FACSAria IIu (BD Biosciences) and a BD FACSAria
III (BD Biosciences) cell sorters at the IMM flow cytometry unit. The purity of sorted cells was always
>95%, as analysed by flow cytometry.
3.16.5 Limiting dilution assay and Real-time PCR of viral DNA positive cells
Total splenocytes from a pool of 5 individual mice (starting at 2x10⁶ cells) or sorted GC B cells
(starting at 1x10⁶ cells) were serially two-fold diluted and eight replicates of each dilution added to PCR
tubes. Lysis buffer (10 mM Tris-HCl pH 8.3, 3mM MgCl2, 50mM KCl, 0,45% NP-40, 0,45% Tween-20
and 0,5mg/mL of proteinase K) was added to each tube and left overnight at 37°C. The next day the
proteinase K was inactivated at 95°C for 5 min in a thermocycler and the samples were analysed by
real time PCR, as previously described (Pires de Miranda et al., 2008), on a Rotor Gene 6000
thermocycler from Corbett Research using fluorescent Taqman methodology and primers and probe
sets specific for the MHV-68 M9 gene: M9-F (forward) (5’- GCCACGGTGGCCCTCTA -3’), M9-R
(reverse) (5’ – CAGGCCTCCCTCCCTTTG -3’) and M9T probe (5’- 6-FAM-CTTCTGTTGATCTTCC-
MGB-3’). PCR reactions had a final volume of 25μL containing 2,5μL of cell suspension lysate prepared

21
previously, 200μM of each primer, 300μM of probe, 1x Platinum Quantitative PCR SuperMix-UDG
(Invitrogen), 5mM of MgCl2 and 1x of Rox reference dye. The cycling program consists of a melting
temperature of 95°C for 10 min followed by 40 cycles of 15 sec at 95°C and 1 min at 60°C. In each PCR
run, a dilution series of pGBT9-M9, a plasmid that contains the M9 gene, was included as a positive
control. PCR results were analysed with Rotor-Gene™ 6000 real-time rotary analyser Software version
1.7. (Corbett Life Science). For all dilutions tested each replicate eas scored positive or negative based
on comparison with negative (water sample) and positive (plasmid containing M9 gene) controls. The
frequency of cells with viral DNA was calculated according to the single-hit Poisson model (SHPM) by
maximum likelihood (Bonnefoix et al., 2001). This model assumes that only one cell is necessary and
sufficient for generating a positive response. The method consists in modelling the data from the limiting
dilution assay according to the linear log-log regression model fitting the SHPM.
3.17 Statistical analysis
Data comparisons between groups was performed by an ordinary one-way ANOVA and Mann-
Whitney test, when applied. Statistics were calculated with GraphPad Prism Software. For limiting
dilution analysis 95% confidence intervals were determined as described (Marques, S. et al., 2003).

22
4. Results
4.1 Generation and characterization of MHV-68 recombinant viruses
Previous work from our laboratory shows that the chimeric kLANA MHV-68 virus (v-kLANA),
where the endogenous ORF73 (mLANA) was replaced by KSHV ORF73 (kLANA), is a viable model to
study KSHV pathogenesis in mice (Pires de Miranda and Simas, unpublished results). This model allows
to address the relevance of the different kLANA domains in an in vivo infection, by generating viral
recombinants with deletions in these domains. The internal acidic repeat region is the least
characterized domain of kLANA. Previous in vitro studies with two kLANA internal repeat deletion
mutants (kLANAΔ465-929 and kLANAΔ332-929) are expressed, in a KSHV background, have shown
that both these mutant proteins have a defect in viral episome maintenance (De León Vazquez and
Kaye, 2013).To test the importance of this internal repeat region in our in vivo chimeric model, the same
two recombinant proteins were introduced in a MHV-68 background: kLANAΔ465-929 harbours a
deletion encompassing aminoacids 465 to 929, which removes part of the glutamine region (Q), the full
leucine zipper (LZ) and the glutamate and glutamine region (EQE); kLANAΔ332-929 has a deletion in
aminoacids 332 to 929, disrupting the totality of the internal repeat region of the protein (Figure 7).
The construction of this viruses was made via a mutagenesis procedure in E. coli DH10B
according to the Two-Step-Replacement Strategy (O’ Connor et al., 1989) using a MHV-68 BAC plasmid
with the entire MHV-68 genome cloned (Collins et al., 2009). This technique allows the maintenance of
viral genome as a plasmid in E. coli, where a homologous recombination process occurs with a
subsequent reconstitution of the viral progeny by transfection of the BAC plasmid into eukaryotic cells
(Adler et al., 2003). The full procedure is described in Materials and Methods. To identify the BAC’s
harbouring the mutant kLANA sequences, a PCR with primers specific for the C-terminal region of
Figure 7: Diagram of KSHV LANA and LANA deletion mutant proteins. The numbers indicate aminoacid residues and the different domains of the protein are also indicated, namely the proline-rich (P), the aspartate and glutamate (DE), the glutamine (Q), the glutamate and glutamine (EQE), the leucine zipper (LZ) region and the DNA binding domain (DBD). The fold deficiency in episome maintenance in vitro is also shown and it was determined by comparison with the kLANA WT (De Leon Vazquez et al., 2013).
23
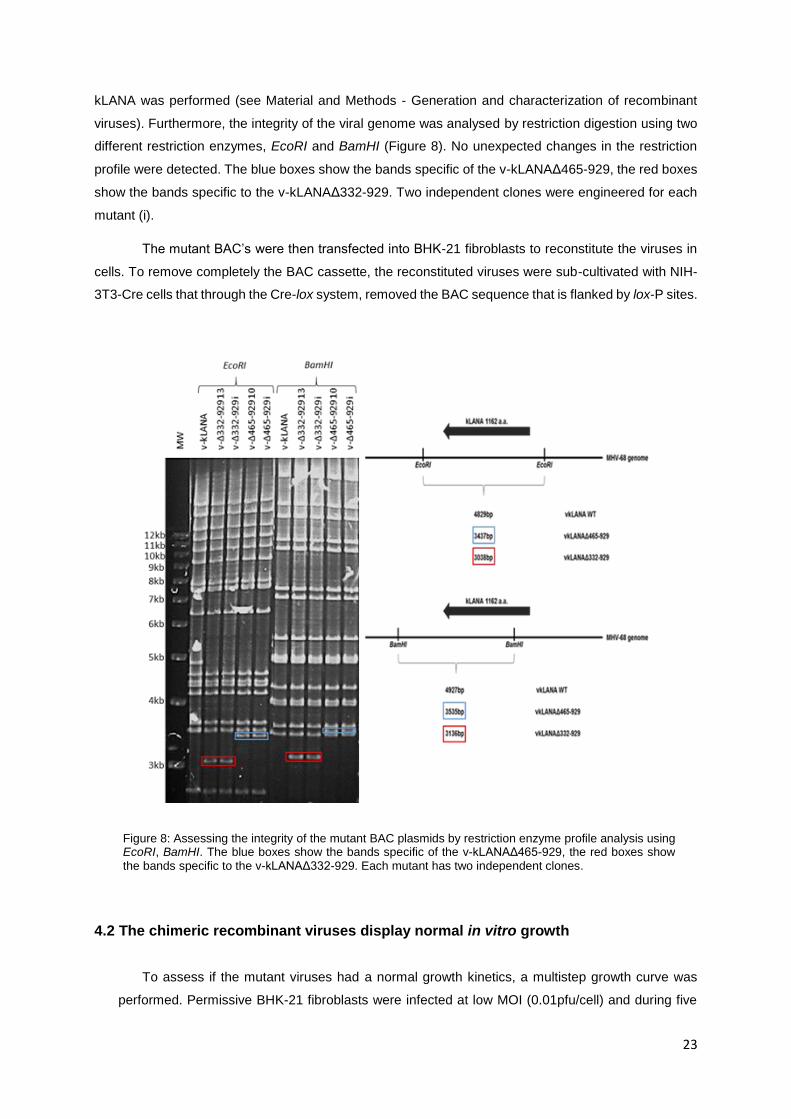
kLANA was performed (see Material and Methods - Generation and characterization of recombinant
viruses). Furthermore, the integrity of the viral genome was analysed by restriction digestion using two
different restriction enzymes, EcoRI and BamHI (Figure 8). No unexpected changes in the restriction
profile were detected. The blue boxes show the bands specific of the v-kLANAΔ465-929, the red boxes
show the bands specific to the v-kLANAΔ332-929. Two independent clones were engineered for each
mutant (i).
The mutant BAC’s were then transfected into BHK-21 fibroblasts to reconstitute the viruses in
cells. To remove completely the BAC cassette, the reconstituted viruses were sub-cultivated with NIH-
3T3-Cre cells that through the Cre-lox system, removed the BAC sequence that is flanked by lox-P sites.
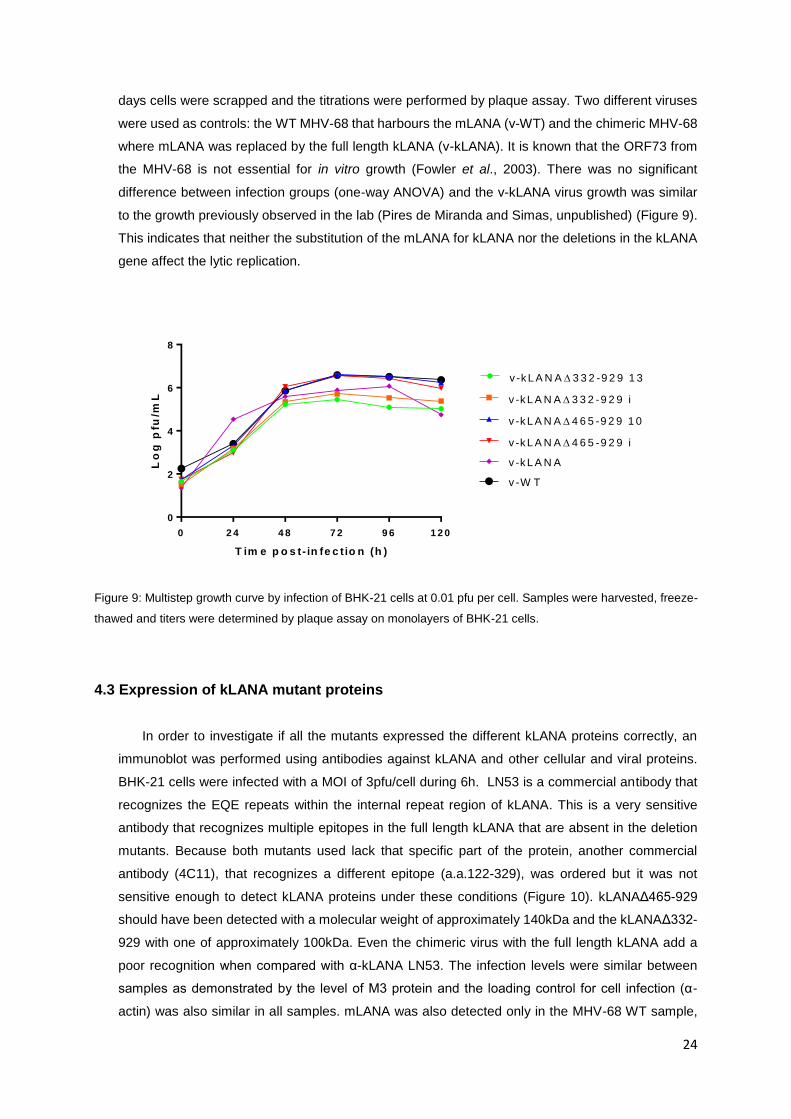
4.2 The chimeric recombinant viruses display normal in vitro growth
To assess if the mutant viruses had a normal growth kinetics, a multistep growth curve was
performed. Permissive BHK-21 fibroblasts were infected at low MOI (0.01pfu/cell) and during five
Figure 8: Assessing the integrity of the mutant BAC plasmids by restriction enzyme profile analysis using EcoRI, BamHI. The blue boxes show the bands specific of the v-kLANAΔ465-929, the red boxes show the bands specific to the v-kLANAΔ332-929. Each mutant has two independent clones.
24
days cells were scrapped and the titrations were performed by plaque assay. Two different viruses
were used as controls: the WT MHV-68 that harbours the mLANA (v-WT) and the chimeric MHV-68
where mLANA was replaced by the full length kLANA (v-kLANA). It is known that the ORF73 from
the MHV-68 is not essential for in vitro growth (Fowler et al., 2003). There was no significant
difference between infection groups (one-way ANOVA) and the v-kLANA virus growth was similar
to the growth previously observed in the lab (Pires de Miranda and Simas, unpublished) (Figure 9).
This indicates that neither the substitution of the mLANA for kLANA nor the deletions in the kLANA
gene affect the lytic replication.
Figure 9: Multistep growth curve by infection of BHK-21 cells at 0.01 pfu per cell. Samples were harvested, freeze-
thawed and titers were determined by plaque assay on monolayers of BHK-21 cells.
4.3 Expression of kLANA mutant proteins
In order to investigate if all the mutants expressed the different kLANA proteins correctly, an
immunoblot was performed using antibodies against kLANA and other cellular and viral proteins.
BHK-21 cells were infected with a MOI of 3pfu/cell during 6h. LN53 is a commercial antibody that
recognizes the EQE repeats within the internal repeat region of kLANA. This is a very sensitive
antibody that recognizes multiple epitopes in the full length kLANA that are absent in the deletion
mutants. Because both mutants used lack that specific part of the protein, another commercial
antibody (4C11), that recognizes a different epitope (a.a.122-329), was ordered but it was not
sensitive enough to detect kLANA proteins under these conditions (Figure 10). kLANAΔ465-929
should have been detected with a molecular weight of approximately 140kDa and the kLANAΔ332-
929 with one of approximately 100kDa. Even the chimeric virus with the full length kLANA add a
poor recognition when compared with α-kLANA LN53. The infection levels were similar between
samples as demonstrated by the level of M3 protein and the loading control for cell infection (α-
actin) was also similar in all samples. mLANA was also detected only in the MHV-68 WT sample,
T im e p o s t- in fe c t io n (h )
Lo
g p
fu/m
L
0 2 4 4 8 7 2 9 6 1 2 0
0
2
4
6
8
v -k L A N A 3 3 2 -9 2 9 1 3
v -k L A N A 3 3 2 -9 2 9 i
v -k L A N A 4 6 5 -9 2 9 1 0
v -k L A N A 4 6 5 -9 2 9 i
v -k L A N A
v -W T

25
as expected. Clearly the problem resides in the lack of a good antibody. Serum from a patient with
Kaposi’s sarcoma, that contains polyclonal antibodies (gift from Professor Kenneth Kaye) was also
used to try to detect kLANA mutants but was also not effective in the detection (data not showed).
Figure 10: Detection of the expression of WT and mutant kLANA proteins. BHK-21 cells were infected with a MOI
of 3pfu/cell during 6h. The proteins were detected with the antibodies indicated on the right. Molecular weight (in
kDa) is indicated on the left.
4.4 Transcription analysis of kLANA mutants
Since it was impossible to detect the kLANA mutant proteins by immunoblotting, the levels of mRNA
expression were quantified instead. Because kLANA proteins affect their own transcription, these
analyses could also reveal if the lack kLANA internal regions would affect expression. BHK-21 cells
were infected with virus at a MOI of 5 pfu/cell during 8h. Total intracellular RNA was extracted, reverse
transcribed and real-time qPCR was performed using primers specific for kLANA and ORF50 viral
transcripts (see Materials and Methods - Transcription analysis of kLANA mutants). Relative kLANA
mRNA values were normalized to ORF50, a lytic gene that is transcribed during the first 8h after
infection. Ratios were calculated using the Pfaff method (Pfaff, 2001), and plotted as fold difference of
kLANA mRNA levels relative to the chimeric virus v-kLANA (Figure 11).
Analysing the data it is clear that both v-kLANAΔ465-929 independent mutants express kLANA at
the same level as v-kLANA, while v-kLANAΔ332-929 independent mutants present a deficit in kLANA
expression levels. One possible explanation for this deficit is that the aspartate and glutamate internal
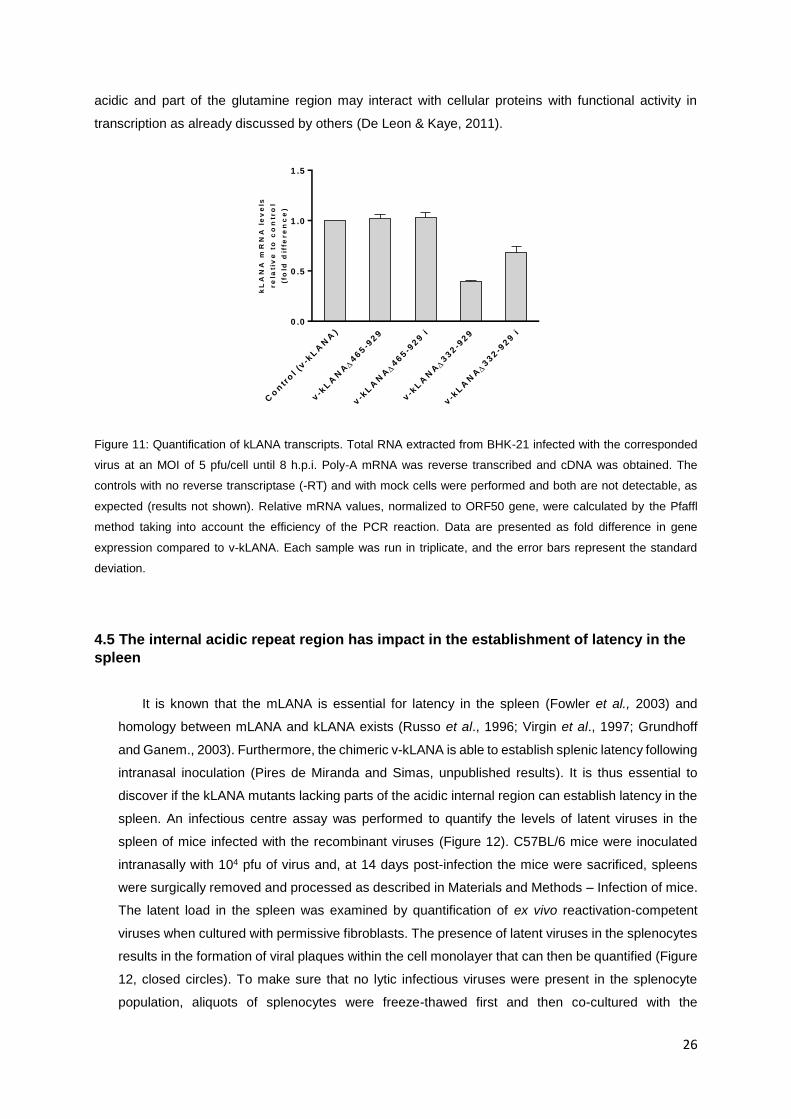
26
acidic and part of the glutamine region may interact with cellular proteins with functional activity in
transcription as already discussed by others (De Leon & Kaye, 2011).
Figure 11: Quantification of kLANA transcripts. Total RNA extracted from BHK-21 infected with the corresponded
virus at an MOI of 5 pfu/cell until 8 h.p.i. Poly-A mRNA was reverse transcribed and cDNA was obtained. The
controls with no reverse transcriptase (-RT) and with mock cells were performed and both are not detectable, as
expected (results not shown). Relative mRNA values, normalized to ORF50 gene, were calculated by the Pfaffl
method taking into account the efficiency of the PCR reaction. Data are presented as fold difference in gene
expression compared to v-kLANA. Each sample was run in triplicate, and the error bars represent the standard
deviation.
4.5 The internal acidic repeat region has impact in the establishment of latency in the
spleen
It is known that the mLANA is essential for latency in the spleen (Fowler et al., 2003) and
homology between mLANA and kLANA exists (Russo et al., 1996; Virgin et al., 1997; Grundhoff
and Ganem., 2003). Furthermore, the chimeric v-kLANA is able to establish splenic latency following
intranasal inoculation (Pires de Miranda and Simas, unpublished results). It is thus essential to
discover if the kLANA mutants lacking parts of the acidic internal region can establish latency in the
spleen. An infectious centre assay was performed to quantify the levels of latent viruses in the
spleen of mice infected with the recombinant viruses (Figure 12). C57BL/6 mice were inoculated
intranasally with 104 pfu of virus and, at 14 days post-infection the mice were sacrificed, spleens
were surgically removed and processed as described in Materials and Methods – Infection of mice.
The latent load in the spleen was examined by quantification of ex vivo reactivation-competent
viruses when cultured with permissive fibroblasts. The presence of latent viruses in the splenocytes
results in the formation of viral plaques within the cell monolayer that can then be quantified (Figure
12, closed circles). To make sure that no lytic infectious viruses were present in the splenocyte
population, aliquots of splenocytes were freeze-thawed first and then co-cultured with the
kL
AN
A m
RN
A l
ev
els
re
lati
ve
to
co
ntr
ol
(fo
ld d
iffe
re
nc
e)
Co
ntr
ol (v
-kL
AN
A)
v-k
LA
NA465-9
29
v-k
LA
NA465-9
29 i
v-k
LA
NA332-9
29
v-k
LA
NA332-9
29 i
0 .0
0 .5
1 .0
1 .5
27
permissive cells. No pre-formed infectious viruses could be detected at any time point for any of the
analysed viruses (Figure 12, open circles).
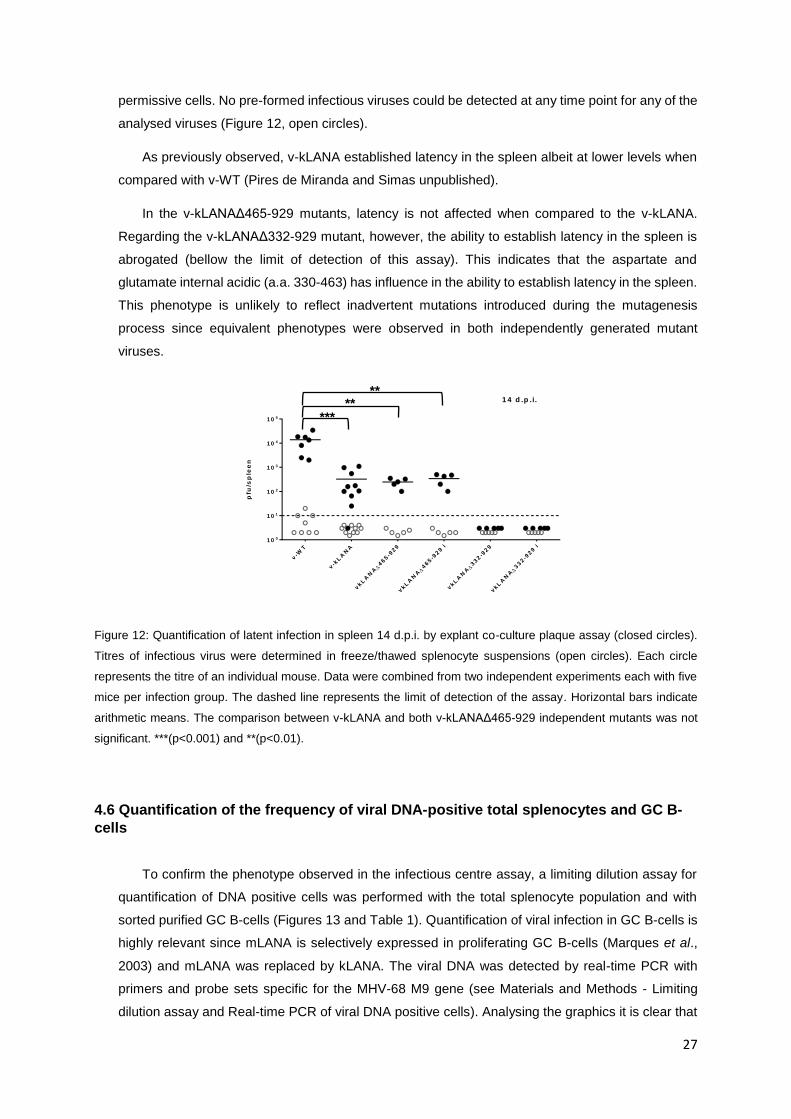
As previously observed, v-kLANA established latency in the spleen albeit at lower levels when
compared with v-WT (Pires de Miranda and Simas unpublished).
In the v-kLANAΔ465-929 mutants, latency is not affected when compared to the v-kLANA.
Regarding the v-kLANAΔ332-929 mutant, however, the ability to establish latency in the spleen is
abrogated (bellow the limit of detection of this assay). This indicates that the aspartate and
glutamate internal acidic (a.a. 330-463) has influence in the ability to establish latency in the spleen.
This phenotype is unlikely to reflect inadvertent mutations introduced during the mutagenesis
process since equivalent phenotypes were observed in both independently generated mutant
viruses.
Figure 12: Quantification of latent infection in spleen 14 d.p.i. by explant co-culture plaque assay (closed circles).
Titres of infectious virus were determined in freeze/thawed splenocyte suspensions (open circles). Each circle
represents the titre of an individual mouse. Data were combined from two independent experiments each with five
mice per infection group. The dashed line represents the limit of detection of the assay. Horizontal bars indicate
arithmetic means. The comparison between v-kLANA and both v-kLANAΔ465-929 independent mutants was not
significant. ***(p<0.001) and **(p<0.01).
4.6 Quantification of the frequency of viral DNA-positive total splenocytes and GC B-
cells
To confirm the phenotype observed in the infectious centre assay, a limiting dilution assay for
quantification of DNA positive cells was performed with the total splenocyte population and with
sorted purified GC B-cells (Figures 13 and Table 1). Quantification of viral infection in GC B-cells is
highly relevant since mLANA is selectively expressed in proliferating GC B-cells (Marques et al.,
2003) and mLANA was replaced by kLANA. The viral DNA was detected by real-time PCR with
primers and probe sets specific for the MHV-68 M9 gene (see Materials and Methods - Limiting
dilution assay and Real-time PCR of viral DNA positive cells). Analysing the graphics it is clear that
1 4 d .p .i.
pfu
/sp
lee
n
v-W
T
v-k
LA
NA
vkL
AN
A465-9
29
vkL
AN
A465-9
29 i
vkL
AN
A332-9
29
vkL
AN
A332-9
29 i
1 0 0
1 0 1
1 0 2
1 0 3
1 0 4
1 0 5
1 4 d .p .i.
pfu
/sp
lee
n
v-W
T
v-k
LA
NA
vkL
AN
A465-9
29
vkL
AN
A465-9
29 i
vkL
AN
A332-9
29
vkL
AN
A332-9
29 i
1 0 0
1 0 1
1 0 2
1 0 3
1 0 4
1 0 5
***
**
**
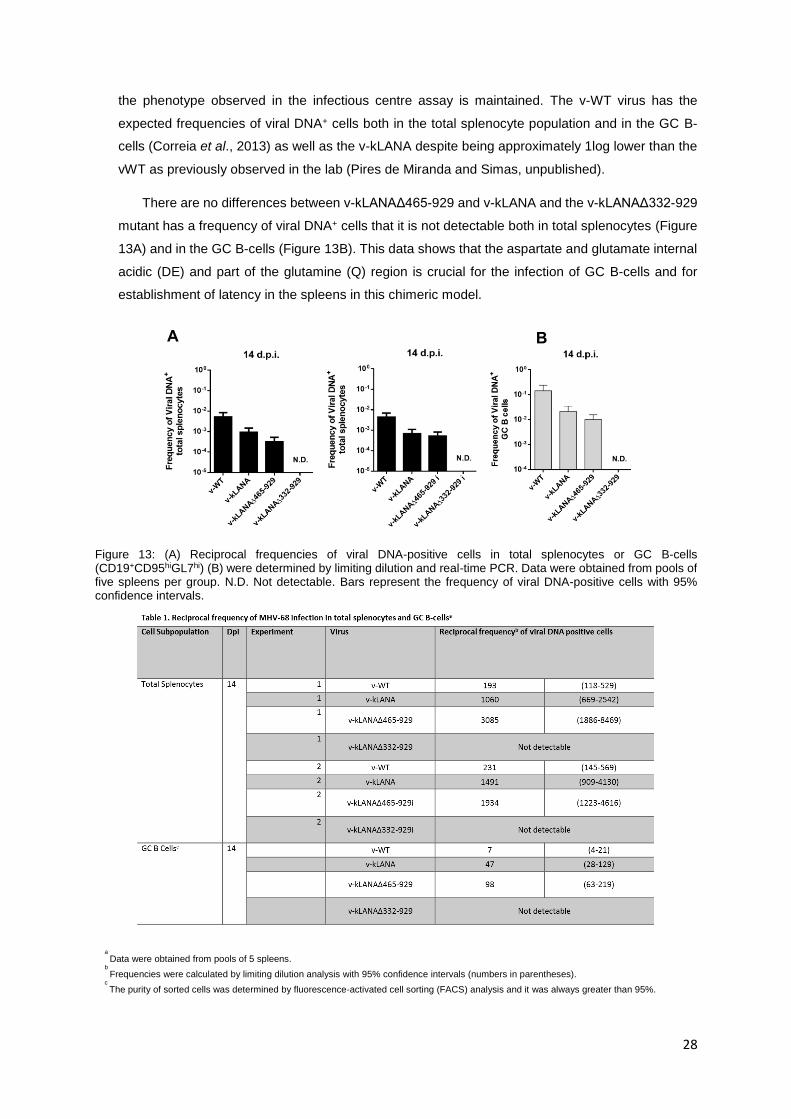
28
the phenotype observed in the infectious centre assay is maintained. The v-WT virus has the
expected frequencies of viral DNA+ cells both in the total splenocyte population and in the GC B-
cells (Correia et al., 2013) as well as the v-kLANA despite being approximately 1log lower than the
vWT as previously observed in the lab (Pires de Miranda and Simas, unpublished).
There are no differences between v-kLANAΔ465-929 and v-kLANA and the v-kLANAΔ332-929
mutant has a frequency of viral DNA+ cells that it is not detectable both in total splenocytes (Figure
13A) and in the GC B-cells (Figure 13B). This data shows that the aspartate and glutamate internal
acidic (DE) and part of the glutamine (Q) region is crucial for the infection of GC B-cells and for
establishment of latency in the spleens in this chimeric model.
Figure 13: (A) Reciprocal frequencies of viral DNA-positive cells in total splenocytes or GC B-cells (CD19+CD95hiGL7hi) (B) were determined by limiting dilution and real-time PCR. Data were obtained from pools of five spleens per group. N.D. Not detectable. Bars represent the frequency of viral DNA-positive cells with 95% confidence intervals.
a
Data were obtained from pools of 5 spleens. b
Frequencies were calculated by limiting dilution analysis with 95% confidence intervals (numbers in parentheses). c
The purity of sorted cells was determined by fluorescence-activated cell sorting (FACS) analysis and it was always greater than 95%.
A B

29
5. Discussion
In this work, two kLANA-MHV68 chimeric mutant viruses were generated, v-kLANAΔ465-929,
lacking part of the Q, the LZ and the EQE internal repeat region and v-kLANAΔ332-929, lacking the
entire internal repeat region. They were created to assess the impact of kLANA internal repeat deletions
in the chimeric in vivo model. Results show that the DE internal repeat region and part of the Q region
(a.a. 330-463) are essential for the viral latency in the spleen.
Recombinant viruses displayed an in vitro growth similar to the v-WT and v-kLANA viruses
(Figure 3). This was expected since it has been reported that mLANA was not essential for in vitro
growth (Fowler et al., 2003). This indicates that neither the substitution of the mLANA for kLANA, nor
the internal repeat deletions in the kLANA gene dramatically affected the lytic replication.
In vivo analysis by infectious centre assay show that the v-kLANAΔ465-929 has a latency peak
very similar to vkLANA, in both independent clones and the v-kLANAΔ332-929 mutant has a completely
different result, with a phenotype emerging (Figure 12). For the latter, the ability to establish latency in
the spleen is below the limit of detection of the assay. This result indicates that the DE internal repeat
region, encompassed in a.a. 330-463, influences the ability of v-kLANA to establish latency in the
spleen. In agreement is the detection of the frequency of viral DNA positive cells, where no differences
between v-kLANAΔ465-929 and v-kLANA are observed, and the v-kLANAΔ332-929 mutant present a
frequency of viral DNA positive cells that it is not detectable both in total splenocytes and in the GC B
cells (Figures 13A and 13B and Table 1). The correlation between this two independent assays helps
to confirm the phenotype observed in the v-kLANAΔ332-929 mutant, where the lack of establishment of
latency in the spleen assessed by infectious centre assay is supported by the non detection of viral DNA
positive cells in total splenocytes and in GC B cells.
The results obtained in this work are in line with studies made by others, where in vitro, either
in transient transfected cells or in stable cell lines expressing similar LANA deletion mutants, kLANA
without the complete internal repeat region had deficits in maintaining viral episomes during latency
(Alkharsah and Schulz in 2011; De León Vasquez and Kaye, 2011; De León Vasquez and Kaye, 2013).
Some proteins, important for the correct replication and/or segregation of the episomes, might
interact with this internal region and the lack of that region impairs the persistence of viral genomes in
the spleen. Protein conformation itself might be altered by the lack of this structural parts, making it
impossible to function correctly. There also might be additional functions other than DNA segregation
and replication exerted by the internal repeat region that are essential for persistency of episome in the
spleen.
It was also important to detect the proteins by western blot to check if the lack of latency of the
v-kLANAΔ332-929 was due to low protein levels or lower stability of the protein. Given the fact that v-
kLANAΔ465-929 establishing latency in the spleen, with levels similar to v-kLANA, it is likely that the
protein is being expressed. The most common used antibody to detect kLANA is LN53, which is an
antibody that detects several epitopes in the EQE repeat region and is very sensitive. Because both v-
30
kLANAΔ465-929 and v-kLANAΔ332-929 lack that specific part, another antibody was used and it was
not successful in the detection (Figure 11). Serum from a KS patient was also used to try to detect the
proteins but is was unsuccessful as well. In the future efforts should be done to detect these mutant
proteins, like the construction of viruses with higher affinity epitope tags (HA tag for example), to be able
to detect these proteins with common commercial antibodies. The use of more cells or higher MOI to
intensify the detection and the analysis at different time-points after infection can also be done to
improve the detection levels in a western blot
The levels of kLANA poly-A transcripts in both mutant viruses were also assessed in infected
BHK-21 cells and compared to v-kLANA. The v-kLANA and the v-kLANAΔ465-929 presented very
similar levels of transcripts whereas the v-kLANAΔ332-929 have a slight deficit in the kLANA expression
levels (Figure 11). This might be due to the fact that the aspartate and glutamate internal acidic and part
of the glutamine region may interact with cellular proteins with functional activity in transcription (De
Leon & Kaye, 2011). Again, with the lack of such structural parts, the protein conformation might be
altered in such a way that blocks the access of the transcription machinery, making it difficult for the
correct transcription to occur. Overall these results confirm expression of the mutant kLANA transcripts
in infected cells and suggest that deletion of the internal regions does not affect significantly its own
expression.
Many proteins interact with different parts of LANA. Some were identified and mapped to overlap
with the internal repeat region. These proteins fall in the transcription category, in chromosome structure
or modification and in cell growth regulation (De León Vasquez and Kaye, 2011). Protein-protein
interaction assays should be performed to identify even more interactions and, more importantly, map
the location of those interactions. It is possible that most interactions occur within the internal repeat
region since it is the biggest region (Figure 5). By doing this kind of assays it might be possible to unveil
more functions of this internal structural part.

31
6. Conclusion
This work took advantage of the creation of an in vivo model to study the pathogenesis
associated with Kaposi’s sarcoma-associated herpesvirus infection. Two chimeric recombinant viruses
in a MHV-68 background were created, where the MHV-68 ORF73 (mLANA) was substituted by KSHV
ORF73 (kLANA): v-ΔkLANA465-929, which retains the DE region and part of the Q region and v-
ΔkLANA332-929, lacking the entire internal repeat region. The fact that these parts were missing helped
to unveil their importance in this in vivo model.
v-ΔkLANA465-929 had the same ability to establish latency in the spleen as the v-kLANA, while
the v-ΔkLANA332-929 has a big deficit in establish latency. This leads to conclude that the aspartate
and glutamate and part of the glutamine internal regions (a.a. 330-464) are somehow crucial for the
latency in the spleen. These results have similarities with in vitro results obtained by other authors where
it was seen that the lack of some internal parts of kLANA led to a deficit in the maintenance of the viral
episomes during latency.
In the future, a deletion mutant encompassing precisely aminoacids 330-463 should be
constructed, in order to prove that this is really a crucial part of the protein for infection and establishment
of latency. Furthermore, with this mutant virus, the EQE repeats are maintained, meaning that the
epitopes for the LN53 antibody are maintained and it is thus possible to detect the protein.
Future work on identification of more proteins that interact with this internal part is also needed to
elucidate better the mechanisms underlying LANA full function.
By having more knowledge about this protein, that is crucial for latency, might shed light into a possible
therapeutic target for fighting the KSHV infection.

32
7. References
. Adler, H. et al., 2000. Cloning and mutagenesis of the murine gammaherpesvirus 68 genome as an
infectious bacterial artificial chromosome. J Virol, 74(15), pp.6964–74.
. Adler, H., Messerle, M. & Koszinowski, U.H., 2003. Cloning of herpesviral genomes as bacterial
artificial chromosomes. Reviews in medical virology, 13(2), pp.111–121.
. Alkharsah, K.R. & Schulz, T.F., 2011. A role for the internal repeat of the Kaposi’s sarcoma-associated
herpesvirus latent nuclear antigen in the persistence of an episomal viral genome. J Virol, 86(3),
pp.1883–7.
. Ballestas, M.E. & Kaye, K.M., 2001. Kaposi ’ s Sarcoma-Associated Herpesvirus Latency-Associated
Nuclear Antigen 1 Mediates Episome Persistence through cis -Acting Terminal Repeat ( TR )
Sequence and Specifically Binds TR DNA Kaposi ’ s Sarcoma-Associated Herpesvirus Latency-
Associated Nucl. , 75(7), pp.3250–3258.
. Ballestas, M.E., Chatis, P. A. & Kaye, K.M., 1999. Efficient persistence of extrachromosomal KSHV
DNA mediated by latency-associated nuclear antigen. Science (New York, N.Y.), 284(5414),
pp.641–644.
. Barbera, A.J., 2006. The Nucleosomal Surface as a Docking Station for Kaposi’s Sarcoma Herpesvirus
LANA. Science, 311(5762), pp.856–861.
. Barton, E., Mandal, P. & Speck, S.H., 2011. Pathogenesis and host control of gammaherpesviruses:
lessons from the mouse. Annu Rev Immunol, 29, pp.351–397.
. Bennett, N.J., May, J.S. & Stevenson, P.G., 2005. Gamma-herpesvirus latency requires T cell evasion
during episome maintenance. PLoS Biology, 3(4), pp.0638–0649.
. Blasdell, K. et al., 2003. The wood mouse is a natural host for Murine herpesvirus 4. Journal of General
Virology, 84(1), pp.111–113.
. Blaskovic, D., Stancekova, M., Svobodova, J. and Mistrikova, J., 1980. Isolation of five strains of
herpesviruses from two species of free-living small rodents. Acta Virol, 24, 468.
. Bonnefoix, T. et al., 2001. Graphical representation of a generalized linear model-based statistical test
estimating the fit of the single-hit Poisson model to limiting dilution assays. Journal of immunology,
167(10), pp.5725–5730.
. Cai, Q.; Verma, S.C.; Lu, J.; Robertson, E.S. 2010. Molecular biology of Kaposi’s sarcoma-associated
herpesvirus and related oncogenesis. Adv. Virus Res, (78), pp.87-142.

33
. Chang, Y.; Cesarman, E.; Pessin, M.S.; Lee, F.; Culpepper, J.; Knowles, D.M.; Moore, P.S., 1994.
Identification of herpesvirus-like DNA sequences in AIDS-associated Kaposi’s sarcoma. Science, 266,
pp.1865–1869.
. Collins, C.M., Boss, J.M. & Speck, S.H., 2009. Identification of infected B-cell populations by using a
recombinant murine gammaherpesvirus 68 expressing a fluorescent protein. J Virol, 83(13), pp.6484–
93.
. Correia, B. et al., 2013. Crystal Structure of the Gamma-2 Herpesvirus LANA DNA Binding Domain
Identifies Charged Surface Residues Which Impact Viral Latency. PLoS Pathogens, 9(10).
. Coscoy, L., 2007. Immune evasion by Kaposi’s sarcoma-associated herpesvirus. Nature Reviews
Immunology, 7(5), pp.391–401.
. Davison AJ, Eberle R, Ehlers B, et al., 2009. The Order Herpesvirales. Archives of virology, 154(1),
pp.171-177.
. Davison, A.J., 2002. Evolution of the herpesviruses. Veterinary microbiology, 86(1-2), pp.69–88.
. De Leon Vazquez, E. & Kaye, K.M., 2011. The Internal Kaposi’s Sarcoma-Associated Herpesvirus
LANA Regions Exert a Critical Role on Episome Persistence. J Virol, 85(15), pp.7622–7633.
. De Leon Vazquez, E. et al., 2014. A short sequence immediately upstream of the internal repeat
elements is critical for KSHV LANA mediated DNA replication and impacts episome persistence.
Virology, 448, pp.344–355.
. De Leon Vazquez, E., Carey, V. & Kaye, K., 2013. Identification of Kaposi’s Sarcoma-Associated
Herpesvirus LANA Regions Important for Episome Segregation, Replication, and Persistence. J
Virol, 87(22), pp.12270–12283.
. Decker, B.L.L. et al., 1996. The Kaposi Sarcoma-associated Herpesvirus (KSHV) Is Present as an
Intact Latent Genome in KS Tissue but Replicates in the Peripheral Blood Mononuclear Cells of
KS Patients. J. Exp. Med, 184(7), pp.283-288.
. Dittmer, D. et al., 1998. A cluster of latently expressed genes in Kaposi’s sarcoma-associated
herpesvirus. J Virol, 72(10), pp.8309–8315.
. Efstathiou, S., Ho, Y.M. & Minson, a. C., 1990. Cloning and molecular characterization of the murine
herpesvirus 68 genome. Journal of General Virology, 71(6), pp.1355–1364.
. Flaño, E. et al., 2000. Latent murine gamma-herpesvirus infection is established in activated B-cells,
dendritic cells, and macrophages. Journal of immunology, 165(2), pp.1074–81.

34
. Flaño, E. et al., 2002. Gamma-herpesvirus latency is preferentially maintained in splenic germinal
center and memory B-cells. The Journal of experimental medicine, 196(10), pp.1363–72.
. Fowler, P. et al., 2003. ORF73 of murine herpesvirus-68 is critical for the establishment and
maintenance of latency. Journal of General Virology, 84(12), pp.3405–3416.
. Frederico, B. et al., 2014. A Murine gamma-herpesviruses exploits normal splenic immune
communication routes for systemic spread. Cell Host and Microbe, 15(4), pp.457–470.
. Gao, S.J. et al., 1999. Molecular polymorphism of Kaposi’s sarcoma-associated herpesvirus (Human
herpesvirus 8) latent nuclear antigen: evidence for a large repertoire of viral genotypes and dual
infection with different viral genotypes. The Journal of infectious diseases, 180(5), pp.1466–1476.
. Grundhoff, A. & Ganem, D., 2003. The Latency-Associated Nuclear Antigen of Kaposi’s Sarcoma-
Associated Herpesvirus Permits Replication of Terminal The Latency-Associated Nuclear Antigen
of Kaposi ’ s Sarcoma-Associated Herpesvirus Permits Replication of Terminal Repeat-Containing
Plasmids. J Virol, 77(4), pp.2779–2783.
. Habison, A. C. et al., 2012. Murine Gammaherpesvirus 68 LANA Acts on Terminal Repeat DNA To
Mediate Episome Persistence. J Virol, 86(21), pp.11863–11876.
. Jensen, K.K. et al., 2003. Disruption of CCL21-induced chemotaxis in vitro and in vivo by M3, a
chemokine-binding protein encoded by murine gammaherpesvirus 68. Jvirol, 77(1), pp.624–630.
. Komatsu, T. et al., 2001. The Kaposi’s Sarcoma-Associated Herpesvirus Latency-Associated Nuclear
Antigen. Viral Immunology, 14(4), pp.311–317.
. Komatsu, T. et al., 2004. KSHV LANA1 binds DNA as an oligomer and residues N-terminal to the
oligomerization domain are essential for DNA binding, replication, and episome persistence.
Virology, 319(2), pp.225–236.
. Kwun, H.J. et al., 2007. Kaposi’s sarcoma-Associated Herpesvirus Latency-Associated Nuclear
Antigen 1 Mimics Epstein-Barr Virus EBNA1 Immune Evasion through Central Repeat Domain
Effects on Protein Processing. J Virol, 81(15), pp.8225–8235.
. Lagunoff, M. & Ganem, D., 1997. The structure and coding organization of the genomic termini of
Kaposi’s sarcoma-associated herpesvirus. Virology, 236(1), pp.147–154.
. Lan, K. et al., 2004. Kaposi’s sarcoma-associated herpesvirus-encoded latency-associated nuclear
antigen inhibits lytic replication by targeting Rta: a potential mechanism for virus-mediated control
of latency. J Virol, 78(12), pp.6585–6594.
35
. Liu F, Zhou ZH. Comparative virion structures of human herpesvirus. In: Arvin A, Campadelli-Fiume
G, Mocarski E, et al; editors. Human Herpesviruses: Biology, Therapy and Immunoprophylaxis.
Cambridge: Cambridge University Press; 2007. Chapter 3.
. Marques, S. et al., 2003. Selective gene expression of latent murine gammaherpesvirus 68 in B
lymphocytes. J Virol, 77(13), pp.7308–18.
. Mesri, E. a, Cesarman, E. & Boshoff, C., 2010. Kaposi’s sarcoma and its associated herpesvirus.
Nature reviews Cancer, 10(10), pp.707–719.
. Moore, P.S. & Chang, Y., 2003. Kaposi’s sarcoma–associated herpesvirus Immunoevasion and
Tumorigenesis: Two Sides of the Same Coin? Annu Rev Microbiol, (20), pp.609–639.
. Moorman, N.J., Willer, D.O. & Speck, S.H., 2003. The gammaherpesvirus 68 latency-associated
nuclear antigen homolog is critical for the establishment of splenic latency. J Virol, 77(19),
pp.10295–303.
. Nash, A.A. et al., 2001. Natural history of murine gamma-herpesvirus infection. Philosophical
Transactions of the Royal Society of London. Series B, 356(1408), pp.569–579.
. O’Connor, M., Peifer, M. & Bender, W., 1989. Construction of large DNA segments in Escherichia coli.
Science, 244(4910), pp.1307–1312.
. Pedro Simas, J. & Efstathiou, S., 1998. Murine gammaherpesvirus 68: A model for the study of
gammaherpesvirus pathogenesis. Trends in Microbiology, 6(7), pp.276–282.
. Pfaffl, M.W., 2001. A new mathematical model for relative quantification in real-time RT-PCR. Nucleic
acids research, 29(9), p.e45.
. Pires De Miranda, M. et al., 2008. The gammaherpesvirus m2 protein manipulates the Fyn/Vav
pathway through a multidocking mechanism of assembly. PLoS ONE, 3(2).
. Pires De Miranda, M. et al., 2013. Role of Src homology domain binding in signaling complexes
assembled by the murine γ-herpesvirus M2 protein. Journal of Biological Chemistry, 288(6), pp.3858–
3870.
. Purushothaman, P. et al., 2016. KSHV Genome Replication and Maintenance. Frontiers in
Microbiology, 7(2), pp.1–14.
. Russo, J.J. et al., 1996. Nucleotide sequence of the Kaposi sarcoma-associated herpesvirus (HHV8).
Proceedings of the National Academy of Sciences of the United States of America, 93(25), pp.14862–
7.
36
. Simas, J.P. et al., 1999. Analysis of murine gammaherpesvirus-68 transcription during lytic and latent
infection. Journal of General Virology, 80(1), pp.75–82.
. Stewart, J.P. et al., 1998. Lung Epithelial Cells Are a Major Site of Murine Gammaherpesvirus
Persistence. J Exp Med, 187(12), pp.1941–1951.
. Sunil-Chandra, N.P. et al., 1992a. Virological and pathological features of mice infected with murine
gammaherpesvirus 68. Journal of General Virology, 73(9), pp.2347–2356.
. Sunil-Chandra, N.P., Efstathiou, S. & Nash, A.A., 1992b. Murine gammaherpesvirus 68 establishes a
latent infection in mouse B lymphocytes in vivo. Journal of General Virology, 73(12), pp.3275–
3279.
. Uppal, T. et al., 2014. KSHV LANA - The Master Regulator of KSHV Latency. Viruses, 6(12), pp.4961–
4998.
. Verma, S.C., Lan, K. & Robertson, E., 2007. Structure and function of latency-associated nuclear
antigen. Current topics in microbiology and immunology, 312, pp.101–36.
. Viejo-Borbolla, A. et al., 2003. A Domain in the C-terminal region of latency-associated nuclear antigen
1 of Kaposi’s sarcoma-associated Herpesvirus affects transcriptional activation and binding to
nuclear heterochromatin. J Virol, 77(12), pp.7093–100.
. Virgin, H.W. et al., 1997. Complete sequence and genomic analysis of murine gammaherpesvirus 68.
J Virol, 71(8), pp.5894–904.
. Weck, K.E. et al., 1999. B-cells regulate murine gammaherpesvirus 68 latency. J Virol, 73(6), pp.4651–
4661.
. Wen, K.W. & Damania, B., 2010. Kaposi sarcoma-associated herpesvirus (KSHV): Molecular biology
and oncogenesis. Cancer Letters, 289(2), pp.140–150.
. Wu, T.-T., Blackman, M.A. & Sun, R., 2010. Prospects of a novel vaccination strategy for human
gamma-herpesviruses. Immunologic Research, 48(1-3), pp.122–146.
. Ye, F., Lei, X. & Gao, S.J., 2011. Mechanisms of Kaposi’s sarcoma-associated herpesvirus latency
and reactivation. Advances in Virology, vol. 2011, Article ID 193860, 19 pages.
. Zaldumbide, A. et al., 2006. In cis inhibition of antigen processing by the latency-associated nuclear
antigen I of Kaposi sarcoma Herpes virus. Molecular Immunology, 44(6), pp.1352–1360.


![Sodium Dodecyl Sulfate-PolyacrylAmide gel Electrophoresis [SDS-PAGE] Experiment 7 BCH 333[practical]](https://img.pdfslide.us/doc/110x75/5a4d1acb7f8b9ab05996f6d2/sodium-dodecyl-sulfate-polyacrylamide-gel-electrophoresis-sds-page-experiment.jpg)


![Proteomics of Chlamydomonas reinhardtii Light-Harvesting ... · tein separation by high-resolution (isoelectric focusing com-bined with sodium dodecyl sulfate [SDS]-polyacrylamide](https://img.pdfslide.us/doc/110x75/5ec8467ed0cd7c3a730fb3bc/proteomics-of-chlamydomonas-reinhardtii-light-harvesting-tein-separation-by.jpg)