Embed Size (px)
Citation preview

Microbiological and Biochemical
Investigations of Cocoa Bean Fermentation
Dissertation
submitted to the Department of Chemistry
Faculty of Mathematics, Informatics, and Natural Sciences
University of Hamburg
for the degree of Doctor of Natural Sciences
by
Fahrurrozi
from Lombok, West Nusa Tenggara, Indonesia
Hamburg 2015

| i
Die vorliegende Arbeit wurde in der Zeit von April 2011 bis Oktober 2014 in dem Arbeitskreis
von Professor Dr. Bernward Bisping in der Abteilung für Lebensmittelmikrobiologie und
Biotechnologie, Fachbereich Chemie, Fakultät für Mathematik, Informatik und
Naturwissenschaften der Universität Hamburg, Deutschland angefertigt.
The following work was conducted during the time period from April 2011 – October 2014 in
the research group of Professor Dr. Bernward Bisping at the Division of Food Microbiology
and Biotechnology, Department of Chemistry, Faculty of Mathematics and Natural Sciences,
University of Hamburg, Germany.
1. Gutachter / Reviewer: Prof. Dr. Bernward Bisping
2. Gutachter / Reviewer: Prof. Dr. Sascha Rohn
Tag der Disputation / Day of oral examination (disputation): 27 March 2015

| ii
Erklärung über frühere Promotionversuche
Hiermit erkläre ich, dass vorher keine weiteren Promotionversuche unternommen worden sind, oder an einer anderen Stelle vorgelegt wurden.
Hamburg, den ……………………………….. …………………………………………………………………
(Unterschrift)
Eidesstattliche Versicherung
Hiermit erkläre ich an Eides statt, dass die vorliegende Dissertationschrift selbständing und allein von mir unter den angegebenen Hilfsmitteln angefertigt wurde.
Hamburg, den ……………………………….. …………………………………………………………………
(Unterschrift)

| iii
Eidesstattliche Erklärung
Ich erkläre hiermit an Eides statt, dass ich die vorliegende Dissertation selbständig verfasst
habe und die angegebenen Quellen und Hilfsmittel verwendet habe. Ich habe vorher weder
die vollständige Dissertation noch Teile der Dissertation an anderer Stelle eingereicht. Dies
ist mein erster Promotionsversuch, um den Doktorgrad zu erlangen.
Declaration
I hereby declare under oath that I have worked on this dissertation independently and have
used sources and equipments as specified in this work. This dissertation has not been
previously submitted in part or in total to any other institution. This is my first attempt to
submit a dissertation in order to obtain a doctorate degree.
___________________________________
Fahrurrozi

| iv
Acknowledgement
First and foremost, I would like to thank God for giving me the magnificent gift of living in
this world. To Him I belong, on Him I always depend and unto Him I shall return.
I wish to express my sincere and deep gratitude to Professor Bernward Bisping for giving me
the invaluable opportunity to work in his labs and for all of his support, kindness, and
hospitality. I am very grateful to Prof. Dr. Sascha Rohn for kindly accepting to be the second
reviewer for my dissertation. I would also to express my profound thanks to Prof. Dr. Peter
Heisig and Dr. Angelika Paschke-Kratzin who honoured me with their approval to be
members of the doctoral committee for my disputation. I am very grateful to Prof. Dr.
Reinhard Lieberei for many helpful hints and fruitful discussions.
I am also very much grateful to working group of Prof. Dr. Bernward Bisping (Dr. Cornelia
Koob, Dr. Claudia Bahmann, Dr. Zhu Xuan, Corina Noll, Nicole Illas, Clemens Bernhardt,
Dominic Bahmann), working group of Prof. Dr. Reinhard Lieberei (Dr. Daniel Kadow, Thomas
Tumforde and Detlef Böhm), working group of Prof. Dr. Sascha Rohn (Valeria Reim), working
group of Prof. Dr. Hartmut Schlüter (Olga Kraus), University Medical Center Hamburg-
Eppendorf and working group of Dr. Christian von Wallbrunn, Geisenheim University for all
of their assistance in various ways which I am not able to mention individually.
Many thanks are due to the Ministry of Research and Technology Scholarship (RISTEK
Scholarship), Republic of Indonesia for giving me the financial support to taste the beautiful
and impressive life in Hamburg, in addition to my academic activities. I would like to extend
my gratitude, too, to the Indonesia Institute of Sciences (LIPI), which freed me from my work
duty and gave me permission to pursue my doctoral research. Particularly the Research
Center for Biotechnology and its former director Prof. Dr. Bambang Prasetya, M.Sc and
Dr. Puspita Lisdiyanti, M.Sc introduced me to the new research topic of cocoa bean
fermentation.
I further would like to thank my beloved wife Dewi Monasari for all the support, love,
patience, hard work and responsibility to take care of our family during my study; my lovely
sons Deo Nanda Fakhrullah and Faiz Saladin Wahid have always inspired and motivated me
to complete my study. I cannot find the words to thank you adequately for all of your great

A c k n o w l e d g e m e n t | v
sacrifices for your husband, your father. My dearest parents, I thank you both for your
“invisible help”.
It is beyond my ability to mention all others who have supported me; I am indebted to many
other people and organisations that were integral to the completion of this project.

| vi
List of Publications
Poster publications
Fahrurrozi, Bahmann C, Lieberei R, Bisping B (2013) Antifungal activity in seed coat extracts
of Theobroma cacao L. Poster. Dechema Jahrestagung der Biotechnologen, Frankfurt
am Main, 4.-5. March 2013.
Fahrurrozi, Bahmann C, Lieberei R, Bisping B (2013) Antifungal activity in seed coat extracts
of Theobroma cacao L. Poster presentation at VAAM International Conference on
Microbiology, Bremen, Germany, 10 - 13 March 2013.
Fahrurrozi, Bahmann C, Niemenak N, Lieberei R, Bisping B (2014) Antifungal protein of seed
coat extracts of Theobroma cacao L. during fermentation. N Biotechnol 31: S178.

| vii
LIST OF CONTENTS
1 INTRODUCTION ......................................................................... 1
1.1 History of cocoa and chocolate ............................................................................... 1
1.2 World cocoa production ......................................................................................... 3
1.3 Cocoa varieties and the effect of genotype on cocoa bean flavours ......................... 4
1.4 The cocoa pulp and beans ....................................................................................... 6
1.4.1 Cocoa pulp .................................................................................................................. 6
1.4.2 Cocoa beans ................................................................................................................ 6
1.5 Fermentation of cocoa pulp and beans ................................................................... 9
1.5.1 Cocoa pulp inoculation ............................................................................................... 9
1.5.2 Cocoa bean fermentation ......................................................................................... 10
1.6 Methods of cocoa bean fermentation ................................................................... 11
1.6.1 Heap fermentation.................................................................................................... 11
1.6.2 Box fermentation ...................................................................................................... 13
1.7 The succession of microorganisms during fermentation ........................................ 15
1.7.1 The three-phase cocoa bean fermentation process ................................................. 15
1.7.2 Yeast fermentation ................................................................................................... 17
1.7.3 Lactic acid bacteria (LAB) fermentation .................................................................... 18
1.7.4 Acetic acid bacteria (AAB) fermentation .................................................................. 19
1.7.5 Bean death ................................................................................................................ 20
1.7.6 Optimal fermentation course and end of fermentation .......................................... 20
1.8 Drying of fermented cocoa beans ......................................................................... 21
1.8.1 Drying process ........................................................................................................... 21
1.8.2 Drying apparatus ....................................................................................................... 23
1.9 Biochemical changes in the cocoa beans during fermentation and drying .............. 26

L i s t o f c o n t e n t s | viii
1.9.1 Creating an environment for flavour precursor development during
fermentation ............................................................................................................. 26
1.9.2 Enzymatic and diffusion processes in the beans cotyledons during
fermentation and drying ........................................................................................... 27
1.10 Use of starter cultures for the fermentation of cocoa beans .................................. 30
1.11 Chocolate flavour development and chocolate production .................................... 32
1.11.1 Chocolate flavour ...................................................................................................... 32
1.11.2 Chocolate production ............................................................................................... 33
1.12 Seed coat (testa) of Theobroma cacao L., and plant antifungal protein .................. 36
1.12.1 Seed coat (testa) of Theobroma cacao L. ................................................................. 36
1.12.2 Plant antifungal proteins .......................................................................................... 38
1.13 Structure of the fungal cell wall ............................................................................ 41
2 AIMS OF THE THESIS ................................................................ 42
3 MATERIAL AND METHODS ....................................................... 44
3.1 Cocoa bean fermentation samples ........................................................................ 44
3.2 Fermentation protocol for commercial fermentation plant in Nusantara
Plantation XII (PTPN XII) ....................................................................................... 44
3.3 Fermentation protocol for laboratory level ........................................................... 45
3.3.1 Materials ................................................................................................................... 45
3.3.2 Starter culture strains and preparation .................................................................... 45
3.3.3 Design of the cocoa bean fermentation ................................................................... 45
3.4 Fermentation protocol for fermentation with only 10% of pulp ............................. 47
3.5 Determination of physical and chemical changes during fermentation .................. 48
3.5.1 Determination of temperature value ....................................................................... 48
3.5.2 Determination of pH value ....................................................................................... 48

L i s t o f c o n t e n t s | ix
3.5.3 Determination of water activity (aW) value .............................................................. 48
3.6 Microbiological analyses ....................................................................................... 49
3.6.1 Media and reagents .................................................................................................. 49
3.6.2 Enumeration, isolation and purification of yeasts, lactic acid bacteria, and
acetic acid bacteria ................................................................................................... 51
3.6.3 Gram staining ............................................................................................................ 52
3.6.4 Catalase activity ........................................................................................................ 53
3.6.5 Oxidase test ............................................................................................................... 53
3.7 Carbohydrate assimilation test using the API kit ................................................... 54
3.7.1 Carbohydrate assimilation test for yeasts using API ID 32 C .................................... 54
3.7.2 Carbohydrate assimilation test for lactic acid bacteria using API 50 CHL ................ 54
3.8 FT-IR spectroscopy for the identification of yeasts ................................................ 54
3.9 Identification using molecular methods ................................................................ 55
3.9.1 Isolation of genomic DNA and purification ............................................................... 55
3.9.2 Determination of DNA concentration and purity ..................................................... 56
3.9.3 Agarose gel electrophoresis ...................................................................................... 57
3.9.4 Visualization and documentation of DNA................................................................. 57
3.9.5 Amplification of DNA by polymerase chain reaction (PCR) ...................................... 58
3.9.6 Purification of PCR product ....................................................................................... 62
3.9.7 Sequencing analyses of DNA ..................................................................................... 62
3.9.8 BLAST analyses .......................................................................................................... 63
3.10 Physiological adaptation to fermentation environment (acid, ethanol and heat
tolerance) ............................................................................................................ 63
3.10.1 Physiological adaptation of yeasts ............................................................................ 63
3.10.2 Physiological adaptation of lactic acid bacteria ........................................................ 63
3.10.3 Physiological adaptation of acetic acid bacteria ....................................................... 64
3.11 Analyses of metabolites with HPLC ....................................................................... 64
3.11.1 Measurement of sugars and ethanol ........................................................................ 64

L i s t o f c o n t e n t s | x
3.11.2 Measurement of organic acids and glycerol ............................................................. 66
3.11.3 Measurement of amino acids ................................................................................... 66
3.11.4 Measurement of polyphenols and anthocyanins ..................................................... 67
3.12 Extraction of the seed coat slime .......................................................................... 70
3.12.1 Preparation of the seed coat slime from different times of fermentation .............. 70
3.12.2 Preparation of the seed coat slime from different cocoa varieties .......................... 70
3.13 Antimicrobial activity assays ................................................................................. 71
3.13.1 Microorganisms for assays........................................................................................ 71
3.13.2 Preparation of the seed coat slime solution for assays ............................................ 73
3.13.3 Antimicrobial assay against molds ............................................................................ 73
3.13.4 Antimicrobial assay against yeasts ........................................................................... 74
3.13.5 Antimicrobial activity assay against Gram-positive and Gram-negative bacteria .... 74
3.14 Minimum inhibitory concentration against molds and yeasts ................................ 75
3.14.1 Agar diffusion methods ............................................................................................. 75
3.14.2 Broth microdilution methods ................................................................................... 76
3.15 Biochemical analyses of seed coat slime proteins .................................................. 77
3.15.1 Quantitative determination of protein content ....................................................... 77
3.15.2 SDS-polyacrylamide gel electrophoresis (SDS-PAGE) ............................................... 78
3.15.3 Precipitation of seed coat slime proteins ................................................................. 81
3.15.4 Extraction of seed coat slime proteins ..................................................................... 81
3.15.5 Separation of seed coat slime proteins with SDS-PAGE electrophoresis ................. 82
3.15.6 Identification of seed coat proteins with mass spectrometry .................................. 82
3.15.7 Temperature stability of the seed coat slime extract ............................................... 84
4 RESULTS .................................................................................. 85
4.1 Dynamics and biodiversity of the populations of yeasts, lactic acid bacteria
(LAB) and acetic acid bacteria (AAB) involved in the spontaneous box
fermentation of cocoa beans in Nusantara Plantation XII (PTPN XII), East Java,
Indonesia ............................................................................................................. 85

L i s t o f c o n t e n t s | xi
4.1.1 Changes in temperature and pH during cocoa bean fermentation ......................... 85
4.1.2 Microbiological analysis of cocoa bean fermentation .............................................. 86
4.1.3 Yeast identification ................................................................................................... 87
4.1.4 Lactic acid bacteria identification ............................................................................. 89
4.1.5 Acetic acid bacteria identification ............................................................................ 90
4.1.6 Carbohydrates (sucrose, glucose, fructose, and mannitol) ...................................... 91
4.1.7 Organic acids (citric acid, succinic acid, lactic acid, acetic acid) ............................... 93
4.1.8 Ethanol and glycerol concentrations ........................................................................ 94
4.2 Diversity and characterization of yeasts, lactic acid bacteria and acetic acid
bacteria in spontaneous cocoa bean fermentations carried out in Jember,
Indonesia; Mocache, Ecuador; Santo Domingo, Trinidad & Tobago ....................... 96
4.2.1 Identification and diversity of yeasts ........................................................................ 96
4.2.2 Identification and diversity of lactic acid bacteria .................................................... 98
4.2.3 Identification and diversity of acetic acid bacteria ................................................... 99
4.2.4 Yeasts characterization ............................................................................................. 99
4.2.5 Lactic acid bacteria characterization ...................................................................... 101
4.2.6 Acetic acid bacteria characterization ...................................................................... 103
4.3 Development of a starter culture at laboratory level for improved quality of
cocoa bean fermentation products ...................................................................... 104
4.3.1 Changes in pH during cocoa bean fermentation .................................................... 104
4.3.2 Growth of the starter culture during fermentation ............................................... 105
4.3.3 Analysis of metabolites ........................................................................................... 107
4.4 Investigation of activity and characterization of antifungal proteins in the seed
coat slime of Theobroma cacao L. ....................................................................... 115
4.4.1 Antimicrobial activity assay against fungi, Gram-positive bacteria and Gram-
negative bacteria .................................................................................................... 115
4.4.2 Minimum inhibitory concentration against molds and yeasts ............................... 118
4.4.3 Protein concentration in the seed coat slime ......................................................... 124
4.4.4 Protein extraction and separation by electrophoresis ........................................... 124
4.4.5 Temperature stability of seed coat proteins .......................................................... 125

L i s t o f c o n t e n t s | xii
4.4.6 Identification of seed coat slime proteins .............................................................. 127
4.5 Investigation of the influence of seed coat slime on growth of starter culture
and physical and chemical changes during cocoa bean fermentation at
laboratory level .................................................................................................. 129
4.5.1 Changes in pH during fermentation........................................................................ 129
4.5.2 Growth of the starter culture during fermentation ............................................... 130
4.5.3 Analysis of metabolites ........................................................................................... 132
5 DISCUSSION .......................................................................... 138
5.1 Dynamics and biodiversity of the populations of yeasts, lactic acid bacteria
(LAB) and acetic acid bacteria (AAB) involved in the spontaneous box
fermentation of cocoa beans in Nusantara Plantation XII (PTPN XII), East Java,
Indonesia ............................................................................................................ 138
5.2 Diversity and characterization of yeasts, lactic acid bacteria and acetic acid
bacteria in spontaneous cocoa bean fermentations carried out in Jember,
Indonesia; Mocache, Ecuador; Santo Domingo, Trinidad & Tobago ...................... 143
5.3 Development of a starter culture at laboratory level for improved quality of
cocoa bean fermentation products ...................................................................... 148
5.4 Investigation of activity and characterization of antifungal proteins in the seed
coat slime of Theobroma cacao L. ....................................................................... 152
5.5 Investigation of the influence of seed coat slime slime on growth of starter
culture and physical and chemical changes during cocoa bean fermentation at
laboratory level .................................................................................................. 156
6 SUMMARY (ZUSAMMENFASSUNG) ....................................... 158
6.1 Summary ............................................................................................................. 158
6.2 Zusammenfassung ............................................................................................... 160

L i s t o f c o n t e n t s | xiii
7 REFERENCES .......................................................................... 163
8 FIGURES AND TABLES ............................................................ 177
8.1 List of figures ....................................................................................................... 177
8.2 List of tables ........................................................................................................ 181
9 APPENDIX ............................................................................. 183
9.1 Abbreviations ...................................................................................................... 183
9.1.1 General abbreviations ............................................................................................. 183
9.1.2 Abbreviations for amino acids ................................................................................ 187
9.1.3 Abbreviations for microorganisms.......................................................................... 188
9.2 Hazardous chemicals ........................................................................................... 191
9.2.1 List of hazardous chemicals .................................................................................... 191
9.2.2 Abbreviations and description of hazards .............................................................. 193
9.2.3 Risk phrases and description of risks ...................................................................... 194
9.2.4 Safety phrases and description of safety ................................................................ 196
9.3 Representative results of fourier-transfom infrared (FT-IR) spectroscopy for
yeast identification ............................................................................................. 197
9.4 Representative results of 26S rRNA gene sequencing for yeasts ........................... 198
9.5 Representative results of 16S rRNA gene sequencing for lactic acic bacteria and
acetic acid bacteria ............................................................................................. 200
9.6 Representative HPLC chromatogram for carbohydrates analysis .......................... 202
9.7 Representative HPLC chromatogram for organic acids analysis ............................. 203
9.8 Representative HPLC chromatogram for amino acids analysis .............................. 204
9.9 Representative HPLC chromatogram for polyphenol analysis ............................... 205

L i s t o f c o n t e n t s | xiv
9.10 Representative MALDI TOF MS chromatogram for protein analysis ...................... 206
10 CURRICULUM VITAE .............................................................. 208

| 1
1 Introduction
1.1 History of cocoa and chocolate
The term ‘cocoa’ is a corruption of the word ‘cacao’ that is taken directly from Mayan and
Aztec languages. Chocolate is derived from cocoa beans, found in the fruit of cocoa tree,
Theobroma cacao, which is indigenous to South America and believed to have originated
from the Amazon and Orinoco valleys. Theobroma cacao (food of the gods) belongs to the
family Sterculiaceae and includes four principal types: Criollo, which accounts for about 5%
of world cocoa production; the more common Forastero, with smaller, flatter and purple
beans; and Nacional with a fine flavour, grown in Ecuador. The fourth variety, Trinitario, a
more disease-resistant hybrid of Criollo and Forastero is regarded as a high flavour bean
(Fowler 2009).
Wild cocoa trees originate from the Amazon, but the cultivated crop is found around the
world on the tropical belt, where the humid and hot climate allows for economically
lucrative cocoa production. Theobroma cacao grows between the tropics of Cancer and
Capricorn, with varieties originating in forest areas of South America. Forastero basic cocoa
grows mainly in Brazil and West Africa, whilst flavour cocoas are largely hybrids and are
cultivated in Central and South America (Afoakwa 2010).
Figure 1.1 Cocoa producing countries (Rohsius et al. 2010)

I n t r o d u c t i o n | 2
The distribution of cocoa throughout the world started from Mexico with descendants of the
Criollo group. Later, mainly Forasteros from the Eastern part of South America were
transported to West Africa (known as the West African Amelonados). Although cocoa
breeding programs have been enforced since the early 1960s, the ancient distribution
pattern of fine and flavour vs. bulk cocoas can still be observed in most of the countries. Fine
and flavour Criollo and Trinitario descendants still predominate in e.g. Java, Papua New-
Guinea and Madagascar, whereas bulk cocoa (Forastero) is prevalent in West Africa (Rohsius
et al. 2010).
The use of cocoa beans dates back at least 1400 years (Rössner 1997), when Aztecs and
Incas used the beans as currency for trading or to produce the so-called “chocolatl”, a drink
made by roasting and grinding cocoa nibs, mashing them with water, and often adding other
ingredients such as vanilla, spices or honey. In the 1520s, the drink was introduced into
Spain (Minifie 1989) although Coe and coworkers emphasize that the European arrivals in
the new world, including Christopher Columbus and Hernan Cortes, were unimpressed with
the Mayan beverage (Coe et al. 1996). Nevertheless, the conquistadors familiarized Europe
with the chocolate beverage, and being expensive, it was initially reserved for consumption
by the highest social classes. It was only in the seventeenth century that the consumption of
chocolate spread throughout Europe (Afoakwa 2010).
Progress in cocoa and chocolate production together with industrialization during the 18th
and 19th century made it possible to give chocolate creative and innovative shapes that
would forever change its appearance from a drink to pressed blocks and bars. Amongst
others, the cocoa beans grinder (invented by the Frenchman Doret in 1778), the cocoa press
(discovered by the Dutchman Van Houten in 1828) and the conche (invented by the Swiss
Lindt in 1879) were introduced, and the first solid ‘eating’ chocolates were created by
incorporating sugar and cocoa butter into the paste (created by the English Fry in 1848)
(Afoakwa 2010). Milk chocolate was first created by the Swiss Peter in 1875 after Nestlé is
discovery of how to manufacture milk powder in 1867 (Afoakwa 2010).
In today’s Europe, the leading chocolate producers are Belgium, Switzerland, France,
Germany, and the United Kingdom. Whereas Belgium is world famous for its extremely fine,
excellent tasting and high-quality dark chocolate, French chocolate became renowned in

I n t r o d u c t i o n | 3
French gastronomy; Swiss chocolate is appreciated worldwide for its seductive silky
smoothness and purity. Today, Cadbury, Nestlé, Mars, the Ferrero Group, and Hershey
Foods represent 60% of the world market of chocolate (www.candyindustry.com).
1.2 World cocoa production
Theobroma cacao originated in the Amazon Basin, where the optimal growth conditions of
20 – 30 °C, 1500–2500 mm of annual rainfall and 2000 hours of sunshine per year are found.
Table 1.1 shows that the density of production is centered within West Africa, accounting for
approximately 71% of world cocoa production in the 2012 – 2013 growing season. West
African countries are ideal in terms for climate for growing cocoa as a cash crop. However, as
a consequence, natural or man-made problems can potentially have a disproportionately
large impact on the cocoa trade. Small holders in West Africa have dominated world
production since the 1930s. In the 1980s, the emergence of Malaysian and Indonesian
productions led to a more balanced geographical spread of production (Afoakwa 2010).

I n t r o d u c t i o n | 4
Table 1.1 World cocoa production
Thousand tones Thousand tones Thousand tones
Countries 2011/12 % 2012/2013 % 2013/2014* %
World total 4085 100.0 3929 100.0 4162 100.0
Africa 2919 71.5 2823 71.9 2981 71.6
Cameroon 207 5.1 225 5.7 205 4.9
Ivory Coast 1486 36.4 1449 36.9 1610 38.7
Ghana 879 21.5 835 21.3 850 20.4
Nigeria 235 5.8 225 5.7 230 5.5
Others 113 2.8 89 2.3 86 2.1
America 655 16.0 622 15.8 676 16.2
Brazil 220 5.4 185 4.7 210 5.0
Ecuador 198 4.8 192 4.9 210 5.0
Others 237 5.8 245 6.2 256 6.2
Asia & Oceania 511 12.5 484 12.3 505 12.1
Indonesia 440 10.8 410 10.4 425 10.2
Papua New Guinea 39 1.0 37 0.9 40 1.0
Others 32 0.8 37 0.9 40 1.0
Source: ICCO Quarterly Bulletin of Cocoa Statistics, Vol. XL, No. 2, Cocoa year 2013/14, *) forecasts
1.3 Cocoa varieties and the effect of genotype on cocoa bean flavours
The oval, leathery cocoa fruits vary among varieties in size, shape, external color, and
appearance (Fig. 1.2). Criollo pods are small and elongated, soft, thin-skinned and are
typically red or yellow, sometimes green or white. The pods have a bumpy (five to ten deep
furrows) or warty skin with pointed tips. Forastero pods are moderately sized, thick-walled,
green, and relatively smooth with a more or less bulbous (no pointed tips) or, sometimes
round shape (type Amelonado). The woodier hull makes the pods harder to open. Trinitario
pods can be red or yellow as well as orange or purple, large, elongated but not pointed,
moderately ribbed, sometimes warty or with a relatively smooth skin. Nacional pods are
large, green, thick walled, deeply bumped, and oval, slightly narrowed at the basis and with

I n t r o d u c t i o n | 5
a blunted point. At harvest time, cocoa pods change color from green or dark red-purple to
yellow, orange, or red, depending on the cocoa variety (Wood and Lass 2008).
a) Criollo b) Nacional
c) Forastero d) Trinitario
Figure 1.2 Cocoa varieties: a) Criollo, b) Nacional, c) Forastero, d) Trinitario
Criollo, Trinitario and Nacional are fine flavoured cocoas with different flavour attributes;
Criollo are nutty and floral, Trinitario are acidic and fruity, while Nacional are floral, fruity,
raw/beany/green. Forastero is bulk grade cocoa with the flavour attributes of cocoa, bitter
and astringent (Afoakwa 2010; Beckett 2009). Bulk cocoa is usually used for milk chocolates
and cocoa butter, while fine or flavour cocoas are usually used for premium plain dark
chocolates and couvertures (Rohsius et al. 2010).

I n t r o d u c t i o n | 6
1.4 The cocoa pulp and beans
1.4.1 Cocoa pulp
Cocoa pulp is the raw material which serves as the basis for fermentation, as it is a rich
medium for microbial growth. This mucilage constitutes about 10% of the mass of the cocoa
fruit. It is composed of 82 - 87% water, 10 - 15% sugars, 1 - 5% pectin, 1 - 3% citric acid, 0.1 -
0.4% other non-volatile acids (malic acid and tartaric acid), 0.5 - 0.7% proteins and 8 - 10%
minerals and trace elements (Schwan et al. 1995). Of the sugars present, about 60% is
sucrose and 39% is a mixture of glucose and fructose. The concentration of sucrose, glucose,
and fructose is a function of cultivar and fruit age, with unripe pods containing a higher
proportion of sucrose and ripe pods containing mainly fructose and glucose (Thompson et al.
2001). The amino acids, aspartic acid, glutamic acid, and asparagine, have been reported to
be present at high levels in the pulp compared to other amino acids. Vitamin C is the most
important vitamin in cocoa pulp. Potassium and sulfate are the major cations and anions,
respectively. Cocoa pulp contains a higher concentration of sulfate than chloride or
phosphate. The pH of the pulp is relatively low (pH 3.0 to 4.0), mainly due to the citric acid
content. The high content of pectin and other polysaccharides (cellulose, hemicellulose,
lignin) makes the pulp viscous, sticky, and cohesive.
1.4.2 Cocoa beans
Each cocoa pod contains 20 - 30 (Criollo) or 30 - 40 (Forastero and Trinitario) beans
embedded in a sweet, white, mucilaginous pulp that represents approximately 40% of the
seed’s fresh weight. The beans are arranged in five rows, derived from the five locules of the
ovary around and loosely attached to a central placenta (Camu et al. 2007).
Criollo beans are large, rather round and white (or slightly pale violet in pigment, possibly
due to the presence of alleles of Forastero origin) in cross-section, ferment quickly (2 - 3
days), and in the past were reported to have a highly regarded (caramel, nut, or honey
flavour), slightly bitter, but usually weak, chocolate flavour. Compared to Criollo, Forastero
beans are smaller and flatter and the cotyledons are violet. They ferment slowly (5 - 7 days)
and their flavour produced upon proper processing is stronger (bitter and cocoa flavour).

I n t r o d u c t i o n | 7
In addition, the Forastero beans possess a higher fat content than Criollo beans. Trinitario
beans provide a less intense but fine taste, constituting an intermediary between the Criollo
and Forastero beans. The Arriba-type beans (Nacional) are large, flat, and deep purple, and
produce cocoa with a ‘fine’ flavour, i.e. an intense cocoa flavour, which is very aromatic and
with a slight bitterness. This typical, highly appreciated flavour is determined largely by
genetic factors, but the fermentation process and further processing play a role, too. Finally,
a different and fruitier flavour can be processed in much the same way as chocolate in order
to produce ‘cupulate’ from beans of Theobroma grandiflorum or cupuaçu (Rohsius et al.
2006; Reisdorff et al. 2004).
Fresh, unfermented cocoa beans basically consist of two parts (Fig. 1.3 a): an outer part
comprising the testa (seed coat) surrounding the bean, and an inner part comprising two
cotyledons contained within the testa and uniformed at a small embryonic axis and the
embryo (germ). The cotyledons are referred to as the nibs in the cured bean. The testa of
the cocoa seed is impermeable to larger molecules, whereas smaller volatile molecules such
as ethanol and acetic acid can easily penetrate the testa. In this way, the testa provides a
natural barrier against organic acid (citric acid) penetrating from the pulp into the bean as
well as discouraging the outward diffusion of theobromine, caffeine, and polyphenols, hence
controlllings the kinetics of fermentation and the concomitant diffusion processes (see
Section 1.9.2).
The cotyledons are basically made up of different types of storage cells, such as white
lipid/protein/starch and purple polyphenol-containing cells, with parenchyma plasma
forming a grid between the two types of cells (Fig. 1.3 b). Whereas the storage cells of starch
granules, aleurone grains, and fat droplets constitute the reserve material for the embryo
and lipids form a natural barrier around the water-soluble compounds (enzymes, substrates,
and inhibitors), the larger, vacuolated, polyphenol storage cells contain unique cocoa bean
components encompassing purine alkaloids (theobromine and caffeine) and polyphenols,
both possibly involved in the stress resistance responses of the plant.
The fat of the cocoa bean is important for chocolate production, which depends on cocoa
butter as an essential ingredient. Fat makes up slightly more than 50% of the mass of the dry
unfermented cocoa bean cotyledons. The cocoa butter present in the bean is a relatively
I n t r o d u c t i o n | 8
simple fat comprised primarily of palmitic acid (C16:0, saturated, 25%), stearic acid (C18:0,
saturated, 35%), and oleic acid (cis-C18:1, mono-unsaturated, 35%), with small amounts of
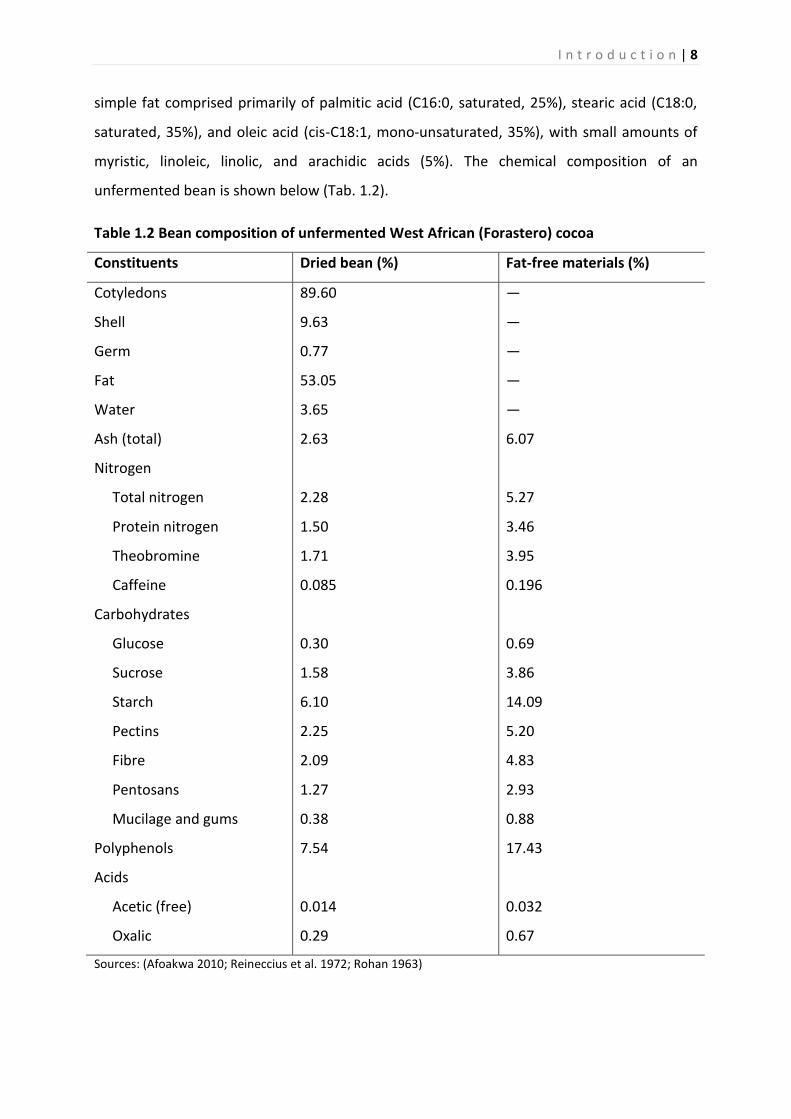
myristic, linoleic, linolic, and arachidic acids (5%). The chemical composition of an
unfermented bean is shown below (Tab. 1.2).
Table 1.2 Bean composition of unfermented West African (Forastero) cocoa
Constituents Dried bean (%) Fat-free materials (%)
Cotyledons
Shell
Germ
Fat
Water
Ash (total)
Nitrogen
Total nitrogen
Protein nitrogen
Theobromine
Caffeine
Carbohydrates
Glucose
Sucrose
Starch
Pectins
Fibre
Pentosans
Mucilage and gums
Polyphenols
Acids
Acetic (free)
Oxalic
89.60
9.63
0.77
53.05
3.65
2.63
2.28
1.50
1.71
0.085
0.30
1.58
6.10
2.25
2.09
1.27
0.38
7.54
0.014
0.29
—
—
—
—
—
6.07
5.27
3.46
3.95
0.196
0.69
3.86
14.09
5.20
4.83
2.93
0.88
17.43
0.032
0.67
Sources: (Afoakwa 2010; Reineccius et al. 1972; Rohan 1963)

I n t r o d u c t i o n | 9
Figure 1.3 a) Cocoa bean, b) Cocoa bean storage cells
1.5 Fermentation of cocoa pulp and beans
1.5.1 Cocoa pulp inoculation
The pulp is microbiologically sterile when healthy, undamaged pods are opened aseptically.
The interior of ripe pods may contain a few hundred microorganisms (yeasts) per gram
(Jespersen et al. 2001). When the pulp and bean are manually removed from the opened
a

I n t r o d u c t i o n | 10
pods, the pulp is accidentally contaminated with a variety of microorganisms, prevalent in
the surrounding environment. Contamination can occur through cocoa pod surfaces, banana
and plantain leaves used to construct and cover the heaps, boxes, and baskets, knives used
for opening the pods, the workers’ hands, unwashed baskets used for transient seed
transport, dried mucilage left on the walls of receptacles from previous fermentations, and
fruit flies and other insects (Ostovar and Keeney 1973; Jespersen et al. 2001). Many but not
all of these microorganisms contribute to the subsequent fermentation (Schwan and Wheals
2004).
1.5.2 Cocoa bean fermentation
The batch process of cocoa bean fermentation forms the basis of the entire chocolate
production and plays a significant role in determining the flavour and health properties of
chocolate and chocolate-related products. Cocoa bean fermentation is a spontaneous
fermentation process. It takes two to eight days, depending on the variety of cocoa and local
practice, with five to six days being most common, and is most often carried out in heaps or
wooden boxes with 100 - 1000 kg bean. The bean may be mixed or turned once daily
(usually after 24 and 48 h, and sometimes after 96 and 144 h of fermentation) or not at all
during the fermentation process (Wood and Lass 2008).
Critical process parameters for cocoa bean fermentation are the type of cocoa bean, the
health status of the cocoa pods, the ripeness of the pods, post-harvest pod storage, the
quantity of bean and pulp, bean packing or spreading, fermentation method, batch size, the
duration of fermentation, turning, seasonal variations and weather conditions, etc. For
instance, storing the harvested cocoa pods for a number of days before opening is
considered beneficial for fermentation, as it results in a faster fermentation, because the
pulp sucrose is already converted into glucose and fructose by cotyledon invertase activity
(Schwan and Wheals 2004; Tomlins et al. 1993, Schwan 1998). Pod ripeness at harvest is also
of crucial importance. Fresh beans can vary considerably in the ratio of pulp to bean and in
the amount of sugars per bean, depending on cocoa cultivar, growing conditions, and post-
harvest storage of the pods. For example, pulp and beans can contain more water during the
wet season, which influences fermentation by affecting the aeration of the fermenting mass

I n t r o d u c t i o n | 11
and beans acidity. Indeed, beans with more pulp restrict gas exchange and make the bean
mass more anaerobic, so that a higher bean sugar content may lead to greater amounts of
acids in the bean cotyledons at the end of fermentation. Up to 20% of the pulp of the total
fresh weight of the bean plus pulp can be removed, either through a natural ‘sweatings’
drain with mechanical depulpers, or through the addition of pectinolytic enzymes, which
enables a reduction of fermentation time from seven to four days, and hence lowers the
acidity and enhances the flavour of the final cocoa (Schwan et al. 1995; Schwan and Wheals
2004). As an example, in Malaysia harvested cocoa pods are stored for up to 15 days before
breaking and removal of the beans, or the beans are pressed or pre-dried to reduce the pulp
volume before fermentation (Lehrian and Patterson 1983). Unfortunately, Malaysian cocoa
produced on a large scale is considered to be poor quality cocoa.
1.6 Methods of cocoa bean fermentation
Various cocoa bean fermentation systems have been developed worldwide. The actual
methods of fermentation vary in different cocoa-producing countries and regions and even
from one grower to another. The different fermentation methods include heap, box, basket,
tray, and platform fermentation. Of these, two methods of fermentation have been
commonly used for many years worldwide, namely the heap and box methods.
Approximately one-half of the world cocoa crops is fermented in some type of box, and the
remaining half is fermented by using heaps or other traditional methods that are slowly
disappearing.
1.6.1 Heap fermentation
The heap fermentation is the most simple and most commonly used method of
fermentation on smaller farms (Fig. 1.4, 1.5). The equipment required is simple and is
available at practically no cost, so that this type of fermentation can be run by a family. In
heap fermentation, the wet beans are piled onto banana or plantain leaves, spread out in a
circle on the ground, or sometimes raised above soil level to allow for easy pulp drainage.
When the heap is complete, it is covered with more leaves, which are often held in place by
small logs. The cover protects the fermenting mass against surface mold growth and keeps

I n t r o d u c t i o n | 12
the heat inside. In general, sweatings are allowed to flow away and penetrate into the
ground. The size of the heaps varies widely; heaps from 25 - 2000 kg are common. This
method is used throughout West-Africa and almost exclusively in Ghana, where farmers
ferment their beans in heaps of 200 - 500 kg for six days with care, explaining the higher
quality of Ghanaian cocoa compared with Nigerian or Ivorian (Baker et al. 1994). To ensure
uniform fermentation, to enhance the growth of beneficial microorganisms, and to
discourage surface mold growth, the heap should be mixed every two days, which is done
practically by forming another heap. However, turning the heaps is tedious and most
Ghanaian farmers only turn large heaps or do not turn their heaps at all (Baker et al. 1994).
Figure 1.4 Heap of cocoa beans prior to fermentation on a West African farm (Afoakwa
2010)

I n t r o d u c t i o n | 13
Figure 1.5 Cocoa beans covered with plantain leaves in heap fermentation (Afoakwa 2010)
1.6.2 Box fermentation
Box fermentations are carried out in large, perforated, open, wooden boxes, made of local
hardwoods in a wide variety of shapes and sizes. A typical box measures 1.2 x 1.2 x 0.9 m
and holds just over a ton of wet beans when loaded to a depth of 0.75 m (Fig. 1.6). The box
fermentation method is generally used on larger farms or plantations in for instance Brazil,
Trinidad, Indonesia, and Malaysia. The floor of the boxes is usually made of similar wood, in
which 15-mm holes are drilled at intervals of 10 - 15 cm. These holes are essential to provide
drainage for ‘sweatings’ and allowing air to enter the boxes. Therefore, the boxes are always
raised above ground level and placed over a drain. A box may be a single unit or a large box
with either fixed or movable internal partitions to create a number of compartments. In the
latter case, mixing is achieved by simply removing a dividing wall and shoveling the beans
into the next compartment. In the former case, the boxes are arranged in cascades making
use of a slope (tier design), so that mixing is achieved by simply moving beans from a higher
box to a lower one. The objective of these arrangements is to reduce the labor involved in

I n t r o d u c t i o n | 14
the turning of the beans. The fermenting boxes are usually housed in a barn to protect them
from rain.
Following pod breaking, the beans are placed in the top box or compartment. The wet beans
are then covered by banana leaves or jute sacks to retain heat and prevent the surface
beans from drying. During the course of fermentation, the beans are moved from one box or
compartment to another to ensure uniform conditions. This turning aerates the bean mass
and as a result, the temperature falls immediately after mixing and later rises as
fermentation proceeds. Typical box fermentation in Indonesia lasts for four to five days,
during which time the beans are mixed every 24 h, when the beans are moved to the middle
and lowest box, respectively.
Figure 1.6 Box fermentation, capacity 800 – 1000 kg Nusantara Plantation XII (PTPN XII),
East Java, Indonesia

I n t r o d u c t i o n | 15
1.7 The succession of microorganisms during fermentation
1.7.1 The three-phase cocoa bean fermentation process
Successful cocoa bean fermentation requires a succession of microorganisms, or better, of
microbial activities (Schwan and Wheals 2004). The initial microbial population is variable in
numbers and type and so are the microbial population dynamics. They vary between
countries, regions, and fermentation techniques. Cocoa bean fermentations carried out in
Africa (Ghana, Ivory Coast, Madagascar), Latin-America (Brazil, Dominican Republic, Mexico,
Trinidad, Ecuador), and South-East Asia (Malaysia, Indonesia) have been studied and
different species of yeasts, bacteria, and/or fungi have been isolated (Ardhana and Fleet
2003; Camu et al. 2007; Nielsen et al. 2007; Ostovar and Keeney 1973; Papalexandratou et
al. 2011 c; Papalexandratou et al. 2013; Schwan et al. 1995). Although it is believed that
most of the microorganisms present are not essential, the key groups of microorganisms
active during cocoa bean fermentation are yeasts, lactic acid bacteria (LAB), and acetic acid
bacteria (AAB).
Three phases can be considered during the actual cocoa bean fermentation process,
reflecting the environmental factors (temperature, pH, and oxygen tension) and the
metabolism of substrates available in the cocoa pulp (Fig. 1.7 a): phase 1 or the anaerobic
development of yeasts; phase 2 or the development of LAB; and phase 3 or the development
of AAB (Schwan et al. 1995; Ardhana and Fleet 2003; Schwan and Wheals 2004; Thompson
et al. 2001). In practice, there is considerable overlap between these phases. In general, the
total count of microorganisms present in the pulp during fermentation increases during the
first 24-36 h, and then stabilizes or gradually reduces. The acidity and high temperatures that
develop in the fermenting mass, the diffusion of important components in and out of the
bean cotyledons during fermentation, and enzymatic conversions of constituents within the
cotyledons during fermentation and drying have been attributed to the metabolism of these
microorganisms (Fig. 1.7 b).

I n t r o d u c t i o n | 16
Figure 1.7 a) Schematic diagram of microbial succession during cocoa bean
fermentations, along with peak of temperature and metabolite concentrations, b)
Microbial activities during cocoa bean fermentation
Days
a
b

I n t r o d u c t i o n | 17
1.7.2 Yeast fermentation
During phase 1, yeasts convert sugars (sucrose, glucose, and/or fructose) into alcohol
(ethanol) under conditions with high carbohydrate concentrations (characteristic for fresh
cocoa pulp), limited oxygen availability (due to tight packing of the beans), and a pH of
below 4.0 (due to the relatively high content of citric acid in cocoa pulp). Sucrose is the
preferred energy source for yeasts, which is converted by yeast invertase into glucose and
fructose, releasing 18.8 kJ of heat per mol of sucrose hydrolyzed. However, as mentioned
above, sucrose concentrations depend on pod ripeness and hence cotyledon invertase
activity. Further, glucose is preferentially converted into ethanol by anaerobic yeast
fermentation, leaving fructose to a large extent unfermented. Pulp ethanol concentrations
resulting from yeast fermentation may be as high as 6.5% or as low as 1% or less. The
production of ethanol is accompanied by a moderate temperature increase, as the
conversion of sugars into ethanol (and carbon dioxide) is an exothermic process producing
93.3 kJ per mol of glucose or fructose and thus elevating the temperature of the fermenting
mass from an ambient temperature of 25 - 30 °C to 35 – 40 °C within 48 h. The exhaustion of
the appropriate energy sources, the production of toxic ethanol and a small amount of heat
and further conversion of ethanol into toxic acetic acid by AAB later in the fermentation are
responsible for a rapid decline in the dominance of yeasts during fermentation.
The most important roles of the yeasts are the following (Schwan et al. 1995, Ardhana and
Fleet 2003): (i) the production of ethanol under low-oxygen and high-sugar conditions.
Ethanol disappears upon fermentation through its oxidation to acetic acid by AAB (see
below) or alternatively through oxidative consumption by aerobically growing yeasts or
through sweating and evaporation; (ii) the breakdown of citric acid in the pulp, which
together with losses in the sweatings leads to an increase in the pH of the pulp allowing
growth of bacteria (see below); although a few yeasts assimilate citric acid, citric acid-
consuming yeasts, such as Pichia fermentans and certain isolates of Candida krusei have
been isolated from the cocoa bean fermenting mass (Roelofsen 1958; Jespersen et al. 2005);
(iii) the production of organic acids (acetic, malic, oxalic, phosphoric, succinic, and tartaric
acids), which have a buffering capacity and tend to reduce fluctuations in pH; (iv) the
production of some volatile organic compounds, principally fusel alcohols, fatty acids, and
fatty acid esters, which may contribute either to cocoa flavour or, more likely, to precursors

I n t r o d u c t i o n | 18
of cocoa flavour. Yeasts such as Kloeckera apiculata and Saccharomyces cerevisiae var.
chevalieri produce large amounts of aroma compounds (Schwan and Wheals 2004); (v) the
secretion of pectinases, which reduces the viscosity of the pulp and causes its drainage.
Some of the yeasts produce pectinolytic enzymes that break down the walls of cells in the
pulp, among which Kluyveromyces marxianus and S. cerevisiae var. chevalieri show
substantial activity (Sanchez et al. 1984; Schwan et al. 1995, 1997; Jespersen et al. 2005}.
The spaces formed between the beans due to the collapse of parenchyma cells in the pulp
between beans allow air to enter; the aeration of the pulp mass is important for the growth
of AAB (see below). To speed up the fermentation process and enhance the quality of the
final product, pectinases may be added to the pulp or strains over-producing pectinolytic
enzymes may be used (Schwan and Wheals 2004).
1.7.3 Lactic acid bacteria (LAB) fermentation
During phase 2, LAB grow rapidly, though large numbers may be present for only a brief
period. Although LAB are present at the start of the fermentation, yeasts are dominant at
this point. As more pulp drains away, more air penetrates the fermenting mass, ethanol is
still produced through yeast activity, and both temperature and pH increase up to 40 °C and
pH 4.0, respectively. These conditions are favorable for the growth of lactic acid and acetic
acid bacteria. Around 24-72 h, conditions are more favorable for microaerophilic acid
tolerant LAB, which then dominate. This coincides with a rapid decline in the dominance of
the yeast population due to exhaustion of the appropriate energy sources and inhibition by
an increasingly toxic ethanol concentration, heat production, increasing pH, and greater
aeration. During the later stages of fermentation, LAB numbers decrease as well.
LAB convert a wide range of sugars (mainly glucose and fructose) and some organic acids
(e.g. citric acid and malic acid) into lactic acid and – depending on the strain of LAB – into
lactic acid, acetic acid, ethanol, mannitol, and carbon dioxide (Axelsson 2004). Their relative
proportions thus change the composition of the pulp and consequently may influence
microbial succession. The lactic acid concentration peaks around 0.2%. Most LAB prefer
glucose as an energy source. Some LAB species use fructose as an alternative external
electron acceptor, which is then converted into mannitol. Another important function of the

I n t r o d u c t i o n | 19
LAB during cocoa bean fermentation is the metabolism of citric acid. Citric acid is
metabolized via oxaloacetate (and acetate) into either succinic acid (via malic acid and
fumaric acid) or pyruvic acid, which in turn is converted into end-products of pyruvate
metabolism (lactic acid, acetic acid, ethanol, etc.) (Axelsson 2004). The assimilation of citric
acid causes the pH of the pulp to increase from 3.5 to 4.2, allowing for the growth of other
bacteria. Aerobic spore-forming bacteria such as Bacillus species, may dominate the
fermentation by the fourth day. Lactic acid may be consumed by yeasts as well (Camu et al.
2007).
1.7.4 Acetic acid bacteria (AAB) fermentation
During phase 3 from 24 - 112 h of fermentation, aerobic AAB, which grow very early and
survive the initial steps of fermentation, persist until the end, when the conditions for AAB
growth are optimal. When more of the pulp is metabolized and drained away, aeration
increases, and the temperature rises above 37 °C, AAB grow rapidly. Moreover, turning of
large heaps and moving of the bean during box fermentation favor AAB growth (Nielsen et
al. 2007).
The main activity of AAB is the oxidation of ethanol, initially formed by the yeasts, into acetic
acid, which provides them with the necessary energy. This exothermic reaction, producing
496 kJ per mol of ethanol oxidized, is responsible for the rise in temperature of the
fermenting mass, which can reach 45 - 50 °C or higher in some fermentations. The decline in
ethanol concentration coincides with a decline in lactic acid concentration, indicating its
simultaneous oxidation by AAB to acetate and carbon dioxide and water, respectively. The
acetic acid concentration peaks around 2%, followed by a decline likely due to evaporation
at the high temperature of the fermenting mass and its further metabolism. Indeed, some
AAB are responsible for the further oxidation of acetic acid into carbon dioxide and water, in
turn liberating 1754 kJ per mol of acetic acid over oxidized. The oxidation of lactic acid and
acetic acid may result in a further pH increase.

I n t r o d u c t i o n | 20
1.7.5 Bean death
As mentioned above, ethanol and acetic acid diffuse into the bean, which in combination
with the heat produced in the fermenting bean mass leads to the death of the bean embryo.
Bean death is a prerequisite for the biochemical reactions responsible for the formation of
chocolate flavour precursors. Indeed, changes in the internal cellular structure of the bean
due to penetrating acetic acid (the lowering of the pH leads to the formation of fat globules
surrounded by an aqueous phase of water-soluble components that, after being liberated,
can undergo hydrolysis), the mixing of compounds (enzymes, substrates, and inhibitors) in
the bean, and hence biochemical changes involving flavour and color development lead to
well-fermented cocoa beans. Bean death usually occurs on the second day of fermentation
and is mainly caused by the internal acetic acid concentration, the rise in temperature of the
bean being relatively unimportant. However, high temperatures in combination with ethanol
and acetic acid limit microbial growth in the cocoa pulp and can even kill a microbial cell,
which halts the cocoa bean fermentation process. The production of ethanol during the
anaerobic growth of yeasts correlates very closely with the death of the seed embryo as
well, with seeds being unable to germinate 24 h after maximum concentrations of ethanol
are attained within the bean cotyledons (Thompson et al. 2001). Thanks to all of these
processes, events associated with germination and certain quality defects, such as the
utilization of valuable bean components (for instance cocoa butter) and the opening of the
testa by hypocotyl extensions do not occur, leading to a more stable, desirable end-product.
Alternatively, lactic acid remains in the bean indefinitely due to its limited volatility, and
hence compromises the final quality of the bean (Camu et al. 2007).
1.7.6 Optimal fermentation course and end of fermentation
An optimal course of fermentation requires appropriate microbial population dynamics such
as a correct succession of microorganisms and concomitant activities as the basis for the
development of flavour precursors within the bean and the characteristic coloration of the
bean.
As cocoa beans vary in their degree of fermentation, because of the unpredictable
fermentation step, a fermentation index has been introduced as a quantitative measure for

I n t r o d u c t i o n | 21
the degree of cocoa bean fermentation. Cocoa bean can be under-fermented (fermentation
too short), over-fermented (fermentation too long), or optimally fermented (exact
fermentation time), with corresponding sensory attributes. The fermentation index is
determined colorimetrically as the ratio of the absorbance of oxidation products of cocoa
bean polyphenols at 460 nm to that at 530 nm (Gourieva and Tserevitinov 1979). A
fermentation index value of > 1 would indicate that the cocoa bean mass is sufficiently
fermented (Shamsuddin and Dimick 1986).
A key decision involved in obtaining fermented cocoa beans of high quality is when to
remove the beans from their fermentation environment to start the drying process. As
mentioned above, when all of the ethanol is oxidized into acetic acid and then further into
carbon dioxide and water, the fermentation stops, as the energy sources for microbial
growth are no longer available, and the temperature of the bean mass starts to decrease.
Extending the fermentation can result in undesirable microbial activity, leading to
putrefaction and the production of off-flavours. The following factors collectively indicate
optimal fermentation: (i) decrease in temperature of the fermenting mass; (ii) smell of the
fermenting mass (distinct smell of alcohol and acetic acid during the early and late stages of
cocoa bean fermentation, respectively); (iii) visual appearance of molds at the surface of the
fermenting mass; (iv) plumping or swelling of the bean (the water content of fermenting
bean increases from about 35% at harvest time to about 40% after bean death); (v) external
colour of the bean; (vi) internal colour of the bean making use of the bean cut test; and (vii)
internal pH of the bean. However, other factors may influence the decision to end
fermentation, in particular when certain components of the cocoa bean have to be valorized
(see Section 13.3).
1.8 Drying of fermented cocoa beans
1.8.1 Drying process
After fermentation, the beans are removed from the heaps or boxes and dried in the sun on
the ground (Fig. 1.8) until fully dried, usually occurring within 5 – 10 sunny days. The
fermentation must be stopped completely, the moisture content of the beans must be

I n t r o d u c t i o n | 22
brought from an initial 40 - 60% down to 6 - 7% to avoid the growth of molds within the
beans during storage, and the major part of acetic acid formed during fermentation must be
eliminated (Thompson et al. 2001). The drying process relies on air movement to remove
water. This results in a pronounced reduction in the number of viable microorganisms
(Schwan and Wheals 2004). Furthermore, biochemical processes important for the flavour
and color development of the cocoa beans, initiated during fermentation, continue during
drying. A slow migration of moisture throughout the beans will transport flavour precursors
formed during fermentation. Hence, some oxidation will occur and some excess acids, in
particular acetic acid, may volatilize through the shell, both of which are beneficial. Non-
volatile lactic acid is partly transported by the water from the bean to the shell (Nganhou et
al. 2003; Thompson et al. 2001; Wood and Lass 2008).
In the case of artificial drying (Fig. 1.9a, b), the rate of drying has an important bearing on
the flavour and quality of the dried beans. If drying is too slow, there is a danger that molds
will develop and penetrate the testa and that off-flavours may arise. Rapid drying may cause
case hardening (fast drying on the bean surface with moisture retention inside the bean),
which may prevent oxidative changes, resulting in excessive acidity. It has been established
that artificial drying should take at least 48 h to allow for proper flavour development.

I n t r o d u c t i o n | 23
Figure 1.8 Sun drying in Nusantara Plantation XII (PTPN XII), Jember, East Java, Indonesia
1.8.2 Drying apparatus
Plastic covers, raised bamboo mats, wooden platforms, or concrete terraces are generally
used for sun-drying. It is important to ensure uniform drying by mixing the beans regularly
(for instance four times per day), thereby breaking up clumps of beans that may form and
discouraging mold growth. Sun-drying can take from 5 to 10 days, but in the case of bad
weather conditions can last up to 4 weeks, increasing the risk of mold development and
spoilage. In general, sun-drying is employed on small farms, whereas large estates may
resort to both natural and artificial drying.
Several methods of mechanical drying exist which can save time and man-power but
necessitate adapted equipment and energy supply. Generally, hot air dryers fueled by wood
or oil are employed. Numerous designs have been developed, including direct contact with
the flow gasses, but normally indirect heating using heat exchangers is preferred. In the
latter case, the disadvantageous case hardening by hot air conduction is reduced, as heat
convection also reaches the inside of the beans. A temperature gradient between beans and
the surrounding air as well as the use of a closed and controlled atmosphere encourages the

I n t r o d u c t i o n | 24
evaporation of water and acetate (Afoakwa 2010). In the case of artificial drying, the
temperature should be kept at a maximum of 60 °C for at least 48 h and the beans should be
mixed regularly. The beans are considered dry when they are crunchy. Elevated
temperatures tend to produce cocoa with brittle shells and cotyledons that crumble during
handling, which is not desirable. Smoke contamination due to badly constructed, poorly
maintained or improperly used equipment may give smoky or hammy off-flavours, which is
characteristic for bean from some countries (Wood and Lass 1985; Thompson et al. 2001).

I n t r o d u c t i o n | 25
Figure 1.9 Artificial drying facility with a capacity of 4500 kg, a) view from outside, b) view
from inside in Nusantara Plantation XII (PTPN XII), Jember, East Java, Indonesia
a
b

I n t r o d u c t i o n | 26
1.9 Biochemical changes in the cocoa beans during fermentation and drying
1.9.1 Creating an environment for flavour precursor development during
fermentation
As described above, the fermentation of cocoa pulp provides the conditions necessary for
the development of cocoa flavour and colour precursors within the cotyledons of the bean,
namely (Fig. 1.10): (i) the initiation of bean germination, which leads to water uptake by the
protein vacuoles within the cells; (ii) the death of the bean embryo (germ), mainly caused by
acetic acid and ethanol penetrating the testa and entering the bean (accumulating to levels
of about 3.5% and 0.4%, respectively), whereby the biological barriers (membranes)
between the cells (storage and pigment cells) within the bean cotyledons break down. This
in turn allows various enzymes and substrates to mix freely, because ethanol, acids and
water diffusing into the cotyledons act as solvents so that components are transported to
sites of enzyme activity and vice versa. The subsequent biochemical reactions produce the
flavour and colour precursors; (iii) the conditions of pH and temperature. The pH,
determined mainly by the diffusion of acetic acid into the bean, is important, and the
reaction rates are also increased by the warm temperatures during fermentation and drying.
The penetrating acetic acid causes the bean pH to drop from an initial value of 6.3 - 6.8 to
4.0 - 4.8. Microbial activity contributes to the increasing temperature of the fermenting bean
mass; (iv) the penetration of oxygen. When oxygen begins to enter the bean around 96 h of
fermentation, a series of enzymatic, oxidative reactions are initiated. These result in a
browning of the cotyledon.

I n t r o d u c t i o n | 27
Figure 1.10 Biochemical changes in pulp and beans during cocoa bean fermentation (Lopes,
1986)
1.9.2 Enzymatic and diffusion processes in the beans cotyledons during
fermentation and drying
Biochemical processes within the beans include enzymatic and diffusion processes
influenced by several environmental factors, such as pH, temperature, and moisture
(Thompson et al. 2001). Enzymatic reactions within the bean cotyledons encompass the
breakdown of proteins to peptides and amino acids and of sucrose to fructose and glucose
(Hansen et al. 1998). The (non)-enzymatic reactions involving polyphenols are considered to
be pivotal in the development of chocolate flavour and colour. These enzymatic reactions
are of short duration, as optimal conditions of pH (decreasing in the bean) and temperature
(increasing in the bean) are transient upon fermentation. In addition, a certain amount of
moisture (increasing during fermentation and decreasing during drying) is necessary to allow
enzymes and their substrates to react to form the desirable products. Significant changes in
pH, temperature, and moisture occuring during cocoa bean fermentation and drying
influence the type and quantity of flavour precursor compounds produced by endogenous
enzymes.
Bean

I n t r o d u c t i o n | 28
Moisture content within the cotyledon during fermentation is usually greater than 35% and
allows for the adequate migration of enzymes and substrates for enzymatic activities.
However, once the drying process begins, moisture content gradually decreases, making it
increasingly difficult for enzymes and substrates to react. When a moisture content of 6 - 8%
is achieved upon drying, virtually all enzyme activities cease. An increase in temperature of
more than 20 °C during fermentation can also have a profound impact on enzyme activity. If
the temperature fails to change significantly, enzymatic activity is reduced, resulting in fewer
flavour precursors and subsequently poor cocoa flavour. Likewise, if inadequate amounts of
organic acids are produced during fermentation, the pH of the cotyledons will not be
suitable for optimal enzyme activities and the flavour of the resulting cocoa will be affected.
On the other hand, too much acid produces excessive sourness that can mask the chocolate
flavour. Consequently, there is a need to achieve balance between the length of
fermentation, environmental factors, and microbial activities that influence enzymatic
activities within the bean cotyledons.
Biochemical and physical changes within the bean cotyledons can be divided into two
general phases, namely the anaerobic-hydrolytic phase and the aerobic-oxidative phase. In
practice, there is a considerable overlap of both phases, as even though oxygen penetrates
the surface of the bean cotyledons, parts of the interior remain anoxic. The cotyledons are
initially anaerobic and hydrolytic reactions involving proteins, sugars, and polyphenols take
place during the anaerobic-hydrolytic phase. This occurs through the absorption of water
and diffusion of substrates in the tissue during fermentation after seed death occurs. The
hydrolysis of bean cotyledon substrates contributes to the formation of aroma precursor
molecules necessary for cocoa flavour development. During the aerobic-oxidative phase,
oxygen begins to penetrate the testa and causes oxidative changes to polyphenols and
protein material on the surface of the cotyledon from the fourth day onwards. These
reactions (browning of the surface of the cotyledon), which occur towards the end of the
fermentation and are to some extent responsible for inhibiting enzyme activities, contribute
to the removal of astringency and tanning of proteins. The oxidative phase also contributes
to the formation of ancillary (e.g. fruity) flavours. Oxygen continues to penetrate the bean
during the drying process, allowing some enzymatic activities to continue until rising
temperatures and insufficient moisture become inhibiting factors.

I n t r o d u c t i o n | 29
Cocoa bean hydrolytic enzymes, such as invertase, glycosidases, and proteases, display
highest activities during the anaerobic phase of cocoa bean fermentation. After seed death,
the proteolysis of vicilin-like globular storage proteins in the bean cotyledons is catalyzed by
aspartic endoprotease, carboxypeptidase, and aminopeptidase enzymes, which are
particularly active at pH 3.0 - 3.5, 5.8 - 6.0, and 6.8 - 7.0, respectively. This in turn, indicates
full activity, partial activity during 1 – 2 days of fermentation, and partial activity during 3 – 4
days of fermentation, respectively (Biehl et al. 1982; Hansen et al. 1998; Hashim et al. 1998a;
Hashim et al. 1998b; Voigt et al. 1994).
The cocoa bean aspartic endoprotease cleaves the protein substrate preferentially at
hydrophobic amino acid residues to produce oligopeptides displaying hydrophobic amino
acid residues at their carboxy terminal ends. The endogenous carboxypeptidase plays an
important role in converting hydrophobic oligopeptides to hydrophilic oligopeptides and
hydrophobic free amino acids, which are aroma precursors required for the formation of
typical cocoa aroma components in the presence of reducing sugars upon roasting (Amin et
al. 2002; Biehl et al. 1982; Voigt et al. 1994).
Sucrose is the major sugar in unfermented cocoa beans. It is not a reducing sugar and,
therefore, does not participate in non-enzymatic browing reactions occuring during roasting.
However, sucrose is converted to glucose and fructose by cocoa bean invertase during
fermentation. Hansen et al. (1998) reported the existence of both a cotyledon and pulp
invertase. Total sugar content decreases throughout fermentation. About 70% of the total
sugars remain after fermentation and are of value for flavour development during roasting
(Lehrian and Patterson 1983).
The polyphenols and alkaloid contents of the beans decrease slightly during fermentation
due to the diffusion of these molecules out of the beans. The polyphenols (including the
anthocyanidins) are oxidized and polymerize to insoluble, characteristically coloured, high
molecular-mass compounds (tannins) during fermentation and drying. These reactions are
non-enzymatic or are catalyzed by the cotyledon enzyme polyphenol oxidase. This enzyme
possesses optimal activity at pH 4.5 - 7.0 and hence is strongly inactivated during the first
days of fermentation, retaining only 50 and 6% of its enzymatic activity after 1 and 2 days,
respectively (Hansen et al. 1998). Polyphenol oxidase converts the polyphenols, mainly

I n t r o d u c t i o n | 30
epicatechin (the main cocoa bean polyphenol) and free anthocyanidins, to quinones.
Polyphenols and quinones complex with other polyphenols, proteins, peptides, and amino
acids to form tannins, which on the one hand decreases their solubility, astringency, and
bitterness, and gives rise to the brown colouration of the bean that is typical of well-
fermented cocoa beans. A dramatic drop (70%) in the content of soluble polyphenols occurs
between the first and fourth day of fermentation (Wollgast and Anklam 2000). The
occurrence of condensation reactions is confirmed by the sharp decrease in epicatechin
content between the second and third day of fermentation. The epicatechin and soluble
polyphenols content is reduced to approximately 10 - 20% during fermentation and drying.
Polyphenol oxidase is also sensitive to drying, so that the remaining enzyme activity after
fermentation and drying of the bean is only about 2%. In addition to the oxidation process
and diffusion of polyphenols into fermentation sweatings, it is believed that the non
enzymatic oxidation of polyphenols could also be important during the drying process
(Hansen et al. 1998; Jinap et al. 2002).
Apparently, no change in starch and fat content occurs during fermentation and drying
(Roelofsen 1958; Lehrian and Patterson 1983). However, as the non-fat portion of the cocoa
bean is the source of polyphenols, the polyphenol and anti-oxidant contents of chocolate
products are determined by their levels in the cocoa solid contents of these products.
Therefore, the flavour-enhancing properties of cocoa bean fermentation must be balanced
against the polyphenol health effects of fermentation, when polyphenol-enriched chocolate
products are to be produced. The availability of cocoa bean with various degrees of
fermentation provides the chocolate manufacturer with the opportunity to produce
chocolate products that meet the diverse needs of the modern consumer (Thompson et al.
2001).
1.10 Use of starter cultures for the fermentation of cocoa beans
As mentioned above, cocoa flavour is determined by several factors, particularly the cocoa
beans variety, the fermentation and drying process, and the subsequent processing of well
fermented cocoa beans. Therefore, technological challenges at the level of the natural cocoa
bean fermentation have an impact on the quality of the cocoa beans and hence on the

I n t r o d u c t i o n | 31
quality of the cocoa and chocolate made thereof. Such influences include a possible impact
on colour and flavour development during fermentation, on sugar and fat contents, on
polyphenol and alkaloid contents, etc. As cocoa bean fermentations may be performed in an
artisan manner on small scale or under non-optimal large scale conditions, the results are
variable in quality. In addition, there might be problems of acidity, lack of cocoa flavour (due
to incomplete fermentation) and presence of off-flavours (due to over-fermented beans and
spoilage), all of which lead to low crop value for the farmer. Therefore, it would be desirable
to change the fermentation from a wholly natural and unpredictable process to a controlled
process, initiated with an appropriate starter culture, in which fermentation occurs more
quickly. However, one of the reasons why chocolate quality has not been a priority for
farmers is that there is no financial incentive to produce high-quality fermented cocoa
beans. In the last 25 years, multinational companies have put most of their efforts into two
areas: encouraging farmers to maximize production and to improve processing of the
fermented cocoa beans. The fermentation process itself has been largely neglected.
The dairy, meat, and alcoholic beverage industries have largely replaced traditional natural
fermentations with defined inocula of high-quality raw materials, the strict control of the
fermentation processes, the better treatment of the final products, and the diversification of
the market (Leroy and De Vuyst 2004). Cocoa bean fermentations have a long way to go
before they reach that stage of development, but preliminary experiments using a defined
starter culture in such a complex fermentation show promising results. For instance, Schwan
(1998) used a defined microbial cocktail inoculum consisting of a yeast, Saccharomyces
cerevisiae (var. chevalieri), two LAB species, Lactobacillus delbrueckii ssp. lactis (formerly
named Lactobacillus lactis) and Lactobacillus plantarum, and two AAB species, Acetobacter
aceti and Gluconobacter oxydans (ssp. suboxydans) to perform fermentations in 200 kg
wooden boxes with aseptically prepared cocoa beans, inoculated at different points of time.
The fermentation process exactly mimicked the conditions in 800 kg boxes on Brazilian
farms. Using the zero-time inoculum, the fermentation proceeded almost identically to the
natural one. The fermentation with a phased-addition inoculum was similar, but slower and
less pronounced, which led to a slightly poorer end-product. Although preliminary, these
data show that the many common species of microorganisms found in natural cocoa bean
fermentations can be replaced through judicious selection and concentration of members of

I n t r o d u c t i o n | 32
each physiological group important to the process. There is of course need for improvement
in the choice of species and the way of inoculation and fermentation when this technology is
to be used commercially. For instance, independent studies on the pectinolytic enzyme
endopolygalacturonase (Schwan et al. 1997), which is produced by the yeast Kluyveromyces
marxianus isolated from spontaneous cocoa bean fermentations in Bahia (Schwan et al.
1995), suggest that this yeast species would be a better source of pectinase. Therefore,
Schwan (1998) proposed that a combination of K. marxianus as pectinase producer and the
naturally vigorous yeast S. cerevisiae as an ethanol producer might be a better choice of
yeasts for future defined inocula.
One of the ultimate purposes of controlled cocoa bean fermentations will be to speed up the
fermentation process and to influence the flavour of chocolate products through
fermentation. Faster fermentations will be necessary to allow controlled, large-scale
fermentation and to increase production capacity in order to respond to the growing
demand for cocoa. ‘Flavour’-controlled fermentations will be necessary to produce
marketable, tailor-made cocoa. Demonstrating a reduction in fermentation time and
obtaining well-fermented cocoa bean with desirable sensory attributes would represent a
scientific step forward. However, to scale up the initiation of cocoa bean fermentation with a
defined inoculum, whether applied to small farm holdings or large estates, would be a great
challenge, especially considering costs, culture production and maintenance, and inoculation
method (Thompson et al. 2001).
1.11 Chocolate flavour development and chocolate production
1.11.1 Chocolate flavour
The most notable attribute of chocolate is its unique flavour, being an extremely complex
mixture of more than 550 compounds (Nijssen et al. 1996). The mix and balance of these
numerous compounds contributing to the final cocoa flavour depends on plant genetics
(cultivar), environmental conditions of crop cultivation (climate, soil quality and richness,
water management, shade canopy management, pollination, etc.) and fermentation
(country and region, method, weather conditions), pod harvesting and storage (fruit

I n t r o d u c t i o n | 33
ripeness), primary processing (fermentation, drying, and roasting), and final storage. With
chocolate, the chemical complexity of flavour development is evident when one realizes
these numerous parameters that may influence its production. Its complexity is equally
obvious when considering that, even today, this desirable flavour has yet to be duplicated by
the flavour chemist (Dimick and Hoskin 1999).
1.11.2 Chocolate production
Chocolates are semisolid suspensions of fine solid particles of sugar and cocoa (and milk,
depending on type), resulting in about 70% in a continuous fat phase. Primary chocolate
categories are dark, milk and white, which differ in their contents of cocoa solid, milk fat and
cocoa butter. The outcomes include varying proportions of carbohydrates, fats and proteins
(Tab. 1.3).
Table 1.3 Dark, milk and white chocolate: major constituents
Product Carbohydrate (%) Fat (%) Protein (%)
Dark chocolate
Milk chocolate
White chocolate
63.5
56.9
58.3
28.0
30.7
30.9
5.0
7.7
8.0
Source: (Afoakwa et al. 2007)
Chocolate manufacturing processes (Afoakwa 2010; Beckett 2009) differ due to variation in
national consumer preferences and company practices. The various steps in these processes
are presented schematically in Fig. 1.11 (Wood and Lass 1985).
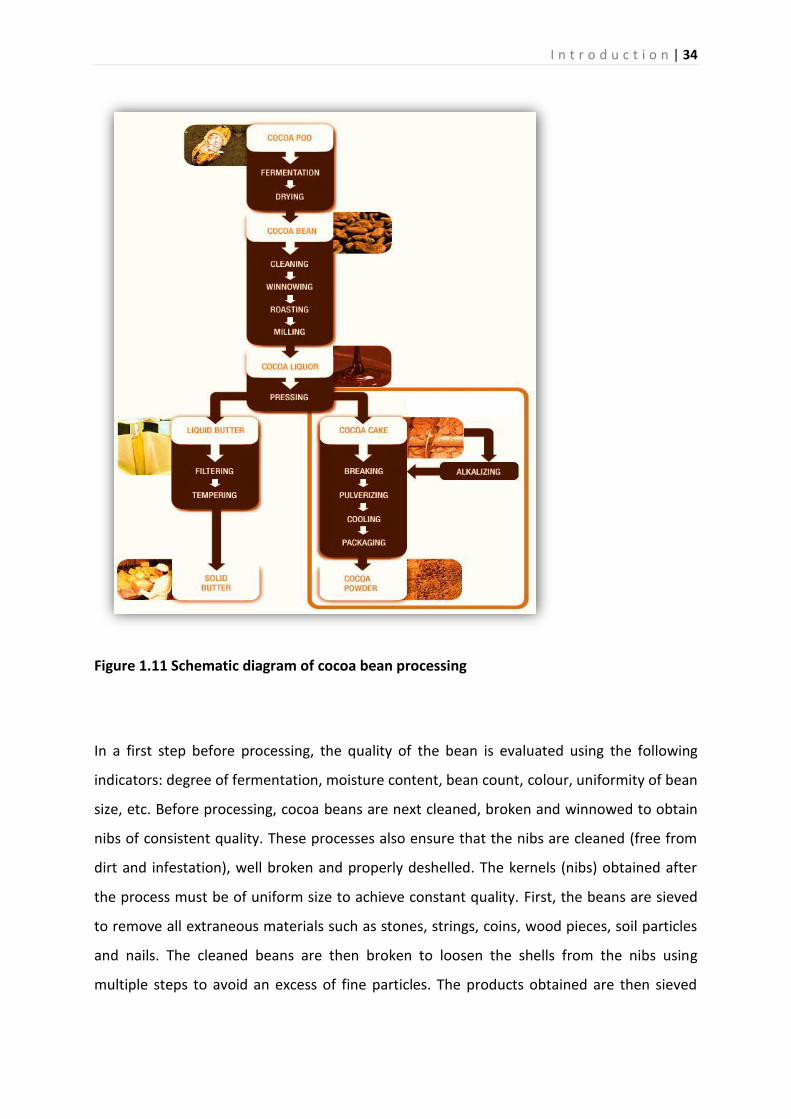
I n t r o d u c t i o n | 34
Figure 1.11 Schematic diagram of cocoa bean processing
In a first step before processing, the quality of the bean is evaluated using the following
indicators: degree of fermentation, moisture content, bean count, colour, uniformity of bean
size, etc. Before processing, cocoa beans are next cleaned, broken and winnowed to obtain
nibs of consistent quality. These processes also ensure that the nibs are cleaned (free from
dirt and infestation), well broken and properly deshelled. The kernels (nibs) obtained after
the process must be of uniform size to achieve constant quality. First, the beans are sieved
to remove all extraneous materials such as stones, strings, coins, wood pieces, soil particles
and nails. The cleaned beans are then broken to loosen the shells from the nibs using
multiple steps to avoid an excess of fine particles. The products obtained are then sieved
I n t r o d u c t i o n | 35
into smaller numbers of fractions to obtain optimal separation during subsequent
winnowing. The fractions are then transported to the winnowing cabinet, where the lighter
broken shells are removed by a stream of air (Afoakwa 2010).
After cleaning and breaking, the next step is roasting. Cocoa beans are roasted to further
develop the original cocoa flavour that exists in the form of precursors generated during the
fermentation and drying of the beans. During the roasting of the dried fermented beans,
several physical and chemical changes take place, including the loosening of the shells and
moisture, the changing of nib colour, the reduction of the number of microorganisms, the
degradation of protein and amino acids, and the losses of volatile acids and other substances
that contribute to acidity and bitterness. The roasting temperature varies between 90 and
170 °C. Three main roasting methods are employed in the cocoa processing industry: 1)
whole bean roasting, in which the bean are roasted before winnowing, 2) nib roasting, in
which the shells are removed before roasting and 3) liquor roasting, in which thermal pre-
treatment is often used before winnowing (Afoakwa 2010).
After roasting, cocoa nibs need to be milled to form cocoa liquor. The purpose of this step is
to produce as low a viscosity as possible in order to obtain smooth cocoa powder and
chocolate taste during the subsequent use of the liquor. The nib has a cellular structure
containing about 55% cocoa butter in solid form locked within the cells. Grinding the nib
cells releases the cocoa butter with a particle size up to 30 μm, into the liquor, with fine
grinding being particularly important for the production of cocoa powder. The viscosity of
the liquor is related to the degree of roasting preceding the grinding and to moisture
content of the nib. Many machines are used for reducing the nibs into liquor, including stone
mills, disc mills, pin or hammer mills and bead or ball mills. The grinding is performed in a
multistage process, and the heat treatment generated during the grinding process causes
the cocoa butter in the nib to melt, forming the cocoa liquor. The refined cocoa liquor is
then heated in storage tanks at a temperature of about 90 – 100 °C for aging and microbial
destruction, after which the liquor is packaged for sale (Afoakwa 2010; Beckett 2009).
In the next step, the liquor is pressed to produce cocoa butter and cocoa cake. Cocoa butter
constitutes about half the weight of the cocoa nib. This fat is removed from the cocoa liquor
by means of hydraulic presses applying pressures as great as 520 kg/cm2, with the larger

I n t r o d u c t i o n | 36
presses processing to 113.4 kg per pressing cycle. Depending on the pressing time and the
settings of the press, the resulting cake has a fat content of between 10 and 24%. Two kinds
of cocoa cakes can be obtained by the process: 1) high-fat cakes containing between 22 -
24% residual fat and 2) low-fat cakes containing between 10 - 12% residual fat (Afoakwa
2010; Beckett 2009).
After liquor pressing, two types of cocoa form, namely cocoa butter and the cocoa cake
which will later become cocoa powder. Prior to this, the cocoa cake needs to be alkalized
and ground. Alkalisation consists of treating the cocoa nibs with an alkali solution such as
potassium or sodium carbonate. The alkali is used to raise the pH of the bean or nibs from
5.2 - 5.6 to near neutrality at 6.8 – 7.5 depending on the alkali used. The purpose of this step
is primarily to modify the colour and flavour of the cocoa powder or cocoa liquor, and also to
improve the dispersibility or suspension of the cocoa solids in water. The cakes released
after grinding are quite big and are therefore passed through kibbling machines to be broken
down into smaller pieces, known as kibbled cake. The kibbled cake obtained is stored
according to fat content and degree of alkalisation, and may be blended before pulverisation
to obtain the desired type of cocoa powder (Afoakwa 2010).
The final step is the production of cocoa powder. The powder grinding lines usually employ
hammer-and-disc or pin mills, which pulverize cocoa cake particles into the defined level of
fineness for cocoa powder. The powder is then cooled so that the fat in the cocoa powder
crystallises into its stable form (Afoakwa 2010).
1.12 Seed coat (testa) of Theobroma cacao L., and plant antifungal protein
1.12.1 Seed coat (testa) of Theobroma cacao L.
The testa is the outer shell surrounding the bean. The testa of the cocoa seed is
impermeable to larger molecules, whereas smaller volatile molecules such as ethanol and
acetic acid can easily penetrate the testa. The testa thus provides a natural barrier against
organic acid (citric acid) penetration from the pulp into the bean and the outward diffusion
of theobromine, caffeine and polyphenols; hence controlling the kinetics of fermentation
and the concomitant diffusion processes (Camu 2007).

I n t r o d u c t i o n | 37
In the testa of Theobroma cacao L., a layer of slime is located directly below the outer
epidermis. This slime has yet to be described in detail in the literature and its chemical
composition was previously unknown. Bahmann (2014) reported that cocoa seeds produce
this slime for three days after removal of the pulp. This slime is composed out of sugars and
different kinds of proteins including chitinase, glucanase, and osmotin (Bahmann 2014).
a
Cotyledons
Testa
Pulp
b
Slime
Figure 1.12 a) Appearance of testa under microscope analysis, b) Testa after removal of
pulp and soaked 24 h in water (Bahmann, 2014)

I n t r o d u c t i o n | 38
The seed coat is an important tissue for the regulation of imbibition and the maintenance of
seed integrity (Bewley and Black 1994). It is also the first seed barrier encountered by pests
and pathogens (Moise et al. 2005). However, this tissue has previously been considered to
be an exclusively physical barrier and the involvement of seed coat molecules in this
defensive role has not been considered. Seed cotyledons contain an array of proteins that
may be involved in the protection of quiescent seeds against fungi (Santos et al. 2008).
1.12.2 Plant antifungal proteins
Plants are exposed to a large number of pathogenic fungi; although they do not have an
immune system, plants have evolved a variety of potent defense mechanisms including the
synthesis of low-molecular-weight compounds, proteins, and peptides with antifungal
activity (Caruso et al. 1996; Grenier et al. 1993; Kitajima and Sato 1999; Linthorst and Van
Loon 1991; Selitrennikoff 2001).
Several classes of antifungal proteins are involved in the inhibition of the synthesis of the
fungal cell wall or disrupt cell wall structure and/or function; others perturb fungal
membrane structure, resulting in fungal cell lysis. Plant antifungal proteins have been
classically divided into five groups, PR-1, -2, -3, -4, and -5, based on serological and amino
acid sequence analyses (Van Loon 1985). The mechanisms of antifungal action have only
been clearly identified for the PR-2 and PR-3 groups of proteins.
PR-1 proteins. PR-1 proteins have been found in rice, wheat, maize, tobacco, Arabidopsis
thaliana, barley, and many other plants (Agrawal et al. 2000; Bryngelsson et al. 1993). PR-1
proteins have antifungal activity at the micromolar level directed against a number of plant
pathogenic fungi, including Uromyces fabae, Phytophthora infestans, and Erysiphe graminis.
PR-1 proteins have molecular masses of 15 - 17 kDa and show homology with the
superfamily of cysteine-rich proteins. Although the precise mechanism of antifungal activity
is not understood, the PR-1-like protein helothermine from the Mexican banded lizard
interacted with membrane-channel proteins of target cells, thus inhibiting the release of
Ca2+. Whether antifungal plant PR-1 proteins act by this mechanism is not known yet but is
suspected (Selitrennikoff 2001).

I n t r o d u c t i o n | 39
PR-2 proteins (β-glucanases). PR-2 proteins have (1,3) β-endoglucanase activity in vitro and
have been grouped into three classes on the basis of amino acid sequence analysis. Class I
glucanases are basic proteins of 33 kDa and are found in the plant vacuole. Classes II and III
include acidic extracellular proteins of about 36 kDa. The major structural difference
between class I proteins and the other two classes is that class I proteins are synthesized as
preproproteins that are processed prior to being enzymatically active. PR-2 proteins have
been found in a wide variety of plants, including tobacco, A. thaliana, peas, grains, and fruits
(Cote et al. 1991; Kim and Hwang 1997). The proteins are active in vitro at micromolar levels
(~50 µg mL-1) against a wide number of fungi, including human and plant pathogens (e.g.
Rhizoctonia solani, Candida albicans and Aspergillus fumigatus). The antifungal activity of
plant (1,3) β-glucanases is thought to occur by PR-2 proteins hydrolyzing the structural (1,3)
β-glucan present in the fungal cell wall, particularly at the hyphal apex of filamentous molds
where glucan is most exposed, resulting in a weakened cell wall. This weakened cell wall
results in cell lysis and cell death (Selitrennikoff 2001).
PR-3 proteins (chitinases). A number of enzymatic assays have shown PR-3 proteins to have
in vitro chitinase activity. Most PR-3 proteins have molecular masses of between 26 and 43
kDa (Nielsen et al. 1997; Watanabe et al. 1999). Chitinases (both plant PR-3 chitinases and
chitinases from other sources) have been divided into five groups. Class I chitinases contain
an N-terminal cysteine-rich domain of ~40 amino acids (also known as the wheat germ
agglutinin domain), a chitin-binding hevein-like domain, a highly conserved central portion,
and a hinge region; most class I proteins have molecular masses of ~32 kDa. Class II proteins
are similar in amino acid sequence to class I proteins, but they lack the N-terminal cysteine-
rich domain and have molecular masses of 27 to 28 kDa. Class IV proteins resemble class I
chitinases but are significantly smaller due to four major deletions. Class III proteins do not
share amino acid sequence homology to any other class and have molecular masses of ~28
to 30 kDa. Class V chitinases show sequence similarities to bacterial exochitinases and have
molecular masses of 41 to 43 kDa. In addition to chitinases, a chitosanase (chitosan is
deacetylated chitin) from Streptomyces sp. strain N174 with antifungal activity has been
isolated (Money and Harold 1992), and its X-ray structure has been determined.
Chitinases have been isolated from fungi, tobacco, cucumber, bean, peas, grains, among
others, and exhibit potent antifungal activity against a wide variety of human and plant

I n t r o d u c t i o n | 40
pathogens including Trichoderma reesei, Alternaria solani, Alternaria radicina, Fusarium
oxysporum, Rhizoctonia solani, Guignardia bidwellii, Botrytis cinerea, and Coprinus comatus.
Using analogy of β-glucanases, the mode of action of PR-3 proteins is relatively
straightforward: PR-3 proteins are endochitinases that cleave cell wall chitin polymers in
situ, resulting in a weakened cell wall and rendering fungal cells osmotically sensitive. Not
surprisingly, PR-2 (β-glucanases) and PR-3 (chitinases) proteins act synergistically in
inhibiting fungal growth, both in vitro and in planta (Jach et al. 1995; Selitrennikoff 2001).
PR-4 (chitin-binding) proteins. PR-4 proteins are chitin-binding proteins, have molecular
masses of 13-14.5 kDa, and have been classified into two groups. Class I proteins exibit
amino acid sequence similarities to hevein (a chitin-binding polypeptide) and belong to the
superfamily of chitin-binding lectins. Class II proteins lack the chitin-binding domain. PR-4
proteins have been isolated from potato, tobacco, barley, tomato, and many other plants.
Both classes of proteins have potent antifungal activity against a wide variety of human and
plant pathogens (e.g. Trichoderma harzianum, Fusarium culmorum, Fusarium graminearum,
and Botrytis cinerea). The antifungal activity of class I proteins is likely the result of protein
binding to nascent fungal cell wall β-chitin in the nascent fungal cell wall. By mechanisms not
yet understood these results in disrupted cell polarity and subsequent growth inhibition. The
mechanism of action of class II proteins (which lack the chitin-binding hevein domain but are
antifungal nonetheless) is not understood (Selitrennikoff 2001).
PR-5 (TL) proteins. PR-5 proteins share significant amino acid homology with thaumatin (a
sweet-tasting protein [to humans] from the South African ketemfe berry bush) and are
known as TL proteins. TL proteins have been isolated from Arabidopsis thaliana, corn,
soybean, rice, wheat, tobacco, tomato, pumpkin, bean, barley, flax, and many other plants.
The majority of PR-5 proteins haves molecular masses of ~22 kDa and are stabilized by eight
disulfide bonds. This highly stabilized structure allows PR-5 proteins to be very resistant to
protease degradation. The X-ray structures for two PR-5 proteins and thaumatin have been
determined (Kolbe et al. 1998; Ogata et al. 1992).
Although the precise mechanism of action of PR-5 proteins is not completely understood, a
number of interesting observations have been made that may eventually lead to a unified
hypothesis for how these proteins function in killing fungi. First, several TL proteins cause

I n t r o d u c t i o n | 41
cell permeability changes in fungal cells with a cell wall but have little or no effect on
protoplasts (Roberts and Selitrennikoff 1990). For example, zeamatin (a TL protein from
corn) caused very rapid cell lysis in Neurospora crassa, even at 4 °C; lysis occurred primarily at
subapical regions (Roberts and Selitrennikoff 1990). Second, osmotin, a TL protein from
tobacco, causes perturbations in the regulation of fungal cell wall assembly (Yun et al. 1998;
Yun et al. 1997). Regardless of the precise mode of action of TL proteins, they are fungicidal
against a wide number of plant and human pathogens in vitro. Importantly, one protein,
zeamatin, has shown efficacy in a murine vaginal model of C. albicans infection (White et al.
2002). It is therefore possible that certain PR-5 proteins may be developed into human
therapeutics.
1.13 Structure of the fungal cell wall
A schematic diagram of a typical fungal cell wall is shown in Fig. 1.13. It is important to note
that fungi possess significant internal turgor pressure, so that even a slight perturbation of
the cell wall results in fungal cell lysis (Kaminskyj et al. 1992).
Figure 1.13 Schematic diagram of the fungal cell wall, GPI, glycophosphatidylinositol
(Selitrennikoff 2001)

| 42
2 Aims of the thesis
The aim of this thesis was to investigate microbiological and biochemical aspects of the
cocoa bean fermentation process. In particular, this study aimed to develop a starter culture
for a controlled cocoa bean fermentation process of potential use for the production of
cocoa products. In addition, this study aimed to investigate the antifungal proteins in the
seed coat slime of Theobroma cacao which have not been previously described in order to
understand their influence on fermentation of cocoa bean. The study consists of the
following stages:
A first stage was to investigate the population dynamics of yeasts, lactic acid bacteria (LAB)
and acetic acid bacteria (AAB) and the investigation of important fermentation parameters
such as temperature, pH, sugars, organic acids and ethanol during spontaneous box
fermentation of cocoa bean in a commercial plant in Nusantara Plantation XII (PTPN XII), East
Java, Indonesia.
In the second stage, the microbial diversity of cocoa bean fermentations in three different
cocoa producing regions, namely East Java (Indonesia), Mocache (Ecuador) and Santo
Domingo (Trinidad and Tobago) was compared in order to physiologically characterize
dominant species for applications as starter culture in the cocoa bean fermentation process.
In stage three, the results from in stages 1 and 2 were employed to develop a laboratory
fermentation process (aerobic and anaerobic fermentation conditions) using a starter
culture with the goal of understanding its influence during cocoa bean fermentation and to
control the quality of cocoa bean fermentation products.
The next stage aimed to study the antifungal activity of the seed coat slime of Theobroma
cacao L. found during cocoa bean fermentation and to determine which proteins play a role
in inhibitory process as well as their inhibitory capacities.
The final goal of this work was to perform cocoa bean fermentation after removal of the pulp
using a starter culture under controlled and sterile conditions. Further, the inhibitory activity
of the seed coat slime of Theobroma cacao during fermentation process was investigated
A i m s o f t h e t h e s i s | 43
and its influence on biochemical and metabolic product changes during cocoa bean
fermentation was monitored.

| 44
3 Material and Methods
3.1 Cocoa bean fermentation samples
In order to compare the microbial diversity of cocoa bean fermentations carried out in three
different cocoa producing regions, samples from cocoa bean fermentations were collected in
Jember, East Java, Indonesia, after 0, 24, 48, 72 and 96 h of fermentation, in Mocache
(Ecuador) after 0, 12, 24, 96 and 120 h of fermentation, and in Santo Domingo (Trinidad &
Tobago) after 0, 12, 24, 48 and 72 h of fermentation.
3.2 Fermentation protocol for commercial fermentation plant in Nusantara
Plantation XII (PTPN XII)
Cocoa beans were fermented in the context of commercial operations using box
fermentations at PTPN XII (PT. Perkebunan Nusantara XII: Nusantara Plantation XII, Ltd. Co.),
Jember, East Java, Indonesia. The beans were harvested from plantations by traditional
methods and used in fermentations within 6 h after harvest. Typically, cocoa pods were
harvested from the tree and opened within 30 min for removal of the beans. The pods were
cut with a machete by plantation workers and the beans plus surrounding pulp were
scooped out by hand and placed in piles on a plastic mat. The beans were collected from the
mat, transferred in to plastic or hessian sacks and transported to the fermentary. At each
fermentary, the beans (1000 kg approximately) were placed into wooden boxes (150-200 cm
long x 100 cm wide x 75-100 cm deep), where natural fermentation started. After 12–16 h,
the beans were mixed by transferring them to another box. Such transfers were repeated
every 20–24 h until fermentation was complete (after 4 days). The wooden boxes were not
cleaned between operations, and contained holes drilled into the base and sides to allow for
drainage of liquids (sweatings) generated by the fermentation (Ardhana and Fleet 2003).
Following fermentation, the beans were sundried for 4–5 h before being artificially dried for
20 h at 40-70 °C. Approximately 100 g beans were sampled with a sterile plastic bag at 24 h
intervals. Samples were taken approximately 15 cm from the surface.

M a t e r i a l a n d M e t h o d s | 45
3.3 Fermentation protocol for laboratory level
3.3.1 Materials
Cocoa pod samples were provided by ICCRI (Indonesia Coffee and Cocoa Research Institute),
East Java, Indonesia. Cocoa bean pods of Forastero varieties were surface sterilized using 3%
sodium hypochlorite. Subsequently, the pods were opened in laminar airflow under sterile
conditions.
3.3.2 Starter culture strains and preparation
All of the microorganisms in the defined cocktail used had been isolated previously from
cocoa bean fermentations from Indonesia (Saccharomyces cerevisiae IDI-Y001, Acetobacter
pasteurianus IDI-A019) and Ecuador (Lactobacillus fermentum IDE-L007). All of the strains
used in this study had been physiologically characterized for heat, acid and ethanol
tolerance. To inoculate the fermentary Erlenmeyer flasks, the three strains were first grown
in 100-mL Erlenmeyer flasks in standard media (yeast cells were grown in malt broth, lactic
acid bacteria were grown in MRS broth and acetic acid bacteria were grown in GYP broth).
The cells were then centrifuged in an Eppendorf 5804R centrifuge (Eppendorf, Hamburg,
Germany) for 5 min at 4.000 x g, and resuspended in 10 mL of Ringer solution. The cells were
counted (S. cerevisiae IDI-Y001 107 CFU g-1, L. fermentum IDE-L007 106 CFU g-1,
A. pasteurianus IDI-A019 107 CFU g-1) and then sprayed over the cocoa beans.
3.3.3 Design of the cocoa bean fermentation
Two types of fermentation, aerobic and anaerobic, were carried out to determine the
influence of microbes on the quality of fermented cocoa bean. The fermentation was
performed under sterile conditions. The cocoa pods used in this study were Forastero
varieties obtained from the fields of the Indonesia Coffee and Cocoa Research Institute
(ICCRI) Jember in East Java, Indonesia. Mature pods were harvested by farmers and
transported to Hamburg the following day. Cocoa pods were opened under sterile
conditions as described (Section 3.3.1). Shortly after opening, about 250 g cocoa beans were

M a t e r i a l a n d M e t h o d s | 46
put into each fermentary flask. Each fermentation method (aerobic and anaerobic) was
repeated two times. The fermentation was conducted under sterile conditions in a
Cytoperm™ 2 CO2 Gassed Incubator (Thermo Scientific™, St. Leon-Rot, Baden-Württemberg,
Germany), as follows:
Table 3.1 Fermentation design
Fermentation time (h) Starter culture Aerobic fermentation Anaerobic fermentation
°C CO2 O
2 rH °C CO
2 O
2 rH
0 Yeast, LAB 30 5 10 90 30 5 10 90
24 Yeast, LAB 30 5 10 90 30 5 10 90
48 Yeast, LAB 35 0.04 20 90 35 5 10 90
72 Yeast, LAB, AAB 40 0.04 20 90 40 5 10 90
96 Yeast, LAB, AAB 45 0.04 20 90 45 5 10 90
120 Yeast, LAB, AAB 45 0.04 20 90 45 5 10 90
Add: yeast (S. cerevisiae IDI-Y001), LAB (L. fermentum IDE-L007), AAB (A. pasteurianus IDI-A019), sampling every 24 h.

M a t e r i a l a n d M e t h o d s | 47
Figure 3.1 Laboratory fermentation (Thermo Scientific Heraeus® Cytoperm® 2. CO2 and CO2
/O2 Incubator)
3.4 Fermentation protocol for fermentation with only 10% of pulp
Cocoa pod samples were provided by ICCRI (Indonesia Coffee and Cocoa Research Institute),
Jember, East Java, Indonesia. Five pods of SCA 6 varieties were surface sterilized using 3%
sodium hypochlorite. Subsequently, pods were opened in laminar airflow Herasafe (Heraeus,
Hanau, Germany) under sterile conditions. The beans and pulp were manually separated
using sterile surgical blades. Shortly after, approximately 200 g separated beans were placed
into sterile Erlenmeyer flasks for fermentation. Afterwards, beans with 10% pulp were
fermented as described above (Section 3.3).

M a t e r i a l a n d M e t h o d s | 48
3.5 Determination of physical and chemical changes during fermentation
3.5.1 Determination of temperature value
The temperature of fermentation masses was recorded at each sampling site by inserting a
thermometer into the fermenting mass.
3.5.2 Determination of pH value
For pH determinations, the pulp was separated from the beans following the protocol of
Ardhana and Fleet (2003). Beans and pulp were physically separated by adding 50 g of
distilled H2O (dH2O) to 50 g of sample in a plastic bag and massaging the bag for 5 min. The
pulp fraction was recovered by decanting. Twenty grams of the pulp and bean fraction was
added to 80 g of dH2O each and, mixed in a laboratory stomacher (type BA 7021, Seward
Medical, London, UK). The homogenate was centrifuged at 11.953 x g at 10 °C for 15 min in a
Sorvall RC 5C Plus (Kendro Laboratory, Newtown, CT, USA) and the supernatant retained.
The sediment was washed one time with 20 mL of distilled water and the washings
combined with the first supernatant. This extract for analysis was filtered through a 0.45 μm
filter (Macherey-Nagel, Düren, Germany). The pH of the filtrate was determined using a pH
meter (pH 21, Hanna, Rhode Island, USA).
3.5.3 Determination of water activity (aW) value
The water activity (aw) value of the fermented cocoa bean samples was measured by
Hygromess Labo 4701 (Hygrocontrol, Hanau, Germany) every 24 h (0, 24, 48, 72, 96, 120 h).

M a t e r i a l a n d M e t h o d s | 49
3.6 Microbiological analyses
3.6.1 Media and reagents
3.6.1.1 Media
Table 3.2 Composition of malt extract agar (MEA) and malt extract broth (MEB)
MEA MEB
Substance g L-1 Substance g L-1
Peptone
Malt extract
Agar-agar
pH
3
30
15
5.6
Malt extract
pH
17
4.8
Table 3.3 Composition of DeMan-Rogosa-Sharpe agar (MRSA) and DeMan-Rogosa-Sharpe
broth (MRSB)
MRSA MRSB
Substance g L-1 Substance g L-1
Peptone
Meat extract
Yeast extract
D(+)-glucose
Dipotassium hydrogen phosphate
Tween 80
Di-ammonium hydrogen citrate
Sodium acetate
Magnesium sulfate
Manganese sulfate
Agar-agar
pH
10
10
4
20
2
1
2
5
0.2
0.04
14
5.7
Peptone
Meat extract
Yeast extract
Tween 80
Di-ammonium hydrogen citrate
Sodium acetate
Magnesium sulfate
Manganese sulfate
pH
10
8
4
1
2
5
0.2
0.04
5.7

M a t e r i a l a n d M e t h o d s | 50
Table 3.4 Composition of glucose yeast extract peptone calcium carbonate agar (GYPA)
and glucose yeast extract peptone broth (GYPB)
GYPA GYB
Substance g L-1 Substance g L-1
D-glucose
Yeast extract
Peptone
Calcium carbonate
Agar-agar
pH
20
5
5
3
15
5.6
D-glucose
Yeast extract
Peptone
pH
20
5
5
5.6
Table 3.5 Composition of Acetobacter agar and plate count agar (PCA)
Acetobacter agar PCA
Substance g L-1 Substance g L-1
Yeast extract
Ethanol
Bromocresol purple
Agar-agar
pH
10
15
0.04
25
6.5
Peptone
Yeast extract
D(+)-glucose
Agar-agar
pH
5
2.5
1
14
7
Table 3.6 Composition of yeast extract glucose chloramphenicol agar (YGCA) and yeast
extract glucose chloramphenicol bromophenol blue agar (YGCBA)
YGCA YGCBA
Substance g L-1 Substance g L-1
Yeast extract
D(+) glucose
Chloramphenicol
Agar-agar
pH
5
20
0.1
14.9
6.6
Yeast extract
D(+) glucose
Chloramphenicol
Bromophenol blue
Agar-agar
pH
5
20
0.1
0.01
14.9
6.6

M a t e r i a l a n d M e t h o d s | 51
3.6.1.2 Reagents
TE buffer
Tris
EDTA
H2Obidest
pH
0.606 g
0.146 g
ad 500 mL
8
TE-sucrose buffer
20% sucrose dissolved in 1x TE buffer
Lysis buffer
10% [wt/vol] sodium dodecyl sulfate
1 N NaOH
H2Obidest
2.5 mL
5 mL
92.5 mL
3.6.2 Enumeration, isolation and purification of yeasts, lactic acid bacteria, and
acetic acid bacteria
Ten grams of samples of cocoa beans and adhering pulp were added to 90 ml of Ringer’s
solution (Merck, Darmstadt, Germany) and mixed for 2 min in a laboratory blender
stomacher 400 (Seward Medical, London, UK) at medium speed. From this, 10-fold dilutions
were prepared in 1 × Ringer’s solutions. Yeasts were enumerated by spreading on malt
extract agar (Merck, Darmstadt, Germany) containing 100 mg L-1 chloramphenicol (Sigma, St.
Louis, Missouri, USA) and were incubated for 3 days at 28 °C. Lactic acid bacteria were
enumerated by spreading on MRS agar (Merck, Darmstadt, Germany) containing 0.1%
cycloheximide (Merck, Darmstadt, Germany) to suppress the growth of yeasts. Incubation
was done in anaerobic jars BBL GasPak system (BD, New Jersey, USA) and supplementation
with Anaerocult A (Merck, Darmstadt, Germany) to obtain anaerobic conditions during
incubation for 3 – 4 days at 30 °C. Acetic acid bacteria were enumerated by spreading on

M a t e r i a l a n d M e t h o d s | 52
GYP agar, containing 0.1% cycloheximide (Merck, Darmstadt, Germany) to inhibit growth of
yeasts and incubated for 3 – 5 days at 30 °C (Lisdiyanti et al. 2003). Acetobacter agar
containing 0.1% cycloheximide (Merck, Darmstadt, Germany) to inhibit growth of yeasts and
incubated for 3 – 5 days at 30 °C was also used. Aerobic mesophilic bacteria and Bacillus spp.
were enumerated by spreading on plate count agar (Merck, Darmstadt, Germany) containing
0.1% cycloheximide (Merck, Darmstadt, Germany) and incubated for 3 days at 30 °C.
Following incubation, the number of colony forming units (CFU) was recorded.
Subsequently, the morphological characteristics of each colony type were recorded and
counts were made for each type. For each colony type a number of colonies corresponding
to the square root of the number of colonies of that type were restreaked and purified.
Purified isolates were stored at −80 °C. Yeasts were stored in YGP broth (yeast extract 5 g L-1,
glucose 10 g L-1, peptone 10 g L-1, pH 5.6) containing 20% (w/w) glycerol; LAB were stored in
10% skim milk, containing 20% (w/w) glycerol; AAB were stored in GYP broth (glucose
20 g L-1, yeast extract 5 g L-1, peptone 5 g L-1, pH 5.6) containing 20% glycerol.
3.6.3 Gram staining
Gram staining was carried out according to the methods of Hucker and Conn (1923). Further
on the KOH test was performed using the reaction with 0.3% KOH (Powers 1995). Cultures
were incubated in a basal slant medium at 30 °C for 18 - 24 h. In the former method, a loop-
full of culture was placed on a clean slide, spread using the loop, and allowed to dry, forming
a smear. The smear was fixed by passing it quickly through a Bunsen flame twice. A heat-
fixed smear was stained for 1 min with crystal violet before being rinsed briefly under water,
treated for 1 min with Lugol’s iodine (a solution of iodine and potassium iodine in water),
and briefly rinsed again. Decolorization was then conducted by treating the stained smear
with 95% ethanol and, rinsing in water. The smear was counterstained for 1 min with
safranine. After a brief rinse, the smear was blotted dry and examined under the oil-
immersion objective of the Zeiss axiostar plus microscope (Carl Zeiss Microscopy,
Thornwood, NY, USA) (magnification approximately 1000×). Cells that stained red were
Gram-negative, while those that stained blue were Gram-positive (Hucker and Conn 1923).
In the second method, colonies grown on a basal agar plate were placed on a slide. A drop of

M a t e r i a l a n d M e t h o d s | 53
3% KOH was added and the cells were mixed using a loop. The appearance of a viscous
thread-like slime when the loop was raised for about 1 cm from the slide indicated Gram-
negative strains.
3.6.4 Catalase activity
Catalase is an enzyme which is present in all cells with aerobic metabolism. It contains iron
protoporphyrin (haemin) as a coenzyme. Catalase cleaves toxic hydrogen peroxide produced
in metabolic processes into oxygen and water. The presence or absence of catalase activity is
a taxonomic property of microorganisms and can be used for their differentiation or
identification. Part of the colony to be examined was picked up with a loop and placed onto
a dry glass slide. A drop of the catalase reagent ‘Bactident Catalase’ (Merck, Darmstadt,
Germany) contening 3% aqueous solution of hydrogen peroxide was placed on the bacteria.
Gas formation indicated positive reaction.
3.6.5 Oxidase test
Cytochrome oxidase is a very widespread enzyme belonging to the group of iron porphyrins.
It oxidizes reduced cytochrome c and is itself converted to its reduced inactive form. The
reduced cytochrome oxidase is reconverted to its oxidized active form via the transfer of
electrons to molecular oxygen. In the presence of molecular oxygen the electrons can be
removed by the cytochrome oxidase/cytochrome c system from a number of organic
compounds, e.g. the so-called Nadi reagent (1-naphthol + dimethylparaphenylenediamine)
with formation of the condensation molecule indophenol blue. This reaction is utilized for
the classification and identification of bacteria. The oxidase test was done by using a
platinum loop to apply single colonies from the plate medium to the reactive zone of the
oxidase strip ‘Bactident Oxidase’ (Merck, Darmstadt, Germany) containing N,N-Dimethyl-1,4-
phenylenediammonium chloride; 1-naphthol. After 20 - 60 seconds, the test strip was
compared with the color scale provided. Cytochrome oxidase-positive bacteria are present
when the reactive zone exhibits a blue to purple color.

M a t e r i a l a n d M e t h o d s | 54
3.7 Carbohydrate assimilation test using the API kit
3.7.1 Carbohydrate assimilation test for yeasts using API ID 32 C
API ID 32 C (bioMérieux, Marcy-L’Etoile, France) was used for the assimilation test of yeasts.
The application of these ID 32 C assimilation kits was performed according to manufacturer’s
instructions.
3.7.2 Carbohydrate assimilation test for lactic acid bacteria using API 50 CHL
API 50 CHL (bioMérieux, Marcy-L’Etoile, France) was used for the assimilation test of
Lactobacillus. The application of these API 50 CHL assimilation kits was performed according
to manufacturer’s instructions.
3.8 FT-IR spectroscopy for the identification of yeasts
Because of the large number of isolates, a high throughput method was necessary for the
identification of yeast in cocoa bean fermentation. This was accomplished using Fourier-
transfom infrared (FT-IR) spectroscopy (Bruker, Ettlingen, Baden-Württemberg, Germany),
which allows for the processing of a large number of isolates. This spectroscopy method is
based on the isolation of pure cultures. After standardized cultivation on YGCA (22 g ± 1 g)
for 24 h ± 0.5 h at 27 °C, the middle infrared range of 4000-500 wave length/cm2 (25.000 -
2.500 nm) was used to shift atoms in molecule bonds into vibration. By absorption of light, a
spectrum can be measured, calculated and constructed. This specific absorption can then be
attributed to several cell components (polysaccharides, fatty acids, proteins, mixed region,
fingerprint-region) which are used for species identification using an appropriate
comparative database. This database includes approximately 215 yeast species. By
hierarchical cluster analysis (HCA), a differentiation on strain level is possible and can be
used for choosing several important species for strain typing by random amplified
polymorphic DNA (RAPD) and δ-PCR (Naumann et al. 1991; Kummerle et al. 1998) (Fig. 3. 2).

M a t e r i a l a n d M e t h o d s | 55
Figure 3.2 a) Pure yeast culture on YGCBA, b) Measurement on a ZnSe microtiterplate (96-
well format) in a FT-IR (Bruker), comparison of the absorbance pattern with a database
and identification of the isolate, c) Differentiation by hierarchical cluster analysis (HCA) up
to strain level (strain range 0.3 spectral distances)
3.9 Identification using molecular methods
3.9.1 Isolation of genomic DNA and purification
3.9.1.1 Isolation of genomic DNA using classical methods
A preculture of LAB and AAB was grown in 30 mL of MRSB and GYPB medium at 30 °C for 2-3
days. Then 5 - 10 mL of this preculture was centrifuged in an Eppendorf 5417R centrifuge
(Eppendorf, Hamburg, Germany) for 30 sec at 13.000 x g. To remove excess medium, the
pellet was resuspended in 1 mL NaCl. Then, cells were harvested in an Eppendorf 5417R
centrifuge (Eppendorf, Hamburg, Germany) for 30 sec at 13.000 x g and resuspended in
250 μL TE-sucrose buffer. After adding 250 μL TE buffer containing lysozyme (10 mg mL-1)
and RNAase (1 mg mL-1), the mixture was incubated for 1 h at 37 °C. Proteinase K (1 mg mL-1)
was added to the suspension and incubated for at least 1 h. After adding 250 μL
phenol/chloroform (1:1), the suspension was mixed well until a white emulsion appeared.
The emulsion was centrifuged in an Eppendorf 5417R centrifuge (Eppendorf, Hamburg,
Germany) for 20 min at 17.000 x g and the supernatant was carefully transferred into a new
a
c
b

M a t e r i a l a n d M e t h o d s | 56
eppendorf cup (Eppendorf, Hamburg, Germany). The phenol/chloroform step was repeated
twice. Then, 250 μL chloroform were added to the supernatant, mixed well and centrifuged
in an Eppendorf 5417R centrifuge (Eppendorf, Hamburg, Germany) for 2 min at 17.000 x g.
The supernatant was then transferred into a fresh eppendorf cup (Eppendorf, Hamburg,
Germany) and precipitated with 2.5 volumes of 96% EtOH and 0.3 M NaOAc. The eppendorf
cup was inverted several times and incubated at -70 °C for 10 min. After centrifugation for
20 min at 17.000 x g, the supernatant was decanted and mixed with 1 mL 70% EtOH and
centrifuged in an Eppendorf 5417R centrifuge (Eppendorf, Hamburg, Germany) for 2 min at
17.000 x g. This step was repeated once more. The DNA pellet was then dried, resuspended
in 100 μL 1x TE buffer or H2Obidest and incubated for 1 h at 60 °C or at room temperature
overnight.
3.9.1.2 Isolation of genomic DNA using the peqGOLD Fungal DNA kit
Highly pure fungal DNA was isolated using the peqGOLD Fungal DNA Kit (PEQLAB
Biotechnologie, Erlangen, Germany). Culture volumes of 5 mL were sufficient for the
isolation of yeast DNA. The application of these DNA isolation kits was done according to
manufacturer’s instructions.
3.9.1.3 Isolation of genomic DNA using the peqGOLD Bacteria DNA kit
Highly pure bacteria DNA was isolated using peqGOLD Bacteria DNA Kit (PEQLAB
Biotechnologie, Erlangen, Germany). Culture volumes of 5 mL were sufficient for the
isolation of bacteria DNA. The application of these DNA isolation kits was done according to
manufacturer’s instructions.
3.9.2 Determination of DNA concentration and purity
The quantity and purity of DNA was measured using a photometer SmartSpecTM Plus Spec-
trophotometer (BIO RAD, Hercules, CA, USA). DNA concentration was measured in a disposa-
ble micro UV cuvette (Plastibrand®, Brand, Wertheim, Germany) at 260 nm against H2Obidest.
An OD260 of 1.0 corresponds to 50 μg mL-1 of double-stranded DNA. The purity was
determined by calculating the ratio of the extinction values at 260 and 280 nm. Pure DNA
solutions have a ratio OD260:OD280 of 1.8 - 2.0 (Sambrook 2001).

M a t e r i a l a n d M e t h o d s | 57
3.9.3 Agarose gel electrophoresis
The size, quality and quantity of DNA were analyzed by agarose gel electrophoresis. DNA is
negatively charged and moves through a 1.0 % (w/v) agarose gel. The run time of the DNA
fragments is dependent on their size. Smaller fragments move through the matrix faster, and
thus fragments are separated according to their size. The electrophoresis was performed at
100 V for at least 35 min with a PowerPacTM HC (BioRad, Munich, Germany) power supply in
an electrophoresis gel chamber Sub-Cell® GT Agarose Gel (BioRad, Munich, Germany) filled
with TAE buffer. Samples (1-5 μL) were mixed with 1 μL of 6X DNA loading dye (Fermentas,
St. Leon-Rot, Baden-Württemberg, Germany) before they were applied to the gel.
10X TAE Buffer 6X DNA loading dye
Tris 48.5 g Tris-HCl (pH 7.6) 10 mM
Glacial acetic acid 11.4 mL Tris-HCl (pH 7.6) 10 mM
0.5M EDTA (pH 8.0) 20 mL bromophenol blue 0.03%
H2Obidest to 1000 mL xylene cyanol FF 0.03%
glycerol 60%
EDTA 60 mM
3.9.4 Visualization and documentation of DNA
After performing the electrophoresis, the DNA was stained in an ethidium bromide solution
(10 μg mL-1) for 15 min and visualized under UV light of 254 nm in a Molecular Imager®
(GelDocTM XR+ Imaging System, BioRad, Munich, Germany). The gel was documented with
Quantity One 1-D analysis software version 4.6.9 (BioRad, Munich, Germany). The size of the
DNA fragments was estimated by comparison with marker bands of a GeneRuler™ 1 kb DNA
Ladder (Fermentas, St. Leon-Rot, Baden-Württemberg, Germany) which was also loaded
onto the gel.

M a t e r i a l a n d M e t h o d s | 58
3.9.5 Amplification of DNA by polymerase chain reaction (PCR)
Table 3.7 Primers used in this study
Primers Sequence 5’ – 3’ Length [bp] GC content [%] Tm [C] NL1 GCA TAT CAA TAA GCG GAG GAA AAG 24 41.7 59.3
NL4 GGT CCG TGT TTC AAG ACG G 19 57.9 58.8
27 F AGA GTT TGA TCM TGG CTC AG 20 58.6
1492 R TAC GGY TAC CTT GTT ACG ACT T 22 59.1
FD1 AGA GTT TGA TCC TGG CTC AG 20 61.0
RD1 AAG GAG GTG ATC CAG CC 17 60.2
20 F GAT TTT GAT CCT GGC TCA G 19 47.4 54.5
1500 R GTT ACC TTG TTA CGA CTT 18 38.9 49.1
Oligonucleotide primers were ordered from Operon Biotechnologies (Eurofins MWG,
Ebersberg, Germany).
3.9.5.1 Standard PCR
To set up parallel reactions and to minimize the possibility of pipetting errors, DreamTaq PCR
Master Mix (Fisher Scientific, Schwerte, North Rhine-Westphalia, Germany) was used for
standard PCR. The application of these DreamTaq PCR Master Mix kits was done according
to manufacturer’s instructions.
Table 3.8 PCR master mix reaction for standard PCR
Reaction components Final concentration Per 50 µL
10X DreamTaq Buffer 5 μL
dNTP Mix (2 mM each) 0.2 mM of each dNTP 5 μL
Forward primer (10 µM) 0.5 µM 2.5 µL
Reverse primer (10 µM) 0.5 µM 2.5 µL
Template DNA 10pg-1 μg 2 μL
DreamTaq DNA Polymerase 1.25 u 1.25 u
Water, nuclease-free To 50 μL

M a t e r i a l a n d M e t h o d s | 59
Table 3.9 PCR cycling program for yeasts
Cycling step Temperature and time
Initial denaturation 95 °C, 5 min
Denaturation 95 °C, 1 min
Annealing 52 °C, 15 sec
Extension 72 °C, 2 min
Cycles 35 cycles
Final extension 72 °C, 7 min
Modified PCR cycling (Kurtzman and Robnett 1998)
Table 3.10 PCR cycling program for LAB
Cycling step Temperature and time
Initial denaturation 95 °C, 5 min
Denaturation 95 °C, 1 min
Annealing 56 °C, 1.15 min
Extension 72 °C, 1.15 min
Cycles 35 cycles
Final extension 72 °C, 7 min
Modified El-Ghaish (El-Ghaish et al. 2011)
Table 3.11 PCR cycling program for AAB
Cycling step Temperature and time
Initial denaturation 95 °C, 5 min
Denaturation 95 °C, 18 sec
Annealing 55 °C, 18 sec
Extension 72 °C, 1.0 min
Cycles 30 cycles
Final extension 72 °C, 7 min
(Lisdiyanti et al. 2001)

M a t e r i a l a n d M e t h o d s | 60
3.9.5.2 Yeasts direct colony PCR
For yeasts colony PCR, yeasts were grown on malt agar (Merck, Darmstadt, Germany) for
24-48 h at 28 °C or in 5 mL malt broth (Merck, Darmstadt, Germany) for 24 h at 25 °C on a
rotary shaker GFL 3015 (Burgwedel, Hanover, Germany) at 150 rpm and harvested by
centrifugation in an Eppendorf 5417R centrifuge (Eppendorf, Hamburg, Germany) for 5 min
at 13.000 x g. PCR template was prepared using 50 µL 0.02 M NaOH for pure yeasts colony or
40 µL 0.1 NaOH for overnight culture. The culture solutions were incubated for 5 min at
37 °C. Yeast DNA templates were amplified using KAPA2G Robust PCR Kits (PEQLAB
Biotechnologie, Erlangen, Germany). The application of PCR kits was done according to
manufacturer’s instructions. The PCR cycling programs used are described above (Tab. 3.9),
PCR master mix conditions are given below.
Table 3.12 PCR master mix reaction for yeasts
Reaction component Final concentration Per 25 µL
PCR grade water 14.3 µL
5x KAPA2G Buffer B 1x 5.0 µL
dNTP mix (10 mM each dNTP) 0.2 mM each dNTP 0.50 µL
Forward primer NL-1 (10 µM) 0.5 µM 1.25 µL
Reverse primer NL-4 (10 µM) 0.5 µM 1.25 µL
Template DNA
KAPA 2G Robust HotStart (5 U/µL)
1 unit per 25 µL
2.5 µL
0.20 µL
Total 25 µL
3.9.5.3 Lactic acid bacteria direct colony PCR
For LAB colony PCR, LAB were grown on MRSA (Merck, Darmstadt, Germany) for 24 - 48 h at
25 °C or in 5 mL MRSB (Merck, Darmstadt, Germany) for 24-48 h at 37 °C anaerobically and
were harvested by centrifugation in an Eppendorf 5417R centrifuge (Eppendorf, Hamburg,
Germany) for 5 min at 13.000 x g. A small portion of a single colony was resuspended in
20 µL lysis buffer (2.5 ml of 10% [wt/vol] sodium dodecyl sulfate, 5.0 mL of 1 N NaOH, and
92.5 mL of ultrapure water). The mixture was heated at 95 °C for 15 min and cooled
immediately on ice. After centrifugation in an Eppendorf 5417R centrifuge for 30 sec at

M a t e r i a l a n d M e t h o d s | 61
13.000 x g, 180 µL of sterile ultrapure water were added. Subsequently, the mixture was
centrifuged in an Eppendorf 5417R centrifuge (Eppendorf, Hamburg, Germany) for 5 min at
13.000 x g and stored at -20 °C (Van der Meulen et al. 2007). If this treatment method was
not able to produce a high quality DNA template, the peqGOLD Bacterial DNA Kit was used.
LAB DNA template was amplified using KAPA2G Robust PCR kits (PEQLAB Biotechnologie,
Erlangen, Germany). The application of PCR kits was done according to manufacturer’s
instructions. The PCR cycling program used are described above (Tab. 3.10), PCR master mix
conditions are given below.
Table 3.13 PCR master mix reaction for lactic acid bacteria
Reaction component Final concentration Per 25 µL
PCR grade water 15.9 µL
5x KAPA2G Buffer B 1x 5.0 µL
dNTP mix (10 mM each dNTP) 0.2 mM each dNTP 0.50 µL
Forward primer fD1 (10 µM) 0.5 µM 1.25 µL
Reverse primer rD1 (10 µM) 0.5 µM 1.25 µL
Template DNA
KAPA 2G Robust HotStart (5 U/µL)
1 unit per 25 µL
1 μL
0.10 µL
Total 25.0 µL
3.9.5.4 Acetic acid bacteria direct colony PCR
For AAB colony PCR, AAB were grown on GYPA (Lisdiyanti et al. 2003) for 24-48 h at 30 °C
aerobically or in 5 mL GYPB (Lisdiyanti et al. 2003) for 24-48 h at 30 °C aerobically on a rotary
shaker GFL 3015 (Burgwedel, Hanover, Germany) at 150 rpm and harvested by
centrifugation in an Eppendorf 5417R centrifuge (Eppendorf, Hamburg, Germany) for 5 min
at 13.000 x g. A small portion of a single colony was resuspended in 20 µL of ultrapure water.
The mixture was heated at 95 °C for 5 min and cooled immediately on ice. After
centrifugation in an Eppendorf 5417R centrifuge for 30 sec at 13.000 x g, 180 µL of sterile
ultrapure water were added. Subsequently, the mixture was centrifuged in Eppendorf 5417R
(Eppendorf, Hamburg, Germany) for 5 min at 13.000 x g and stored at -20 °C. If this
treatment method was not able to produce a high quality DNA template, the peqGOLD

M a t e r i a l a n d M e t h o d s | 62
Bacterial DNA Kit was used. LAB DNA template was amplified using KAPA2G Robust PCR Kits
(PEQLAB Biotechnologie, Erlangen, Germany). The application of PCR kits was done
according to manufacturer’s instructions. The PCR cycling programs used are described
above (Tab. 3.11). PCR master mix conditions are given below.
Table 3.14 PCR master mix for acetic acid bacteria
Reaction component Final concentration Per 25 µL
PCR grade water 15.9 µL
5x KAPA2G Buffer B 1x 5.0 µL
dNTP mix (10 mM each dNTP) 0.2 mM each dNTP 0.50 µL
Forward primer 20f (10 µM) 0.5 µM 1.25 µL
Reverse primer 1500r (10 µM) 0.5 µM 1.25 µL
Template DNA
KAPA 2G Robust HotStart (5 U/µL)
1 unit per 25 µL
1 μL
0.10 µL
Total 25.0 µL
3.9.6 Purification of PCR product
Prior to sequencing, enzymes, primers and remaining nucleotides had to be removed from
the PCR products. The purification was carried out by using the GeneJETTM PCR Purification
kit (Fermentas, St. Leon-Rot, Baden-Württemberg, Germany) according to the
manufacturer´s instructions.
3.9.7 Sequencing analyses of DNA
Sequencing was carried out by the commercial DNA sequencing service Eurofins MWG
Operon (Ebersberg, Germany). Sample preparation for sequencing: 100 ng μL-1 purified PCR
products in 15 µL ddH2O, including 15 pmol primer. This premixed DNA sample was sent to
Eurofins MWG Operon (Ebersberg, Germany) for sequencing. An ABI 3730XL DNA analyzer
(Applied Biosytems/Life technologies, Darmstadt, Germany) was used based on the Sanger
technique (Sanger et al. 1977).

M a t e r i a l a n d M e t h o d s | 63
3.9.8 BLAST analyses
Sequences results were corrected and aligned using Bio Edit software. The corrected
sequences were subsequently aligned to 16S rRNA gene sequences for bacteria and 26S
rRNA gene sequences for yeasts in the GenBank Database using the BLAST algorithm
(Altschul et al. 1997).
3.10 Physiological adaptation to fermentation environment (acid, ethanol
and heat tolerance)
3.10.1 Physiological adaptation of yeasts
Malt extract broth (MEB) (Merck, Darmstadt, Germany) was used for the characterization of
the physiological adaptation of yeasts. To test pH tolerance, MEB was adjusted to pH 2.5,
3.5, and 5.0 with 5M HCl. To test ethanol tolerance, MEB was supplemented with 5%, 10%,
or 15% (v/v) ethanol. To test heat tolerance, MEB was adjusted to pH 5.5, and was incubated
at 25, 35, and 45 °C. All tubes were inoculated with 1% (v/v) of a yeast culture grown at 30 °C
for 24 h. Growth was determined by measurements of OD600nm after incubation at 25 °C for
5 days.
3.10.2 Physiological adaptation of lactic acid bacteria
De Man, Rogosa and Sharpe broth (MRSB) (Merck, Darmstadt, Germany) was used for the
characterization of the physiological adaptation of LAB. To test pH tolerance, MRSB was
adjusted to pH 2.5, 3.5, and 5.0 with 5M HCl. To test ethanol tolerance, MRSB was
supplemented with 5%, 10%, or 15% (v/v) ethanol. To test heat tolerance, MRSB was
adjusted to pH 5.5 and was incubated at 25, 35, and 45 °C. All tubes were inoculated with 1%
(v/v) of a yeast culture grown at 30 °C for 24 h. Growth was determined by measurement of
OD600nm after incubation at 30 °C for 5 days.

M a t e r i a l a n d M e t h o d s | 64
3.10.3 Physiological adaptation of acetic acid bacteria
Glucose yeast extract peptone broth (GYPB) containing 2.0% D-glucose, 0.5% yeast extract
and 0.5% peptone (Lisdiyanti et al. 2002) was used for the characterization of the
physiological adaptation of AAB. To test pH tolerance, GYPB was adjusted to pH 2.5, 3.5, and
5.0 with 5M HCl. To test ethanol tolerance, GYPB was supplemented with 5%, 10%, or 15%
(v/v) ethanol. To test heat tolerance, GYPB medium was adjusted to pH 5.5 and was
incubated at 25, 35, and 45 °C. All tubes were inoculated with 1% (v/v) of a yeast culture
grown at 30 °C for 24 h. Growth was determined by measurement of OD600nm after
incubation at 25 °C for 5 days.
3.11 Analyses of metabolites with HPLC
3.11.1 Measurement of sugars and ethanol
The HPLC system utilized in this study consisted of a Merck Hitachi L-6200 pump (Merck
Hitachi, Darmstadt, Germany), an ERC-3512 degasser (Erma, Tokyo, Japan), an AS-2000A
sample injector (Merck Hitachi, Darmstadt, Germany) and a Merck Hitachi Lachrom RI
detector L-7490 (Darmstadt, Germany). The software, D-7000 HPLC-System-Management
HSM, Version 4.1 (Hitachi, Tokyo, Japan), was used to manage the HPLC system and to
evaluate and quantify the results. The column used was an 850 BP-OA H+ 300*7.8mm
organic acid column (Benson polymeric, Sparks, NV, USA) for organic acid and glycerol and a
Rezex RCM-Monosaccharide column (Phenomenex, Torrance, CA, USA) for sugar and
ethanol. All solvents used were of analytical grade purchased from Merck (Darmstadt,
Germany). Water was purified in a Milli-Q water purification system (Millipore, Bedford, MA,
USA).
3.11.1.1 Preparation of the samples
Bean and pulp were physically separated by adding 50 g distilled H2O (dH2O) to 50 g sample
in a plastic bag and massaging the bag for 5 min. The pulp fraction was recovered by
decanting. Twenty grams of the pulp and bean fraction was added to 80 mL dH2O and mixed

M a t e r i a l a n d M e t h o d s | 65
in a laboratory blender stomacher 400 (Seward Medical, London, UK). The homogenate was
centrifuged at 11.953 x g at 10 C for 15 min in a Sorvall RC 5C plus (Kendro Laboratory,
Newtown, CT, USA) and the supernatant retained. Sediment was washed one time with
20 mL distilled water and the washings were combined with the first supernatant. This
extract for analysis was filtered through a 0.45 μm filter (Macherey-Nagel, Düren, Germany).
3.11.1.2 Sugars and ethanol standards
Sucrose, glucose, fructose, mannitol and ethanol were used as standards. All standards were
diluted with distilled water. The range of the standards was (0.2 – 2 g 100 mL-1). Different
concentrations of each standard solution were injected into the Rezex RCM-Monosaccharide
column (Phenomenex, Torrance, CA, USA) as a solid phase and were eluted with water as
mobile phase at 60 °C, and a flow rate of 0.6 mL min-1. The injection volume was 10 μL and
the column eluate was monitored by Lachrom RI Detector. The calibration curves were
obtained by plotting peak area (mV min-1) versus amount injected (range covered, 0.2 – 2 g
100 mL-1).
3.11.1.3 Organic acids and glycerol standards
Citric acid, lactic acid, acetic acid, succinic acid and glycerol were used as standards. All
standards were diluted with distilled water. The range of the standards was (0.1 – 2.5 g
100 mL-1). Different concentrations of each standard solution were injected into organic acid
column 850 BP-OA H+, 300*7.8mm (Benson Polymeric, Sparks, NV, USA) as a solid phase. All
of the chromatographic separations were carried out at 60 °C. A flow of 0.6 mL min-1 with
26 mM sulfuric acid was used as mobile phase. The injection volume was 10 μL and the
column eluate was monitored by Lachrom RI Detector. The calibration curves were obtained
by plotting peak area (mV min-1) versus amount injected (range covered, 0.1 – 2.5 g
100 mL-1).
3.11.1.4 Measurement of sugars and ethanol
The concentrations of sucrose, glucose, fructose, mannitol, and ethanol were determined by
high performance liquid chromatography (HPLC) (Merck Hitachi, Darmstadt, Germany) with
a Rezex RCM-Monosaccharide column (Phenomenex, Torrance, CA, USA) as a solid phase

M a t e r i a l a n d M e t h o d s | 66
and were eluted with water as a mobile phase at 60 °C, and a flow rate of 0.6 mL min-1. The
injection volume was 10 μL and the column eluate was monitored by Lachrom RI Detector.
3.11.2 Measurement of organic acids and glycerol
Organic acids (citric acid, lactic acid, acetic acid, succinic acid) and glycerol were determined
by HPLC with an organic acid column 850 BP-OA H+, 300*7.8mm (Benson Polymeric, Sparks,
NV, USA) as a solid phase. All of the chromatographic separations were carried out at 60 °C.
A flow of 0.6 mL min-1 with 26 mM sulfuric acid was used as a mobile phase. The injection
volume was 10 μL and the column eluate was monitored by Lachrom RI Detector.
3.11.3 Measurement of amino acids
Amino acid contents were analysed according to the method described by Rohsius et al.
(2006)
3.11.3.1 Preparation of samples
Two grams of freeze-dried fermented cocoa bean were milled to a powder with a particle
size of ca. 1 µm3 in a Retsch MM 200 (Haan, North Rhine-Westphalia, Germany) laboratory
mill using 10 mL n-hexane for fat removal. The pulverised sample then was rinsed twice with
50 mL petroleum in a Buchner funnel to reduce the residual fat content to ≤5%.
Subsequently, the defatted powder was dried in a vacuum oven (Heraeus, Hanau, Germany)
at room temperature and 100 mbar.
3.11.3.2 Preparation of standard for amino acids
Amino acid standards were prepared by injecting of mixtures containing 1 – 10 pmol µL-1 of
each amino acid into the column.
3.11.3.3 Measurement of amino acids
Free amino acid contents were analysed according to the method described by Rohsius et al.
(2006). One-hundred milligram defatted cocoa powder were stirred at 4 °C for 1 h with
300 mg polyvinyl-polypyrrolidon (PVPP) and 5 - 10 mL distilled water. Immediately after
adding the water, the pH was adjusted to pH 2.5 with 10% aqueous trifluoroacetic acid. The

M a t e r i a l a n d M e t h o d s | 67
homogenate was centrifuged in Biofuge 11R (Heraeus, Hanau, Germany) for 10 min at
2.683 x g. The clear supernatant solution was filtered through a 0.45 µm filter
(CS-Chromatography, Düren, North Rhine-Westphalia, Germany). About 30 µL of each
sample were lyophilized in Christ Alpha 1-4 (SciQuip, Shrewsbury, West Midlands, UK) for 1 h
at -20 °C, 0.05 mbar directly into the vial and kept at -20 °C until analysis.
Free amino acids were derivatized with O-phthalaldehyde (OPA) prior to HPLC analysis.
Chromatographic separation was performed with a LiChroCART 250-4 (Merck, Darmstadt,
Germany) provided with precolumn LiChrospher 100 RP-18 (5 µm) (VWR international,
Radnor, PA, USA). Chromatographic analyses were conducted with a reverse phase binary
gradient [A: 1.6 L sodium acetate solution/glacial acetic acid (50 mmol L-1; pH 6.2), 50 mL
MeOH (Lichrosolv®, gradient grade, Merck, Darmstadt, Germany), 20 mL tetrahydrofuran
(Lichrosolv®; gradient grade, Merck, Darmstadt, Germany); B: 200 mL sodium acetate
solution/glacial acetic acid (50 mmol L-1; pH 6.2), 800 mL MeOH (Lichrosolv®, gradient grade,
Merck, Darmstadt, Germany)] at a flow rate of 1.3 mL min-1.
The OPA derivatization procedure was performed according to Rohsius et al. (2006). Twenty
microliters of the derivative samples were injected into the column for separation and were
subsequently detected with the Hitachi F-1050 Fluorescence Spectrophotometer (Triad
Scientific, Manasguan, NJ, USA) (λex = 334 nm, λem = 425 nm). The column temperature was
30 °C. The autosampler was from Merck-Hitachi AS-4000 (Darmstadt, Germany). The
solution degasser consisted of the Degassex DG-4400 from Phenomenex (Torrance,
California, USA). Quantification was carried out by calculating the peak area of
chromatograms from standard mixtures containing 1–10 pmol µL-1 of each amino acid. Total
free amino acid concentrations were obtained by summation of the individual amino acid
concentrations.
3.11.4 Measurement of polyphenols and anthocyanins
3.11.4.1 Preparation of the samples
Polyphenol and anthocyanins contents were analysed according to the method described by
Niemenak et al. (2006) and Elwers et al. (2009). Two grams of freeze-died fermented cocoa

M a t e r i a l a n d M e t h o d s | 68
beans were milled to a powder with a particle size of ca. 1 µm3 in a Retsch MM 200 (Haan,
North Rhine-Westphalia, Germany) laboratory mill using 10 mL n-hexane for fat removal.
The pulverised sample was then rinsed 2 twice with 50 mL petroleum in a Buchner funnel to
reduce the residual fat content to ≤5%. Subsequently, the defatted powder was dried in a
vacuum oven (Heraeus, Hanau, Germany) at room temperature and 100 mbar (Niemenak
et al. 2006; Elwers et al. 2009).
3.11.4.2 Preparation of the standards
Epicatechin and quercetin were obtained from Sigma (St. Louis, Missouri, USA).
Protocatechiuc acid and catechin were from Aldrich (St. Louis, Missouri, USA) and Fluka
(St. Louis, Missouri, USA), respectively. 3-a-L-arabinosyl cyanidinin and 3-b-D-galactosyl
cyanidin were purchased from Polyphenols AS (Sandnes, Rogaland, Norway). All solvents
used were of analytical grade purchased from Merck (Darmstadt, Germany). Water was
purified in a Milli-Q water purification system (Millipore, Bedford, MA, USA).
3.11.4.3 Measurement of polyphenols and anthocyanins
For RP-HPLC analysis, 100 mg of the defatted cocoa powder were weighed in a centrifuge
tube (16 x 100 mm2), 3 mL of methanol were added and the mixture stirred for 20 – 30 s
with an ULTRA-TURRAX® T25 (Ika Labortechnik, Staufen, Germany) agitator. The agitator was
then rinsed with 2 mL methanol and the solutions were combined. The centrifuge tube was
cooled for 15 min at 0 °C and then centrifuged in Megafuge 11R (Heraeus, Hanau, Germany)
for 10 min at 2.683 x g. The methanolic supernatant containing phenolic compounds was
decanted into a 50 mL pear-shaped flask. The extraction was repeated 3 additional times,
with a cooling phase of only 2 min.
The methanol was removed from the combined extracts by rotary evaporation under partial
vacuum at 40 °C and 100 mbar. Subsequently, the residue was dissolved in 3.0 mL methanol
(Lichrosolv®, Merck, Darmstadt, Germany). The sample was transferred into an HPLC vial
through a 0.45 µL syringe filter PTFE Multoclear® (CS-Chromatographie, Langerwehe, North
Rhine-Westphalia, Germany). The vial was sealed hermetically and the sample stored at
-20 °C until further analysis.

M a t e r i a l a n d M e t h o d s | 69
Chromatographic analyses were carried out on a HPLC system equipped with an AS-4000
(Merck Hitachi, Darmstadt, Germany) automatic injector, two Knauer (Berlin, Germany)
HPLC pumps 64, a Knauer HPLC programme 50 solvent controller and, a Waters (Eschborn,
Hesse, Germany) 996 Photodiode Array Detector (PDA) and were analysed by means of
Millennium TM 3.2 software (Millipore, Milford, MA, USA). The separation of the
polyphenols was performed on a Waters Novapac C18 (3.9 x 300 mm2; endcapped) column
at 26 °C. The binary mobile phase (Tab. 3.15) consisted of 2% acetic acid in water (A) and a
mixture of acetonitrile, water and concentrated acetic acid (400:90:10 v/v/v) (B).
Twenty microliters of sample was injected onto the column. The separation of polyphenols
was monitored using a PDA detector at 280nm and anthocyanins were recorded at 520 nm.
The identity of each peak was confirmed by comparing the retention time and coelution with
authentic standards for protocatechiuc acid, catechinhydrate, epicatechin, quercetin,
cyanidin-3-galactoside and cyanindin-3-arabinoside.
Table 3.15 RP-HPLC gradients used for the separation of cocoa seed polyphenoles and
anthocyanins present in cocoa beans
Time (min) Flow rate (mL min-1) A (%) B (%)
0 1.2 90 10
8 1.2 90 10
38 1.1 77 23
50 1 60 40
70 1 10 90
73 1 10 90
78 1.2 90 10
93 1.2 90 10

M a t e r i a l a n d M e t h o d s | 70
3.12 Extraction of the seed coat slime
3.12.1 Preparation of the seed coat slime from different times of fermentation
Five-hundred gram samples of cocoa bean fermentations were obtained at different times
during box fermentation in PTPN XII, Jember, East Java, Indonesia specifically after 0 h (D0),
24 h (D1), 48 h (D2), 72 h (D3) and 96 h (D4) of fermentation.
To remove the pulp from the beans, each sample was soaked in pectinase enzyme diluted in
an equal amount of water to the cocoa seed sample. Subsequently, the mixture was
incubated in a rotary shaker GFL 3015 (Burgwedel, Hanover, Germany) overnight at 200 rpm
at room temperature. Afterwards, the solution containing the pulp was removed from the
seeds. The seeds without pulp were soaked in water of equal volume overnight at room
temperature. Finally, the seed coat slime was harvested from the seeds using a stainless
steel flour sieve and kept at -20 °C until use.
3.12.2 Preparation of the seed coat slime from different cocoa varieties
Five-hundred gram samples of cocoa bean fermentations were obtained from different
varieties of cocoa Forastero (F) and Trinitario (T) provided by the Indonesia Coffee and Cocoa
Research Institute (ICCRI), Jember, East Java, Indonesia.
To remove the pulp from the beans, each sample was soaked in pectinase enzyme diluted in
an equal amount of water to the cocoa seed sample. Subsequently, the mixture was
incubated in a rotary shaker GFL 3015 (Burgwedel, Hanover, Germany) overnight at 200 rpm
at room temperature. Afterwards, the solution containing the pulp was removed from the
seeds. The seeds without pulp were soaked in water of equal volume overnight at room
temperature. Finally, the seed coat slime was harvested from the seeds using a stainless
steel flour sieve and kept at -20 °C until use.
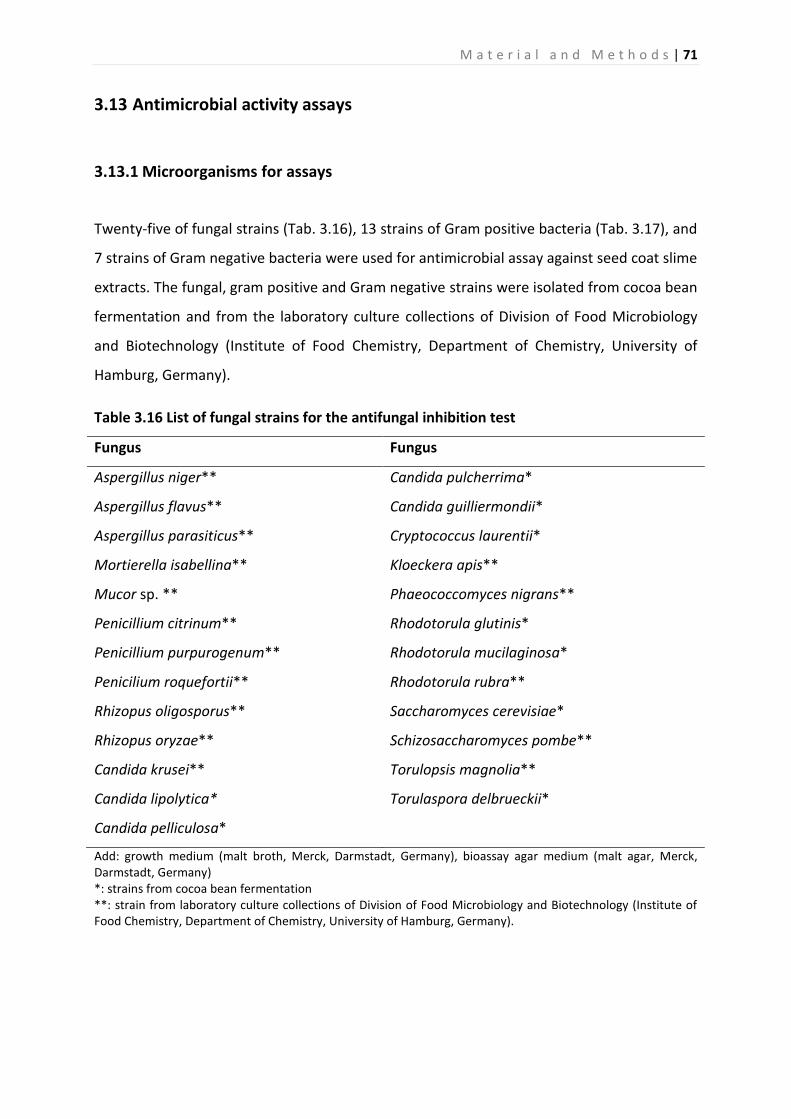
M a t e r i a l a n d M e t h o d s | 71
3.13 Antimicrobial activity assays
3.13.1 Microorganisms for assays
Twenty-five of fungal strains (Tab. 3.16), 13 strains of Gram positive bacteria (Tab. 3.17), and
7 strains of Gram negative bacteria were used for antimicrobial assay against seed coat slime
extracts. The fungal, gram positive and Gram negative strains were isolated from cocoa bean
fermentation and from the laboratory culture collections of Division of Food Microbiology
and Biotechnology (Institute of Food Chemistry, Department of Chemistry, University of
Hamburg, Germany).
Table 3.16 List of fungal strains for the antifungal inhibition test
Fungus Fungus
Aspergillus niger**
Aspergillus flavus**
Aspergillus parasiticus**
Mortierella isabellina**
Mucor sp. **
Penicillium citrinum**
Penicillium purpurogenum**
Penicilium roquefortii**
Rhizopus oligosporus**
Rhizopus oryzae**
Candida krusei**
Candida lipolytica*
Candida pelliculosa*
Candida pulcherrima*
Candida guilliermondii*
Cryptococcus laurentii*
Kloeckera apis**
Phaeococcomyces nigrans**
Rhodotorula glutinis*
Rhodotorula mucilaginosa*
Rhodotorula rubra**
Saccharomyces cerevisiae*
Schizosaccharomyces pombe**
Torulopsis magnolia**
Torulaspora delbrueckii*
Add: growth medium (malt broth, Merck, Darmstadt, Germany), bioassay agar medium (malt agar, Merck, Darmstadt, Germany) *: strains from cocoa bean fermentation **: strain from laboratory culture collections of Division of Food Microbiology and Biotechnology (Institute of Food Chemistry, Department of Chemistry, University of Hamburg, Germany).

M a t e r i a l a n d M e t h o d s | 72
Table 3.17 List of Gram-positive bacteria strains for the antimicrobial test
Gram positive bacteria Growth medium Bioassay medium
Bacillus subtilis ATCC 6633
Micrococcus luteus DSM 1790
Staphylococcus aureus LMH 5P
Streptococcus thermophilus LMH 5P
Lactobacillus plantarum LMH 13P
Lactobacillus plantarum DSM 20205
Lactobacillus acidophilus LMH 16P
Lactobacillus casei ssp. casei LMH 17P
Lactobacillus fermentum DSM 20052
Lactobacillus reuteri DSM 20016
Lactobacillus delbrueckii ssp. lactis DSM 20355
Propionibacterium freudenreichii DSM 20271
Propionibacterium shermanii DSM 20270
Nutrient broth
Nutrient broth
Nutrient broth
Nutrient broth
MRS broth
MRS broth
MRS broth
MRS broth
MRS broth
MRS broth
MRS broth
MRS broth
MRS broth
Nutrient agar
Nutrient agar
Nutrient agar
Nutrient agar
MRS agar
MRS agar
MRS agar
MRS agar
MRS agar
MRS agar
MRS agar
MRS agar
MRS agar
Add: All gram positive bacteria were from laboratory culture collections of Division of Food Microbiology and
Biotechnology (Institute of Food Chemistry, Department of Chemistry, University of Hamburg, Germany).
Table 3.18 List of Gram-negative bacteria strains for the antimicrobial test
Gram-negative bacteria Growth medium Bioassay medium
Eschericia coli**
Acetobacter pasteurianus*
Acetobacter tropicalis*
Acetobacter pomorum*
Acetobacter peroxydans**
Gluconobacter frateurii**
Acetobacter orientalis*
Nutrient broth
GYP broth
GYP broth
GYP broth
GYP broth
GYP broth
GYP broth
Nutrient agar
GYP agar
GYP agar
GYP agar
GYP agar
GYP agar
GYP agar
*: strains from cocoa bean fermentation **: strain from laboratory culture collections of Division of Food Microbiology and Biotechnology (Institute of Food Chemistry, Department of Chemistry, University of Hamburg, Germany).

M a t e r i a l a n d M e t h o d s | 73
3.13.2 Preparation of the seed coat slime solution for assays
One gram of surface-sterilizied seed coat slime (see Section 3.12.1) was shaken in 10 mL
sterile distilled water overnight and the liquid was decanted and filtered through Whatman
No. 4 paper (Macherey-Nagel, Düren, Germany). Afterwards, the seed coat slime solution
was filtered with microfilter 0.20 µm (Macherey-Nagel, Düren, Germany) to remove
microbes which may have contaminated the sample. Thus, the concentration of the final
extract was 100 mg mL-1. To obtain a lower concentration the sample was further diluted
with sterile distilled water.
3.13.3 Antimicrobial assay against molds
The antifungal assay was carried out using agar diffusion methods as described by Ye et al.
(2000) with slight modifications. All mold cultures were grown on malt slant agar (Merck,
Darmstadt, Germany) for 48-72 h at 25 °C. After growth of mycelia, 5 mL sterile water
supplemented with 0.1% Tween 20 (Merck, Darmstadt, Germany) were added. Then, the
conidia were carefully rubbed with a sterile cotton swab and transferred with a pipette to a
sterile tube. Afterwards, the suspension was adjusted with sterile distilled water to produce
a mold spore suspension of 1–5x10⁶ CFU mL-1 by counting the conidia in a Haemocytometer
chamber (Glaswarenfabrik Karl Hecht, Rhön, Germany). The suspension was loaded onto a
sterile cotton swab (Heinz Herenz Medizinalbedarf, Hamburg, Germany) that was rotated
several times and pressed firmly against the inside wall of the tube to remove excess
inoculum from the swab. The dried surface of a malt agar plate was inoculated by streaking
the swab over the entire sterile agar surface (Ye et al. 2000).
This procedure was repeated two more times, rotating the plate approximately 60° each
time to ensure a uniform distribution of the inoculum. Subsequently, sterile blank paper
discs 6.5mm (Mast Group, Merseyside, UK) were impregnated with 50 µL seed coat slime
solution (100 mg mL-1). The discs were allowed to be permeated by the seed coat slime
solution at room temperature for 2-3 min and were then placed onto the surface of the agar.
The plates were incubated at 25 °C for 48–72 h. The zone diameter was read to the nearest
whole millimeter at the point at which a sharp reduction in growth occurs. The control was
sterile distilled water.

M a t e r i a l a n d M e t h o d s | 74
3.13.4 Antimicrobial assay against yeasts
The antifungal assay was carried out using agar diffusion methods as described by Ye et al.
(2000) with slight modifications. Agar diffusion was carried out with malt agar (Merck,
Darmstadt, Germany). The inoculum was prepared using 24–48 hour plate cultures. The
colonies were suspended in 0.85% saline (Merck, Darmstadt, Germany) and the turbidity
was compared with the 0.5 McFarland standard (bioMérieux®, SA, Marcy-l'Étoile, France) to
produce a yeast suspension of 1-5x10⁶ CFU mL-1. The concentration of the cell suspension for
the assay was 1-5x10⁵ CFU mL-1. The suspension was loaded onto a sterile cotton swab
(Heinz Herenz Medizinalbedarf, Hamburg, Germany) that was rotated several times and
pressed firmly against the inside wall of the tube to remove excess inoculum from the swab.
The dried surface of a malt agar plate was inoculated by streaking the swab over the entire
sterile agar surface (Ye et al. 2000).
This procedure was repeated two more times, rotating the plate approximately 60° each
time to ensure a uniform distribution of the inoculum. Afterwards, blank paper discs 6.5mm
(Mast Group, Merseyside, UK) were prepared, and the seed coat slime solution was added at
a concentration of 50 mg mL-1, with a final volume of 50 µL. The plates were incubated at
25 °C for 24–48 h. The zone diameter was read to the nearest whole millimeter at the point
at which a sharp reduction in growth occurs. The control was sterile distilled water.
3.13.5 Antimicrobial activity assay against Gram-positive and Gram-negative
bacteria
The antimicrobial assay was carried out using agar diffusion methods as described by
Pongtharabfkul and Demirci (2004) with slight modifications. All strains (Tab. 3.17, 3.18)
were taken from the laboratory culture collections of the Division of Food Microbiology and
Biotechnology (Institute of Food Chemistry, Department of Chemistry, University of
Hamburg, Germany). All stock cultures were maintained at −80 °C in 20% glycerol. The
working cultures were maintained on agar slants of the same media at 4 °C.
The bioassay agar plates prepared for Gram-positive and Gram-negative bacteria used the
optimal media for each culture (Tab. 3.17, 3.18). In each medium, 0.75% agar-agar (Merck)
and 1% Tween 20 (J.T. Baker, Phillipsburg, NJ, USA) were added before boiling and sterilizing.

M a t e r i a l a n d M e t h o d s | 75
After autoclaving, the agar medium was cooled down to 40 °C and inoculated with 1% of
each 24 h culture. To ensure that the same numbers of cells of each culture were inoculated
into the agar medium each time, the inoculum size was adjusted to reflect an optical cell
density reading of 1.7 at 600 nm. The corresponding diluted media used for each culture
were used as blanks for optical density measurements. The final population of each culture
was approximately 108 CFU mL-1 agar medium. The bioassay agar (25 mL) was aseptically
poured into sterile petri dishes (100×15 mm) and allowed to solidify for 3 h. Four holes were
bored on each plates using a 7-mm outer diameter stainless steel borer with slight suction
applied.
After placing 100 μL of the 100 mg mL-1 seed coat slime solution into the holes, the agar
plates were stored at 4 °C for 24 h to allow for the pre-diffusion of the seed coat slime
solutions and were then incubated at 30 °C for another 24 h. The diameter of the inhibition
zone around each well was measured horizontally and vertically using a digital caliper
(lsr tools, Hückeswagen, Germany) to the nearest 0.01 mm and averaged. Each culture was
replicated and evaluated three times (Pongtharangkul and Demirci 2004).
3.14 Minimum inhibitory concentration against molds and yeasts
The antifungal activity of seed coat slime was investigating using the agar diffusion and broth
microdilution methods.
3.14.1 Agar diffusion methods
The seed coat slime (see Section 3.13.2), inoculum (see Section 3.13.3, 3.13.4) and medium
assay were prepared as described before (see Section 3.13.3, 3.13.4).
For the agar diffusion method, sterile blank paper discs 6.5mm (Mast Group, Merseyside,
UK) were impregnated with 50 µL seed coat slime solution with different concentrations
(100, 75, 50, and 25 mg mL-1 and 40, 30, 20 and 10 mg mL-1) for molds and yeasts,
respectively. The discs were allowed to be permeated by the seed coat slime solution at
room temperature for 2-3 min. Subsequently, discs with different concentrations of the seed

M a t e r i a l a n d M e t h o d s | 76
coat slime solution were placed onto the surface of the agar inoculated with the test molds
and yeasts. The plates were incubated at 25 °C for 48–72 h. The zone diameter was read to
the nearest whole millimeter at the point at which a sharp reduction in growth occurs. The
control was sterile distilled water.
3.14.2 Broth microdilution methods
3.14.2.1 Broth microdilution for molds
The broth microdilution was performed as described by Scorzoni et al. (2009) with
modification. The seed coat slime solution was prepared as described before (see Section
3.13.2). The inoculum was prepared as described above (see Section 3.13.3), the
concentration of cells used in this study was 1-5x10⁵ CFU mL-1. The medium used in this
study was malt broth (Merck, Darmstadt, Germany).
A total volume of 100 µL malt broth (Merck, Darmstadt, Germany) was placed into the
microplate reader Nunc™ MicroWell™ 96-Well Microplates (Fermentas, St. Leon-Rot, Baden-
Württemberg, Germany). One-hundred microliters of different concentrations of seed coat
extract (100, 75, 50, and 25 mg mL-1) were added to the medium in the microplate reader.
Afterwards, the microplate was incubated at 35 °C with medium agitation using the
Absorbance Microplate Reader ELx808TM (Biotek®Instruments, Montpelier, VT, USA). The
optical density of the growing fungi was read every 12 h until 48 h at an absorbance 530 nm
using the Absorbance Microplate Reader ELx808TM, (Biotek®Instruments, Montpelier, VT,
USA). Data were analyzed using Gen5 2.0 (Biotek®Instruments, Montpelier, VT, USA)
(Riesselman et al. 2000; Scorzoni et al. 2009).
One hundred microliter of 2 mg mL-1 propionic acid were added to 100 µL malt broth
(Merck, Darmstadt, Germany) as a positive control, while 100 µL sterile distilled water were
added to 100 µL malt broth (Merck, Darmstadt, Germany) as a negative control.
3.14.2.2 Broth microdilution for yeasts
The broth microdilution was performed as described by Scorzoni et al. (2009) with
modifications. The seed coat slime solution was prepared as described above (see Section

M a t e r i a l a n d M e t h o d s | 77
3.13.2). The inoculum was prepared as described above (see Section 3.13.4), concentration
of cell used in this study was 1-5x10⁵ CFU mL-1. The medium used in this study was malt
broth (Merck, Darmstadt, Germany).
A total volume of 100 µL malt broth (Merck, Darmstadt, Germany) was placed into the
microplate reader Nunc™ MicroWell™ 96-Well Microplates (Fermentas, St. Leon-Rot, Baden-
Württemberg, Germany). One-hundred microliters of different concentrations of seed coat
extract (40, 30, 20, and 10 mg mL-1) were added to the medium in the microplate reader.
Afterwards, the microplate was incubated at 35 °C with medium agitation using the
Absorbance Microplate Reader ELx808TM (Biotek®Instruments, Montpelier, VT, USA). The
optical density of the growing fungi was read every 12 h until 48 h at an absorbance 530 nm
using the Absorbance Microplate Reader ELx808TM (Biotek®Instruments, Montpelier, VT,
USA). Data were analyzed using Gen5 2.0 (Biotek®Instruments, Montpelier, VT, USA)
(Riesselman et al. 2000; Scorzoni et al. 2009).
One hundred microliter of 2 mg mL-1 propionic acid were added to 100 µL malt broth
(Merck, Darmstadt, Germany) as a positive control, while 100 µL sterile distilled water were
added to 100 µL malt broth (Merck, Darmstadt, Germany) as a negative control.
3.15 Biochemical analyses of seed coat slime proteins
3.15.1 Quantitative determination of protein content
The measurement of the concentrations of protein solutions was carried out using the
Bradford protein assay. This method is based on the shift in the absorbance of the
Coomassie Brilliant Blue G-250 dye (absorbs at 595 nm), when the previously red form of the
Coomassie reagent (absorbs at 465 nm) changes and stabilizes into Coomassie blue
(Bradford 1976).
One-hundred microliters of seed coat slime protein were added to 1 mL Bradford solution
(see below), mixed well and incubated for 15 min at RT in the dark. The extinction was
measured at a wavelength of 595 nm with a SmartSpec™ Plus Spectrometer (BIO RAD,
Hercules, CA, USA). H2Obidest was used as a control. The extinctions were compared with a

M a t e r i a l a n d M e t h o d s | 78
standard curve made with concentrations of BSA between 10 and 150 mg mL-1 as a
reference protein and the corresponding concentrations were calculated.
Coomassie Brilliant Blue G-250 100 mg
Ethanol (95%, v/v) 50 mL
H3PO4 (85%, w/v) 100 mL
H2Obidest ad 1000 mL
3.15.2 SDS-polyacrylamide gel electrophoresis (SDS-PAGE)
All chemical reagents for SDS-PAGE were purchased from Bio-Rad (Bio-Rad, Munich,
Germany).
The protein solutions were analyzed by SDS-PAGE. SDS is an anionic amphipathic substance
that binds to polypeptides. It denatures and confers an almost evenly distributed charge.
The denatured proteins can migrate in the electromagnetic field through the matrix. The
electrophoretic mobility is a function of the length of a polypeptide chain and its charge.
Smaller polypeptides move faster through the matrix than bigger ones. Mini-Protean
equipment (BioRad, Munich, Germany) was used for preparing the gels and carrying out the
electrophoresis.
3.15.2.1 Preparation of denaturing SDS-polyacrylamide gels
Discontinuous gels with a 7% stacking gel and a 12 or 15% separating gel were prepared.
After cleaning both with 70% EtOH, a spacer plate was put together with a short plate and
arrested in a casting frame. The glass plate sandwich was clamped in a casting stand and
loaded with approximately 5 mL separating gel (Tab. 3.19). The gel was overlaid with a thin
wall of water in order to obtain a smooth gel surface and to ensure nearly anoxic
polymerization. After ca. 30 min, the water was removed with a tissue and the stacking gel
(Tab. 3.19) was applied on the separating gel. A comb with 10 molds was set in the stacking
gel before its polymerization. After ca. 20 min, the comb was removed and the gel was ready
for electrophoresis. After the glass plates with the SDS-gel were loaded into a Mini-Protean
(BioRad, Munich, Germany) inner chamber they were put horizontally into an
electrophoresis tank filled with running buffer (Laemmli 1970).

M a t e r i a l a n d M e t h o d s | 79
3.15.2.2 Composition of the SDS-PAGE gel
Preparation of the SDS-PAGE stock solution
Acrylamide stock solution 10% SDS solution
Acrylamide
N’N’-bis-methylene-acrylamide
H2Obidest ad
29.2 g
0.8 g
100 mL
10 g SDS in 100 H2Obidest
Resolving gel stock solution 10% APS solution
Tris base
H2Obidest ad
pH 8.8 (with 6 N HCl)
18.15 g
100 mL
0.1 g APS in 1 mL
Stacking gel stock solution N,N,N’,N’-Tetramethylene ethylene diamine
Tris base
H2Obidest ad
pH 6.8 (with 6 N HCl)
6.0 g
100 mL
(TEMED) supplied by Bio-Rad Laboratories
(Munich, Germany)
10x electrophoresis running
buffer
2x Laemmli Sample Buffer #161-0737
Tris base
Glycine
SDS
H2Obidest ad
pH 8.3 (with Glycine)
30.3 g
144.0 g
10.0 g
1 L
Tris-HCl, pH 6.8
Glycerol
SDS
Bromophenol blue
2-mercaptoethanol
65.8 mM
26.3% (w/v)
2.1%
0.01%
355 mM

M a t e r i a l a n d M e t h o d s | 80
Table 3.19 Composition of the SDS-PAGE gels used in this study
Component Resolving gel (12%) Stacking gel (7%)
H2O 1650 µL 1700 µL
Acrylamide stock solution 2000 µL 415 µL
Resolving gel stock solution 1250 µL -
Stacking gel stock solution - 315 µL
10% SDS 75 µL 25 µL
10% APS 75 µL 25 µL
TEMED 3 µL 2.5 µL
3.15.2.3 Preparation of protein samples and SDS-PAGE gel electrophoresis
Aliquots of 15 μL of obtained protein extracts were mixed with 15 μL 2x Laemmmli sample
buffer (#161-0737, Bio-Rad, Munich, Germany), mixed well and incubated at 95 °C for 5 min.
After centrifugation at 13.000 x g for 2 min in Eppendorf 5417R (Eppendorf, Hamburg,
Germany), samples were applied to the wells of the SDS-gel. For detection of molecular
masses, protein bands were compared with the bands of a protein molecular weight marker
(Precision Plus Protein All Blue Standards, #161-0373, Bio-Rad, Munich, Germany) which was
also applied to the SDS-gel (Laemmli 1970).
The chamber was filled with 1x electrophoresis buffer. Aliquots of 20 μL of each sample were
then loaded carefully into the gel pockets and the electrophoresis was carried out at 20 mA
for the stacking gel and was increased to 40 mA for the resolving gel.
3.15.2.4 Coomassie staining of SDS-PAGE gels
Following electrophoresis, the gel was carefully removed from the glass plates and stained
overnight with Coomassie Brilliant Blue R250 under gentle shaking using the Polymax 1040
(Heidolph Instruments, Schwabach, Germany). The gel was destained for about 3 h with
destaining solution.

M a t e r i a l a n d M e t h o d s | 81
Staining solution (L): Destaining solution (L)
Coomassie Brilliant Blue R250 1 g
Methanol 400 mL
Acetic acid 100 mL
H2Obidest 500 mL
Methanol 200 mL
Glacial acetic acid 100 mL
H2Obidest 700 mL
3.15.3 Precipitation of seed coat slime proteins
After extraction, 40 mL seed coat slime were precipitated with 80% acetone in a 250 mL
centrifuge acetone resistant bottle and mixed well. Subsequently, the mixture was
precipitated for 48 hours at -20 °C. Afterwards, the mixture was centrifuged in a Sorvall RC
5C Plus (Kendro laboratory, Newtown, Connecticut, USA) at 25.673 x g for 20 min at 4 °C.
Finally, the pellet was dried at room temperature for about 3-4 hours.
3.15.4 Extraction of seed coat slime proteins
Extractions of seed coat slime protein were obtained by using the phenol based procedure
as described by Noah et al. (2012) with slight modifications. One-hundred miligrams
precipitated seed coat slime protein were vortexed using Vortex Genie®2 (MO BIO
Laboratories, Carlsbad, CA, USA) together with glass beads (innuSPEED Lysis Tube J, Analytik
Jena, Jena, Germany) for 10 min at full speed. Afterwards, the mixture was dissolved in
0.75 mL extraction buffer and 0.75 mL phenol buffered at 7.5 with Tris-EDTA. The mixture
was then incubated for 1 h at 0 °C. After incubation, the mixture was centrifugated in a
Eppendorf 5417R (Eppendorf, Hamburg, Germany) at 13.000 x g for 20 min at 4 °C. Finally,
the upper surface containing the seed coat slime proteins was collected (Noah et al. 2012).
Precipitations of the seed coat slime protein were performed using an ammonium acetate
based procedure described by Colditz et al. (2004). After extraction, the proteins were
precipitated with five times their volume in 100 mM ammonium acetate solubilized in
methanol at -20 °C overnight, and then centrifuged in a Eppendorf 5417R (Eppendorf,
Hamburg, Germany) at 13.000 x g for 20 min at 4 °C. The pellet was washed three times with
cold 100 mM ammonium acetate in methanol, centrifuged in an Eppendorf 5417R centrifuge

M a t e r i a l a n d M e t h o d s | 82
(Eppendorf, Hamburg, Germany) at 4.000 x g for 4 min at 4 °C and once with cold 80%
acetone in a Eppendorf 5417R (Eppendorf, Hamburg, Germany) at 4.000 x g for 4 min at 4 °C.
Finally, the protein mixture was dried at room temperature for 1 h and stored at -20 °C until
use. Before being used as a SDS-PAGE sample, the protein solution was resuspended in 50 µL
SDS-PAGE sample buffer and dissolved by incubation at 37 °C for 1 h (Colditz et al. 2004).
Buffer extraction
Sucrose 700 mM
Tris 500 mM
EDTA 50 mM
KCl 100 mM
β-mercaptoethanol 2% (v/v)
PMSF 2 mM
pH adjusted to 8.0
3.15.5 Separation of seed coat slime proteins with SDS-PAGE electrophoresis
Protein samples from different fermentation times (0 h (D0), 24 h (D1), 48 h (D2), 72 h (D3)
96 h (D4)) and from different varieties (Forastero (F), and Trinitario (T)) were prepared and
electrophoresed using the methods described above (see Section 3.15.2 – 3.15.4).
3.15.6 Identification of seed coat proteins with mass spectrometry
Preparation of solutions
AmBiCa stock solution
1.186 g ammonium bicarbonate
add 15 mL distilled water (d H2O)
Trypsin solution
dissolve 20 μg Trypsin in 50 μL reconstitution
buffer (kit)

M a t e r i a l a n d M e t h o d s | 83
Digest buffer
750 μL AmBiCa stock solution
add 1.5 mL ACN
add 15 mL d H2O (12.75 mL)
Shrinking solution
750 μL AmBiCa stock solution
add 9 mL ACN
add 15 mL dH2O (5.25 mL)
Swelling solution
1.5 mL AmBiCa stock solution
add 15 mL distilled water (13.5 mL)
Digest solution
0.4 μL Trypsin solutions add 20 μL digest
buffer (19.6 μL) for one sample!
5 % formic acid solution
0.5 mL formic acid (FA) (85 %)
add 10 mL d H2O (9.5 mL)
Squeeze solution
7.5 mL ACN
add 0.5 mL formic acid (85 %)
30 % ACN solution
3 mL ACN add 10 mL d H2O (7 mL)
0.2 % formic acid solution
20 μL formic acid (85 %)
add 10 mL (9.98 mL) dH2O
60 % ACN solution
6 mL ACN add 10 mL d H2O (4 mL)
Bands of interest were excised, the proteins reduced with 200 µL shrinking solution (1 mM
NH4HCO3, 9 mL acetonitrile, 5.25 mL dH2O), samples were incubated at room temperature
for 30 min, and 200 µL swelling solution (0.1 mM NH4HCO3), incubation at room
temperature for 20 min, and the protein digested in-gel with trypsin [20 µg trypsin were
dissolved in 50 µL resuspension buffer (50 mM acetic acid), 0.4 µL of the trypsin solution
(modified trypsin, Promega, Madison, Wisconsin, USA) add 20 µL digest buffer (50 mM
NH4HCO3), 37 °C, overnight]. After digestion, the reaction was stopped by adding 1 µL of 5%
formic acid solution. The supernatant was transferred into a new cup. The remaining gel
pieces were repeatedly extracted (50 % acetonitrile and 5 % formic acid). The combined
extracts were then dried down in a vacuum concentrator, redissolved in 30 % acetonitrile
and 0.2 % formic acid and desalted on a C18 microZipTip (Millipore, Billerica, Massachusetts,
USA), conditioned with 60% acetonitrile and equilibratined with 0.2 % formic acid.

M a t e r i a l a n d M e t h o d s | 84
Desorption of the peptides was carried out with 60% acetonitrile. Samples were analysed by
nano-electrospray mass spectrometry in a QTOF II instrument (Micromass, Manchester, UK).
The MS/MS spectra of the peptides obtained by collision-induced fragmentation were
evaluated both manually and by the Mascot MS/MS ion search algorithm (Matrix Sciences,
London, UK) (Makrypidi et al. 2012).
3.15.7 Temperature stability of the seed coat slime extract
To study the temperature stability of the seed coat slime proteins, 40 mL of seed coat slime
protein mixture were incubated for 24 h at different temperatures (30, 40 and 50 °C). After
incubation, seed coat slime proteins were extracted using the methods described above.
Then the protein was used as a sample for SDS-PAGE analysis as described above (see
Section 3.15.2 – 3.15.4).

| 85
4 Results
4.1 Dynamics and biodiversity of the populations of yeasts, lactic acid
bacteria (LAB) and acetic acid bacteria (AAB) involved in the
spontaneous box fermentation of cocoa beans in Nusantara Plantation
XII (PTPN XII), East Java, Indonesia
4.1.1 Changes in temperature and pH during cocoa bean fermentation
The initial temperature of cocoa bean box fermentation was 28 °C, which gradually
increased after 24 h of fermentation. This correlated with the increased numbers of AAB
after mixing of the fermenting cocoa beans at 24, 48 and 72 h. The temperature increased
from 28 to 34 °C and reached a maximum value of 48 °C at the end of fermentation.
Figure 4.1 Changes in temperature and pH during cocoa bean fermentation
The initial pH of the pulp was 3.8, before increasing after 24 h of fermentation to 4.0,
probably due to the degradation of citric acid by yeasts during the first 24 h of fermentation.
Afterwards, the pH fell again to 3.8 as a consequence of the production of lactic and acetic
acid. At the end of the fermentation, the pH increased to a value of 4.3. In contrast to the
3.0
3.5
4.0
4.5
5.0
5.5
6.0
6.5
7.0
0
10
20
30
40
50
60
0 24 48 72 96
pH
Tem
per
atu
re °
C
Fermentation time (h)
Temperature pH Pulp pH Beans

R e s u l t s | 86
pulp pH, the pH of the beans decreased during fermentation from an initial 6.2 to 4.7 by the
end of fermentation (Fig. 4.1).
4.1.2 Microbiological analysis of cocoa bean fermentation
A yeast population count of 105 CFU g-1 was present in the bean mass at the beginning of
fermentation. The size of the yeast population increased during the first 24 h and grew to a
maximum population of 108 CFU g-1. Upon prolonged fermentation, the yeast population
declined to 106 CFU g-1 (Fig. 4.2).
Figure 4.2 Microbiological analysis of cocoa bean fermentation
LAB population count increased during the first 48 h from an initial population of 106 CFU g-1
to a maximum population 109 CFU g-1. Afterwards, the LAB colonies decreased to 108 CFU g-1
and slightly decreased to 107 CFU g-1 at the end of fermentation (Fig. 4.2). AAB population
count increased slowly from an initial population of 105 CFU g-1 within the first 24 h of
fermentation. Then, beginning with the turning around of the cocoa beans every 20-24 h,
growth occurred rapidly, with a maximum population of 108 CFU g-1 after 72 h. Growth
remained at this level up to the end of fermentation (Fig. 4.2). Total bacterial population
1.0E+00
1.0E+02
1.0E+04
1.0E+06
1.0E+08
1.0E+10
0 24 48 72 96
Log 1
0 (
CFU
g-1
)
Fermentation time (h)
yeasts LAB AAB TPC

R e s u l t s | 87
count increased from an initial population of 106 CFU g-1 to a maximum population of
109 CFU g-1 after 24 h of fermentation. Growth remained at this level up to 72 h of
fermentation and decreased after that to 107 CFU g-1 until the end of fermentation (Fig. 4.2).
4.1.3 Yeast identification
Eighty yeasts isolated were identified based on DI/D2 large subunit (LSU) sequencing,
Including Saccharomyces cerevisiae (63 isolates; 78.75% of the total number of isolates,
isolation during 0 – 96 h fermentation), Hanseniaspora guilliermondii (3.75%; isolation from
24 and 48 h of fermentation), Torulaspora delbrueckii (3.75%; isolation from 24 and 48 h of
fermentation), Pichia kudriavzevii (2.5%; isolation from 24 h of fermentation),
Hanseniaspora opuntiae (1.25%; isolation from 24 h of fermentation), Candida tropicalis
(1.25%; isolation from 24 h of fermentation), Hanseniaspora thailandica (1.25%; isolation
from 24 h of fermentation), Issatchenkia orientalis (1.25%; isolation from 24 h of
fermentation) and Sporobolomyces roseus (2.5%; isolation from 96 h of fermentation) (Tab.
4.1).
Table 4.1 Yeasts species diversity
Yeast species Fermentation time, (h)
0 24 48 72 96
Saccharomyces cerevisiae 2 (2*) 23 (16*) 20 (14*) 3 (3*) 15 (10*)
Hanseniaspora guilliermondii 1 1 1
Torulaspora delbrueckii 2 1
Pichia kudriavzevii 2
Hanseniaspora opuntiae 1 1
Candida tropicalis 1 1
Hanseniaspora thailandica 1 1
Issatchenkia orientalis 1
Sporobolomyces roseus 2
*) Number of S. cerevisiae identified using 26S rRNA gene sequencing. Other strains of S. cerevisiae were identified by API ID 32C. All strains of other yeasts species were identified by 26S rRNA gene sequencing.

R e s u l t s | 88
Figure 4.3 Yeast population dynamics during fermentation
Yeasts were dominant during the first 24 h of cocoa bean mass fermentation. Ten different
yeasts species were detected. H. thailandica (107 CFU g-1), S. cerevisiae (107 CFU g-1),
H. opuntiae (107 CFU g-1), H. guilliermondii (107 CFU g-1), C. tropicalis (105 CFU g-1) were the
dominant yeast species during the first 24 h of fermentation. Other yeast species such as
P. kudriavzevii (107 CFU g-1) and I. orientalis (107 CFU g-1) also contributed to the beginning of
fermentation, though in smaller numbers. After 24 h, other yeast species such as
T. delbrueckii (107 CFU g-1) and S. roseus (106 CFU g-1) were found (Fig. 4.3).
1.E+00
1.E+02
1.E+04
1.E+06
1.E+08
1.E+10
0 24 48 72 96
Log
10 (
CFU
g-1
)
Fermentation time (h)
Saccharomyces cerevisiae Hanseniaspora guilliermondii Torulaspora delbrueckii
Pichia kudriavzevii Hanseniaspora opuntiae Candida tropicalis
Hanseniaspora thailandica Issatchenkia orientalis Sporobolomyces roseus
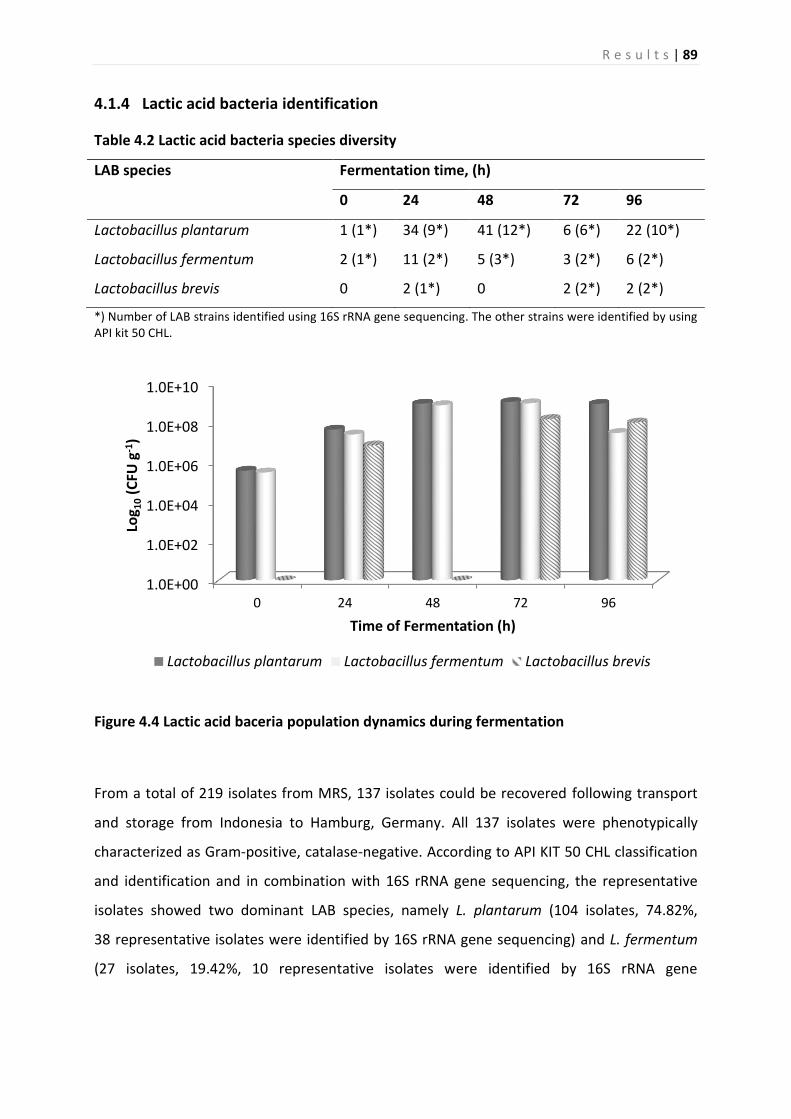
R e s u l t s | 89
4.1.4 Lactic acid bacteria identification
Table 4.2 Lactic acid bacteria species diversity
LAB species Fermentation time, (h)
0 24 48 72 96
Lactobacillus plantarum 1 (1*) 34 (9*) 41 (12*) 6 (6*) 22 (10*)
Lactobacillus fermentum 2 (1*) 11 (2*) 5 (3*) 3 (2*) 6 (2*)
Lactobacillus brevis 0 2 (1*) 0 2 (2*) 2 (2*)
*) Number of LAB strains identified using 16S rRNA gene sequencing. The other strains were identified by using API kit 50 CHL.
Figure 4.4 Lactic acid baceria population dynamics during fermentation
From a total of 219 isolates from MRS, 137 isolates could be recovered following transport
and storage from Indonesia to Hamburg, Germany. All 137 isolates were phenotypically
characterized as Gram-positive, catalase-negative. According to API KIT 50 CHL classification
and identification and in combination with 16S rRNA gene sequencing, the representative
isolates showed two dominant LAB species, namely L. plantarum (104 isolates, 74.82%,
38 representative isolates were identified by 16S rRNA gene sequencing) and L. fermentum
(27 isolates, 19.42%, 10 representative isolates were identified by 16S rRNA gene
1.0E+00
1.0E+02
1.0E+04
1.0E+06
1.0E+08
1.0E+10
0 24 48 72 96
Log 1
0 (
CFU
g-1
)
Time of Fermentation (h)
Lactobacillus plantarum Lactobacillus fermentum Lactobacillus brevis

R e s u l t s | 90
sequencing). Other species included L. brevis (6 isolates, 4.31%, 5 representative isolates
were identified by 16S rRNA gene sequencing).
Both L. plantarum and L. fermentum could be isolated from the beginning of fermentation
until the end of fermentation. The initial number of L. plantarum 106 CFU g-1 increased
during fermentation to a maximum of 109 CFU g-1 at 72 h of fermentation. L. fermentum
grew form 105 CFU g-1 initially to a maximum of 109 CFU g-1 at 72 h of fermentation. L. brevis
started to grow at 24 h of fermentation with initial number of 107 CFU g-1. At 48 h L. brevis
could not be found. It reached a maximum of of 108 CFU g-1 at 72 h of fermentation (Fig. 4.4).
4.1.5 Acetic acid bacteria identification
From a total of 145 isolates from GYP and Acetobacter medium, 112 isolates could be
recovered following transport and storage from Indonesia to Hamburg, Germany. All 112
isolates were phenotypically characterized as Gram-negative, oxidase-negative and catalase-
positive. According to API kit 50 CHL classification and identification and combined with 16S
rRNA gene sequencing, the representative isolates showed that two AAB species were
dominant, namely Acetobacter pasterianus (80 isolates, 71.42%, 22 representative isolates
were identified by 16S rRNA gene sequencing) and Acetobacter pomorum (25 isolates,
22.32%, 20 representative isolates were identified by 16S rRNA gene sequencing). Other
species were including Acetobacter ghanensis (5 isolates, 4.46%, 4 representative isolates
were identified by 16S rRNA gene sequencing), and Acetobacter tropicalis (2 isolates, 1.78%,
2 isolates were identified by 16S rRNA gene sequencing) (Tab. 4.3).
Table 4.3 Acetic acid bacteria species diversity
AAB species Fermentation time (h)
0 24 48 72 96
Acetobacter pasteurianus 11 (2*) 8 (3*) 16 (4*) 9 (1*) 36 (12*)
Acetobacter pomorum 3 (2*) 4 (2*) 5 (5*) 12 (11*)
Acetobacter tropicalis 2 (2*)
Acetobacter ghanensis 2 (1*) 3 (3*)
*) Number of AAB strains identified using 16S rRNA gene sequencing. The other strains were identified by using API kit 50 CHL.

R e s u l t s | 91
Figure 4.5 AAB population dynamics during fermentation
The most dominant isolates at the beginning of fermentation contained A. pasterianus in the
amount of 106 CFU g-1, which increased during fermentation to a maximum of 108 CFU g-1 at
72 h of fermentation, followed by A. pomorum in the amount of 106 CFU g-1, which also
increased during fermentation to a maximum of 108 CFU g-1 at 72 h of fermentation.
A. ghanensis was found at 48 h and 96 h of fermentation in amounts of 106 CFU g-1 and
107 CFU g-1, respectively. A. tropicalis was found at the end of fermentation in the amount of
107 CFU g-1 (Fig. 4.5).
4.1.6 Carbohydrates (sucrose, glucose, fructose, and mannitol)
Glucose (39.9 mg g-1) and fructose (43.6 mg g-1) were the main sugars found in fresh cocoa
pulp, sucrose was not detected in the pulp. From the start of fermentation up to 24 h,
glucose (from 39.9 to 5.34 mg g-1), fructose (from 43.6 to 7.8 43.6 mg g-1) were metabolized
in box fermentation, coinciding with the increased production of mannitol, ethanol, glycerol,
succinic acid, lactic acid and acetic acid (Fig. 4.6, 4.8).
1.0E+00
1.0E+02
1.0E+04
1.0E+06
1.0E+08
1.0E+10
0 24 48 72 96
Log 1
0 (
CFU
g-1
)
Time of Fermentation (h)
Acetobacter pasteurianus Acetobacter pomorum
Acetobacter tropicalis Acetobacter ghanensis

R e s u l t s | 92
Mannitol was detected in cocoa pulp at 24 h of fermentation with an initial concentration of
5.93 mg g-1. The mannitol concentration reached a maximum of 8.79 mg g-1 at 48 h of
fermentation. Afterwards, the concentration of mannitol decreased up to the end of
fermentation to a final concentration of 1.23 mg g-1 (Fig. 4.6).
Figure 4.6 Changes in carbohydrates during fermentation in the pulp
Figure 4.7 Changes in carbohydrates during fermentation in the beans
0
10
20
30
40
50
0 24 48 72 96
Car
bo
hyd
rate
s (m
g g-1
)
Fermentation time (h)
Sucrose Glucose Fructose Mannitol
0
2
4
6
8
10
12
0 24 48 72 96
Car
bo
hyd
rate
s (m
g g-1
)
Fermentation time (h)
Sucrose Glucose Fructose Mannitol

R e s u l t s | 93
In contrast to the pulp, sucrose (10.46 mg g-1) was found to be the main sugar of the cocoa
beans, and only low concentrations of glucose (1.1 mg g-1) and fructose (1.4 mg g-1) were
found in the fresh cocoa beans. Sucrose was slowly metabolized during fermentation and
decreased to a concentration of 3.04 mg g-1at the end of fermentation. In contrast to the
pulp, the concentration of glucose and fructose increased during fermentation until the end
of fermentation. The concentration of mannitol was variable during the course of
fermentation (Fig. 4.7).
4.1.7 Organic acids (citric acid, succinic acid, lactic acid, acetic acid)
Citric acid (16.56 mg g-1) was the main organic acid in fresh cocoa pulp; succinic acid, lactic
acid, acetic acid, ethanol, and glycerol were not detected in fresh cocoa pulp. From the start
of fermentation up to 24 h, citric acid (from 16.56 to 1.56 mg g-1) were metabolized in box
fermentation. Succinic acid, lactic acid and acetic acid with initial concentrations of 0.07, 0.9
and 1.9 mg g-1, respectively, where detected in the cocoa pulp after 24 h of fermentation.
The concentrations of succinic acid, lactic acid and acetic acid, 3.47, 5.69, and 11.53 mg g-1,
respectively, reached maximum concentrations at 72 h of fermentation and then decreased
up to the end of fermentation (Fig. 4.8).
Figure 4.8 Changes in organic acids during fermentation in the pulp
0
5
10
15
20
0 24 48 72 96
Org
anic
aci
ds
(mg
g-1)
Fermentation time (h)
Citric acid Succinic acid Lactic acid Acetic acid

R e s u l t s | 94
Figure 4.9 Changes in organic acids during fermentation in the beans
Citric acid in cocoa beans was slowly metabolized and decreased until the end of
fermentation, paralleled by increasing concentrations of succinic acid, lactic acid and acetic
acid with maximum concentrations of 4.8, 3.65 and 7.1 mg g-1 at the end of fermentation
(Fig. 4.9).
4.1.8 Ethanol and glycerol concentrations
The concentration of ethanol in the pulp reached a maximum concentration of 17.5 mg g-1
after 48 h of fermentation. At the end of fermentation, the ethanol concentration had
declined to 9.7 mg g-1. In contrast to the pulp, the ethanol concentration in the beans
increased continually until the end of fermentation, with a maximum concentration of
11.37 mg g-1 found at the end of fermentation (Fig. 4.10).
0
5
10
15
20
0 24 48 72 96
Org
anic
aci
ds
(mg
g-1)
Fermentation time (h)
Citric acid Succinic acid Lactic acid Acetic acid

R e s u l t s | 95
Figure 4.10 Changes in ethanol and glycerol during fermentation in the pulp
Figure 4.11 Changes in ethanol and glycerol during fermentation in the beans
The concentration of glycerol increased almost simultaneously in the pulp and beans during
the course of fermentation. The maximum concentration of glycerol was 4.5 and 1.57 mg g-1
in the pulp and beans, respectively. At the end of fermentation, the concentration of glycerol
decreased to minimum concentrations of 0.7 and 0.1 mg g-1 in the pulp and beans,
respectively (Fig. 4.10, 4.11).
0
5
10
15
20
0 24 48 72 96Eth
ano
l an
d g
lyce
rol (
mg
g-1 )
Fermentation time (h)
Ethanol Glycerol
0
5
10
15
20
0 24 48 72 96Eth
ano
l an
d g
lyce
rol (
mg
g-1)
Fermentation time (h)
Ethanol Glycerol

R e s u l t s | 96
4.2 Diversity and characterization of yeasts, lactic acid bacteria and acetic
acid bacteria in spontaneous cocoa bean fermentations carried out in
Jember, Indonesia; Mocache, Ecuador; Santo Domingo, Trinidad &
Tobago
4.2.1 Identification and diversity of yeasts
The diversity of yeasts found during cocoa bean fermentation varies depending on regions
and methods of fermentation. Fermented cocoa beans from Ecuador had the highest
diversity of yeasts compared with Indonesia and Trinidad & Tobago. For example, species of
Bulleromyces albus, Candida parapsilosis, Cryptococcus laurentii, Metschnikowia
pulcherrima, Rhodotorula glutinis and Wickerhamomyces anomalus were found only in the
fermentations from Ecuador. On the other hand species of Hanseniaspora thailandica,
Issatchenkia orientalis, Pichia kudriavzevii and Sporobolomyces roseus were only isolated
from cocoa bean fermentations from Indonesia. The species of Candida quercitrusa was only
isolated out of cocoa bean fermentations from Trinidad & Tobago (Tab 4.4).
Start of fermentation by yeasts was found in cocoa bean box fermentation in Indonesia,
which has been proved by the isolation of several yeast species such as Candida tropicalis,
Hanseniaspora guilliermondii, Hanseniaspora opuntiae, Hanseniaspora thailandica, and
Saccharomyces cerevisiae. Most of the yeasts species in cocoa bean box fermentation from
Indonesia could only be isolated between 24 and 48 h of fermentation, while S. cerevisiae
could be isolated until the end of fermentation.
The fermentation of cocoa beans from Ecuador also started with yeasts. For example,
B. albus, C. parapsilosis, C. tropicalis, C. laurentii, M. pulcherrima, Rhodotorula mucilaginosa,
Torulaspora delbrueckii and W. anomalus could be isolated at the beginning of fermentation,
though some species were no longer found after 24 h of fermentation. A few species of
yeasts such as H. guilliermondii, H. opuntiae, T. delbrueckii and W. anomalus could be
isolated up to 24h after the start of fermentation, while only S. cerevisiae could be isolated
until the end of fermentation. In contrast to the Indonesian samples, species of

R e s u l t s | 97
T. delbrueckii, W. anomalus, and H. guilliermondii were found to be more dominant during
early phases of cocoa bean fermentation in the sample from Ecuador (Tab 4.4).
Table 4.4 Diversity of yeasts species in cocoa bean fermentations from Indonesia, Ecuador
and Trinidad & Tobago
Yeast species Fermentation time (h)
Indonesia Ecuador Trinidad & Tobago
0 24 48 72 96 0 12 24 96 120 0 12 24 48 72
Bulleromyces albus 4
Candida parapsilosis 3
Candida quercitrusa 1
Candida sp. VTT C-04530* 1
Candida tropicalis 1 1 1
Cryptococcus laurentii 2
Hanseniaspora guilliermondii 1 1 1 5 9 6
Hanseniaspora opuntiae 1 1 2
Hanseniaspora thailandica 1 1
Hanseniaspora uvarum 1 1
Issatchenkia orientalis 1
Metschnikowia pulcherrima 4
Pichia kudriavzevii 2
Rhodotorula glutinis 2
Rhodotorula mucilaginosa 10 1
Saccharomyces cerevisiae 2 16 14 3 10 16 3
Sporobolomyces roseus 2
Torulaspora delbrueckii 2 1 1 4 4
Wickerhamomyces anomalus 11 8 7
*) VTT "Valtion Teknillinen Tutkimuskeskus" (State Technical Research Center), VTT Technical Research Centre of Finland
The composition of yeasts from Indonesia and Ecuador proved to be similar. The
fermentation of cocoa bean from Trinidad & Tobago was initiated by yeasts, with
H. guilliermondii and S. cerevisiae consistently present at the beginning of fermentation.
Only S. cerevisiae was found in all regions at consistently stable level until the end of
fermentation (Indonesia, Ecuador and Trinidad & Tobago) (Tab 4.4).

R e s u l t s | 98
4.2.2 Identification and diversity of lactic acid bacteria
Fermented cocoa beans from Ecuador showed a greater diversity of LAB compared to
Indonesia and Trinidad & Tobago. For example, species of Leuconostoc pseudomesenteroides
were only isolated in cocoa bean fermentation samples from Ecuador. On the other hand,
species of Lactobacillus brevis were only isolated out of cocoa bean fermentation samples
from Indonesia (Tab 4.5).
Table 4.5 Diversity of lactic acid bacteria species in cocoa bean fermentations from
Indonesia, Ecuador and Trinidad & Tobago
LAB species Fermentation time (h)
Indonesia Ecuador Trinidad & Tobago
0 24 48 72 96 0 12 24 96 120 0 12 24 48 72
Lactobacillus brevis 2 2 2
Lactobacillus fermentum 2 2 3 2 2 2 2 2 14 12 1 1
Lactobacillus plantarum 1 9 12 6 10 1 12 3 5
Leuconostoc pseudomesenteroides 4
Pediococcus acidilactici 6 4 1 1 2
Pediococcus pentosaceus 2 16 1
At the onset of lactic acid fermentation, particularly L. plantarum and L. fermentum were
isolated from cocoa bean box fermentations from Indonesia. L. plantarum and L. fermentum
could be consistently isolated during the course of fermentation, while L. brevis could only
temporarily be isolated during fermentation (Tab. 4.5).
L. plantarum and L. fermentum were isolated at the onset of fermentation in cocoa bean
fermentations from Ecuador. L. pseudomesenteroides was also isolated during the early
phases of fermentations, but could no longer be detected after 24 h of fermentation.
L. fermentum was found consistently during the course of fermentation. P. acidilactici and
P. pentosaceus prevailed during the late phases of the Ecuadorian cocoa bean fermentation
(Tab. 4.5).
L. fermentum, L. plantarum and P. acidilactici were isolated out of cocoa bean fermentation
samples from Trinidad and Tobago, with L. fermentum being found consistently during the
fermentation.

R e s u l t s | 99
L. fermentum and L. plantarum were the only species of LAB found consistently during
fermentations from all regions (Indonesia, Ecuador and Trinidad & Tobago) (Tab. 4.5).
4.2.3 Identification and diversity of acetic acid bacteria
Fermented cocoa beans from Indonesia showed the highest diversity of AAB compared to
Ecuador and Trinidad & Tobago. For example, species of Acetobacter ghanensis, Acetobacter
pomorum, and Acetobacter tropicalis were only isolated in cocoa bean fermentations from
Indonesia (Tab. 4.6).
Table 4.6 Diversity of acetic acid bacteria species in cocoa bean fermentations from
Indonesia, Ecuador and Trinidad & Tobago
AAB species Fermentation time (h)
Indonesia Ecuador Trinidad & Tobago
0 24 48 72 96 0 12 24 96 120 0 12 24 48 72
Acetobacter ghanensis 1 3
Acetobacter pasteurianus 2 3 4 1 12 6 6 2 6 3 2
Acetobacter pomorum 2 2 5 11
Acetobacter tropicalis 2
A. pasteurianus was the only AAB species isolated from cocoa bean fermentation samples
from Ecuador and Trinidad & Tobago. A. pasteurianus and A. pomorum were found
consistently in cocoa bean box fermentations from Indonesia. Only A. pasteurianus was
observed during the course of fermentation in samples from all regions (Indonesia, Ecuador
and Trinidad & Tobago (Tab. 4.6).
4.2.4 Yeasts characterization
To investigate the physiological adaptation of the yeast species to the cocoa bean
fermentation enviroment, various physiological characteristics were determined for selected
yeasts isolates representing all detected species.
All yeast isolates tested grew at 25 and 35 °C, with the exception of the four isolates of
T. delbrueckii which only showed weak growth at 35 °C. Two isolates of P. kudriavzevii

R e s u l t s | 100
showed growth at 45 °C. Three isolates of R. mucilaginosa and two isolates of S. cerevisiae
grew weakly at 45 °C (Tab. 4.7).
Table 4.7 Diversity and physiological characterization of yeasts isolates adapted to cocoa
bean fermentation
ID Yeast strains Temperature, °C pH Ethanol, %
25 35 45 2.5 3.5 5.0 5 10 15
IDI-Y31 Candida tropicalis + + - + + + + + -
IDE-Y62 Candida tropicalis + + - + + + + + -
IDI-Y35 Hanseniaspora guilliermondii + + - + + + + + -
IDI-Y36 Hanseniaspora guilliermondii + + - + + + + + -
IDE-Y19 Hanseniaspora guilliermondii + + - + + + + + -
IDT-Y07 Hanseniaspora guilliermondii + + - + + + + + -
IDT-Y16 Hanseniaspora guilliermondii + + - + + + + + -
IDI-Y30 Hanseniaspora opuntiae + + - + + + + - -
IDE-Y25 Hanseniaspora opuntiae + + - + + + + - -
IDE-Y27 Hanseniaspora opuntiae + + - + + + + - -
IDI-Y34 Hanseniaspora thailandica + + - - + + + - -
IDE-Y56 Hanseniaspora uvarum + + - - w + + w -
IDT-Y05 Hanseniaspora uvarum + + - - w + + w -
IDE-Y40 Metschnikowia pulcherrima + + - - + + + w -
IDE-Y48 Metschnikowia pulcherrima + + - - + + + w -
IDI-Y51 Pichia kudriavzevii + + + + + + + + +
IDI-Y52 Pichia kudriavzevii + + + + + + + + +
IDE-Y42 Rhodotorula mucilaginosa + + w - w + + w -
IDE-Y87 Rhodotorula mucilaginosa + + w - w + + w -
IDT-Y02 Rhodotorula mucilaginosa + + w - w + + w -
IDI-Y01 Saccharomyces cerevisiae + + w + + + + + +
IDI-Y02 Saccharomyces cerevisiae + + - + + + + + +
IDI-Y03 Saccharomyces cerevisiae + + w + + + + + +
IDE-Y31 Saccharomyces cerevisiae + + - + + + + + +

R e s u l t s | 101
Table 4.7 Continuation
ID Yeast strains Temperature, °C pH Ethanol, %
25 35 45 2.5 3.5 5.0 5 10 15
IDT-Y06 Saccharomyces cerevisiae + + - + + + + + +
IDI-Y43 Torulaspora delbrueckii + w - - + + + w -
IDI-Y57 Torulaspora delbrueckii + w - - + + + w -
IDE-Y71 Torulaspora delbrueckii + w - - + + + w -
IDE-Y13 Torulaspora delbrueckii + w - - + + + w -
IDE-Y01 Wickerhamomyces anomalus + + - - w + + + -
IDE-Y15 Wickerhamomyces anomalus + + - - w + + + -
IDE-Y21 Wickerhamomyces anomalus + + - - w + + + -
+ = growth - = no growth w = weak growth
All yeast isolates grew at pH 5.0. Nearly all yeasts grew at pH 3.5, with the exception of the
isolates of H. uvarum, R. mucilaginosa, and W. anomalus. All isolates of C. tropicalis,
H. guilliermondii, H. opuntiae, P. kudriavzevii, S. cerevisiae, grew at pH 2.5. None of the
isolates of H. thailandica, H. uvarum, M. pulcherrima, R. mucilaginosa, T. delbrueckii and
W. anomalus grew at pH 2.5 (Tab. 4.7).
All yeast isolates tested grew at 5% ethanol. All isolates of C. tropicalis, H. guilliermondii,
P. kudriavzevii, S. cerevisiae, and W. anomalus grew at 10% ethanol. All isolates of
H. uvarum, M. pulcherrima, R. mucilaginosa, and T. delbrueckii grew weakly at 10% ethanol.
Isolates of H. opuntiae and H. thailandica failed to grow at 10% ethanol. Only very few yeast
isolates grew at 15% ethanol. Only species of P. kudriavzevii and S. cerevisiae were able to
grow at 15% ethanol (Tab. 4.7).
4.2.5 Lactic acid bacteria characterization
All LAB isolates tested grew at 25 and 35 °C. All isolates of L. fermentum, L. plantarum and
Pediococcus acidilactici grew at 45 °C. Three isolates of Pediococcus pentosaceus showed
weak growth at 45 °C, while three isolates of L. brevis failed to grow at 45 °C. All LAB isolates
tested grew at pH 5.0 and 3.5 but not at pH 2.5. All LAB isolates tested grew at 5% and 10%

R e s u l t s | 102
ethanol, except for three isolates of L. brevis which weak growth at 10%. None of the LAB
isolates tested showed growth at 15% ethanol (Tab. 4.8).
Table 4.8 Diversity and physiological characterization of lactic acid bacteria species
adapted to cocoa bean fermentation
ID LAB strains Temperature, °C pH Ethanol, %
25 35 45 2.5 3.5 5.0 5 10 15
IDI-L03 Lactobacillus brevis + + - - + + + w -
IDI-L06 Lactobacillus brevis + + - - + + + w -
IDI-L07 Lactobacillus brevis + + - - + + + w -
IDE-L07 Lactobacillus fermentum + + + - + + + + -
IDE-L11 Lactobacillus fermentum + + + - + + + + -
IDE-L36 Lactobacillus fermentum + + + - + + + + -
IDE-L38 Lactobacillus fermentum + + + - + + + + -
IDE-L42 Lactobacillus fermentum + + + - + + + + -
IDI-L16 Lactobacillus plantarum + + + - + + + + -
IDI-L17 Lactobacillus plantarum + + + - + + + + -
IDI-L18 Lactobacillus plantarum + + + - + + + + -
IDT-L46 Lactobacillus plantarum + + + - + + + + -
IDT-L45 Lactobacillus plantarum + + + - + + + + -
IDE-L54 Lactobacillus plantarum + + + - + + + + -
IDE-L59 Lactobacillus plantarum + + + - + + + + -
IDE-L87 Lactobacillus plantarum + + + - + + + + -
IDE-L23 Pediococcus acidilactici + + + - + + + + -
IDE-L09 Pediococcus acidilactici + + + - + + + + -
IDE-L13 Pediococcus acidilactici + + + - + + + + -
IDT-L37 Pediococcus acidilactici + + + - + + + + -
IDT-L40 Pediococcus acidilactici + + + - + + + + -
IDE-L44 Pediococcus pentosaceus + + w - + + + + -
IDE-L21 Pediococcus pentosaceus + + w - + + + + -
IDE-L15 Pediococcus pentosaceus + + w - + + + + -
+ = grow th - = no growth w = weak growth

R e s u l t s | 103
4.2.6 Acetic acid bacteria characterization
All AAB isolates tested grew at 25 and 35 °C, while only isolates of A. pasteurianus showed
weak growth at 45 °C. None of the isolates of A. ghanensis and A. pomorum grew at 45 °C.
All AAB isolates grew at pH 5.0 and 3.5, though none did so at pH 2.5. All AAB isolates tested
grew at 5% and 10% ethanol, with the exception two isolates of A. ghanensis and three
isolates of A. pomorum which showed weak growth at 10%. None of the AAB isolates grew
at 15% ethanol (Tab. 4.9).
Table 4.9 Diversity and physiological characterization of acetic acid bacteria species
adapted to cocoa bean fermentation
ID AAB strains Temperature, °C pH Ethanol, %
25 35 45 2.5 3.5 5,0 5 10 15
IDI-A22 Acetobacter ghanensis + + - - + + + w -
IDI-A23 Acetobacter ghanensis + + - - + + + w -
IDI-A19 Acetobacter pasteurianus + + w - + + + + -
IDI-A03 Acetobacter pasteurianus + + w - + + + + -
IDI-A04 Acetobacter pasteurianus + + w - + + + + -
IDE-A05 Acetobacter pasteurianus + + w - + + + + -
IDE-A12 Acetobacter pasteurianus + + w - + + + + -
IDE-A14 Acetobacter pasteurianus + + w - + + + + -
IDT-A19 Acetobacter pasteurianus + + w - + + + + -
IDT-A18 Acetobacter pasteurianus + + w - + + + + -
IDT-A21 Acetobacter pasteurianus + + w - + + + + -
IDI-A18 Acetobacter pomorum + + - - + + + w -
IDI-A20 Acetobacter pomorum + + - - + + + w -
IDI-A02 Acetobacter tropicalis + + - - + + + w -
+ = growth - = no growth w = weak growth

R e s u l t s | 104
4.3 Development of a starter culture at laboratory level for improved quality
of cocoa bean fermentation products
4.3.1 Changes in pH during cocoa bean fermentation
There was no significant difference between the pH observed in the pulp of cocoa beans
fermented with aerobic and anaerobic methods. On the other hand, the pH of beans was
different, whereas the pH of beans fermented by anaerobic methods was slightly less acid
compared to aerobic methods.
Figure 4.12 Changes in pH during aerobic and anaerobic fermentation, full symbol (pulp),
open symbol (beans)
The initial pH of the pulp was 4.05, which then increased to pH 4.88 after 72 h of
fermentation, probably due to the degradation of citric acid by Saccharomyces cerevisiae
and Lactobacillus fermentum during the first 24-48 h of fermentation. Afterwards, the pH
remained stable until the end of fermentation. In an inverse relationship to the pH of the
pulp, the pH of the beans decreased during fermentation from an initial pH of 6.77 to 5.46
by the end of the fermentation. This is reflected in the increased amount of citric, lactic and
acetic acid during fermentation. This was partly responsible for the death of the cell
cotyledon after 48 h of fermentation.
0
1
2
3
4
5
6
7
0 24 48 72 96 120
pH
Fermentation time (h)
Anaerobic Aerobic Anaerobic Aerobic

R e s u l t s | 105
4.3.2 Growth of the starter culture during fermentation
To investigate the growth of the starter culture during aerobic fermentation, cocoa beans
were inoculated with S. cerevisiae and L. fermentum at the onset of fermentation with an
initial cell count of 107 and 106 CFU g-1, respectively. A. pasteurianus was inoculated after
48 h of fermentation with an initial cell count of 108 CFU g-1. The cell count of S. cerevisiae
increased during the first 24 h and grew to a maximum number of 109 CFU g-1. Upon
prolonged fermentation, the S. cerevisiae cell count declined down to 104 CFU g-1 (Fig. 4.13).
The size of the L. fermentum cell count increased during fermentation and grew to a
maximum population of 108 CFU g-1 after 72 h of fermentation. Afterwards, the
L. fermentum cell count decreased to 105 CFU g-1, before slightly decreasing until the end of
fermentation to 104 CFU g-1 (Fig. 4.13). A. pasteurianus was added to the fermented cocoa
beans mass after 48 h of fermentation with an initial number of 108 CFU g-1, before
increasing rapidly to a maximum cell count of 108 CFU g-1 after 72 h, followed by a decline
until the end of fermentation down to 104 CFU g-1 (Fig. 4.13).
Figure 4.13 Growth of the starter culture during aerobic fermentation
1.E+00
1.E+02
1.E+04
1.E+06
1.E+08
1.E+10
0 24 48 72 96 120
Log 1
0 (
CFU
g-1
)
Fermentation time (h)
Saccharomyces cerevisiae Lactobacillus fermentum
Acetobacter pasteurianus

R e s u l t s | 106
To investigate the growth of the starter culture during anaerobic fermentation, cocoa beans
were inoculated with S. cerevisiae and L. fermentum at the onset of fermentation with an
initial population of 107 and 106 CFU g-1, respectively. A. pasteurianus was inoculated after
48 h of fermentation with an initial population of 108 CFU g-1. The size of the S. cerevisiae
population increased during the first 24 h and grew to a maximum population of 109 CFU g-1.
Upon prolonged fermentation, the S. cerevisiae population declined to a undetectable level
(Fig. 4.14). The size of the L. fermentum population increased during fermentation and grew
to a maximum population of 108 CFU g-1 after 72 h of fermentation. Afterwards, the
L. fermentum population decreased to 105 CFU g-1, before decreasing until the end of
fermentation to 104 CFU g-1 (Fig. 4.14). A. pasteurianus was added to the fermenting cocoa
beans after 48 h of fermentation with an initial population of 107 CFU g-1, before increasing
rapidly to a maximum population of 108 CFU g-1 after 72 h, followed by a decline until the
end of fermentations down to undetected level (Fig. 4.14).
Figure 4.14 Growth of the starter culture during anaerobic fermentation
S. cerevisiae grew until the end of fermentation in the aerobic fermentation, whereas it
could not be detected in anaerobic fermentation after 120 h. A. pasteurianus grew well
during aerobic fermentation and survived until the end of fermentation. In contrast to this in
anaerobic fermentation it declined down to undetectable levels at the end of fermentation.
1.0E+00
1.0E+02
1.0E+04
1.0E+06
1.0E+08
1.0E+10
0 24 48 72 96 120
Log 1
0 (
CFU
g-1
)
Fermentation time (h)
Saccharomyces cerevisiae Lactobacillus fermentum
Acetobacter pasteurianus
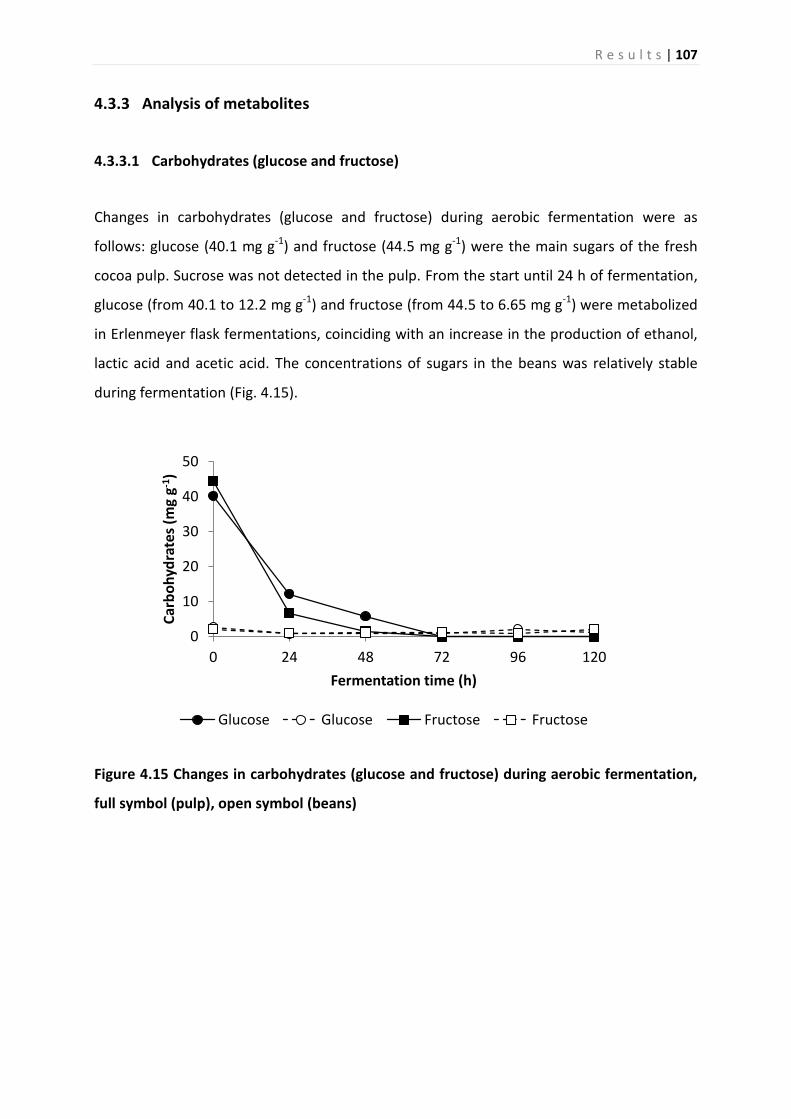
R e s u l t s | 107
4.3.3 Analysis of metabolites
4.3.3.1 Carbohydrates (glucose and fructose)
Changes in carbohydrates (glucose and fructose) during aerobic fermentation were as
follows: glucose (40.1 mg g-1) and fructose (44.5 mg g-1) were the main sugars of the fresh
cocoa pulp. Sucrose was not detected in the pulp. From the start until 24 h of fermentation,
glucose (from 40.1 to 12.2 mg g-1) and fructose (from 44.5 to 6.65 mg g-1) were metabolized
in Erlenmeyer flask fermentations, coinciding with an increase in the production of ethanol,
lactic acid and acetic acid. The concentrations of sugars in the beans was relatively stable
during fermentation (Fig. 4.15).
Figure 4.15 Changes in carbohydrates (glucose and fructose) during aerobic fermentation,
full symbol (pulp), open symbol (beans)
0
10
20
30
40
50
0 24 48 72 96 120
Car
bo
hyd
rate
s (m
g g-1
)
Fermentation time (h)
Glucose Glucose Fructose Fructose

R e s u l t s | 108
Figure 4.16 Changes in carbohydrates (glucose and fructose) during anaerobic
fermentation, full symbol (pulp), open symbol (beans)
Changes in carbohydrates (glucose and fructose) during anaerobic fermentation were as
follows: similar to aerobic fermentation, glucose (40.1 mg g-1) and fructose (44.5 mg g-1)
were the main sugars found in the fresh cocoa pulp. Sucrose was not detected in the pulp.
From the start until 24 h of fermentation, glucose (from 40.1 to 14.2 mg g-1) and fructose
(from 44.5 to 8.8 mg g-1) were metabolized during fermentation, coinciding with an increase
in production of ethanol, lactic acid and acetic acid. The concentrations of sugars in the
beans remained stable during fermentation (Fig. 4.16).
The concentration of sugars in the pulp was always higher than that in the beans, both in the
aerobic and anaerobic fermentation. Glucose and fructose in the pulp were consumed more
quickly and in greater amounts in the aerobic fermentation.
0
10
20
30
40
50
0 24 48 72 96 120
Car
bo
hyr
ates
(m
g g-1
)
Fermentation time (h)
Glucose Glucose Fructose Fructose

R e s u l t s | 109
4.3.3.2 Organic acids (citric acid, lactic acid, acetic acid)
Changes in organic acids (citric acid, lactic acid, acetic acid) during aerobic fermentation
were as follows: citric acid was the main organic acid in cocoa pulp. Lactic acid and acetic
acid were not detected in cocoa pulp. From the start of fermentation up to 24 h, citric acid
(from 6.9 to 1.66 mg g-1) was metabolized during fermentation, coinciding with an increase
in the production of ethanol, lactic acid and acetic acid. Lactic acid and acetic acid were
detected in the cocoa pulp at 48 h of fermentation, with initial concentrations of 1.55 and
0.8 mg g-1, respectively. Lactic acid reached a maximum concentration of 11.9 mg g-1 at 72 h
of fermentation and then decreased until the end of fermentation down to a value of 7.58
mg g-1. Acetic acid reached a maximum concentration of 23.1 mg g-1 at 96 h of fermentation
and then decreased until the end of fermentation down to a value of 17.8 mg g-1 (Fig. 4.17).
Citric acid in the cocoa beans was slowly metabolized and decreased until the end of
fermentation. In contrast to the pulp, the concentrations of lactic acid and acetic acid in the
beans increased to maximum concentrations of 3.24 and 3.1 mg g-1, respectively, until the
end of fermentation (Fig. 4.17).
Figure 4.17 Changes in organic acids (citric acid, lactic acid, acetic acid) during aerobic
fermentation, full symbol (pulp), open symbol (beans)
0
5
10
15
20
25
0 24 48 72 96 120
Org
anic
aci
ds
(mg
g-1)
Fermentation time (h)
Citric acid Citric acid
Lactic acid Lactic acid
Acetic acid Acetic acid

R e s u l t s | 110
Figure 4.18 Changes in organic acids (citric acid, lactic acid, acetic acid) during anaerobic
fermentation, full symbol (pulp), open symbol (beans)
Organic acids (citric acid, lactic acid, acetic acid) changed during anaerobic fermentation as
follows: similar to aerobic fermentation, citric acid is the main organic acid found in cocoa
pulp. Lactic acid and acetic acid were not detected in the cocoa pulp. From the start of
fermentation until 24 h later, citric acid (from 6.9 to 2.38 mg g-1) was metabolized in the
Erlenmeyer flasks fermentation, coinciding with an increased production of ethanol, lactic
acid and acetic acid. Lactic acid and acetic acid were detected in the cocoa pulp at 48 h of
fermentation with initial concentrations of 0.34 and 3.0 mg g-1, respectively. Lactic acid
reached a maximum concentration of 9.0 mg g-1 at 72 of fermentation, and then decreased
until the end of fermentation down to 4.74 mg g-1. Acetic acid reached a maximum
concentration of 18.1 mg g-1 at 72 h of fermentation and then decreased until the end of
fermentation down to 10.2 mg g-1 (Fig. 4.18). Citric acid in the cocoa beans was slowly
metabolized and decreased until the end of fermentation. In contrast to the pulp,
concentrations of lactic acid and acetic acid in the beans increased until the end of
fermentation to maximum concentrations of 3.9 and 2.0 mg g-1, respectively (Fig. 4.18). The
production of lactic acid and acetic acid was slightly higher in the aerobic fermentation
compared to the anaerobic fermentation.
0
5
10
15
20
25
0 24 48 72 96 120
Org
anic
aci
ds
(mg
g-1)
Fermentation time (h)
Citric acid Citric acid
Lactic acid Lactic acidAcetic acid Acetic acid

R e s u l t s | 111
4.3.3.3 Changes in ethanol during aerobic and anaerobic fermentation
The concentration of ethanol in the pulp of the aerobic fermentation reached a maximum
concentration of 18.54 mg g-1 after 48 h of fermentation. The ethanol concentration
declined to 4.0 mg g-1 at the end of fermentation. The concentration of ethanol in the pulp
of the anaerobic fermentation reached a maximum concentration of 20.16 mg g-1 after 48 h
of fermentation. At the end of fermentation, the ethanol concentration had declined down
to 5.20 mg g-1 (Fig. 4.19).
Figure 4.19 Changes in ethanol during aerobic and anaerobic fermentation, full symbol
(pulp), open symbol (beans)
In contrast to the pulp, the concentration of ethanol in the beans increased during
fermentation before slightly declining until the end of fermentation. The concentration of
ethanol in the aerobic and anaerobic fermentations increased to maximum values of 8.33
and 9.44 mg g-1 after 72 h of fermentation, respectively. The concentration of ethanol in the
anaerobic fermentation was slightly higher compared to the aerobic fermentation (Fig. 4.19).
0
5
10
15
20
25
30
0 24 48 72 96 120
Eth
ano
l (m
g g-1
)
Fermentation time (h)
Aerobic pulp Aerobic beans
Anaerobic pulp Anaerobic beans

R e s u l t s | 112
4.3.3.4 Changes in amino acids during aerobic and anaerobic fermentation
The concentrations of free amino acids increased during fermentation, both in aerobic and
anaerobic fermentations. Acidic amino acids decreased after 72 h of fermentation, whereas
basic and hydrophobic amino acids increased after 72 h of fermentation. The concentrations
of free amino acids was higher in the aerobic fermentation compared to the anaerobic
fermentation (Fig. 4.20 and 4.21).
Figure 4.20 Changes in amino acids during aerobic fermentation
0
5
10
15
20
25
0 h 24 h 48 h 72 h 96 h 120 h
Am
ino
aci
ds
(mg
g-1 f
fdm
)
Fermentation time (h)
GABA
Tyr
Phe
Leu
Ile
Val
Ala
Trp
Thr
Gly
Ser
Lys
Glu
Asn
Asp
Hyd
rop
ho
bic
B
asic
A
cid

R e s u l t s | 113
Figure 4.21 Changes in amino acids during anaerobic fermentation
4.3.3.5 Changes in polyphenols during aerobic and anaerobic fermentation
The concentration of polyphenols decreased during fermentation, particularly after 48 and
72 h of fermentation in aerobic and anaerobic fermentation, respectively. More than 50% of
polyphenols were lost after 48 and 72 h of fermentation in aerobic and anaerobic
fermentation, respectively. The concentration of polyphenols was higher in the anaerobic
fermentation compared to aerobic fermentation. The concentration of polyphenols was
more stable during the first 48 h of fermentation in the anaerobic fermentation. The
polyphenol concentration was found to be extremely low after 48 h of fermentation in
aerobic fermentation (Fig. 4.22, 4.23).
0
5
10
15
20
25
0 24 48 72 96 120
Am
ino
aci
ds
(mg
g-1
ffd
m)
Fermentation time (h)
GABA
Tyr
Phe
Leu
Ile
Val
Ala
Trp
Thr
Gly
Ser
Lys
Glu
Asn
Asp
Hyd
rop
ho
bic
B
asic
A
cid

R e s u l t s | 114
Figure 4.22 Changes in polyphenols during aerobic fermentation
Figure 4.23 Changes in polyphenols during anaerobic fermentation
0
5
10
15
20
0 24 48 72 96 120
Po
lyp
hen
ols
(m
g g-1
ffd
m)
Fermentation time (h)
(+)-Catechin (-)-Epicatechin
0
5
10
15
20
0 24 48 72 96 120
Po
lyp
hen
ols
(m
g g-1
ffd
m)
Fermentation time (h)
(+)-Catechin (-)-Epicatechin

R e s u l t s | 115
4.4 Investigation of activity and characterization of antifungal proteins in the
seed coat slime of Theobroma cacao L.
4.4.1 Antimicrobial activity assay against fungi, Gram-positive bacteria and Gram-
negative bacteria
Strains of microorganisms were isolated from cocoa bean fermentations from Indonesia and
Ecuador, or strains from the microorganism collection at the Division of Food Microbiology
and Biotechnology, Department of Chemistry, University of Hamburg were used (Tab. 4.10).
Table 4.10 Seed coat slime inhibition test against fungi
Fungus Zone
diameter
(mm)
Fungus Zone
diameter
(mm)
Aspergillus niger**
Aspergillus flavus**
Aspergillus parasiticus**
Mortierella isabellina**
Mucor sp. **
Penicillium citrinum**
Penicillium purpurogenum**
Penicillium roquefortii**
Rhizopus oligosporus**
Rhizopus oryzae**
Candida krusei**
Candida lipolytica*
Candida pelliculosa*
12.55
14.49
12.49
11.72
0
12.72
12.82
12.52
0
0
16.82
19.62
0
Candida pulcherrima*
Candida guilliermondii*
Cryptococcus laurentii*
Kloeckera apis**
Phaeococcomyces nigricans**
Rhodotorula glutinis*
Rhodotorula mucilaginosa*
Rhodotorula rubra**
Saccharomyces cerevisiae*
Schizosaccharomyces pombe**
Torulopsis magnoliae**
Torulaspora delbrueckii*
0
18.55
14.55
0
0
0
19.52
19.62
19.84
19.62
0
0
*: strains from cocoa bean fermentation **: strain from laboratory culture collections of Division of Food Microbiology and Biotechnology (Institute of Food Chemistry, Department of Chemistry, University of Hamburg, Germany).
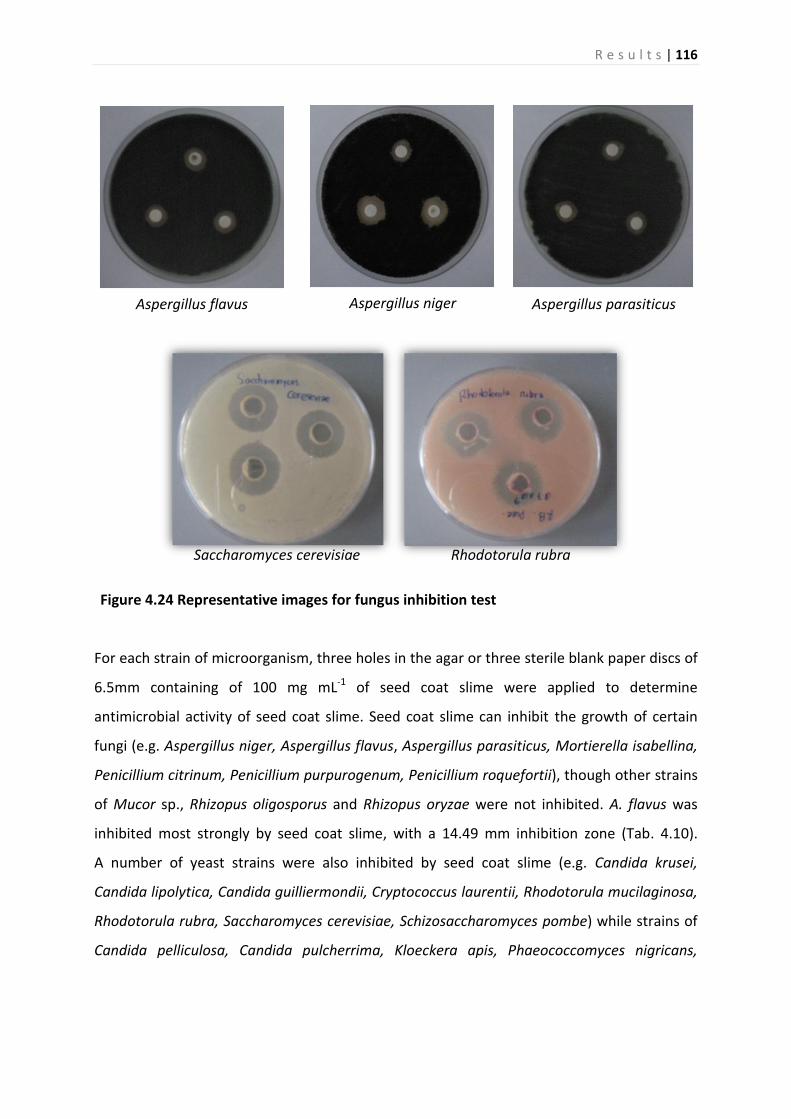
R e s u l t s | 116
For each strain of microorganism, three holes in the agar or three sterile blank paper discs of
6.5mm containing of 100 mg mL-1 of seed coat slime were applied to determine
antimicrobial activity of seed coat slime. Seed coat slime can inhibit the growth of certain
fungi (e.g. Aspergillus niger, Aspergillus flavus, Aspergillus parasiticus, Mortierella isabellina,
Penicillium citrinum, Penicillium purpurogenum, Penicillium roquefortii), though other strains
of Mucor sp., Rhizopus oligosporus and Rhizopus oryzae were not inhibited. A. flavus was
inhibited most strongly by seed coat slime, with a 14.49 mm inhibition zone (Tab. 4.10).
A number of yeast strains were also inhibited by seed coat slime (e.g. Candida krusei,
Candida lipolytica, Candida guilliermondii, Cryptococcus laurentii, Rhodotorula mucilaginosa,
Rhodotorula rubra, Saccharomyces cerevisiae, Schizosaccharomyces pombe) while strains of
Candida pelliculosa, Candida pulcherrima, Kloeckera apis, Phaeococcomyces nigricans,
Aspergillus niger Aspergillus parasiticus Aspergillus flavus
Saccharomyces cerevisiae Rhodotorula rubra
Figure 4.24 Representative images for fungus inhibition test

R e s u l t s | 117
Rhodotorula glutinis, Torulopsis magnoliae and Torulaspora delbrueckii were not inhibited
(Tab. 4.10).
No inhibition effect could be detected against Gram-positive and Gram-negative bacteria
(Tab. 4.11, 4.12).
Table 4.11 Seed coat slime inhibition test against Gram-positive bacteria
Gram-positive bacteria Zone diameter (mm)
Bacillus subtilis ATCC 6633
Micrococcus luteus DSM 1790
Staphylococcus aureus LMH 5P
Streptococcus thermophilus LMH 5P
Lactobacillus plantarum LMH 13P
Lactobacillus plantarum DSM 20205
Lactobacillus acidophilus LMH 16P
Lactobacillus casei LMH 17P
Lactobacillus fermentum DSM 20052
Lactobacillus reuteri DSM 20016
Lactobacillus delbrueckii DSM 20355
Propionibacterium freudenreichii DSM 20271
Propionibacterium shermanii DSM 20270
0
0
0
0
0
0
0
0
0
0
0
0
0
Add: All gram positive bacteria were from laboratory culture collections of Division of Food Microbiology and
Biotechnology (Institute of Food Chemistry, Department of Chemistry, University of Hamburg, Germany).

R e s u l t s | 118
Table 4.12 Seed coat slime inhibition test against Gram-negative bacteria
Gram-negative bacteria Zone diameter (mm)
Escherichia coli
Acetobacter pasteurianus
Acetobacter tropicalis
Acetobacter pomorum
Acetobacter peroxydans
Gluconobacter frateurii
Acetobacter orientalis
0
0
0
0
0
0
0
*: strains from cocoa bean fermentation **: strain from laboratory culture collections of Division of Food Microbiology and Biotechnology (Institute of Food Chemistry, Department of Chemistry, University of Hamburg, Germany).
4.4.2 Minimum inhibitory concentration against molds and yeasts
The antifungal activity of the seed coat slime of Theobroma cacao L. was evaluated by the
disk diffusion agar and microdilution methods. To determine the minimum inhibitory
concentration (MIC) of seed coat slime of Theobroma cacao L., a susceptibility test was
performed against A. niger, P. citrinum, S. cerevisiae and R. rubra.
Both the disk diffusion agar and microdilution methods showed good results during testing.
MIC test using disk diffusion agar methods showed difficulties to distinguish between
different concentrations of seed coat slime, while microdilution methods allowed to
distinguish between the concentrations of seed coat slime. The diffusion agar method was
thus less sensitive than the microdilution method in these antifungal tests.
A. niger was significantly inhibited by seed coat slime. 25 mg mL-1 of seed coat slime
inhibited 56.7% and 66.48% of the growth of A. niger after 24 and 48 h of incubation,
respectively. 100 mg mL-1 of seed coat slime inhibited 84.1% and 89.6% of the growth of
A. niger after 24 and 48 h of incubation, respectively. 25 mg mL-1 of seed coat slime was the
lowest concentration capable of inhbiting 50% of the growth of A. niger after 24 h of
incubation (Fig. 4.25).

R e s u l t s | 119
a) Agar diffusion methods, 25, 50, 75, 100 (seed coat slime extract mg mL-1), C: control
(sterile H2O)
b) Microdilution methods, 25, 50, 75, 100 (seed coat slime extract mg mL-1), C- (control
negative, sterile H2O), C+ (control positive, 2 mg mL-1 propionic acid)
0.000
0.100
0.200
0.300
0.400
0.500
0.600
0.700
C - 25 50 75 100 C +
OD
53
0 n
m
Seed coat slime (mg mL-1)
24 h 48 h
Figure 4.25 Minimum inhibitory concentration against Aspergillus niger, a) agar diffusion
methods, b) microdilution methods
C
25
50
75
100

R e s u l t s | 120
P. citrinum was not strongly inhibited by seed coat slime. 25 mg mL-1 of seed coat slime
inhibited 16.74% and 32.42% of the growth of P. citrinum after 24 and 48 h of incubation,
respectively.
a) Agar diffusion methods, 25, 50, 75, 100 (seed coat slime extract mg mL-1), C: control
(sterile H2O)
b) Microdilution methods, 25, 50, 75, 100 (seed coat slime extract mg mL-1), C- (control
negative, sterile H2O), C+ (control positive, 2 mg mL-1 propionic acid)
0.000
0.100
0.200
0.300
0.400
0.500
0.600
0.700
C - 25 50 75 100 C +
OD
53
0 n
m
Seed coat slime extract (mg mL-1)
24 h 48 h
Figure 4.26 Minimum inhibitory concentration against Penicillium citrinum, a) agar diffusion
methods, b) microdilution methods
C
25
50
75
100

R e s u l t s | 121
100 mg mL-1 of seed coat slime inhibited 42.04% and 55.13% of the growth of P. citrinum
after 24 and 48 h of incubation, respectively. 100 mg mL-1 of seed coat slime was the lowest
concentration capable of inhibiting 50% of the growth of P. citrinum after 48 h of incubation
(Fig. 4.26).
S. cerevisiae was not strongly inhibited by seed coat slime using microdilution methods.
10 mg mL-1 of seed coat slime inhibited 6.9% and 2.56% of the growth of S. cerevisiae after
24 and 48 h of incubation, respectively. 40 mg mL-1 of seed coat slime inhibited 17.86% and
11.6% of the growth of S. cerevisiae after 24 and 48 h of incubation, respectively. 40 mg mL-1
of seed coat slime could not achieve 50% growth inhibition of S. cerevisiae after 48 h of
incubation (Fig. 4.27). For S. cerevisiae, 24 h of incubation seems to be the best time for the
inhibition test.
R. rubra was significantly inhibited by seed coat slime. 10 mg mL-1 of seed coat slime
inhibited 52.22% and 60.03% of the growth of R. rubra after 24 and 48 h of incubation,
respectively. 40 mg mL-1 of seed coat slime inhibited 78.22% and 87.63% of the growth of
R. rubra after 24 and 48 h of incubation, respectively. 10 mg mL-1 of seed coat slime was the
lowest concentration capable of inhibiting 50% of the growth of R. rubra after 24 h of
incubation (Fig. 4.28).

R e s u l t s | 122
a) Agar diffusion methods, 10, 20, 30, 40 (seed coat slime extract mg mL-1), C: control (sterile
H2O)
b) Microdilution methods, 10, 20, 30, 40 (seed coat slime extract mg mL-1), C- (control
negative, sterile H2O), C+ (control positive, 2 mg mL-1 propionic acid)
C
10
20
30
40
0.000
0.100
0.200
0.300
0.400
0.500
0.600
0.700
C - 10 20 30 40 C +
OD
53
0 n
m
Seed coat slime (mg mL-1)
24 h 48 h
Figure 4.27 Minimum inhibitory concentration against Saccharomyces cerevisiae, a) agar
diffusion methods, b) microdilution methods

R e s u l t s | 123
a) Agar diffusion methods, 10, 20, 30, 40 (seed coat slime extract mg mL-1), C: control (sterile
H2O)
b) Microdilution methods, 10, 20, 30, 40 (seed coat slime extract mg mL-1), C- (control
negative, sterile H2O), C+ (control positive, 2 mg mL-1 propionic acid)
C
10
20
30
40
0.000
0.100
0.200
0.300
0.400
0.500
0.600
0.700
C - 10 20 30 40 C +
OD
53
0 n
m
Seed coat slime extract (mg mL-1)
24 h 48 h
Figure 4.28 Minimum inhibitory concentration against Rhodotorula rubra, a) agar
diffusion methods, b) microdilution methods

R e s u l t s | 124
4.4.3 Protein concentration in the seed coat slime
The protein concentration of seed coat slime differed between varieties of Theobroma cacao
L., with Forastero (7.0 µg mL-1) showing a higher concentration than Trinitario (5.2 µg mL-1).
The concentration of the seed coat slime (Forastero) decreased during fermentation. The
concentration of the seed coat slime was 10.75 µg mL-1 at the onset of fermentation before
decresing by 50% after 96 h of fermentation down to 4.83 µg mL-1. Seed coat slime does not
seem to be resistant to high temperature, as the protein concentration of the seed coat
slime decreased during heat treatment to 5.12, 4.94 and 2.35 after incubation for 24 h at 30,
40 and 50 °C, respectively (Tab. 4.13). Only 4 and 1 protein band could be seen after 24 h
incubation at 40 and 50 °C, respectively (Fig. 4.30).
Table 4.13 Concentration of seed coat slime proteins
Seed coat sample Protein concentration µg mL-1
Forastero 6.98
Trinitario 5.17
Fermentation, 0 h 10.75
Fermentation, 24 h 10.08
Fermentation, 48 h 9.25
Fermentation, 72 h 6.40
Fermentation, 96 h 4.83
Heated 30 °C, 24 h 5.12
Heated 40 °C, 24 h 4.94
Heated 50 °C, 24 h 2.35
4.4.4 Protein extraction and separation by electrophoresis
It could be seen that seed coat slime proteins degraded during the fermentation process,
probably caused by an increase in temperature and by activity of proteases produced by the
microbes during the fermentation.

R e s u l t s | 125
4.4.5 Temperature stability of seed coat proteins
To study the stability of seed coat slime proteins at different temperatures, the slime was
incubated at various temperatures (30, 40 and 50 °C) for 24 h. The study on temperature
stability showed that the slime proteins were stable at 30 °C for 24 h, but not at 40 and
50 °C.
250
150
100
kDa
75
50
37
25
20
15
96 h M 72 h 48 h 24 h 0 h
Figure 4.29 Seed coat slime proteins from different fermentation times

R e s u l t s | 126
250 kD 150
100
75
50
37
25
20
15
30 M 50 40
Figure 4.30 Seed coat slime protein from different incubation temperatures (30, 40, 50 °C),
24 h

R e s u l t s | 127
4.4.6 Identification of seed coat slime proteins
Analyses of proteins using nano-electrospray mass spectrometry in a QTOF II instrument
(Micromass, Manchester, UK) showed 3 proteins that could have an antifungal effect,
namely osmotin 24.1 kDa (6) chitinase 28.8 and 31.6 kDa (7, 8) and glucanase 33 kDa (9)
(Fig. 4.31).
37
150
25
250
20
15
50
75
100
kDa
10
9
8
7
6
5 4 3 2
1
11
12
13 14
15
Figure 4.31 Seed coat slime proteins from Forastero

R e s u l t s | 128
Table 4.14 Protein determination by mass spectrometry
Protein Identified proteins Molecular weight (kDa)
1. Glycoprotein [Bromus inermis] 15.5
2. Ribosomal protein S11 family protein [Theobroma cacao] 16.3
3. 17.6 kDa class II heat shock protein [Theobroma cacao] 17.5
4. Ribosomal protein L11 family protein [Theobroma cacao] 17.8
5. 21 kDa seed protein [Theobroma cacao] 18.7
6. Osmotin 34 [Theobroma cacao] 24.1
7. Basic chitinase [Theobroma cacao] 28.8
8. Carrot EP3-3 chitinase [Theobroma cacao] 31.6
9. Glucan endo-1,3-beta-glucosidase [Theobroma cacao] 33.0
10. Lactate dehydrogenase family protein [Theobroma cacao] 35.4
11. Aldolase-type TIM barrel family protein [Theobroma cacao] 47.8
12. ATP synthase alpha [Theobroma cacao] 59.7
13. Vacuolar ATP synthase subunit A [Theobroma cacao] 73.2
14. Hsc70 [Solanum lycopersicum] 75.0
15. Phospholipase D alpha 2 [Theobroma cacao] 91.6

R e s u l t s | 129
4.5 Investigation of the influence of seed coat slime on growth of starter
culture and physical and chemical changes during cocoa bean
fermentation at laboratory level
4.5.1 Changes in pH during fermentation
No significant differences in pH of the pulp and beans were found between fermentations
with pulp (complete pulp) and with only 10% pulp during fermentation.
Figure 4.32 Changes in pH during fermentation, a) with pulp, b) with only 10% pulp
0
1
2
3
4
5
6
7
0 24 48 72 96 120
pH
Fermentation time (h)
Pulp Bean
0
1
2
3
4
5
6
7
0 24 48 72 96 120
pH
Fermentation time (h)
b
Pulp Bean
a

R e s u l t s | 130
4.5.2 Growth of the starter culture during fermentation
To investigate the growth of the starter culture during fermentation with complete pulp,
cocoa beans were inoculated with S. cerevisiae and L. fermentum at the onset of
fermentation with an initial cell count of 107 and 106 CFU g-1, respectively. A. pasteurianus
was inoculated after 48 h of fermentation with an initial cell count of 108 CFU g-1. The cell
count of S. cerevisiae increased during the first 24 h and grew to a maximum number of
109 CFU g-1. Upon prolonged fermentation, the S. cerevisiae cell count declined down to 104
CFU g-1 (Fig. 4.33 a). The size of the L. fermentum cell count increased during fermentation
and grew to a maximum population of 108 CFU g-1 after 72 h of fermentation. Afterwards,
the L. fermentum cell count decreased to 105 CFU g-1, before slightly decreasing until the end
of fermentation to 104 CFU g-1 (Fig. 4.33 a). A. pasteurianus was added to the fermented
cocoa bean mass after 48 h of fermentation with an initial number of 108 CFU g-1, before
increasing rapidly to a maximum cell count of 108 CFU g-1 after 72 h, followed by a decline
until the end of fermentation down to 104 CFU g-1 (Fig. 4.33 a).
To investigate the growth of the starter culture during fermentation with only 10% of pulp,
cocoa beans were inoculated with S. cerevisiae and L. fermentum at the onset of
fermentation with an initial cell count of 107 and 106 CFU g-1, respectively. A. pasteurianus
was inoculated after 48 h of fermentation with an initial cell count of 108 CFU g-1. The cell
count of S. cerevisiae increased during the first 24 h of fermentation to a maximum number
of 108 CFU g-1. After 24 h of fermentation, the S. cerevisiae cell count declined down to a
minimum of 101 CFU g-1 until the end of fermentation (Fig. 4.33 b). The size of the
L. fermentum cell count increased during fermentation and grew to a maximum population
of 108 CFU g-1 after 72 h of fermentation. Afterwards, the L. fermentum cell count decreased
to 106 CFU g-1, before slightly decreasing until the end of fermentation to 105 CFU g-1
(Fig. 4.33 b). A. pasteurianus was added to the fermented cocoa beans mass after 48 h of
fermentation with an initial number of 108 CFU g-1, before increasing rapidly to a maximum
cell count of 109 CFU g-1 after 72 h, followed by a decline until the end of fermentation down
to 106 CFU g-1 (Fig. 4.33 b).
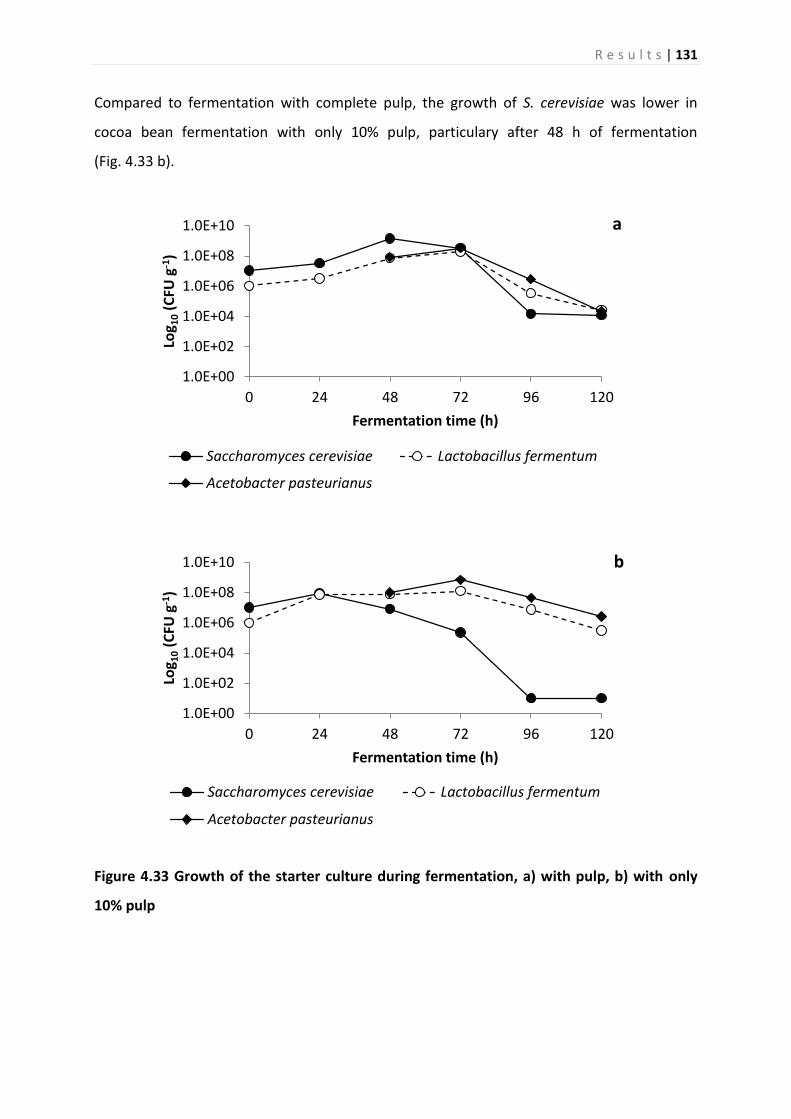
R e s u l t s | 131
Compared to fermentation with complete pulp, the growth of S. cerevisiae was lower in
cocoa bean fermentation with only 10% pulp, particulary after 48 h of fermentation
(Fig. 4.33 b).
Figure 4.33 Growth of the starter culture during fermentation, a) with pulp, b) with only
10% pulp
1.0E+00
1.0E+02
1.0E+04
1.0E+06
1.0E+08
1.0E+10
0 24 48 72 96 120
Log 1
0 (
CFU
g-1
)
Fermentation time (h)
a
Saccharomyces cerevisiae Lactobacillus fermentum
Acetobacter pasteurianus
1.0E+00
1.0E+02
1.0E+04
1.0E+06
1.0E+08
1.0E+10
0 24 48 72 96 120
Log 1
0 (
CFU
g-1
)
Fermentation time (h)
b
Saccharomyces cerevisiae Lactobacillus fermentum
Acetobacter pasteurianus
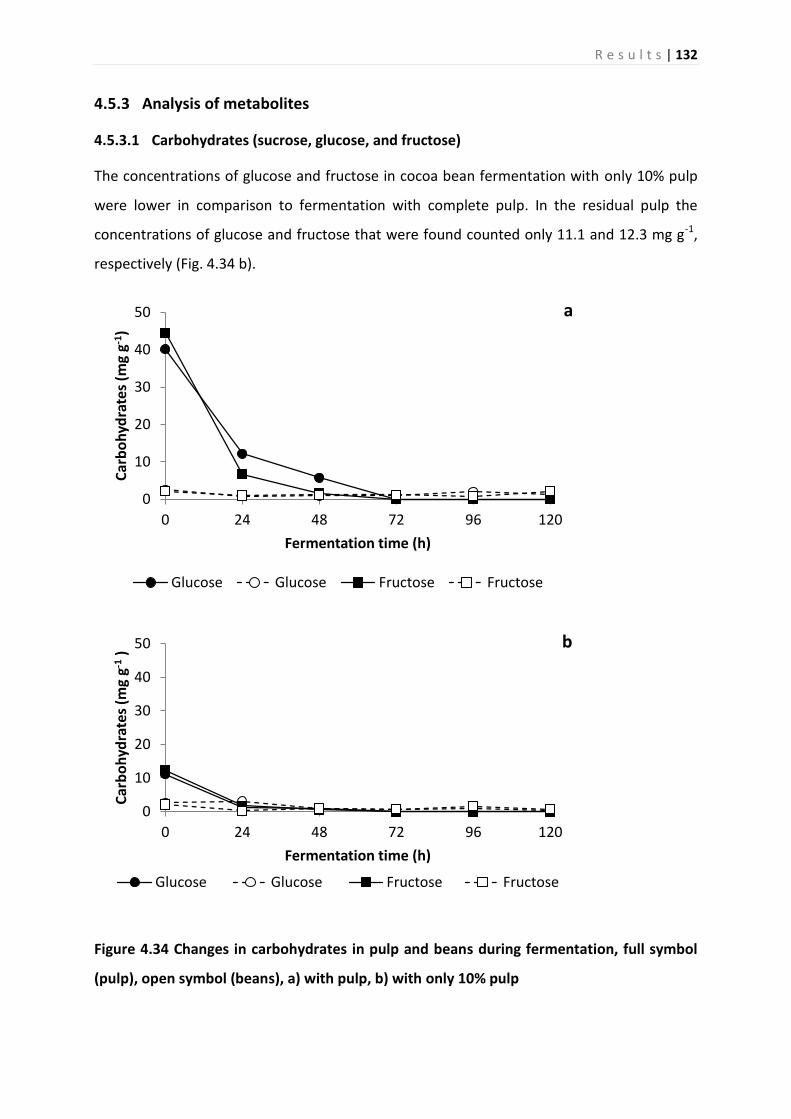
R e s u l t s | 132
4.5.3 Analysis of metabolites
4.5.3.1 Carbohydrates (sucrose, glucose, and fructose)
The concentrations of glucose and fructose in cocoa bean fermentation with only 10% pulp
were lower in comparison to fermentation with complete pulp. In the residual pulp the
concentrations of glucose and fructose that were found counted only 11.1 and 12.3 mg g-1,
respectively (Fig. 4.34 b).
Figure 4.34 Changes in carbohydrates in pulp and beans during fermentation, full symbol
(pulp), open symbol (beans), a) with pulp, b) with only 10% pulp
0
10
20
30
40
50
0 24 48 72 96 120
Car
bo
hyd
rate
s (m
g g-1
)
Fermentation time (h)
a
Glucose Glucose Fructose Fructose
0
10
20
30
40
50
0 24 48 72 96 120
Car
bo
hyd
rate
s (m
g g-1
)
Fermentation time (h)
b
Glucose Glucose Fructose Fructose

R e s u l t s | 133
4.5.3.2 Organic acids (citric acid, lactic acid, acetic acid)
Citric acid was utilized during fermentation, whereas lactic acid and acetic acid were
produced. No significant differences in concentrations of citric acid, lactic acid and acetic
acid between fermentation with complete pulp and with only 10% pulp were to be seen,
both in the pulp and and in the beans (Fig. 4.35, 4.36).
Figure 4.35 Changes in organic acids in the pulp during fermentation, a) with pulp, b) with
only 10% pulp
0
5
10
15
20
25
0 24 48 72 96 120
Org
anic
aci
ds
(mg
g-1)
Fermentation time (h)
a
Citric acid Lactic acid Acetic acid
0
5
10
15
20
25
0 24 48 72 96 120
Org
anic
aci
ds
(mg
g-1 )
Fermentation time (h)
b
Citric acid Lactic acid Acetic acid

R e s u l t s | 134
Figure 4.36 Changes in organic acids in the beans during fermentation, a) with pulp, b) with
only 10% pulp
0
2
4
6
8
10
0 24 48 72 96 120
Org
anic
aci
ds
(mg
g-1)
Fermentation time (h)
a
Citric acid Lactic acid Acetic acid
0
2
4
6
8
10
0 24 48 72 96 120
Org
anic
aci
ds
(mg
g-1)
Fermentation time (h)
b
Citric acid Lactic acid Acetic acid

R e s u l t s | 135
4.5.3.3 Ethanol
Compared to the fermentation with complete pulp, the production of ethanol was 2 mg g-1
lower in the fermentation with only 10% pulp in the pulp. In contrast with pulp the
concentration of ethanol in the beans was 2 – 4 mg g-1 higher in cocoa bean fermentation
with complete pulp (Fig. 4.37 a, b).
Figure 4.37 Changes in ethanol during fermentation, a) with pulp, b) with only 10% pulp
0
2
4
6
8
10
12
14
0 24 48 72 96 120
Eth
ano
l (m
g g-1
)
Fermentation time (h)
a
Pulp Beans
0
2
4
6
8
10
12
14
0 24 48 72 96 120
Eth
ano
l (m
g g-1
)
Fermentation time (h)
b
Pulp Beans
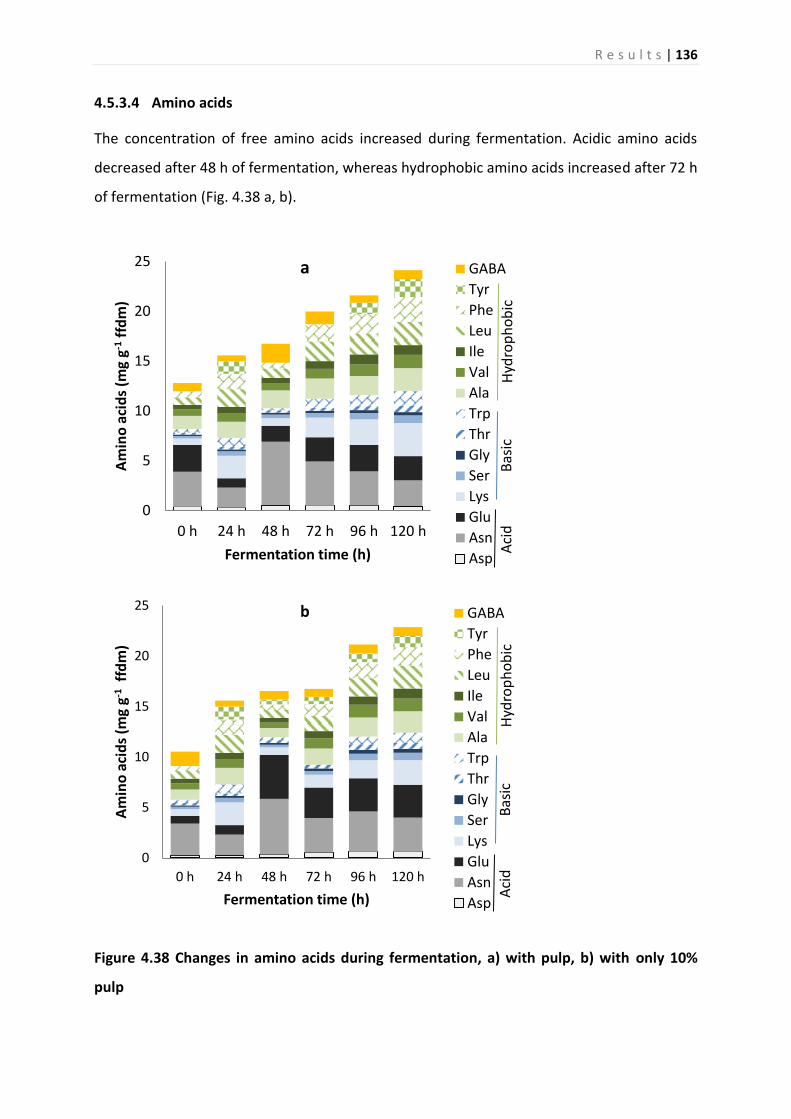
R e s u l t s | 136
4.5.3.4 Amino acids
The concentration of free amino acids increased during fermentation. Acidic amino acids
decreased after 48 h of fermentation, whereas hydrophobic amino acids increased after 72 h
of fermentation (Fig. 4.38 a, b).
Figure 4.38 Changes in amino acids during fermentation, a) with pulp, b) with only 10%
pulp
0
5
10
15
20
25
0 h 24 h 48 h 72 h 96 h 120 h
Am
ino
aci
ds
(mg
g-1 f
fdm
)
Fermentation time (h)
a GABA
Tyr
Phe
Leu
Ile
Val
Ala
Trp
Thr
Gly
Ser
Lys
Glu
Asn
Asp
0
5
10
15
20
25
0 h 24 h 48 h 72 h 96 h 120 h
Am
ino
aci
ds
(mg
g-1 f
fdm
)
Fermentation time (h)
b GABA
Tyr
Phe
Leu
Ile
Val
Ala
Trp
Thr
Gly
Ser
Lys
Glu
Asn
Asp
Hyd
rop
ho
bic
B
asic
A
cid
H
ydro
ph
ob
ic
Bas
ic
Aci
d
R e s u l t s | 137
There is no significant difference in the concentration of free amino acids between
fermentation with complete pulp and with only with only 10% pulp.

| 138
5 Discussion
5.1 Dynamics and biodiversity of the populations of yeasts, lactic acid
bacteria (LAB) and acetic acid bacteria (AAB) involved in the
spontaneous box fermentation of cocoa beans in Nusantara Plantation
XII (PTPN XII), East Java, Indonesia
The fact that temperature of cocoa bean mass increased from an initial temperature of 28 °C
to a maximum value of 48 °C, is caused by the conversion of pulp sugar into ethanol by
yeasts and by the further oxidation of ethanol into acetic acid by AAB which is an exothermal
process. This exothermal process produces a lot of energy and causes rise in the
temperature of the fermenting mass during fermentation (Camu et al. 2007; Nielsen et al.
2007; Schwan and Wheals 2004; Thompson et al. 2001). Typically cocoa bean box
fermentations at PTPN XII are always turned every 24 h during fermentation.
The activity of microbes during cocoa bean fermentation is characterized by the metabolism
of pulp sugars in fresh cocoa beans and the production of significant amounts of ethanol,
lactic acid, and acetic acid during fermentation (Ardhana and Fleet 2003; Lopez and Dimick
1995). Pulp sugars (glucose, fructose) and organic acid (citric acid) were utilized during
fermentation, paralleled by increasing concentrations of ethanol, glycerol, lactic acid and
acetic acid. Glucose and fructose were utilized by yeasts to produce ethanol and carbon
dioxide. LAB utilized glucose, fructose and citrate to produce lactic acid, acetic acid, ethanol
and mannitol. AAB oxidized ethanol into acetic acid. The citric acid metabolized during
fermentation caused the pH of the pulp to increase during this process.
In the first 24-48 h, yeasts were the dominant population of the cocoa bean box
fermentations. The consistent presence of yeasts during earlier phases of fermentation was
also reported by Ardhana and Fleet (2003) for cocoa bean fermentations in Java, Indonesia
and even from different countries such as Ghana (Nielsen et al. 2007), Ecuador
(Papalexandratou et al. 2011 c), Malaysia (Meersman et al. 2013; Papalexandratou et al.
2013), Brazil and Ivory Coast (Papalexandratou and De Vuyst 2011).

D i s c u s s i o n | 139
Ten different yeasts species were found during cocoa bean box fermentation in nusantara
plantation XII (PTPN XII). This diversity of yeasts species was even greater than that
previously reported by Ardhana and Fleet (2003). For example, the species of H. thailandica,
P. kudriavzevii, I. orientalis, T. delbrueckii and S. roseus were not found by Ardhana and Fleet
(2003).
H. thailandica, S. cerevisiae, H. opuntiae, H. guilliermondii, and C. tropicalis were the
dominant yeast species present during the first 24 h of fermentations. However, the
population size decreased after about 24 h. Other yeast species such as P. kudriavzevii and
I. orientalis also contributed to the beginning of fermentation but in low numbers.
H. guilliermondii, S. cerevisiae, and C. tropicalis were also reported by Ardhana and Fleet
(2003) as predominant yeasts species during the early phase of fermentation. In contrast to
this H. thailandica and H. opuntiae were not reported by Ardhana and Fleet (2003).
H. opuntiae was reported to be the predominante species of yeast during early phase of
well-performed Malaysian cocoa bean box fermentation (Papalexandratou et al. 2013),
while H. thailandica, T. delbrueckii and P. kudriavzevii were reported to be present at higher
densities during spontaneous cocoa bean box fermentation in Malaysia (Meersman et al.
2013).
After 24 h of fermentation, T. delbrueckii and S. roseus were also isolated. However, only
limited numbers of yeasts species have adapted to the cocoa bean mass environment. Only
yeasts with specific characteristics like resistance to lactic acid, growth at 40 °C or in the
range of 40 to 50 °C, and tolerance to high ethanol and acid concentrations have been found
to persist until the later stages of cocoa bean fermentation (Lima et al. 2011). Overall, only S.
cerevisiae has been able to survive until the end of fermentation. This is due to the adaptive
ability of this species to survive heat and high concentrations of acid and ethanol (see
Section 5.2).
Citric acid-consuming yeasts, were also isolated in this study during early phases of
fermentation namely, I. orientalis. The main activity of this species is to break down the citric
acid in the pulp, leading to an increase in the pH of the pulp during fermentation (Jespersen
et al. 2005; Schwan and Wheals 2004).

D i s c u s s i o n | 140
Most of the species reported in this study have also been reported previously in
spontaneous cocoa bean fermentations worldwide, but one of these species
Sporobolomyces roseus has thus far never been associated with spontaneous cocoa bean
fermentations. S. roseus is belonging to red to pinkish ballistoconidia-forming yeasts (Bai et
al. 2002; Nakase 2000). This strain was later described as Sporidiobolus metaroseus sp. nov
(Valério et al. 2008) and has also been found in other substrates such as air, seawater,
freshwater, and phylloplane (Valério et al. 2008).
The production of toxic ethanol and the increase in temperature as well as the further
conversion of ethanol to toxic acetic acid by AAB later in the fermentation seem to be
responsible for the rapid decline in the dominance of yeasts during fermentation (Camu
et al. 2007). Our study shows for the first time that the decline of the yeasts population after
48 h of fermentation was caused by antifungal proteins in the cocoa bean seed coat slime
(see Section 5.4).
As pulp drains away, more air penetrates the fermenting mass, ethanol is still produced
through the activity of the yeasts, and both temperature and pH increase up to 40 °C and
pH 4.0, respectively. These conditions are favorable for the growth of lactic acid and acetic
acid bacteria.
LAB grew from the beginning of fermentation and increased to a maximum population size
at 48-72 h of fermentation. The primary activity of LAB is to metabolize pulp sugars (glucose,
fructose) and some organic acids (citric acid, malic acid) by homofermentative and
heterofermentative metabolism. The end products of lactic acid, acetic acid, ethanol,
mannitol and carbon dioxide have an impact on the acidity and quality of the beans
(Axelsson 2004; Schwan and Wheals 2004; Thompson et al. 2001).
A small number of LAB species was found in this study, including L. plantarum, L. fermentum
and L. brevis. This finding was confirmed by Ardhana and Fleet (2003), who showed only a
limited number of LAB species in cocoa bean box fermentations in Indonesia. In contrast to
this, other studies in Ghana (Camu et al. 2007; Nielsen et al. 2007), Brazil (Garcia-Armisen et
al. 2010; Papalexandratou et al. 2011 a), the Ivory Coast (Papalexandratou et al. 2011 a),
Ecuador (Papalexandratou et al. 2011 c), and Malaysia (Papalexandratou et al. 2013) found a
wide number of LAB species.

D i s c u s s i o n | 141
Both L. plantarum and L. fermentum were counted in high numbers during fermentation
(Schwan and Wheals 2004; Thompson et al. 2001). In contrast with findings previously
reported by Ardhana and Fleet (2003), L. plantarum was more consistent during
fermentation than L. fermentum, while L. brevis was less consistent during fermentation.
However, L. plantarum and L. fermentum are the most dominant LAB species worldwide, for
example in Ghana (Camu et al. 2007; Nielsen et al. 2007), Brazil (Garcia-Armisen et al. 2010;
Papalexandratou et al. 2011 a), the Ivory Coast (Papalexandratou et al. 2011 a), Ecuador
(Papalexandratou et al. 2011 c), and Malaysia (Papalexandratou et al. 2013).
AAB growth was observed during the earlier phases of cocoa bean fermentation and
increased until the end of fermentation. The intensive activity of yeasts and LAB metabolized
pulp sugars and organic acids together with pectinolytic activity, causing the pulp to drain
away, and increasing the temperature to more than 37 °C. This activity corresponds with the
turnover of the cocoa beans every 24 h, which can lead to better aeration of the cocoa bean
mass. Those aerobic conditions favor the growth of AAB. The main activity of AAB is to
oxidize ethanol, initially formed by yeasts, into acetic acid, which provides them with the
necessary energy. This exothermic reaction is mainly responsible for the rise in temperature
of the fermenting mass.
Several AAB species have been found during fermentation, including A. pasterianus,
A. pomorum, A. ghanensis, and A. tropicalis. Compared to Ardhana and Fleet (2003), the AAB
species in this study showed greater diversity, with A. ghanensis, and A. tropicalis for
example, not having been found by Ardhana and Fleet (2003). Only A. pasterianus and
A. pomorum were dominant and found consistently until the end of fermentation. This
finding was also confirmed by previous studies from Indonesia, Ghana and Malaysia
(Ardhana and Fleet 2003; Camu et al. 2007; Meersman et al. 2013). The diversity of AAB
species in cocoa bean box fermentation in Indonesia was less than previously reported in
studies from Ghana (Camu et al. 2007; Nielsen et al. 2007), Brazil (Garcia-Armisen et al.
2010), Ecuador (Papalexandratou et al. 2011 d) and Malaysia (Meersman et al. 2013;
Papalexandratou et al. 2013).
It is generally accepted from previous studies that S. cerevisiae, L. plantarum, L. fermentum
and A. pasteurianus are the key microbiota observed during cocoa bean fermentations

D i s c u s s i o n | 142
worldwide (Ardhana and Fleet 2003; Camu et al. 2007; Garcia-Armisen et al. 2010; Nielsen et
al. 2007; Papalexandratou et al. 2011 a; Papalexandratou et al. 2011 c; Papalexandratou et
al. 2013; Papalexandratou and Vuyst 2011). The activity of yeasts (particularly S. cerevisiae),
LAB (particularly L. plantarum, and L. fermentum) and AAB (particularly A. pasteurianus) is
correlating to the sequence of microbial communities during cocoa bean fermentation
described in literature (Camu et al. 2007; Lima et al. 2011; Schwan and Wheals 2004).
The intense metabolic activity and secretion of pectinolytic enzymes by yeasts and
eventually molds leads to the degradation and drainage of pulp. After 48 h of fermentation,
approximately 80% of the pulp was degraded, a condition in which yeasts and molds can
come into close contact with the slime of the cocoa bean seed, leading to the death of
yeasts and molds. Yeasts producing pectinolytic enzymes (Kluyveromyces marxianus and
S. cerevisiae var. chevalieri) were reported before (Schwan et al. 1995; Schwan et al. 1997;
Jespersen et al. 2005). Ardhana and Fleet (2003) reported also molds (P. citrinum) producing
pectinolytic enzymes.
During fermentation, the concentration of citric acid decreased as the result of the
assimilation of citrate by L. plantarum during the early phases of fermentation (Ardhana and
Fleet 2003; Camu et al. 2007; Palles et al. 1998; Schwan and Wheals 2004; Thompson et al.
2001). The consumption of citrate by L. plantarum also explains the increase in pH during
fermentation (Camu et al. 2007; Schwan and Wheals 2004; Thompson et al. 2001). The
concentration of succinic acid also increased after 24 h of fermentation. LAB producing
succinic acid from citric acid has been previously reported (Kaneuchi et al. 1988).
The concentration of mannitol was found to be increased after 24 h of fermentation due to
the consumption of fructose by L. fermentum and its conversion into mannitol. The
production of mannitol enables the production of acetic acid and extra ATP, contributing to
both volatile acidity and enhanced growth competitiveness, respectively (Camu et al. 2007;
Wisselink et al. 2002). Further, the concentration of volatile acids likely influences the quality
of fermented cocoa beans (Camu et al. 2007; Holm et al. 1993; Jinap and Zeslinda 1995).
The concentration of acetic acid increased after 48 h of fermentation, paralleled by the
increased population of AAB. At the end of fermentation after about 72-96 h, the
concentration of acetic acid increased and the temperature was increased to 40-45 °C. Part

D i s c u s s i o n | 143
of the acetic acid volatilized, while another part penetrated into the cotyledons of the beans
and was, together with part of the ethanol and the heat, responsible for certain changes in
the subcellular structure of the beans as well as killing the cocoa seed embryo (de Brito et al.
2001), a processes which represents an important end point of fermentation (Camu et al.
2007).
Bean death is a prerequisite for certain biochemical reactions responsible for the formation
of chocolate flavour precursors. Bean death usually occurs on the second day of
fermentation and is mainly caused by an increase in internal acetic acid concentration (Camu
et al. 2007). The production of ethanol during the anaerobic growth of yeasts correlates very
closely with the death of the seed embryo resulting in a total inability of the seeds to
germinate occurring about 24 h after maximum concentrations of ethanol are attained
within the bean cotyledons (Thompson et al. 2001).
5.2 Diversity and characterization of yeasts, lactic acid bacteria and acetic
acid bacteria in spontaneous cocoa bean fermentations carried out in
Jember, Indonesia; Mocache, Ecuador; Santo Domingo, Trinidad &
Tobago
Cocoa bean fermentation has a serious impact on the formation of the characteristic flavour
and color precursors of cocoa (De Vuyst et al. 2010; Schwan and Wheals 2004). In addition,
fermentation practices such as methods used and the duration of the fermentation may
influence the nature and course of local cocoa bean fermentations (Wood and Lass 2008).
Therefore, extensive studies have been conducted to determine the influence of external
factors on the fermentation process in order to improve traditional practices so that the best
final products can be achieved (Camu et al. 2008; Camu et al. 2007; Nielsen et al. 2007;
Schwan 1998).
Most of the yeast species isolated from all regions (Tab. 4.4) were only found during the
early phase of the fermentation, due to their physiological ability to grow in the cocoa bean
environment during fermentation. However, S. cerevisiae seems to be more tolerant to acid,
ethanol and heat, as it can still be isolated until the end of fermentation, as seen in the

D i s c u s s i o n | 144
samples from Indonesia and Ecuador. None of the yeast species isolated during the early
phases of fermentation were able to grow at 35 °C and 15% ethanol. This explains why these
species can not be isolated after 48 h of fermentation. S. cerevisiae and P. kudriavzevii were
able to grow at 45 °C, pH 2.5 and 15% ethanol concentration (Tab. 4.7).
The diversity of yeast species present during cocoa bean fermentation in Ecuador was
greater compared to that in Indonesia and Trinidad & Tobago (Tab. 4.4). None of the yeast
species isolated during early phases of cocoa bean fermentation from Ecuador including
B. albus, C. parapsilosis (synonym C. quercitrusa), C. tropicalis, C. laurentii, M. pulcherrima,
R. mucilaginosa, T. delbrueckii and W. anomalus were able to grow at 35 °C and 15%
ethanol. This explains why these species could not be isolated after 48 h of fermentation
(Tab 4.7).
During early phases of fermentation in cocoa bean fermentations from Ecuador,
fermentative yeasts such as H. guilliermondii, T. delbrueckii, C. tropicalis, and C. parapsilosis
(synonym C. quercitrusa) could be isolated, as well as respiratory yeasts species such as
R. mucilaginosa.
B. albus, M. pulcherrima and R. mucilaginosa represented the main yeast species involved in
cocoa bean fermentations from Ecuador. The latter has not yet been reported for cocoa
bean fermentations. B. albus was originally isolated from straw of Hordeum jubatum in the
USA (Boekhout et al. 1991). M. pulcherrima was originally isolated from grapes in California
(Mrak and McClung 1940). C. parapsilosis (synonym C. quercitrusa) and C. laurentii were
isolated during earlier phases of cocoa bean fermentations from Ecuador, though species
had not been previously reported by Papalexandratou et al. (2011 d) in Ecuadorian cocoa
bean fermentations.
In contrast to cocoa bean fermentations from Indonesia and Trinidad & Tobago,
fermentation in Ecuador was dominanted by W. anomalus during the earlier phases of
fermentation. W. anomalus is frequently associated with spoilage or processing in food and
grain products. Its ability to grow on a wide range of carbon sources at low pH under high
osmotic pressure and with little or no oxygen enables it to propagate in a wide range of
environments (Passoth et al. 2006). It is a non Saccharomyces wine yeast that contributes to
the wine aroma observed in the production of volatile compounds. In recent years it has

D i s c u s s i o n | 145
been used as a biocontrol agent against other fungi due to its ability to produce mycocin
killer toxins (Naumov et al. 2001; Wang et al. 2009). It has also been studied for its cyanide-
resistant alternative oxidase activity (Minagawa et al. 1990; Minagawa and Yoshimoto 1987)
and it possesses an active beta-glucosidase that plays a role in wine fermentations
(Swangkeaw et al. 2011).
In the present study, H. thailandica, I. orientalis, P. kudriavzevii, and S. roseus were only
isolated out of cocoa bean fermentations from Indonesia. During earlier phases of
fermentation, fermentative yeasts such as S. cerevisiae, H. guilliermondii, T. delbrueckii,
C. tropicalis, and I. orientalis could also be found. I. orientalis, a citric acid-consuming yeast,
could be isolated during early phases of fermentation. The main activity of I. orientalis is to
break down the citric acid in the pulp, leading to an increase in the pH of the pulp during
fermentation (Jespersen et al. 2005; Schwan and Wheals 2004). S. roseus was isolated only
in the end of fermentation, probably due to contamination from the fermentation box.
P. kudriavzevii has been reported to be an acid- and ethanol-tolerant yeast species (Okuma
et al. 1986; Daniel et al. 2009). It ferments reducing carbohydrates at a slower rate than
S. cerevisiae, but it is able to use malic acid efficiently, in contrast to S. cerevisiae (Kim et al.
2008). Although P. kudriavzevii partially reduces citric acid, cocoa-originating H. opuntiae
and S. cerevisiae isolates do not assimilate citric acid, indicating a possible role of
P. kudriavzevii in citric acid conversion in addition to that of LAB (Camu et al. 2007, 2008 a, b;
Daniel et al. 2009).
H. guilliermondii was more prevalent because of its ability to survive in the cocoa bean mass
environment (Tab. 4.7). H. thailandica represented the main yeast species involved in the
Indonesian fermentations and has not yet been reported before for Indonesian cocoa bean
fermentations by Ardhana and Fleet (2003). H. thailandica was originally isolated from insect
frass in Khao-Yai National Park, Thailand (Jindamorakot et al. 2007).
Compared to the microbial diversity in cocoa bean fermentations from Indonesia and
Ecuador, fermented cocoa beans from Trinidad & Tobago showed a lower level of yeast
diversity but strains of S. cerevisiae and H. guilliermondii could be isolated. Smaller numbers
of yeasts were observed in the fermentation of cocoa beans from Trinidad & Tobago

D i s c u s s i o n | 146
(Tab. 4.4), due to the high fermentation temperatures, which can reach up to 56 °C (Ostovar
and Keeney 1973).
In general, a limited number of yeast species was found in cocoa bean fermentations from
different cocoa-producing regions, with H. guilliermondii being the prevailing species during
the initial phase of fermentation before being replaced by S. cerevisiae which dominates
until the end of fermentation. In the present study and based on the samples analyzed,
S. cerevisiae was the predominant yeast species found in most fermentations. S. cerevisiae
and P. kudriavzevii were able to grow at 45 °C, pH 2.5 and 15% ethanol concentration
(Tab. 4.7). This explains why S. cerevisiae was the dominant species until the end of
fermentation.
As pulp drains away, more air penetrates the fermenting mass. Ethanol is still produced
through yeast activity, and both temperature and pH increase up to 40 °C and pH 4.0,
respectively. These conditions are favorable for the growth of lactic acid and acetic acid
bacteria. The primary activity of LAB is to metabolize pulp sugars (glucose, fructose) and
some organic acids (citric acid, malic acid) by homofermentative and heterofermentative
mechanisms, into lactic acid, acetic acid, ethanol, mannitol and carbon dioxide. These end
products have an impact on the acidity and quality of the resulting bean (Axelsson 2004;
Schwan and Wheals 2004; Thompson et al. 2001).
The diversity of LAB species found during cocoa bean fermentations from Ecuador was
greater than that out of the Indonesian and Trinidad & Tobago samples (Tab. 4.5). During
early phases of Ecuadorian cocoa bean fermentation both, L. plantarum and L. fermentum,
as well as L. pseudomesenteroides could be isolated. P. acidilactici and P. pentosaceus also
prevailed during the later phase of fermentation. Cocoa beans from Ecuador were
fermented by heterofermentative LAB species during the early phase. Afterwards,
homofermentative LAB species were found to dominante. Lactic acid can be produced by
either homofermentative metabolism, with a yield higher than 85%, or heterofementative
metabolism, with a yield of only 50% (Axelsson 2004).
The ability of LAB species to adapt to the conditions of fermenting mass environment
explains how they can survive until the end of fermentation. L. fermentum, L. plantarum,
and P. acidilactici grew at 45 °C, while isolates of P. pentosaceus showed weak growth at
D i s c u s s i o n | 147
45 °C. Species of L. fermentum, L. plantarum, P. acidilactici and P. pentosaceus have the
ability to grow at pH 3.5 and 10% ethanol (Tab. 4.8).
LAB grew during the early phase of cocoa bean fermentation in Indonesia. Only a small
number of LAB species was found in samples from Indonesia cocoa bean fermentations
including L. plantarum, L. fermentum and L. brevis. Both L. plantarum and L. fermentum were
counted in high numbers during fermentation, while L. brevis could be temporarly isolated
during fermentation. All of the LAB species involved in cocoa bean box fermentations from
Indonesia were heterofermentative species. L. plantarum and L. fermentum have the ability
to grow at 45 °C, pH 3.5 and 10% ethanol, while L. brevis did not grow at 45 °C, and 10%
ethanol. This explains why only L. plantarum and L. fermentum can survive until the end of
fermentation (Tab. 4.8).
Similar to fermented cocoa beans from Ecuador, fermented cocoa beans from Trinidad &
Tobago were fermented by heterofermentative and homofermentative LAB species.
A number of LAB species was found in different cocoa bean fermentations in different
cocoa-producing regions, with L. plantarum and L. fermentum being the prevailing species in
fermentations in all regions. Homofermentative LAB species such as P. acidilactici and
P. pentosaceus were found to dominate during late phases of fermentation in cocoa bean
fermentations from Ecuador.
The intensive activity of yeasts and LAB in the metabolization of pulp sugar and acid causes
the pulp to drain away. This leads to an increase in temperature to above 37 °C, a result of
the transfer of the cocoa beans every 24 h, which provides better aeration to cocoa bean
mass. This condition favours the growth of AAB. The main activity of AAB is to oxidize
ethanol, initially formed by the yeasts, into acetic acid, which provides them with necessary
energy. This exothermic reaction is mainly responsible for the rise in temperature of the
fermenting mass.
Fermented cocoa beans from Indonesia showed the greatest diversity of AAB species
compared to samples from Ecuador and Trinidad & Tobago (Tab. 4.6). A. pasteurianus was
the only AAB species isolated from cocoa bean fermentations from Ecuador and Trinidad &
Tobago. A. pasteurianus and A. pomorum were consistently isolated during the course of

D i s c u s s i o n | 148
cocoa bean box fermentations from Indonesia. Only A. pasteurianus was isolated
consistently from fermentations from all regions (Tab. 4.6).
Only a strain of A. pasteurianus showed weak growth at 45 °C. A. ghanensis and A. pomorum
did not grow at 45 °C. A. pasteurianus, A. ghanensis, A. pomorum, and A. tropicalis showed
growth at pH 5.0 and 3.5, but not at pH 2.5. A. pasteurianus, A. ghanensis, and A. tropicalis
grew at 5 and 10% ethanol, while A. pomorum grew weakly at 10%. None of these species
grew at 15% ethanol. This fact explains why only A. pasteurianus prevailed during the course
of fermentation and survived until the end of fermentation in all regions (Tab. 4.9).
5.3 Development of a starter culture at laboratory level for improved quality
of cocoa bean fermentation products
The metabolic products of cocoa bean fermentation depend on the microbial population
present during fermentation. The microbial activity in cocoa bean pulp is carried out by a
well-defined succession of microorganisms, led by yeasts, which dominate the total
microbial population during the first hours. These are then surpassed by LAB, which in turn
decline after 48 h of fermentation in favour of the vigorous development of AAB (Lima et al.
2011). The metabolic activity of yeasts in the cocoa bean pulp leads to the production of
ethanol, carbon dioxide, acids, and volatile compounds, with a concomitant increase in
temperature. The primary metabolic activity of LAB is to produce lactic acid, ethanol, acetic
acid and other organic acids, as well as glycerol, mannitol, carbon dioxide and volatiles. The
metabolism of AAB is shifted towards the utilization of ethanol as a main carbon source. AAB
can oxidize ethanol to acetic acid, and species from the genus Acetobacter have the
additional capacity to oxidize acetic acid to carbon dioxide and water (Lima et al. 2011).
Fermentation is the key in developing cocoa and chocolate flavour. Chocolate flavour is an
extremely complex mixture of more than 550 compounds, and as analytical methods
improve this number increases (Nijssen et al. 1996). Whereas undesirable bitter and
astringent tastes decrease during fermentation, desirable fruity, floral and cocoa flavours
develop during fermentation and drying. Essential precursors of the cocoa-specific flavour
components are generated during the microbial fermentation of the pulp surrounding the

D i s c u s s i o n | 149
beans as well as by enzymatic processes in the beans (Biehl et al. 1985; Camu et al. 2008;
Camu et al. 2007; de Brito et al. 2001; Hansen et al. 1998; Rohan 1964). The optimal activity
of the endogenous enzymes is influenced by fermentation temperature and pH, which
increase and decrease in the beans during the course of fermentation, as well as by the
diffusion of ethanol, acetic acid, and to a lesser extent lactic acid into the beans and
polyphenols and alkaloids out of the beans (Camu et al. 2008; Hansen et al. 1998; Wollgast
and Anklam 2000).
Based on previous results from this study (Section 4.1) concerning the dynamics and
biodiversity of the populations of yeasts, lactic acid bacteria (LAB) and acetic acid bacteria
(AAB) involved in the spontaneous box fermentation of cocoa beans in PTPN XII, East Java,
Indonesia a cocoa bean fermentation method (aerobic and anaerobic fermentation) in
laboratory scale was developed. A starter culture under controlled and sterile conditions was
used to investigate the influence of starter cultures and fermentation methods.
No significant difference was observed between the aerobic and anaerobic fermentations
during the first 48 h of fermentation. After 48 h, the growth of S. cerevisiae, L. fermentum
and A. pasteurianus was higher in the aerobic fermentation. Particularly A. pasteurianus
grew to a higher concentration of cells and longer during fermentation because of the
availability of oxygen during fermentation. Conversely, the growth of S. cerevisiae,
L. fermentum and A. pasteurianus was lower in the anaerobic fermentation, particularly
A. pasteurianus as this species represents an obligate aerobic bacterium.
Glucose, fructose and citric acid were utilized during fermentation, both in the aerobic and
anaerobic fermentation. The consumption of glucose, fructose and citric acid in aerobic
fermentation was greater than in the anaerobic fermentation, since the growth of
S. cerevisiae, L. fermentum and A. pasteurianus was greater. Further, the production of
ethanol, lactic acid and acetic acid in the pulp and beans was also greater in the aerobic
fermentation, resulting in larger populations of S. cerevisiae, L. fermentum and
A. pasteurianus during fermentation.
It is known, that well-fermented cocoa contains about 8-14 mg g-1 ffdm and unfermented
cocoa contains as low as 2-4 mg g-1 ffdm free amino acids. Contents as high as 25 mg g-1 ffdm
occur in fermented cocoas are reported in this study. Fermented cocoa beans from

D i s c u s s i o n | 150
Madagascar, Papua New Guinea and Java, Indonesia were also reported to contain high
amounts of free amino acids (Rohsius et al. 2006).
These results show clearly that the content of free amino acid differs between fermentation
methods. In general, the number of free amino acids increased during fermentation, both in
the aerobic and anaerobic fermentation. The production of free amino acids was greater in
the aerobic fermentation compared to the anaerobic fermentation. The largest amount of
free amino acids seen in the aerobic fermentation was 25 mg g-1 ffdm after 120 h of
fermentation, whereas the largest amount of free amino acids in the anaerobic fermentation
was 20 mg g_1 ffdm after 96 h of fermentation. This amount of free amino acids was
relatively higher, compared to the 8-14 mg g-1 ffdm (Rohsius et al. 2006).
The production of hydrophobic amino acids increased during fermentation, both in the
aerobic and anaerobic fermentation, reaching a maximum after 72 h of fermentation in the
aerobic fermentation and after 96 h in the anaerobic fermentation. Conversely, acidic amino
acids decreased during fermentation, both in the aerobic and anaerobic fermentation. Acidic
amino acids decreased after 72 h of fermentation, both in the aerobic and anaerobic
fermentation. The increase in hydrophobic amino acids and hydrophilic oligopeptides is due
to cocoa beans proteolytic activity (Biehl et al. 1993; Camu et al. 2007; Hansen et al. 1998;
Voigt et al. 1994). Differences in these enzyme activities exist between cocoa genotypes, but
they are not linked to differences in cocoa flavour formation (Hansen et al. 1998; Lefeber
et al. 2012).
In general, proteolysis depends primarily on the fermentation conditions, specifically the
duration and intensity of acidification, temperature, and aeration (de Brito et al. 2001;
Kirchhoff et al. 1989). Oxidation, condensation, and complexation (with polypeptides) of
polyphenols can also play a role (de Brito et al. 2001; Jinap et al. 2003). Fermentation
conditions determine the amount of free amino acids, oligopeptides, reducing sugars, and
polyphenols of fermented, dried cocoa beans, which all play an important role in aroma
precursor formation during cocoa processing (de Brito et al. 2001; Thompson et al. 2001).
The metabolite results presented in this paper in combination with literature data indicate
that a successful fermentation process is reached after about 72 h of fermentation (Camu
et al. 2007).

D i s c u s s i o n | 151
In general, the presence of polyphenols in cocoa beans is dependent on several factors,
including degree of pod ripeness, cocoa variety, processing, and storage (Camu et al. 2008;
Hammerstone et al. 1999; Nazaruddin et al. 2006; Porter et al. 1991). However, there are no
qualitative differences in polyphenol compounds in cocoa beans, in spite of their genetic
origin (Camu et al. 2008).
The total polyphenol content decreased throughout fermentation by approximately 10–50%
during 48 h of fermentation, both in the aerobic and anaerobic fermentation. The
concentration of polyphenols was higher in the anaerobic fermentation. Losses of
polyphenols differed between the aerobic and anaerobic fermentation, indicating slight
differences in population dynamics during fermentation. The decrease in polyphenol
concentration is due to their diffusion out of the bean (through water release) and further
oxidation and condensation of the polyphenol compounds (Jinap et al. 2002; Jinap et al.
2003; Nazaruddin et al. 2006; Wollgast and Anklam 2000). Oxidase reactions are both non-
enzymatic and catalyzed by polyphenol oxidase. This polyphenol oxidase is strongly
inactivated during the first days of anaerobic (yeast) fermentation at a temperature of
28 – 35 °C, retaining only 50 and 6% of initial enzyme activity after 1 and 2 days, respectively
(Camu et al. 2008; Hansen et al. 1998).
Although a higher concentration of polyphenols would decrease cocoa flavour (Jinap et al.
2004), efforts are being made to maintain their levels while avoiding taste problems, as
there are abundant health benefits ascribed to polyphenols (Schroeter et al. 2006; Sies et al.
2005; Wollgast and Anklam 2000). The polyphenol concentrations have no influence on the
acidity, fruity/floral flavour, raw/green, and mouldy/earthy properties of chocolate (Camu
et al. 2008; Jinap et al. 2004).
Aerobic fermentation was characterized by a high amino acids and a low polyphenols
content in the fermented beans. This type of bean showed better parameters for the
production of flavour in chocolate. In contrast, anaerobic fermentation was characterized by
high polyphenol content, resulting in healthy raw bean for chocolate production.

D i s c u s s i o n | 152
5.4 Investigation of activity and characterization of antifungal proteins in the
seed coat slime of Theobroma cacao L.
Disk diffusion agar and microdilution were both successfully used for the antifungal assay,
although microdilution was more sensitive than disk diffusion test. The advantage of the
disk-diffusion agar method is its simplicity and low cost as well as the possibility of testing up
to six extracts per plate against a single microorganism using small sample volumes (Hadacek
and Greger 2000).
The disadvantage of the disk diffusion agar method is that the potency of different samples
may not always be proper, mainly because of differences in physical properties, such as
solubility, volatility and diffusion in agar. Compounds with a high diffusion coefficient or
solubility and low antimicrobial activity may penetrate the agar rapidly, even in small
amounts, and give zones like those of active compounds with poor penetration. This
problem is encountered when zones of inhibition are compared for different classes of
compounds. Additionally, the size of the inhibition zones might be influenced by the
volatilization of antimicrobial substances, disk size, the amount of compound added to the
disk, adsorption by the disk, the type of agar, agar strength, pH, the volume of agar, and
microbial strains used (Pauli 2006; Scorzoni et al. 2009).
In the dilution method, each compound is mixed with an appropriate medium that has
previously been inoculated with the fungal strain. It is thus possible to determine the
minimal inhibitory concentration (MIC), which is defined as the lowest concentration
capable of inhibiting any visible fungal growth. Turbidity due to growth can be estimated
visually or more accurately by measuring the optical density at 490nm. The liquid-dilution
method can also be used to determine whether a compound or extract has a fungicidal or
fungistatic action at a given concentration. This test yielded the most reproducible results for
the MIC and was recommended as the general standard method for testing natural products
(Hadacek and Greger 2000).
In the case of antifungal activity assay for the seed coat slime of Theobroma cacao L., both
the disk diffusion agar and microdilution were used successfully, with microdilution being

D i s c u s s i o n | 153
more sensitive than disk diffusion. A wide variety of fungi was inhibited by antifungal
proteins from seed coat slime of Theobroma cacao L.
Generally, individual fungi within the same taxon reacted similarly to Theobroma cacao L.
seed coat slime. The size of the inhibition zones varied for different fungi, indicating
differences in sensitivity to the levels of inhibitory substances among the test organisms
likely due to a concentration gradient of the substances that presumably developed in the
agar around the seeds. Zones of inhibition were very diffuse for certain fungi, suggesting an
effect on fungus growth rate rather than total inhibition of growth.
Some species of fungi were inhibited by seed coat slime. The inhibition activity depends on
the composition of the fungal cell wall. Fungi with cell walls containing β-glucan and chitin
showed greater sensitivity to seed coat slime antifungal proteins such as chitinase and
glucanase. Chitinase and glucanase act synergistically to hydrolyze the structural (1,3)
β-glucan and chitin present in the fungal cell wall, particularly at the hyphal apex of
filamentous fungi where glucan is most exposed. This weakened cell wall results in cell lysis
and cell death (Selitrennikoff 2001). On the other hand, fungi with cell walls containing
chitosan (e.g. Mucor sp., Rhizopus oligosporus) are more resistant to seed coal slime, as seed
coat slime does not contain chitosanase.
Seed coat slime from Theobroma cacao L. inhibited the growth of a number of fungi such as
A. niger, A. flavus, A. parasiticus, M. isabellina, P. citrinum, P. purpurogenum and
P. roquefortii as well as a number of yeasts such as C. krusei, C. lipolytica, C. guilliermondii,
C. laurentii, R. mucilaginosa, R. rubra, S. cerevisiae and S. pombe. The minimum inhibitory
concentration (MIC) found for seed coat slime was 25 mg mL-1 against fungi (e.g. P. citrinum,
A. niger, P. purpurogenum) and 10 mg mL-1 against yeasts (e.g. S. cerevisiae, R. rubra,
C. lipolytica). These results suggest the opportunity to use seed coat slime for a wide array of
applications such as an antifungal agent against fungi causing black pod disease in Theobora
cacao L. tree, as well as in pharmaceutical or therapeutic applications for combating fungi
that are pathogenic for humans. This is the first report of antifungal protein activity from the
seed coat slime of Theobroma cacao L. Future research is needed for the screening of
antifungal activities from different cocoa varieties, the purification and characterization of

D i s c u s s i o n | 154
antifungal proteins or compounds from seed coat slime and the establishment of methods
for MIC test against pathogenic fungal for medical applications.
Analyses of proteins using nano-electrospray mass spectrometry (Q-TOF II) showed the
existence of three proteins in the cocoa slime that have antifungal effect, namely osmotin
24.1 kDa (6), chitinase 28.8 and 31.6 kDa (7, 8) and glucanase 33 kDa (9).
Osmotin is an antifungal protein belonging to the PR-5 (TL) family of proteins. TL proteins
have been isolated from Arabidopsis thaliana, corn, soybean, rice, wheat, tobacco, tomato,
pumpkin, bean, barley, flax, and many other plants. The majority of PR-5 proteins have
molecular masses of 22 kDa and are stabilized by eight disulfide bonds. This highly stabilized
structure allows PR-5 proteins to be very resistant to protease degradation. Although the
precise mechanism of the action of PR-5 proteins is not completely understood, a number of
interesting observations have been made that may eventually lead to a unified hypothesis
for the mechanism how these proteins function to kill fungi. First, several TL proteins cause
cell permeability changes in fungal cells with a cell wall, but have no or little effect on
protoplasts (Roberts and Selitrennikoff 1990). For example, zeamatin (a TL protein from
corn) causes very rapid cell lysis in Neurospora crassa, even at 4 °C; lysis occurred primarily
at subapical regions (Roberts and Selitrennikoff 1990). Second, osmotin, a TL protein from
tobacco, causes perturbations in the regulation of fungal cell wall assembly (Yun et al. 1998;
Yun et al. 1997). Regardless of the precise mode of action of TL proteins, they are fungicidal
against a wide number of plant and human pathogens in vitro. Most importantly, one
protein, zeamatin, has shown efficacy in a murine vaginal model of Candida albicans
infection (White et al. 2002). PR-5 proteins may be used in the future for the development of
human therapeutics.
Chitinase is an antifungal protein belonging to PR-3 family of proteins. A number of
enzymatic assays have shown PR-3 proteins to have in vitro chitinase activity. Most PR-3
proteins have molecular masses between 26 and 43 kDa (Nielsen et al. 1997; Watanabe et
al. 1999). Chitinases have been isolated from fungi, tobacco, cucumber, beans, peas, grains,
and many others, and have potent antifungal activity against a wide variety of human and
plant pathogens, including Trichoderma reesei, Alternaria solani, Alternaria radicina,
Fusarium oxysporum, Rhizoctonia solani, Guignardia bidwellii, Botrytis cinerea, and Coprinus

D i s c u s s i o n | 155
comatus. By analogy with β-glucanases, the mode of action of PR-3 proteins is relatively
straightforward: PR-3 proteins are endochitinases that cleave cell wall chitin polymers in
situ, resulting in a weakened cell wall and rendering fungal cells osmotically sensitive. Not
surprisingly, PR-2 (β-glucanases) and PR-3 (chitinases) proteins act synergistically in
inhibiting fungal growth, both in vitro and in planta (Jach et al. 1995; Selitrennikoff 2001).
Glucanase is an antifungal protein belonging to the PR-2 family of proteins (β-glucanases).
PR-2 proteins have (1,3) β-endoglucanase activity in vitro and have been grouped into three
classes based on amino acid sequence analysis. Class I glucanases are basic proteins of
33 kDa and are found in the plant vacuole. Classes II and III include acidic, extracellular
proteins of about 36 kDa. The major structural difference between class I proteins and the
other two classes is that class I proteins are synthesized as preproproteins that are
processed prior to being enzymatically active. PR-2 proteins have been found in a wide
variety of plants, including tobacco, Arabidopsis thaliana, peas, grains, and fruits (Cote et al.
1991; Kim and Hwang 1997). The proteins are active in vitro at micromolar levels ( ~50 µg
mL-1) against a wide number of fungi, including human and plant pathogens (e.g.,
Rhizoctonia solani, C. albicans, and Aspergillus fumigatus). The antifungal activity of plant
(1,3) β-glucanases is thought to occur by PR-2 proteins hydrolyzing the structural (1,3)
β-glucan present in the fungal cell wall, particularly at the hyphal apex of filamentous molds
where glucan is most exposed. This weakened cell wall results in cell lysis and cell death
(Selitrennikoff 2001).
The seed coat proteins seem to be degraded during the fermentation process, probably
caused by an increase in temperature and by activity of proteases produced by microbes,
particularly Bacillus sp., during the fermentation. This was confirmed by the heat stability
test of seed coat slime, whereas the seed coat slime was shown to be not stable for 24 h at
40 and 50 °C. The temperature of fermentation mass increased up to 45 – 50 °C for the last
2 days of fermentation, during which time the population of Bacillus species increased as
well (Ardhana and Fleet 2003; Camu et al. 2007; Nielsen et al. 2007).

D i s c u s s i o n | 156
5.5 Investigation of the influence of seed coat slime slime on growth of
starter culture and physical and chemical changes during cocoa bean
fermentation at laboratory level
It is well known that after 2 days of fermentation alcoholic fermentation by yeasts is
extremely decreased (Ardhana and Fleet 2003; Camu et al. 2007; Nielsen et al. 2007;
Papalexandratou et al. 2011 c; Schwan and Wheals 2004). Until recently, the reason for this
extreme decrease was unknown. Many researchers argue that the collapsing of yeasts after
2 days of fermentation is probably caused by the physiological adaptation of yeasts to heat,
acid and ethanol concentrations during fermentation.
In this study, it was found that the seed coat slime of Theobroma cacao L. inhibits a wide
variety of yeasts commonly found during cocoa bean fermentation.
In this treatment, 90% of cocoa bean pulp was reduced from the bean. After removal of 90%
of the pulp in fermentations using a defined starter the concentration of substrates,
particularly glucose and fructose, decreased by about 75% at onset of fermentation
compared to the control. The concentration of organic acids, particularly citric acid was
similar to the control. The reduced concentration of sugar at the onset of fermentation
affected the growth of the starter culture and hence the metabolic products created during
fermentation.
The growth of the starter culture in fermentations with only 10% pulp was lower compared
to the control (fermentation with pulp), particularly for S. cerevisiae in consequence of the
reduction of sugar concentration at the onset of fermentation and the activity of antifungal
proteins from seed coat slime.
No significant difference was found between fermentations with complete pulp and with
only 10% pulp. 90% of cocoa pulp was reduced, but the concentration of citric acid was
similar between fermentation with complete pulp and with only 10% pulp.
Glucose, fructose and citric acid were utilized during fermentation, whereas ethanol, lactic
acid and acetic acid were produced during fermentation. The production of ethanol was
lower in fermentation with only 10% pulp, due to the lower amount of cells of S. cerevisiae.

D i s c u s s i o n | 157
The concentration of lactic acid and acetic acid was relatively similar to the fermentation
with complete pulp. This means there was no significant effect to be seen by reducing cocoa
seeds pulp at the onset of fermentations.
The concentration of amino acids was relatively similar to that in the control, no significant
effect was found concerning the concentration of amino acids between fermentation with
complete pulp and with only 10% pulp. This is because the metabolized amino acids were
produced by endogenous enzymes, and the activity of these enzymes depends on pH during
fermentation. There was no significant difference in pH during fermentation between
fermentation with complete pulp and with only 10% pulp.

| 158
6 Summary (Zusammenfassung)
6.1 Summary
Cocoa beans are the principal raw material used in chocolate production. These seeds are
derived from the fruit pods of the cocoa tree (Theobroma cacao L.), which is cultivated in
plantations in the equatorial zone, with Ivory Coast, Ghana and Indonesia as the major
producers. Raw cocoa has an astringent unpleasant taste and a spontaneous fermentation is
the first step in a process leading cocoa beans to develop their characteristic cocoa flavour
and taste. The quality of raw cocoa beans is highly dependent on the post-harvest practice of
fermentation. Three main phases occur during cocoa bean fermentation: phase 1 anaerobic
fermentation by yeasts, phase 2 microaerophilic fermentation by lactic acid bacteria and
phase 3 aerobic fermentation by acetic acid bacteria.
The quality of fermented cocoa beans varies between regions of cocoa producer countries,
varieties of cocoa, fermentation methods, drying and cocoa beans storage. The fermentation
itself depends on farm practices such as bean selection, mixing of the fermenting mass and
the activity of microbes during fermentation. Cocoa bean fermentation is a spontaneous,
uncontrolled process that results in end products of variable quality.
It is generally known that after 48 h of fermentation, depectinization of pulp and alcoholic
fermentation by yeasts is extremely decreased. Until recently it was not known why this
occurs. Up to date, the decreasing of yeasts has been most commonly attributed to the
physiological adaptation of yeasts to the fermentation environment during fermentation in
terms of heat, acid and ethanol tolerance.
During the first 24 h of fermentation, yeasts are the dominant species, with Saccharomyces
cerevisiae being stably and consistenly present during fermentation. Lactic acid bacteria
show dominant growth during 48-72 h of fermentation with the species of Lactobacillus
plantarum and Lactobacillus fermentum being dominant. Acetic acid bacteria dominate the
last stage of fermentation, where only species of Acetobacter pasterianus remain consistent
and stable. Glucose, fructose and citric acid of the pulp are metabolised during
fermentation. The metabolic activity of microbes during fermentation produces ethanol,
lactic acid, mannitol, acetic acid, as well as heat. Ethanol, acetic acid, lactic acid and heat

S u m m a r y | 159
diffuse into the bean, causing the death of the bean embryo.
Further results indicated the presence of microbial diversity between different regions of
cocoa bean fermentations. Some species were shown to be present in the cocoa bean
fermentations from all investigated regions. Fermented cocoa beans from Ecuador showed
the highest diversity of yeasts and lactic acid bacteria compared to Indonesia and Trinidad &
Tobago, but the diversity of acetic acid bacteria species was highest in cocoa bean
fermentations from Indonesia. Based on the physiological characterization of dominant
species from all cocoa bean fermentation regions, the use of Saccharomyces cerevisiae IDI-
Y001, Lactobacillus fermentum IDE-L007, and Acetobacter pasteurianus IDI-A019 is
suggested as the best combination for use as a starter culture for cocoa bean fermentation
process.
The development of laboratory fermentation methods showed differences between aerobic
and anaerobic methods. Aerobic fermentation methods were characterized by higher
organic acid concentrations at the end of fermentation and higher free amino acid
concentrations. This is typical for fermented cocoa beans used for the production of
chocolate rich in flavour. The anaerobic fermentation method was characterized by lower
levels of organic acids and free amino acids, but higher polyphenol concentrations. This is
typical for fermented cocoa beans used for the production of healthy chocolate.
A novel result of this study is the fact that the seed coat slime of Theobroma cacao L.
possesses the ability to inhibit the growth of yeasts and molds. 25 mg mL-1 of seed coat slime
inhibit the growth of molds (e.g. Penicillium citrinum, Aspergillus niger, Penicillium
purpurogenum) and 10 mg mL-1 seed coat slime inhibit the growth of yeasts
(e.g. Saccharomyces cerevisiae, Rhodotorula rubra, Candida lipolytica). Analyses of proteins
using nano-electrospray mass spectrometry (Q-TOF II) showed that three proteins have
antifungal effect, namely glucanase (33 kDa), chitinase (28.8 kDa) and osmotin (24.1 kDa).
The seed coat slime proteins were not stable at 40 and 50 °C for 24 h.
Reduction of 90% of pulp can inhibit the growth of the starter culture, specifically growth of
the yeasts after 48 h of fermentation, providing the existence of an inhibition by antifungal
proteins from the seed coat slime.

S u m m a r y | 160
6.2 Zusammenfassung
Kakaosamen sind das Rohmaterial für die Schokoladenproduktion. Diese Samen werden aus
den Früchten des Kakaobaumes (Theobroma cacao L.) gewonnen, der in Plantagen der
Äquatorialzone angebaut wird. Dabei stellen die Elfenbeinküste, Ghana und Indonesien die
hauptsächlichen Kakaoproduktionsländer dar. Roher Kakao hat einen unangenehmen
adstringierenden Geschmack und spontane Fermentationen stellen die erste Stufe in einem
Prozess dar, um den charakteristischen Kakaogeschmack und das charakteristische
Kakaoaroma zu entwickeln. Die Qualität der rohen Kakaosamen ist sehr stark von der
Nacherntebehandlung, der Fermentation, abhängig. Während der Fermentation der
Kakaosamen treten drei Hauptphasen auf: 1) eine anaerobe Fermentation durch Hefen, 2)
eine mikroaerophile Fermentation durch Milchsäurebakterien und 3) eine aerobe
Fermentation durch Essigsäurebakterien.
Die Qualität der fermentierten Kakaosamen variiert zwischen den Regionen der Kakao
produzierenden Länder, den Kakaovarietäten, den Fermentationsmethoden, der Trocknung
und der Lagerung der Kakaosamen. Die Fermentation selber hängt von den auf den Farmen
durchgeführten Verfahren, wie der Auswahl der Samen, der Umwälzung der
fermentierenden Masse und der mikrobiellen Aktivität während der Fermentation, ab.
Grundsätzlich ist die Fermentation der Kakaosamen ein spontaner unkontrollierter Prozess,
der zu Endprodukten mit unterschiedlicher Qualität führt.
Es ist generell bekannt, dass die alkoholische Gärung und der Pektinabbau durch die Hefen
nach 48 Stunden Fermentation nachlässt. Die Ursache dafür war bis jetzt unbekannt. Bis
jetzt ist man davon ausgegangen, dass die Reduktion der Hefepopulation durch die
Fermentationsbedingungen, das heißt, durch eine geringe Hitze-, Säure- und Ethanoltoleranz
der Hefen verursacht wird.
Während der ersten 24 Stunden stellen Hefen die dominanten Spezies dar, wobei
Saccharomyces cerevisiae durchgehend stetig bei der Fermentation auftritt. Während eines
Zeitraumes von 48 bis 72 Stunden zeigen Milchsäurebakterien ein dominantes Wachstum,
S u m m a r y | 161
wobei die Spezies Lactobacillus plantarum und Lactobacillus fermentum besonders
hervortreten. Essigsäurebakterien überwiegen im letzten Stadium der Fementation wobei
die Spezies Acetobacter fermentum stetig und durchgehend auftritt. Während der
Fermentation werden durch die Stoffwechselaktivität der Mikroorganismen Ethanol,
Milchsäure, Mannitol, Essigsäure und Wärme erzeugt. Durch die Diffusion von Ethanol,
Essigsäure und Wärme in die Samen hinein wird der Embryo im Samen abgetötet.
Weitere Ergebnisse zeigten die mikrobielle Diversität zwischen unterschiedlichen Regionen
auf. Einige mikrobielle Spezies ließen sich in Kakaosamenfermentationen aus allen
untersuchten Regionen nachweisen. Fermentierte Kakaosamen aus Ecuador zeigten die
höchste Diversität an Hefen und Milchsäurebakterien im Vergleich zu fermentierten
Kakaosamen aus Indonesien und aus Trinidad und Tobago.
Demgegenüber war die Diversität der Essigsäurebakterien aus Kakaofermentationen aus
Indonesien am höchsten. Auf der Basis der physiologischen Charakterisierung der
dominanten Spezies der untersuchten Kakaofermentationen aus allen drei Regionen wird die
Kombination der Stämme Saccharomyces cerevisiae IDI-Y001, Lactobacillus fermentum IDE-
L007 und Acetobacter pasteurianus IDI-A019 als die beste Kombination für eine Starterkultur
für die Kakaofermentation vorgeschlagen.
Die Untersuchung von Laborfermentationsmethoden wies Unterschiede zwischen aeroben
und anaeroben Verfahren auf. Aerobe Fermentationen wiesen zum Schluss höhere
Konzentrationen an organischen Säuren und an freien Aminosäuren auf. Dieses ist typisch
für fermentierte Kakaosamen, die für die Produktion von aromareicher Schokolade benutzt
werden. Die anaeroben Fermentationen waren durch niedrige Konzentrationen an
organischen Säuren und freien Aminosäuren gekennzeichnet, wiesen aber höhere Gehalte
an Polyphenolen auf. Dieses ist typisch für fermentierte Kakaosamen, die für die Herstellung
von Schokolade mit gesundheitlichen Effekten benutzt werden.
Ein neues Ergebnis der Arbeit ist die Erkenntnis, dass der Testa-Schleim von Theobroma
cacao L. die Fähigkeit besitzt das Wachstum von Hefen und Schimmelpilzen zu inhibieren. 25
mg Testa-Schleim mL-1 inhibieren das Wachstum von Schimmelpilzen (z.B. Penicillium
citrinum, Aspergillus niger, Penicillium purpurogenum) und 10 mg mL-1 hemmen das

S u m m a r y | 162
Wachstum von Hefen (z.B. S. cerevisiae, Rhodotorula rubra, Candida lipolytica). Mit Hilfe der
Nano-Electrospray-Massen-Spektroskopie konnte gezeigt werden, dass drei
Proteinfraktionen aus dem Testa-Schleim einen antimykotischen Effekt haben, nämlich
Glucanase (33 kDA), Chitinase (28,8 kDa) und Osmotin (24,1 kDa). Es konnte gezeigt werden,
dass die Testa-Schleim-Proteine bei Lagerungen über 24 Stunden bei 40 oC und bei 50 oC
nicht stabil waren.
Eine Verminderung der Pulpa um 90% kann das Wachstum der Starterkultur inhibieren.
Insbesondere wird das Wachstum der Hefen nach 48 Stunden Fermentationszeit inhibiert,
was einen Hinweis auf die Hemmung der Hefen durch die antimykotisch wirkenden Proteine
des Testa-Schleimes darstellt.

| 163
7 References
Afoakwa EO (2010) Chocolate science and technology. Wiley-Blackwell, Chichester
Afoakwa EO, Paterson A, Fowler M (2007) Factors influencing rheological and textural
qualities in chocolate - a review. Trends Food Sci Technol 18:290-298
Agrawal GK, Jwa NS, Rakwal R (2000) A Novel Rice (Oryza sativa L.) Acidic PR1 gene highly
responsive to cut, phytohormones, and protein phosphatase inhibitors. Biochem
Biophys Res Commun 274:157-165
Altschul SF, Madden TL, Schaffer AA, Zhang J, Zhang Z, Miller W, Lipman DJ (1997) Gapped
BLAST and PSI-BLAST: a new generation of protein database search programs. Nucleic
Acids Res 25:3389-3402
Amin I, Jinap S, Jamilah B, Harikrisna K, Biehl B (2002) Analysis of vicilin (7S) class globulin in
cocoa cotyledons from various genetic origins. J Sci Food Agric 82:728-732
Ardhana MM, Fleet GH (2003) The microbial ecology of cocoa bean fermentations in
Indonesia. Int J Food Microbiol 86:87-99
Axelsson L (2004) Lactic acid bacteria: Classification and physiology. In: Salminen S, Wright
AV (eds), Lactic acid bacteria: microbiology and functional aspects. 3rd edn. Marcel
Dekker, New York, pp 1-66
Bai FY, Zhao JH, Takashima M, Jia JH, Boekhout T, Nakase T (2002) Reclassification of the
Sporobolomyces roseus and Sporidiobolus pararoseus complexes, with the
description of Sporobolomyces phaffii sp. nov. Int J Syst Evol Microbiol 52:2309-2314
Baker DM, Tomlins KI, Gay C (1994) Survey of Ghanaian cocoa farmer fermentation practices
and their influence on cocoa flavour. Food Chem 51:425-431
Beckett ST (2009) Industrial chocolate manufacture and use. 4th edn. Wiley-Blackwell,
Chichester
Bewley JD, Black M (1994) Seeds. Springer. New York

R e f e r e n c e s | 164
Biehl B, Heinrichs H, Ziegeler-Berghausen H, Srivastava S, Xiong Q, Passern D, Senyuk VI, Hammoor
M. (1993) The proteases of ungerminated cocoa seeds and their role in the
fermentation process. Angew Bot 67:59-65
Biehl Bl, Brunner E, Passern D, Quesnel VC, Adomako D (1985) Acidification, proteolysis and
flavour potential in fermenting cocoa bean. J Sci Food and Agric 36:583-598
Biehl Bl, Wewetzer C, Passern D (1982) Vacuolar (storage) proteins of cocoa seeds and their
degradation during germination and fermentation. J Sci Food and Agric 33:1291-1304
Boekhout T, Fonseca A, Batenburg-van der Vegte WH (1991) Bulleromyces genus novum
(Tremellales), a teleomorph for Bullera alba, and the occurrence of mating in Bullera
variabilis. A Van Leeuw 59:81-93
Bradford MM (1976) A rapid and sensitive method for the quantitation of microgram
quantities of protein utilizing the principle of protein-dye binding. Anal Biochem
72:248-254
Bryngelsson T, Sommer-Knudsen J, Gregersen P, Collinge D, Ek B, Thordal-Christensen H
(1993) Purification, characterization, and molecular cloning of basic PR-1-type
pathogenesis-related proteins from barley. Molecular plant-microbe interactions:
MPMI 7:267-275
Camu N, De Winter T, Verbrugghe K, Cleenwerck I, Vandamme P, Takrama JS, Vancanneyt M,
De Vuyst L (2007) Dynamics and biodiversity of populations of lactic acid bacteria and
acetic acid bacteria involved in spontaneous heap fermentation of cocoa bean in
Ghana. Appl Environ Microbiol 73:1809-1824
Camu N, De Winter T, Addo SK, Takrama JS, Bernaert H, De Vuyst L (2008) Fermentation of
cocoa bean: influence of microbial activities and polyphenol concentrations on the
flavour of chocolate. J Sci Food and Agric 88:2288-2297
Caruso C, Caporale C, Chilosi G, Vacca F, Bertini L, Magro P, Poerio E, Buonocore V (1996)
Structural and antifungal properties of a pathogenesis-related protein from wheat
kernel. J Pro Chem 15:35-44

R e f e r e n c e s | 165
Coe SD, Coe MD, Huxtable RJ (1996) The true history of chocolate. Thames Hudson, London
Colditz F, Nyamsuren O, Niehaus K, Eubel H, Braun HP, Krajinski F (2004) Proteomic
approach: identification of Medicago truncatula proteins induced in roots after
infection with the pathogenic oomycete Aphanomyces euteiches. Plant Mol Biol
55:109-120
Cote F, Cutt JR, Asselin A, Klessig DF (1991) Pathogenesis-related acidic β-1,3-glucanase
genes of tobacco are regulated by both stress and developmental signals. Mol Plant
Microbe Interact 4:173-181
de Brito ES, Garcia NHP, Gallao MI, Cortelazzo AL, Fevereiro PS, Braga MR (2001) Structural
and chemical changes in cocoa (Theobroma cacao L.) during fermentation, drying and
roasting. J Sci Food and Agric 81:281-288
De Vuyst L, Lefeber T, Papalexandratou Z, Camu N (2010) The functional role of lactic acid
bacteria in cocoa bean fermentation. In: Mozzi F, Raya RR, Vignolo GM (eds),
Biotechnology of lactic acid bacteria: novel applications. Wiley-Blackwell, Chichester,
pp 301-325
Dimick P, Hoskin J (1999) The chemistry of flavour development in chocolate. In: Beckett ST
(eds), Industrial chocolate manufacture and use. 3rd edn. Wiley-Blackwell,
Chichester, pp 137-152
El-Ghaish S, Hadji-Sfaxi I, Ahmadova A, Choiset Y, Rabesona H, Sitohy M, Haertlé T, Chobert
JM (2011) Characterization of two safe Enterococcus strains producing enterocins
isolated from Egyptian dairy products. Benef Microbes 2:15-27
Elwers S, Zambrano A, Rohsius C, Lieberei R (2009) Differences between the content of
phenolic compounds in Criollo, Forastero and Trinitario cocoa seed (Theobroma
cacao L.). Eur Food Res Technol 229:937-948
Fowler M (2009) Cocoa bean: from tree to factory. In: Beckett ST (eds), Industrial chocolate
manufacture and use, 4th edn. Wiley-Blackwell, Chichester, pp 10-47

R e f e r e n c e s | 166
Garcia-Armisen T, Papalexandratou Z, Hendryckx H, Camu N, Vrancken G, De Vuyst L,
Cornelis P (2010) Diversity of the total bacterial community associated with Ghanaian
and Brazilian cocoa bean fermentation samples as revealed by a 16S rRNA gene clone
library. Appl Microbiol Biotechnol 87:2281-2292
Gerhards D, Lehnigk C, Buchl N, Wenning M, Scherer S, Von Wallbrunn C (2011) Biodiversity
and development of yeasts from Riesling vines to wines monitored by FT-IR. In
Darriet P, Geny L, Lonvaud A, Lucas P, de Revel G, Teissedre P-L, editors. 9th
International Symposium of Oenology-Bordeaux. Dunod, Paris. pp 263–268.
Gourieva K, Tserevitinov O (1979) Method of evaluating the degree of fermentation of cocoa
bean. USSR patent 646
Grenier J, Potvin C, Asselin A (1993) Barley pathogenesis-related proteins with fungal cell
wall lytic activity inhibit the growth of yeasts. Plant Physiol 103:1277-1283
Hadacek F, Greger H (2000) Testing of antifungal natural products: methodologies,
comparability of results and assay choice. Phytochem Anal 11:137-147
Hammerstone JF, Lazarus SA, Mitchell AE, Rucker R, Schmitz HH (1999) Identification of
procyanidins in cocoa (Theobroma cacao) and chocolate using high-performance
liquid chromatography/mass spectrometry. J Agric Food Chem 47:490-496
Hansen CE, del Olmo M, Burri C (1998) Enzyme activities in cocoa bean during fermentation.
J Sci Food and Agric 77:273-281
Hashim P, Selamat J, Muhammad S, Kharidah S, Ali A (1998a) Changes in free amino acid,
peptide-N, sugar and pyrazine concentration during cocoa fermentation. J Sci Food
Agric 78:535-542
Hashim P, Selamat J, Muhammad S, Kharidah S, Ali A (1998b) Effect of mass and turning time
on free amino acid, peptide-N, sugar and pyrazine concentration during cocoa
fermentation. J Sci Food and Agric 78:543-550
Holm CS, Aston JW, Douglas K (1993) The effects of the organic acids in cocoa on the flavour
of chocolate. J Sci Food and Agric 61:65-71

R e f e r e n c e s | 167
Hucker GJ, Conn HJ (1923) Methods of Gram staining. NY Agric Exp Sta. Tech Bull 93:3-37.
Jach G, Görnhardt B, Mundy J, Logemann J, Pinsdorf E, Leah R, Schell J, Maas C (1995)
Enhanced quantitative resistance against fungal disease by combinatorial expression
of different barley antifungal proteins in transgenic tobacco. Plant J 8:97-109
Jespersen L, Nielsen DS, Honholt S, Jakobsen M (2005) Occurrence and diversity of yeasts
involved in fermentation of West African cocoa beans. FEMS Yeast Res 5:441-453
Jinap M, Nazamid S, Jamilah B (2002) Activation of remaining key enzymes in dried under-
fermented cocoa beans and its effect on aroma precursor formation. Food Chem
78:407-417
Jinap S, Jamilah B, Nazamid S (2003) Effects of incubation and polyphenol oxidase
enrichment on colour, fermentation index, procyanidins and astringency of
unfermented and partly fermented cocoa beans. Int J Food Sci Technol 38:285-295
Jinap S, Jamilah B, Nazamid S (2004) Sensory properties of cocoa liquor as affected by
polyphenol concentration and duration of roasting. Food Qual Pref 15:403-409
Jinap S, Zeslinda A (1995) Influence of organic acids on flavour perception of Malaysian and
Ghanaian cocoa beans. J Food Sci Technol 32:153-155.
Jindamorakot S, Limtong S, Yongmanitchai W, Tuntirungkij M, Potacharoen W, Kawasaki H,
Nakase T (2007) Two new anamorphic yeasts, Candida thailandica sp. nov. and
Candida lignicola sp. nov., isolated from insect frass in Thailand. FEMS Yeast Res
7:1409-1414
Kaminskyj SG, Garrill A, Heath IB (1992) The relation between turgor and tip growth in
Saprolegnia ferax: Turgor is necessary, but not sufficient to explain apical extension
rates. Exp Mycol 16:64-75
Kaneuchi C, Seki M, Komagata K (1988) Production of succinic acid from citric acid and
related acids by Lactobacillus strains. Appl Environ Microbiol 54:3053-3056

R e f e r e n c e s | 168
Kim YJ, Hwang BK (1997) Isolation of a basic 34 kilo Dalton β-1, 3-glucanase with inhibitory
activity against Phytophthora capsici from pepper stems. Physiol Mol Plant Pathol
50:103-115
Kirchhoff PM, Biehl B, Ziegeler-Berghausen H, Hammoor M, Lieberei R (1989) Kinetics of the
formation of free amino acids in cocoa seeds during fermentation. Food Chem
34:161-179
Kitajima S, Sato F (1999) Plant pathogenesis-related proteins: molecular mechanisms of gene
expression and protein function. J Biochem 125:1-8
Kolbe S, Fischer S, Becirevic A, Hinz P, Schrempf H (1998) The Streptomyces reticuli alpha-
chitin-binding protein CHB2 and its gene. Microbiology 144:1291-1297
Kümmerle M, Scherer S, Seiler H (1998) Rapid and reliable identification of food-borne
yeasts by Fourier-transform infrared spectroscopy. Appl Environ Microbiol 64:2207-
2214
Kurtzman CP, Robnett CJ (1998) Identification and phylogeny of ascomycetous yeasts from
analysis of nuclear large subunit (26S) ribosomal DNA partial sequences. A Van Leeuw
73:331-371
Laemmli UK (1970) Cleavage of structural proteins during the assembly of the head of
bacteriophage T4. Nature 227:680-685
Lefeber T, Papalexandratou Z, Gobert W, Camu N, De Vuyst L (2012) On-farm
implementation of a starter culture for improved cocoa bean fermentation and its
influence on the flavour of chocolates produced thereof. Food Microbiol 30:379-392
Lehrian DW, and Patterson GR (1983) Cocoa fermentation. In: Rehm HJ and Reed G (eds)
Biotechnology, Vol 5: Food and Feed production with Microorganisms. VCH,
Weinheim, pp 529-575.
Leroy F, De Vuyst L (2004) Lactic acid bacteria as functional starter cultures for the food
fermentation industry. Trends Food Sci Tech 15:67-78

R e f e r e n c e s | 169
Lima LJ, Almeida MH, Nout MR, Zwietering MH (2011) Theobroma cacao L., "The Food of the
Gods": quality determinants of commercial cocoa bean, with particular reference to
the impact of fermentation. Crit Rev Food Sci Nutr 51:731-761
Linthorst HJ, Van Loon L (1991) Pathogenesis-related proteins of plants. Crit Rev Plant Sci
10:123-150
Lisdiyanti P, Kawasaki H, Widyastuti Y, Saono S, Seki T, Yamada Y, Uchimura T, Komagata K
(2002) Kozakia baliensis gen. nov., sp. nov., a novel acetic acid bacterium in the
alpha-proteobacteria. Int J Syst Evol Microbiol 52:813-818
Lisdiyanti P, Katsura K, Potacharoen W, Navarro RR, Yamada Y, Uchimura T, Komagata K
(2003) Diversity of acetic acid bacteria in Indonesia, Thailand, and the Philippines.
Microbiol Cult Coll 19:91-98
Lisdiyanti P, Kawasaki H, Seki T, Yamada Y, Uchimura T, Komagata K (2001) Identification of
Acetobacter strains isolated from Indonesian sources, and proposals of Acetobacter
syzygii sp. nov., Acetobacter cibinongensis sp. nov., and Acetobacter orientalis sp.
nov. J Gen Appl Microbiol 47:119-131
Lopez AS, Dimick PS (1995) Cocoa fermentation. In: Rehm HJ and Reed G, Nagodawithana
TW (eds), Biotechnology, Vol 9: Enzymes, biomass, food and feed, 2nd edn. VCH,
Weinheim, pp 561-577
Makrypidi G, Damme M, Müller-Loennies S, Trusch M, Schmidt B, Schlüter H, Heeren J,
Lübke T, Saftig P, Braulke T (2012) Mannose 6 dephosphorylation of lysosomal
proteins mediated by acid phosphatases Acp2 and Acp5. Mol Cell Biol 32: 774-782.
Meersman E, Steensels J, Mathawan M, Wittocx J, Saels V, Struyf N, Bernaert H, Vrancken G,
Verstrepen KJ (2013) Detailed analysis of the microbial population in Malaysian
spontaneous cocoa pulp fermentations reveals a core and variable microbiota. PLoS
one 8:e81559
Minagawa N, Sakajo S, Komiyama T, Yoshimoto A (1990) Essential role of ferrous iron in
cyanide-resistant respiration in Hansenula anomala. FEBS Lett 267:114-116

R e f e r e n c e s | 170
Minagawa N, Yoshimoto A (1987) The induction of cyanide-resistant respiration in
Hansenula anomala. J Biochem 101:1141-1146
Minifie BW (1989) Chocolate, cocoa and confectionery: science and technology. Chapman
Hall, London
Moise JA, Han S, Gudynaite-Savitch L, Johnson DA, Miki BL (2005) Seed coats: structure,
development, composition, and biotechnology. In Vitro Cell Dev Biol Plant 41:620-
644
Money NP, Harold FM (1992) Extension growth of the water mold Achlya: interplay of turgor
and wall strength. Proc Natl Acad Sci USA 89:4245-4249
Mrak E, McClung L (1940) Yeasts occurring on grapes and in grape products in California.
J Bacteriol 40:395
Nakase T (2000) Expanding world of ballistosporous yeasts. Distribution in the phyllosphere,
systematics and phylogeny. J Gen Appl Microbiol 46:189-216
Naumov GI, Naumova ES, Schnurer J (2001) Genetic characterization of the nonconventional
yeast Hansenula anomala. Res Microbiol 152:551-562
Naumann D, Helm D, Labischinski H (1991) Microbiological characterizations by FT-IR
spectroscopy. Nature 351:81-82
Nazaruddin R, Seng L, Hassan O, Said M (2006) Effect of pulp preconditioning on the content
of polyphenols in cocoa bean (Theobroma cacao) during fermentation. Ind Crops and
Products 24:87-94
Nganhou J, Njomo D, Benet J, Augier F, Berthomieu G (2003) Perfecting a method of micro-
analysis of water and acetic acid in a cocoa bean in the course of drying: applying to
determine transportation coefficients. Heat Mass Transfer 39:797-803
Nielsen DS, Teniola OD, Ban-Koffi L, Owusu M, Andersson TS, Holzapfel WH (2007) The
microbiology of Ghanaian cocoa fermentations analysed using culture-dependent
and culture-independent methods. Int J Food Microbiol 114:168-186

R e f e r e n c e s | 171
Nielsen KK, Nielsen JE, Madrid SM, Mikkelsen JD (1997) Characterization of a new antifungal
chitin-binding peptide from sugar beet leaves. Plant Physiol 113:83-91
Niemenak N, Rohsius C, Elwers S, Ndoumou DO, Lieberei R (2006) Comparative study of
different cocoa (Theobroma cacao L.) clones in terms of their phenolics and
anthocyanins contents. J Food Comp Anal 19:612-619
Nijssen L M, Visscher CA, Maarse H and Willemsen L (1996) In Volatile Compounds in Foods.
TNO, Zeist, The Netherlands.
Noah AM, Niemenak N, Sunderhaus S, Haase C, Omokolo DN, Winkelmann T, Braun HP
(2012) Comparative proteomic analysis of early somatic and zygotic embryogenesis in
Theobroma cacao L. J Proteomics 78:123-133
Ogata CM, Gordon PF, de Vos AM, Kim S-H (1992) Crystal structure of a sweet tasting protein
thaumatin I, at 1.65 Å resolution. J Mol Biol 228:893-908
Ostovar K, Keeney P (1973) Isolation and characterization of microorganisms involved in the
fermentation of Trinidad's cacao beans. J Food Sci 38:611-617
Palles T, Beresford T, Condon S, Cogan T (1998) Citrate metabolism in Lactobacillus casei and
Lactobacillus plantarum. J Appl Microbiol 85:147-154
Papalexandratou Z, Vuyst L (2011) Assessment of the yeast species composition of cocoa
bean fermentations in different cocoa producing regions using denaturing gradient
gel electrophoresis. FEMS Yeast Res 11:564-574
Papalexandratou Z, Camu N, Falony G, De Vuyst L (2011 a) Comparison of the bacterial
species diversity of spontaneous cocoa bean fermentations carried out at selected
farms in Ivory Coast and Brazil. Food Microbiol 28:964-973
Papalexandratou Z, Vrancken G, De Bruyne K, Vandamme P, De Vuyst L (2011 b)
Spontaneous organic cocoa bean box fermentations in Brazil are characterized by a
restricted species diversity of lactic acid bacteria and acetic acid bacteria. Food
Microbiol 28:1326-1338

R e f e r e n c e s | 172
Papalexandratou Z, Falony G, Romanens E, Jimenez JC, Amores F, Daniel HM, De Vuyst L
(2011 c) Species diversity, community dynamics, and metabolite kinetics of the
microbiota associated with traditional Ecuadorian spontaneous cocoa bean
fermentations. Appl Environ Microbiol 77:7698-7714
Papalexandratou Z, Lefeber T, Bahrim B, Lee OS, Daniel HM, De Vuyst L (2013)
Hanseniaspora opuntiae, Saccharomyces cerevisiae, Lactobacillus fermentum, and
Acetobacter pasteurianus predominate during well-performed Malaysian cocoa bean
box fermentations, underlining the importance of these microbial species for a
successful cocoa bean fermentation process. Food Microbiol 35:73-85
Passoth V, Fredlund E, Druvefors U, Schnurer J (2006) Biotechnology, physiology and
genetics of the yeast Pichia anomala. FEMS Yeast Res 6:3-13
Pauli A (2006) Anticandidal low molecular compounds from higher plants with special
reference to compounds from essential oils. Med Res Rev 26:223-268
Pongtharangkul T, Demirci A (2004) Evaluation of agar diffusion bioassay for nisin
quantification. Appl Microbiol Biotechnol 65:268-272
Porter L, Ma Z, Chan B (1991) Cacao procyanidins: major flavanoids and identification of
some minor metabolites. Phytochem 30:1657-1663
Powers EM (1995) Efficacy of the Ryu nonstaining KOH technique for rapidly determining
gram reactions of food-borne and waterborne bacteria and yeasts. Appl Environ
Microbiol 61:3756-3758
Reineccius GA, Andersen DA, Kavanagh TE, Keeney PG (1972) Identification and
quantification of the free sugars in cocoa beans. J Agric Food Chem 20:199-202
Reisdorff C, Rohsius C, de Souza C, das Gracias A, Gasparotto L, Lieberei R (2004)
Comparative study on the proteolytic activities and storage globulins in seeds of
Theobroma grandiflorum (Willd ex Spreng) Schum and Theobroma bicolor Humb
Bonpl, in relation to their potential to generate chocolate-like aroma. J Sci Food Agric
84:693-700

R e f e r e n c e s | 173
Riesselman MH, Hazen KC, Cutler JE (2000) Determination of antifungal MICs by a rapid
susceptibility assay. J Clin Microbiol 38:333-340
Roberts WK, Selitrennikoff CP (1990) Zeamatin, an antifungal protein from maize with
membrane-permeabilizing activity. J Gen Microbiol 136:1771-1778
Roelofsen PA (1958) Fermentation, drying and storage of cacao beans. Adv Food Res 8:225-
296.
Rohan TA (1964) The precursors of chocolate aroma: a comparative study of fermented and
unfermented cocoa beans. J Food Sci 29:456-459
Rohsius C, Matissek R, Lieberei R (2006) Free amino acid amounts in raw cocoas from
different origins. Eur Food Res Technol 222:432-438
Rössner S (1997) Chocolate-divine food, fattening junk or nutritious supplementation. Eur J
Clin Nutr 51:341
Sambrook JR (2001) Molecular cloning: a laboratory manual. Qua Rev Biol 76:348-349
Sanger F, Nicklen S, Coulson AR (1977) DNA sequencing with chain-terminating inhibitors.
Proc Natl Acad Sci USA 74:5463-5467
Santos P, Santos I, Gomes V, Machado O, Fernandes K, Xavier-Filho J, Oliveira A (2008) In
vitro evaluation of antifungal activity of soybean (Glycine max) seed coat proteins.
J Stored Prod Res 44:310-315
Schroeter H, Heiss C, Balzer J, Kleinbongard P, Keen CL, Hollenberg NK, Sies H, Kwik-Uribe C,
Schmitz HH, Kelm M (2006) (-)-Epicatechin mediates beneficial effects of flavanol-rich
cocoa on vascular function in humans. Proc Nat Acad Sci USA 103:1024-1029
Schwan R, Rose A, Board R (1995) Microbial fermentation of cocoa beans, with emphasis on
enzymatic degradation of the pulp. J Appl Bacteriol 79:96S-107S
Schwan RF (1998) Cocoa fermentations conducted with a defined microbial cocktail
inoculum. Appl Environ Microbiol 64:1477-1483

R e f e r e n c e s | 174
Schwan RF, Cooper RM, Wheals AE (1997) Endopolygalacturonase secretion by
Kluyveromyces marxianus and other cocoa pulp-degrading yeasts. Enzyme Microb
Technol 21:234-244
Schwan RF, Wheals AE (2004) The microbiology of cocoa fermentation and its role in
chocolate quality. Crit Rev Food Sci Nutr 44:205-221
Scorzoni L, Benaducci T, Almeida A, Silva D, Bolzani V, Mendes-Giannini M (2009)
Comparative study of disk diffusion and microdilution methods for evaluation of
antifungal activity of natural compounds against medical yeasts Candida sp. and
Cryptococcus sp. J Basic Appl Pham Sci 28:25-34
Selitrennikoff CP (2001) Antifungal proteins. Appl Environ Microbiol 67:2883-2894
Shamsuddin S, Dimick P (1986) Qualitative and quantitative measurements of cacao bean
fermentation. In: Dimick PS (ed) Proceedings of cocoa biotechnology. Departement of
Food Science, Penn State University, University Park, PA. pp 55-78
Sies H, Schewe T, Heiss C, Kelm M (2005) Cocoa polyphenols and inflammatory mediators.
Am J Clin Nutr 81:304S-312S
Swangkeaw J, Vichitphan S, Butzke CE, Vichitphan K (2011) Characterization of β-
glucosidases from Hanseniaspora sp. and Pichia anomala with potentially aroma-
enhancing capabilities in juice and wine. World J Microbiol Biotechnol 27:423-430
Thompson SS, Miller KB, Lopez AS (2001) Cocoa and coffee. In Doyle MJ, Beuchat LR,
Montville TJ (eds) Food microbiology: fundamentals and frontiers, 2nd (edn). ASM
Press, Washington, DC. pp 721-733
Tomlins KI, Baker DM, Daplyn P, Adomako D (1993) Effect of fermentation and drying
practices on the chemical and physical profiles of Ghana cocoa. Food Chem 46:257-
263
Valério E, Gadanho Mr, Sampaio JP (2008) Reappraisal of the Sporobolomyces roseus species
complex and description of Sporidiobolus metaroseus sp. nov. Int J Syst Evol
Microbiol 58:736-741

R e f e r e n c e s | 175
Van der Meulen R, Scheirlinck I, Van Schoor A, Huys G, Vancanneyt M, Vandamme P, De
Vuyst L (2007) Population dynamics and metabolite target analysis of lactic acid
bacteria during laboratory fermentations of wheat and spelt sourdoughs. Appl
Environ Microbiol 73:4741-4750
Van Loon L (1985) Pathogenesis-related proteins. Plant Mol Biol 4:111-116
Voigt J, Biehl, B (1995) Precursors of the cocoa-specific aroma components are derived from
the vicilinclass globulin of the cocoa seeds by proteolytic processing. Botanica Acta
167:283-289.
Voigt J, Heinrichs H, Voigt G, Biehl B (1994) Cocoa-specific aroma precursors are generated
by proteolytic digestion of the vicilin-like globulin of cocoa seeds. Food Chem 50:177-
184
Wang X, Li G, Jiang D, Huang H-C (2009) Screening of plant epiphytic yeasts for biocontrol of
bacterial fruit blotch (Acidovorax avenae subsp. citrulli) of hami melon. Biol Control
50:164-171
Watanabe T, Kanai R, Kawase T, Tanabe T, Mitsutomi M, Sakuda S, Miyashita K (1999) Family
19 chitinases of Streptomyces species: characterization and distribution. Microbiology
145:3353-3363
White TC, Holleman S, Dy F, Mirels LF, Stevens DA (2002) Resistance mechanisms in clinical
isolates of Candida albicans. Antimicrob Agents Chemother 46:1704-1713
Wisselink H, Weusthuis R, Eggink G, Hugenholtz J, Grobben G (2002) Mannitol production by
lactic acid bacteria: a review. Int Dairy J 12:151-161
Wollgast J, Anklam E (2000) Review on polyphenols in Theobroma cacao: changes in
composition during the manufacture of chocolate and methodology for identification
and quantification. Food Res Int 33:423-447
Wood GAR, Lass R (2008) Cocoa. Wiley-Blacwell, Chichester

R e f e r e n c e s | 176
Ye XY, Wang HX, Ng TB (2000) Dolichin, a new chitinase-like antifungal protein isolated from
field bean (Dolichos lablab). Biochem Biophys Res Commun 269:155-159
Yun DJ, Zhao Y, Pardo JM, Narasimhan ML, Damsz B, Lee H, Abad LR, D’Urzo MP, Hasegawa
PM, Bressan RA (1997) Stress proteins on the yeast cell surface determine resistance
to osmotin, a plant antifungal protein. Proc Nat Acad Sci 94:7082-7087
Yun DJ, Ibeas JI, Lee H, Coca MA, Narasimhan ML, Uesono Y, Hasegawa PM, Pardo JM,
Bressan RA (1998) Osmotin, a plant antifungal protein, subverts signal transduction
to enhance fungal cell susceptibility. Mol cell 1:807-817
Ziegleder G, Biehl B (1988) Analysis of cocoa flavour components and flavour precursors. In:
Linkens H, Jackson JF (eds) Methods in plant analysis. Springer, Berlin, pp 321-393

| 177
8 Figures and Tables
8.1 List of figures
Figure 1.1 Cocoa producing countries (Rohsius et al. 2010) ...................................................... 1
Figure 1.2 Cocoa varieties: a) Criollo, b) Nacional, c) Forastero, d) Trinitario ........................... 5
Figure 1.3 a) Cocoa bean, b) Cocoa bean storage cells .............................................................. 9
Figure 1.4 Heap of cocoa beans prior to fermentation on a West African farm (Afoakwa
2010) ............................................................................................................................. 12
Figure 1.5 Cocoa beans covered with plantain leaves in heap fermentation (Afoakwa
2010) ............................................................................................................................. 13
Figure 1.6 Box fermentation, capacity 800 – 1000 kg Nusantara Plantation XII (PTPN XII),
East Java, Indonesia ...................................................................................................... 14
Figure 1.7 a) Schematic diagram of microbial succession during cocoa bean fermentations,
along with peak of temperature and metabolite concentrations, b) Microbial
activities during cocoa bean fermentation .................................................................. 16
Figure 1.8 Sun drying in Nusantara Plantation XII (PTPN XII), Jember, East Java, Indonesia .. 23
Figure 1.9 Artificial drying facility with a capacity of 4500 kg, a) view from outside, b) view
from inside in Nusantara Plantation XII (PTPN XII), Jember, East Java, Indonesia ...... 25
Figure 1.10 Biochemical changes in pulp and beans during cocoa bean fermentation
(Lopes, 1986) ................................................................................................................ 27
Figure 1.11 Schematic diagram of cocoa bean processing ...................................................... 34
Figure 1.12 a) Appearance of testa under microscope analysis, b) Testa after removal of
pulp and soaked 24 h in water (Bahmann, 2014) ........................................................ 37
Figure 1.13 Schematic diagram of the fungal cell wall, GPI, glycophosphatidylinositol
(Selitrennikoff 2001) ..................................................................................................... 41

F i g u r e s a n d T a b l e s | 178
Figure 3.1 Laboratory fermentation (Thermo Scientific Heraeus® Cytoperm® 2. CO2 and
CO2 /O2 Incubator) ........................................................................................................ 47
Figure 3.2 a) Pure yeast culture on YGCBA, b) Measurement on a ZnSe microtiterplate
(96-well format) in a FT-IR (Bruker), comparison of the absorbance pattern with a
database and identification of the isolate, c) Differentiation by hierarchical
cluster analysis (HCA) up to strain level (strain range 0.3 spectral distances)............. 55
Figure 4.1 Changes in temperature and pH during cocoa bean fermentation ........................ 85
Figure 4.2 Microbiological analysis of cocoa bean fermentation ............................................ 86
Figure 4.3 Yeast population dynamics during fermentation ................................................... 88
Figure 4.4 Lactic acid baceria population dynamics during fermentation ............................... 89
Figure 4.5 AAB population dynamics during fermentation ..................................................... 91
Figure 4.6 Changes in carbohydrates during fermentation in the pulp ................................... 92
Figure 4.7 Changes in carbohydrates during fermentation in the beans ................................ 92
Figure 4.8 Changes in organic acids during fermentation in the pulp ..................................... 93
Figure 4.9 Changes in organic acids during fermentation in the beans................................... 94
Figure 4.10 Changes in ethanol and glycerol during fermentation in the pulp ....................... 95
Figure 4.11 Changes in ethanol and glycerol during fermentation in the beans .................... 95
Figure 4.12 Changes in pH during aerobic and anaerobic fermentation, full symbol (pulp),
open symbol (beans) .................................................................................................. 104
Figure 4.13 Growth of the starter culture during aerobic fermentation ............................... 105
Figure 4.14 Growth of the starter culture during anaerobic fermentation ........................... 106
Figure 4.15 Changes in carbohydrates (glucose and fructose) during aerobic
fermentation, full symbol (pulp), open symbol (beans)............................................. 107
Figure 4.16 Changes in carbohydrates (glucose and fructose) during anaerobic
fermentation, full symbol (pulp), open symbol (beans)............................................. 108
Figure 4.17 Changes in organic acids (citric acid, lactic acid, acetic acid) during aerobic
fermentation, full symbol (pulp), open symbol (beans)............................................. 109

F i g u r e s a n d T a b l e s | 179
Figure 4.18 Changes in organic acids (citric acid, lactic acid, acetic acid) during anaerobic
fermentation, full symbol (pulp), open symbol (beans)............................................. 110
Figure 4.19 Changes in ethanol during aerobic and anaerobic fermentation, full symbol
(pulp), open symbol (beans) ....................................................................................... 111
Figure 4.20 Changes in amino acids during aerobic fermentation ........................................ 112
Figure 4.21 Changes in amino acids during anaerobic fermentation .................................... 113
Figure 4.22 Changes in polyphenols during aerobic fermentation ........................................ 114
Figure 4.23 Changes in polyphenols during anaerobic fermentation .................................... 114
Figure 4.24 Representative images for fungus inhibition test ............................................... 116
Figure 4.25 Minimum inhibitory concentration against Aspergillus niger, a) agar diffusion
methods, b) microdilution methods........................................................................... 119
Figure 4.26 Minimum inhibitory concentration against Penicillium citrinum, a) agar
diffusion methods, b) microdilution methods ........................................................... 120
Figure 4.27 Minimum inhibitory concentration against Saccharomyces cerevisiae, a) agar
diffusion methods, b) microdilution methods ........................................................... 122
Figure 4.28 Minimum inhibitory concentration against Rhodotorula rubra, a) agar
diffusion methods, b) microdilution methods ........................................................... 123
Figure 4.29 Seed coat slime proteins from different fermentation times ............................. 125
Figure 4.30 Seed coat slime protein from different incubation temperatures (30, 40, 50 °C),
24 h ............................................................................................................................. 126
Figure 4.31 Seed coat slime proteins from Forastero ............................................................ 127
Figure 4.32 Changes in pH during fermentation, a) with pulp, b) with only 10% pulp ......... 129
Figure 4.33 Growth of the starter culture during fermentation, a) with pulp, b) with only
10% pulp ..................................................................................................................... 131
Figure 4.34 Changes in carbohydrates in pulp and beans during fermentation, full symbol
(pulp), open symbol (beans), a) with pulp, b) with only 10% pulp ............................ 132
F i g u r e s a n d T a b l e s | 180
Figure 4.35 Changes in organic acids in the pulp during fermentation, a) with pulp, b) with
only 10% pulp ............................................................................................................. 133
Figure 4.36 Changes in organic acids in the beans during fermentation, a) with pulp, b) with
only 10% pulp ............................................................................................................. 134
Figure 4.37 Changes in ethanol during fermentation, a) with pulp, b) with only 10% pulp .. 135
Figure 4.38 Changes in amino acids during fermentation, a) with pulp, b) with only 10%
pulp ............................................................................................................................. 136

F i g u r e s a n d T a b l e s | 181
8.2 List of tables
Table 1.1 World cocoa production ............................................................................................. 4
Table 1.2 Bean composition of unfermented West African (Forastero) cocoa ......................... 8
Table 1.3 Dark, milk and white chocolate: major constituents ............................................... 33
Table 3.1 Fermentation design ................................................................................................ 46
Table 3.2 Composition of malt extract agar (MEA) and malt extract broth (MEB) ................. 49
Table 3.3 Composition of DeMan-Rogosa-Sharpe agar (MRSA) and DeMan-Rogosa-Sharpe
broth (MRSB) ................................................................................................................ 49
Table 3.4 Composition of glucose yeast extract peptone calcium carbonate agar (GYPA)
and glucose yeast extract peptone broth (GYPB) ........................................................ 50
Table 3.5 Composition of Acetobacter agar and plate count agar (PCA) ................................ 50
Table 3.6 Composition of yeast extract glucose chloramphenicol agar (YGCA) and yeast
extract glucose chloramphenicol bromophenol blue agar (YGCBA) ............................ 50
Table 3.7 Primers used in this study ........................................................................................ 58
Table 3.8 PCR master mix reaction for standard PCR .............................................................. 58
Table 3.9 PCR cycling program for yeasts ................................................................................ 59
Table 3.10 PCR cycling program for LAB .................................................................................. 59
Table 3.11 PCR cycling program for AAB .................................................................................. 59
Table 3.12 PCR master mix reaction for yeasts ........................................................................ 60
Table 3.13 PCR master mix reaction for lactic acid bacteria .................................................... 61
Table 3.14 PCR master mix for acetic acid bacteria ................................................................. 62
Table 3.15 RP-HPLC gradients used for the separation of cocoa seed polyphenoles and
anthocyanins present in cocoa beans .......................................................................... 69
Table 3.16 List of fungal strains for the antifungal inhibition test ........................................... 71
Table 3.17 List of Gram-positive bacteria strains for the antimicrobial test ........................... 72

F i g u r e s a n d T a b l e s | 182
Table 3.18 List of Gram-negative bacteria strains for the antimicrobial test .......................... 72
Table 3.19 Composition of the SDS-PAGE gels used in this study ........................................... 80
Table 4.1 Yeasts species diversity ............................................................................................ 87
Table 4.2 Lactic acid bacteria species diversity ........................................................................ 89
Table 4.3 Acetic acid bacteria species diversity ....................................................................... 90
Table 4.4 Diversity of yeasts species in cocoa bean fermentations from Indonesia,
Ecuador and Trinidad & Tobago ................................................................................... 97
Table 4.5 Diversity of lactic acid bacteria species in cocoa bean fermentations from
Indonesia, Ecuador and Trinidad & Tobago ................................................................. 98
Table 4.6 Diversity of acetic acid bacteria species in cocoa bean fermentations from
Indonesia, Ecuador and Trinidad & Tobago ................................................................. 99
Table 4.7 Diversity and physiological characterization of yeasts isolates adapted to cocoa
bean fermentation...................................................................................................... 100
Table 4.8 Diversity and physiological characterization of lactic acid bacteria species
adapted to cocoa bean fermentation ........................................................................ 102
Table 4.9 Diversity and physiological characterization of acetic acid bacteria species
adapted to cocoa bean fermentation ........................................................................ 103
Table 4.10 Seed coat slime inhibition test against fungi........................................................ 115
Table 4.11 Seed coat slime inhibition test against Gram-positive bacteria ........................... 117
Table 4.12 Seed coat slime inhibition test against Gram-negative bacteria ......................... 118
Table 4.13 Concentration of seed coat slime proteins .......................................................... 124
Table 4.14 Protein determination by mass spectrometry ..................................................... 128

| 183
9 Appendix
9.1 Abbreviations
9.1.1 General abbreviations
aw Water activity
CFU Colony forming units
AAB Acetic acid bacteria
ACN Acetonitrile
APS Ammonium persulfate
BLAST Basic local alignment search tool
Da Dalton (unit of molecular weight)
DMSZ Deutsche Sammlung von Mikroorganismen und Zellkulturen
DNA Deoxyribonucleic acid
dNTP Desoxyribonucleotide-5‘-triphosphate
DTT Dithiothreitol
E-cup
e.g.
Eppendorf cup
(lat.: exempli gratia) for example
EDTA Ethylen diamin tetra acetate
et al. (lat.: et alii) and others
etc. (lat.: et cetera) and other things
EtOH Ethanol
FA Formic acid
ffdm Fat-free dry mass
FTIR Fourier-transfom infrared
GABA gamma-Aminobutyric acid
GC Guanine and cytosine content

A p p e n d i x | 184
GYPA Glucose yeasts extract peptone agar
GYPB
h
Glucose yeasts extract peptone broth
Hour
H2O Distilled water
H2Obidest Double distilled water
HCA Hierarchical cluster analysis
HCl Hydrogen chloride
HPLC High Performance Liquid Chromatography
i.e. id est/that is
ICCRI Indonesian coffee and cocoa research institute
kb Kilo base pairs
kDa kilo Dalton (unit of molecular weight)
KOH Potassium hydroxide
L Liter
LAB Lactic acid bacteria
LMH (ger.: Lebensmittelmikrobiologie Universität Hamburg)
Log logarithm
M Molar concentration (molarity)
mA Mili ampere
MALDI-TOF-MS Matrix-assisted laser desorption/ionization time-of-flight mass spectrometry
max. Maximum
MEA
MEB
Malt extract agar
Malt extract broth
MeOH Methanol
mg Milligram

A p p e n d i x | 185
MIC Minimum inhibitory concentration
min Minute
min. Minimum
mL Milliliter
mM Milli mole
mm Mili meter
mol Molar
MRSA de Man Rogosa and Sharpe agar
MRSB
MS
de Man Rogosa and Sharpe broth
Mass spectrometry
Mw Molecular weight
NA Nutrient agar
NaCl Sodium chloride
nt Nucelotide
OD Optical density
OD530 Optical density at wavelength 530 nm
OD600 Optical density at wavelength 600 nm
OPA O-phthalaldehyde
PCA Plate count agar
PCR Polymerase chain reaction
PMSF Phenylmethylsulfonyl fluoride
pmol Picomole
ppm parts per million
PTPN XII (ina.: PT. Perkebunan Nusantara XII) Nusantara Plantation XII, Ltd. Co.
PVPP Polyvinyl-polypyrrolidon
RAPD Random amplified polymorphic DNA

A p p e n d i x | 186
RNA Ribonucleic acid
RNAse Ribonuclease
RP Reverse-phase (a type of HPLC column)
rpm Rounds per minute
Rt Retention time
RT Room temperature
SDS sodium dodecyl sulfate
sec Second
sp. Species
spp. species (plural)
Tann Annealing temperature
Taq Thermus aquaticus
TE Tris-EDTA
TEMED N,N,N´,N´-Tetramethylene ethylene diamine
Tm Melting temperature
TPC Total plate count
Tris Tris-(hydroxymethylene)-aminoethane
U Unit
UK United Kingdom
USA United States of America
UV Ultraviolet
V Volt
v/v Volume per volume
w/v Weight per volume
YGCA Yeast extract glucose chloramphenicol agar
YGCBA Yeast extract glucose chloramphenicol bromophenol blue agar

A p p e n d i x | 187
μ Micro (10-6)
μg Microgram
μL Microliter
9.1.2 Abbreviations for amino acids
Ala Alanine Met Methionine
Cys Cysteine Asn Asparagine
Asp Aspartic acid Pro Proline
Glu Glutamic acid Gln Glutamine
Phe Phenylalanine Arg Arginine
Gly Glycine Ser Serine
His Histidine Thr Threonine
IIe Isoleucine Val Valine
Lys Lysine Trp Tryptophan
Leu Leucine Tyr Tyrosine

A p p e n d i x | 188
9.1.3 Abbreviations for microorganisms
9.1.3.1 Fungi
A. flavus Aspergillus flavus
A. niger Aspergillus niger
A. parasiticus Aspergillus parasiticus
B. albus Bulleromyces albus
C. krusei Candida krusei
C. laurentii Cryptococcus laurentii
C. lipolytica Candida lipolytica
C. parapsilosis Candida parapsilosis
C. pelliculosa Candida pelliculosa
C. quercitrusa Candida quercitrusa
C. tropicalis Candida tropicalis
H. guilliermondii Hanseniaspora guilliermondii
H. opuntiae Hanseniaspora opuntiae
H. thailandica Hanseniaspora thailandica
H. uvarum Hanseniaspora uvarum
I. orientalis Issatchenkia orientalis
M. isabellina Mortierella isabellina
M. pulcherrima Metschnikowia pulcherrima
P. citrinum Penicillium citrinum
P. kudriavzevii Pichia kudriavzevii
P. purpurogenum Penicillium purpurogenum
P. roquefortii Penicilium roquefortii

A p p e n d i x | 189
R. glutinis Rhodotorula glutinis
R. mucilaginosa Rhodotorula mucilaginosa
R. oligosporus Rhizopus oligosporus
R. oryzae Rhizopus oryzae
S. cerevisiae Saccharomyces cerevisiae
S. roseus Sporobolomyces roseus
T. delbrueckii Torulaspora delbrueckii
W. anomalus Wickerhamomyces anomalus
9.1.3.2 Gram negative bacteria
A. ghanensis Acetobacter ghanensis
A. orientalis Acetobacter orientalis
A. pasteurianus Acetobacter pasteurianus
A. peroxydans Acetobacter peroxydans
A. pomorum Acetobacter pomorum
A. tropicalis Acetobacter tropicalis
E. coli Eschericia coli
G. frateurii Gluconobacter frateurii

A p p e n d i x | 190
9.1.3.3 Gram positive bacteria
B. subtilis Bacillus subtilis
L. acidophilus Lactobacillus acidophilus
L. brevis Lactobacillus brevis
L. casei Lactobacillus casei
L. delbrueckii Lactobacillus delbrueckii
L. fermentum Lactobacillus fermentum
L. plantarum Lactobacillus plantarum
L. reuteri Lactobacillus reuteri
L. pseudomesenteroides Leuconostoc pseudomesenteroides
M. luteus Micrococcus luteus
P. acidilactici Pediococcus acidilactici
P. pentosaceus Pediococcus pentosaceus
P. freudenreichii Propionibacterium freudenreichii
P. shermanii Propionibacterium shermanii
S. aureus Staphylococcus aureus
S. thermophilus Streptococcus thermophilus

A p p e n d i x | 191
9.2 Hazardous chemicals
9.2.1 List of hazardous chemicals
Chemicals Hazard symbol
Risk phrase Safety phrase
1,3-Dimethylbarbituric acid
Xn R22, R41 S26, S36/39
Boric acid T R60, R61 S53, S45
Calcium chloride dihydrate
Xi R36 S22, S24
Claradiastase Xn R20, R36/37/38,R42/43 S22, S26, S36
Copper (II) sulphate Xn, N R22, R36/38,R50/53 S22, S60, S61
Diethyl ether F+, Xn R12, R19, R22,R66, R67 S16
Dinitrosalicylic acid Xn R22, R37/38 S22, S24/25
Ethanol F R11 S7, S16
Hydrochloric acid C R34, R37 S26, S45
Iron (II) sulphate heptahydrate
Xn R22
Kjeldahl tablets (free of Hg and Se)
N R51/R53 S61
Manganese (II) sulphate monohydrate
Xn, N R48/20/22, R51/53 S22, S61
Methanol F, T R11, R23/24/25,R39/23/24/25 S7, S16, S36/37,S45
Nicotinic acid Xi R36 S26
Papain Xn R36/37/38, R42 S22, S24, S26,S36/37

A p p e n d i x | 192
Chemicals Hazard symbol
Risk phrase Safety phrase
Phosphoric acid C R34 S26, S45
Polyoxyethylene lauryl ether
Xn R22, R38, R41 S26, S36/37/39
Potassium cyanide – zinc cyanide solution
T, N R23/24/25, R51/53 S36/37, S45, S61
Potassium ferricyanide Xn R20, R21, R22, R32 S26, S36
Pyridoxamine dihydrochloride
Xi R36/37/38 S26, S36
Sodium hydroxide C R35 S26, S37/39, S45
Sulphuric acid C R35 R35
Takadiastase Xn R42 S22, S24, S36/37
Thiosemicarbazide T+ R28 S22, S26, S36/37,S45
Trichloroacetic acid C, N R35, R50/53 S26, S36/37/39,S45, S60, S61
Zinc sulphate monohydrate
Xn, N R22, R41, R50/53 S22, S26, S39,S46, S60, S61
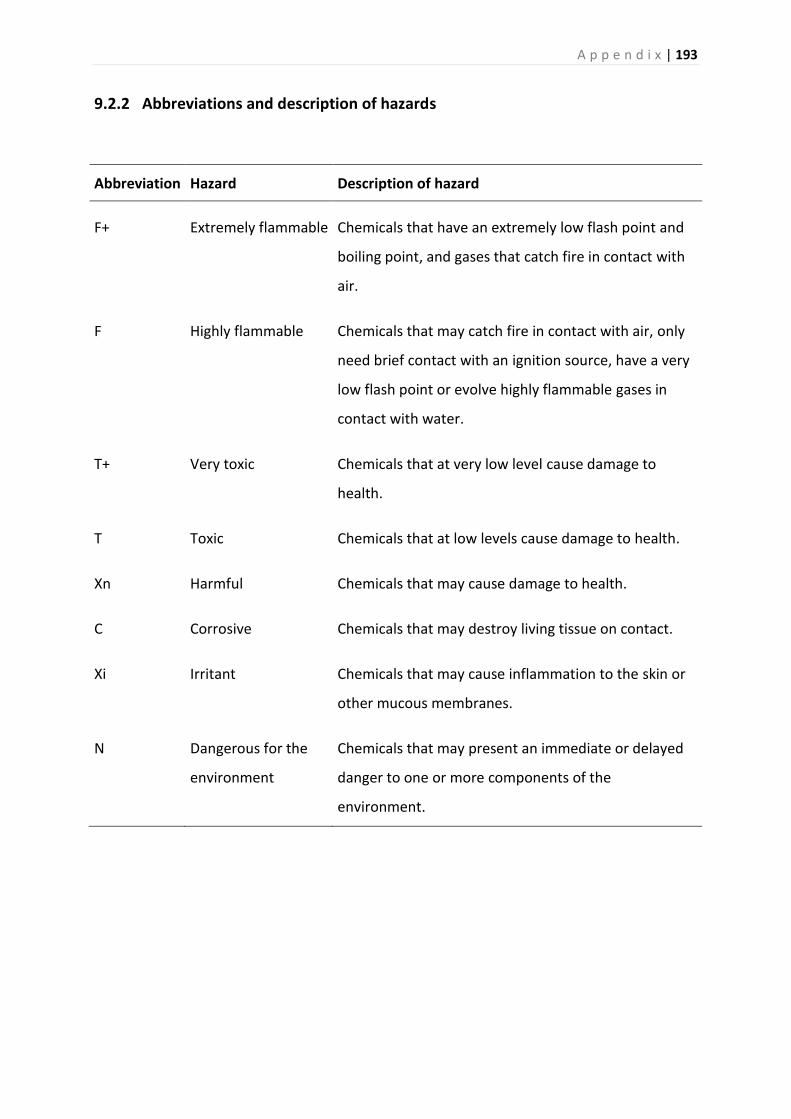
A p p e n d i x | 193
9.2.2 Abbreviations and description of hazards
Abbreviation Hazard Description of hazard
F+ Extremely flammable Chemicals that have an extremely low flash point and
boiling point, and gases that catch fire in contact with
air.
F Highly flammable Chemicals that may catch fire in contact with air, only
need brief contact with an ignition source, have a very
low flash point or evolve highly flammable gases in
contact with water.
T+ Very toxic Chemicals that at very low level cause damage to
health.
T Toxic Chemicals that at low levels cause damage to health.
Xn Harmful Chemicals that may cause damage to health.
C Corrosive Chemicals that may destroy living tissue on contact.
Xi Irritant Chemicals that may cause inflammation to the skin or
other mucous membranes.
N Dangerous for the
environment
Chemicals that may present an immediate or delayed
danger to one or more components of the
environment.

A p p e n d i x | 194
9.2.3 Risk phrases and description of risks
Abbreviation Description of risk
R11 Highly flammable
R12 Extremely flammable
R19 May form explosive peroxides
R20 Harmful by inhalation
R22 Harmful if swallowed
R23/24/25 Toxic by inhalation, in contact with skin and if swallowed
R28 Very toxic if swallowed
R32 Contact with acids liberates very toxic gas
R34 Causes burns
R35 Causes severe burns
R36 Irritating to eyes
R36/37/38 Irritating to eyes, respiratory system and skin
R36/38 Irritating to eyes and skin
R37 Irritating to respiratory system
R37/38 Irritating to respiratory system and skin
R38 Irritating to skin
R39/23/24/25 Toxic: danger of very serious irreversible effects through inhalation, in contact with skin and if swallowed
R41 Risk of serious damage to eyes

A p p e n d i x | 195
Abbreviation Description of risk
R42 May cause sensitisation by inhalation
R42/43 May cause sensitisation by inhalation and skin contact
R48/20/22 Harmful: danger of serious damage to health by prolonged exposure through inhalation and if swallowed
R50/53 Very toxic to aquatic organisms, may cause longterm adverse effects in the aquatic environment
R51/53 Toxic to aquatic organisms, may cause longterm adverse effects in the aquatic environment
R60 May impair fertility
R61 May cause harm to the unborn child
R66 Repeated exposure may cause skin dryness or cracking
R67 Vapours may cause drowsiness and dizziness

A p p e n d i x | 196
9.2.4 Safety phrases and description of safety
Abbreviation Description of safety
S7 Keep container tightly closed
S16 Keep away from sources of ignition - No smoking
S20 When using do not eat or drink
S22 Do not breathe dust
S24 Avoid contact with skin
S24/25 Avoid contact with skin and eyes
S26 In case of contact with eyes, rinse immediately with plenty of water and seek medical advice
S30 Never add water to this product
S36 Wear suitable protective clothing
S36/37 Wear suitable protective clothing and gloves
S36/37/39 Wear suitable protective clothing, gloves and eye/face protection
S36/39 Wear suitable protective clothing and eye/face protection
S37/39 Wear suitable gloves and eye/face protection
S39 Wear eye/face protection
S45 In case of accident or if you feel unwell seek medical advice immediately (show the label where possible)
S46 If swallowed, seek medical advice immediately and show this container or label
S53 Avoid exposure - obtain special instructions before use
S60 This material and its container must be disposed of as hazardous waste
S61 Avoid release to the environment. Refer to special instructions/safety data sheet

A p p e n d i x | 197
9.3 Representative results of fourier-transfom infrared (FT-IR) spectroscopy
for yeast identification
C:\Dokumente und Einstellungen\Administrator\Desktop\Auftragsproben_Studenten\Labormessungen\Prof.B.Bisping_Hamburg\Hefe_Prof.Dr.B.Bisping-18_B5.0 Prof.Dr.B.Bisping-18;;Hefe;Beerenwachstum 11/12/2013
500100015002000250030003500
Wavenumber cm-1
0.2
0.3
0.4
0.5
0.6
0.7
Ab
so
rba
nce
Un
its
Seite 1 von 1
C:\Dokumente und Einstellungen\Administrator\Desktop\Auftragsproben_Studenten\Labormessungen\Prof.B.Bisping_Hamburg\Hefe_Prof.Dr.B.Bisping-20_D5.0 Prof.Dr.B.Bisping-20;;Hefe;Beerenwachstum 11/12/2013
500100015002000250030003500
Wavenumber cm-1
0.2
0.4
0.6
0.8
1.0
Ab
so
rba
nce
Un
its
Seite 1 von 1
Pichia anomala IDE-Y001
Candida parapsilosis IDE-Y007

A p p e n d i x | 198
9.4 Representative results of 26S rRNA gene sequencing for yeasts
C:\Dokumente und Einstellungen\Administrator\Desktop\Auftragsproben_Studenten\Labormessungen\Prof.B.Bisping_Hamburg\Proben 26.02.14\Hefe_B.Bisping-26.2-54_D1.0 B.Bisping-26.2-54;;Hefe;Beerenwachstum 06/03/2014
500100015002000250030003500
Wavenumber cm-1
0.0
50
.10
0.1
50
.20
0.2
50
.30
Ab
so
rba
nce
Un
its
Seite 1 von 1
Hanseniaspora guilliermondii IDE-Y054
Saccharomyces cerevisiae IDI-Y001

A p p e n d i x | 199
Hanseniaspora guilliermondii IDI-Y039
Wickerhamomyces anomalus IDE-Y001

A p p e n d i x | 200
9.5 Representative results of 16S rRNA gene sequencing for lactic acic
bacteria and acetic acid bacteria
Lactobacillus plantarum IDI-L019
Lactobacillus fermentum IDE-L036

A p p e n d i x | 201
Acetobacter pasteurianus IDI-A003

A p p e n d i x | 202
9.6 Representative HPLC chromatogram for carbohydrates analysis
Chromatogram profile of mixed carbohydrates standards at a concentration of 2 mg mL-1
Chromatogram profile of carbohydrates s sample from cocoa bean fermentation
Sucr
ose
Glu
cose
Fru
cto
se
Man
nit
ol
Glu
cose
Fru
cto
se

A p p e n d i x | 203
9.7 Representative HPLC chromatogram for organic acids analysis
Chromatogram profile of mixed organic acids standards at a concentration of 1 mg mL-1
Chromatogram profile of organic acids sample from cocoa bean fermentation
Cit
ric
Lact
ic
Ace
tic
Cit
ric
Lact
ic
Ace
tic

A p p e n d i x | 204
9.8 Representative HPLC chromatogram for amino acids analysis
Chromatogram profile of amino acids standard at a concentration of 500 ng mL-1
Chromatogram profile of amino acids sample from cocoa bean fermentation

A p p e n d i x | 205
9.9 Representative HPLC chromatogram for polyphenol analysis
Chromatogram profile of polyphenols standard A
Chromatogram profile of polyphenols sample from cocoa bean fermentation

A p p e n d i x | 206
9.10 Representative MALDI TOF MS chromatogram for protein analysis
Chromatogram profile of osmotin protein from Theobroma cacao L.
Chromatogram profile of chitinase protein from Theobroma cacao L.

A p p e n d i x | 207
Chromatogram profile of glucan endo-1,3-beta-glucosidase protein from Theobroma cacao
L.

| 208
10 Curriculum vitae
Personal Data
Name : Fahrurrozi
Date of birth : Mataram, May 3rd 1981
Nationality : Indonesian
Educational Background
No. Year Degree Field and University
1. 1999 - 2003 Bachelor of
Science
Technology for agricultural products, Departement of
Agricultural Technology, University of Mataram,
Indonesia
2. 2004 - 2007 Master of Science
Protein and enzymology, Department of Biotechnology,
Bogor Agricultural Institute, Indonesia
3. 2011 - 2014 PhD student Food Microbiology and Biotechnology, Institute of Food Chemistry, Department of Chemistry, University of Hamburg, Germany
Research Experiences
No. Year Position Research
1. 2003 Bachelor of science
thesis
Making of soy sauce from the tofu waste
2. 2007 Master of science thesis
Purification and characterization of extracellular
xylanase Streptomyces 234P-16
3. 2007 Research assistant Utilization of palm kernel cake waste for production
manno-oligosaccharides as functional food components
4. 2007 Research assistant Studies of specification of mannanase enzyme to
produce functional food components
5. 2008 Research assistant Utilization of indigenous potato (Porang :
Amorphophallus onchophyllus) for manno-

A p p e n d i x | 209
oligosaccharides production
6. 2010 Research assistant BIOGROUTING: Utilization of marine microbes
carbonate precipitation for beach erosion application
7. 2014 PhD thesis Microbiological and biochemical investigations of cocoa
bean fermentation
Professional jobs
No. Year Positions Field and Institution
1. 2007 - 2008 Research assistant Laboratory of Biocatalyst and Fermentation,
Research Center for Biotechnology, Indonesia
Institute of Sciences (LIPI), Cibinong, Indonesia
2. 2008 - 2010 Research assistant Laboratory of Applied Microbiology
Research Center for Biotechnology, Indonesia
Institute of Sciences (LIPI), Cibinong, Indonesia
Publications
1. Anja Meryandini, Trio Hendarwin, Fahrurrozi, Alina Akhdiya, Deden Saprudin, Yulin
Lestari. 2009. Characterization and Purification a Specific Xylanase Showing
Arabinofuranosidase Activity from Streptomyces spp. 234P-16. Biodiversitas, Vol.
10, No. 3. p 115-119.
2. Fahrurrozi, Shanti Ratnakomala, Trisanti Anindyawati, Puspita Lisdiyanti, and Endang
Sukara. 2010. Rapid Assessment of Diverse Trichoderma Isolates of Indonesian
Origin For Cellulase Production. Annales Bogorienses Vol. 14, No. 1. 2010.
3. Fahrurrozi, Shanti Ratnakomala and Puspita Lisdiyanti. 2009. Screening and
Characterization of Actinomycetes Degrading Hemicellulose. Proceedings in The
First International Symposium of Indonesia Wood Research Society. Bogor,
Indonesia. 2nd – 3rd Nopember 2009.
4. Shanti Ratnakomala, Fahrurrozi, and Puspita Lisdiyanti. Screening and Characterization
of Cellulase Enzyme Producers from Indonesian Actinomycetes. Proceedings in
The First International Symposium of Indonesia Wood Research Society. Bogor,
Indonesia. 2nd – 3rd Nopember 2009
5. Puspita Lisdiyanti, Kiki Bayu Wardani, Fahrurrozi, and Shanti Ratnakomala. Molecular
Identification of Actinomycetes Isolated from Termite Mound. Proceedings in

A p p e n d i x | 210
The First International Symposium of Indonesia Wood Research Society. Bogor,
Indonesia. 2nd – 3rd Nopember 2009
6. Yopi, Dwi Susilaningsih, Ahmad Thontowi, Awan Purnawan, Apridah C. Djohan,
Fahrurrozi, and Puspita Lisdiyanti. 2007. Study on Hemicellulytic Bacteria:
Production of Oligosaccharides from Palm Kernel Cake using Fermentation.
Proceedings in Internasional Seminar “Advances in Biological Science:
Contribution Towards a Better Human Prosperity” Faculty of Biology Gajah
Mada Universuty, Yogyakarta-Indonesia. September 7-8, 2007, p 111-113
7. Yopi, A. Thontowi, Fahrurrozi, A. Purnawan and A.C. Djohan. Utilization of Indigenous
potato (Porang: Amorphophallus onchophyllus) for manno-oligosaccharides
production. Proceedings in ITSF SEMINAR on Science and Technology. Jakarta,
11st February 2009.
8. Fahrurrozi, Bahmann C, Lieberei R, Bisping B (2013) Antifungal activity in seed coat
extracts of Theobroma cacao L. Poster. Dechema Jahrestagung der
Biotechnologen, Frankfurt am Main, 4.-5. March 2013.
9. Fahrurrozi, Bahmann C, Lieberei R, Bisping B (2013) Antifungal activity in seed coat
extracts of Theobroma cacao L. Poster presentation at VAAM International
Conference on Microbiology, Bremen, Germany, 10 - 13 March 2013.
10. Fahrurrozi, Bahmann C, Niemenak N, Lieberei R, Bisping B (2014) Antifungal protein of
seed coat extracts of Theobroma cacao L. during fermentation. Poster 16th
European Congress on Biotechnology, Edinburgh, Scotland, 13-16 July 2014.