Embed Size (px)
Citation preview
Microbiological Analysis of Sediment and Water–Column Samples
from St. John’s Harbour
And
Antibiotic Resistance of the Isolates
By
Dr. Thakor R. Patel Professor of Microbiology
Memorial University of Newfoundland, St. John’s And
Dr. Jerry Payne Department of Fisheries & Oceans
Prepared For
St. John’s Harbour ACAP, Inc.
December 15, 2004
Table of Contents Introduction…………………………………………………………… 1 Objectives……………………………………………………………… 1 Material and Methods………………………………………………… 1 1. Sediment/Water Column Samples…………………………………………... 1 2. Preparation of sediment samples for microbiological analysis……………… 3 3. Preparation of marine water-column samples for microbiological analysis… 3 4. Enumeration of Escherichia coli and coliform bacteria……………………. 3 5. Detection of Salmonella organisms………………………………………… 4 6. Isolation of specific organisms in pure cultures…………………………….. 5 7. Identification of Enterobacteriaceae and other non-fastidious,
gram-negative rods………………………………………………….. 7 8. Gram Staining……………………………………………………………….. 7 Results………………………………………………………………….. 8 A. Coliforms……………………………………………………………………. 8 B. E. coli……………………………………………………………………….. 8 C. Listeria……………………………………………………………………… 8 D. E. coli and Enterococci……………………………………………………... 8 E. E. coli and Salmonella……………………………………………………… 9 F. Staphylococci……………………………………………………………….. 9 G. Salmonella and Shigella……………………………………………………. 9 H. Purification of isolates………………………………………………………. 10 I. Antibiotic sensitivity of selected isolates……………………………………. 10 J. Observed drug resistance in the isolates…………………………………….. 11 Discussion………………………………………………………………. 12 Q.1 Do any of the species identified have natural resistance to antibiotics?…….. 12 Q.2 Are isolates picking up this resistance from the other bacteria in the harbour or because of treatment of human hosts with antibiotics?…………… 13 Q.3 Comparison of sampling sites to show relative abundance of drug resistant populations…………………………………………………. 13 Q.4 Are all of the antibiotics used broad spectrum?……………………………... 13 Conclusions……………………………………………………………. 14 References……………………………………………………………… 43 List of Figures: Figure 1: Location of Sample Sites……………………………………………. 2
i
List of Tables: Table 1: Enumeration of E. coli on selective medium, Eosine Methylene Blue, EMB, Agar Plates……………………………………………. 15 Table 2: Determination of Coliform MPN using 3-Tube Series of BGB-broth tubes…………………………………………………………. 16 Table 3: Determination of E. coliMPN using 3-Tube Series and EC broth tubes…………………………………………………………. 17 Table 4: Enumeration of Listeria organisms on a selective medium – PALCAM supplemented with Antimicrobial Supplement……………… 18 Table 5: Enumeration of Listeria organisms on a selective medium Bacto Oxford medium containing Bacto Oxford Antimicrobic Supplement…………………………………………………... 19 Table 6: Estimation of E. coli and Enterococci numbers on a selective medium, Xylose, Lysine, Deoxycholate Agar (XLD) Plates…………... 20 Table 7: Detection of E. coli and Salmonella organisms on a selective medium, XLT4 Agar Plates…………………………………………….. 21 Table 8: Detection of Staphylococci organisms on a selective medium, Baird Parker Agar Plates……………………………………………. 22 Table 9: Detection of Salmonella and Shigella on selective medium, Hektoen Agar Plates……………………………………………………. 23 Table 10: Detection of Salmonella and Shigella on selective HEK plates Inoculated with Tetrathionate broth cultures…………………. 24 Table 11: Detection of Salmonella and Shigella on XLD agar plates inoculated with selenite-cystine broth cultures…………………………... 25 Table 12: Detection of Salmonella, Shigella and E. coli on XLD agar plates inoculated with Tetrathionate broth cultures…………………. 26 Table 13: Detection of Salmonella and E. coli on Bismuth Sulfite Agar plates inoculated with selenite-cystine broth cultures………………. 27 Table 14: Isolation of Listeria organisms from selective media plates (PALCAM, and Oxford agar plates……………………………………….. 28 Table 15: Isolation of E. coli from EMB plates………………………………… 29 Table 16: Isolation of Salmonella organisms from selective medium, Baird Parker plates………………………………………………….. 30 Table 17: Isolation of Salmonella from Bismuth Sulfite Agar plates………….. 31 Table 18: Isolation of Shigella organisms from Hektoen (HEK) Agar Plates…. 32 Table 19: Sensitivity of Listeria isolates to various Antibiotics……………….. 33 Table 20: Sensitivity of Listeria isolates to selected Antibiotics………………. 34 Table 21: Sensitivity of E. coli isolates to selected Antibiotics………………… 35 Table 22: Sensitivity of E. coli isolates to selected Antibiotics………………… 36 Table 23: Sensitivity of Staphylococci isolates to selected Antibiotics………... 37 Table 24: Sensitivity of Staphylococci isolates to selected Antibiotics………... 38 Table 25: Sensitivity of Salmonella isolates to selected Antibiotics…………… 39 Table 26: Sensitivity of Salmonella isolates to selected Antibiotics…………… 40 Table 27: Bacterial isolates identified by the API system……………………… 41 Table 28: List of isolates tested for their gram characteristics…………………. 42
ii
Introduction Urban and industrial sewage discharges into harbour or marine environments can cause contamination of waters and aquatic life forms. An earlier study, “A Bacteriological Investigation of Selected Flounder, Crab and Lobster Collected from St. John’s Harbour” (June 2001) prepared by Deborah Squires-Parsons, MUN, in June 2002 revealed the presence of various human pathogens of bacterial origin. Consumption of harvested organisms from contaminated areas therefore presents a risk to public health. A further study, "Analysis of Steroid Hormones as Endocrine Disruptors in Sewage, Seawater and Mussels Using GC.MS techniques" by Gurusankar Saravanabhavan, M.Sc. thesis, Memorial U., June 2003 provides additional evidence of marine contamination in St. John’s Harbour from the discharge of untreated municipal wastewater. Many bacterial species of enteric origin (animal faecal matter) can be isolated from harbours with human /or animal habitation. Marine sediments have been shown to harbour large numbers of pathogenic bacteria with less numbers being present in the water column and surface films. St. John's Harbour receives substantial quantities (120 million litres) of untreated sewage and stormwater run-off per day. Rapid multiplication of microbes is expected in such waste with high organic content. As a part of a large study to examine safety of marine environment undertaken by ACAP the present study describes the prevalence of selected bacterial species in the sediment and water column samples collected from selected designated sites in St. John's Harbour. Objectives The intent of this study is to:
i) Collect sediment and water-column samples from five different locations in the St. John's Harbour.
ii) To isolate enteric pathogens using selective microbiological media. iii) To identify the isolated bacterial species. iv) To determine antibiotic resistance or sensitivity of the isolates to various
antibiotics. Material and Methods 1. Sediment / Water column samples.
Sediment and water-column samples were collected by the Department of Fisheries and Oceans, St. John's. They consisted of five sediment (G1-G5) and five water-column (W1-W5) samples collected from the same corresponding location as the sediment samples. Sample collection began near the Chain Rock location in The Narrows for Samples G1/W1; south of Pier 17 for Samples
1

Figure 1: Location of Sample Sites
2
G2/W2; east of Pier 12 for Samples G3/W3; equi-distant between Pier 9 (adjacent to Atlantic Place) and Pier 25 (Marine Institute) for Samples G4/W4; and just north-east of Pier34/35 in The Basin for Samples G5/W5 (Figure 1). The appropriate latitude and longitude coordinates are as follows for these sample locations:
Sample 1 (G1 & W1): N 47° 33.986' W 052° 41.312' Sample 2 (G2 & W2): N 47° 34.100' W 052° 41.702' Sample 3 (G3 & W3): N 47° 33.940' W 052° 41.997' Sample 4 (G4 & W4): N 47° 33.708' W 052° 42.230' Sample 5 (G5 & W5): N 47° 33.417' W 052° 42.505'
Sediment samples in plastic containers (buckets) and water-column samples in plastic bottles were transported to a lab at MUN (Dr. Thakor Patel), on ice in large ice coolers. These samples were processed within 24 hr after arrival.
2. Preparation of sediment samples for microbiological analysis.
The following methods are based on the analysis of 25g analytical unit at 1: 9 sample dilution ratio. 25g of sediment were suspended in 225 ml of 0.1% peptone water. Five such 250ml (total) suspensions were prepared and used for detection and quantification of selected bacterial species described below.
3. Preparation of marine water-column samples for microbiological analysis.
25 ml water sample was added to 225 ml of 0.1% peptone water and mixed thoroughly. Five such suspensions representing samples W1 - W5 were prepared and used for detection and enumeration of selected bacterial species.
4. Enumeration of Escherichia coli and Coliform Bacteria.
To test the presence of sanitary index bacteria (the coliforms, faecal coliforms and E. coli as coliforms) the method described in Bacteriological Analytical Manual, 7th Edition, 1992, Association of Official Analytical Chemists (AOAC) International, was used. This method also detects virulent strains of E. coli, of which there are several major groups. E. coli and the coliforms are Gram-negative, rod shaped bacteria. Identification criteria used are production of a gas from glucose (and other sugars) and fermentation of lactose within 48 hr at 35oC (coliforms) and at 45.5oC (faecal
3
coliforms and E. coli as coliforms). It is common to use 44.5oC for detection of E. coli (1, 2). The method used in the present study corresponds to AOAC's Official Method of Analysis (6). Presumptive and confirmed tests for coliform bacteria were carried out using the procedure of Hutchins, et al. (1992) while EC broth method was used for the Most Probable Number for E.Coli (1). E coli counts were also obtained by plating serial dilutions of the samples on a selective medium – Eosine Methylene Blue (EMB) agar plates. On this medium E. coli gives blue-black colonies with dark centres and green metallic sheen. Enterococcus faecalis and Salmonella typhimurium give colorless colonies.
5. Detection of Salmonella organisms. Procedure of Andews, et al. (1992) was used for detection and isolation of Salmonella organisms. Bacto selenite cystin broth (SC-broth) is used for selectively enriching Salmonella in an unknown sample. Selenite broth favours the growth of Salmonella while reducing growth of faecal coliforms and enterococci. The growth and recovery of Salmonella in food samples can be hindered by non- Salmonella bacteria, substances indigenous to the sediment samples or water samples, and low numbers of Salmonella which may be partially injured. Using protocols that involve pre-enrichment, selective enrichment and selective plating increases the likelihood of recovering Salmonella. In most standard method procedures selenite - cystine broth is recommended in the selective enrichment step. As a selective enrichment medium selenite - cystine broth is formulated to allow proliferation of Salmonella while inhibiting the growth of competing non- Salmonella bacteria. Tetra-thionate broth is used for enriching Salmonella from samples prior to isolation procedures. TT – broth is very useful in detecting Salmonella that can be injured in the environment or during processing procedures. Factors such as temperatures, drying, radiation, preservatives and sanitizers can injure Salmonella cells. Although injured cells may not form colonies on selective media, they can cause diseases if ingested. Salmonella species, in particular, can cause many types of infections from mild self-limiting gastroenteritis to life-threatening typhoid fever. Selectivity in TT-broth is accomplished by the combination of sodium thiosulfate and tetra-thionate, suppressing coliform organisms. Organisms containing
4
tetrathionate reductase will proliferate in this medium. Sodium deoxycholate and brilliant green in TT-broth are selective agents that suppress coliform bacteria. Bismuth sulfite indicator and brilliant green in Bismuth Sulfite Agar, are complementary in inhibiting gram positive bacteria and members of coliform group while allowing Salmonella to grow luxuriantly. Dark brown or black colonies result from ferrous sulphate precipitating iron. Hektoen Enteric Agar was also used for the detection and isolation of Salmonella colonies. On this selective medium, Salmonella typhimurium gives black colonies while Shigella flexneri yields greenish-blue. E. coli and Enterococci are inhibited on this medium. To facilitate detection and isolation of Salmonella, two other selective media were used, namely, XLD (Difco, xylose,lysine & deoxycholate) agar and XLT4 (difco, xylose, lysine & sodium thiosulfate) agar.
On XLD plates Entercocci and E. coli give yellow colonies while Salmonella and Shigella give red/black and red colonies, respectively. Lysine is added to differentiate Salmonella organisms carrying lysine decarboxylase which acts on lysine to create alkaline conditions. High acid production by fermentation of sugars (xylose, lactose, and saccharose) in the medium inhibit other lysine – positive organisms.
On the XLT4 agar plates both Staphylococci and Escherichia & Enterococci are inhibited while Salmonella grow into yellow to red colonies with black centers. 6. Isolation of specific organisms in pure cultures. a) Detection and isolation of Salmonella and Shigella organisms using selective media From Bismuth Sulfite Agar plates 12 colonies of Salmonella were obtained for further testing. From XLT4 Agar plates 18 colonies representing Salmonella were isolated. Thus, a total of 30 Salmonella colonies were obtained for testing of their antibiotic resistance. For the isolation of Shigella organisms, HEK and XLD agar plates were used. A total of 30 colonies were picked at random from HEK agar plates (12 colonies) and XLD agar plates (18 colonies).
5
b) Detection and isolation of Staphylococci organisms using selective medium. Procedures outlined in the Manual of Health Protection Branch (MFHPB- 21) were used for the detection and isolation of staphylococci. Baird Parker Agar contains glycine and sodium pyruvate which stimulate growth of Staphylococci. Lithium chloride and potassium tellurite in the medium suppress the growth of organisms other than Staphylococci. Coagulase positive Staphylococci yield clear zone around colonies while opaque zone of precipitation may form due to lipase activity. Reduction of potassium ellurite causes blackening of the colonies.
c) Detection and isolation of Listeria organisms using selective media. Isolation and detection protocols of Hitchins (1992a) were used for isolation of Listeria organisms. BactoOxford agar medium containing oxford antimicrobic supplement is highly selective for isolating and differentiating Listeria organisms. This organism can cause human illness and death, particularly in immuno-compromised individuals and pregnant women. Implicated vehicle of transmission include food items and water. These organisms are ubiquitous in nature, being present in a wide range of unprocessed foods, and in soil, sewage, silage, and river water. Oxford agar containing esculin make Listeria colony and surrounding medium black due to hydrolysis of esculin and formation of hydroxyl- coumarine which reacts with ferric chloride ions in the medium. Lithium chloride and high salt content in the medium are selective for Listeria. Enterococci are sensitive to high salt content. Selectivity is increased by various antimicrobial agents present in the antimicrobic supplement. Bacto PALCAM medium base with antimicrobic supplement is used in isolating and cultivating Listeria from various types of samples. This medium is recommended by Health Canada for the detection of Listeria monocytogenes in food and environmental samples. Selectivity of the complete medium is achieved by incorporating antimicrobic supplement in the agar medium. The antimicrobic agents effectively suppress growth of most commonly occurring non-Listeria species of bacteria. Esculin functions in the same way as it does in the oxford medium.
6
7. Identification of Enterobacteriaceae and other non-fastidious, Gram-
negative rods. API-20 E is a standardized identification system for Enterobacteriaceae and other non-fastidious Gram-negative rods which use 21 miniaturized
biochemical tests and a database. The complete list of those organisms that is possible to identify with this system is given in the Identification Table and includes, amongst them, organisms included in the present study.
The API20-E strip consists of 20 micro-tubes containing dehydrated substrates. These micro-tubes are inoculated with bacterial suspensions that reconstitutes the media. During incubation, metabolism produces colour changes that are either spontaneous or revealed by the addition of reagents. The reactions are read according to the Reading Table and the identification is obtained by referring to the Analytical Profile index or using the identification software. In the current study Analytical Profile index was used. Table 27 lists selected isolates (Gram-negative) that were confirmed using API system. 8. Gram Staining:
The Gram staining is a very useful technique for identifying and classifying bacteria. The Gram stain is a differential stain that allows one to classify bacteria as either gram-positive (stained blue or purple) or gram negative (stained red or pink). It is one of the first procedures to be performed for the identification of bacteria. Bacterial classification schemes are based on the gram-nature of bacterial cells.
Isolates were randomly picked from each group to confirm their Gram- nature, and are listed in Table 28.
7
Results A. Coliforms: Table 1 shows the presence of E. coli in both types of samples, i.e. sediment samples G1 – G5 as well as water column samples W1 – W5. E. coli numbers were higher in the sediment samples when compared to water column samples.
Sediment sample G5 showed the highest counts with 13,500 colony forming units per gm. (cfu/g) while sample G2 had a lower value of 2,400 per gm. High counts of 3700 per ml and a low of 100 colony forming units per ml were detected in samples W3 and W2, respectively.
Coliform content of the samples showed higher counts when samples were analysed using the MPN-method. Table 2 shows the coliform MPN per 100 ml or gm. of the samples. Sediment samples (G1 – G5) in general yielded higher MPN values than the water column samples (W1 – W5). Samples G4 and G5 showed the highest counts of 110,000 MPN per 100g. In contrast, the water column samples gave an elevated value of 46,000 MPN per 100 ml (W5), which is less than 50% of the value detected for G4 or G5.
B. E. coli: Estimation of E. coli MPN revealed that with EC broth tubes incubated at 45oC, the values doubled (Table 3) compared to similar values for coliforms ( Table 2).
A high MPN value of 240,000 per 100 g sediment samples was obtained with G4 and G5. MPN values for water-column samples under similar conditions ranged between 700 and 21,000 (Table 3). Thus, there was a ten-fold difference in the values for sediment and water column samples.
C. Listeria:
No Listeria organisms were detected in the majority of water- column samples (W1, W3, W4, and W5) when plating was performed on selective medium such as
PALCAM (Table 4). Only one sample (W2) showed the presence of Listeria. In contrast, the majority of sediment samples (G2 – G5) revealed the presence of this organism. A high count of 10,400 cfu / g was obtained for G2 while a low count of 100 cfu / g was estimated for samples W2.
Surprisingly, W1 was the only sample that detected the presence of Listeria when plating was performed on Oxford agar plates (Table 5). On the same medium, the sediment samples (G2, G3, and G5) gave positive results. No growth was detected with samples G1 and G4. Sample G2 showed the highest count of 18,300 cfu / g while counts in samples, W1, G3, and G5 was about 3,700 cfus.
8
D. E. coli and Enterococci:
Selective medium such as XLD agar enhances the growth of E. coli-Enterococci, and Shigella (Table 6) with each of the organisms displaying characteristic colony morphology. On this selective medium both E. coli-Enterococci group and Shigella organisms were detected. Only one sample, G5, showed the presence of Shigella while evidence of the E. coli-Enterococci group could be detected in samples G1, G3, G4, and G5. Only water column samples W1, W2, and W5, as well as sediment sample G5, revealed the presence of low counts (100 – 300 cfu / gm or ml) of Shigella (Table 6).
E. E. coli and Salmonella: On selective medium like XLT4 agar, it is possible to detect the growth of E.coli and Salmonella simultaneously. E. coli was detected using this medium in samples G1, G2, G4, and G5, as well as samples W2, W4, and W5. Thus, seven out of ten samples showed the presence of E. coli. In contrast, only four samples (G2, G5, W4, and W5) revealed the presence of Salmonella (Table 7). Highest counts of 3,400 cfu / g were estimated for Salmonella (G5). F. Staphylococci: Baird Parker agar plates are suitable for detecting Staphylococcus in unknown samples. This selective medium enhances the proliferation of these organisms which form black colonies that are easily visualised on BP agar plates. Two sediment samples (G2 and G5) revealed the presence of staphylococci organisms. These organisms were not detected in water column samples W1- W5 (Table 8). Sediment sample G2 revealed a high count of 14,700 cfu / g while the numbers decreased by ten-fold in G5. G. Salmonella and Shigella: Hektoen agar plates are commonly used to detect these organisms which form characteristic colonies. Salmonella was detected in samples G1, G5, W1, W2,
W4 and W5 when HEK plates were inoculated with a loopful of samples from selenite-cystin broth cultures. Thus, four out of five water column samples were positive for Salmonella, whereas only two sediment samples (G1 and G5) were positive. In contrast, nine out of ten samples revealed the presence of Shigella (Table 9). The detection of Salmonella on HEK plates inoculated with loopfuls of innocula from tetrathinonate broth cultures revealed the distribution shown in Table 10. All sediment samples were positive for Salmonella together with sample W1. Samples G2, G4, G5 and W1 only showed the presence of Shigella organisms (Table 10).
9
On selective XLD agar plates inoculated with loopfuls of inocula from selenite cystin broth cultures, the distribution of Salmonella and Shigella is depicted in Table 11. All sediment samples (G1 – G5) were positive for Salmonella but all water column samples (W1 – W5) were negative. Shigella organisms were detected in sediment samples G1, G5, and water column sample W1 only.
All samples were tested positive for E. coli (Table 11). On repeating the tests using inoculum from tetrathionate broth cultures, the results changed drastically (Table 12). Four sediment samples (G1, G3, G4, and G5) tested positive for Shigella. All water column samples (W1 - W5) tested negative for Shigella. E. coli was tested positive in only three samples (G1,G2 and G5). The remaining seven samples tested negative on XLD agar plates (Table12).
Bismuth sulfite agar is also selective medium that allows the growth of Salmonella and E. coli. When samples from selenite – cystin broth cultures
were used as inocula and inoculated on BS agar plates, the growth pattern observed is shown in Table 13. All the samples tested positive for Salmonella and E. coli (Table 13). All ten samples tested positive for Salmonella and E. coli.
H. Purification of isolates: Tables 14, 15, 16, 17 and 18 list 30 isolates each of Listeria, E. coli, Staphylococci, Salmonella, and Shigella, respectively. Single colonies were sub-cultured to purify the isolates. From 30 colonies of each genera about 15 – 20 were tested for their sensitivity to about 15 different antibiotics. I. Antibiotic sensitivity of selected isolates: Table 19 and 20 list Listeria isolates and their response to 15 different antibiotics. It is evident from these Tables that these isolates vary in their response to these antibiotics. Some isolates are resistant to specific antibiotics in varying degrees.
It is evident that some isolates listed in Table 19 are resistant to nalidixic acid (NA), gentamycin (G), and erythromycin (E). The results in Table 20 indicate that almost all of the Listeria isolates tested were resistant to bacitracin (B) while others were resistant to streptomycin (S) and oxacillin (OX).
All twenty one (21) isolates of E. coli were resistant to OX, B, and penicillin (P) while EMB -18, 19, 21, and 22 were resistant to ampicillin (AM). Isolate EMB-21 was also resistant to carbecillin (CB) (Table 21). Table 21 also shows that isolate EMB-21 was resistant to NA, G, and trimethoprim (TMP) and slightly resistant to oxytetracycline (OT). Isolate EMB-26 showed resistance to G and E to a lesser degree.
10
Table 23 shows that some Staphylococcus isolates exhibited slight resistance to B and P. In Table 24, isolates BP-13, 15, 17, 18, 20, and 26 were resistant to E while isolates BP-12 and BP-20 were resistant to G.
The majority of the Salmonella isolates were resistant to OX, B, and P and slightly resistant to S. Isolate XLT4 – 23 was found to be resistant to PB (polymyxin B) and slightly resistant to AM (Table 25). Table 26 indicates that all Salmonella isolates tested were resistant to E and slightly to G.
Table 27 gives a summary of Salmonella, E. coli, and Shigella species that were identified using the API system. For practical reasons only a limited number of isolates from each genus were tested. Table 28 lists isolates that were subjected to Gram staining procedures. Their response to this staining method is given in this table. J. Observed drug resistance in the isolates:
Listeria species. Isolate 02 resistant to NA, G, B, & S Isolate 07 resistant to E, Ox, & B E. coli. Nineteen (19) isolates were resistant of OX, B, & P Five (5) isolates were resistant to OX, B, P, & AM One (1) resistant to NA, C, & TMP One (1) resistant to NA One (1) resistant to G Staphylococci. Two (2) resistant to G & E Six (6) resistant to E One (1) resistant to G & E Salmonella species Fifteen (15) resistant to OX, B, P, E One (1) resistant to OX, B, P, & AM One (1) resistant to OX, B, P, & PB
Thus, it is evident that some of the isolates carry multiple drug resistance and can pose a potential health hazard to the public if contaminated marine life forms are consumed and originate in the
11
vicinity of the harbour. Discussion In interpreting the results of this research study, a number of questions were raised which deserve further exploration. While recognizing the limitations that exist within a research project of this size, these questions are identified below in an effort to provide the best possible answers with the information available at the present time. Q1. Do any of the species identified have natural resistance to antibiotics?
Natural resistance is due to genetic make up of an organism. Micro-organisms may spontaneously mutate against a given trait in their environment once every 100,000 to1,000,000 cell divisions. Because of their rapid multiplication rates, the chance of microbial mutations against a given antimicrobial agent is quite probable. In this situation, the mutant may rapidly multiply in the presence of antibiotic and produce many resistant progeny.
In addition to spontaneous mutations genetic resistance may be passed from one bacterium to another by small circular extra-chromosomal DNA fragments called 'resistant plasmids' or 'R factors'. A resistance plasmid may contain the genetic information that codes for resistance to one or several antibacterial agents( multiple drug resistance); when the plasmid is passed to a new cell, the trait of antibiotic resistance is also passed. The accumulation of antibiotics in the environment speeds up the evolution of drug resistant bacteria which begin to dominate since the sensitive ones are destroyed. There are three mechanisms by which drug resistance can be transferred amongst bacterial populations: a. Conjugating cells transfer plasmid from a donor cell to a recipient cell. Thus a resistant bacterium can transfer plasmid to a sensitive bacterial cell which now becomes resistant having acquired the R factor. b. Transformation is a process in which a bacterial cell is capable of taking up (absorbing) fragments of DNA into its cytoplasm where a recombination event takes place and the acquired DNA fragment is integrated into the host chromosome. This integrated fragment encodes genetic information for drug resistance.
c. Bacterial viruses (bacteriophages, phages) play a role in transferring genetic information from one bacterium to another by a process called
12
transduction. If the fragment or gene transferred is related to the drug resistance, then the recipient cell becomes resistant as well.
Q2. Are isolates picking up this resistance from the other bacteria in the harbour or because of treatment of human hosts with antibiotics?
Transfer of drug resistance (R factor) amongst bacterial communities is a common phenomenon. More work is needed to confirm if the drug resistant bacteria isolated carry plasmids and if conjugation is occurring between different species of the same genus, or whether there is also inter-generic transfer as well. Flushing of antibiotics into the sewer system creates an ideal environment for rapid evolution of drug resistant bacteria. The presence of antibiotics in the environment allows the selection of resistant variety which begin to rapidly multiply without competition.
Q3. Comparison of sampling sites to show relative abundance of drug resistant populations.
There is not enough data to enable us to draw any conclusions with respect to the abundance of resistant populations at various sites sampled.
Q4. Are all of the antibiotics used broad spectrum antibiotics?
The majority of the fifteen (15) antibiotics used in the tests were broad Spectrum, i.e. effective against a wide variety of bacteria including gram positive and gram negative cells. Five (nalidixic, polymyxin B, erythromycin, bacitracin and oxacillin) are considered narrow spectrum i.e. effective against a limited type of bacteria. Please refer to Tables 20 & 21 of the report.
13
Conclusions 1. Enteric pathogens together with Listeria and Staphylococcus were present in sediment and water column samples from St. John’s Harbour. 2. Five different types of bacterial species were confirmed in ten (10) samples that were analysed for their microbial contents. These included E. coli, Salmonella, Listeria, Staphylococcus and Shigella. 3. Sediment samples showed higher bacterial numbers than water column samples. 4. About 140 isolates representing five different genera were characterized with respect to their gram nature and sensitivity to fifteen different antibiotics. 5. Selected isolates were further confirmed using an API identification system. 6. Exposure of isolates to 15 different antibiotics suggests there is a potential for
accumulation of drug resistant bacteria in the harbour.
14
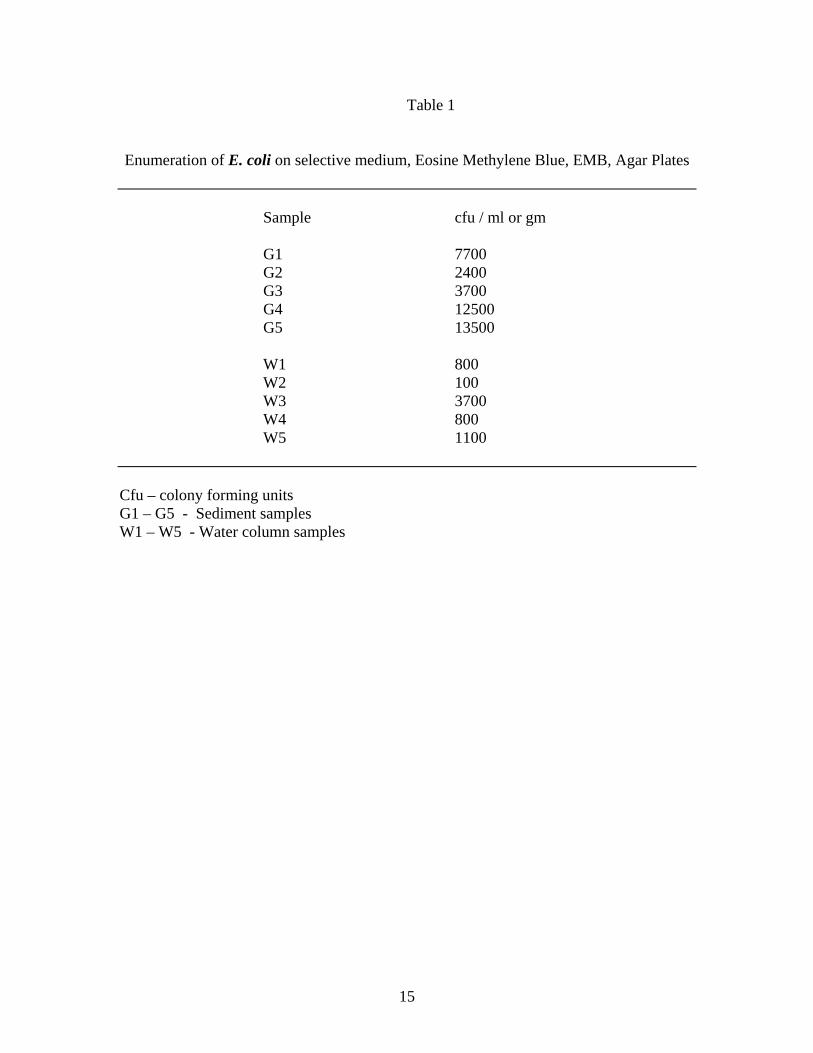
Table 1
Enumeration of E. coli on selective medium, Eosine Methylene Blue, EMB, Agar Plates
Sample cfu / ml or gm G1 7700 G2 2400 G3 3700 G4 12500 G5 13500 W1 800 W2 100 W3 3700 W4 800 W5 1100
Cfu – colony forming units G1 – G5 - Sediment samples W1 – W5 - Water column samples
15
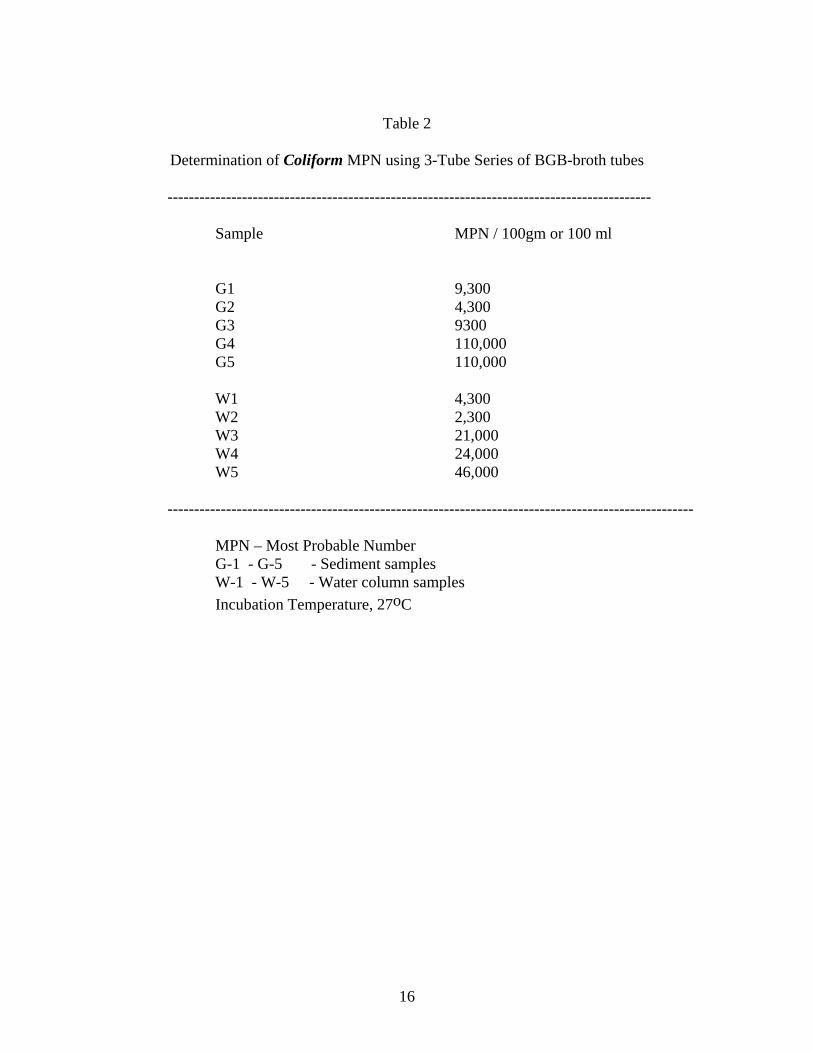
Table 2
Determination of Coliform MPN using 3-Tube Series of BGB-broth tubes
------------------------------------------------------------------------------------------- Sample MPN / 100gm or 100 ml G1 9,300 G2 4,300 G3 9300 G4 110,000 G5 110,000 W1 4,300 W2 2,300 W3 21,000 W4 24,000 W5 46,000 --------------------------------------------------------------------------------------------------- MPN – Most Probable Number G-1 - G-5 - Sediment samples W-1 - W-5 - Water column samples Incubation Temperature, 27oC
16
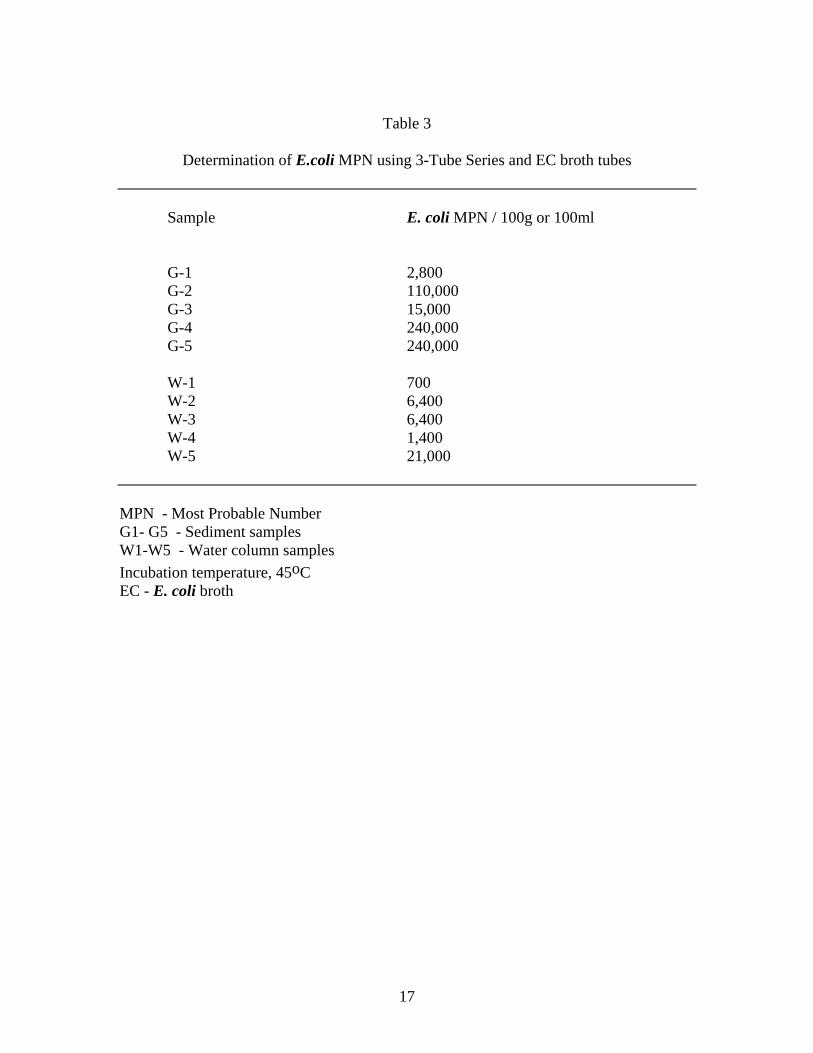
Table 3
Determination of E.coli MPN using 3-Tube Series and EC broth tubes
Sample E. coli MPN / 100g or 100ml G-1 2,800 G-2 110,000 G-3 15,000 G-4 240,000 G-5 240,000 W-1 700 W-2 6,400 W-3 6,400 W-4 1,400 W-5 21,000 MPN - Most Probable Number G1- G5 - Sediment samples W1-W5 - Water column samples Incubation temperature, 45oC EC - E. coli broth
17
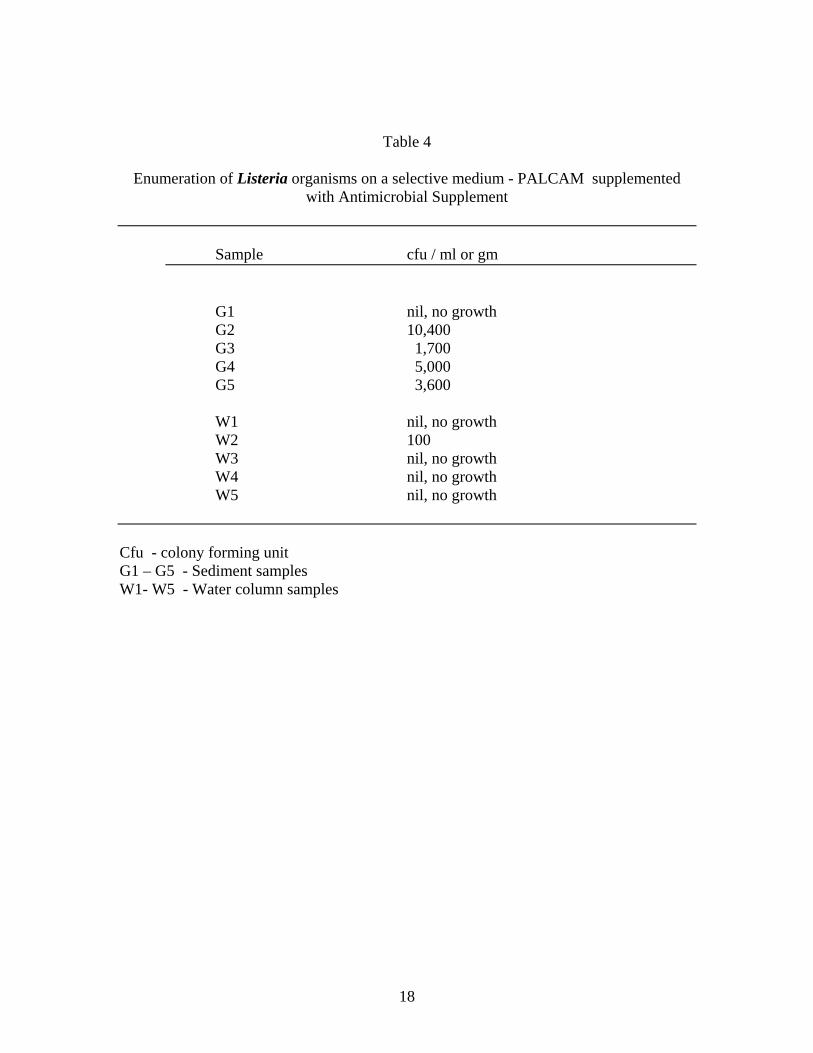
Table 4
Enumeration of Listeria organisms on a selective medium - PALCAM supplemented with Antimicrobial Supplement
Sample cfu / ml or gm G1 nil, no growth G2 10,400 G3 1,700 G4 5,000 G5 3,600
W1 nil, no growth W2 100 W3 nil, no growth W4 nil, no growth W5 nil, no growth Cfu - colony forming unit G1 – G5 - Sediment samples W1- W5 - Water column samples
18
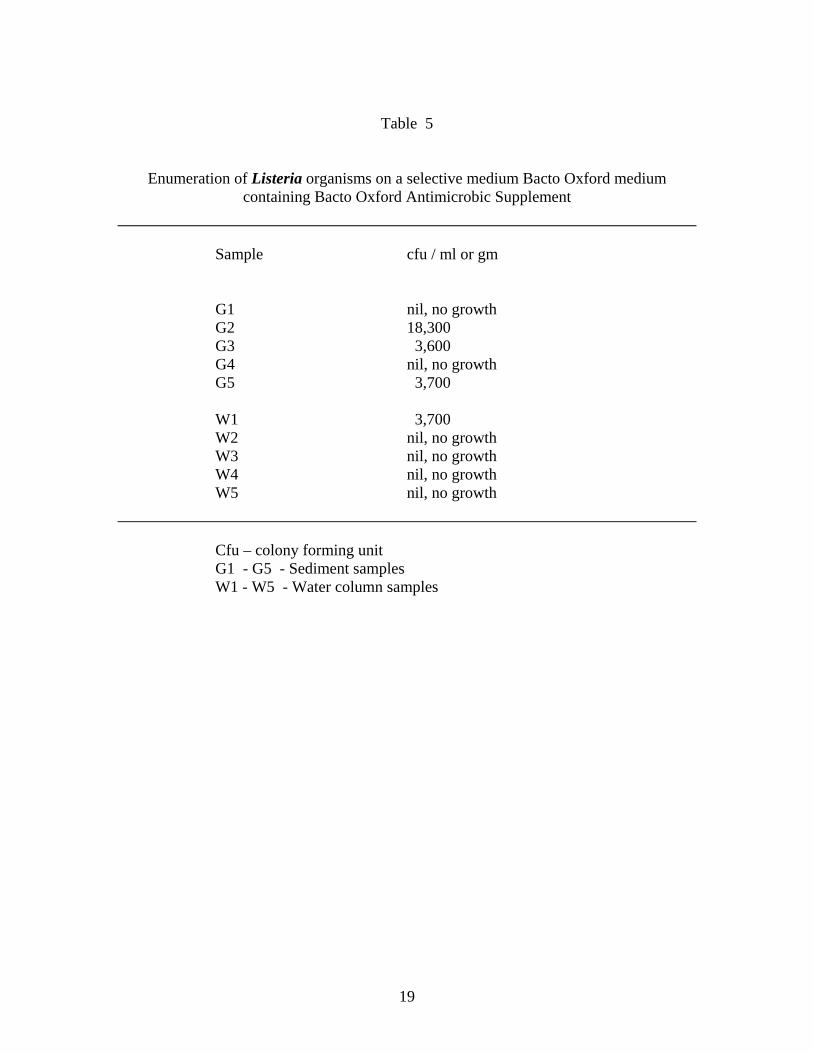
Table 5
Enumeration of Listeria organisms on a selective medium Bacto Oxford medium containing Bacto Oxford Antimicrobic Supplement
Sample cfu / ml or gm G1 nil, no growth G2 18,300 G3 3,600 G4 nil, no growth G5 3,700 W1 3,700 W2 nil, no growth W3 nil, no growth W4 nil, no growth W5 nil, no growth Cfu – colony forming unit G1 - G5 - Sediment samples W1 - W5 - Water column samples
19
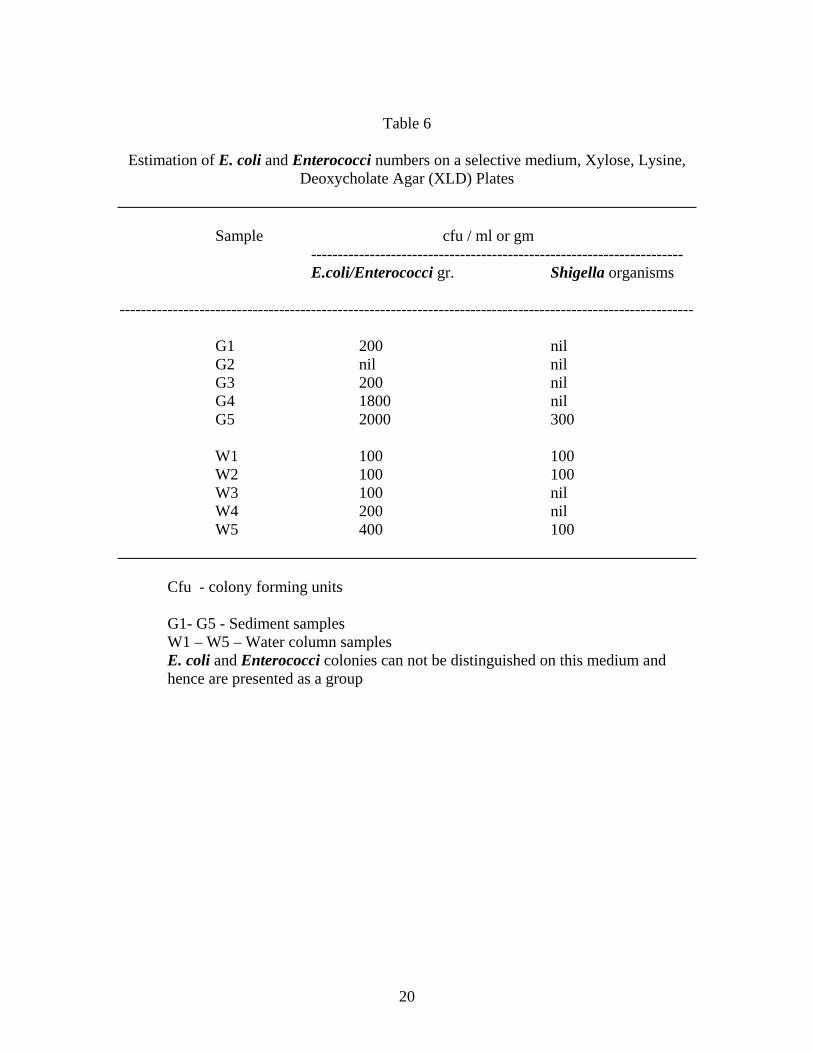
Table 6
Estimation of E. coli and Enterococci numbers on a selective medium, Xylose, Lysine,
Deoxycholate Agar (XLD) Plates
Sample cfu / ml or gm ---------------------------------------------------------------------- E.coli/Enterococci gr. Shigella organisms
------------------------------------------------------------------------------------------------------------ G1 200 nil G2 nil nil G3 200 nil G4 1800 nil G5 2000 300 W1 100 100 W2 100 100 W3 100 nil W4 200 nil W5 400 100 Cfu - colony forming units G1- G5 - Sediment samples W1 – W5 – Water column samples
E. coli and Enterococci colonies can not be distinguished on this medium and hence are presented as a group
20
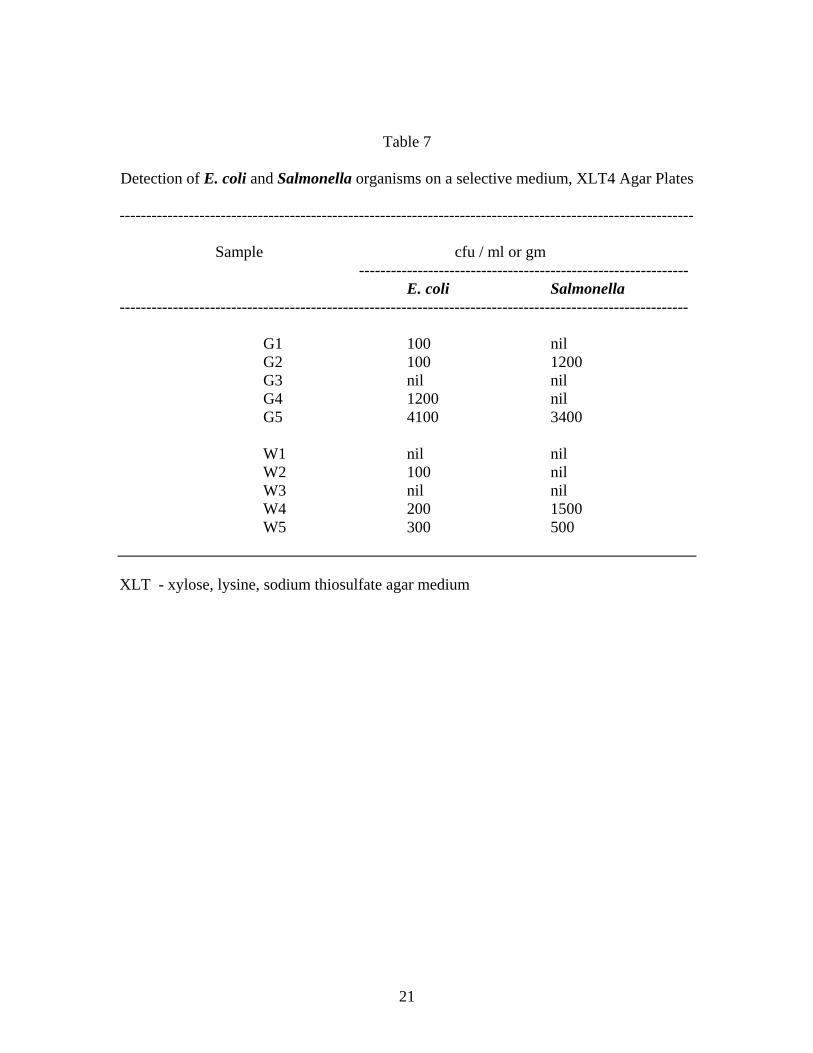
Table 7
Detection of E. coli and Salmonella organisms on a selective medium, XLT4 Agar Plates ------------------------------------------------------------------------------------------------------------ Sample cfu / ml or gm -------------------------------------------------------------- E. coli Salmonella ----------------------------------------------------------------------------------------------------------- G1 100 nil G2 100 1200 G3 nil nil G4 1200 nil G5 4100 3400 W1 nil nil W2 100 nil W3 nil nil W4 200 1500 W5 300 500 XLT - xylose, lysine, sodium thiosulfate agar medium
21
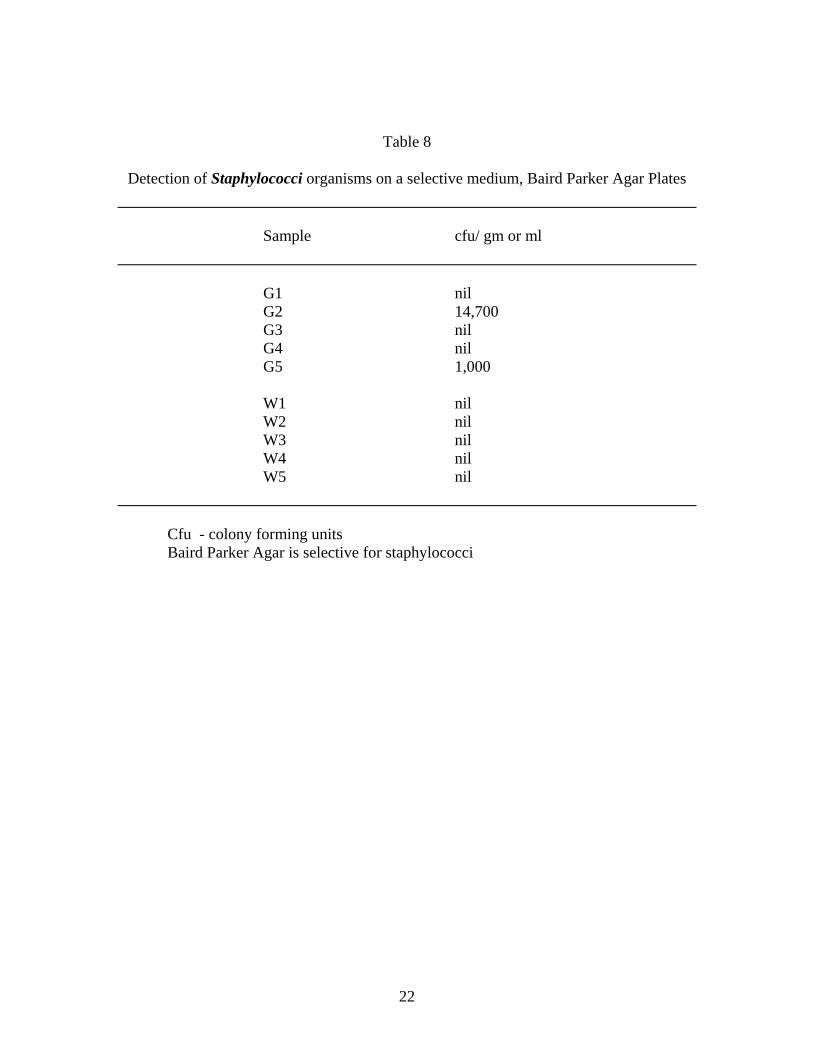
Table 8
Detection of Staphylococci organisms on a selective medium, Baird Parker Agar Plates Sample cfu/ gm or ml G1 nil G2 14,700 G3 nil G4 nil G5 1,000 W1 nil W2 nil W3 nil W4 nil W5 nil Cfu - colony forming units Baird Parker Agar is selective for staphylococci
22
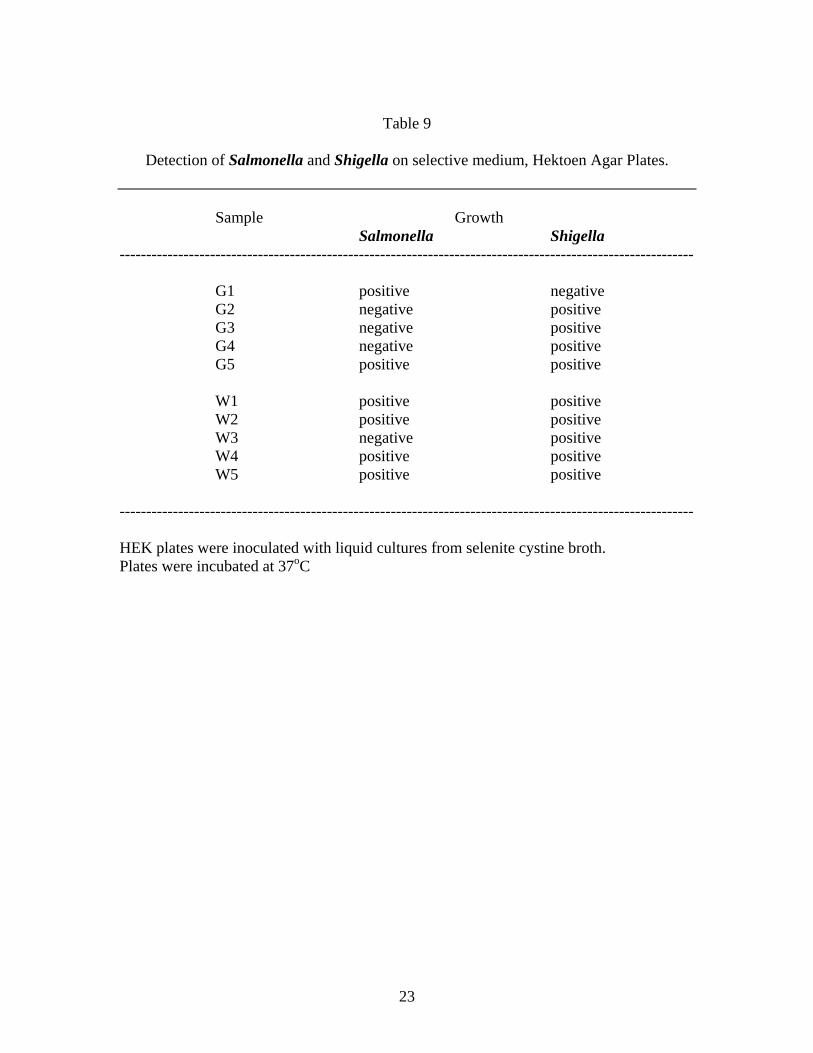
Table 9
Detection of Salmonella and Shigella on selective medium, Hektoen Agar Plates.
Sample Growth Salmonella Shigella ------------------------------------------------------------------------------------------------------------ G1 positive negative G2 negative positive G3 negative positive G4 negative positive G5 positive positive W1 positive positive W2 positive positive W3 negative positive W4 positive positive W5 positive positive ------------------------------------------------------------------------------------------------------------ HEK plates were inoculated with liquid cultures from selenite cystine broth. Plates were incubated at 37oC
23
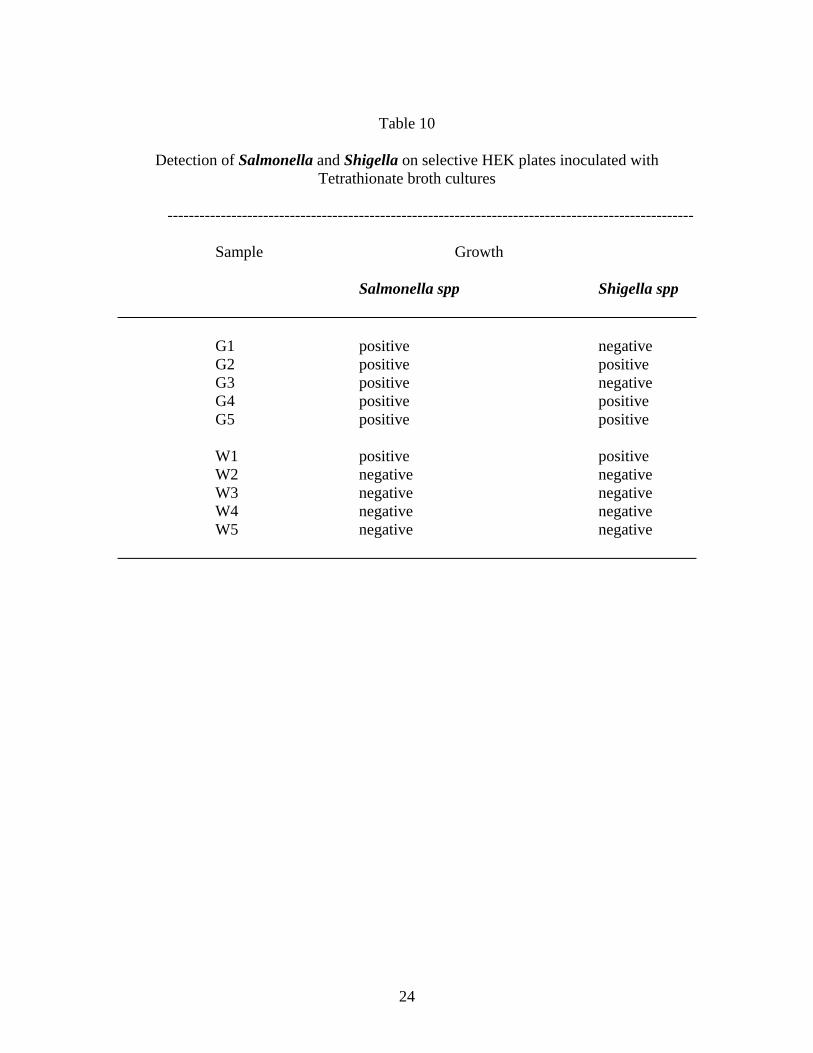
Table 10
Detection of Salmonella and Shigella on selective HEK plates inoculated with
Tetrathionate broth cultures --------------------------------------------------------------------------------------------------- Sample Growth Salmonella spp Shigella spp G1 positive negative G2 positive positive G3 positive negative G4 positive positive G5 positive positive W1 positive positive W2 negative negative W3 negative negative W4 negative negative W5 negative negative
24
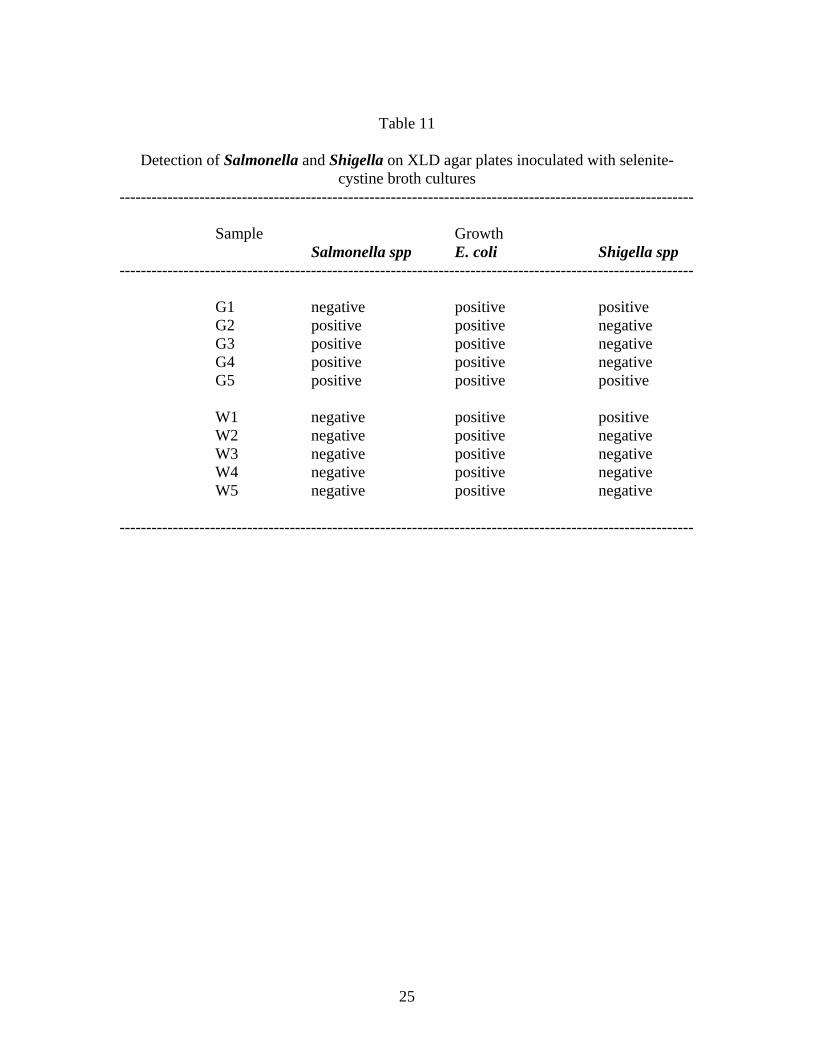
Table 11
Detection of Salmonella and Shigella on XLD agar plates inoculated with selenite-
cystine broth cultures ------------------------------------------------------------------------------------------------------------ Sample Growth Salmonella spp E. coli Shigella spp ------------------------------------------------------------------------------------------------------------ G1 negative positive positive G2 positive positive negative G3 positive positive negative G4 positive positive negative G5 positive positive positive W1 negative positive positive W2 negative positive negative W3 negative positive negative W4 negative positive negative W5 negative positive negative ------------------------------------------------------------------------------------------------------------
25
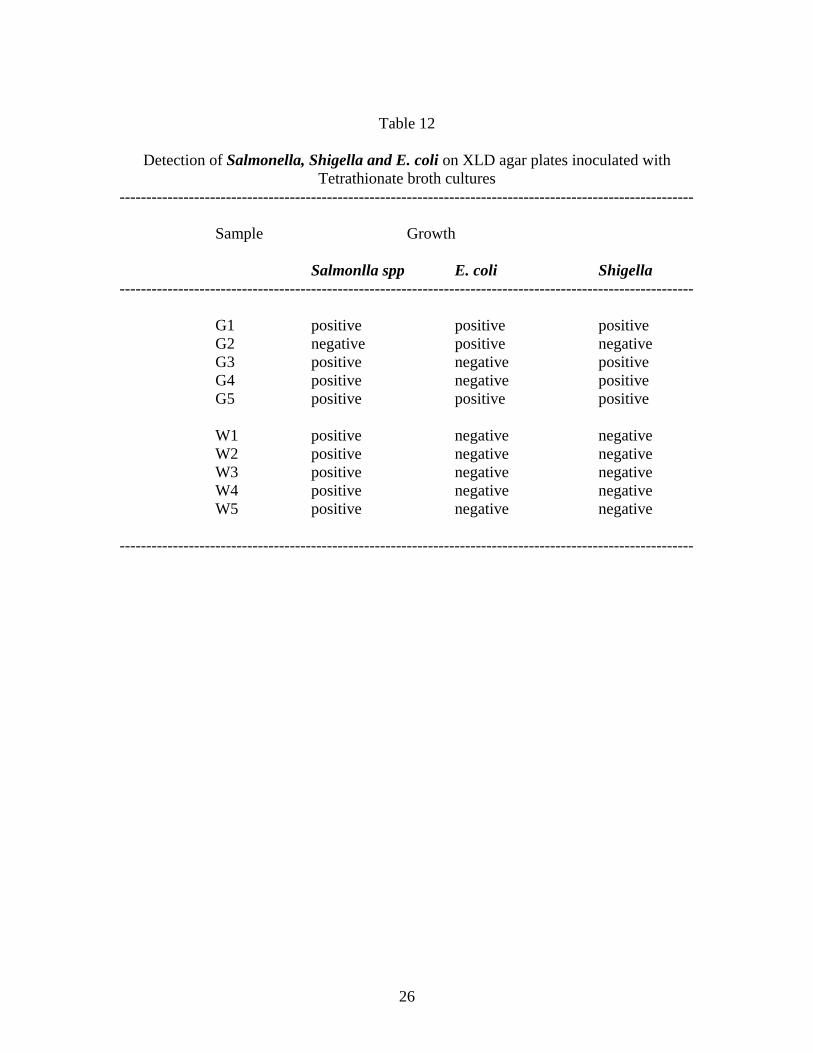
Table 12
Detection of Salmonella, Shigella and E. coli on XLD agar plates inoculated with
Tetrathionate broth cultures ------------------------------------------------------------------------------------------------------------ Sample Growth Salmonlla spp E. coli Shigella ------------------------------------------------------------------------------------------------------------ G1 positive positive positive G2 negative positive negative G3 positive negative positive G4 positive negative positive G5 positive positive positive W1 positive negative negative W2 positive negative negative W3 positive negative negative W4 positive negative negative W5 positive negative negative ------------------------------------------------------------------------------------------------------------
26
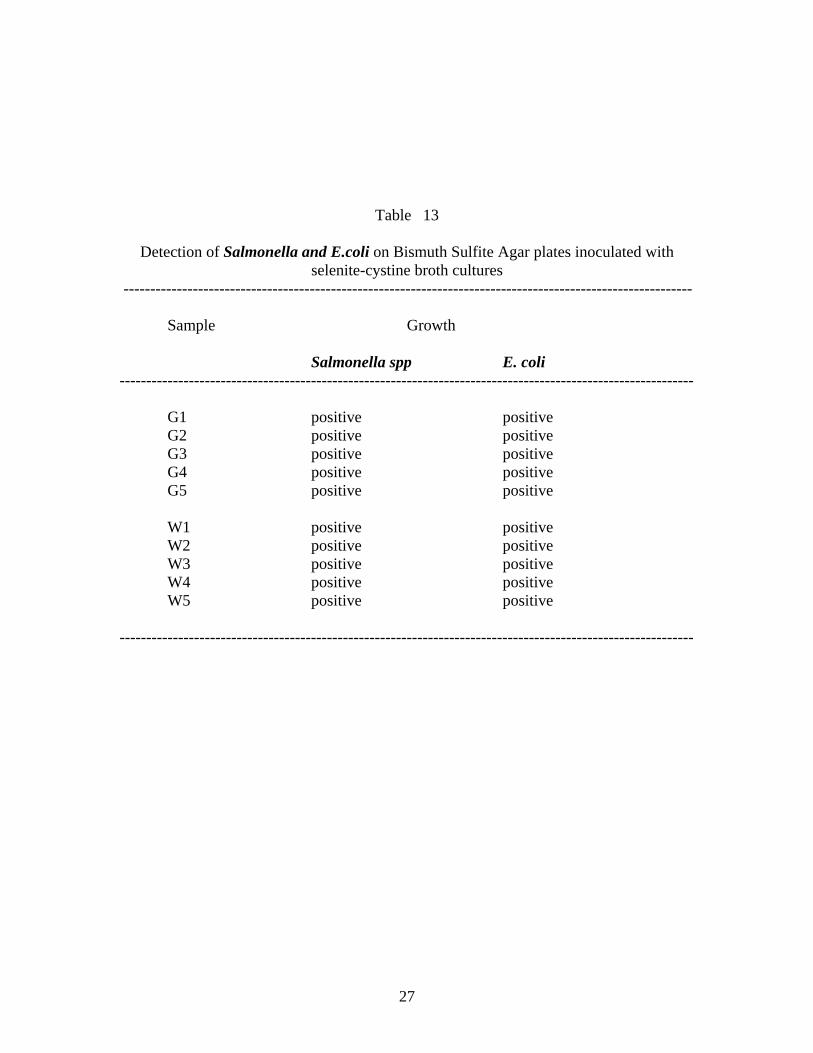
Table 13
Detection of Salmonella and E.coli on Bismuth Sulfite Agar plates inoculated with selenite-cystine broth cultures
----------------------------------------------------------------------------------------------------------- Sample Growth Salmonella spp E. coli ------------------------------------------------------------------------------------------------------------ G1 positive positive G2 positive positive G3 positive positive G4 positive positive G5 positive positive W1 positive positive W2 positive positive W3 positive positive W4 positive positive W5 positive positive ------------------------------------------------------------------------------------------------------------
27
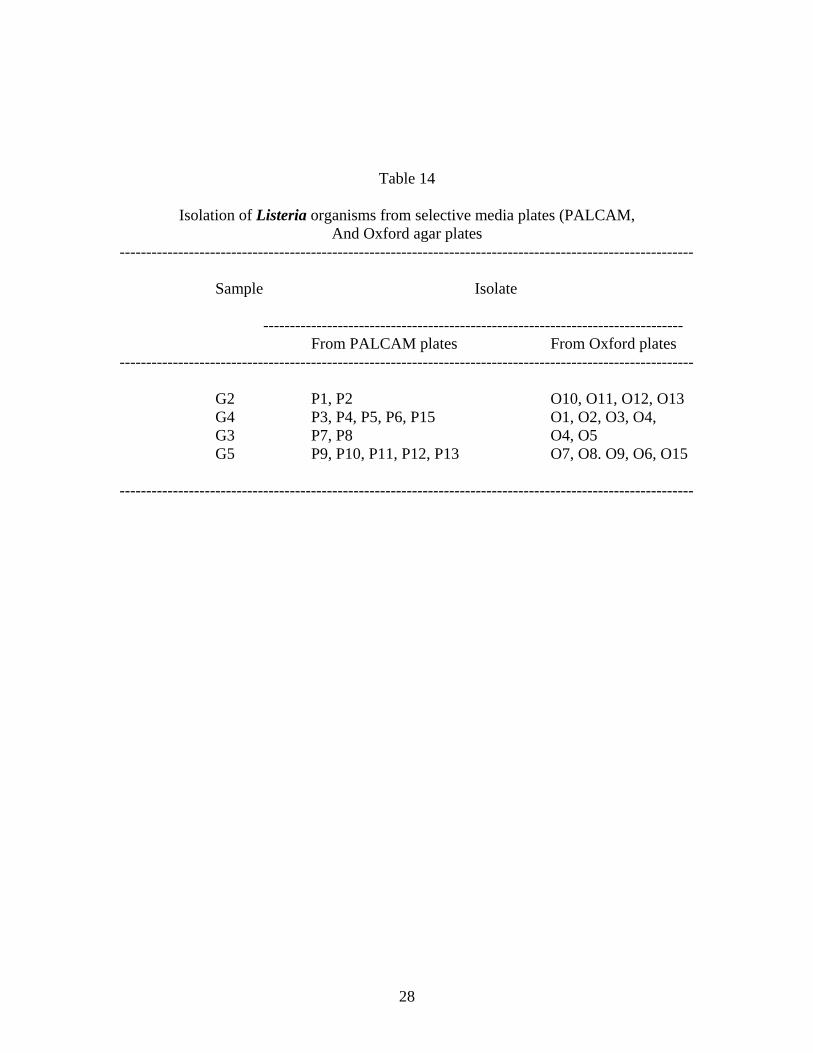
Table 14
Isolation of Listeria organisms from selective media plates (PALCAM, And Oxford agar plates
------------------------------------------------------------------------------------------------------------ Sample Isolate ------------------------------------------------------------------------------- From PALCAM plates From Oxford plates ------------------------------------------------------------------------------------------------------------ G2 P1, P2 O10, O11, O12, O13
G4 P3, P4, P5, P6, P15 O1, O2, O3, O4, G3 P7, P8 O4, O5 G5 P9, P10, P11, P12, P13 O7, O8. O9, O6, O15
------------------------------------------------------------------------------------------------------------
28
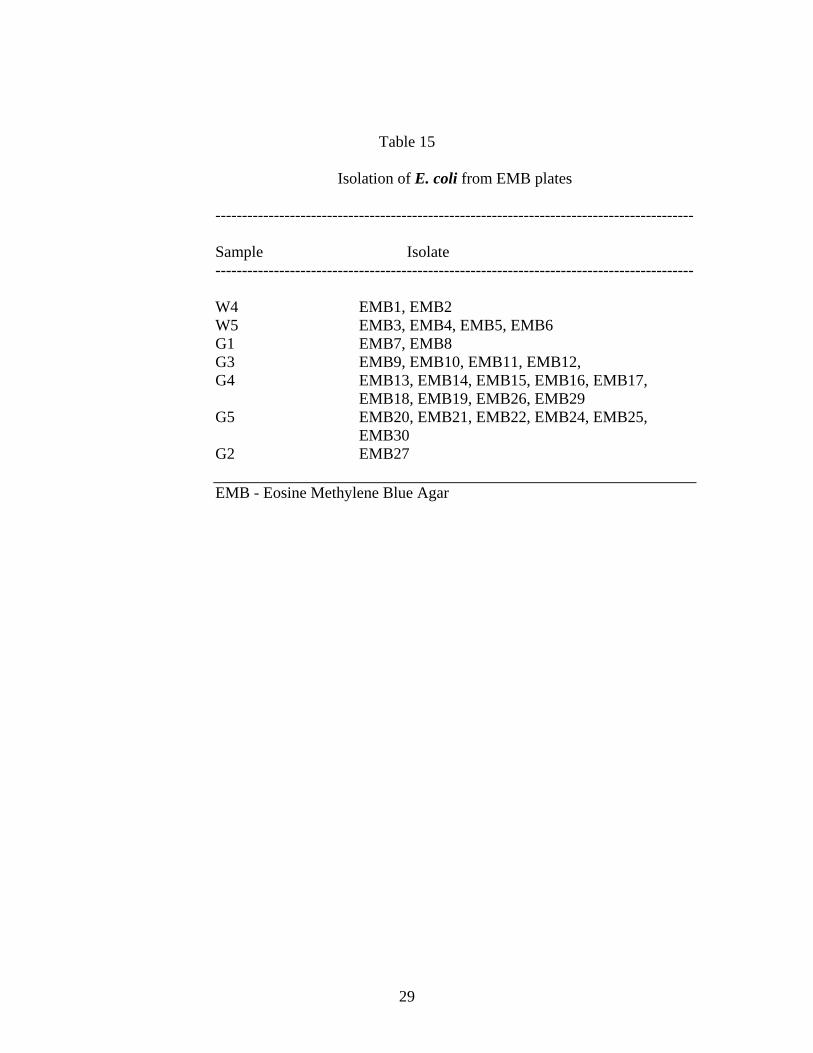
Table 15
Isolation of E. coli from EMB plates ------------------------------------------------------------------------------------------
Sample Isolate ------------------------------------------------------------------------------------------ W4 EMB1, EMB2 W5 EMB3, EMB4, EMB5, EMB6 G1 EMB7, EMB8 G3 EMB9, EMB10, EMB11, EMB12,
G4 EMB13, EMB14, EMB15, EMB16, EMB17, EMB18, EMB19, EMB26, EMB29
G5 EMB20, EMB21, EMB22, EMB24, EMB25, EMB30 G2 EMB27 EMB - Eosine Methylene Blue Agar
29
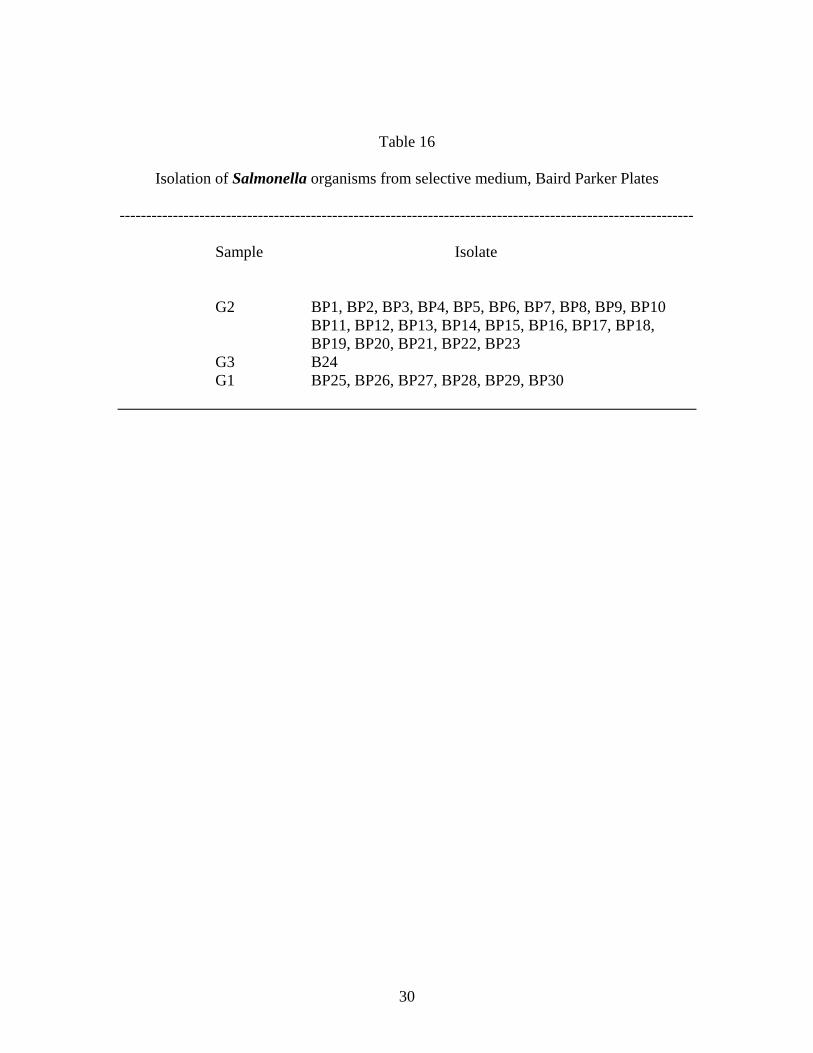
Table 16
Isolation of Salmonella organisms from selective medium, Baird Parker Plates ------------------------------------------------------------------------------------------------------------ Sample Isolate
G2 BP1, BP2, BP3, BP4, BP5, BP6, BP7, BP8, BP9, BP10 BP11, BP12, BP13, BP14, BP15, BP16, BP17, BP18, BP19, BP20, BP21, BP22, BP23
G3 B24 G1 BP25, BP26, BP27, BP28, BP29, BP30
30
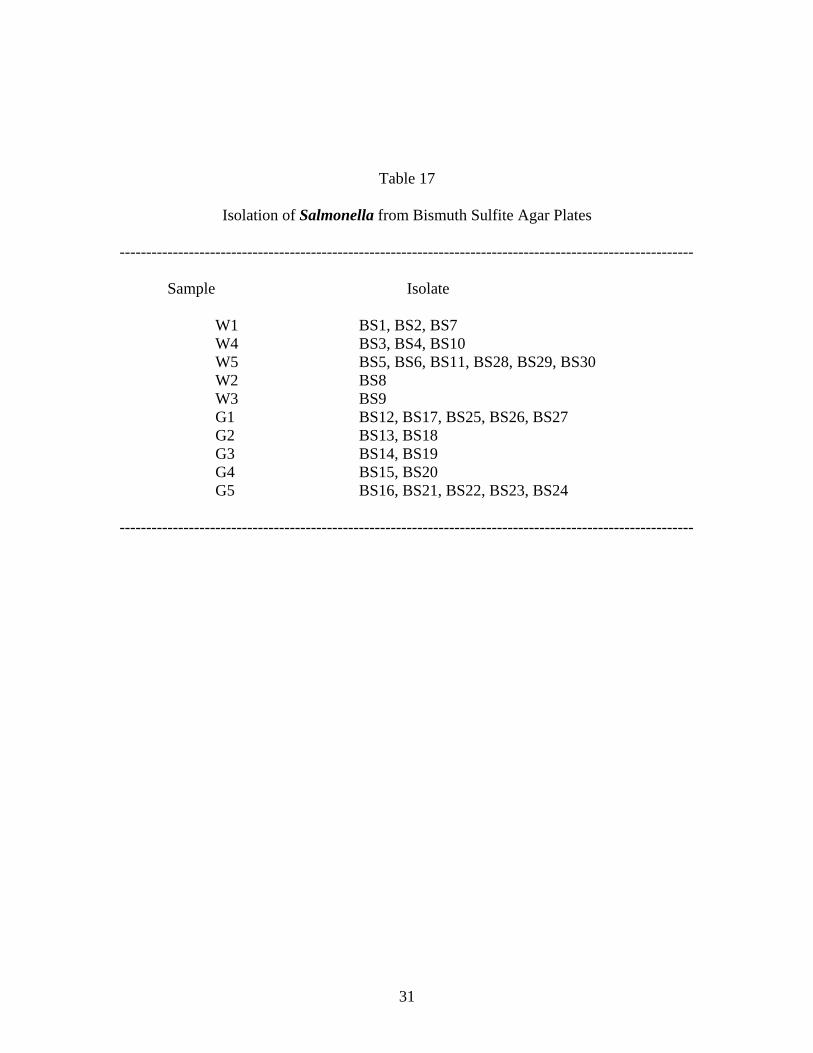
Table 17
Isolation of Salmonella from Bismuth Sulfite Agar Plates ------------------------------------------------------------------------------------------------------------ Sample Isolate W1 BS1, BS2, BS7 W4 BS3, BS4, BS10 W5 BS5, BS6, BS11, BS28, BS29, BS30 W2 BS8 W3 BS9 G1 BS12, BS17, BS25, BS26, BS27 G2 BS13, BS18 G3 BS14, BS19 G4 BS15, BS20 G5 BS16, BS21, BS22, BS23, BS24 ------------------------------------------------------------------------------------------------------------
31
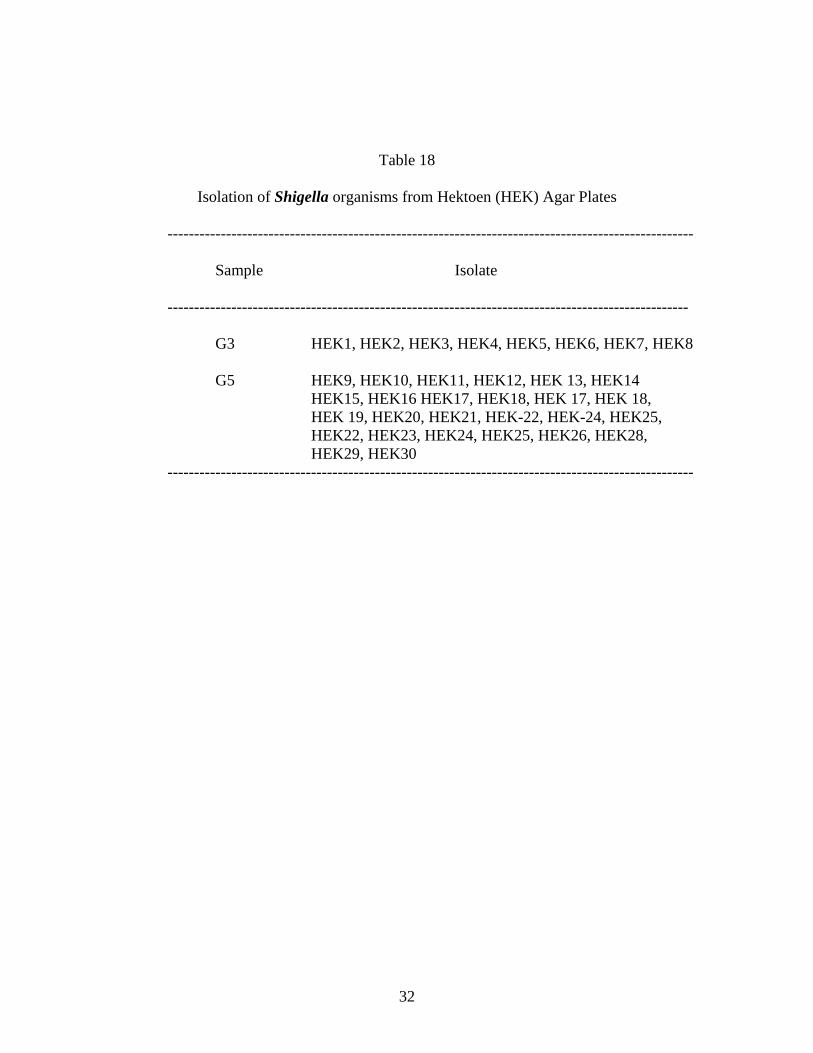
Table 18
Isolation of Shigella organisms from Hektoen (HEK) Agar Plates --------------------------------------------------------------------------------------------------- Sample Isolate --------------------------------------------------------------------------------------------------
G3 HEK1, HEK2, HEK3, HEK4, HEK5, HEK6, HEK7, HEK8 G5 HEK9, HEK10, HEK11, HEK12, HEK 13, HEK14 HEK15, HEK16 HEK17, HEK18, HEK 17, HEK 18, HEK 19, HEK20, HEK21, HEK-22, HEK-24, HEK25, HEK22, HEK23, HEK24, HEK25, HEK26, HEK28, HEK29, HEK30
---------------------------------------------------------------------------------------------------
32
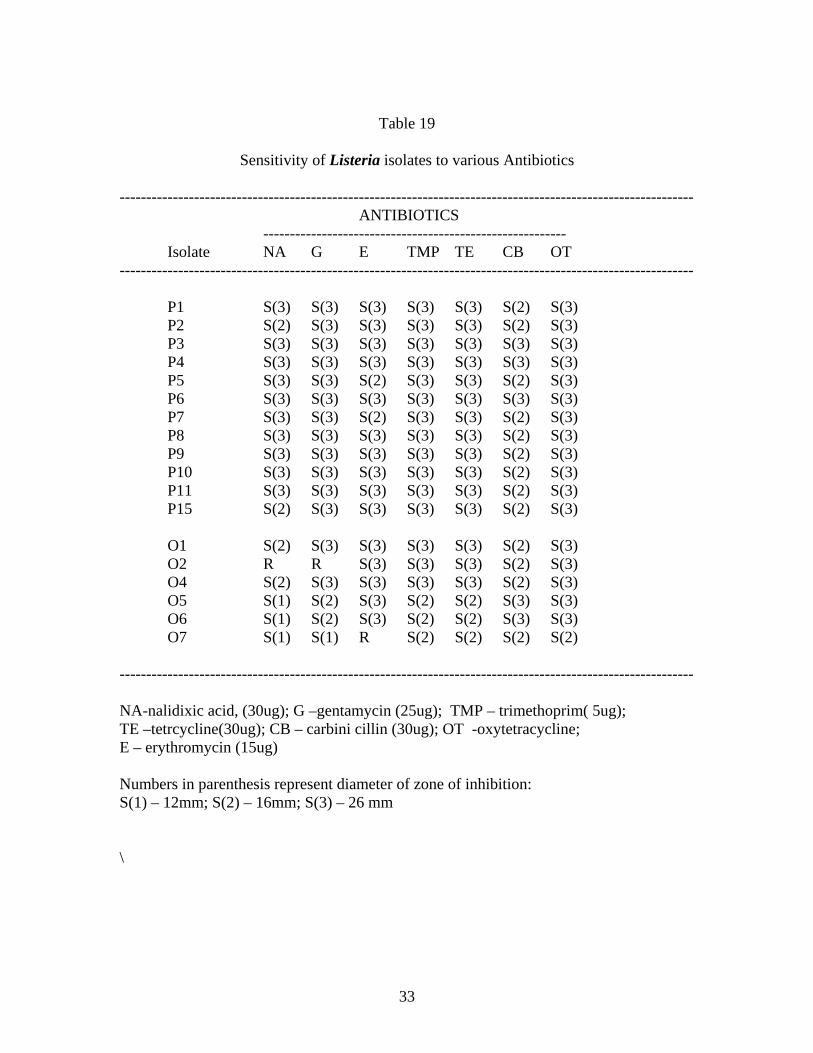
Table 19
Sensitivity of Listeria isolates to various Antibiotics
------------------------------------------------------------------------------------------------------------ ANTIBIOTICS --------------------------------------------------------- Isolate NA G E TMP TE CB OT ------------------------------------------------------------------------------------------------------------ P1 S(3) S(3) S(3) S(3) S(3) S(2) S(3) P2 S(2) S(3) S(3) S(3) S(3) S(2) S(3) P3 S(3) S(3) S(3) S(3) S(3) S(3) S(3) P4 S(3) S(3) S(3) S(3) S(3) S(3) S(3) P5 S(3) S(3) S(2) S(3) S(3) S(2) S(3) P6 S(3) S(3) S(3) S(3) S(3) S(3) S(3) P7 S(3) S(3) S(2) S(3) S(3) S(2) S(3) P8 S(3) S(3) S(3) S(3) S(3) S(2) S(3) P9 S(3) S(3) S(3) S(3) S(3) S(2) S(3) P10 S(3) S(3) S(3) S(3) S(3) S(2) S(3) P11 S(3) S(3) S(3) S(3) S(3) S(2) S(3) P15 S(2) S(3) S(3) S(3) S(3) S(2) S(3) O1 S(2) S(3) S(3) S(3) S(3) S(2) S(3) O2 R R S(3) S(3) S(3) S(2) S(3) O4 S(2) S(3) S(3) S(3) S(3) S(2) S(3) O5 S(1) S(2) S(3) S(2) S(2) S(3) S(3) O6 S(1) S(2) S(3) S(2) S(2) S(3) S(3) O7 S(1) S(1) R S(2) S(2) S(2) S(2) ------------------------------------------------------------------------------------------------------------ NA-nalidixic acid, (30ug); G –gentamycin (25ug); TMP – trimethoprim( 5ug); TE –tetrcycline(30ug); CB – carbini cillin (30ug); OT -oxytetracycline; E – erythromycin (15ug) Numbers in parenthesis represent diameter of zone of inhibition: S(1) – 12mm; S(2) – 16mm; S(3) – 26 mm \
33
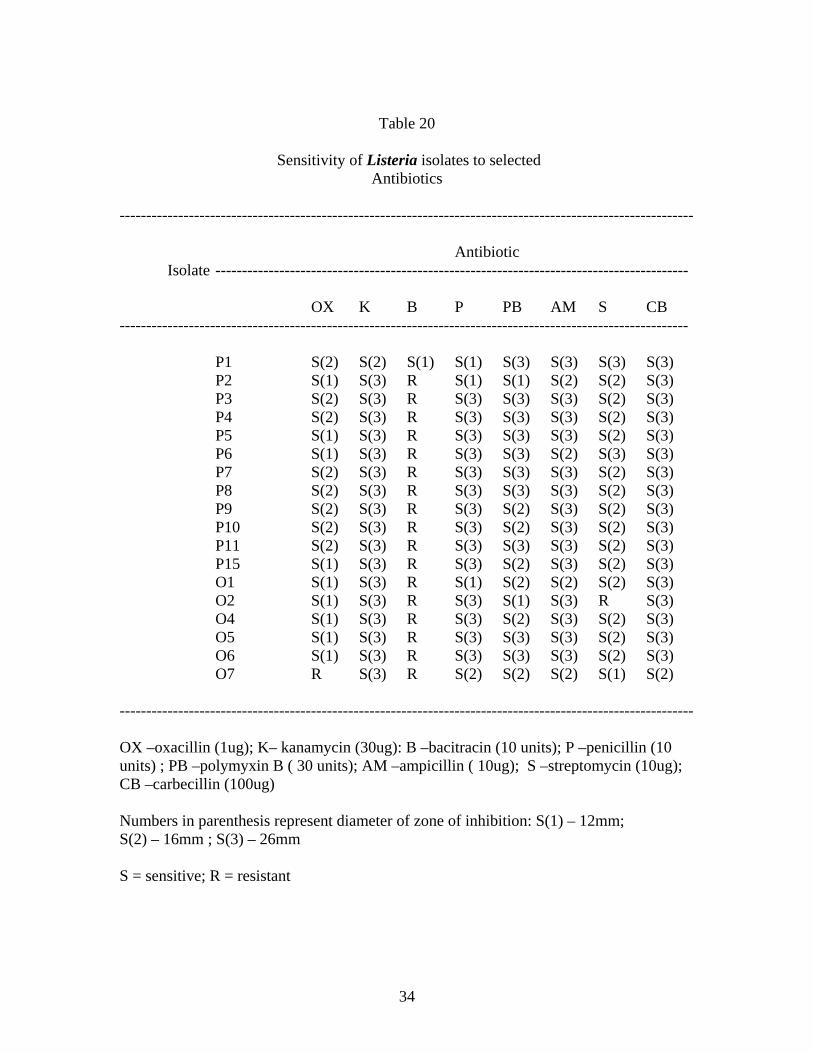
Table 20
Sensitivity of Listeria isolates to selected
Antibiotics ------------------------------------------------------------------------------------------------------------ Antibiotic Isolate ----------------------------------------------------------------------------------------- OX K B P PB AM S CB -----------------------------------------------------------------------------------------------------------
P1 S(2) S(2) S(1) S(1) S(3) S(3) S(3) S(3) P2 S(1) S(3) R S(1) S(1) S(2) S(2) S(3) P3 S(2) S(3) R S(3) S(3) S(3) S(2) S(3) P4 S(2) S(3) R S(3) S(3) S(3) S(2) S(3) P5 S(1) S(3) R S(3) S(3) S(3) S(2) S(3) P6 S(1) S(3) R S(3) S(3) S(2) S(3) S(3) P7 S(2) S(3) R S(3) S(3) S(3) S(2) S(3) P8 S(2) S(3) R S(3) S(3) S(3) S(2) S(3) P9 S(2) S(3) R S(3) S(2) S(3) S(2) S(3) P10 S(2) S(3) R S(3) S(2) S(3) S(2) S(3) P11 S(2) S(3) R S(3) S(3) S(3) S(2) S(3) P15 S(1) S(3) R S(3) S(2) S(3) S(2) S(3) O1 S(1) S(3) R S(1) S(2) S(2) S(2) S(3) O2 S(1) S(3) R S(3) S(1) S(3) R S(3) O4 S(1) S(3) R S(3) S(2) S(3) S(2) S(3) O5 S(1) S(3) R S(3) S(3) S(3) S(2) S(3) O6 S(1) S(3) R S(3) S(3) S(3) S(2) S(3) O7 R S(3) R S(2) S(2) S(2) S(1) S(2) ------------------------------------------------------------------------------------------------------------ OX –oxacillin (1ug); K– kanamycin (30ug): B –bacitracin (10 units); P –penicillin (10 units) ; PB –polymyxin B ( 30 units); AM –ampicillin ( 10ug); S –streptomycin (10ug); CB –carbecillin (100ug) Numbers in parenthesis represent diameter of zone of inhibition: S(1) – 12mm; S(2) – 16mm ; S(3) – 26mm S = sensitive; R = resistant
34
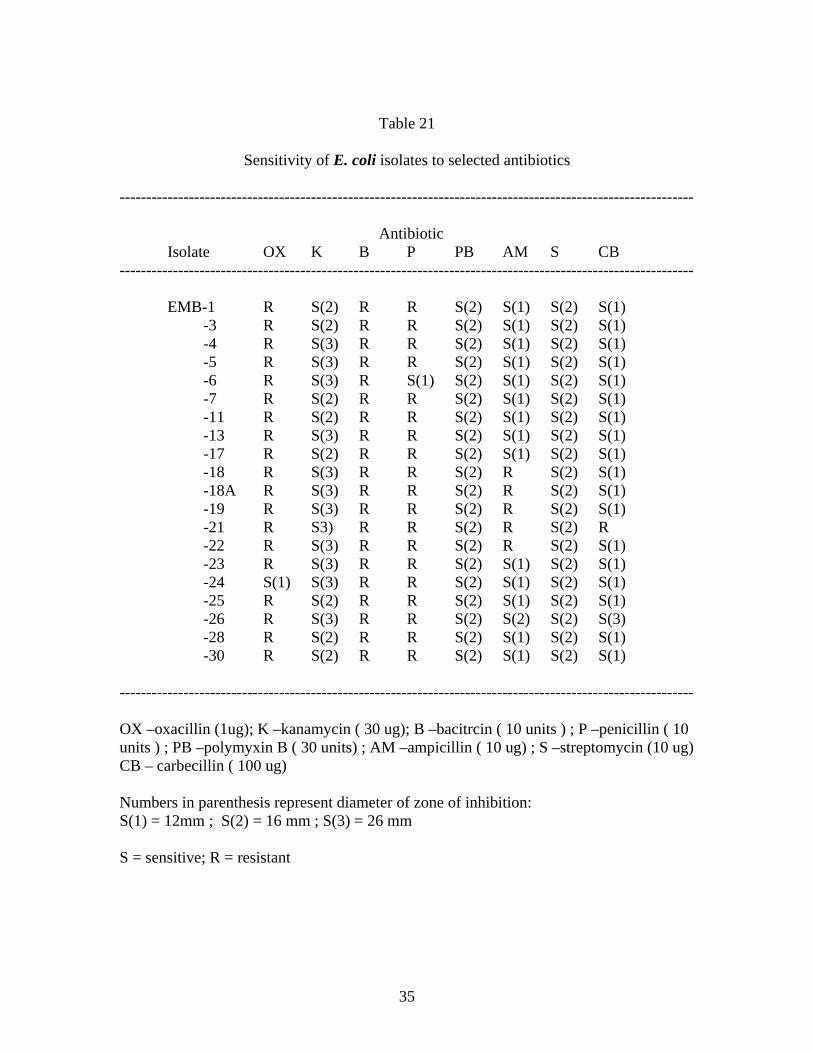
Table 21
Sensitivity of E. coli isolates to selected antibiotics
------------------------------------------------------------------------------------------------------------ Antibiotic Isolate OX K B P PB AM S CB ------------------------------------------------------------------------------------------------------------ EMB-1 R S(2) R R S(2) S(1) S(2) S(1) -3 R S(2) R R S(2) S(1) S(2) S(1) -4 R S(3) R R S(2) S(1) S(2) S(1) -5 R S(3) R R S(2) S(1) S(2) S(1) -6 R S(3) R S(1) S(2) S(1) S(2) S(1) -7 R S(2) R R S(2) S(1) S(2) S(1) -11 R S(2) R R S(2) S(1) S(2) S(1) -13 R S(3) R R S(2) S(1) S(2) S(1) -17 R S(2) R R S(2) S(1) S(2) S(1) -18 R S(3) R R S(2) R S(2) S(1) -18A R S(3) R R S(2) R S(2) S(1) -19 R S(3) R R S(2) R S(2) S(1) -21 R S3) R R S(2) R S(2) R -22 R S(3) R R S(2) R S(2) S(1) -23 R S(3) R R S(2) S(1) S(2) S(1) -24 S(1) S(3) R R S(2) S(1) S(2) S(1) -25 R S(2) R R S(2) S(1) S(2) S(1) -26 R S(3) R R S(2) S(2) S(2) S(3) -28 R S(2) R R S(2) S(1) S(2) S(1) -30 R S(2) R R S(2) S(1) S(2) S(1) ------------------------------------------------------------------------------------------------------------ OX –oxacillin (1ug); K –kanamycin ( 30 ug); B –bacitrcin ( 10 units ) ; P –penicillin ( 10 units ) ; PB –polymyxin B ( 30 units) ; AM –ampicillin ( 10 ug) ; S –streptomycin (10 ug) CB – carbecillin ( 100 ug) Numbers in parenthesis represent diameter of zone of inhibition: S(1) = 12mm ; S(2) = 16 mm ; S(3) = 26 mm S = sensitive; R = resistant
35
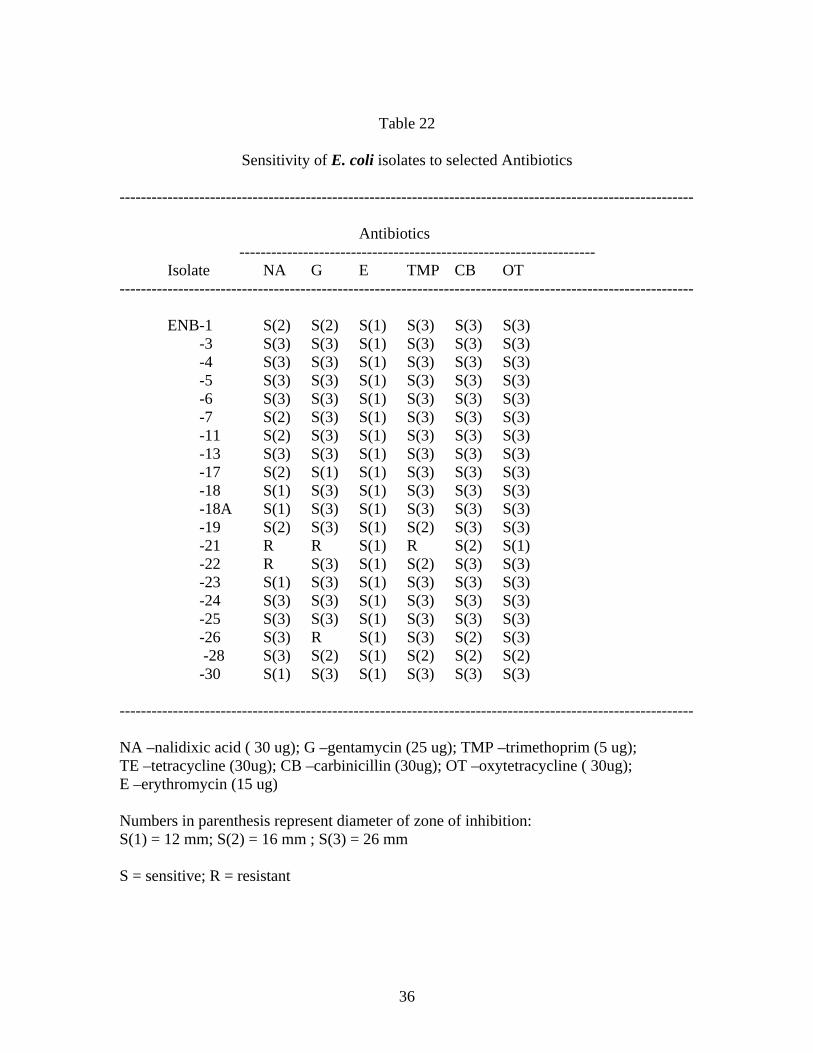
Table 22
Sensitivity of E. coli isolates to selected Antibiotics
------------------------------------------------------------------------------------------------------------ Antibiotics ------------------------------------------------------------------- Isolate NA G E TMP CB OT ------------------------------------------------------------------------------------------------------------ ENB-1 S(2) S(2) S(1) S(3) S(3) S(3) -3 S(3) S(3) S(1) S(3) S(3) S(3) -4 S(3) S(3) S(1) S(3) S(3) S(3) -5 S(3) S(3) S(1) S(3) S(3) S(3) -6 S(3) S(3) S(1) S(3) S(3) S(3) -7 S(2) S(3) S(1) S(3) S(3) S(3) -11 S(2) S(3) S(1) S(3) S(3) S(3) -13 S(3) S(3) S(1) S(3) S(3) S(3) -17 S(2) S(1) S(1) S(3) S(3) S(3) -18 S(1) S(3) S(1) S(3) S(3) S(3) -18A S(1) S(3) S(1) S(3) S(3) S(3) -19 S(2) S(3) S(1) S(2) S(3) S(3) -21 R R S(1) R S(2) S(1) -22 R S(3) S(1) S(2) S(3) S(3) -23 S(1) S(3) S(1) S(3) S(3) S(3) -24 S(3) S(3) S(1) S(3) S(3) S(3) -25 S(3) S(3) S(1) S(3) S(3) S(3) -26 S(3) R S(1) S(3) S(2) S(3) -28 S(3) S(2) S(1) S(2) S(2) S(2) -30 S(1) S(3) S(1) S(3) S(3) S(3) ------------------------------------------------------------------------------------------------------------ NA –nalidixic acid ( 30 ug); G –gentamycin (25 ug); TMP –trimethoprim (5 ug); TE –tetracycline (30ug); CB –carbinicillin (30ug); OT –oxytetracycline ( 30ug); E –erythromycin (15 ug) Numbers in parenthesis represent diameter of zone of inhibition: S(1) = 12 mm; S(2) = 16 mm ; S(3) = 26 mm S = sensitive; R = resistant
36
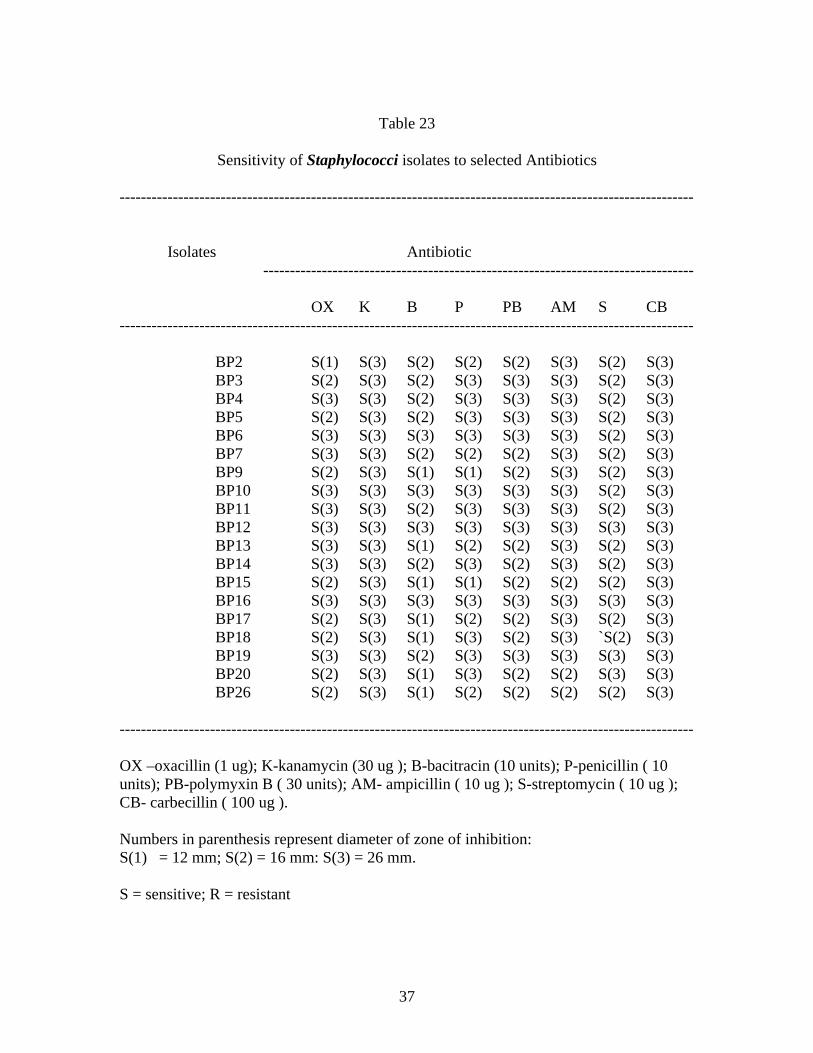
Table 23
Sensitivity of Staphylococci isolates to selected Antibiotics
------------------------------------------------------------------------------------------------------------ Isolates Antibiotic --------------------------------------------------------------------------------- OX K B P PB AM S CB ------------------------------------------------------------------------------------------------------------ BP2 S(1) S(3) S(2) S(2) S(2) S(3) S(2) S(3) BP3 S(2) S(3) S(2) S(3) S(3) S(3) S(2) S(3) BP4 S(3) S(3) S(2) S(3) S(3) S(3) S(2) S(3) BP5 S(2) S(3) S(2) S(3) S(3) S(3) S(2) S(3) BP6 S(3) S(3) S(3) S(3) S(3) S(3) S(2) S(3) BP7 S(3) S(3) S(2) S(2) S(2) S(3) S(2) S(3) BP9 S(2) S(3) S(1) S(1) S(2) S(3) S(2) S(3) BP10 S(3) S(3) S(3) S(3) S(3) S(3) S(2) S(3) BP11 S(3) S(3) S(2) S(3) S(3) S(3) S(2) S(3) BP12 S(3) S(3) S(3) S(3) S(3) S(3) S(3) S(3) BP13 S(3) S(3) S(1) S(2) S(2) S(3) S(2) S(3) BP14 S(3) S(3) S(2) S(3) S(2) S(3) S(2) S(3) BP15 S(2) S(3) S(1) S(1) S(2) S(2) S(2) S(3) BP16 S(3) S(3) S(3) S(3) S(3) S(3) S(3) S(3) BP17 S(2) S(3) S(1) S(2) S(2) S(3) S(2) S(3) BP18 S(2) S(3) S(1) S(3) S(2) S(3) `S(2) S(3) BP19 S(3) S(3) S(2) S(3) S(3) S(3) S(3) S(3) BP20 S(2) S(3) S(1) S(3) S(2) S(2) S(3) S(3) BP26 S(2) S(3) S(1) S(2) S(2) S(2) S(2) S(3) ------------------------------------------------------------------------------------------------------------ OX –oxacillin (1 ug); K-kanamycin (30 ug ); B-bacitracin (10 units); P-penicillin ( 10 units); PB-polymyxin B ( 30 units); AM- ampicillin ( 10 ug ); S-streptomycin ( 10 ug ); CB- carbecillin ( 100 ug ). Numbers in parenthesis represent diameter of zone of inhibition: S(1) = 12 mm; S(2) = 16 mm: S(3) = 26 mm. S = sensitive; R = resistant
37
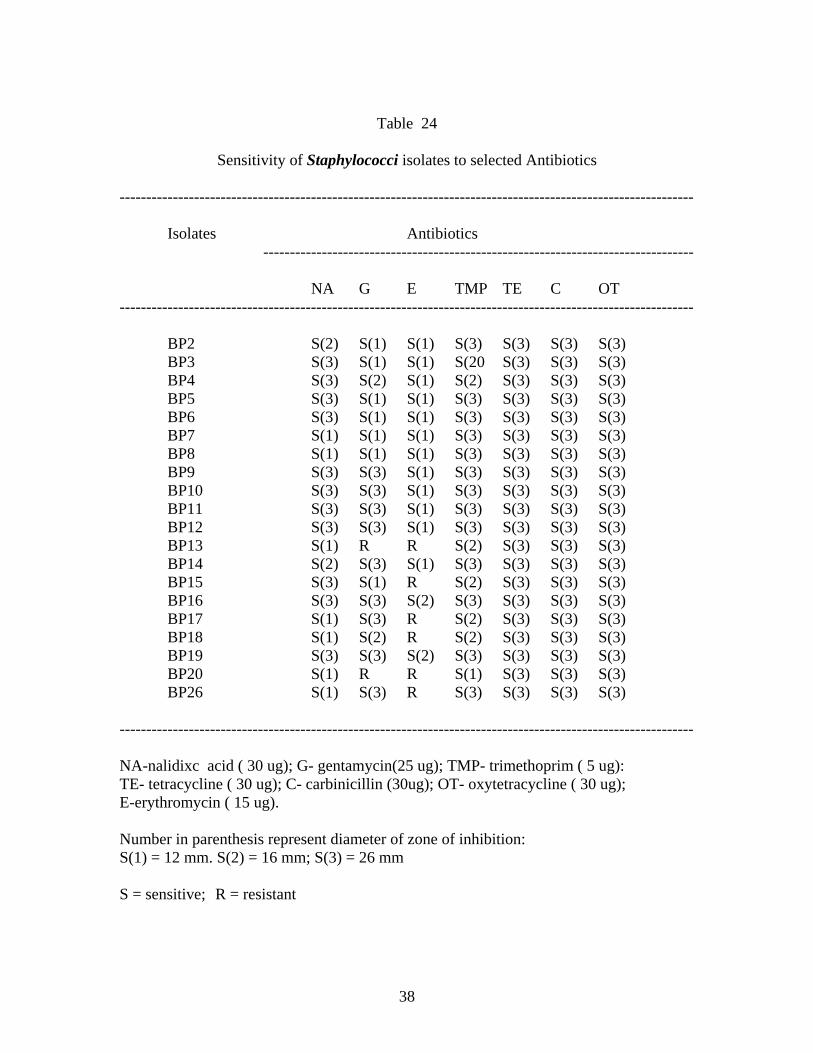
Table 24
Sensitivity of Staphylococci isolates to selected Antibiotics
------------------------------------------------------------------------------------------------------------ Isolates Antibiotics --------------------------------------------------------------------------------- NA G E TMP TE C OT ------------------------------------------------------------------------------------------------------------ BP2 S(2) S(1) S(1) S(3) S(3) S(3) S(3) BP3 S(3) S(1) S(1) S(20 S(3) S(3) S(3) BP4 S(3) S(2) S(1) S(2) S(3) S(3) S(3) BP5 S(3) S(1) S(1) S(3) S(3) S(3) S(3) BP6 S(3) S(1) S(1) S(3) S(3) S(3) S(3) BP7 S(1) S(1) S(1) S(3) S(3) S(3) S(3) BP8 S(1) S(1) S(1) S(3) S(3) S(3) S(3) BP9 S(3) S(3) S(1) S(3) S(3) S(3) S(3) BP10 S(3) S(3) S(1) S(3) S(3) S(3) S(3) BP11 S(3) S(3) S(1) S(3) S(3) S(3) S(3) BP12 S(3) S(3) S(1) S(3) S(3) S(3) S(3) BP13 S(1) R R S(2) S(3) S(3) S(3) BP14 S(2) S(3) S(1) S(3) S(3) S(3) S(3) BP15 S(3) S(1) R S(2) S(3) S(3) S(3) BP16 S(3) S(3) S(2) S(3) S(3) S(3) S(3) BP17 S(1) S(3) R S(2) S(3) S(3) S(3) BP18 S(1) S(2) R S(2) S(3) S(3) S(3) BP19 S(3) S(3) S(2) S(3) S(3) S(3) S(3) BP20 S(1) R R S(1) S(3) S(3) S(3) BP26 S(1) S(3) R S(3) S(3) S(3) S(3) ------------------------------------------------------------------------------------------------------------ NA-nalidixc acid ( 30 ug); G- gentamycin(25 ug); TMP- trimethoprim ( 5 ug): TE- tetracycline ( 30 ug); C- carbinicillin (30ug); OT- oxytetracycline ( 30 ug); E-erythromycin ( 15 ug). Number in parenthesis represent diameter of zone of inhibition: S(1) = 12 mm. S(2) = 16 mm; S(3) = 26 mm S = sensitive; R = resistant
38
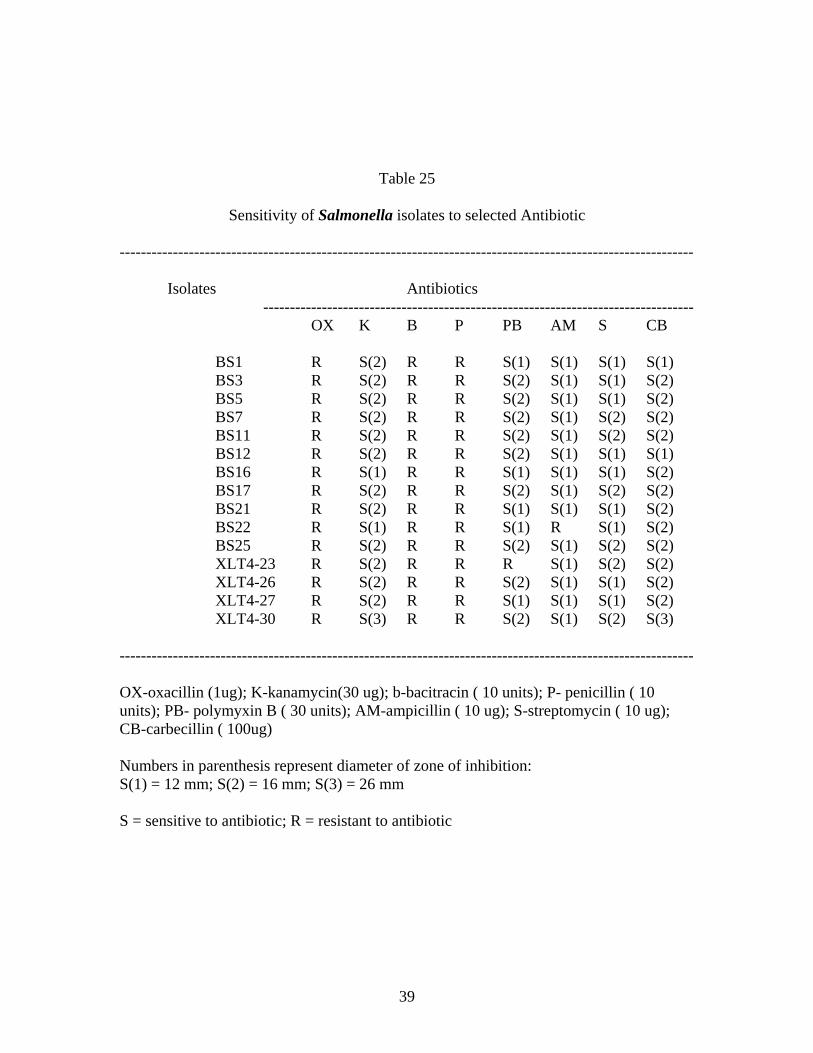
Table 25
Sensitivity of Salmonella isolates to selected Antibiotic ------------------------------------------------------------------------------------------------------------ Isolates Antibiotics --------------------------------------------------------------------------------- OX K B P PB AM S CB BS1 R S(2) R R S(1) S(1) S(1) S(1) BS3 R S(2) R R S(2) S(1) S(1) S(2) BS5 R S(2) R R S(2) S(1) S(1) S(2) BS7 R S(2) R R S(2) S(1) S(2) S(2) BS11 R S(2) R R S(2) S(1) S(2) S(2) BS12 R S(2) R R S(2) S(1) S(1) S(1) BS16 R S(1) R R S(1) S(1) S(1) S(2) BS17 R S(2) R R S(2) S(1) S(2) S(2) BS21 R S(2) R R S(1) S(1) S(1) S(2) BS22 R S(1) R R S(1) R S(1) S(2) BS25 R S(2) R R S(2) S(1) S(2) S(2) XLT4-23 R S(2) R R R S(1) S(2) S(2) XLT4-26 R S(2) R R S(2) S(1) S(1) S(2) XLT4-27 R S(2) R R S(1) S(1) S(1) S(2) XLT4-30 R S(3) R R S(2) S(1) S(2) S(3) ------------------------------------------------------------------------------------------------------------ OX-oxacillin (1ug); K-kanamycin(30 ug); b-bacitracin ( 10 units); P- penicillin ( 10 units); PB- polymyxin B ( 30 units); AM-ampicillin ( 10 ug); S-streptomycin ( 10 ug); CB-carbecillin ( 100ug) Numbers in parenthesis represent diameter of zone of inhibition: S(1) = 12 mm; S(2) = 16 mm; S(3) = 26 mm S = sensitive to antibiotic; R = resistant to antibiotic
39
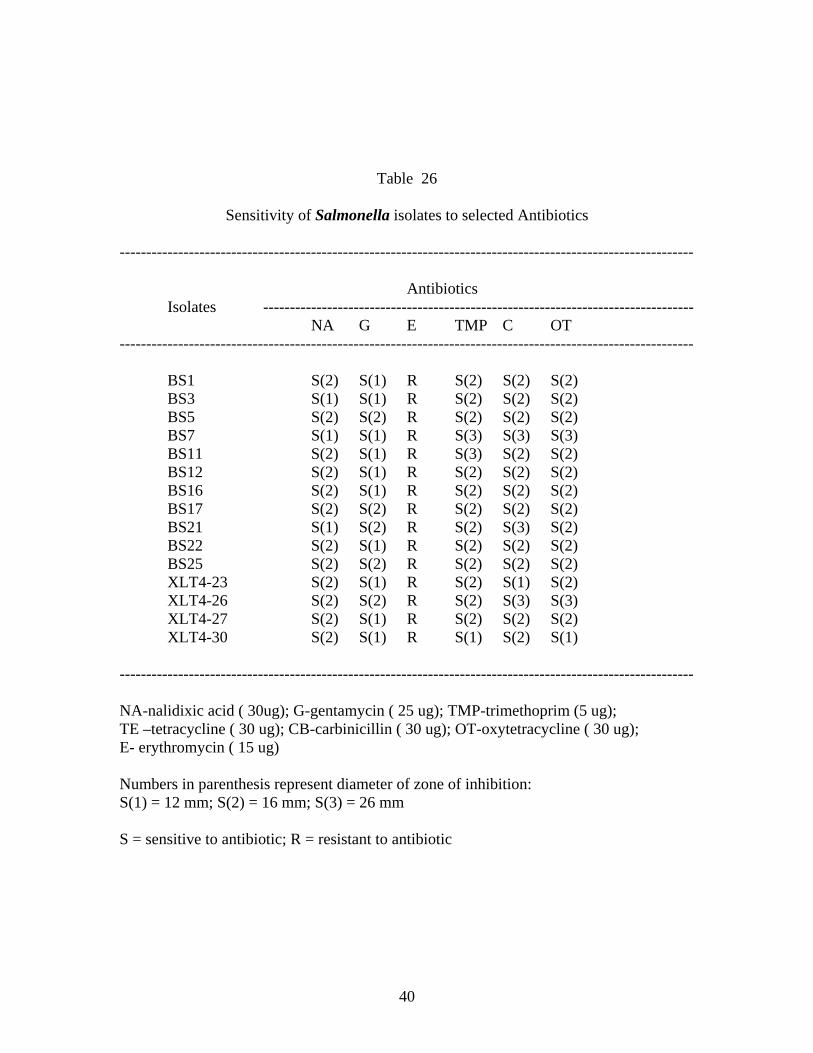
Table 26
Sensitivity of Salmonella isolates to selected Antibiotics ------------------------------------------------------------------------------------------------------------ Antibiotics Isolates --------------------------------------------------------------------------------- NA G E TMP C OT ------------------------------------------------------------------------------------------------------------ BS1 S(2) S(1) R S(2) S(2) S(2) BS3 S(1) S(1) R S(2) S(2) S(2) BS5 S(2) S(2) R S(2) S(2) S(2) BS7 S(1) S(1) R S(3) S(3) S(3) BS11 S(2) S(1) R S(3) S(2) S(2) BS12 S(2) S(1) R S(2) S(2) S(2) BS16 S(2) S(1) R S(2) S(2) S(2) BS17 S(2) S(2) R S(2) S(2) S(2) BS21 S(1) S(2) R S(2) S(3) S(2) BS22 S(2) S(1) R S(2) S(2) S(2) BS25 S(2) S(2) R S(2) S(2) S(2) XLT4-23 S(2) S(1) R S(2) S(1) S(2) XLT4-26 S(2) S(2) R S(2) S(3) S(3) XLT4-27 S(2) S(1) R S(2) S(2) S(2) XLT4-30 S(2) S(1) R S(1) S(2) S(1) ------------------------------------------------------------------------------------------------------------ NA-nalidixic acid ( 30ug); G-gentamycin ( 25 ug); TMP-trimethoprim (5 ug); TE –tetracycline ( 30 ug); CB-carbinicillin ( 30 ug); OT-oxytetracycline ( 30 ug); E- erythromycin ( 15 ug) Numbers in parenthesis represent diameter of zone of inhibition: S(1) = 12 mm; S(2) = 16 mm; S(3) = 26 mm S = sensitive to antibiotic; R = resistant to antibiotic
40
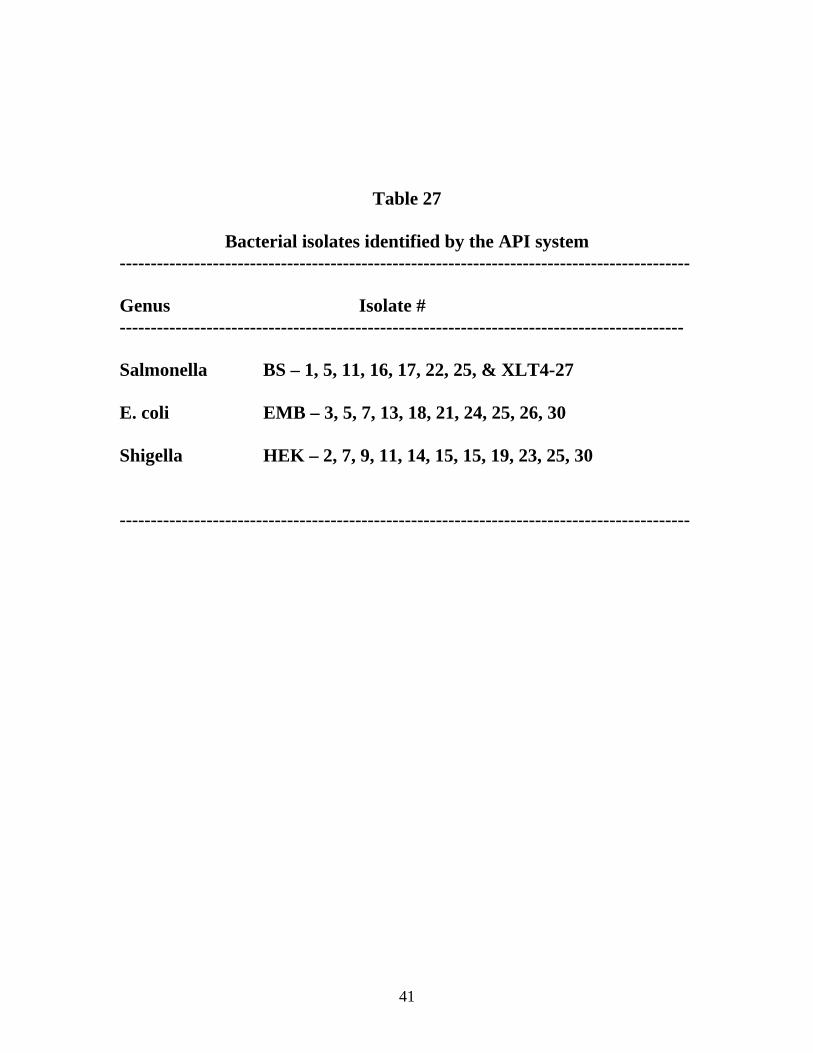
Table 27
Bacterial isolates identified by the API system --------------------------------------------------------------------------------------------
Genus Isolate # ------------------------------------------------------------------------------------------- Salmonella BS – 1, 5, 11, 16, 17, 22, 25, & XLT4-27 E. coli EMB – 3, 5, 7, 13, 18, 21, 24, 25, 26, 30 Shigella HEK – 2, 7, 9, 11, 14, 15, 15, 19, 23, 25, 30 --------------------------------------------------------------------------------------------
41
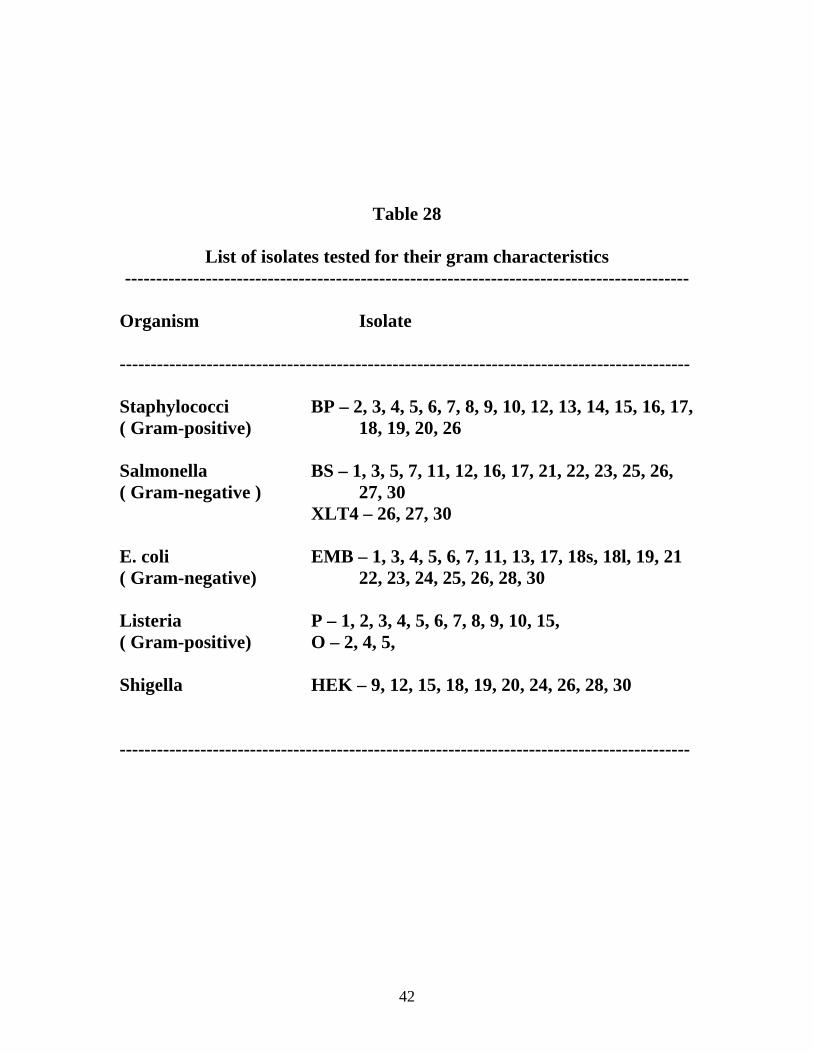
Table 28
List of isolates tested for their gram characteristics -------------------------------------------------------------------------------------------
Organism Isolate --------------------------------------------------------------------------------------------
Staphylococci BP – 2, 3, 4, 5, 6, 7, 8, 9, 10, 12, 13, 14, 15, 16, 17, ( Gram-positive) 18, 19, 20, 26
Salmonella BS – 1, 3, 5, 7, 11, 12, 16, 17, 21, 22, 23, 25, 26, ( Gram-negative ) 27, 30 XLT4 – 26, 27, 30 E. coli EMB – 1, 3, 4, 5, 6, 7, 11, 13, 17, 18s, 18l, 19, 21 ( Gram-negative) 22, 23, 24, 25, 26, 28, 30 Listeria P – 1, 2, 3, 4, 5, 6, 7, 8, 9, 10, 15, ( Gram-positive) O – 2, 4, 5, Shigella HEK – 9, 12, 15, 18, 19, 20, 24, 26, 28, 30 --------------------------------------------------------------------------------------------
42
References 1. American Public Health Association. (1970). Recommended Procedures for the Examination of seawater and shellfish. 4th Edition. APHA. Washington, D.C. 2. American Public Health Association. (1985). Laboratory Procedures for the Examination of Seawater and Shellfish. 5th Edition. APHA. Washington, D.C. 3. Association of Official Analytical Chemists (1990). Official Methods of Analysis. 15th Edition. AOAC. Arlington, VA. 4. Hutchins, A.D., P. Feng, W. D. Watkins, S. C. Repley and L.A. Chandler (1992) Esherichia coli and Coliform Bacteria. FDA Bacteriological Analytical Manual. 7th Edition. AOAC International. Arlington, VA. 5. Andrews, W. H., V.R. Bruce, G. June, F. Satchwell, and P. Sherrod (1992). Salmonella. FDA Bacteriological Analytical Manual. AOAC International. Arlington, VA. 6. Canadian Health Protection Branch (1985). Determination of Staphylococcus aureus in foods. MFHPB-21. Compendium of Analytical Methods. Vol 2. 7. Hutchins, A.D. (1992). Listeria monocytogenes. FDA Bacteriological Analytical Manual. 7th Edition. AOAC International. Arlington, VA.
43