Embed Size (px)
Citation preview
ENVIRONMENTAL MICROBIOLOGY
Microbial Functional Diversity Associated with Plant LitterDecomposition Along a Climatic Gradient
Chen Sherman & Yosef Steinberger
Received: 22 November 2011 /Accepted: 28 February 2012 /Published online: 21 March 2012# Springer Science+Business Media, LLC 2012
Abstract Predicted changes in climate associated with in-creased greenhouse gas emissions can cause increases in globalmean temperature and changes in precipitation regimes. Thesechanges may affect key soil processes, e.g., microbial CO2
evolution and biomass, mineralization rates, primary produc-tivity, biodiversity, and litter decomposition, which play animportant role in carbon and nutrient cycling in terrestrialecosystems. Our study examined the changes in litter microbialcommunities and decomposition along a climatic gradient,ranging from arid desert to humid Mediterranean regions inIsrael. Wheat straw litter bags were placed in arid, semi-arid,Mediterranean, and humid Mediterranean sites. Samples werecollected seasonally over a 2-year period in order to evaluatemass loss, litter moisture, C/N ratio, bacterial colony-formingunits (CFUs), microbial CO2 evolution and biomass, microbialfunctional diversity, and catabolic profile. Decomposition ratewas the highest during the first year of the study at the Medi-terranean and arid sites. Community-level physiological profileand microbial biomass were the highest in summer, whilebacterial CFUs were the highest in winter. Microbial functionaldiversity was found to be highest at the humid Mediterraneansite, whereas substrate utilization increased at the arid site. Ourresults support the assumption that climatic factors control litterdegradation and regulate microbial activity.
Introduction
Predicted changes in global climate associated with increasedgreenhouse gas emissions are expected to be one of the main
factors affecting temperature and hydrological cycles, result-ing in more severe droughts and floods [32]. Based on theabove assumption, the climate models of Ben-Gai et al. [7] forthe Middle East predict an increase in winter temperaturescombined with changes in rainfall amount and distribution.These changes may affect key soil processes, such as CO2
evolution and net nitrogen (N) mineralization, thus affectingkey ecosystem functions, such as carbon (C) storage, nutrientavailability [21], and soil biodiversity as well as ecosystemprocesses such as primary production and plant litter decom-position [12, 49].
Plant litter decomposition is known to be one of the mostimportant nutrient sources in terrestrial and aquatic ecosys-tems. It is also known that its turnover rate is determined by itsquality, biotic community, and abiotic factors (e.g., tempera-ture, rainfall, moisture availability) [1, 33, 43–45, 59, 62]. Theinteraction between the biotic and abiotic factors, along withlitter decomposition processes on a temporal and spatial basis,was the subject of many studies conducted in different eco-systems [4, 66, 67].
Salamanca et al. [48] found that mass loss of Quercusserrata, Quercus acutissima, Acer rufinerve, and Pinus densi-flora leaf litter, which were protected from rainfall, were lowerin comparison to the mass loss of forest floor litter, which wasfully exposed to rainfall. According to Swift et al. [60], theleaching effect of rainfall enhances mass loss at the initialstage of the decaying process. Moreover, leaching efficiencywas found to be affected by the intensity and amount ofrainwater, as shown by Tukey’s [65] study. The impact ofrainfall explains the enhancement of mass loss in fully andpartially exposed litter, as reported by Salamanca et al. [48].Although litter decomposition is positively correlated withannual precipitation in many regions [8, 57], Steinbergeret al. [55] found no correlation between mass loss and thenumber of rainfall events and/or total rainfall in the Judean
C. Sherman :Y. Steinberger (*)The Mina & Everard Goodman Faculty of Life Sciences,Bar-Ilan University,Ramat-Gan 52900, Israele-mail: [email protected]
Microb Ecol (2012) 64:399–415DOI 10.1007/s00248-012-0037-7
Desert. The results of Schaefer et al. [50] and Steinberger et al.[55] suggested that mass loss is primarily the result of abioticforces, such as temperature and radiation. Austin and Vivanco[5] evaluated the influence of solar radiation, soil biotic activ-ity, and soil resource availability on litter decomposition in thesemi-arid (SA) Patagonian Steppe. According to their findings,solar radiation was the only factor that had a significant effecton organic matter decomposition.
It is widely acknowledged that microorganisms play amajor role in the decomposition process, in addition to therole of abiotic forces. The microbial biomass (MB) in the littersoil system serves as a source and a sink of available plantnutrients and regulates plant litter decomposition [6]. More-over, the microbial biomass provides amore sensitive measureof change in organic matter status than total organic mattercontent and can detect changes within 1–5 years, rather thanafter decades [3]. While it is broadly recognized that bacteriaand fungi are involved in organic matter turnover [60] bychanging the chemical composition of litter (e.g., decomposi-tion), the role of microbial community structure in determin-ing ecosystem process rates is not well characterized [46].
In order to evaluate the microbial community structure andprocesses during litter weight loss, the Biolog and Micro-Resp™ techniques have been developed and used [11, 68].The MicroResp™ technique allows rapid assessment of cata-bolic profiles of whole soil samples using a colorimetricrespiration detection system (cresol red) and an automatedplate reader, which was developed in order to characterize soilheterotrophic microbial communities according to their solecarbon-source utilization profiles. Schimel et al. [51] investi-gated the effect of different moisture regimes on litter decom-position in an Alaskan birch stand system by using the BiologGN microplate system. They found that episodic drying andrewetting decreased the number of Biolog substrates used.Although many studies examined the effect of various plantspecies on the composition of microbial communities in soilby using the Biolog or other substrate-induced respirationtechniques [39, 53], little is known about the composition ofmicrobial communities on the litter itself. The above studiesenabled focusing on diverse questions that were raised onplant litter microbial substrate utilization diversity [13, 37].
According to the above and previous studies, the threemain components that determine soil-surface organic matterdecomposition patterns are (1) amount of leaching, (2) pho-todestruction—volatilization, and (3) microbial communitystructure. The first two are driven by abiotic forces, whereboth of them shape the biotic components. The biotic con-stituents are also manipulated by plant litter chemical com-ponents, which establish the basic substrate that determinesthe microflora, micro- and meso-fauna community [28]. Asa result of this, the biotic community and its substrateutilization will be determined by litter quality on the onehand and by the abiotic variables that determine the
composition, activity, and relationship of the biological eco-system on the other hand. Their activity will be synchro-nized by litter quality and abiotic variables, which can beseen as an allegory of the “hammer and anvil” unit.
In the present study, an attempt was made to evaluate theeffects of climate gradient (e.g., rainfall and temperature,Table 1) (abiotic components—the “hammer”) on the onehand and organic weight loss (substrate degradation—activetransfer of litter constituents) (in this case—the “anvil”) on theother hand. Changes in wheat straw plant litter and microbialcommunity colonization along a natural climatic gradient,which reflects changes in the hammer intensity, will also bedetermined by changes in plant litter composition (which willbe the “anvil” in our case). The interplay of the two compo-nents, “hammer” and “anvil,”will be themain governing forcesdetermining the biomass, activity, composition, and ratio of thesubstrate utilization microbial community components.
The impact of climate (changes in precipitation) on a tem-poral basis (seasonality) and the four ecosystems used as aspatial dimension, on microbial community activity, e.g., CO2
evolution, biomass, and substrate utilization associated withplant litter breakdown, were evaluated. We hypothesized that:(1) a decrease in xeric environmental conditions will increasemicrobial biomass and decrease microbial functional diversityand (2) the correlation between total amount of rainfall and soilmicrobial community activity, e.g., CO2 evolution and bio-mass, will increase as we move from humid Mediterranean(HM) to xeric ecosystems.
Materials and Methods
Study Site
Four study sites located along a 245-km stretch, from thenorthern part of Israel toward the southern part, represent aclimatic gradient. These sites represent different environmen-tal and climatic conditions: humid-Mediterranean (HM),Mediterranean (M), semi-arid (SA) and arid (A) ecosystems.
The common basic climate for all four sites is characterizedby rainy winters (October–April) and prolonged dry summers(June–August). The plant-growing season commences soonafter the first rains, between October and December [24]. Thesites are located at similar elevations, ranging between 470and 620 m above sea level, and are positioned on south-facingslopes. Each site overlies calcareous bedrock, conferring pHvalues in the alkaline range (7.5–7.9). A significant decreasein yearly rainfall, relative to the mean multiannual rainfall,was obtained at each of the four sites.
The HM site is located (33°0′N, 35°14′E) in the northernGalilee mountains, at an elevation of 500 m above sea level(a.s.l.), on montmorillonitic terra rossa, clay texture. Averageannual rainfall at this site amounts to 780 mm, and the mean
400 C. Sherman, Y. Steinberger
annual temperature is 18.1°C. Vegetation varies from a denser,more closed oak maquis cover to more open garrigues dom-inated by shrubs. Herbaceous vegetation, mainly composed ofannuals, coexists with shrubs.
The M site is located 18 km southwest of Jerusalem (31°42′N, 35°3′E) at 620 ma.s.l., on terra rossa, clay texture.Average annual rainfall is 540 mm, and the mean annualtemperature is 17°C. Vegetation is dominated by shrubs andlarge numbers of herbaceous (mostly annual) plant species.
The SA site is positioned between the southern JudeanMountains and the northern Negev (31°23′N, 34°54′E) at590 ma.s.l., on light brown rendzina, loam texture. Averageannual rainfall is 300 mm, and the mean annual temperatureis 18.4°C. Vegetation is dominated by dwarf shrubs associ-ated with herbaceous (chiefly annual) plants.
The A site is situated on the Negev plateau (30°52′N, 34°46′E) near Sde Boker, at an elevation of 470 ma.s.l., on desertlithosol, sandy clay loam texture. Average multiannual rainfallis 90 mm, and the mean multiannual temperature is 19.1°C.Vegetation at this site is dominated by small shrubs andsparsely growing desert annuals and geophytes [24].
Field Experimental Setup
The decomposition study along the climate gradient wasconducted using air-dried wheat straw litter packed in fiber-glass mesh bags (20×20 cm fiberglass window screen, meshsize 1.5 mm), each containing 10±0.015 g litter. A total of240 litter bags were prepared, and sets of 60 litter bags wereplaced randomly at each of the four locations on a 50×50-marea on the soil surface in September 2007. Each litter bagwas secured with wire pins to prevent movement. Ten litterbags were collected randomly from each study site along thegradient and placed in individual plastic bags (in order tominimize the loss of plant material during transportation toand from the field), at the following times: February 2008,July 2008, October 2008, January 2009, and July 2009. OnOctober 2009, intact litter bags were found only in theMediterranean and semi-arid sites. Rainfall and soil/air tem-perature (AT) data were obtained from four meteorological
stations (one at each study site) using automatic rain gaugesand thermocouples (see Talmon et al. [61]).
Laboratory Analysis
All chemical and biological analyses were conducted on eachof the replicates collected in the field from each location.
Weight Loss
The weight loss of each individual litter bag was determinedaccording to remaining plant organic matter on a dry weightloss basis after removing the soil particles by gentle brushing[55]. Five litter bags per study site were used for weight lossdetermination from a total of 10 l bags retrieved at each timeperiod from the field.
Each of these 5 l bags was oven-dried at 60°C for aminimum of 72 h, weighed for litter moisture determinationfollowed by organic matter quantification using a mufflefurnace at 390°C for 8 h. The weight loss for each bagwas determined according to the Hamadi et al. [29] equa-tion, and a first-order kinetic constant (k) for weight loss wascalculated as follows:
At ¼ A0e�kt
where At is the mass remaining at time t, A0 is the initialmass, t is time, and k is a negative coefficient [60].
Litter moisture was determined gravimetrically by dryinglitter samples for a minimum of 72 h at 60°C. The contentsof the additional 5 l bags were crushed to a size of 2 mm byusing a “Wiley milled” [29] before determination of biolog-ical components and chemical parameters as below.
C/N Ratio
Dried straw samples were used to determine C and N valuesby using a CHNS analyzer (Flash EA 1112 series, Thermo).The ratios between carbon and nitrogen were calculated.
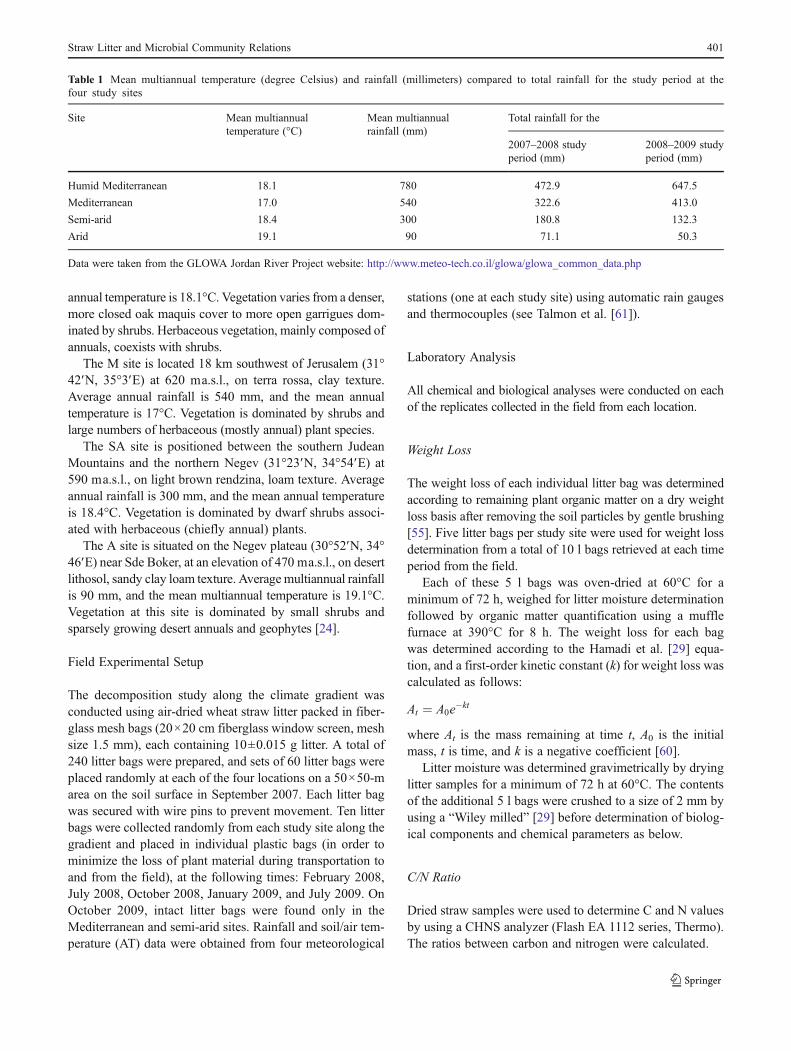
Table 1 Mean multiannual temperature (degree Celsius) and rainfall (millimeters) compared to total rainfall for the study period at thefour study sites
Site Mean multiannualtemperature (°C)
Mean multiannualrainfall (mm)
Total rainfall for the
2007–2008 studyperiod (mm)
2008–2009 studyperiod (mm)
Humid Mediterranean 18.1 780 472.9 647.5
Mediterranean 17.0 540 322.6 413.0
Semi-arid 18.4 300 180.8 132.3
Arid 19.1 90 71.1 50.3
Data were taken from the GLOWA Jordan River Project website: http://www.meteo-tech.co.il/glowa/glowa_common_data.php
Straw Litter and Microbial Community Relations 401
MB and CO2 Evolution
These were detected using the MicroResp™ plate method[11], where ground straw samples were added into the deepwell plates (0.07 g in each well). CO2 evolution was mea-sured by dye plates—a colorimetric reaction using absor-bent alkali with the ability to measure carbon dioxideevolution. The plates were read twice in a spectrophotome-ter at 590 nm: before the plates were placed on the deepwells containing the ground straw samples (time 0) and after1 h (time 1). During that time, the plates were incubated inthe dark at 27°C. The result for each well was calculatedcompared to the 16th well, which contained the same strawsample and water, measuring the basal respiration with nocarbon source at all. Glucose was added to determine mi-crobial biomass according to the substrate-induced respira-tion method [2].
Microbial Functional Diversity and Community-LevelPhysiological Profile
These were detected using the MicroResp™ plate [11]. Fif-teen different carbon sources of carbohydrates, carboxylicacids, amino acids, and aromatic carboxylic acids (Table 2)were added to whole ground straw samples in deep wellplates (0.07 g in each well). CO2 evolution was mea-sured by dye plates—a colorimetric reaction using absor-bent alkali with the ability to measure carbon dioxideevolution. The plates were read twice in a spectropho-tometer at 590 nm: just before the plates were placed onthe deep wells containing the ground (0.2 mm size) strawsamples (time 0) and after 1 h of microbial respiration(which colonized the straw litter) (time 1). During thattime, the plates were incubated in the dark at 27°C. The resultfor each well was calculated and compared to the 16th well(which contained the same straw sample and water), measur-ing the basal respiration with no added carbon source. Micro-bial functional diversity was determined using the Shannon–Weaver index (H′): H′0−ΣPi (ln Pi), where Pi is the ratio ofthe activity of a particular substrate and the sum of activities ofall substrates [68].
Metabolic Quotient (qCO2)
The metabolic quotient (qCO2) of the microbial communitieswas suggested by Fliessbach and Mader [25] and Dilly et al.[19] as correlating positively with energy demand and hencenegatively with carbon-use efficiency of soil microbial com-munities. It is widely accepted that qCO2 is elevated when amicrobial community operates inefficiently and—as a resultof an exogenous disturbance—diverts a higher proportion ofcarbon to maintenance requirements than to biosynthesis [2].Division of the basal respiration rate by the respiring biomassprovides the metabolic quotient (qCO2).
MB/OM Ratio
The MB/OM ratio elucidates the expected carbon mineraliza-tion potential [34].
Bacterial Colony-Forming Units
These were used to estimate the population size of heterotro-phic bacteria in each straw sample throughout the study period.Tryptic soy agar was prepared for bacterial cultures [16]. Themedium was inoculated with 100 μl diluted, ground strawsample (9.5 ml sterile distilled water+0.5 g ground straw ineach tube, 1min vortex), and then incubated at 27°C for 5 days.Colony-forming units (CFUs) in each plate were determined.
Statistical Analysis
All data were subjected to statistical analysis of variance usingthe SAS model (ANOVA and Duncan’s multiple range test,and Pearson correlation coefficients) and were used to evalu-ate differences between separate means. ANOVA was fol-lowed by Tukey’s honestly significant difference test toestablish the significance of differences between plot areasusing the statistical package Statistica 4.3. Differencesobtained at levels of p<0.05 were considered significant.Redundancy analysis (RDA) was used to relate environmentalfactors such as sampling location along the climatic gradientand seasonality with soil abiotic parameters and microbial
Table 2 The different carbonsources added to straw samplesand divided into chemicalgroups using theMicroResp™ technique
Aromatic carboxylic acids Amino acids Carbohydrates Carboxylic acids
3,4-Dihydroxybenzoic acid(protocatechuic acid)
L-Alanine L-Arabinose Citric acid
Arginine D-Fructose L-Malic acid
L-Cysteine HCL D-Galactose Oxalic acid
γ-Amino butyric acid D-Glucose
L-Lysine Trehalose
N-Acetyl-glucosamine
402 C. Sherman, Y. Steinberger
community substrate utilization (CANOCO, version 4.54[63]). The Monte Carlo permutation (499) test was used tocalculate the significance of any given relationship establishedbetween the environmental factors and the measured soilparameters [63]. RDA analysis produced graphic illustrationswith arrows connecting the environmental factors to theircorresponding measured parameters. Arrows pointing insimilar directions indicate a positive correlation, whilearrows pointing in opposite directions indicate a negativeone. The longer the arrow is, the more significant therelationship.
Results
Abiotic Parameters
Rainfall
During the study period, two rainy seasons occurred, betweenSeptember 2007 and October 2009 (a total of 26 months)(Table 1). The first rainy season began in October 2007, afterplacing the litter bags along the transect in the field, and itended in May 2008. The second rainfall season started inSeptember 2008 and ended in April 2009. In both rainfallseasons, the total amounts of rainfall were found to be lowerthan the multiannual rainfall amount at all four study sites(Table 1). During the first winter season, the total amounts ofprecipitation at the HM, M, and SA sites were about 40 %lower than the multiannual rainfall, whereas at the A site, thetotal amount of precipitation was about 21 % lower. In thesecond year of our study, the pattern of lower rainfall relativeto the multiannual average continued, reaching values of83, 77, 44, and 56 % for the HM, M, SM, and A sites,respectively. The following distinction was found when com-paring the total rainfall between the two winter seasons: (1) atthe humid Mediterranean site (647.5 mm year−1 during 2009compared to 472.9 mm year−1 during 2008) and at the Med-iterranean site (413 mm year−1 during 2009 compared to322.6 mm year−1 during 2008); rainfall during the secondyear was higher compared to that in the (2) semi-arid site(180.8 mm year−1 during 2008 compared to 132.3 mm year−1
during 2009) and the arid site (71.1 mm year−1 during 2008compared to 50.3 mm year−1 during 2009), where the decreasein rainfall pattern continued.
A negative Pearson correlation (p<0.01) was establishedbetween rainfall and soil temperature for joined data from allseasons at the HM, M, SA, and A sites. Similar results (cor-relation) were acquired between rainfall and air temperature(AT) for joined data for all seasons at the M and SA sites(Table 3). Only for data collected at the A site a positivePearson correlation (p<0.01) between rainfall and the biotic
parameters (bacterial CFU, CO2 evolution, and MB) forjoined data from all seasons was obtained.
Litter Moisture
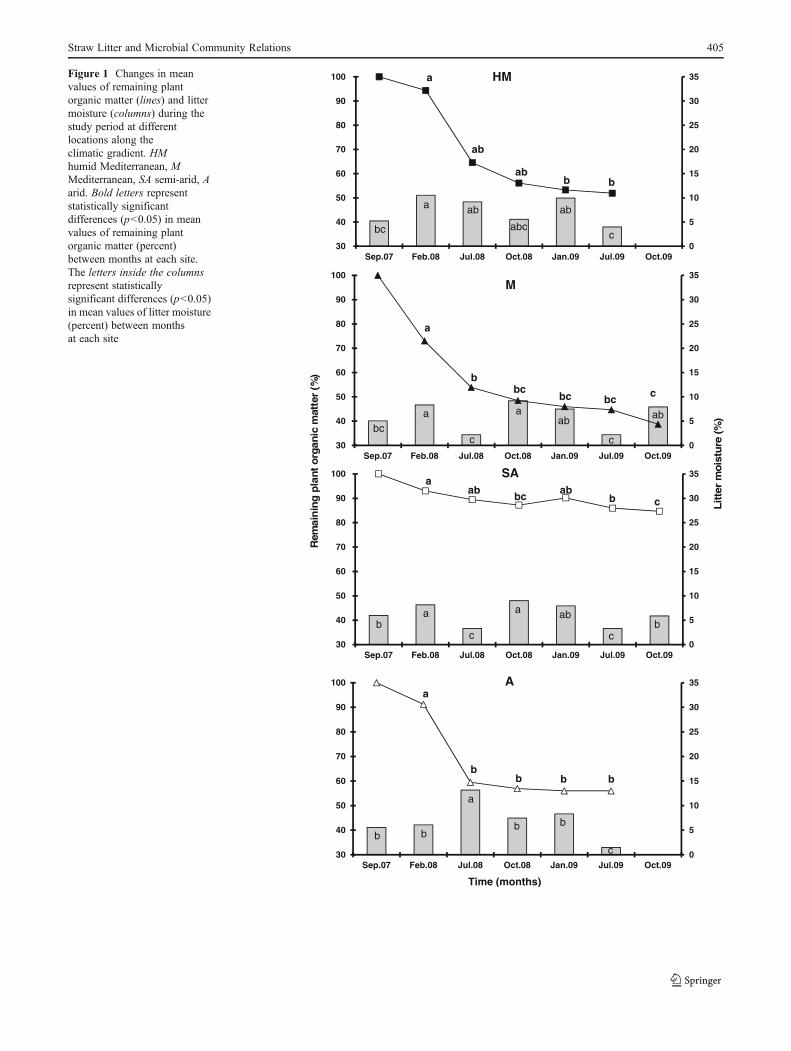
During the study period, litter moisture content was found tovary according to season (Fig. 1). The greatest moisture rangewas observed at the arid site (11.6 %), followed by M (6.9 %),HM (6.6 %), and SA (5.7 %) (Fig. 1). The highest littermoisture at the HM site was found in winter 2008 (10.53 %),while the lowest value was obtained in summer 2009 (4 %). Asimilar trend was observed at the M and SA sites, with thehighest litter moisture values found in winter 2008 (8.3 and8.1 %, respectively) and autumn 2008 (9.1 and 9.0 %, respec-tively). The lowest litter moisture at these two sites wasobtained in both summer seasons (2.2 % at the M site and3.3 % at the SA site). In contrast, at the A site, the highest littermoisture was reached in summer 2008 (13.1 %), while thelowest was obtained during the second summer, with a value of1.5 % (Fig. 1).
Litter moisture was significantly affected by seasonality(F021.29, p<0.0001), year (F014.38, p<0.0001), the in-teraction between the two (F09.43, p00.0002), the interac-tion between season and site (F08.78, p<0.0001), and theinteraction between the three (F07.79, p<0.0001) (Table 4).No correlation was obtained between litter moisture andweight loss.
A negative Pearson correlation (p<0.01) was establishedbetween litter moisture and soil temperature for joined datafrom all seasons at the HM,M, and SA sites (Table 3). Similarnegative correlations between litter moisture and AT at the Mand SA sites were obtained for all seasons (Table 3). The littermoisture and bacterial CFU for joined data of all seasons werefound to be significantly positively correlated only at the aridstudy site (p<0.05) (Table 3).
Weight Loss
During the study period, a total of 48.1, 61.2, 15.3, and 44 %litter weight loss was obtained at HM, M, SA, and A, respec-tively (Fig. 1). At three out of the four sites, the highest weightloss was obtained following the first winter season, reachingvalues of 64.5, 53.8, and 59.5 %, relative to the initial weightfor HM, M, and A. However, at the SA site, weight loss wassignificantly lower compared to the other three sites, reachingonly 89.4 % during the same period, a loss of 10.6 % from theinitial weight. A moderate loss in wheat straw was obtained inthe following winter, summer, and in the second winter(Fig. 1).
In general, weight loss was found to be significantlyaffected by season (F014.76, p<0.0001), year (F027.66,p<0.0001), site (F084.51, p<0.0001), and the interaction
Straw Litter and Microbial Community Relations 403
between season and year (F05.76, p00.0048) and betweenyear and site (F03.1, p00.0323) (Table 4). The kineticconstants calculated for the first year, which included winterand spring, indicated a higher value for the M and A sites,with values of 2.0 and 1.9×10⁻³ K day−1, respectively,followed by HM and SA, with values of 1.4 and 0.4×10⁻³ K day−1, respectively (Table 5). A similar trend wasobserved for the second period beginning in the summer ofthe first year and ending at the end of the study period, withvalues of 0.6, 0.8, 0.1, and 0.2×10⁻³ K day−1 for the HM,M, SA, and A sites, respectively (Table 5). During thesecond study period, a decrease in K values of 57, 60, 75,
and 90 % for HM, M, SA, and A sites, respectively, wasexhibited.
Biotic Activity
CO2 evolution, microbial biomass, and subsequently all otherbiotic parameters measured did not show biotic activity in littersamples at the initiation of the study (September 2007), nor inplant litter in litter bags placed and retrieved as zero time fromeach station along the climate gradient. As a consequence ofthis, the figures presented a zero activity result at time zero.
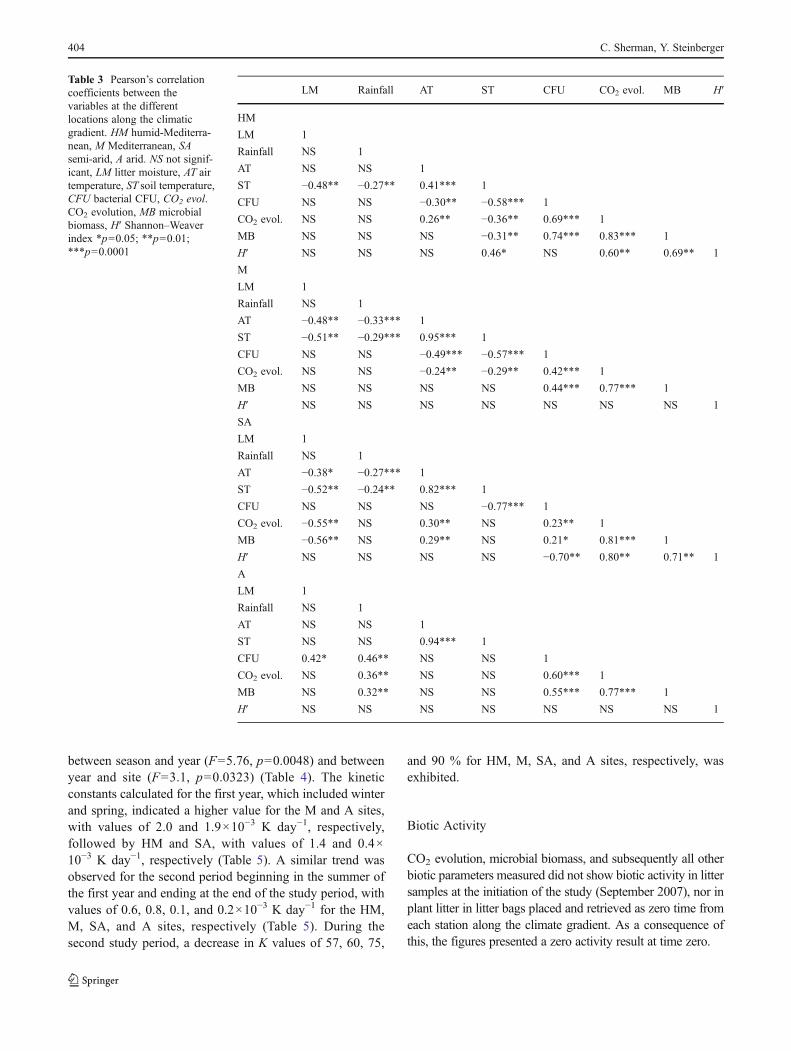
Table 3 Pearson’s correlationcoefficients between thevariables at the differentlocations along the climaticgradient. HM humid-Mediterra-nean, M Mediterranean, SAsemi-arid, A arid. NS not signif-icant, LM litter moisture, AT airtemperature, ST soil temperature,CFU bacterial CFU, CO2 evol.CO2 evolution, MB microbialbiomass, H′ Shannon–Weaverindex *p00.05; **p00.01;***p00.0001
LM Rainfall AT ST CFU CO2 evol. MB H′
HM
LM 1
Rainfall NS 1
AT NS NS 1
ST −0.48** −0.27** 0.41*** 1
CFU NS NS −0.30** −0.58*** 1
CO2 evol. NS NS 0.26** −0.36** 0.69*** 1
MB NS NS NS −0.31** 0.74*** 0.83*** 1
H′ NS NS NS 0.46* NS 0.60** 0.69** 1
M
LM 1
Rainfall NS 1
AT −0.48** −0.33*** 1
ST −0.51** −0.29*** 0.95*** 1
CFU NS NS −0.49*** −0.57*** 1
CO2 evol. NS NS −0.24** −0.29** 0.42*** 1
MB NS NS NS NS 0.44*** 0.77*** 1
H′ NS NS NS NS NS NS NS 1
SA
LM 1
Rainfall NS 1
AT −0.38* −0.27*** 1
ST −0.52** −0.24** 0.82*** 1
CFU NS NS NS −0.77*** 1
CO2 evol. −0.55** NS 0.30** NS 0.23** 1
MB −0.56** NS 0.29** NS 0.21* 0.81*** 1
H′ NS NS NS NS −0.70** 0.80** 0.71** 1
A
LM 1
Rainfall NS 1
AT NS NS 1
ST NS NS 0.94*** 1
CFU 0.42* 0.46** NS NS 1
CO2 evol. NS 0.36** NS NS 0.60*** 1
MB NS 0.32** NS NS 0.55*** 0.77*** 1
H′ NS NS NS NS NS NS NS 1
404 C. Sherman, Y. Steinberger
0
5
10
15
20
25
30
35
30
40
50
60
70
80
90
100
Sep.07 Feb.08 Jul.08 Oct.08 Jan.09 Jul.09 Oct.09
0
5
10
15
20
25
30
35
30
40
50
60
70
80
90
100
Sep.07 Feb.08 Jul.08 Oct.08 Jan.09 Jul.09 Oct.09
0
5
10
15
20
25
30
35
30
40
50
60
70
80
90
100
Sep.07 Feb.08 Jul.08 Oct.08 Jan.09 Jul.09 Oct.09
0
5
10
15
20
25
30
35
30
40
50
60
70
80
90
100
Sep.07 Feb.08 Jul.08 Oct.08 Jan.09 Jul.09 Oct.09
HM
M
SA
A
a ab
bc
ab
abcc
bca
c
aab
c
ab
cb
a
c
a abb
b b
a
b b
c
b
c
a
b
a
ab
abb
a
b
bc bcbc
ab abbc b c
a
bb b
Lit
ter
mo
istu
re (
%)
Rem
ain
ing
pla
nt
org
anic
mat
ter
(%)
Time (months)
Figure 1 Changes in meanvalues of remaining plantorganic matter (lines) and littermoisture (columns) during thestudy period at differentlocations along theclimatic gradient. HMhumid Mediterranean, MMediterranean, SA semi-arid, Aarid. Bold letters representstatistically significantdifferences (p<0.05) in meanvalues of remaining plantorganic matter (percent)between months at each site.The letters inside the columnsrepresent statisticallysignificant differences (p<0.05)in mean values of litter moisture(percent) between monthsat each site
Straw Litter and Microbial Community Relations 405
CO2 Evolution
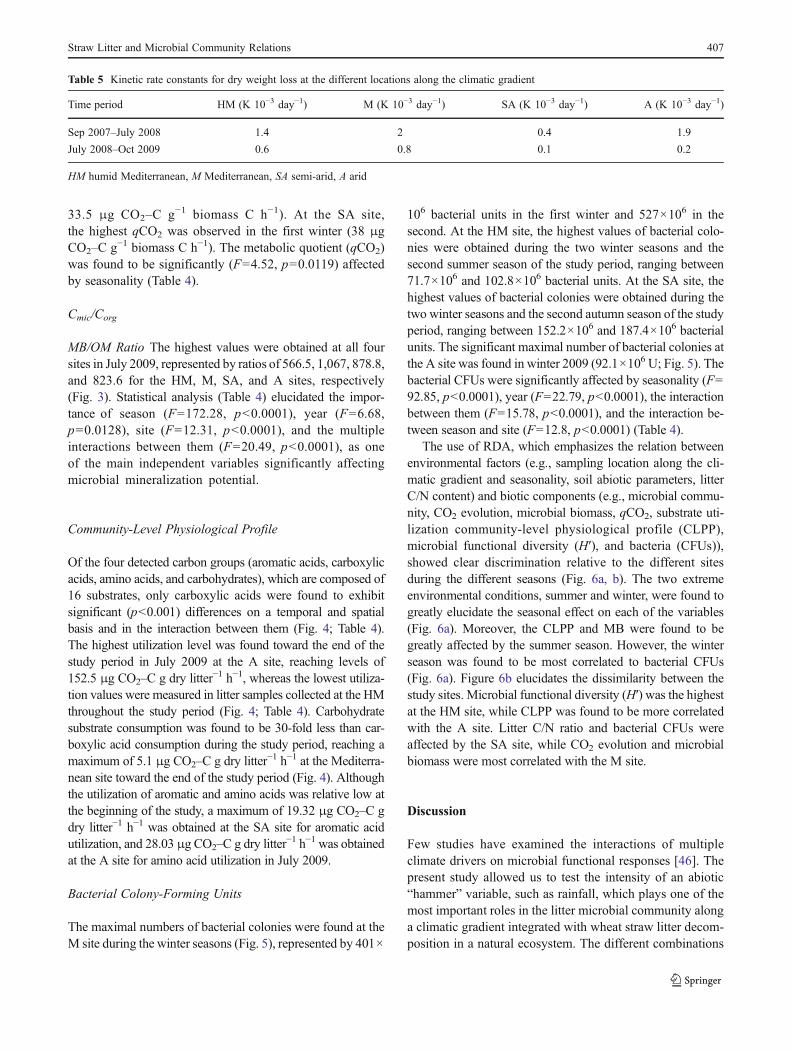
It obtained from the wheat straw litter during the first year ofrainfall demonstrated relatively higher activity compared tothe periods that followed in the HM and M site samples,reaching a maximum of 10.2 and 18.5 μg CO2–C gdrylitter−1 h−1, respectively (Fig. 2). However, at the SA and Asites, CO2 evolution levels exhibited a different trend, with alow level of 1.6 μg CO2–C g dry litter−1 h−1 for the SA in thefirst winter season and a seven-fold higher value of 11.8 μgCO2–C g dry litter−1 h−1 in July (summer) 2009. At the A site,CO2 evolution in litter samples collected during the first winterwas similar to the CO2 evolution levels of the 2009 summer,with a mean of 8.3μg CO2–C g dry litter−1 h−1. TheCO2 levelsin litter samples collected from HM in July 2008 and winter2009 reached lower values of 2.3 and 1.4 μg CO2–C g drylitter−1 h−1, respectively. A similar trend was obtained for theM site for the same period (Fig. 2). The fluctuations in CO2
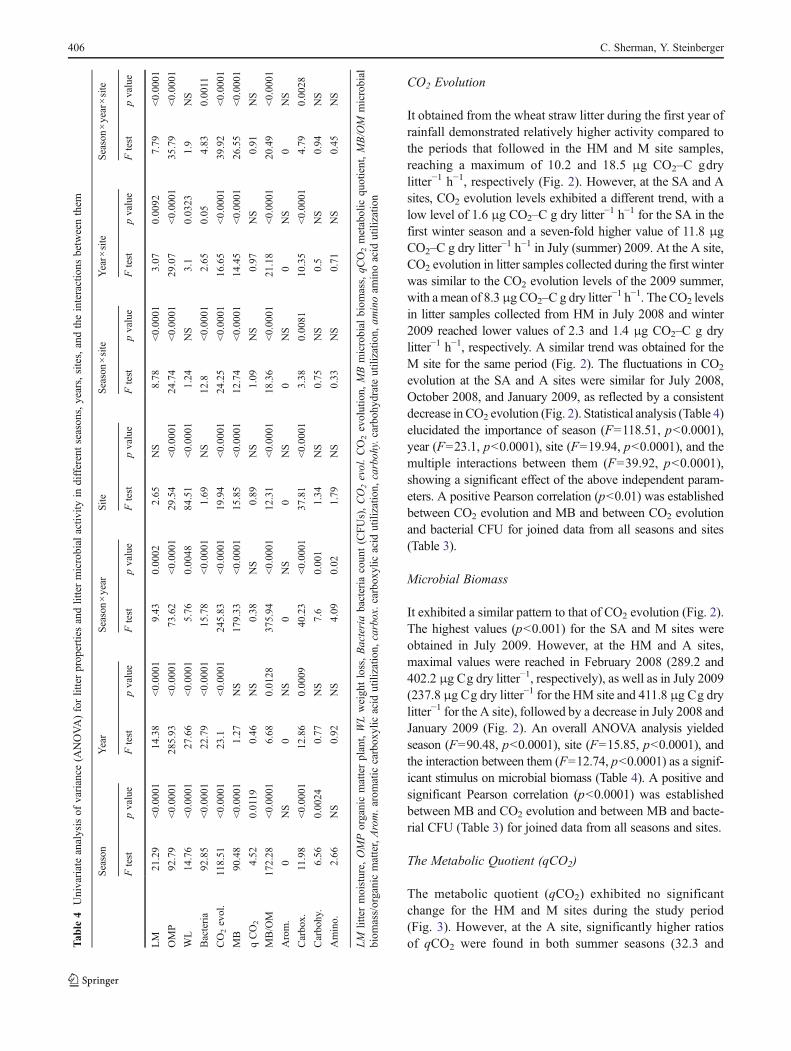
evolution at the SA and A sites were similar for July 2008,October 2008, and January 2009, as reflected by a consistentdecrease in CO2 evolution (Fig. 2). Statistical analysis (Table 4)elucidated the importance of season (F0118.51, p<0.0001),year (F023.1, p<0.0001), site (F019.94, p<0.0001), and themultiple interactions between them (F039.92, p<0.0001),showing a significant effect of the above independent param-eters. A positive Pearson correlation (p<0.01) was establishedbetween CO2 evolution and MB and between CO2 evolutionand bacterial CFU for joined data from all seasons and sites(Table 3).
Microbial Biomass
It exhibited a similar pattern to that of CO2 evolution (Fig. 2).The highest values (p<0.001) for the SA and M sites wereobtained in July 2009. However, at the HM and A sites,maximal values were reached in February 2008 (289.2 and402.2 μg Cg dry litter−1, respectively), as well as in July 2009(237.8 μg Cg dry litter−1 for the HM site and 411.8 μg Cg drylitter−1 for the A site), followed by a decrease in July 2008 andJanuary 2009 (Fig. 2). An overall ANOVA analysis yieldedseason (F090.48, p<0.0001), site (F015.85, p<0.0001), andthe interaction between them (F012.74, p<0.0001) as a signif-icant stimulus on microbial biomass (Table 4). A positive andsignificant Pearson correlation (p<0.0001) was establishedbetween MB and CO2 evolution and between MB and bacte-rial CFU (Table 3) for joined data from all seasons and sites.
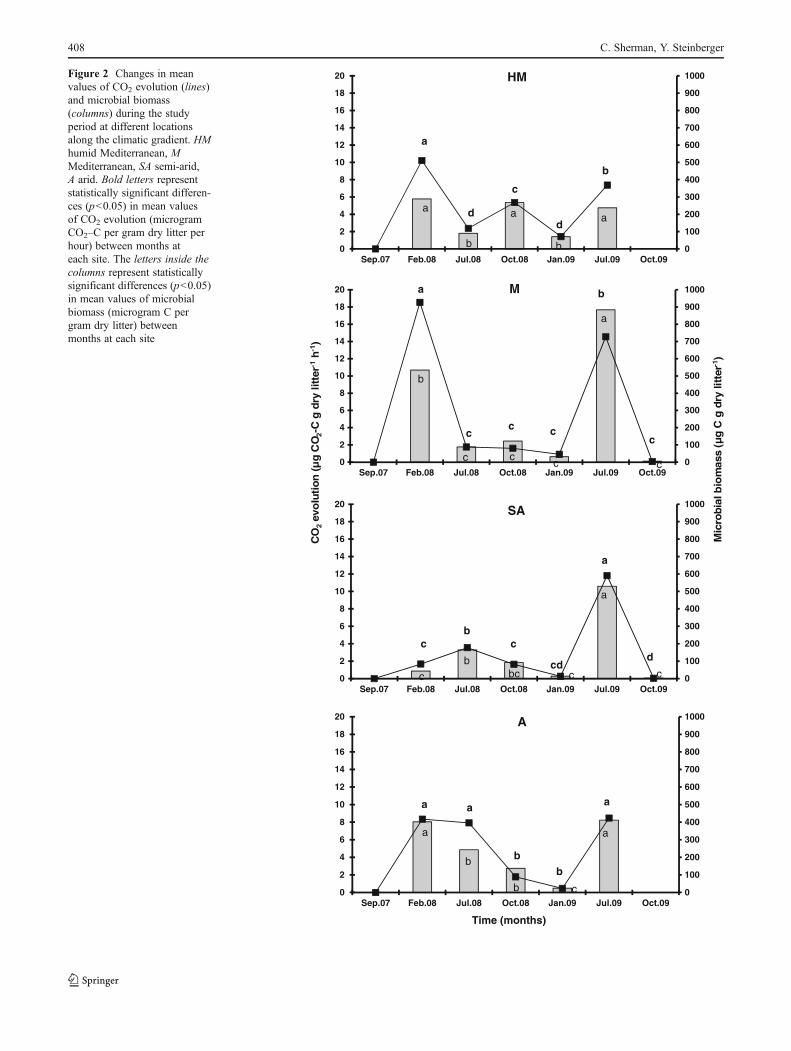
The Metabolic Quotient (qCO2)
The metabolic quotient (qCO2) exhibited no significantchange for the HM and M sites during the study period(Fig. 3). However, at the A site, significantly higher ratiosof qCO2 were found in both summer seasons (32.3 andT
able
4Univariateanalysisof
variance
(ANOVA)forlitterprop
ertiesandlittermicrobial
activ
ityin
differentseason
s,years,sites,andtheinteractions
betweenthem
Season
Year
Season×year
Site
Season×site
Year×
site
Season×year×site
Ftest
pvalue
Ftest
pvalue
Ftest
pvalue
Ftest
pvalue
Ftest
pvalue
Ftest
pvalue
Ftest
pvalue
LM
21.29
<0.00
0114
.38
<0.00
019.43
0.0002
2.65
NS
8.78
<0.00
013.07
0.00
927.79
<0.00
01
OMP
92.79
<0.00
0128
5.93
<0.00
0173
.62
<0.0001
29.54
<0.00
0124
.74
<0.00
0129
.07
<0.0001
35.79
<0.00
01
WL
14.76
<0.00
0127
.66
<0.00
015.76
0.0048
84.51
<0.00
011.24
NS
3.1
0.03
231.9
NS
Bacteria
92.85
<0.00
0122
.79
<0.00
0115
.78
<0.0001
1.69
NS
12.8
<0.00
012.65
0.05
4.83
0.00
11
CO2evol.
118.51
<0.00
0123
.1<0.00
0124
5.83
<0.0001
19.94
<0.00
0124
.25
<0.00
0116
.65
<0.0001
39.92
<0.00
01
MB
90.48
<0.00
011.27
NS
179.33
<0.0001
15.85
<0.00
0112
.74
<0.00
0114
.45
<0.0001
26.55
<0.00
01
qCO2
4.52
0.0119
0.46
NS
0.38
NS
0.89
NS
1.09
NS
0.97
NS
0.91
NS
MB/OM
172.28
<0.00
016.68
0.0128
375.94
<0.0001
12.31
<0.00
0118
.36
<0.00
0121
.18
<0.0001
20.49
<0.00
01
Arom.
0NS
0NS
0NS
0NS
0NS
0NS
0NS
Carbox.
11.98
<0.00
0112
.86
0.0009
40.23
<0.0001
37.81
<0.00
013.38
0.00
8110
.35
<0.0001
4.79
0.00
28
Carbohy.
6.56
0.00
240.77
NS
7.6
0.001
1.34
NS
0.75
NS
0.5
NS
0.94
NS
Amino.
2.66
NS
0.92
NS
4.09
0.02
1.79
NS
0.33
NS
0.71
NS
0.45
NS
LM
littermoisture,
OMPorganicmatterplant,WLweigh
tloss,Bacteriabacteria
coun
t(CFUs),CO2evol.CO2evolution,
MBmicrobial
biom
ass,qC
O2metabolic
quotient,MB/OM
microbial
biom
ass/organicmatter,Arom.arom
atic
carbox
ylic
acid
utilizatio
n,carbox.carbox
ylic
acid
utilizatio
n,carboh
y.carboh
ydrate
utilizatio
n,am
inoam
inoacid
utilizatio
n
406 C. Sherman, Y. Steinberger
33.5 μg CO2–C g−1 biomass C h−1). At the SA site,the highest qCO2 was observed in the first winter (38 μgCO2–C g−1 biomass C h−1). The metabolic quotient (qCO2)was found to be significantly (F04.52, p00.0119) affectedby seasonality (Table 4).
Cmic/Corg
MB/OM Ratio The highest values were obtained at all foursites in July 2009, represented by ratios of 566.5, 1,067, 878.8,and 823.6 for the HM, M, SA, and A sites, respectively(Fig. 3). Statistical analysis (Table 4) elucidated the impor-tance of season (F0172.28, p<0.0001), year (F06.68,p00.0128), site (F012.31, p<0.0001), and the multipleinteractions between them (F020.49, p<0.0001), as oneof the main independent variables significantly affectingmicrobial mineralization potential.
Community-Level Physiological Profile
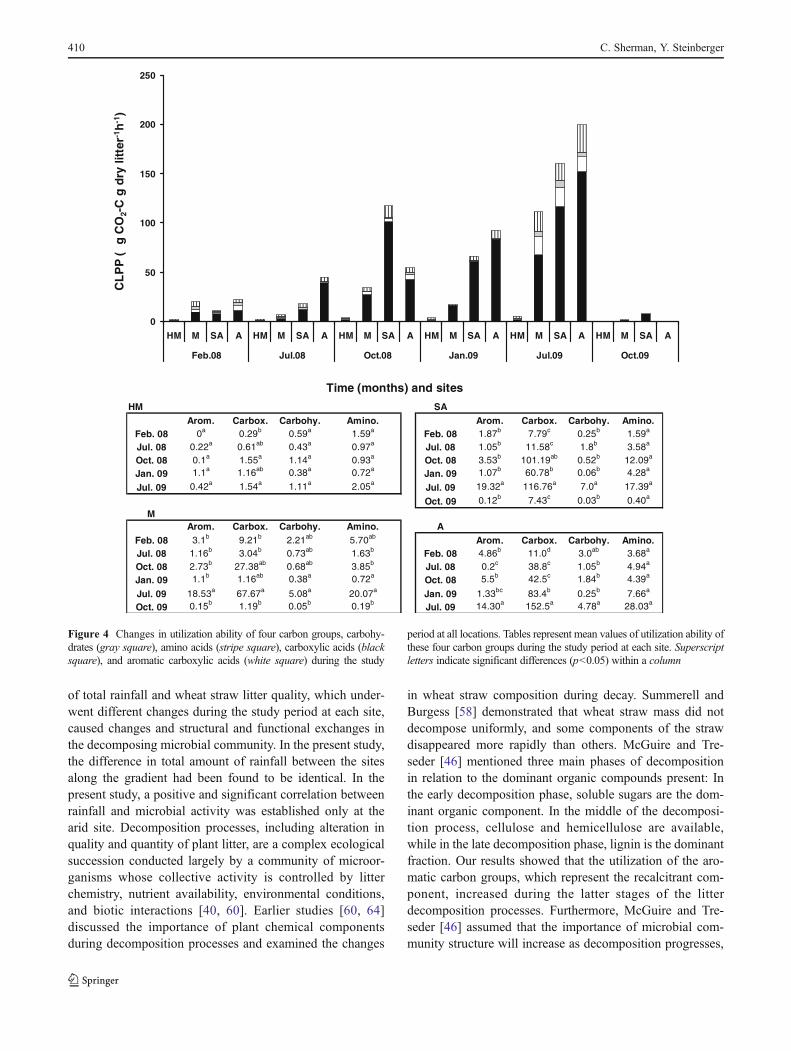
Of the four detected carbon groups (aromatic acids, carboxylicacids, amino acids, and carbohydrates), which are composed of16 substrates, only carboxylic acids were found to exhibitsignificant (p<0.001) differences on a temporal and spatialbasis and in the interaction between them (Fig. 4; Table 4).The highest utilization level was found toward the end of thestudy period in July 2009 at the A site, reaching levels of152.5 μg CO2–C g dry litter−1 h−1, whereas the lowest utiliza-tion values were measured in litter samples collected at the HMthroughout the study period (Fig. 4; Table 4). Carbohydratesubstrate consumption was found to be 30-fold less than car-boxylic acid consumption during the study period, reaching amaximum of 5.1 μg CO2–C g dry litter−1 h−1 at the Mediterra-nean site toward the end of the study period (Fig. 4). Althoughthe utilization of aromatic and amino acids was relative low atthe beginning of the study, a maximum of 19.32 μg CO2–C gdry litter−1 h−1 was obtained at the SA site for aromatic acidutilization, and 28.03 μg CO2–C g dry litter−1 h−1 was obtainedat the A site for amino acid utilization in July 2009.
Bacterial Colony-Forming Units
The maximal numbers of bacterial colonies were found at theM site during the winter seasons (Fig. 5), represented by 401×
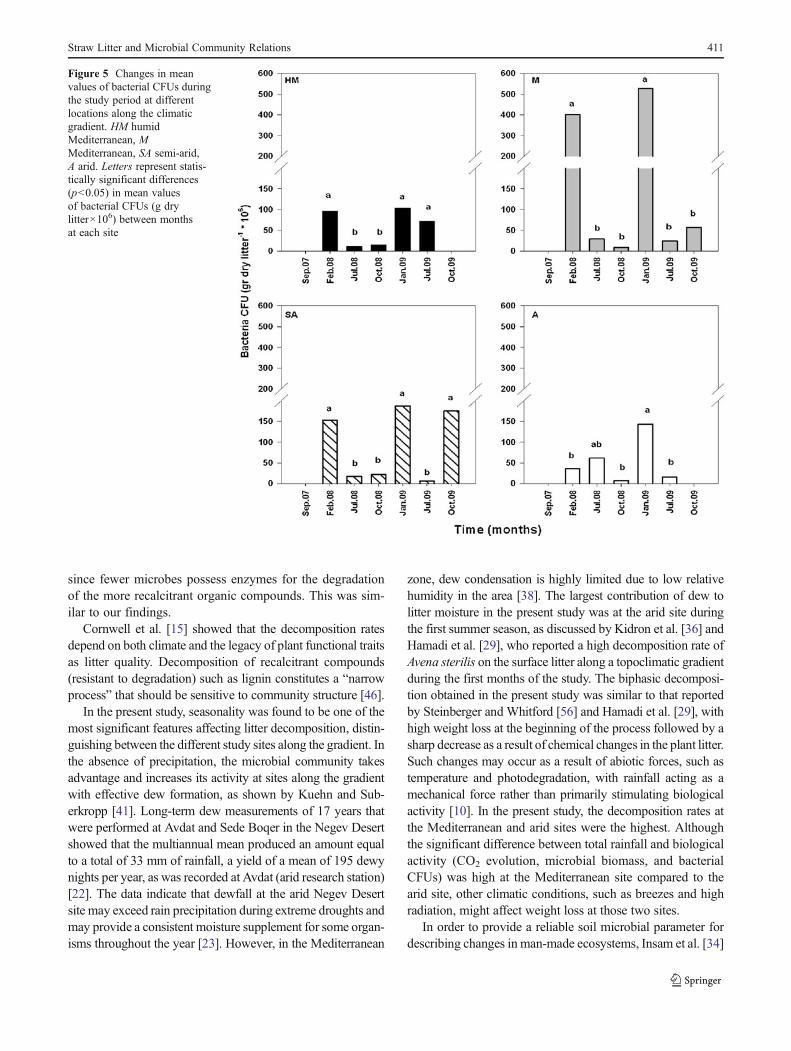
106 bacterial units in the first winter and 527×106 in thesecond. At the HM site, the highest values of bacterial colo-nies were obtained during the two winter seasons and thesecond summer season of the study period, ranging between71.7×106 and 102.8×10⁶ bacterial units. At the SA site, thehighest values of bacterial colonies were obtained during thetwo winter seasons and the second autumn season of the studyperiod, ranging between 152.2×10⁶ and 187.4×10⁶ bacterialunits. The significant maximal number of bacterial colonies atthe A site was found in winter 2009 (92.1×10⁶ U; Fig. 5). Thebacterial CFUs were significantly affected by seasonality (F092.85, p<0.0001), year (F022.79, p<0.0001), the interactionbetween them (F015.78, p<0.0001), and the interaction be-tween season and site (F012.8, p<0.0001) (Table 4).
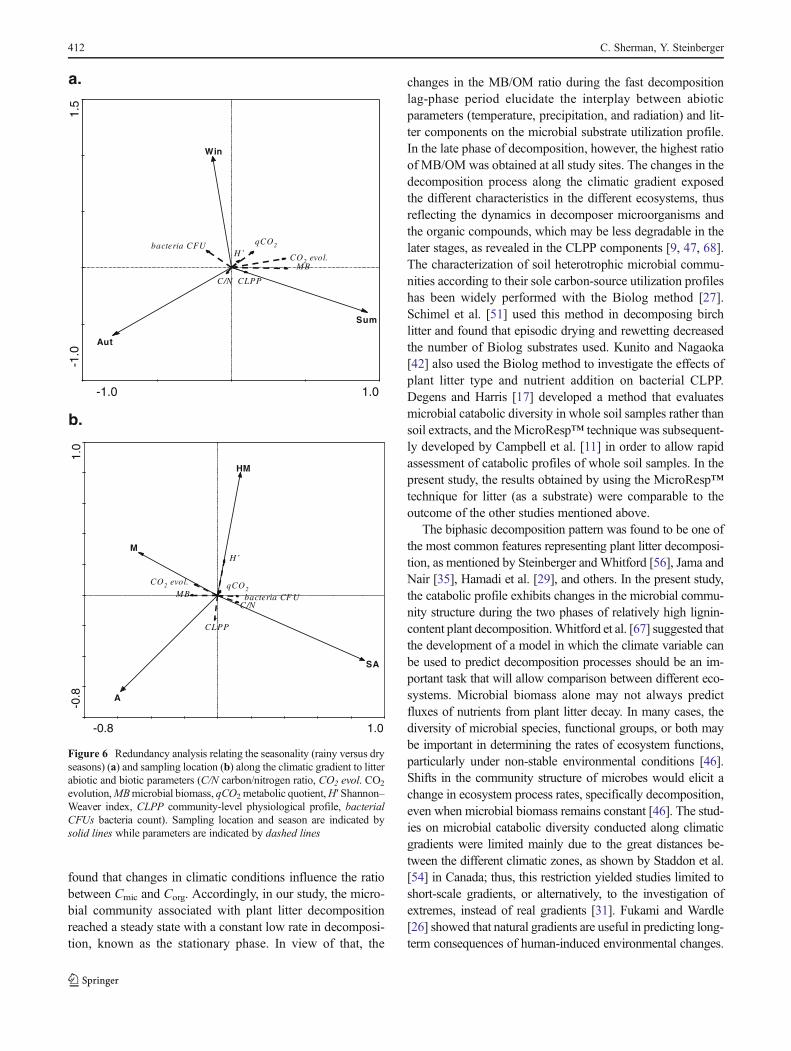
The use of RDA, which emphasizes the relation betweenenvironmental factors (e.g., sampling location along the cli-matic gradient and seasonality, soil abiotic parameters, litterC/N content) and biotic components (e.g., microbial commu-nity, CO2 evolution, microbial biomass, qCO2, substrate uti-lization community-level physiological profile (CLPP),microbial functional diversity (H′), and bacteria (CFUs)),showed clear discrimination relative to the different sitesduring the different seasons (Fig. 6a, b). The two extremeenvironmental conditions, summer and winter, were found togreatly elucidate the seasonal effect on each of the variables(Fig. 6a). Moreover, the CLPP and MB were found to begreatly affected by the summer season. However, the winterseason was found to be most correlated to bacterial CFUs(Fig. 6a). Figure 6b elucidates the dissimilarity between thestudy sites. Microbial functional diversity (H′) was the highestat the HM site, while CLPP was found to be more correlatedwith the A site. Litter C/N ratio and bacterial CFUs wereaffected by the SA site, while CO2 evolution and microbialbiomass were most correlated with the M site.
Discussion
Few studies have examined the interactions of multipleclimate drivers on microbial functional responses [46]. Thepresent study allowed us to test the intensity of an abiotic“hammer” variable, such as rainfall, which plays one of themost important roles in the litter microbial community alonga climatic gradient integrated with wheat straw litter decom-position in a natural ecosystem. The different combinations
Table 5 Kinetic rate constants for dry weight loss at the different locations along the climatic gradient
Time period HM (K 10−3 day−1) M (K 10−3 day−1) SA (K 10−3 day−1) A (K 10−3 day−1)
Sep 2007–July 2008 1.4 2 0.4 1.9
July 2008–Oct 2009 0.6 0.8 0.1 0.2
HM humid Mediterranean, M Mediterranean, SA semi-arid, A arid
Straw Litter and Microbial Community Relations 407
0
100
200
300
400
500
600
700
800
900
1000
0
2
4
6
8
10
12
14
16
18
20
Sep.07 Feb.08 Jul.08 Oct.08 Jan.09 Jul.09 Oct.09
HM
0
100
200
300
400
500
600
700
800
900
1000
0
2
4
6
8
10
12
14
16
18
20
Sep.07 Feb.08 Jul.08 Oct.08 Jan.09 Jul.09 Oct.09
M
0
100
200
300
400
500
600
700
800
900
1000
0
2
4
6
8
10
12
14
16
18
20
Sep.07 Feb.08 Jul.08 Oct.08 Jan.09 Jul.09 Oct.09
SA
0
100
200
300
400
500
600
700
800
900
1000
0
2
4
6
8
10
12
14
16
18
20
Sep.07 Feb.08 Jul.08 Oct.08 Jan.09 Jul.09 Oct.09
A
b
a
b
a a
b
cc c c
a
cc
bbc
a
c
a
b
b c
a
a
c
d
b
d
c
a
c cc
b
cb
c
cd
a
d
a a
bb
a
CO
2ev
olu
tio
n (
µg
CO
2-C
g d
ry li
tter
-1h
-1)
Mic
rob
ial b
iom
ass
(µg
C g
dry
litt
er-1
)
Time (months)
Figure 2 Changes in meanvalues of CO2 evolution (lines)and microbial biomass(columns) during the studyperiod at different locationsalong the climatic gradient. HMhumid Mediterranean, MMediterranean, SA semi-arid,A arid. Bold letters representstatistically significant differen-ces (p<0.05) in mean valuesof CO2 evolution (microgramCO2–C per gram dry litter perhour) between months ateach site. The letters inside thecolumns represent statisticallysignificant differences (p<0.05)in mean values of microbialbiomass (microgram C pergram dry litter) betweenmonths at each site
408 C. Sherman, Y. Steinberger
0
200
400
600
800
1000
1200
0
5
10
15
20
25
30
35
40
45
50
55
Feb.08 Jul.08 Oct.08 Jan.09 Jul.09 Oct.09
0
200
400
600
800
1000
1200
0
5
10
15
20
25
30
35
40
45
50
55
Feb.08 Jul.08 Oct.08 Jan.09 Jul.09 Oct.09
0
200
400
600
800
1000
1200
0
5
10
15
20
25
30
35
40
45
50
55
Feb.08 Jul.08 Oct.08 Jan.09 Jul.09 Oct.09
0
200
400
600
800
1000
1200
0
5
10
15
20
25
30
35
40
45
50
55
Feb.08 Jul.08 Oct.08 Jan.09 Jul.09 Oct.09
HM
M
SA
A
b
c
b
a
cdc
b
cd
a
d
c
bc c
a
c
b
c
cd d
a
a
aa
a
a
a
a
a
a
aa
a
c
abc abcbc
ab
aab
b
ab
a
qC
O2
(µµg
CO
2–C
g-1
bio
mas
s-C
h-1
)
Time (months)
MB
/OM
Figure 3 Changes in meanvalues of qCO2 (lines) andmicrobial biomass(MB)/organic matter (OM)ratio (columns) during the studyperiod at different locationsalong the climatic gradient. HMhumid Mediterranean, MMediterranean, SA semi-arid,A arid. Bold letters representstatistically significant differen-ces (p<0.05) in mean valuesof qCO2 (milligram CO2–Cper gram biomass C per hour)between months at each site.The letters inside the columnsrepresent statistically signifi-cant differences (p<0.05) inmean values of MB/OMbetween months at each site
Straw Litter and Microbial Community Relations 409
of total rainfall and wheat straw litter quality, which under-went different changes during the study period at each site,caused changes and structural and functional exchanges inthe decomposing microbial community. In the present study,the difference in total amount of rainfall between the sitesalong the gradient had been found to be identical. In thepresent study, a positive and significant correlation betweenrainfall and microbial activity was established only at thearid site. Decomposition processes, including alteration inquality and quantity of plant litter, are a complex ecologicalsuccession conducted largely by a community of microor-ganisms whose collective activity is controlled by litterchemistry, nutrient availability, environmental conditions,and biotic interactions [40, 60]. Earlier studies [60, 64]discussed the importance of plant chemical componentsduring decomposition processes and examined the changes
in wheat straw composition during decay. Summerell andBurgess [58] demonstrated that wheat straw mass did notdecompose uniformly, and some components of the strawdisappeared more rapidly than others. McGuire and Tre-seder [46] mentioned three main phases of decompositionin relation to the dominant organic compounds present: Inthe early decomposition phase, soluble sugars are the dom-inant organic component. In the middle of the decomposi-tion process, cellulose and hemicellulose are available,while in the late decomposition phase, lignin is the dominantfraction. Our results showed that the utilization of the aro-matic carbon groups, which represent the recalcitrant com-ponent, increased during the latter stages of the litterdecomposition processes. Furthermore, McGuire and Tre-seder [46] assumed that the importance of microbial com-munity structure will increase as decomposition progresses,
0
50
100
150
200
250
HM M SA A HM M SA A HM M SA A HM M SA A HM M SA A HM M SA A
Feb.08 Jul.08 Oct.08 Jan.09 Jul.09 Oct.09
Time (months) and sites
CL
PP
(µg
CO
2-C
g d
ry li
tter
-1h
-1)
ASMH.onimA.yhobraC.xobraC.morA.onimA.yhobraC.xobraC.morA
Feb. 08 0a 0.29b 0.59a 1.59a Feb. 08 1.87b 7.79c 0.25b 1.59a
Jul. 08 0.22a 0.61ab 0.43a 0.97a Jul. 08 1.05b 11.58c 1.8b 3.58a
Oct. 08 0.1a 1.55a 1.14a 0.93a Oct. 08 3.53b 101.19ab 0.52b 12.09a
Jan. 09 1.1a 1.16ab 0.38a 0.72aJan. 09 1.07b 60.78b 0.06b 4.28a
Jul. 09 0.42a 1.54a 1.11a 2.05aJul. 09 19.32a 116.76a 7.0a 17.39a
Oct. 09 0.12b 7.43c 0.03b 0.40a
MArom. Carbox. Carbohy. Amino. A
Feb. 08 3.1b 9.21b 2.21ab 5.70ab Arom. Carbox. Carbohy. Amino.Jul. 08 1.16b 3.04b 0.73ab 1.63b Feb. 08 4.86b 11.0d 3.0ab 3.68a
Oct. 08 2.73b 27.38ab 0.68ab 3.85b Jul. 08 0.2c 38.8c 1.05b 4.94a
Jan. 09 1.1b 1.16ab 0.38a 0.72aOct. 08 5.5b 42.5c 1.84b 4.39a
Jul. 09 18.53a 67.67a 5.08a 20.07a Jan. 09 1.33bc 83.4b 0.25b 7.66a
Oct. 09 0.15b 1.19b 0.05b 0.19b Jul. 09 14.30a 152.5a 4.78a 28.03a
Figure 4 Changes in utilization ability of four carbon groups, carbohy-drates (gray square), amino acids (stripe square), carboxylic acids (blacksquare), and aromatic carboxylic acids (white square) during the study
period at all locations. Tables represent mean values of utilization ability ofthese four carbon groups during the study period at each site. Superscriptletters indicate significant differences (p<0.05) within a column
410 C. Sherman, Y. Steinberger
since fewer microbes possess enzymes for the degradationof the more recalcitrant organic compounds. This was sim-ilar to our findings.
Cornwell et al. [15] showed that the decomposition ratesdepend on both climate and the legacy of plant functional traitsas litter quality. Decomposition of recalcitrant compounds(resistant to degradation) such as lignin constitutes a “narrowprocess” that should be sensitive to community structure [46].
In the present study, seasonality was found to be one of themost significant features affecting litter decomposition, distin-guishing between the different study sites along the gradient. Inthe absence of precipitation, the microbial community takesadvantage and increases its activity at sites along the gradientwith effective dew formation, as shown by Kuehn and Sub-erkropp [41]. Long-term dew measurements of 17 years thatwere performed at Avdat and Sede Boqer in the Negev Desertshowed that the multiannual mean produced an amount equalto a total of 33 mm of rainfall, a yield of a mean of 195 dewynights per year, as was recorded at Avdat (arid research station)[22]. The data indicate that dewfall at the arid Negev Desertsite may exceed rain precipitation during extreme droughts andmay provide a consistent moisture supplement for some organ-isms throughout the year [23]. However, in the Mediterranean
zone, dew condensation is highly limited due to low relativehumidity in the area [38]. The largest contribution of dew tolitter moisture in the present study was at the arid site duringthe first summer season, as discussed by Kidron et al. [36] andHamadi et al. [29], who reported a high decomposition rate ofAvena sterilis on the surface litter along a topoclimatic gradientduring the first months of the study. The biphasic decomposi-tion obtained in the present study was similar to that reportedby Steinberger and Whitford [56] and Hamadi et al. [29], withhigh weight loss at the beginning of the process followed by asharp decrease as a result of chemical changes in the plant litter.Such changes may occur as a result of abiotic forces, such astemperature and photodegradation, with rainfall acting as amechanical force rather than primarily stimulating biologicalactivity [10]. In the present study, the decomposition rates atthe Mediterranean and arid sites were the highest. Althoughthe significant difference between total rainfall and biologicalactivity (CO2 evolution, microbial biomass, and bacterialCFUs) was high at the Mediterranean site compared to thearid site, other climatic conditions, such as breezes and highradiation, might affect weight loss at those two sites.
In order to provide a reliable soil microbial parameter fordescribing changes in man-made ecosystems, Insam et al. [34]
Figure 5 Changes in meanvalues of bacterial CFUs duringthe study period at differentlocations along the climaticgradient. HM humidMediterranean, MMediterranean, SA semi-arid,A arid. Letters represent statis-tically significant differences(p<0.05) in mean valuesof bacterial CFUs (g drylitter×106) between monthsat each site
Straw Litter and Microbial Community Relations 411
found that changes in climatic conditions influence the ratiobetween Cmic and Corg. Accordingly, in our study, the micro-bial community associated with plant litter decompositionreached a steady state with a constant low rate in decomposi-tion, known as the stationary phase. In view of that, the
changes in the MB/OM ratio during the fast decompositionlag-phase period elucidate the interplay between abioticparameters (temperature, precipitation, and radiation) and lit-ter components on the microbial substrate utilization profile.In the late phase of decomposition, however, the highest ratioof MB/OM was obtained at all study sites. The changes in thedecomposition process along the climatic gradient exposedthe different characteristics in the different ecosystems, thusreflecting the dynamics in decomposer microorganisms andthe organic compounds, which may be less degradable in thelater stages, as revealed in the CLPP components [9, 47, 68].The characterization of soil heterotrophic microbial commu-nities according to their sole carbon-source utilization profileshas been widely performed with the Biolog method [27].Schimel et al. [51] used this method in decomposing birchlitter and found that episodic drying and rewetting decreasedthe number of Biolog substrates used. Kunito and Nagaoka[42] also used the Biolog method to investigate the effects ofplant litter type and nutrient addition on bacterial CLPP.Degens and Harris [17] developed a method that evaluatesmicrobial catabolic diversity in whole soil samples rather thansoil extracts, and the MicroResp™ technique was subsequent-ly developed by Campbell et al. [11] in order to allow rapidassessment of catabolic profiles of whole soil samples. In thepresent study, the results obtained by using the MicroResp™technique for litter (as a substrate) were comparable to theoutcome of the other studies mentioned above.
The biphasic decomposition pattern was found to be one ofthe most common features representing plant litter decomposi-tion, as mentioned by Steinberger andWhitford [56], Jama andNair [35], Hamadi et al. [29], and others. In the present study,the catabolic profile exhibits changes in the microbial commu-nity structure during the two phases of relatively high lignin-content plant decomposition.Whitford et al. [67] suggested thatthe development of a model in which the climate variable canbe used to predict decomposition processes should be an im-portant task that will allow comparison between different eco-systems. Microbial biomass alone may not always predictfluxes of nutrients from plant litter decay. In many cases, thediversity of microbial species, functional groups, or both maybe important in determining the rates of ecosystem functions,particularly under non-stable environmental conditions [46].Shifts in the community structure of microbes would elicit achange in ecosystem process rates, specifically decomposition,even when microbial biomass remains constant [46]. The stud-ies on microbial catabolic diversity conducted along climaticgradients were limited mainly due to the great distances be-tween the different climatic zones, as shown by Staddon et al.[54] in Canada; thus, this restriction yielded studies limited toshort-scale gradients, or alternatively, to the investigation ofextremes, instead of real gradients [31]. Fukami and Wardle[26] showed that natural gradients are useful in predicting long-term consequences of human-induced environmental changes.
a.
b.
-1.0 1.0
1.5
-1.0
C/N
bacteria CFUCO2 evol.
MB
qCO2
H’
CLPP
Aut
Win
Sum
1.0-0.8
-0.8
1.0
C/Nbacteria CF U
CO2 evol.MB
qCO2
H’
CLPP
HM
M
SA
A
Figure 6 Redundancy analysis relating the seasonality (rainy versus dryseasons) (a) and sampling location (b) along the climatic gradient to litterabiotic and biotic parameters (C/N carbon/nitrogen ratio, CO2 evol. CO2
evolution,MBmicrobial biomass, qCO2 metabolic quotient,H′ Shannon–Weaver index, CLPP community-level physiological profile, bacterialCFUs bacteria count). Sampling location and season are indicated bysolid lines while parameters are indicated by dashed lines
412 C. Sherman, Y. Steinberger
Gradients encompassing a wide range of spatially connectedenvironmental conditions and communities, e.g., geographicgradients, would be competent frameworks for exploring theeffects of environmental dynamics, as well as potential climatechanges, on soil microbial function [47]. Climatic gradientswith different environmental components, such as altitude,topography, temperature, and precipitation, provide a usefulframework for studying the effects of climate change, as dis-cussed by Diaz and Cabido [18] and Dunne et al. [20]. In thegradient with four different natural environments, studied in thepresent research, a diverse microbial CLPP was found. In thearid ecosystem, the low levels of organic matter might be thereason for relatively high utilization of organic matter withoutany inconsistency in its composition. At the humid Mediterra-nean site, the frequency of easily decomposed organic matterinput is relatively high and wheat straw may, therefore not bethe favorable substrate, thus resulting in relatively low values ofcarbon-source utilization. The increase in carboxylic acid utili-zation at the arid site during the study period can be explainedaccording to Christian et al. [14], who claimed that organicacids such as carboxylic acids are often a product of bacterialfatty acid catabolism, photochemical degradation of high mo-lecular weight dissolved organic carbon, or an end product offermentative metabolism. As the decomposition processes con-tinue, the easily decomposed fraction of the material is con-sumed, and other groups of bacteria and fungi begin to utilizethe fraction that is harder to decompose [46]. Fungi can survivedrought stress better than bacteria due to their ability to grow atlower matrix potentials [30], and bacteria may be activelyinhibited by the rapidly growing fungi [51].
RDA was performed in order to summarize the resultsfound in this study and their relative contribution to microbialactivity in the four different ecosystems. Autumn and winterwere the favorite periods for the bacterial community, whilesummer was more favorable for the litter microbial commu-nity (MB), which included the fungi population. High fungalactivity during the dry season was reported by Oren andSteinberger [47]. Shamir and Steinberger [52] found similarresults, elucidating the effect of moisture availability and in-crease in temperature toward the driest seasons in arid environ-ment. This affected soil microbial activity and can change theratio between bacterial and fungal biomass, resulting in a largedecrease in their value. Microbial functional diversity (H′) wasfound to be correlated to the most humid site, while substrateutilization was more related to the arid site, where any source ofcarbon is rapidly consumed as hypothesized. According to thepresent study, the Mediterranean site seems to be the mostsuitable place for microbial activity and litter decomposition.
Our research elucidates the complex interplay betweenmicrobial community litter decomposition and climatic fea-tures, enhancing the importance of “hammer” and “anvil”units and the interplay between them as one of the mostimportant factors determining biotic composition, activity,
and decomposition processes. This supports our hypothesisthat the correlation between total amount of rainfall and soilmicrobial community will increase as we move from a humidMediterranean to a xeric ecosystem. In such a process, inwhich a multidimensional complex permutation in time andspace exists, nutrient availability and its components for pri-mary producers will be determined. Further studies are neededin order to understand the partial contribution of plant littercomposition and the interaction between all the components.
Acknowledgments This research is part of the Ph.D. thesis of ChenSherman. We wish to thank Mrs. Gineta Barness for technical assistanceand Ms. Sharon Victor for her useful comments. Special thanks to Dr.Marcelo Sternberg for useful advice and for allowing us to use theGLOWA Jordan River Project study sites. This research was supportedby the Israel Science Foundation (grant number 1272/08).
References
1. Aerts R (1997) Climate, leaf litter chemistry and leaf litter decompo-sition in terrestrial ecosystems: a triangular relationship (mini-review).Oikos 79:439–449
2. Anderson TH, Domsch KH (1993) The metabolic quotient for CO2
(qCO2) as a specific activity parameter to assess the effects ofenvironmental conditions, such as pH, on the microbial biomass offorest soils. Soil Biol Biochem 25:393–395
3. Anderson TH,DomschKH (1989) Ratios ofmicrobial biomass carbonto total organic carbon in arable soils. Soil Biol Biochem 21:471–479
4. AnejaMK, Sharma S, Fleischmann F, Stich S, HellerW, BahnwegG,Munch JC, Schloter M (2006) Microbial colonization of beech andspruce litter—influence of decomposition site and plant litter specieson the diversity of microbial community. Microb Ecol 52:127–135
5. Austin AT, Vivanco L (2006) Plant litter decomposition in a semi-arid ecosystem controlled by photodegradation. Nature 442:555–558
6. Beare MH, Neely CL, Coleman DC, Hargrove WL (1991) Char-acterization of a substrate-induced respiration method for measur-ing fungal, bacterial and total microbial biomass on plant residues.Agric Ecosyst Environ 34:65–73
7. Ben-Gai T, Bitan A, Manes A, Alpert P, Rubin S (1998) Spatialand temporal changes in rainfall frequency distribution patterns inIsrael. Theor Appl Climatol 61:177–190
8. Berg B, Berg MP, Bottner P, Box E, Breymeyer A, Deanta RC,Couteaux M, Escudero A, Gallardo A, Kratz W, Madeira M,Malkonen E, McClaugherty C, Meentemeyer V, Munoz F, PiussiP, Remacle J, Desanto AV (1993) Litter mass loss rates in pineforests of Europe and eastern United States—some relationshipswith climate and litter quality. Biogeochemistry 20:127–159
9. Berg N, Steinberger Y (2010) Are biological effects of desertshrubs more important than physical effects on soil microorgan-isms? Microb Ecol 59:121–129
10. Brandt LA, King JY, Hobbie SE, Milchunas DG, Sinsabaugh RL(2010) The role of photodegradation in surface litter decompositionacross a grassland ecosystem precipitation gradient. Ecosystems13:765–781
11. Campbell CD, Chapman SJ, Cameron CM, Davidson MS, Potts JM(2003) A rapid microtiter plate method to measure carbon dioxideevolved from carbon substrate amendments so as to determine thephysiological profiles of soil microbial communities by using wholesoil. Appl Environ Microbiol 69:3593–3599
12. Chapin FS, Zavaleta ES, Eviner VT, Naylor RL, Vitousek PM,Reynolds HL, Hooper DU, Lavorel S, Sala OE, Hobbie SE, Mack
Straw Litter and Microbial Community Relations 413
MC, Diaz S (2000) Consequences of changing biodiversity. Nature405:234–242
13. Chapman SK, Newman GS (2010) Biodiversity at the plant–soilinterface: microbial abundance and community structure respondto litter mixing. Oecologia 162:763–769
14. Christian BW, Lind OT (2007) Multiple carbon substrate utilizationby bacteria at the sediment-water interface: seasonal patterns in astratified eutrophic reservoir. Hydrobiologia 586:43–56
15. Cornwell WK, Cornelissen JHC, Amatangelo K, Dorrepaal E,Eviner VT, Godoy O, Hobbie SE, Hoorens B, Kurokawa H,Perez-Harguindeguy N, Quested HM, Santiago LS, Wardle DA,Wright IJ, Aerts R, Allison SD, van Bodegom P, Brovkin V,Chatain A, Callaghan TV, Diaz S, Garnier E, Gurvich DE, KazakouE, Klein JA, Read J, Reich PB, Soudzilovskaia NA, Vaieretti MV,WestobyM (2008) Plant species traits are the predominant control onlitter decomposition rates within biomes worldwide. Ecol Lett11:1065–1071
16. De Leij FAAM, Whipps JM, Lynch JM (1994) The use of colonydevelopment for the characterization of bacterial communities insoil and on roots. Microb Ecol 27:81–97
17. Degens BP, Harris JA (1997) Development of a physiological ap-proach to measuring the catabolic diversity of soil microbial commu-nities. Soil Biol Biochem 29:1309–1320
18. Diaz S, Cabido M (1997) Plant functional types and ecosystemfunction in relation to global change. J Veg Sci 8:463–474
19. Dilly O, Blume HP, Munch JC (2003) Soil microbial activities inLuvisols and Anthrosols during 9 years of region-typical tillageand fertilisation practices in northern Germany. Biogeochemistry65:319–339
20. Dunne JA, Harte J, Taylor KJ (2003) Subalpine meadow floweringphenology responses to climate change: integrating experimentaland gradient methods. Ecol Monogr 73:69–86
21. Emmett BA, Beier C, Estiarte M, Tietema A, Kristensen HL,Williams D, Penuelas J, Schmidt I, Sowerby A (2004) The re-sponse of soil processes to climate change: results from manipu-lation studies of shrublands across an environmental gradient.Ecosystems 7:625–637
22. Evenari M (1981) Ecology of the Negev Desert: a critical reviewof our knowledge. In: Shuval H (ed) Developments in arid zoneecology and environmental quality. Balaban ISS, Philadelphia, pp1–33
23. Evenari M, Shanan L, Tadmor N (1971) The Negev: the challengeof a desert. Harvard University Press, Cambridge
24. Fleischer A, Sternberg M (2006) The economic impact of globalclimate change onMediterranean rangeland ecosystems: a space-for-time approach. Ecol Econom 59:287–295
25. Fliessbach A, Mader P (2000) Microbial biomass and size-densityfractions differ between soils of organic and conventional agriculturalsystems. Soil Biol Biochem 32:757–768
26. Fukami T, Wardle DA (2005) Long-term ecological dynamics:reciprocal insights from natural and anthropogenic gradients. ProcRoy Soc B-Biol Sci 272:2105–2115
27. Garland JL, Mills AL (1991) Classification and characterization ofheterotrophic microbial communities on a basis of patterns ofcommunity-level sole-carbon–source utilization. Appl EnvironMicrobiol 57:2351–2359
28. Gessner MO, Swan CM, Dang CK, Mckie BG, Bardgett RD, WallDH, Hattenschwiler S (2010) Diversity meets decomposition.Trends Ecol Evol 25:372–380
29. Hamadi Z, Steinberger Y, Kutiel P, Lavee H, Barness G (2000)Decomposition of Avena sterilis litter under arid conditions. J AridEnviron 46:281–293
30. Harris RF (1981) Effect of water potential on microbial growth andactivity. In: Parr JF, Gardner WR, Elliott LF (eds) Water potentialrelations in soil microbiology. Soil Science Society of America,Madison, pp 23–95
31. Holzapfel C, Tielborger K, Parag HA, Kigel J, Sternberg M (2006)Annual plant–shrub interactions along an aridity gradient. BasicAppl Ecol 7:268–279
32. Houghton JT, Ding Y, Griggs DJ, Noguer M, van der Linden PJ, DaiX, Maskell K, Johnson CA (2001) Climate change 2001: the scien-tific basis. Contribution of working group 1 to the third assessmentreport of the intergovernmental panel on climate change. CambridgeUniversity Press, Cambridge
33. Hui D, Luo Y (2004) Evaluation of soil CO2 production and transportin Duke Forest using a process-based modeling approach. GlobBiogeochem Cycles 18:GB4029
34. Insam H, Parkinson D, Domsch KH (1989) Influence of macroclimateon soil microbial biomass. Soil Biol Biochem 21:211–221
35. Jama BA, Nair PKR (1996) Decomposition- and nitrogen-mineralization patterns of Leucaena leucocephala and Cassiasiamea mulch under tropical semiarid conditions in Kenya. PlantSoil 179:275–285
36. Kidron GJ, Herrnstadt I, Barzilay E (2002) The role of dew as amoisture source for sand microbiotic crusts in the Negev Desert,Israel. J Arid Environ 52:517–533
37. Kominoski JS, Hoellein TJ, Kelly JJ, Pringle CM (2009) Doesmixing litter of different qualities alter stream microbial diversityand functioning on individual litter species? Oikos 118:457–463
38. Kosmas C, Danalatos NG, Poesen J, van Wesemael B (1998) Theeffect of water vapour adsorption on soil moisture content underMediterranean climatic conditions. Agric Water Manage 36:157–168
39. Kourtev PS, Ehrenfeld JG, Haggblom M (2002) Exotic plantspecies alter the microbial community structure and function inthe soil. Ecology 83:3152–3166
40. Kowalchuk GA, Buma DS, de Boer W, Klinkhamer PGL, vanVeen JA (2002) Effects of above-ground plant species compositionand diversity on the diversity of soil-borne microorganisms. AntonLeeuw Int J Gen Mol Microbiol 81:509–520
41. Kuehn KA, Suberkropp K (1998) Diel fluctuations in rates of CO2
evolution from standing dead leaf litter of the emergent macrophyteJuncus effusus. Aquat Microb Ecol 14:171–182
42. Kunito T, Nagaoka K (2009) Effects of plant litter type andadditions of nitrogen and phosphorus on bacterial community-levelphysiological profiles in a brown forest soil. Microbes Environ24:68–71
43. Kurz-Besson C, Couteaux MM, Berg B, Remacle J, Ribeiro C,Romanya J, Thiery JM (2006) A climate response functionexplaining most of the variation of the forest floor needle massand the needle decomposition in pine forests across Europe. PlantSoil 285:97–114
44. LeRoy CJ, Marks JC (2006) Litter quality, stream characteristicsand litter diversity influence decomposition rates and macroinver-tebrates. Freshwater Biol 51:605–617
45. Liski J, Nissinen A, Erhard M, Taskinen O (2003) Climatic effectson litter decomposition from arctic tundra to tropical rainforest.Glob Change Biol 9:575–584
46. McGuire KL, Treseder KK (2010) Microbial communities andtheir relevance for ecosystem models: decomposition as a casestudy. Soil Biol Biochem 42:529–535
47. Oren A, Steinberger Y (2008) Catabolic profiles of soil fungalcommunities along a geographic climatic gradient in Israel. SoilBiol Biochem 40:2578–2587
48. Salamanca EF, Kaneko N, Katagiri S (2003) Rainfall manipulationeffects on litter decomposition and the microbial biomass of theforest floor. Appl Soil Ecol 22:271–281
49. Sarah P, Rodeh Y (2004) Soil structure variations under manipula-tions of water and vegetation. J Arid Environ 58:43–57
50. Schaefer D, Steinberger Y, Whitford WG (1985) The failure ofnitrogen and lignin control of decomposition in a North Americandesert. Oecologia 65:382–386
414 C. Sherman, Y. Steinberger
51. Schimel JP, Gulledge JM, Clein-Curley JS, Lindstrom JE, BraddockJF (1999) Moisture effects on microbial activity and communitystructure in decomposing birch litter in the Alaskan taiga. Soil BiolBiochem 31:831–838
52. Shamir I, Steinberger Y (2007) Vertical distribution and activity ofsoil microbial population in a sandy desert ecosystem. MicrobEcol53:340–347
53. Sharma S, Rangger A, Insam H (1998) Effects of decomposingmaize litter on community level physiological profiles of soilbacteria. Microb Ecol 35:301–310
54. Staddon WJ, Trevors JT, Duchesne LC, Colombo CA (1998) Soilmicrobial diversity and community structure across a climaticgradient in western Canada. Biodivers Conserv 7:1081–1092
55. Steinberger Y, Shmida A, Whitford WG (1990) Decompositionalong a rainfall gradient in the Judean Desert, Israel. Oecologia82:322–324
56. Steinberger Y, Whitford WG (1988) Decomposition processes inthe Negev ecosystem. Oecologia (Berl) 75:61–66
57. Strojan CL, Randall DC, Turner FB (1987) Relationship of leaflitter decomposition rates to rainfall in the Mojave Desert. Ecology68:741–744
58. Summerell BA, Burgess LW (1989) Decomposition and chemicalcomposition of cereal straw. Soil Biol Biochem 21:551–559
59. Swan CM, Palmer MA (2004) Leaf diversity alters litter breakdownin a Piedmont stream. J North Am Benthol Soc 23:15–28
60. Swift MJ, Heal OW, Anderson JM (1979) Decomposition in ter-restrial ecosystems. Blackwell Scientific, Oxford
61. Talmon Y, Sternberg M, Grunzweig JM (2011) Impact of rainfallmanipulations and biotic controls on soil respiration in Mediterra-nean and desert ecosystems along an aridity gradient. Glob ChangeBiol 17:1108–1118
62. Taylor BR,Mallaley C, Cairns JF (2007) Limited evidence that mixingleaf litter accelerates decomposition or increases diversity of decom-posers in streams of eastern Canada. Hydrobiologia 592:405–422
63. ter Braak CJF (2005) Biometris—quantitative methods in the life andearth sciences plant research international. Wageningen Universityand Research Centre, Wageningen
64. Tripathi SK, Singh KP (1992) Abiotic and litter quality controlduring the decomposition of different plant parts in dry tropicalbamboo savanna in India. Pedobiologia 36:241–256
65. Tukey HBJ (1970) Leaching of substances from plants. Annu RevPlant Physiol 21:305–332
66. Whitford WG (2002) Ecology of desert systems. Academic, NewYork
67. Whitford WG, Steinberger Y, Mackay W, Parker LW, Freckman D,Wallwork JA, Weems D (1986) Rainfall and decomposition in theChihuahuan Desert. Oecologia 68:512–515
68. Zak JC, Willig MR, Moorhead DL, Wildman HG (1994) Functionaldiversity of microbial communities: a quantitative approach. SoilBiol Biochem 26:1101–1108
Straw Litter and Microbial Community Relations 415