Embed Size (px)
Citation preview
BGD8 1275ndash1308 2011
Microbial food webdynamics along a soilchronosequence of a
glacier forefield
J Esperschutz et al
Title Page
Abstract Introduction
Conclusions References
Tables Figures
J I
J I
Back Close
Full Screen Esc
Printer-friendly Version
Interactive Discussion
Discussion
Paper
|D
iscussionP
aper|
Discussion
Paper
|D
iscussionP
aper|
Biogeosciences Discuss 8 1275ndash1308 2011wwwbiogeosciences-discussnet812752011doi105194bgd-8-1275-2011copy Author(s) 2011 CC Attribution 30 License
BiogeosciencesDiscussions
This discussion paper ishas been under review for the journal Biogeosciences (BG)Please refer to the corresponding final paper in BG if available
Microbial food web dynamics along a soilchronosequence of a glacier forefield
J Esperschutz12 A Perez-de-Mora12 K Schreiner2 G Welzl3 F Buegger4J Zeyer5 F Hagedorn6 J C Munch14 and M Schloter12
1Technical University Munich ndash Chair of Soil Ecology Center of Life and Food SciencesWeihenstephan Ingolstaedter Landstr 1 85764 Neuherberg Germany2Helmholtz Zentrum Munchen GmbH German Research Center for Environmental HealthDepartment of Terrestrial Ecogenetics Ingolstaedter Landstr 1 85764 Neuherberg Germany3Helmholtz Zentrum Munchen GmbH German Research Center for Environmental HealthInstitute of Developmental Genetics Ingolstaedter Landstr 1 85764 Neuherberg Germany4Helmholtz Zentrum Munchen GmbH German Research Center for Environmental HealthInstitute of Soil Ecology Ingolstaedter Landstr 1 85764 Neuherberg Germany5ETH Zurich Institute of Biogeochemistry and Pollutant Dynamics Universitatstrasse 16CHN 8092 Zurich Switzerland
1275
BGD8 1275ndash1308 2011
Microbial food webdynamics along a soilchronosequence of a
glacier forefield
J Esperschutz et al
Title Page
Abstract Introduction
Conclusions References
Tables Figures
J I
J I
Back Close
Full Screen Esc
Printer-friendly Version
Interactive Discussion
Discussion
Paper
|D
iscussionP
aper|
Discussion
Paper
|D
iscussionP
aper|
6WSL Birmensdorf Swiss Federal Institute for Forest Snow and Landscape ResearchZurcherstrasse 111 8903 Birmensdorf Switzerland
Received 11 January 2011 ndash Accepted 23 January 2011 ndash Published 10 February 2011
Correspondence to J Esperschutz (juergenesperschuetzhelmholtz-muenchende)
Published by Copernicus Publications on behalf of the European Geosciences Union
1276
BGD8 1275ndash1308 2011
Microbial food webdynamics along a soilchronosequence of a
glacier forefield
J Esperschutz et al
Title Page
Abstract Introduction
Conclusions References
Tables Figures
J I
J I
Back Close
Full Screen Esc
Printer-friendly Version
Interactive Discussion
Discussion
Paper
|D
iscussionP
aper|
Discussion
Paper
|D
iscussionP
aper|
Abstract
Microbial food webs are critical for efficient nutrient turnover providing the basis forfunctional and stable ecosystems However the successional development of such mi-crobial food webs and their role in ldquoyoungrdquo ecosystems is unclear Due to a continuousglacier retreat since the middle of the 19th century glacier forefields have expanded of-5
fering an excellent opportunity to study food web development at differently developedsoils In the present study litter degradation and the corresponding C fluxes into micro-bial communities were investigated along the forefield of the Damma glacier (Switzer-land) 13C-enriched litter of the pioneering plant Leucanthemopsis alpina (L) Heywoodwas incorporated into the soil at sites that have been free from ice for approximately 1010
60 100 and more than 700 years The structure and function of microbial communi-ties were identified by 13C analysis of phospholipid fatty acids (PLFA) and phospholipidether lipids (PLEL) Results showed increasing microbial diversity and biomass andenhanced proliferation of bacterial groups as ecosystem development progressed Ini-tially litter decomposition proceeded faster at the more developed sites but at the end15
of the experiment loss of litter mass was similar at all sites once the more easily-degradable litter fraction was processed As a result incorporation of 13C into microbialbiomass was more evident during the first weeks of litter decomposition 13C enrich-ments of both PLEL and PUFA biomarkers following litter incorporation were observedat all sites suggesting similar microbial foodwebs at all stages of soil development20
Nonetheless the contribution of bacteria and actinomycetes to litter turnover becamemore pronounced as soil age increased in detriment of archaea fungi and protozoamore prominent in recently deglaciated terrain
1 Introduction
Glaciers are retreating in many mountainous areas of the world due to global warm-25
ing (Oerlemans 2005) leaving behind new terrestrial habitats that are colonized by
1277
BGD8 1275ndash1308 2011
Microbial food webdynamics along a soilchronosequence of a
glacier forefield
J Esperschutz et al
Title Page
Abstract Introduction
Conclusions References
Tables Figures
J I
J I
Back Close
Full Screen Esc
Printer-friendly Version
Interactive Discussion
Discussion
Paper
|D
iscussionP
aper|
Discussion
Paper
|D
iscussionP
aper|
organisms (Bardgett et al 2007) This is usually a gradual process that results in achronosequence The latter can be defined as a set of soils that share a commoncommunity of organisms climate parent material and slope but differ in regard withthe length of time that materials have been exposed to weathering and soil formationAs glaciers recede parent materials become exposed and physical and biogeochemi-5
cal weathering convert primary minerals to secondary minerals releasing plant nutrientelements in soluble forms Initially the newly exposed surface typically has a high pro-portion of rocks lacks vegetation is sandy and contains few nutrients (Schutte et al2009) As substrate colonization by plants and microorganisms occurs organic mate-rial starts to accumulate that can be further transformed as a result complex food webs10
develop and stratification into horizons of increasing physical and chemical complexitybecomes more prominent (Chapin et al 1994 Bardgett et al 2007) These featuresmake chronosequences ideal to study the initial and successional stages of soil andecosystem development as well as the role of plant-microbe interactions at differenttime points of soil evolution15
Various studies in alpine regions have recently provided novel insights into microbialcommunity dynamics and their importance in nutrient cycling in these environmentsFor instance extensive colonization of granite surfaces could play a crucial role in initialsoil formation and mineral dissolution (Frey et al 2010) but also wind-driven transportof organic material (insects grasses seeds) has to be considered (Jumpponen et20
al 1999) Although the first phase of soil development is dominated by geologicaland chemical processes also biology plays a major role For example autotrophicfixation of C is also known to be an important process during the early stages of soilformation providing in turn nutrient sources for heterotrophic microorganisms (Walkerand del Moral 2003) Diazotrophic communities have been shown to be highly diverse25
following glacier retreat and could have a major role in N cycling in these ecosystems(Duc et al 2009) Heterotrophic communities may also be highly abundant at initial soilstages (Tscherko et al 2003) for instance in response to ancient C released duringglacier retreat Microbial communities in glacier forefields have also been shown to
1278
BGD8 1275ndash1308 2011
Microbial food webdynamics along a soilchronosequence of a
glacier forefield
J Esperschutz et al
Title Page
Abstract Introduction
Conclusions References
Tables Figures
J I
J I
Back Close
Full Screen Esc
Printer-friendly Version
Interactive Discussion
Discussion
Paper
|D
iscussionP
aper|
Discussion
Paper
|D
iscussionP
aper|
respond to changes in ecosystem development (eg C and N content) and vegetation(Tscherko et al 2005 Miniaci et al 2007)
Pioneer plants can strongly alter parent materials and stimulate microbe-plant inter-actions through root morphology rhizodeposition and litter production (Bardgett et al1999 Bardgett and Walker 2004) The plant residues are transformed by microor-5
ganisms into humus and other new organic substances enhancing the capacity of thesoil to hold water and nutrients This positive feedback accelerates the developmentof more complex plant communities and microbial food web structures (Edwards et al2006) Rhizodeposits of pioneering plants such as Leucanthemopsis alpina (L) Hey-wood (L alpina) have been shown to cause significant shifts in the microbial community10
structure of rhizosphere soil compared to bulk soil at glacier forefields (Edwards et al2006) Due to their simple molecular structure root exudates are readily assimilable bysingle microbes (Baudoin et al 2003) By contrast the transformation of litter requiresdifferent specialized microorganisms acting as functional units to degrade substanceslike lignin or cellulose (Dilly et al 2004 Fioretto et al 2005) Although microbial in-15
teractions during litter degradation might be critical for ecosystem development in suchscenarios (Bardgett and Walker 2004) little is known about microbial dynamics of thisprocess and the main players involved
To improve our understanding of litter degradation and the role of microbial com-munities during the initial stages of soil and ecosystem formation a field incubation20
experiment using 13C labelled plant litter was carried out in a chronosequence in theDamma Glacier forefield (Switzerland) Plant litter of L alpina was incubated into soilat different locations in the forefield of the Damma Glacier because L alpina was pre-viously described as a pioneering plant in this area (Edwards et al 2006 Miniaci et al2007) Microbes involved in litter degradation were identified by following the 13C label25
into phospholipid fatty acids (PLFA) and phospholipid ether lipids (PLEL) (Gattinger etal 2003 White et al 1979 Zelles 1999) We hypothesized a different and morecomplex microbial community structure as soil development progresses In additionwe expected litter degradation rates to increase accordingly along the chronosequence
1279
BGD8 1275ndash1308 2011
Microbial food webdynamics along a soilchronosequence of a
glacier forefield
J Esperschutz et al
Title Page
Abstract Introduction
Conclusions References
Tables Figures
J I
J I
Back Close
Full Screen Esc
Printer-friendly Version
Interactive Discussion
Discussion
Paper
|D
iscussionP
aper|
Discussion
Paper
|D
iscussionP
aper|
as a result of better developed microbial foodwebs To test this litter degradation andincorporation of 13C-labelled litter products by microbial communities were studied atfour different locations (10 60 100 and 700 years old) in bulk and litter amended soil
2 Material and methods
21 Production of labelled plant litter5
L alpina was sowed in plastic pans filled with prick out substrate in a greenhouseapproach Seeds were watered daily and incubated for 8ndash10 days at +20+15 C(daynight) and 75ndash85 relative humidity until germination Subsequently plants weretransferred into plastic pots (4 plants per pot) of 12 cm in diameter filled with a mixtureof potting soil expanded clay and silica sand (112 vvv) The pots were placed in a10
transparent EFTE-plastic tent (ethylene-tetrafluorethylene film thickness 80 microm KochMembranen GmbH 83253 Germany volume sim7000 L) and subjected to a photope-riodic day length of 14 h (additional light by sodium vapour discharge lamps SONTAgro 400 Philips NL) Temperature was kept around +25+18 C (daynight) and rel-ative humidity between 75ndash85 Irrigation was performed daily via irrigation tubes15
(500 mL24 h12 pots) Twice a week 500 mL of Hoagland based fertilizer was addedafter irrigation (Hoagland 1920) The 13C labelling was performed according to Esper-schutz et al (2009a) In brief CO2 concentration in the tent atmosphere was reducedby plant photosynthesis during the daytime When the CO2 concentration in the tentdropped below 350 micromol mol1 enriched 13CO2 (δ13C = +170permil vs Vienna-Pee Dee20
Belemnite Air Liquide Dusseldorf Germany) was added to the tent atmosphere untilCO2 concentration reached 400 micromol mol1 Using this experimental setup an enriched13C atmosphere of +90permil to +110permil V-PDB was established inside the tent At nighttime the tent atmosphere was pumped through vials containing soda lime (sodiumand calcium hydroxide) using a membrane pump (N 01353 AN18 KNF Neuberger25
Freiburg Germany) with a flow of 200 L minminus1 to reduce the CO2 produced by the plant
1280
BGD8 1275ndash1308 2011
Microbial food webdynamics along a soilchronosequence of a
glacier forefield
J Esperschutz et al
Title Page
Abstract Introduction
Conclusions References
Tables Figures
J I
J I
Back Close
Full Screen Esc
Printer-friendly Version
Interactive Discussion
Discussion
Paper
|D
iscussionP
aper|
Discussion
Paper
|D
iscussionP
aper|
dark respiration The CO2 depleted air was pumped into the closed tent again Thesystem capacity ensured a stable CO2-concentration of 350 micromol molminus1 over night TheCO2 concentration of the inner and outer tent atmosphere (daynight) was measuredcontinuously with a photo acoustic CO2-controller (7MB1300 Siemens Germany cal-ibration at 400 to 600 micromol molminus1plusmn2) The labelled plants were harvested before5
flowering after a total growth time of 10 weeks Leaves and stems were oven-dried(60 C) homogenized and shredded (05ndash20 cm) The obtained labelled plant litter ofL alpina (δ13C = 884plusmn16permil vs VPDB) was used in the following experiment
22 Experimental setup
The experiment was carried out in the forefield of the Damma glacier around10
2100 m asl It is located in the canton Uri in Switzerland (N 46 38177prime E 008 27677prime)facing northeast The climate of the area is characterized by a short vegetation period(mid of June to end of September) and approximately 2400 mm of rainfall per year Ithas a total length of 235 km and a total area of 509 km2 (measured in 1973) Sincethe beginning of measurements in 1921 the Damma glacier has retreated at an aver-15
age rate of 11 m per year A detailed site description and site investigation has beendone by the BigLink project (httpwwwccesethzchprojectsclenchBigLink) Basedon this systematic measurements as well as the Swiss Glacier monitoring network(httpglaciologyethzchmessnetz glaciersdammahtml) three locations in the fore-field of known exposure time since glacier retreat were chosen (a) the first location20
near the glacier tongue (N 46 38177prime E 008 27677prime) with an exposure time of approx-imately 10 years (T1) (b) a second location (T2) below the 1992 moraine free of ice fornearly 60 years (N 46 38177prime E 008 27677prime) and (c) a third location near the 1928moraine (N 46 38177prime E 008 27677prime) estimated to be ice free for around 100 years(T3) Outside the forefield a fourth location (T4) (N 46 38177prime E008 27677prime) free25
from ice for at least 700 years served as reference site (Egli et al 2001) Accordingto Hammerli et al (2007) the bedrock material is Aargranite and surface conditions
1281
BGD8 1275ndash1308 2011
Microbial food webdynamics along a soilchronosequence of a
glacier forefield
J Esperschutz et al
Title Page
Abstract Introduction
Conclusions References
Tables Figures
J I
J I
Back Close
Full Screen Esc
Printer-friendly Version
Interactive Discussion
Discussion
Paper
|D
iscussionP
aper|
Discussion
Paper
|D
iscussionP
aper|
vary between fine fluvial sands and coarse sandy areas The soil in the forefield canbe classified as poorly developed regosols with 764 to 837 of sand 108 to 157of silt and 55 to 79 of clay (Lazzaro et al 2009 Towe et al 2010) Soil pH rangedfrom 43 to 56 the lowest value was detected at the reference site T4 Increasing con-centrations of total C and total N from 011 to 650 and from 0004 to 04425
respectively were observed as ecosystem development progressed The soil δ13Cvalue was on average minus27permil vs V-PDB at all locations (Table 1)
Following snow melt in the beginning of June 2008 tubes made of aluminium (20 cmin diameter and 14 cm high) were installed 10 cm deep into the soil and replicated 5times at every location (T1ndashT4) Every replicate was composed of three independent10
tubes two for soil analysis and one for litterbag study In the tubes for soil analysisplant litter (5 g oven-dried) was applied directly below the vegetation cover (2ndash5 cmdepth) For the litter bag experiment two litter bags (mesh-size 40 microm) with 25 g ofoven-dried plant material per bag were placed at a similar depth as with the directlitter application Every tube was protected with steel grids (mesh size 5 mm) against15
disturbancesEight and 12 weeks after litter application one litter bag and one of the tubes con-
taining directly applicated litter was harvested per location and replicate Sampled litterbags were immediately placed on ice for transportation and kept frozen until furtheranalysis The tubes were completely removed from the soil sealed and transported to20
the lab for further analysis Control soil was sampled next to the tubes at similar soildepths at the beginning and at the end of the experiments The soil was immediatelysieved at the forefield and stored on ice for transportation
23 Soil and litter bag analysis
Litter degradation rates were calculated based on the loss of litter material in the litter25
bags during incubation after drying at 60 C Soil samples from the tubes were takenfrom 2ndash5 cm depth and remaining litter material was carefully removed An aliquotof the soil samples was dried at 60 C whereas the rest was stored at minus20 C for
1282
BGD8 1275ndash1308 2011
Microbial food webdynamics along a soilchronosequence of a
glacier forefield
J Esperschutz et al
Title Page
Abstract Introduction
Conclusions References
Tables Figures
J I
J I
Back Close
Full Screen Esc
Printer-friendly Version
Interactive Discussion
Discussion
Paper
|D
iscussionP
aper|
Discussion
Paper
|D
iscussionP
aper|
phospholipid analysis The dried soil and plant litter material were ball-milled andsubsequently analysed for total C 13C and N content using an elemental analyzer(Eurovector Milan Italy) coupled with an isotope ratio mass spectrometer (MAT 253Thermo Electron Bremen Germany) Soil pH was analysed in 001 M CaCl2 extracts(DIN ISO 10390)5
24 Phospholipid analyses
Phospholipid fatty acid (PLFA) and phospholipid ether lipid (PLEL) analyses were per-formed based on Zelles et al (1995) and Gattinger et al (2003) An aliquot of 50 g soil(dry weight) was extracted with 250 mL of methanol 125 mL of chloroform and 50 mLof phosphate buffer (005 M pH 7) After 2 h of horizontal shaking 125 mL of water10
and 125 mL of chloroform were added to promote phase separation After 24 h thewater phase was removed and discarded The total lipid extract was separated intoneutral lipids glycolipids and phospholipids on a silica-bonded phase column (SPE-SI2 g12 mL Bond Elut Analytical Chem International CA USA) An aliquot of the phos-pholipids equivalent to 25 g (dry weight) was used for PLEL extraction as described by15
Gattinger et al (2003) The remaining 25 g of the phospholipid extract was further sep-arated into saturated (SATFA) monounsaturated (MUFA) and polyunsaturated (PUFA)fatty acids (see Zelles et al 1995 for details) to facilitate the identification of fatty acidsas well as to obtain a good baseline separation of peaks for isotopic calculations
Prior to measurements an internal standard (nonadecanoic acid methyl ester re-20
spectively myristic acid methyl ester) was added to calculate absolute amounts of fattyacids PLFA were analyzed as fatty acid methyl esters (FAME) on a gas chromato-graphmass spectrometry system (5973MSD GCMS Agilent Technologies Palo AltoUSA) FAMEs were separated on a polar column (BPX70 SGE GmbH GriesheimGermany) 60times025 mmtimes025 microm coated with 70 of cyanopropyl polysilphenylene-25
siloxane (see Esperschutz et al 2009b for details) PLEL were measured usingan non-polar column (HP 5 capillary column 50 m length 02 mm internal diame-ter coated with a cross-linked 5 phenylmethyl rubber phase with a film thickness
1283
BGD8 1275ndash1308 2011
Microbial food webdynamics along a soilchronosequence of a
glacier forefield
J Esperschutz et al
Title Page
Abstract Introduction
Conclusions References
Tables Figures
J I
J I
Back Close
Full Screen Esc
Printer-friendly Version
Interactive Discussion
Discussion
Paper
|D
iscussionP
aper|
Discussion
Paper
|D
iscussionP
aper|
of 03 microm see Gattinger et al 2003 for details) The mass spectra of the individualFAME were identified by comparison with established fatty acid libraries (Solvit CH6500 ndash Luzern Switzerland) using MSD Chemstation (Version D0200237)
The actual δ13C ratio of the individual FAME was corrected for the one C atom thatwas added during derivatisation (Abrajano et al 1994) The ldquoisoprenoid-20rdquo PLEL5
(phytane i20) was used for (ubiquitous) archaeal abundance (Gattinger et al 2003)For illustration and data analysis lipids were summarized in groups according to theirchemical character (see Fig 2 for details) PLFA analysis of L alpina plant litter wasperformed at the beginning of the experiment as described above PLFA a160 i180181ω11 182ω69 and 183 were detected in significant amounts Since PLFA 18310
was not detected in any soil sample removal of litter residues prior to extraction wassuccessful and hence all PLFA were taken into account for statistical analysis andinterpretation of data
25 Calculations
Stable isotope results were expressed in δ13C or atom percent (AP) according to15
Eqs (1) and (2)
δ13C= [(RsampleRV-PDB)minus1] middot1000 (1)
13CAP = (100 middotRV-PDB middot (δ13C1000+1)(1+RV-PDB middot (δ13C1000+1)) (2)
RSample and RV-PDB represent the 13C to 12C ratios of sample and internationalstandard Vienna-Pee Dee Belemnite (VPDB = 00111802) respectively The relative20
amount of litter-incorporated 13C (13CLITTER) into the total lipid fraction was calculatedaccording to Eq (3)
13CLITTER =CTx middot (13CTx minus13 CT0) middot10013Cadded (3)
where the concentration of the individual C-fraction [ng gminus1 DW] at timepoint Tx wasmultiplied by its 13C enrichment in atom percent excess (difference between 13C at25
1284
BGD8 1275ndash1308 2011
Microbial food webdynamics along a soilchronosequence of a
glacier forefield
J Esperschutz et al
Title Page
Abstract Introduction
Conclusions References
Tables Figures
J I
J I
Back Close
Full Screen Esc
Printer-friendly Version
Interactive Discussion
Discussion
Paper
|D
iscussionP
aper|
Discussion
Paper
|D
iscussionP
aper|
timepoint Tx and 13C enrichment at control) and expressed relatively to the amount ofadded 13C [ng g1 DW] The relative 13C-distribution within total measured phospholipids(13CPLDIST) was calculated as follows
13CPLDIST =13CLITTER i middot100sum
13CLITTER i (4)
where 13CLITTER i represents the relative amount of added 13C in an individual phos-5
pholipid i as calculated after Eq (3) Shannon Diversity (Hk) and Evenness (Ek) werecalculated according to Eqs (5) and (6)
Hk =minusksum
i=1
pi lnpi (5)
Ek =Hk
lnk(6)
where k represents the total number of fatty acids and pi the relative abundance of10
each species (Hill 1973)
26 Statistical analysis
Univariate analysis of variance was carried out using SPSS 110 with location (T1ndashT4) and harvesting treatment (control 8 weeks 12 weeks) as independent variablesTwo-way analysis of variance (ANOVA) was performed to establish significant inter-15
actions between location and treatment Significant differences for specific variableswere identified using Duncanrsquos post-hoc test at p lt 005 following one-way ANOVAPrincipal component analysis (PCA) was performed on the variance-covariance matrixutilizing the statistical software R Data for PCA were calculated as means (n= 5) ofeach location (T1ndashT4) and time point (control 8 weeks 12 weeks) Data illustration20
was performed with Adobe Illustrator CS3 and S-PLUS 81
1285
BGD8 1275ndash1308 2011
Microbial food webdynamics along a soilchronosequence of a
glacier forefield
J Esperschutz et al
Title Page
Abstract Introduction
Conclusions References
Tables Figures
J I
J I
Back Close
Full Screen Esc
Printer-friendly Version
Interactive Discussion
Discussion
Paper
|D
iscussionP
aper|
Discussion
Paper
|D
iscussionP
aper|
3 Results
31 Microbial plant litter degradation
After 8 weeks significant plant litter degradation (plt 005) was observed at all sitesT1ndashT4 (Table 2) Nearly 55 of the applied plant litter was lost at T1 whereas ap-proximately 65 of the litter material was degraded at the other sites After 12 weeks5
no further degradation was observed at T2 T3 and T4 At T1 an extra 10 massloss was detected (plt 005) resulting in a similar amount of degraded residues at allinvestigated sites at the end of the experiment Contamination of the total litter massloss with soil material was excluded since the total mass loss correlated with the massloss of C (linear regression R2 =0959 data not shown) Compared to C the amounts10
of N degraded during the incubation period were relatively low As a result lower CNratios were found at the end of the experiment (plt 005) The label in the plant litterranged between +81permil and +89permil δ13C (vs V-PDB) and did not significantly changeduring the incubation period indicating that the litter material used in the present ex-perimental setup was homogeneously labelled15
The total soil phospholipid (PL) content (nmol gminus1 DW) increased as ecosystem de-velopment progressed whereas significantly higher values (plt005) were detected atthe reference site T4 compared to all other sites (plt 005 Fig 1a) Due to litter appli-cation the PL content increased irrespective of the site location T1ndashT4 In general nodifferences in PL content were observed between 8 and 12 weeks except at the refer-20
ence site T4 In order to compare the amount of 13C incorporated into total PL acrossdifferent locations in the forefield the percentage of added 13C that was incorporatedinto total PL (13CLITTER) was calculated relative to the total amount of 13C addedSimilar to the total PL content an increasing incorporation of 13C derived from plantlitter into total PL was detected at T4 compared to the other sites (Fig 1b) Between 825
and 12 weeks a slight decrease in 13C values in total PL was observed at T2 and T3whilst a 50 reduction was recorded at T4 (Fig 1b)
1286
BGD8 1275ndash1308 2011
Microbial food webdynamics along a soilchronosequence of a
glacier forefield
J Esperschutz et al
Title Page
Abstract Introduction
Conclusions References
Tables Figures
J I
J I
Back Close
Full Screen Esc
Printer-friendly Version
Interactive Discussion
Discussion
Paper
|D
iscussionP
aper|
Discussion
Paper
|D
iscussionP
aper|
32 Soil microbial community composition
Shannon diversity and evenness indices were calculated according to Eqs (5) and(6) respectively on the basis of total PL concentrations and the number of fatty acidsdetected in the samples (Table 3) In general diversity increased concomitantly fromT1 to T4 however a very low diversity was detected in the control treatment at T1 A5
similar trend was observed for Shannon evennessFigure 2 shows the ordination of the samples using PCA analysis of the various
phospholipid classes Principal components accounted for 495 (PC1) and 236(PC2) of the total variance respectively The first principal component (PC1) showssome discrimination between samples from T1 and T2T3T4 sites The PL biomarkers10
that correlated best with this axis were etherlipids (PLEL) and poly unsaturated fattyacids (PUFA) as well as 10Me iso ant and cy PLFA Etherlipids and PUFA were moreabundant in the samples derived from T1 and T2 whilst the opposite was observed forthe other groups The second principal component (PC2) separated samples based onthe presence or absence of added litter The variables that contributed the most to the15
variance explained by this axis were long-chained and saturated fatty acids (norgt 20)as well as saturated branched fatty acids where the position of branching was unknown(unb) these were less abundant in litter treatments On the other hand minusω7 minusω9 andminusω11 mono unsaturated PLFA were more abundant in the litter treatments WhilePCA was able to differentiate between control and litter-amended samples there was20
no clear separation of samples from T1 T2 and T3 within the litter-amended treatmentsHowever there was a good separation of both control and litter-amended samples fromT4 with regard to the other developmental stages
33 13C distribution within PL groups
Figure 3 shows the natural 13C abundance (no litter application) of PL groups in soil25
at the different sites For most groups δ13C values ranged around minus25permil at T2 T3and T4 and showed no statistical differences at p lt 005 between these sites T1
1287
BGD8 1275ndash1308 2011
Microbial food webdynamics along a soilchronosequence of a
glacier forefield
J Esperschutz et al
Title Page
Abstract Introduction
Conclusions References
Tables Figures
J I
J I
Back Close
Full Screen Esc
Printer-friendly Version
Interactive Discussion
Discussion
Paper
|D
iscussionP
aper|
Discussion
Paper
|D
iscussionP
aper|
showed higher variability of δ13C natural abundance with average values ranging be-tween minus1permil and minus20permil (vs V-PDB) In general δ13C natural abundance in PL groupssignificantly differed between soil samples from T1 and the other sites but similar val-ues were observed for the PUFA and PLEL groups
Distribution of 13C derived from plant litter (PLDIST) among the individual groups was5
calculated according to Eq (4) Results showed similar incorporation of plant litter 13Camong individual PL groups at all sites (Fig 4) In all cases the highest plant litter 13Cincorporation was reported for PUFA (50) PLEL (20ndash30) and norlt 20 saturatedfatty acids (10ndash15)
Litter-derived 13C incorporation patterns were also assessed by means of PCA anal-10
ysis (Fig 5) Principal components accounted for 725 (PC1) and 122 (PC2) ofthe total variance respectively Results showed a clear separation between T1 and theother sites along PC1 for both harvesting time points This component is very similar tothat of the total soil microbial community profile (Fig 2) for T1 higher incorporation of13C into the PUFA and PLEL groups and lower incorporation at all other groups com-15
pared to the other sites was observed At the reference site T4 a large shift occurredbetween the first and the second harvesting time point on PC2 which was mainly dueto the lack of norgt20 and minusω5 PLFAs hence 13C incorporation into these groups after12 weeks of litter incubation was negligible
4 Discussion20
41 Plant litter degradation and microbial biomass
In the present study all experimental sites were located in a relatively small geograph-ical region and therefore similar climatic and weathering conditions can be assumedThe litter decomposition rate during the first 8 weeks of incubation was high at all sitesand even higher at sites that had been free from ice for at least 60 years (Table 2)25
This might be explained by the increase in microbial biomass as succession proceeds
1288
BGD8 1275ndash1308 2011
Microbial food webdynamics along a soilchronosequence of a
glacier forefield
J Esperschutz et al
Title Page
Abstract Introduction
Conclusions References
Tables Figures
J I
J I
Back Close
Full Screen Esc
Printer-friendly Version
Interactive Discussion
Discussion
Paper
|D
iscussionP
aper|
Discussion
Paper
|D
iscussionP
aper|
(Fig 1 Ohtonen et al 1999) Nonetheless after 12 weeks more than 50 of the ap-plied plant litter was degraded at all locations along the glacier forefield in agreementwith previous studies for instance Bradford et al (2002) described a litter mass lossof around 40 after 5 weeks although results may vary depending on the type of litterand the mesh size of the bag It is also possible that the loss of litter mass was not5
only a result of microbial degradation Particularly in wet environments leaching ofdissolved organic matter from litter tends to be significant (Chapin et al 2002) Re-cently Gulland and coworkers (unpublished data) found substantial leaching of litter inthe Damma glacier forefield However the incorporation of litter had a stimulating ef-fect on soil microbial biomass at all investigated sites suggesting that microbial activity10
was responsible for the observed loss of litter (Dornbush 2007) after 8 weeks of litterincubation microbial biomass had doubled at all sites (Fig 1a) The incorporation ofa new C and energy source into the soil resulted in the stimulation of zymogenousorganisms otherwise present in a dormant state in the soil regardless of the time freefrom ice The freshly-added litter material probably contained considerable amounts15
of relatively easily degradable substances (Heal et al 1997) As these compoundsare consumed slow-growing cellulose- and lignin-decomposers start to take over andsoon opportunistic organisms that mainly degrade sugars and amino acids begin todie of starvation (Tate 1987 Dilly et al 2003) This was reflected by a decrease in soilmicrobial biomass at all sites after 8 weeks except T1 (Fig 1) Results from 13C incor-20
poration into microbial biomass not only support the above-mentioned trend but alsounderpin that such turnover becomes faster as soil development progresses (Fig 1b)
42 Soil microbial community profile
Microbial diversity and evenness were significantly lower at T1 compared to the othersites (Table 3) As soil development progresses and the parent material becomes more25
accessible for plant colonization complexity increases nutrient content improves andnew potential niches and microniches become available (Loreau 2001) This in turnresults in enhanced microbial diversity (Hattenschwiler et al 2005) The harsh alpine
1289
BGD8 1275ndash1308 2011
Microbial food webdynamics along a soilchronosequence of a
glacier forefield
J Esperschutz et al
Title Page
Abstract Introduction
Conclusions References
Tables Figures
J I
J I
Back Close
Full Screen Esc
Printer-friendly Version
Interactive Discussion
Discussion
Paper
|D
iscussionP
aper|
Discussion
Paper
|D
iscussionP
aper|
conditions however may limit diversity in these environments as suggested by similarShannon indices in T2 and T3 Higher evenness usually reflects higher functionalityand stability within a system (Legrende and Legrende 1998) This becomes moreapparent when diversity values between control and litter amended treatments arecompared At T1 diversity substantially increased in the litter amended treatments5
whereas no changes were observed at the older sites (Table 3) The fact that fewchanges in evenness were observed following litter incorporation may suggest an in-creasing stability of the microbial food web irrespective of nutrient sources as succes-sion proceeds
The initial microbial community structure as evidenced by PLFA analysis of controls10
(no litter incorporation) indicated marked differences between the T1 and T2ndashT3 sitesand T4 (Fig 2) At T1 the microbial community structure was dominated by PLELand PUFA these decreased as soil age increased According to the literature thesemarkers indicate a higher proportion of archaea fungi microeukaryotes protozoa andcyanobacteria (Gattinger et al 2003 Zelles et al 1999 Zaady et al 2010 Potts15
et al 1987 Villanueva et al 2004) These organisms form microbial mats in initialecosystem structures (Villanueva et al 2004 Stal 1995) to revert on different skills ofC and N fixation systems (Nisbet and Fowler 1999) which also allow the use of C-CO2or old C sources In contrast to data from Towe et al (2010) where higher abundanceof archaeal ammonia oxidizers was observed as ecosystem development progressed20
results from this study indicated a high proportion of total archaea at T1 based on theubiquitious archaeal lipid phytane (Gattinger et al 2003) In comparison with T1 amore bacterial-dominated microbial population was detected at the control sites T2 T3and T4 Not only actinomycetes (10Me) and Gram-positives (iso ant) but also someGram-negative populations (cy minusω5 minusω8) were higher at the older sites According25
to Kramer and Gleixner (2008) both Gram-positive and Gram-negative bacteria preferplant derived C as a C-source Moreover vegetation and plant cover were generallyhigher at these sites which might have provided better growth conditions for bacteria
1290
BGD8 1275ndash1308 2011
Microbial food webdynamics along a soilchronosequence of a
glacier forefield
J Esperschutz et al
Title Page
Abstract Introduction
Conclusions References
Tables Figures
J I
J I
Back Close
Full Screen Esc
Printer-friendly Version
Interactive Discussion
Discussion
Paper
|D
iscussionP
aper|
Discussion
Paper
|D
iscussionP
aper|
The microbial community structure detected in control treatments differed from that inthe litter treatments at all stages of ecosystem development (Fig 2) After litter applica-tion an increase of mainly Gram-negative bacteria was observed (minusω7 minusω9 minusω11)that benefited from the fresh and easily available C sources This is in accordancewith other studies postulating Gram-negatives as an important group of bacteria in-5
volved in the litter decomposition process (Elfstrand et al 2008 Kramer and Gleixner2008) Despite a significant decrease in microbial biomass between 8 and 12 weeksof incubation differences between both harvesting time points in PLFA profiles of soilsamended with litter were not as pronounced as those found between litter-amendedand control samples This suggests that shifts in the dominant microbial populations10
from more opportunistic groups to more specialized groups capable to process themore recalcitrant litter components was slow and thus not clearly detectable within thefour weeks interval In addition differences in the microbial community structure be-tween litter-amended treatments from T1 T2 and T3 were not as prominent as thosebetween T4 and the other sites (Fig 2) The influence of run-off transport of materials15
from the glacier end to sites T2 and T3 compared to the reference site T4 (not influ-enced by run-off from the glacier end) and the lack of major variations in soil chemistrybetween T2 and T3 may explain the lack of greater differences between the two andalso between T2ndashT3 and T1
43 13C distribution within PL groups20
There was a high natural 13C abundance of individual PL groups in T1 with δ13C val-ues up to +0permil (vs V-PDB) We do not attribute these high δ13C values to the directuse of ancient C after glacier retreat as suggested by Bardgett et al (2007) as theδ13C values of natural soil organic matter were not higher at T1 compared to thosefound at the other sites The high natural 13C abundance at T1 might be an indication25
of cyanobacterial fixation of C (Walker and del Moral 2003) Due to a smaller iso-topic fractionation by the 3-hydroxypropionate pathway compared to the Calvin cycle13C enriched signatures may also occur due to C fixation by cyanobacteria (van der
1291
BGD8 1275ndash1308 2011
Microbial food webdynamics along a soilchronosequence of a
glacier forefield
J Esperschutz et al
Title Page
Abstract Introduction
Conclusions References
Tables Figures
J I
J I
Back Close
Full Screen Esc
Printer-friendly Version
Interactive Discussion
Discussion
Paper
|D
iscussionP
aper|
Discussion
Paper
|D
iscussionP
aper|
Meer et al 2007) By predation and release of the fixed C into the soil matrix andsubsequent uptake by other microbes enriched 13C signatures were possibly trans-ferred into a variety of ldquonon-cyanobacterialrdquo PL groups For instance high δ13C valuesin PLFA biomarkers indicative for Gram-positive and Gram-negative bacteria were alsodetected In addition as ecosystem development progresses the influence of organic5
sources from plants increases Higher plants fixed C through the Calvin cycle resultingin higher influence of δ13C signatures within the range minus20 to minus25permil δ13C (vs V-PDB)in biolipids at T2ndashT3 and T4
At all sites PUFA and PLEL groups showed highest litter-derived 13C signaturesamong the microbial community structure suggesting that mainly fungi microeukary-10
otes protozoa and archaea were highly active during litter decomposition (Fig 5) Ac-cording to Emerenciano et al (1986) high contents of sesquiterpene lactones areknown in the family of Asteraceae and up to 7 different compounds have been detectedin the Leucanthemopsis genus As such compounds are difficult to degrade (Picman1987) fungi might have played an important role as the main litter decomposers in our15
study For instance fungi secrete enzymes that break down the cuticule of dead leaves(Chapin et al 2002) Schmidt and Lipson (2004) suggest that a high proportion of fungimay dominate the microbial community structure at low temperatures (minus5 to 3 C) de-composing litter and immobilizing N Frey et al (2003) postulated a translocation oflitter-derived C belowground by decomposer fungi subsequently stabilized as soil or-20
ganic matter However PUFA may occur not only in fungi but also among cyanobac-teria (Zaady et al 2010) and γ-proteobacteria (Nichols and McMeekin 2002) whichhave been detected in the Damma forefield as well (Duc et al 2009) Therefore itmight be possible that at the young site the 13C enrichment in PUFA observed in thecontrol soil (no litter application) originates from cyanobacterial 13C fixation whereas2513C enrichment in PUFA after litter application indicates decomposition processes byfungi or γ-proteobacteria
1292
BGD8 1275ndash1308 2011
Microbial food webdynamics along a soilchronosequence of a
glacier forefield
J Esperschutz et al
Title Page
Abstract Introduction
Conclusions References
Tables Figures
J I
J I
Back Close
Full Screen Esc
Printer-friendly Version
Interactive Discussion
Discussion
Paper
|D
iscussionP
aper|
Discussion
Paper
|D
iscussionP
aper|
High amounts of 13C derived from litter were also detected in PLFA norlt 20 how-ever these lipids are ubiquitously found in all organisms and therefore provide no clearbioindication Surprisingly we found 13C enrichment in the PLEL group characteristicof archaea To the best of our knowledge this is the first litter decomposition studythat includes PLEL as archaeal biomarker (at least in alpine ecosystems) suggesting5
that archaea might play an important role during initial litter decomposition in alpineecosystems However it remains unclear whether the enrichment observed is due tothe direct participation of archaea in litter degradation or to the recycling of 13C fromother groups
It should be noted that results from general PL analyses (Sect 42) showed a stim-10
ulation of individual PL groups following litter application which may not necessarily berelated to the utilization of litter derived 13C This might be explained by an increasein soil organic carbon mineralization due to the input of fresh organic carbon residuesthe so called ldquopriming effectrdquo (Kuzyakov 2010) Additionally during the time betweenlitter application and the first harvest (8 weeks) microbes may have migrated to other15
sites through deposition of particulate matter air currents precipitation or snowmelt(Schutte et al 2009) The importance of such disturbances and mechanisms was notestimated in the present study
Similar litter-derived 13C incorporation patterns for all PLFA groups were observedregardless of site age (Fig 4a and b) These results suggest that initial food web struc-20
tures also form the basis of later stages of soil development in this kind of environmentsThis might be related to the demanding specialization required to survive and prolifer-ate in environments characterized by very low temperatures short vegetation periodsand low availability of nutrients Microbial populations thus have to react rapidly toorganic inputs which might be restricted to the short vegetation period and also to25
compete with plants for the scarce nutrients After 12 weeks a significant shift wasobserved at all sites incorporation of 13C into PLEL signatures decreased whilst anincrease was observed in the incorporation of 13C into PUFA markers (Fig 4a and b)This might be related to (i) lower activity of archaea once that litter rich in carbohydrates
1293
BGD8 1275ndash1308 2011
Microbial food webdynamics along a soilchronosequence of a
glacier forefield
J Esperschutz et al
Title Page
Abstract Introduction
Conclusions References
Tables Figures
J I
J I
Back Close
Full Screen Esc
Printer-friendly Version
Interactive Discussion
Discussion
Paper
|D
iscussionP
aper|
Discussion
Paper
|D
iscussionP
aper|
and sugars has been consumed as was previously shown for bacteria (Bardgett andWalker 2004) and (ii) higher contribution of fungi as the litter becomes more recalci-trant for degradation
5 Conclusions
The main points emerging from this study are5
ndash Soil development increases microbial biomass diversity and evenness in glacierforeland resulting in faster turnover rates in response to organic source pulses
ndash Soil development strongly influences the structure of the microbial communityin glacier forefields with increasing importance of bacteria as soil developmentprogresses10
ndash Adaptation to the harsh environmental conditions prevailing in alpine ecosystemsacts as a strong selective force resulting in similar microbial food web patterns atdifferent stages of soil development
ndash Cyanobacteria may play a more important role in C-cycling in alpine ecosystemsthan previously thought15
ndash Both Gram-negative bacteria and archaea are significantly involved in C-turnoverin response to the incorporation of litter residues in alpine forefields
1294
BGD8 1275ndash1308 2011
Microbial food webdynamics along a soilchronosequence of a
glacier forefield
J Esperschutz et al
Title Page
Abstract Introduction
Conclusions References
Tables Figures
J I
J I
Back Close
Full Screen Esc
Printer-friendly Version
Interactive Discussion
Discussion
Paper
|D
iscussionP
aper|
Discussion
Paper
|D
iscussionP
aper|
Acknowledgements This study is part of the Transregional Collaborative Research Centre 38(SFBTRR38) which is financially supported by the Deutsche Forschungsgemeinschaft (DFGBonn) and the Brandenburg Ministry of Science Research and Culture (MWFK Potsdam) Wethank C Kollerbauer for her excellent work in PLFA and PLEL analyses We are also verygrateful to the Department of Environmental Engineering at the Helmholtz Zentrum Munchen5
for providing labelling tents and facilities in the greenhouse The following people are acknowl-edged for their support and their help during the experiment at the glacier forefield A AlbertK Gulland F Haesler B Hai J Ollivier K Schauss R Schilling E Schreiner S SchulzR Smittenberg S Towe
References10
Abrajano J T A Murphy D E Fang J Comet P and Brooks J M 13C12C ratios inindividual fatty acids of marine mytilids with and without bacterial symbionts Org Geochem21 611ndash617 1994
Bai Q Gattinger A and Zelles L Characterisation of microbial consortia in paddy rice soilby phosholipid analysis Microb Ecol 39 273ndash281 200015
Bardgett R D and Walker L R Impact of coloniser plant species on the development ofdecomposer microbial communities following deglaciation Soil Biol Biochem 36 555ndash5592004
Bardgett R D Mawdsley J L Edwards S Hobbs P J Rodwell J S and Davies W JPlant species and nitrogen effects on soil biological properties of temperate upland grass-20
lands Funct Ecol 13 650ndash660 1999Bardgett R D Richter A Bol R Garnett M H Baeumler R Xu X Lopez-Capel E
Manning D A C Hobbs P J Hartley I R and Wanek W Heterotrophic microbialcommunities use ancient carbon following glacial retreat Biology Lett 3 487ndash490 2007
Baudoin E Benizri E and Guckert A Impact of artificial root exudates on the bacterial25
community structure in bulk soil and maize rhizosphere Soil Biol Biochem 35 1183ndash11922003
Boschker H T S Nold S C Wellsbury P Bos D Graaf W D Pel R Parkes R Jand Cappenberg T E Direct linking of microbial populations to specific biogeochemicalprocesses by 13C-labelling of biomarkers Nature 392 801ndash805 199830
1295
BGD8 1275ndash1308 2011
Microbial food webdynamics along a soilchronosequence of a
glacier forefield
J Esperschutz et al
Title Page
Abstract Introduction
Conclusions References
Tables Figures
J I
J I
Back Close
Full Screen Esc
Printer-friendly Version
Interactive Discussion
Discussion
Paper
|D
iscussionP
aper|
Discussion
Paper
|D
iscussionP
aper|
Bradford M A Tordoff G M Eggers T J and Newingtont H J E Microbiota fauna andmesh size interactions in litter decomposition Oikos 99 317ndash323 2002
Butler J L Williams M A Bottomley P J and Myrold D D Microbial community dynamicsassociated with rhizosphere carbon flow Appl Environ Microb 69 6793ndash6800 2003
Chapin F S Walker L R Fastie C L and Sharman L C Mechanisms of Primary Suc-5
cession Following Deglaciation at Glacier Bay Alaska Ecol Monogr 64 149ndash175 1994Chapin F S Matson P A and Mooney H A Principles of Terrestrial Ecosystem Ecology
Springer New York 2002Dilly O Bloem J Vos A and Munch J C Bacterial Diversity in Agricultural Soils during
Litter Decomposition Appl Environ Microb 70 468ndash474 200410
Dornbush M E Grasses litter and their interaction affect microbial biomass and soil enzymeactivity Soil Biol Biochem 39 2241ndash2249 2007
Duc L Neuenschwander S Rehrauer H Wagner U Sobek J Schlapbach R and ZeyerJ Development and experimental validation of a nifH oligonucleotide microarray to studydiazotrophic communities in a glacier forefield Environ Microbiol 11 2179ndash2189 200915
Edwards I Burgmann H Miniaci C and Zeyer J Variation in Microbial Community Com-position and Culturability in the Rhizosphere of Leucanthemopsis alpina (L) Heywood andAdjacent Bare Soil Along an Alpine Chronosequence Microb Ecol 52 679ndash692 2006
Egli M Fitze P and Mirabella A Weathering and evolution of soils formed on granitic glacialdeposits results from chronosequences of Swiss alpine environment Catena 45 19ndash4720
2001Elfstrand S Lagerlof J Hedlund K and Martensson A Carbon routes from decomposing
plant residues and living roots into soil food webs assessed with 13C labelling Soil BiolBiochem 40 2530ndash2539 2008
Emerenciano de P V Auxiliadora M Kaplan C Gottlieb O R Bonfanti de M M R Ferreira25
Z S and Comegno L M A Evolution of sesquiterpene lactones in asteraceae BiochemSyst Ecol 14 585ndash589 1986
Esperschutz J Buegger F Winkler J B Munch J C Schloter M and Gattinger AMicrobial response to exudates in the rhizosphere of young beech trees (Fagus sylvatica L)after dormancy Soil Biol Biochem 41 1976ndash1985 2009a30
Esperschutz J Pritsch K Gattinger A Welzl G Haesler F Buegger F Winkler JMunch J and Schloter M Influence of chronic ozone stress on carbon translocation pat-tern into rhizosphere microbial communities of beech trees (Fagus sylvatica L) during a
1296
BGD8 1275ndash1308 2011
Microbial food webdynamics along a soilchronosequence of a
glacier forefield
J Esperschutz et al
Title Page
Abstract Introduction
Conclusions References
Tables Figures
J I
J I
Back Close
Full Screen Esc
Printer-friendly Version
Interactive Discussion
Discussion
Paper
|D
iscussionP
aper|
Discussion
Paper
|D
iscussionP
aper|
growing season Plant Soil 323 85ndash95 2009bFioretto A Di Nardo C Papa S and Fuggi A Lignin and cellulose degradation and nitro-
gen dynamics during decomposition of three leaf litter species in a Mediterranean ecosys-tem Soil Biol Biochem 37 1083ndash1091 2005
Frey S D Six J and Elliott E T Reciprocal transfer of carbon and nitrogen by decomposer5
fungi at the soil-litter interface Soil Biol Biochem 35 1001ndash1004 2003Frey B Rieder S R Brunner I Plotze M Koetzsch S Lapanje A Brandl H and
Furrer G Weathering-associated bacteria from the Damma Glacier forefield Physiologicalcapabilities and impact on granite dissolution Appl Environ Microb 76 4788ndash4796 2010
Frostegard A and Baath E The use of phospholipid fatty acid analysis to estimate bacterial10
and fungal biomass in soil Biol Fert Soils 22 59ndash65 1996Gattinger A Ruser R Schloter M and Munch J C Microbial community structure varies
in different soil zones of a potato field J Plant Nutr Soil Sci 165 421ndash428 2002Gattinger A Gunthner A Schloter M and Munch J C Characterization of Archaea in soils
by polar lipid analysis Acta Biotechnol 23 21ndash28 200315
Hammerli A Waldhuber S Miniaci C Zeyer J and Bunge M Local expansion and selec-tion of soil bacteria in a glacier forefield Eur J Soil Sci 58 1437ndash1445 2007
Hattenschwiler S Tiunov A V and Scheu S Biodiversity and litter decomposition in ter-restrial ecosystems Annu Rev Ecol Evol Syst 36 191ndash218 2005
Heal O W Anderson J M and Swift M J Plant litter quality and decomposition an20
historical overview edited by Cadisch G and Giller K E in Driven by nature Plant litterquality and decomposition CAB International Wallingford United Kingdom 1997
Hill M O Diversity and Evenness A unifying notation and its consequences Ecology 54427ndash432 1973
Jumpponen A Vare H Matteson K G Ohtonen R and Trappe J M Characterization of25
ldquosafe sitesrdquo for pioneers in primary succession on recently deglaciated terrain J Ecol 8798ndash105 1999
Kramer C and Gleixner G Soil organic matter in soil depth profiles Distinct carbon prefer-ences of microbial groups during carbon transformation Soil Biol Biochem 40 425ndash433200830
Kuzyakov Y Priming effects Interactions between living and dead organic matter Soil BioBiochem 42 1363ndash1371 2010
Lazzaro A Abegg C and Zeyer J Bacterial community structure of glacier forefields on
1297
BGD8 1275ndash1308 2011
Microbial food webdynamics along a soilchronosequence of a
glacier forefield
J Esperschutz et al
Title Page
Abstract Introduction
Conclusions References
Tables Figures
J I
J I
Back Close
Full Screen Esc
Printer-friendly Version
Interactive Discussion
Discussion
Paper
|D
iscussionP
aper|
Discussion
Paper
|D
iscussionP
aper|
siliceous and calcareous bedrock Eur J Soil Sci 60 860ndash870 2009Leake J R Ostle N J Rangel-Castro J I and Johnson D Carbon fluxes from plants
through soil organisms determined by field 13CO2 pulse-labelling in an upland grasslandAppl Soil Ecol 33 152ndash175 2006
Legrende P Legrende L Numerical ecology Elsevier Amstersdam The Netherlands 19985
Loreau M Microbial diversity producer-decomposer interactions and ecosystem processesa theoretical model Proc R Soc London Ser B 268 303ndash309 2001
Lu Y Murase J Watanabe A Sugimoto A and Kimura M Linking microbial communitydynamics to rhizosphere carbon flow in a wetland rice soil FEMS Microbiol Ecol 48 179ndash186 200410
Miniaci C Bunge M Duc L Edwards I Burgmann H and Zeyer J Effects of pioneeringplants on microbial structures and functions in a glacier forefield Biol Fert Soils 44 289ndash297 2007
Nichols D S and McMeekin T A Biomarker techniques to screen for bacteria that producepolyunsaturated fatty acids J Microbiol Meth 48 161ndash170 200215
Nilsson L Baath E Falkengren-Grerup U and Wallander H Growth of ectomycorrhizalmycelia and composition of soil microbial communities in oak forest soils along a nitrogendeposition gradient Oecologia 153 375ndash384 2007
Nisbet E G and Fowler C M R Archaen metabolic evolution of microbial mats P R SocLond B Bio 266 2375ndash2382 199920
Oerlemans J Extracting a climate signal from 169 glacier records Science 308 675ndash6772005
Ohtonen R Fritze H Pennanen T Jumpponen A and Trappe J Ecosystem propertiesand microbial community changes in primary succession on a glacier forefront Oecologia119 239ndash246 199925
Ostle N Briones M J I Ineson P Cole L Staddon P and Sleep D Isotopic detection ofrecent photosynthate carbon flow into grassland rhizosphere fauna Soil Biol Biochem 39768ndash777 2007
Picman A K Persistence and disappearance of the sesquiterpene lactone isoalantolactonein soils Biochem Syst Ecol 15 361ndash363 198730
Pombo S A Pelz O Schroth M H and Zeyer J Field-scale 13C-labeling of phospho-lipid fatty acids (PLFA) and dissolved inorganic carbon tracing acetate assimilation andmineralization in a petroleum hydrocarbon-contaminated aquifer FEMS Microbiol Ecol 41
1298
BGD8 1275ndash1308 2011
Microbial food webdynamics along a soilchronosequence of a
glacier forefield
J Esperschutz et al
Title Page
Abstract Introduction
Conclusions References
Tables Figures
J I
J I
Back Close
Full Screen Esc
Printer-friendly Version
Interactive Discussion
Discussion
Paper
|D
iscussionP
aper|
Discussion
Paper
|D
iscussionP
aper|
259ndash267 2002Potts M Olie J J Nickels J S Parsons J and White D C Variation in phospholipid
ester-linked fatty acids and carotenoids of desiccated nostoc commune (cyanobacteria) fromdifferent geographic locations Appl Environ Microb 53 4ndash9 1987
Ratledge C and Wilkinson S G Microbial lipids Academic Press London 19895
Reichardt W Mascarina G Padre B and Doll J Microbial communities of continuouslycropped irrigated rice fields Appl Environ Microb 63 233ndash238 1997
Schmidt S K and Lipson D A Microbial growth under the snow Implications for nutrientand allelochemical availability in temperate soils Plant Soil 259 1ndash7 2004
Schuette U M E Abdo Z Bent S J Williams C J Schneider G M Solheim B and10
Forney L J Bacterial succession in a glacier foreland of the High Arctic ISME J 3 1258ndash1268 2009
Stal L J Tansley Review No 84 Physiological ecology of cyanobacteria in microbial matsand other communities New Phytol 131 1ndash32 1995
Tate R III Soil organic matter biological and ecological effects John Wiley amp Sons Inc USA15
291 pp 1987Towe S Albert A Kleineidam K Brankatschk R Dumig A Welzl G Munch J Zeyer
J and Schloter M Abundance of microbes involved in nitrogen transformation in the rhi-zosphere of Leucanthemopsis alpina (L) Heywood grown in soils from different sites of theDamma glacier forefield Microb Ecol 60 762ndash770 201020
Tscherko D Rustemeier J Richter A Wanek W and Kandeler E Functional diversityof the soil microflora in primary succession across two glacier forelands in the Central AlpsEur J Soil Sci 54 685ndash696 2003
Tscherko D Hammesfahr U Zeltner G Kandeler E and Bocker R Plant succession andrhizosphere microbial communities in a recently deglaciated alpine terrain Basic Appl Ecol25
6 367ndash383 2005Van Der Meer M T J Schouten S Damste J S S and Ward D M Impact of carbon
metabolism on 13C signatures of cyanobacteria and green non-sulfur-like bacteria inhabitinga microbial mat from an alkaline siliceous hot spring in Yellowstone National Park (USA)Environ Microbiol 9 482ndash491 200730
Villanueva L Navarrete A Urmeneta J White D C and Guerrero R Combined phospho-lipid biomarker-16S rRNA gene denaturing gradient gel electrophoresis analysis of bacterialdiversity and physiological status in an intertidal microbial mat Appl Environ Microb 70
1299
BGD8 1275ndash1308 2011
Microbial food webdynamics along a soilchronosequence of a
glacier forefield
J Esperschutz et al
Title Page
Abstract Introduction
Conclusions References
Tables Figures
J I
J I
Back Close
Full Screen Esc
Printer-friendly Version
Interactive Discussion
Discussion
Paper
|D
iscussionP
aper|
Discussion
Paper
|D
iscussionP
aper|
6920ndash6926 2004Walker L R and del Moral R Primary succession and ecosystem rehabilitation Cambridge
UK Cambridge University Press 2003White D C Davis W M Nickels J S King J D and Bobbie R J Determination of the
sedimentary microbial biomass by extractible lipid phosphate Oecologia 40 51ndash62 19795
Zaady E Ben-David E A Sher Y Tzirkin R and Nejidat A Inferring biological soil crustsuccessional stage using combined PLFA DGGE physical and biophysiological analysesSoil Biol Biochem 42 842ndash849 2010
Zelles L Bai Q Y Rackwitz R Chadwick D and Beese F Determination of phospholipid-and lipopolysaccharide-derived fatty acids as an estimate of microbial biomass and commu-10
nity structure in soils Biol Fert Soils 19 115ndash123 1995Zelles L Fatty acid patterns of phospholipids and lipopolysaccharides in the characterisation
of microbial communities in soil a review Biol Fert Soils 29 111ndash129 1999
1300
BGD8 1275ndash1308 2011
Microbial food webdynamics along a soilchronosequence of a
glacier forefield
J Esperschutz et al
Title Page
Abstract Introduction
Conclusions References
Tables Figures
J I
J I
Back Close
Full Screen Esc
Printer-friendly Version
Interactive Discussion
Discussion
Paper
|D
iscussionP
aper|
Discussion
Paper
|D
iscussionP
aper|
Table 1 Total C and N contents pH-values and δ13C natural abundance in soil (means ofn=5plusmn standard deviation) at different stages of ecosystem development (T1ndashT4)
ecosystemdevelopment
pH(CaCl2)
Ctotal[]
Ntotal[]
13C[permil V-PDB]
10 years (T1) 56 (01) 011 (009) 0004 (0002) minus2696 (239)60 years (T2) 48 (01) 078 (055) 0048 (0034) minus2650 (047)100 years (T3) 51 (06) 062 (035) 0040 (0028) minus2751 (056)gt700 years (T4) 43 (02) 650 (396) 0442 (0252) minus2672 (028)
1301
BGD8 1275ndash1308 2011
Microbial food webdynamics along a soilchronosequence of a
glacier forefield
J Esperschutz et al
Title Page
Abstract Introduction
Conclusions References
Tables Figures
J I
J I
Back Close
Full Screen Esc
Printer-friendly Version
Interactive Discussion
Discussion
Paper
|D
iscussionP
aper|
Discussion
Paper
|D
iscussionP
aper|
Table 2 Plant litter mass loss and selected parameters during the litter incubation period alongthe Damma forefield (means of n=5plusmn standard deviation)
8 weeks 12 weeks
initial plant litter T1 T2 T3 T4 T1 T2 T3 T4
plant litter[g per litterbag DW]
250 112(011)
095(011)
091(010)
087(012)
088(008)
084(016)
083(031)
093(036)
remaining plant litter[]
10000 4468(422)
3803(452)
3627(394)
3490(495)
3514(310)
3350(624)
3321(1241)
3740(1440)
Ctotal[g per litterbag DW]
096(006)
059(015)
042(004)
042(005)
040(004)
045(013)
038(006)
037(014)
042(017)
13Ctotal
[permil δ13C V-PDB]8835(161)
8400(442)
8233(441)
8347(441)
8553(309)
8650(214)
8019(736)
8104(315)
8145(531)
Ntotal[g litterbag DW]
004(001)
004(000)
003(001)
003(000)
003(000)
003(001)
003(001)
003(001)
003(001)
CN 2270(122)
1332(075)
1331(057)
1357(111)
1335(057)
1298(090)
1285(088)
1386(047)
1340(118)
1302
BGD8 1275ndash1308 2011
Microbial food webdynamics along a soilchronosequence of a
glacier forefield
J Esperschutz et al
Title Page
Abstract Introduction
Conclusions References
Tables Figures
J I
J I
Back Close
Full Screen Esc
Printer-friendly Version
Interactive Discussion
Discussion
Paper
|D
iscussionP
aper|
Discussion
Paper
|D
iscussionP
aper|
Table 3 Microbial diversity and evenness (Shannon indices) at T1ndashT4 after 8 weeks and 12weeks of litter application as well as without litter (control) Values are illustrated as means(n=5plusmn standard deviation)
control 8 weeks 12 weeks
10 60 100 gt700 y 10 60 100 gt700 y 10 60 100 gt700 y
Shannondiversity
1600(0154)a
2733(0111)b
2869(0082)b
2869(0033)b
2257(0108)a
2562(0108)b
2478(0147)b
2823(0050)c
2337(00377)a
2512(0053)b
2698(0139)c
21 717(0060)c
Shannonevenness
0667(0084)a
0839(0034)b
0861(0025)b
0850(0011)b
0685(0033)a
0777(0032)b
0752(0045)b
0830(0015)c
0687(0011)a
0762(0016)b
0819(0042)c
0834(0018)c
Letters (abc) indicates significant differences plt005 within treatments (control 8 weeks 12 weeks)
1303
BGD8 1275ndash1308 2011
Microbial food webdynamics along a soilchronosequence of a
glacier forefield
J Esperschutz et al
Title Page
Abstract Introduction
Conclusions References
Tables Figures
J I
J I
Back Close
Full Screen Esc
Printer-friendly Version
Interactive Discussion
Discussion
Paper
|D
iscussionP
aper|
Discussion
Paper
|D
iscussionP
aper|
0
400
800
1200
PL to
tal [
nmol
g-1
DW
] control8 weeks12 weeks
a)
T1 T2 T3 T4000
005
010
015
020
025
o
f ad
ded
13C
in t
ota
l PL
8 weeks12 weeks
T1 T2 T3 T4
b)
Fig 1 Total phospholipid (PL) content (a) in soil (nmol gminus1 DW) and the percent of added13C incorporated into total PL (b) at different stages of ecosystem development T1ndashT4 andindividual harvesting time points (means + standard deviation n=5)
1304
BGD8 1275ndash1308 2011
Microbial food webdynamics along a soilchronosequence of a
glacier forefield
J Esperschutz et al
Title Page
Abstract Introduction
Conclusions References
Tables Figures
J I
J I
Back Close
Full Screen Esc
Printer-friendly Version
Interactive Discussion
Discussion
Paper
|D
iscussionP
aper|
Discussion
Paper
|D
iscussionP
aper|
34
control treatment
8 weeks litter incubation
12 weeks litter incubation
isoi140 i150 i160 i170
anta140 a150 a170
unbbr13170 br180
10Me10Me170 10Me190
nor lt 20n150 n160
nor gt 20n220 n240
cycy170 cy190
- 51615
- 71617 1817
- 81518
- 91619 1819
- 1116111
PUFA18269 182812 204 224
PLELiso200
minus04 minus02 00 02 04
minus0
4minus
02
00
02
04
PC1
PC
2
T1
T2
T3 T4
T1 T2
T3
T4
T1 T2
T3
T4
minus3 minus2 minus1 0 1 2 3
minus3
minus2
minus1
01
23
iso
ant
unb
10Me
nor gt20
nor lt20
cy
-5
-7
-8
-9-11
pufaplel
707
Fig 2 Illustration of the first (PC1) and the second (PC2) principal components of the 708
principal component analysis (PCA) of all PL groups on mol basis (means of n=5) 709
Fig 2 Illustration of the first (PC1) and the second (PC2) principal components of the principalcomponent analysis (PCA) of all PL groups on mol basis (means of n=5)
1305
BGD8 1275ndash1308 2011
Microbial food webdynamics along a soilchronosequence of a
glacier forefield
J Esperschutz et al
Title Page
Abstract Introduction
Conclusions References
Tables Figures
J I
J I
Back Close
Full Screen Esc
Printer-friendly Version
Interactive Discussion
Discussion
Paper
|D
iscussionP
aper|
Discussion
Paper
|D
iscussionP
aper|
35
iso
ant
un
b
10M
e
n
orlt2
0
n
orgt2
0
cy
-
5
-
7
-
8
-9
-
11
PU
FA
PLE
L
-40
-30
-20
-10
0
10na
tura
l abu
ndan
ce13
C vs
V-P
DB
T1 - 10 yearsT2 - 60 yearsT3 - 100 yearsT4 - gt700 years
710
Fig 3 Natural abundance δ13C values [permil vs V-PDB] in individual PL groups in soil without 711
litter application (means plusmn standard deviation n=5) PL groups were formed as described in 712
Fig 2 and 5 713
Fig 3 Natural abundance δ13C values [permil vs V-PDB] in individual PL groups in soil withoutlitter application (means plusmn standard deviation n= 5) PL groups were formed as described inFigs 2 and 5
1306
BGD8 1275ndash1308 2011
Microbial food webdynamics along a soilchronosequence of a
glacier forefield
J Esperschutz et al
Title Page
Abstract Introduction
Conclusions References
Tables Figures
J I
J I
Back Close
Full Screen Esc
Printer-friendly Version
Interactive Discussion
Discussion
Paper
|D
iscussionP
aper|
Discussion
Paper
|D
iscussionP
aper|
iso
ant
unb
10Me
norlt20
norgt20
cy
-w 5
-w7
-w8
-w 9
-w11
PUFA
PLEL
10 years 60 years 100 yearsgt 700 years
a) b)
relative distribution of plant litter derived 13C []
iso
ant
unb
10Me
norlt20
norgt20
cy
-w 5
-w7
-w8
-w 9
-w11
PUFA
PLEL
0 2010 30 40 50 60 0 2010 30 40 50 60
Fig 4 Distribution of 13C derived from litter within PL groups in relative to total litter derived13C into total PL according to Fig 1 (means + standard deviation n= 5) after 8 weeks (a) and12 weeks (b) of litter incubation PL groups were formed as described in Figs 2 and 5
1307
BGD8 1275ndash1308 2011
Microbial food webdynamics along a soilchronosequence of a
glacier forefield
J Esperschutz et al
Title Page
Abstract Introduction
Conclusions References
Tables Figures
J I
J I
Back Close
Full Screen Esc
Printer-friendly Version
Interactive Discussion
Discussion
Paper
|D
iscussionP
aper|
Discussion
Paper
|D
iscussionP
aper|
37
8 weeks litter incubation
12 weeks litter incubation
isoi140 i150 i160 i170
anta140 a150 a170
unbbr13170 br180
10Me10Me170 10Me190
nor lt 20n150 n160
nor gt 20n220 n240
cycy170 cy190
- 51615
- 71617 1817
- 91619 1819
PUFA18269 182812 204 224
PLELiso200
-04 -02 00 02 04 06
-04
-02
00
02
04
06
PC1
PC
2
T1
T2
T3
T4
T1
T2
T3
T4
-2 0 2 4
-20
24
iso
antunb
10Me
norlt20norgt20
cy
-5
-7 -9
pufa
plel
718
Fig 5 First (PC1) and second (PC2) principal components of the principal component 719
analysis (PCA) illustrating the distribution of 13C derived from litter within PL groups (in 720
relative to total 13C derived from litter into total PL according to Fig 1 means of n=5) 721
722
Fig 5 First (PC1) and second (PC2) principal components of the principal component analysis(PCA) illustrating the distribution of 13C derived from litter within PL groups (in relative to total13C derived from litter into total PL according to Fig 1 means of n=5)
1308
BGD8 1275ndash1308 2011
Microbial food webdynamics along a soilchronosequence of a
glacier forefield
J Esperschutz et al
Title Page
Abstract Introduction
Conclusions References
Tables Figures
J I
J I
Back Close
Full Screen Esc
Printer-friendly Version
Interactive Discussion
Discussion
Paper
|D
iscussionP
aper|
Discussion
Paper
|D
iscussionP
aper|
6920ndash6926 2004Walker L R and del Moral R Primary succession and ecosystem rehabilitation Cambridge
UK Cambridge University Press 2003White D C Davis W M Nickels J S King J D and Bobbie R J Determination of the
sedimentary microbial biomass by extractible lipid phosphate Oecologia 40 51ndash62 19795
Zaady E Ben-David E A Sher Y Tzirkin R and Nejidat A Inferring biological soil crustsuccessional stage using combined PLFA DGGE physical and biophysiological analysesSoil Biol Biochem 42 842ndash849 2010
Zelles L Bai Q Y Rackwitz R Chadwick D and Beese F Determination of phospholipid-and lipopolysaccharide-derived fatty acids as an estimate of microbial biomass and commu-10
nity structure in soils Biol Fert Soils 19 115ndash123 1995Zelles L Fatty acid patterns of phospholipids and lipopolysaccharides in the characterisation
of microbial communities in soil a review Biol Fert Soils 29 111ndash129 1999
1300
BGD8 1275ndash1308 2011
Microbial food webdynamics along a soilchronosequence of a
glacier forefield
J Esperschutz et al
Title Page
Abstract Introduction
Conclusions References
Tables Figures
J I
J I
Back Close
Full Screen Esc
Printer-friendly Version
Interactive Discussion
Discussion
Paper
|D
iscussionP
aper|
Discussion
Paper
|D
iscussionP
aper|
Table 1 Total C and N contents pH-values and δ13C natural abundance in soil (means ofn=5plusmn standard deviation) at different stages of ecosystem development (T1ndashT4)
ecosystemdevelopment
pH(CaCl2)
Ctotal[]
Ntotal[]
13C[permil V-PDB]
10 years (T1) 56 (01) 011 (009) 0004 (0002) minus2696 (239)60 years (T2) 48 (01) 078 (055) 0048 (0034) minus2650 (047)100 years (T3) 51 (06) 062 (035) 0040 (0028) minus2751 (056)gt700 years (T4) 43 (02) 650 (396) 0442 (0252) minus2672 (028)
1301
BGD8 1275ndash1308 2011
Microbial food webdynamics along a soilchronosequence of a
glacier forefield
J Esperschutz et al
Title Page
Abstract Introduction
Conclusions References
Tables Figures
J I
J I
Back Close
Full Screen Esc
Printer-friendly Version
Interactive Discussion
Discussion
Paper
|D
iscussionP
aper|
Discussion
Paper
|D
iscussionP
aper|
Table 2 Plant litter mass loss and selected parameters during the litter incubation period alongthe Damma forefield (means of n=5plusmn standard deviation)
8 weeks 12 weeks
initial plant litter T1 T2 T3 T4 T1 T2 T3 T4
plant litter[g per litterbag DW]
250 112(011)
095(011)
091(010)
087(012)
088(008)
084(016)
083(031)
093(036)
remaining plant litter[]
10000 4468(422)
3803(452)
3627(394)
3490(495)
3514(310)
3350(624)
3321(1241)
3740(1440)
Ctotal[g per litterbag DW]
096(006)
059(015)
042(004)
042(005)
040(004)
045(013)
038(006)
037(014)
042(017)
13Ctotal
[permil δ13C V-PDB]8835(161)
8400(442)
8233(441)
8347(441)
8553(309)
8650(214)
8019(736)
8104(315)
8145(531)
Ntotal[g litterbag DW]
004(001)
004(000)
003(001)
003(000)
003(000)
003(001)
003(001)
003(001)
003(001)
CN 2270(122)
1332(075)
1331(057)
1357(111)
1335(057)
1298(090)
1285(088)
1386(047)
1340(118)
1302
BGD8 1275ndash1308 2011
Microbial food webdynamics along a soilchronosequence of a
glacier forefield
J Esperschutz et al
Title Page
Abstract Introduction
Conclusions References
Tables Figures
J I
J I
Back Close
Full Screen Esc
Printer-friendly Version
Interactive Discussion
Discussion
Paper
|D
iscussionP
aper|
Discussion
Paper
|D
iscussionP
aper|
Table 3 Microbial diversity and evenness (Shannon indices) at T1ndashT4 after 8 weeks and 12weeks of litter application as well as without litter (control) Values are illustrated as means(n=5plusmn standard deviation)
control 8 weeks 12 weeks
10 60 100 gt700 y 10 60 100 gt700 y 10 60 100 gt700 y
Shannondiversity
1600(0154)a
2733(0111)b
2869(0082)b
2869(0033)b
2257(0108)a
2562(0108)b
2478(0147)b
2823(0050)c
2337(00377)a
2512(0053)b
2698(0139)c
21 717(0060)c
Shannonevenness
0667(0084)a
0839(0034)b
0861(0025)b
0850(0011)b
0685(0033)a
0777(0032)b
0752(0045)b
0830(0015)c
0687(0011)a
0762(0016)b
0819(0042)c
0834(0018)c
Letters (abc) indicates significant differences plt005 within treatments (control 8 weeks 12 weeks)
1303
BGD8 1275ndash1308 2011
Microbial food webdynamics along a soilchronosequence of a
glacier forefield
J Esperschutz et al
Title Page
Abstract Introduction
Conclusions References
Tables Figures
J I
J I
Back Close
Full Screen Esc
Printer-friendly Version
Interactive Discussion
Discussion
Paper
|D
iscussionP
aper|
Discussion
Paper
|D
iscussionP
aper|
0
400
800
1200
PL to
tal [
nmol
g-1
DW
] control8 weeks12 weeks
a)
T1 T2 T3 T4000
005
010
015
020
025
o
f ad
ded
13C
in t
ota
l PL
8 weeks12 weeks
T1 T2 T3 T4
b)
Fig 1 Total phospholipid (PL) content (a) in soil (nmol gminus1 DW) and the percent of added13C incorporated into total PL (b) at different stages of ecosystem development T1ndashT4 andindividual harvesting time points (means + standard deviation n=5)
1304
BGD8 1275ndash1308 2011
Microbial food webdynamics along a soilchronosequence of a
glacier forefield
J Esperschutz et al
Title Page
Abstract Introduction
Conclusions References
Tables Figures
J I
J I
Back Close
Full Screen Esc
Printer-friendly Version
Interactive Discussion
Discussion
Paper
|D
iscussionP
aper|
Discussion
Paper
|D
iscussionP
aper|
34
control treatment
8 weeks litter incubation
12 weeks litter incubation
isoi140 i150 i160 i170
anta140 a150 a170
unbbr13170 br180
10Me10Me170 10Me190
nor lt 20n150 n160
nor gt 20n220 n240
cycy170 cy190
- 51615
- 71617 1817
- 81518
- 91619 1819
- 1116111
PUFA18269 182812 204 224
PLELiso200
minus04 minus02 00 02 04
minus0
4minus
02
00
02
04
PC1
PC
2
T1
T2
T3 T4
T1 T2
T3
T4
T1 T2
T3
T4
minus3 minus2 minus1 0 1 2 3
minus3
minus2
minus1
01
23
iso
ant
unb
10Me
nor gt20
nor lt20
cy
-5
-7
-8
-9-11
pufaplel
707
Fig 2 Illustration of the first (PC1) and the second (PC2) principal components of the 708
principal component analysis (PCA) of all PL groups on mol basis (means of n=5) 709
Fig 2 Illustration of the first (PC1) and the second (PC2) principal components of the principalcomponent analysis (PCA) of all PL groups on mol basis (means of n=5)
1305
BGD8 1275ndash1308 2011
Microbial food webdynamics along a soilchronosequence of a
glacier forefield
J Esperschutz et al
Title Page
Abstract Introduction
Conclusions References
Tables Figures
J I
J I
Back Close
Full Screen Esc
Printer-friendly Version
Interactive Discussion
Discussion
Paper
|D
iscussionP
aper|
Discussion
Paper
|D
iscussionP
aper|
35
iso
ant
un
b
10M
e
n
orlt2
0
n
orgt2
0
cy
-
5
-
7
-
8
-9
-
11
PU
FA
PLE
L
-40
-30
-20
-10
0
10na
tura
l abu
ndan
ce13
C vs
V-P
DB
T1 - 10 yearsT2 - 60 yearsT3 - 100 yearsT4 - gt700 years
710
Fig 3 Natural abundance δ13C values [permil vs V-PDB] in individual PL groups in soil without 711
litter application (means plusmn standard deviation n=5) PL groups were formed as described in 712
Fig 2 and 5 713
Fig 3 Natural abundance δ13C values [permil vs V-PDB] in individual PL groups in soil withoutlitter application (means plusmn standard deviation n= 5) PL groups were formed as described inFigs 2 and 5
1306
BGD8 1275ndash1308 2011
Microbial food webdynamics along a soilchronosequence of a
glacier forefield
J Esperschutz et al
Title Page
Abstract Introduction
Conclusions References
Tables Figures
J I
J I
Back Close
Full Screen Esc
Printer-friendly Version
Interactive Discussion
Discussion
Paper
|D
iscussionP
aper|
Discussion
Paper
|D
iscussionP
aper|
iso
ant
unb
10Me
norlt20
norgt20
cy
-w 5
-w7
-w8
-w 9
-w11
PUFA
PLEL
10 years 60 years 100 yearsgt 700 years
a) b)
relative distribution of plant litter derived 13C []
iso
ant
unb
10Me
norlt20
norgt20
cy
-w 5
-w7
-w8
-w 9
-w11
PUFA
PLEL
0 2010 30 40 50 60 0 2010 30 40 50 60
Fig 4 Distribution of 13C derived from litter within PL groups in relative to total litter derived13C into total PL according to Fig 1 (means + standard deviation n= 5) after 8 weeks (a) and12 weeks (b) of litter incubation PL groups were formed as described in Figs 2 and 5
1307
BGD8 1275ndash1308 2011
Microbial food webdynamics along a soilchronosequence of a
glacier forefield
J Esperschutz et al
Title Page
Abstract Introduction
Conclusions References
Tables Figures
J I
J I
Back Close
Full Screen Esc
Printer-friendly Version
Interactive Discussion
Discussion
Paper
|D
iscussionP
aper|
Discussion
Paper
|D
iscussionP
aper|
37
8 weeks litter incubation
12 weeks litter incubation
isoi140 i150 i160 i170
anta140 a150 a170
unbbr13170 br180
10Me10Me170 10Me190
nor lt 20n150 n160
nor gt 20n220 n240
cycy170 cy190
- 51615
- 71617 1817
- 91619 1819
PUFA18269 182812 204 224
PLELiso200
-04 -02 00 02 04 06
-04
-02
00
02
04
06
PC1
PC
2
T1
T2
T3
T4
T1
T2
T3
T4
-2 0 2 4
-20
24
iso
antunb
10Me
norlt20norgt20
cy
-5
-7 -9
pufa
plel
718
Fig 5 First (PC1) and second (PC2) principal components of the principal component 719
analysis (PCA) illustrating the distribution of 13C derived from litter within PL groups (in 720
relative to total 13C derived from litter into total PL according to Fig 1 means of n=5) 721
722
Fig 5 First (PC1) and second (PC2) principal components of the principal component analysis(PCA) illustrating the distribution of 13C derived from litter within PL groups (in relative to total13C derived from litter into total PL according to Fig 1 means of n=5)
1308
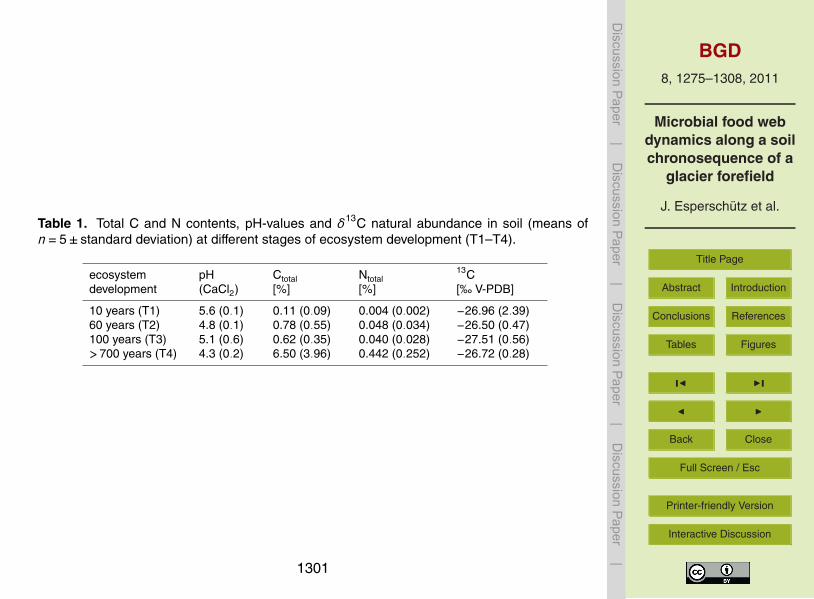
BGD8 1275ndash1308 2011
Microbial food webdynamics along a soilchronosequence of a
glacier forefield
J Esperschutz et al
Title Page
Abstract Introduction
Conclusions References
Tables Figures
J I
J I
Back Close
Full Screen Esc
Printer-friendly Version
Interactive Discussion
Discussion
Paper
|D
iscussionP
aper|
Discussion
Paper
|D
iscussionP
aper|
Table 1 Total C and N contents pH-values and δ13C natural abundance in soil (means ofn=5plusmn standard deviation) at different stages of ecosystem development (T1ndashT4)
ecosystemdevelopment
pH(CaCl2)
Ctotal[]
Ntotal[]
13C[permil V-PDB]
10 years (T1) 56 (01) 011 (009) 0004 (0002) minus2696 (239)60 years (T2) 48 (01) 078 (055) 0048 (0034) minus2650 (047)100 years (T3) 51 (06) 062 (035) 0040 (0028) minus2751 (056)gt700 years (T4) 43 (02) 650 (396) 0442 (0252) minus2672 (028)
1301
BGD8 1275ndash1308 2011
Microbial food webdynamics along a soilchronosequence of a
glacier forefield
J Esperschutz et al
Title Page
Abstract Introduction
Conclusions References
Tables Figures
J I
J I
Back Close
Full Screen Esc
Printer-friendly Version
Interactive Discussion
Discussion
Paper
|D
iscussionP
aper|
Discussion
Paper
|D
iscussionP
aper|
Table 2 Plant litter mass loss and selected parameters during the litter incubation period alongthe Damma forefield (means of n=5plusmn standard deviation)
8 weeks 12 weeks
initial plant litter T1 T2 T3 T4 T1 T2 T3 T4
plant litter[g per litterbag DW]
250 112(011)
095(011)
091(010)
087(012)
088(008)
084(016)
083(031)
093(036)
remaining plant litter[]
10000 4468(422)
3803(452)
3627(394)
3490(495)
3514(310)
3350(624)
3321(1241)
3740(1440)
Ctotal[g per litterbag DW]
096(006)
059(015)
042(004)
042(005)
040(004)
045(013)
038(006)
037(014)
042(017)
13Ctotal
[permil δ13C V-PDB]8835(161)
8400(442)
8233(441)
8347(441)
8553(309)
8650(214)
8019(736)
8104(315)
8145(531)
Ntotal[g litterbag DW]
004(001)
004(000)
003(001)
003(000)
003(000)
003(001)
003(001)
003(001)
003(001)
CN 2270(122)
1332(075)
1331(057)
1357(111)
1335(057)
1298(090)
1285(088)
1386(047)
1340(118)
1302
BGD8 1275ndash1308 2011
Microbial food webdynamics along a soilchronosequence of a
glacier forefield
J Esperschutz et al
Title Page
Abstract Introduction
Conclusions References
Tables Figures
J I
J I
Back Close
Full Screen Esc
Printer-friendly Version
Interactive Discussion
Discussion
Paper
|D
iscussionP
aper|
Discussion
Paper
|D
iscussionP
aper|
Table 3 Microbial diversity and evenness (Shannon indices) at T1ndashT4 after 8 weeks and 12weeks of litter application as well as without litter (control) Values are illustrated as means(n=5plusmn standard deviation)
control 8 weeks 12 weeks
10 60 100 gt700 y 10 60 100 gt700 y 10 60 100 gt700 y
Shannondiversity
1600(0154)a
2733(0111)b
2869(0082)b
2869(0033)b
2257(0108)a
2562(0108)b
2478(0147)b
2823(0050)c
2337(00377)a
2512(0053)b
2698(0139)c
21 717(0060)c
Shannonevenness
0667(0084)a
0839(0034)b
0861(0025)b
0850(0011)b
0685(0033)a
0777(0032)b
0752(0045)b
0830(0015)c
0687(0011)a
0762(0016)b
0819(0042)c
0834(0018)c
Letters (abc) indicates significant differences plt005 within treatments (control 8 weeks 12 weeks)
1303
BGD8 1275ndash1308 2011
Microbial food webdynamics along a soilchronosequence of a
glacier forefield
J Esperschutz et al
Title Page
Abstract Introduction
Conclusions References
Tables Figures
J I
J I
Back Close
Full Screen Esc
Printer-friendly Version
Interactive Discussion
Discussion
Paper
|D
iscussionP
aper|
Discussion
Paper
|D
iscussionP
aper|
0
400
800
1200
PL to
tal [
nmol
g-1
DW
] control8 weeks12 weeks
a)
T1 T2 T3 T4000
005
010
015
020
025
o
f ad
ded
13C
in t
ota
l PL
8 weeks12 weeks
T1 T2 T3 T4
b)
Fig 1 Total phospholipid (PL) content (a) in soil (nmol gminus1 DW) and the percent of added13C incorporated into total PL (b) at different stages of ecosystem development T1ndashT4 andindividual harvesting time points (means + standard deviation n=5)
1304
BGD8 1275ndash1308 2011
Microbial food webdynamics along a soilchronosequence of a
glacier forefield
J Esperschutz et al
Title Page
Abstract Introduction
Conclusions References
Tables Figures
J I
J I
Back Close
Full Screen Esc
Printer-friendly Version
Interactive Discussion
Discussion
Paper
|D
iscussionP
aper|
Discussion
Paper
|D
iscussionP
aper|
34
control treatment
8 weeks litter incubation
12 weeks litter incubation
isoi140 i150 i160 i170
anta140 a150 a170
unbbr13170 br180
10Me10Me170 10Me190
nor lt 20n150 n160
nor gt 20n220 n240
cycy170 cy190
- 51615
- 71617 1817
- 81518
- 91619 1819
- 1116111
PUFA18269 182812 204 224
PLELiso200
minus04 minus02 00 02 04
minus0
4minus
02
00
02
04
PC1
PC
2
T1
T2
T3 T4
T1 T2
T3
T4
T1 T2
T3
T4
minus3 minus2 minus1 0 1 2 3
minus3
minus2
minus1
01
23
iso
ant
unb
10Me
nor gt20
nor lt20
cy
-5
-7
-8
-9-11
pufaplel
707
Fig 2 Illustration of the first (PC1) and the second (PC2) principal components of the 708
principal component analysis (PCA) of all PL groups on mol basis (means of n=5) 709
Fig 2 Illustration of the first (PC1) and the second (PC2) principal components of the principalcomponent analysis (PCA) of all PL groups on mol basis (means of n=5)
1305
BGD8 1275ndash1308 2011
Microbial food webdynamics along a soilchronosequence of a
glacier forefield
J Esperschutz et al
Title Page
Abstract Introduction
Conclusions References
Tables Figures
J I
J I
Back Close
Full Screen Esc
Printer-friendly Version
Interactive Discussion
Discussion
Paper
|D
iscussionP
aper|
Discussion
Paper
|D
iscussionP
aper|
35
iso
ant
un
b
10M
e
n
orlt2
0
n
orgt2
0
cy
-
5
-
7
-
8
-9
-
11
PU
FA
PLE
L
-40
-30
-20
-10
0
10na
tura
l abu
ndan
ce13
C vs
V-P
DB
T1 - 10 yearsT2 - 60 yearsT3 - 100 yearsT4 - gt700 years
710
Fig 3 Natural abundance δ13C values [permil vs V-PDB] in individual PL groups in soil without 711
litter application (means plusmn standard deviation n=5) PL groups were formed as described in 712
Fig 2 and 5 713
Fig 3 Natural abundance δ13C values [permil vs V-PDB] in individual PL groups in soil withoutlitter application (means plusmn standard deviation n= 5) PL groups were formed as described inFigs 2 and 5
1306
BGD8 1275ndash1308 2011
Microbial food webdynamics along a soilchronosequence of a
glacier forefield
J Esperschutz et al
Title Page
Abstract Introduction
Conclusions References
Tables Figures
J I
J I
Back Close
Full Screen Esc
Printer-friendly Version
Interactive Discussion
Discussion
Paper
|D
iscussionP
aper|
Discussion
Paper
|D
iscussionP
aper|
iso
ant
unb
10Me
norlt20
norgt20
cy
-w 5
-w7
-w8
-w 9
-w11
PUFA
PLEL
10 years 60 years 100 yearsgt 700 years
a) b)
relative distribution of plant litter derived 13C []
iso
ant
unb
10Me
norlt20
norgt20
cy
-w 5
-w7
-w8
-w 9
-w11
PUFA
PLEL
0 2010 30 40 50 60 0 2010 30 40 50 60
Fig 4 Distribution of 13C derived from litter within PL groups in relative to total litter derived13C into total PL according to Fig 1 (means + standard deviation n= 5) after 8 weeks (a) and12 weeks (b) of litter incubation PL groups were formed as described in Figs 2 and 5
1307
BGD8 1275ndash1308 2011
Microbial food webdynamics along a soilchronosequence of a
glacier forefield
J Esperschutz et al
Title Page
Abstract Introduction
Conclusions References
Tables Figures
J I
J I
Back Close
Full Screen Esc
Printer-friendly Version
Interactive Discussion
Discussion
Paper
|D
iscussionP
aper|
Discussion
Paper
|D
iscussionP
aper|
37
8 weeks litter incubation
12 weeks litter incubation
isoi140 i150 i160 i170
anta140 a150 a170
unbbr13170 br180
10Me10Me170 10Me190
nor lt 20n150 n160
nor gt 20n220 n240
cycy170 cy190
- 51615
- 71617 1817
- 91619 1819
PUFA18269 182812 204 224
PLELiso200
-04 -02 00 02 04 06
-04
-02
00
02
04
06
PC1
PC
2
T1
T2
T3
T4
T1
T2
T3
T4
-2 0 2 4
-20
24
iso
antunb
10Me
norlt20norgt20
cy
-5
-7 -9
pufa
plel
718
Fig 5 First (PC1) and second (PC2) principal components of the principal component 719
analysis (PCA) illustrating the distribution of 13C derived from litter within PL groups (in 720
relative to total 13C derived from litter into total PL according to Fig 1 means of n=5) 721
722
Fig 5 First (PC1) and second (PC2) principal components of the principal component analysis(PCA) illustrating the distribution of 13C derived from litter within PL groups (in relative to total13C derived from litter into total PL according to Fig 1 means of n=5)
1308
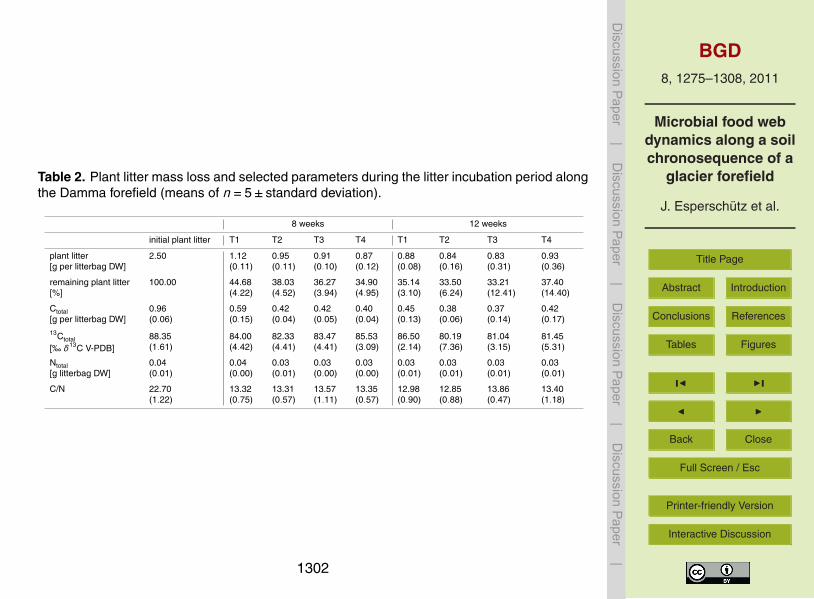
BGD8 1275ndash1308 2011
Microbial food webdynamics along a soilchronosequence of a
glacier forefield
J Esperschutz et al
Title Page
Abstract Introduction
Conclusions References
Tables Figures
J I
J I
Back Close
Full Screen Esc
Printer-friendly Version
Interactive Discussion
Discussion
Paper
|D
iscussionP
aper|
Discussion
Paper
|D
iscussionP
aper|
Table 2 Plant litter mass loss and selected parameters during the litter incubation period alongthe Damma forefield (means of n=5plusmn standard deviation)
8 weeks 12 weeks
initial plant litter T1 T2 T3 T4 T1 T2 T3 T4
plant litter[g per litterbag DW]
250 112(011)
095(011)
091(010)
087(012)
088(008)
084(016)
083(031)
093(036)
remaining plant litter[]
10000 4468(422)
3803(452)
3627(394)
3490(495)
3514(310)
3350(624)
3321(1241)
3740(1440)
Ctotal[g per litterbag DW]
096(006)
059(015)
042(004)
042(005)
040(004)
045(013)
038(006)
037(014)
042(017)
13Ctotal
[permil δ13C V-PDB]8835(161)
8400(442)
8233(441)
8347(441)
8553(309)
8650(214)
8019(736)
8104(315)
8145(531)
Ntotal[g litterbag DW]
004(001)
004(000)
003(001)
003(000)
003(000)
003(001)
003(001)
003(001)
003(001)
CN 2270(122)
1332(075)
1331(057)
1357(111)
1335(057)
1298(090)
1285(088)
1386(047)
1340(118)
1302
BGD8 1275ndash1308 2011
Microbial food webdynamics along a soilchronosequence of a
glacier forefield
J Esperschutz et al
Title Page
Abstract Introduction
Conclusions References
Tables Figures
J I
J I
Back Close
Full Screen Esc
Printer-friendly Version
Interactive Discussion
Discussion
Paper
|D
iscussionP
aper|
Discussion
Paper
|D
iscussionP
aper|
Table 3 Microbial diversity and evenness (Shannon indices) at T1ndashT4 after 8 weeks and 12weeks of litter application as well as without litter (control) Values are illustrated as means(n=5plusmn standard deviation)
control 8 weeks 12 weeks
10 60 100 gt700 y 10 60 100 gt700 y 10 60 100 gt700 y
Shannondiversity
1600(0154)a
2733(0111)b
2869(0082)b
2869(0033)b
2257(0108)a
2562(0108)b
2478(0147)b
2823(0050)c
2337(00377)a
2512(0053)b
2698(0139)c
21 717(0060)c
Shannonevenness
0667(0084)a
0839(0034)b
0861(0025)b
0850(0011)b
0685(0033)a
0777(0032)b
0752(0045)b
0830(0015)c
0687(0011)a
0762(0016)b
0819(0042)c
0834(0018)c
Letters (abc) indicates significant differences plt005 within treatments (control 8 weeks 12 weeks)
1303
BGD8 1275ndash1308 2011
Microbial food webdynamics along a soilchronosequence of a
glacier forefield
J Esperschutz et al
Title Page
Abstract Introduction
Conclusions References
Tables Figures
J I
J I
Back Close
Full Screen Esc
Printer-friendly Version
Interactive Discussion
Discussion
Paper
|D
iscussionP
aper|
Discussion
Paper
|D
iscussionP
aper|
0
400
800
1200
PL to
tal [
nmol
g-1
DW
] control8 weeks12 weeks
a)
T1 T2 T3 T4000
005
010
015
020
025
o
f ad
ded
13C
in t
ota
l PL
8 weeks12 weeks
T1 T2 T3 T4
b)
Fig 1 Total phospholipid (PL) content (a) in soil (nmol gminus1 DW) and the percent of added13C incorporated into total PL (b) at different stages of ecosystem development T1ndashT4 andindividual harvesting time points (means + standard deviation n=5)
1304
BGD8 1275ndash1308 2011
Microbial food webdynamics along a soilchronosequence of a
glacier forefield
J Esperschutz et al
Title Page
Abstract Introduction
Conclusions References
Tables Figures
J I
J I
Back Close
Full Screen Esc
Printer-friendly Version
Interactive Discussion
Discussion
Paper
|D
iscussionP
aper|
Discussion
Paper
|D
iscussionP
aper|
34
control treatment
8 weeks litter incubation
12 weeks litter incubation
isoi140 i150 i160 i170
anta140 a150 a170
unbbr13170 br180
10Me10Me170 10Me190
nor lt 20n150 n160
nor gt 20n220 n240
cycy170 cy190
- 51615
- 71617 1817
- 81518
- 91619 1819
- 1116111
PUFA18269 182812 204 224
PLELiso200
minus04 minus02 00 02 04
minus0
4minus
02
00
02
04
PC1
PC
2
T1
T2
T3 T4
T1 T2
T3
T4
T1 T2
T3
T4
minus3 minus2 minus1 0 1 2 3
minus3
minus2
minus1
01
23
iso
ant
unb
10Me
nor gt20
nor lt20
cy
-5
-7
-8
-9-11
pufaplel
707
Fig 2 Illustration of the first (PC1) and the second (PC2) principal components of the 708
principal component analysis (PCA) of all PL groups on mol basis (means of n=5) 709
Fig 2 Illustration of the first (PC1) and the second (PC2) principal components of the principalcomponent analysis (PCA) of all PL groups on mol basis (means of n=5)
1305
BGD8 1275ndash1308 2011
Microbial food webdynamics along a soilchronosequence of a
glacier forefield
J Esperschutz et al
Title Page
Abstract Introduction
Conclusions References
Tables Figures
J I
J I
Back Close
Full Screen Esc
Printer-friendly Version
Interactive Discussion
Discussion
Paper
|D
iscussionP
aper|
Discussion
Paper
|D
iscussionP
aper|
35
iso
ant
un
b
10M
e
n
orlt2
0
n
orgt2
0
cy
-
5
-
7
-
8
-9
-
11
PU
FA
PLE
L
-40
-30
-20
-10
0
10na
tura
l abu
ndan
ce13
C vs
V-P
DB
T1 - 10 yearsT2 - 60 yearsT3 - 100 yearsT4 - gt700 years
710
Fig 3 Natural abundance δ13C values [permil vs V-PDB] in individual PL groups in soil without 711
litter application (means plusmn standard deviation n=5) PL groups were formed as described in 712
Fig 2 and 5 713
Fig 3 Natural abundance δ13C values [permil vs V-PDB] in individual PL groups in soil withoutlitter application (means plusmn standard deviation n= 5) PL groups were formed as described inFigs 2 and 5
1306
BGD8 1275ndash1308 2011
Microbial food webdynamics along a soilchronosequence of a
glacier forefield
J Esperschutz et al
Title Page
Abstract Introduction
Conclusions References
Tables Figures
J I
J I
Back Close
Full Screen Esc
Printer-friendly Version
Interactive Discussion
Discussion
Paper
|D
iscussionP
aper|
Discussion
Paper
|D
iscussionP
aper|
iso
ant
unb
10Me
norlt20
norgt20
cy
-w 5
-w7
-w8
-w 9
-w11
PUFA
PLEL
10 years 60 years 100 yearsgt 700 years
a) b)
relative distribution of plant litter derived 13C []
iso
ant
unb
10Me
norlt20
norgt20
cy
-w 5
-w7
-w8
-w 9
-w11
PUFA
PLEL
0 2010 30 40 50 60 0 2010 30 40 50 60
Fig 4 Distribution of 13C derived from litter within PL groups in relative to total litter derived13C into total PL according to Fig 1 (means + standard deviation n= 5) after 8 weeks (a) and12 weeks (b) of litter incubation PL groups were formed as described in Figs 2 and 5
1307
BGD8 1275ndash1308 2011
Microbial food webdynamics along a soilchronosequence of a
glacier forefield
J Esperschutz et al
Title Page
Abstract Introduction
Conclusions References
Tables Figures
J I
J I
Back Close
Full Screen Esc
Printer-friendly Version
Interactive Discussion
Discussion
Paper
|D
iscussionP
aper|
Discussion
Paper
|D
iscussionP
aper|
37
8 weeks litter incubation
12 weeks litter incubation
isoi140 i150 i160 i170
anta140 a150 a170
unbbr13170 br180
10Me10Me170 10Me190
nor lt 20n150 n160
nor gt 20n220 n240
cycy170 cy190
- 51615
- 71617 1817
- 91619 1819
PUFA18269 182812 204 224
PLELiso200
-04 -02 00 02 04 06
-04
-02
00
02
04
06
PC1
PC
2
T1
T2
T3
T4
T1
T2
T3
T4
-2 0 2 4
-20
24
iso
antunb
10Me
norlt20norgt20
cy
-5
-7 -9
pufa
plel
718
Fig 5 First (PC1) and second (PC2) principal components of the principal component 719
analysis (PCA) illustrating the distribution of 13C derived from litter within PL groups (in 720
relative to total 13C derived from litter into total PL according to Fig 1 means of n=5) 721
722
Fig 5 First (PC1) and second (PC2) principal components of the principal component analysis(PCA) illustrating the distribution of 13C derived from litter within PL groups (in relative to total13C derived from litter into total PL according to Fig 1 means of n=5)
1308
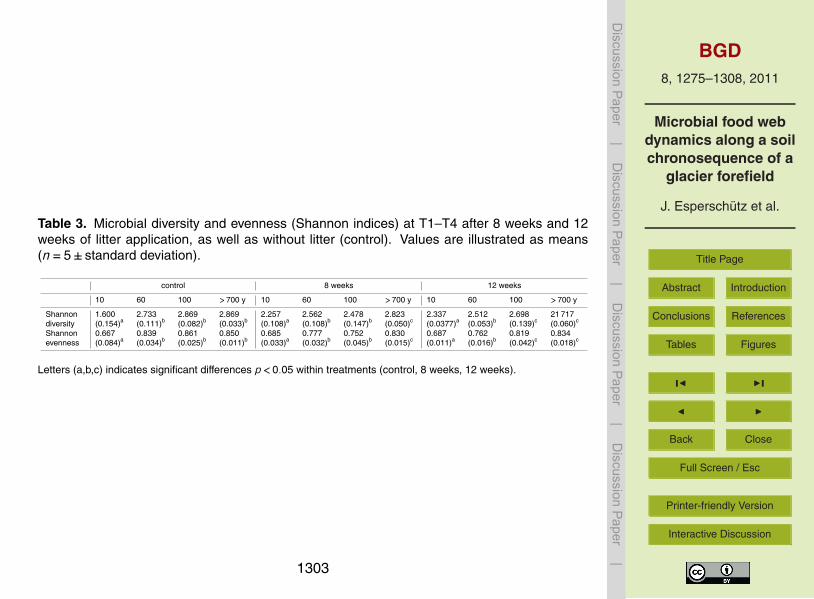
BGD8 1275ndash1308 2011
Microbial food webdynamics along a soilchronosequence of a
glacier forefield
J Esperschutz et al
Title Page
Abstract Introduction
Conclusions References
Tables Figures
J I
J I
Back Close
Full Screen Esc
Printer-friendly Version
Interactive Discussion
Discussion
Paper
|D
iscussionP
aper|
Discussion
Paper
|D
iscussionP
aper|
Table 3 Microbial diversity and evenness (Shannon indices) at T1ndashT4 after 8 weeks and 12weeks of litter application as well as without litter (control) Values are illustrated as means(n=5plusmn standard deviation)
control 8 weeks 12 weeks
10 60 100 gt700 y 10 60 100 gt700 y 10 60 100 gt700 y
Shannondiversity
1600(0154)a
2733(0111)b
2869(0082)b
2869(0033)b
2257(0108)a
2562(0108)b
2478(0147)b
2823(0050)c
2337(00377)a
2512(0053)b
2698(0139)c
21 717(0060)c
Shannonevenness
0667(0084)a
0839(0034)b
0861(0025)b
0850(0011)b
0685(0033)a
0777(0032)b
0752(0045)b
0830(0015)c
0687(0011)a
0762(0016)b
0819(0042)c
0834(0018)c
Letters (abc) indicates significant differences plt005 within treatments (control 8 weeks 12 weeks)
1303
BGD8 1275ndash1308 2011
Microbial food webdynamics along a soilchronosequence of a
glacier forefield
J Esperschutz et al
Title Page
Abstract Introduction
Conclusions References
Tables Figures
J I
J I
Back Close
Full Screen Esc
Printer-friendly Version
Interactive Discussion
Discussion
Paper
|D
iscussionP
aper|
Discussion
Paper
|D
iscussionP
aper|
0
400
800
1200
PL to
tal [
nmol
g-1
DW
] control8 weeks12 weeks
a)
T1 T2 T3 T4000
005
010
015
020
025
o
f ad
ded
13C
in t
ota
l PL
8 weeks12 weeks
T1 T2 T3 T4
b)
Fig 1 Total phospholipid (PL) content (a) in soil (nmol gminus1 DW) and the percent of added13C incorporated into total PL (b) at different stages of ecosystem development T1ndashT4 andindividual harvesting time points (means + standard deviation n=5)
1304
BGD8 1275ndash1308 2011
Microbial food webdynamics along a soilchronosequence of a
glacier forefield
J Esperschutz et al
Title Page
Abstract Introduction
Conclusions References
Tables Figures
J I
J I
Back Close
Full Screen Esc
Printer-friendly Version
Interactive Discussion
Discussion
Paper
|D
iscussionP
aper|
Discussion
Paper
|D
iscussionP
aper|
34
control treatment
8 weeks litter incubation
12 weeks litter incubation
isoi140 i150 i160 i170
anta140 a150 a170
unbbr13170 br180
10Me10Me170 10Me190
nor lt 20n150 n160
nor gt 20n220 n240
cycy170 cy190
- 51615
- 71617 1817
- 81518
- 91619 1819
- 1116111
PUFA18269 182812 204 224
PLELiso200
minus04 minus02 00 02 04
minus0
4minus
02
00
02
04
PC1
PC
2
T1
T2
T3 T4
T1 T2
T3
T4
T1 T2
T3
T4
minus3 minus2 minus1 0 1 2 3
minus3
minus2
minus1
01
23
iso
ant
unb
10Me
nor gt20
nor lt20
cy
-5
-7
-8
-9-11
pufaplel
707
Fig 2 Illustration of the first (PC1) and the second (PC2) principal components of the 708
principal component analysis (PCA) of all PL groups on mol basis (means of n=5) 709
Fig 2 Illustration of the first (PC1) and the second (PC2) principal components of the principalcomponent analysis (PCA) of all PL groups on mol basis (means of n=5)
1305
BGD8 1275ndash1308 2011
Microbial food webdynamics along a soilchronosequence of a
glacier forefield
J Esperschutz et al
Title Page
Abstract Introduction
Conclusions References
Tables Figures
J I
J I
Back Close
Full Screen Esc
Printer-friendly Version
Interactive Discussion
Discussion
Paper
|D
iscussionP
aper|
Discussion
Paper
|D
iscussionP
aper|
35
iso
ant
un
b
10M
e
n
orlt2
0
n
orgt2
0
cy
-
5
-
7
-
8
-9
-
11
PU
FA
PLE
L
-40
-30
-20
-10
0
10na
tura
l abu
ndan
ce13
C vs
V-P
DB
T1 - 10 yearsT2 - 60 yearsT3 - 100 yearsT4 - gt700 years
710
Fig 3 Natural abundance δ13C values [permil vs V-PDB] in individual PL groups in soil without 711
litter application (means plusmn standard deviation n=5) PL groups were formed as described in 712
Fig 2 and 5 713
Fig 3 Natural abundance δ13C values [permil vs V-PDB] in individual PL groups in soil withoutlitter application (means plusmn standard deviation n= 5) PL groups were formed as described inFigs 2 and 5
1306
BGD8 1275ndash1308 2011
Microbial food webdynamics along a soilchronosequence of a
glacier forefield
J Esperschutz et al
Title Page
Abstract Introduction
Conclusions References
Tables Figures
J I
J I
Back Close
Full Screen Esc
Printer-friendly Version
Interactive Discussion
Discussion
Paper
|D
iscussionP
aper|
Discussion
Paper
|D
iscussionP
aper|
iso
ant
unb
10Me
norlt20
norgt20
cy
-w 5
-w7
-w8
-w 9
-w11
PUFA
PLEL
10 years 60 years 100 yearsgt 700 years
a) b)
relative distribution of plant litter derived 13C []
iso
ant
unb
10Me
norlt20
norgt20
cy
-w 5
-w7
-w8
-w 9
-w11
PUFA
PLEL
0 2010 30 40 50 60 0 2010 30 40 50 60
Fig 4 Distribution of 13C derived from litter within PL groups in relative to total litter derived13C into total PL according to Fig 1 (means + standard deviation n= 5) after 8 weeks (a) and12 weeks (b) of litter incubation PL groups were formed as described in Figs 2 and 5
1307
BGD8 1275ndash1308 2011
Microbial food webdynamics along a soilchronosequence of a
glacier forefield
J Esperschutz et al
Title Page
Abstract Introduction
Conclusions References
Tables Figures
J I
J I
Back Close
Full Screen Esc
Printer-friendly Version
Interactive Discussion
Discussion
Paper
|D
iscussionP
aper|
Discussion
Paper
|D
iscussionP
aper|
37
8 weeks litter incubation
12 weeks litter incubation
isoi140 i150 i160 i170
anta140 a150 a170
unbbr13170 br180
10Me10Me170 10Me190
nor lt 20n150 n160
nor gt 20n220 n240
cycy170 cy190
- 51615
- 71617 1817
- 91619 1819
PUFA18269 182812 204 224
PLELiso200
-04 -02 00 02 04 06
-04
-02
00
02
04
06
PC1
PC
2
T1
T2
T3
T4
T1
T2
T3
T4
-2 0 2 4
-20
24
iso
antunb
10Me
norlt20norgt20
cy
-5
-7 -9
pufa
plel
718
Fig 5 First (PC1) and second (PC2) principal components of the principal component 719
analysis (PCA) illustrating the distribution of 13C derived from litter within PL groups (in 720
relative to total 13C derived from litter into total PL according to Fig 1 means of n=5) 721
722
Fig 5 First (PC1) and second (PC2) principal components of the principal component analysis(PCA) illustrating the distribution of 13C derived from litter within PL groups (in relative to total13C derived from litter into total PL according to Fig 1 means of n=5)
1308
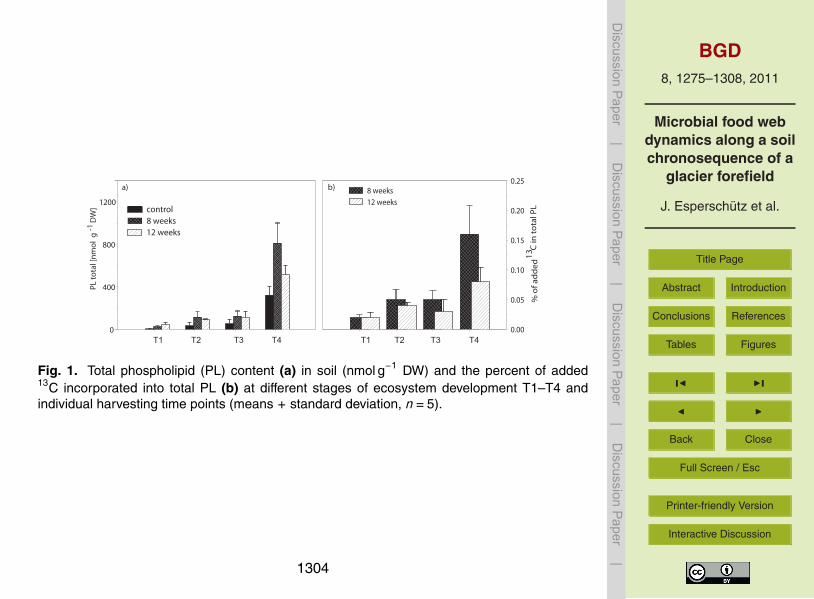
BGD8 1275ndash1308 2011
Microbial food webdynamics along a soilchronosequence of a
glacier forefield
J Esperschutz et al
Title Page
Abstract Introduction
Conclusions References
Tables Figures
J I
J I
Back Close
Full Screen Esc
Printer-friendly Version
Interactive Discussion
Discussion
Paper
|D
iscussionP
aper|
Discussion
Paper
|D
iscussionP
aper|
0
400
800
1200
PL to
tal [
nmol
g-1
DW
] control8 weeks12 weeks
a)
T1 T2 T3 T4000
005
010
015
020
025
o
f ad
ded
13C
in t
ota
l PL
8 weeks12 weeks
T1 T2 T3 T4
b)
Fig 1 Total phospholipid (PL) content (a) in soil (nmol gminus1 DW) and the percent of added13C incorporated into total PL (b) at different stages of ecosystem development T1ndashT4 andindividual harvesting time points (means + standard deviation n=5)
1304
BGD8 1275ndash1308 2011
Microbial food webdynamics along a soilchronosequence of a
glacier forefield
J Esperschutz et al
Title Page
Abstract Introduction
Conclusions References
Tables Figures
J I
J I
Back Close
Full Screen Esc
Printer-friendly Version
Interactive Discussion
Discussion
Paper
|D
iscussionP
aper|
Discussion
Paper
|D
iscussionP
aper|
34
control treatment
8 weeks litter incubation
12 weeks litter incubation
isoi140 i150 i160 i170
anta140 a150 a170
unbbr13170 br180
10Me10Me170 10Me190
nor lt 20n150 n160
nor gt 20n220 n240
cycy170 cy190
- 51615
- 71617 1817
- 81518
- 91619 1819
- 1116111
PUFA18269 182812 204 224
PLELiso200
minus04 minus02 00 02 04
minus0
4minus
02
00
02
04
PC1
PC
2
T1
T2
T3 T4
T1 T2
T3
T4
T1 T2
T3
T4
minus3 minus2 minus1 0 1 2 3
minus3
minus2
minus1
01
23
iso
ant
unb
10Me
nor gt20
nor lt20
cy
-5
-7
-8
-9-11
pufaplel
707
Fig 2 Illustration of the first (PC1) and the second (PC2) principal components of the 708
principal component analysis (PCA) of all PL groups on mol basis (means of n=5) 709
Fig 2 Illustration of the first (PC1) and the second (PC2) principal components of the principalcomponent analysis (PCA) of all PL groups on mol basis (means of n=5)
1305
BGD8 1275ndash1308 2011
Microbial food webdynamics along a soilchronosequence of a
glacier forefield
J Esperschutz et al
Title Page
Abstract Introduction
Conclusions References
Tables Figures
J I
J I
Back Close
Full Screen Esc
Printer-friendly Version
Interactive Discussion
Discussion
Paper
|D
iscussionP
aper|
Discussion
Paper
|D
iscussionP
aper|
35
iso
ant
un
b
10M
e
n
orlt2
0
n
orgt2
0
cy
-
5
-
7
-
8
-9
-
11
PU
FA
PLE
L
-40
-30
-20
-10
0
10na
tura
l abu
ndan
ce13
C vs
V-P
DB
T1 - 10 yearsT2 - 60 yearsT3 - 100 yearsT4 - gt700 years
710
Fig 3 Natural abundance δ13C values [permil vs V-PDB] in individual PL groups in soil without 711
litter application (means plusmn standard deviation n=5) PL groups were formed as described in 712
Fig 2 and 5 713
Fig 3 Natural abundance δ13C values [permil vs V-PDB] in individual PL groups in soil withoutlitter application (means plusmn standard deviation n= 5) PL groups were formed as described inFigs 2 and 5
1306
BGD8 1275ndash1308 2011
Microbial food webdynamics along a soilchronosequence of a
glacier forefield
J Esperschutz et al
Title Page
Abstract Introduction
Conclusions References
Tables Figures
J I
J I
Back Close
Full Screen Esc
Printer-friendly Version
Interactive Discussion
Discussion
Paper
|D
iscussionP
aper|
Discussion
Paper
|D
iscussionP
aper|
iso
ant
unb
10Me
norlt20
norgt20
cy
-w 5
-w7
-w8
-w 9
-w11
PUFA
PLEL
10 years 60 years 100 yearsgt 700 years
a) b)
relative distribution of plant litter derived 13C []
iso
ant
unb
10Me
norlt20
norgt20
cy
-w 5
-w7
-w8
-w 9
-w11
PUFA
PLEL
0 2010 30 40 50 60 0 2010 30 40 50 60
Fig 4 Distribution of 13C derived from litter within PL groups in relative to total litter derived13C into total PL according to Fig 1 (means + standard deviation n= 5) after 8 weeks (a) and12 weeks (b) of litter incubation PL groups were formed as described in Figs 2 and 5
1307
BGD8 1275ndash1308 2011
Microbial food webdynamics along a soilchronosequence of a
glacier forefield
J Esperschutz et al
Title Page
Abstract Introduction
Conclusions References
Tables Figures
J I
J I
Back Close
Full Screen Esc
Printer-friendly Version
Interactive Discussion
Discussion
Paper
|D
iscussionP
aper|
Discussion
Paper
|D
iscussionP
aper|
37
8 weeks litter incubation
12 weeks litter incubation
isoi140 i150 i160 i170
anta140 a150 a170
unbbr13170 br180
10Me10Me170 10Me190
nor lt 20n150 n160
nor gt 20n220 n240
cycy170 cy190
- 51615
- 71617 1817
- 91619 1819
PUFA18269 182812 204 224
PLELiso200
-04 -02 00 02 04 06
-04
-02
00
02
04
06
PC1
PC
2
T1
T2
T3
T4
T1
T2
T3
T4
-2 0 2 4
-20
24
iso
antunb
10Me
norlt20norgt20
cy
-5
-7 -9
pufa
plel
718
Fig 5 First (PC1) and second (PC2) principal components of the principal component 719
analysis (PCA) illustrating the distribution of 13C derived from litter within PL groups (in 720
relative to total 13C derived from litter into total PL according to Fig 1 means of n=5) 721
722
Fig 5 First (PC1) and second (PC2) principal components of the principal component analysis(PCA) illustrating the distribution of 13C derived from litter within PL groups (in relative to total13C derived from litter into total PL according to Fig 1 means of n=5)
1308
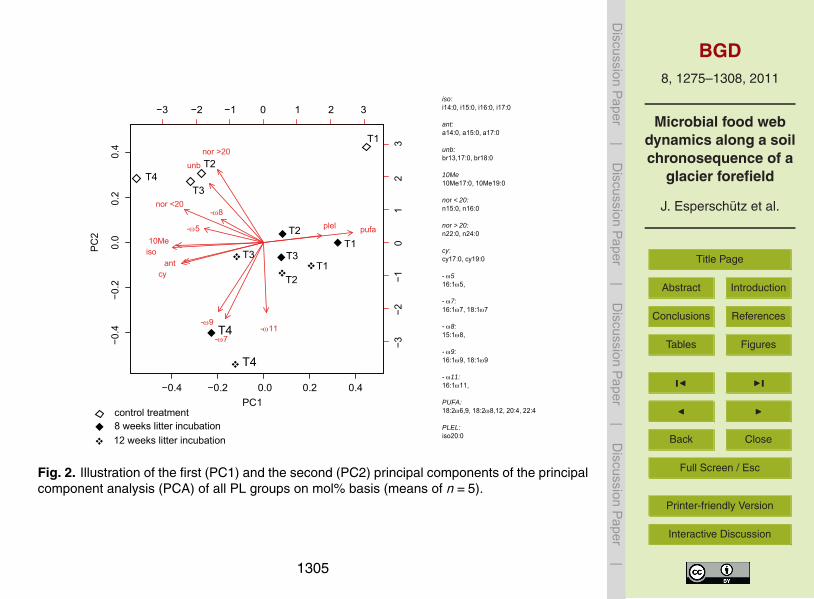
BGD8 1275ndash1308 2011
Microbial food webdynamics along a soilchronosequence of a
glacier forefield
J Esperschutz et al
Title Page
Abstract Introduction
Conclusions References
Tables Figures
J I
J I
Back Close
Full Screen Esc
Printer-friendly Version
Interactive Discussion
Discussion
Paper
|D
iscussionP
aper|
Discussion
Paper
|D
iscussionP
aper|
34
control treatment
8 weeks litter incubation
12 weeks litter incubation
isoi140 i150 i160 i170
anta140 a150 a170
unbbr13170 br180
10Me10Me170 10Me190
nor lt 20n150 n160
nor gt 20n220 n240
cycy170 cy190
- 51615
- 71617 1817
- 81518
- 91619 1819
- 1116111
PUFA18269 182812 204 224
PLELiso200
minus04 minus02 00 02 04
minus0
4minus
02
00
02
04
PC1
PC
2
T1
T2
T3 T4
T1 T2
T3
T4
T1 T2
T3
T4
minus3 minus2 minus1 0 1 2 3
minus3
minus2
minus1
01
23
iso
ant
unb
10Me
nor gt20
nor lt20
cy
-5
-7
-8
-9-11
pufaplel
707
Fig 2 Illustration of the first (PC1) and the second (PC2) principal components of the 708
principal component analysis (PCA) of all PL groups on mol basis (means of n=5) 709
Fig 2 Illustration of the first (PC1) and the second (PC2) principal components of the principalcomponent analysis (PCA) of all PL groups on mol basis (means of n=5)
1305
BGD8 1275ndash1308 2011
Microbial food webdynamics along a soilchronosequence of a
glacier forefield
J Esperschutz et al
Title Page
Abstract Introduction
Conclusions References
Tables Figures
J I
J I
Back Close
Full Screen Esc
Printer-friendly Version
Interactive Discussion
Discussion
Paper
|D
iscussionP
aper|
Discussion
Paper
|D
iscussionP
aper|
35
iso
ant
un
b
10M
e
n
orlt2
0
n
orgt2
0
cy
-
5
-
7
-
8
-9
-
11
PU
FA
PLE
L
-40
-30
-20
-10
0
10na
tura
l abu
ndan
ce13
C vs
V-P
DB
T1 - 10 yearsT2 - 60 yearsT3 - 100 yearsT4 - gt700 years
710
Fig 3 Natural abundance δ13C values [permil vs V-PDB] in individual PL groups in soil without 711
litter application (means plusmn standard deviation n=5) PL groups were formed as described in 712
Fig 2 and 5 713
Fig 3 Natural abundance δ13C values [permil vs V-PDB] in individual PL groups in soil withoutlitter application (means plusmn standard deviation n= 5) PL groups were formed as described inFigs 2 and 5
1306
BGD8 1275ndash1308 2011
Microbial food webdynamics along a soilchronosequence of a
glacier forefield
J Esperschutz et al
Title Page
Abstract Introduction
Conclusions References
Tables Figures
J I
J I
Back Close
Full Screen Esc
Printer-friendly Version
Interactive Discussion
Discussion
Paper
|D
iscussionP
aper|
Discussion
Paper
|D
iscussionP
aper|
iso
ant
unb
10Me
norlt20
norgt20
cy
-w 5
-w7
-w8
-w 9
-w11
PUFA
PLEL
10 years 60 years 100 yearsgt 700 years
a) b)
relative distribution of plant litter derived 13C []
iso
ant
unb
10Me
norlt20
norgt20
cy
-w 5
-w7
-w8
-w 9
-w11
PUFA
PLEL
0 2010 30 40 50 60 0 2010 30 40 50 60
Fig 4 Distribution of 13C derived from litter within PL groups in relative to total litter derived13C into total PL according to Fig 1 (means + standard deviation n= 5) after 8 weeks (a) and12 weeks (b) of litter incubation PL groups were formed as described in Figs 2 and 5
1307
BGD8 1275ndash1308 2011
Microbial food webdynamics along a soilchronosequence of a
glacier forefield
J Esperschutz et al
Title Page
Abstract Introduction
Conclusions References
Tables Figures
J I
J I
Back Close
Full Screen Esc
Printer-friendly Version
Interactive Discussion
Discussion
Paper
|D
iscussionP
aper|
Discussion
Paper
|D
iscussionP
aper|
37
8 weeks litter incubation
12 weeks litter incubation
isoi140 i150 i160 i170
anta140 a150 a170
unbbr13170 br180
10Me10Me170 10Me190
nor lt 20n150 n160
nor gt 20n220 n240
cycy170 cy190
- 51615
- 71617 1817
- 91619 1819
PUFA18269 182812 204 224
PLELiso200
-04 -02 00 02 04 06
-04
-02
00
02
04
06
PC1
PC
2
T1
T2
T3
T4
T1
T2
T3
T4
-2 0 2 4
-20
24
iso
antunb
10Me
norlt20norgt20
cy
-5
-7 -9
pufa
plel
718
Fig 5 First (PC1) and second (PC2) principal components of the principal component 719
analysis (PCA) illustrating the distribution of 13C derived from litter within PL groups (in 720
relative to total 13C derived from litter into total PL according to Fig 1 means of n=5) 721
722
Fig 5 First (PC1) and second (PC2) principal components of the principal component analysis(PCA) illustrating the distribution of 13C derived from litter within PL groups (in relative to total13C derived from litter into total PL according to Fig 1 means of n=5)
1308
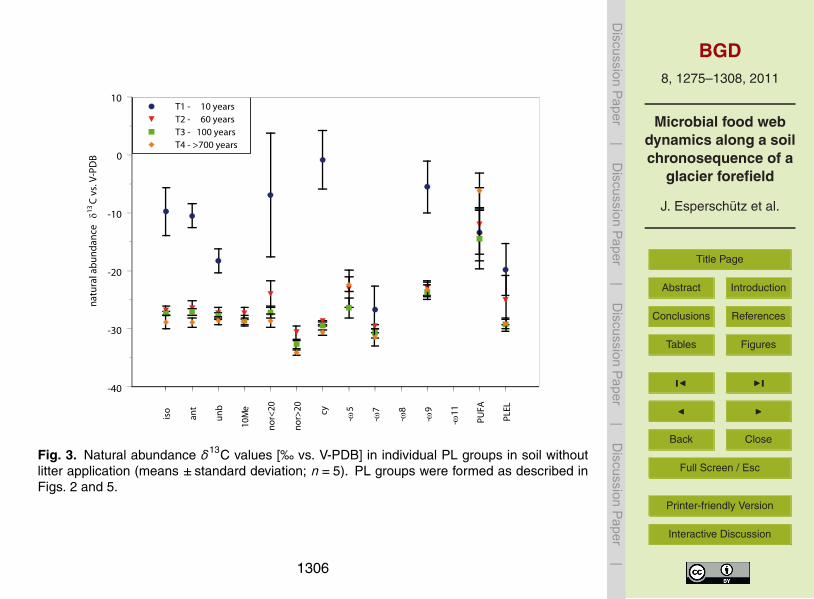
BGD8 1275ndash1308 2011
Microbial food webdynamics along a soilchronosequence of a
glacier forefield
J Esperschutz et al
Title Page
Abstract Introduction
Conclusions References
Tables Figures
J I
J I
Back Close
Full Screen Esc
Printer-friendly Version
Interactive Discussion
Discussion
Paper
|D
iscussionP
aper|
Discussion
Paper
|D
iscussionP
aper|
35
iso
ant
un
b
10M
e
n
orlt2
0
n
orgt2
0
cy
-
5
-
7
-
8
-9
-
11
PU
FA
PLE
L
-40
-30
-20
-10
0
10na
tura
l abu
ndan
ce13
C vs
V-P
DB
T1 - 10 yearsT2 - 60 yearsT3 - 100 yearsT4 - gt700 years
710
Fig 3 Natural abundance δ13C values [permil vs V-PDB] in individual PL groups in soil without 711
litter application (means plusmn standard deviation n=5) PL groups were formed as described in 712
Fig 2 and 5 713
Fig 3 Natural abundance δ13C values [permil vs V-PDB] in individual PL groups in soil withoutlitter application (means plusmn standard deviation n= 5) PL groups were formed as described inFigs 2 and 5
1306
BGD8 1275ndash1308 2011
Microbial food webdynamics along a soilchronosequence of a
glacier forefield
J Esperschutz et al
Title Page
Abstract Introduction
Conclusions References
Tables Figures
J I
J I
Back Close
Full Screen Esc
Printer-friendly Version
Interactive Discussion
Discussion
Paper
|D
iscussionP
aper|
Discussion
Paper
|D
iscussionP
aper|
iso
ant
unb
10Me
norlt20
norgt20
cy
-w 5
-w7
-w8
-w 9
-w11
PUFA
PLEL
10 years 60 years 100 yearsgt 700 years
a) b)
relative distribution of plant litter derived 13C []
iso
ant
unb
10Me
norlt20
norgt20
cy
-w 5
-w7
-w8
-w 9
-w11
PUFA
PLEL
0 2010 30 40 50 60 0 2010 30 40 50 60
Fig 4 Distribution of 13C derived from litter within PL groups in relative to total litter derived13C into total PL according to Fig 1 (means + standard deviation n= 5) after 8 weeks (a) and12 weeks (b) of litter incubation PL groups were formed as described in Figs 2 and 5
1307
BGD8 1275ndash1308 2011
Microbial food webdynamics along a soilchronosequence of a
glacier forefield
J Esperschutz et al
Title Page
Abstract Introduction
Conclusions References
Tables Figures
J I
J I
Back Close
Full Screen Esc
Printer-friendly Version
Interactive Discussion
Discussion
Paper
|D
iscussionP
aper|
Discussion
Paper
|D
iscussionP
aper|
37
8 weeks litter incubation
12 weeks litter incubation
isoi140 i150 i160 i170
anta140 a150 a170
unbbr13170 br180
10Me10Me170 10Me190
nor lt 20n150 n160
nor gt 20n220 n240
cycy170 cy190
- 51615
- 71617 1817
- 91619 1819
PUFA18269 182812 204 224
PLELiso200
-04 -02 00 02 04 06
-04
-02
00
02
04
06
PC1
PC
2
T1
T2
T3
T4
T1
T2
T3
T4
-2 0 2 4
-20
24
iso
antunb
10Me
norlt20norgt20
cy
-5
-7 -9
pufa
plel
718
Fig 5 First (PC1) and second (PC2) principal components of the principal component 719
analysis (PCA) illustrating the distribution of 13C derived from litter within PL groups (in 720
relative to total 13C derived from litter into total PL according to Fig 1 means of n=5) 721
722
Fig 5 First (PC1) and second (PC2) principal components of the principal component analysis(PCA) illustrating the distribution of 13C derived from litter within PL groups (in relative to total13C derived from litter into total PL according to Fig 1 means of n=5)
1308
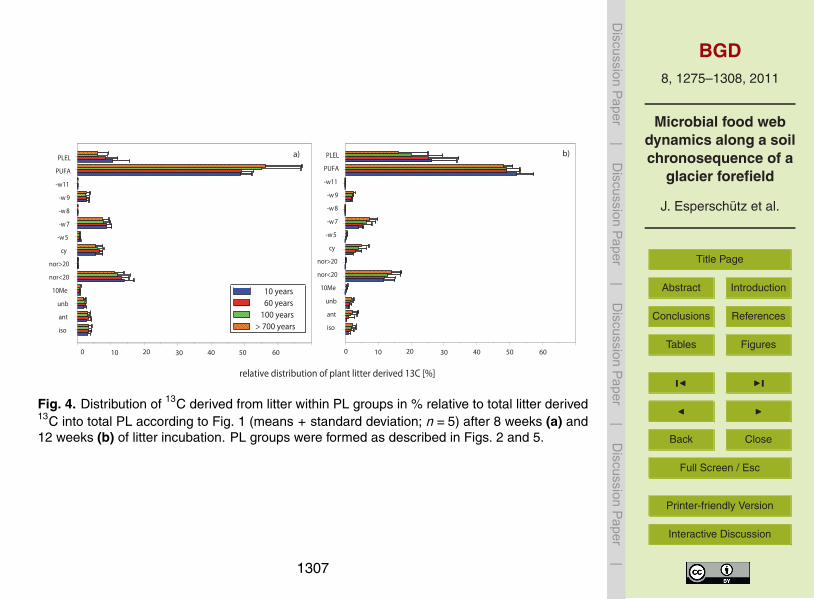
BGD8 1275ndash1308 2011
Microbial food webdynamics along a soilchronosequence of a
glacier forefield
J Esperschutz et al
Title Page
Abstract Introduction
Conclusions References
Tables Figures
J I
J I
Back Close
Full Screen Esc
Printer-friendly Version
Interactive Discussion
Discussion
Paper
|D
iscussionP
aper|
Discussion
Paper
|D
iscussionP
aper|
iso
ant
unb
10Me
norlt20
norgt20
cy
-w 5
-w7
-w8
-w 9
-w11
PUFA
PLEL
10 years 60 years 100 yearsgt 700 years
a) b)
relative distribution of plant litter derived 13C []
iso
ant
unb
10Me
norlt20
norgt20
cy
-w 5
-w7
-w8
-w 9
-w11
PUFA
PLEL
0 2010 30 40 50 60 0 2010 30 40 50 60
Fig 4 Distribution of 13C derived from litter within PL groups in relative to total litter derived13C into total PL according to Fig 1 (means + standard deviation n= 5) after 8 weeks (a) and12 weeks (b) of litter incubation PL groups were formed as described in Figs 2 and 5
1307
BGD8 1275ndash1308 2011
Microbial food webdynamics along a soilchronosequence of a
glacier forefield
J Esperschutz et al
Title Page
Abstract Introduction
Conclusions References
Tables Figures
J I
J I
Back Close
Full Screen Esc
Printer-friendly Version
Interactive Discussion
Discussion
Paper
|D
iscussionP
aper|
Discussion
Paper
|D
iscussionP
aper|
37
8 weeks litter incubation
12 weeks litter incubation
isoi140 i150 i160 i170
anta140 a150 a170
unbbr13170 br180
10Me10Me170 10Me190
nor lt 20n150 n160
nor gt 20n220 n240
cycy170 cy190
- 51615
- 71617 1817
- 91619 1819
PUFA18269 182812 204 224
PLELiso200
-04 -02 00 02 04 06
-04
-02
00
02
04
06
PC1
PC
2
T1
T2
T3
T4
T1
T2
T3
T4
-2 0 2 4
-20
24
iso
antunb
10Me
norlt20norgt20
cy
-5
-7 -9
pufa
plel
718
Fig 5 First (PC1) and second (PC2) principal components of the principal component 719
analysis (PCA) illustrating the distribution of 13C derived from litter within PL groups (in 720
relative to total 13C derived from litter into total PL according to Fig 1 means of n=5) 721
722
Fig 5 First (PC1) and second (PC2) principal components of the principal component analysis(PCA) illustrating the distribution of 13C derived from litter within PL groups (in relative to total13C derived from litter into total PL according to Fig 1 means of n=5)
1308
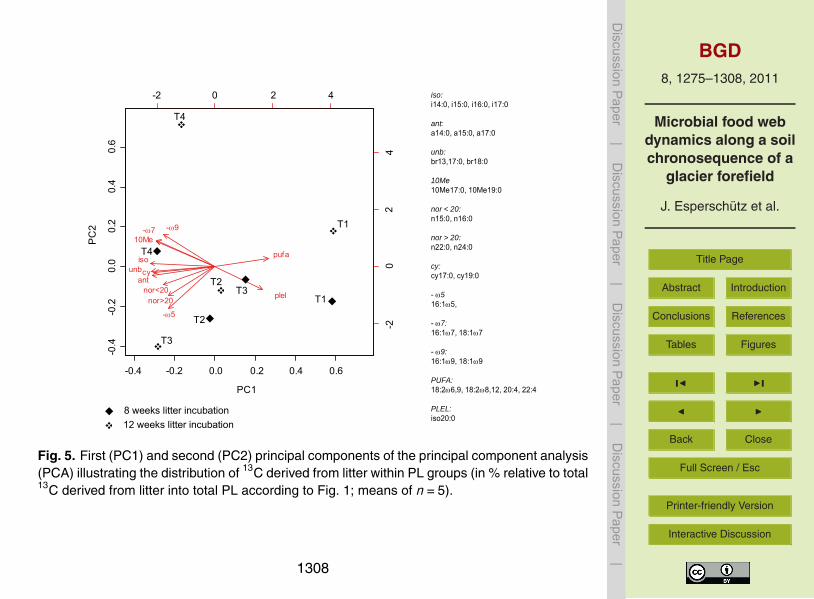
BGD8 1275ndash1308 2011
Microbial food webdynamics along a soilchronosequence of a
glacier forefield
J Esperschutz et al
Title Page
Abstract Introduction
Conclusions References
Tables Figures
J I
J I
Back Close
Full Screen Esc
Printer-friendly Version
Interactive Discussion
Discussion
Paper
|D
iscussionP
aper|
Discussion
Paper
|D
iscussionP
aper|
37
8 weeks litter incubation
12 weeks litter incubation
isoi140 i150 i160 i170
anta140 a150 a170
unbbr13170 br180
10Me10Me170 10Me190
nor lt 20n150 n160
nor gt 20n220 n240
cycy170 cy190
- 51615
- 71617 1817
- 91619 1819
PUFA18269 182812 204 224
PLELiso200
-04 -02 00 02 04 06
-04
-02
00
02
04
06
PC1
PC
2
T1
T2
T3
T4
T1
T2
T3
T4
-2 0 2 4
-20
24
iso
antunb
10Me
norlt20norgt20
cy
-5
-7 -9
pufa
plel
718
Fig 5 First (PC1) and second (PC2) principal components of the principal component 719
analysis (PCA) illustrating the distribution of 13C derived from litter within PL groups (in 720
relative to total 13C derived from litter into total PL according to Fig 1 means of n=5) 721
722
Fig 5 First (PC1) and second (PC2) principal components of the principal component analysis(PCA) illustrating the distribution of 13C derived from litter within PL groups (in relative to total13C derived from litter into total PL according to Fig 1 means of n=5)
1308

![Functional ecology of soil microbial communities along a glacier … · 2018-02-16 · thesis of antibiotics along the succession [24,52] and, there-fore, the antibiotic resistance](https://img.pdfslide.us/doc/110x75/5e7cafcf317c32133d1ea1dd/functional-ecology-of-soil-microbial-communities-along-a-glacier-2018-02-16-thesis.jpg)